
322.1
Determination of the Computational Bias in Criticality Safety Validation of VVER-440/V213
Branislav Vrban1
B&J NUCLEAR ltd.
Alžbetin Dvor 145
900 42 Miloslavov, Slovakia
Jakub Lűley1, Štefan Čerba1, Filip Osuský2 2Institute of Nuclear and Physical Engineering
Slovak University of Technology in Bratislava, Ilkovičova 3
812 19, Bratislava, Slovakia
[email protected], [email protected], [email protected]
ABSTRACT
The key issue in any criticality safety problem is to estimate and to predict the deviation
of calculation from reality. If the calculated value is not equal to its true value bias occurs. In
criticality calculations the computational bias is the difference between the computed and the
actual value of keff. The fundamental assumption is that the computational bias is mostly
caused by errors in the cross-section data. In addition the use of random variables in the
calculation introduces a non-random bias in the computed result as well. The American
National Standards are utilized to predict and bound the computational bias of criticality
calculations. These standards require the validation of the analytical methods and data used in
nuclear criticality safety calculations to quantify the computational bias and its uncertainty.
This paper presents a method for determining the computation bias and bias uncertainty for
VVER-440/V213 reactor. For this analysis a SCALE KENO 3D core model was developed
by B&J NUCLEAR ltd. company. This model is based on technical data and operational
history of NPP Jaslovské Bohunice provided by the Slovenské elektrárne a.s. Several
calculation steps are used to address bias estimation method including sensitivity analysis,
uncertainty analyses and cross section adjustment method. In addition the neutronic similarity
of VVER-440/V213 core to several hundred critical benchmark experiments is evaluated by
the use of three integral indices. The database of the benchmark experiment is based on the
selection and processing procedure VALID provided by the Oak Ridge National Laboratory
and specified in the IHECSBE. The results of all analyses performed are given and discussed
in the paper.
1 INTRODUCTION
The computational bias of criticality safety calculations, defined as difference between
the computed and the actual values of keff, must be established through the validation of the
applied methods to critical experiments. To meet the needs, one may utilize American
National Standard ANSI/ANS-8.1-2014 [1] which allows the use of calculations in the
determination of subcritical limits for the design of fissionable nuclear systems. The
aforementioned validation procedure should be performed with experimental data sufficiently
similar to the system under consideration. The area of applicability of the experiments chosen

322.2
Proceedings of the International Conference Nuclear Energy for New Europe, Portorož, Slovenia, September 5-8, 2016
for validation can be determined via comparison of relevant parameters between two systems
by the use of similarity assessment method. This method is based on sensitivity and
uncertainty analysis, including global integral indices ck, E and G. A computational bias can
be found as a function of these parameters and statistical analysis with extrapolation to target
system can be used to determine an upper subcritical limit (USL). Alternatively the
computational biases may be predicted by the nuclear data adjustment tool TSURFER, which
is based on a GLLS approach [2]. The approaches of bias estimation mentioned above are
applied to SCALE [3] criticality calculations of VVER-440/213 reactor and real operational
conditions. VVER reactors are a special design of Pressurized Water Reactors with a
hexagonal geometry of fuel assemblies, Zirconium-Niobium alloy as fuel rod claddings
material and with the steam generators with a tube sheet in the form of two cylindrical heads.
VVER reactors are the most frequently built reactor types in the world. The first units with
predecessors of VVER-440 type reactors were erected at the Novovoronesh NPP site in 1972
and 1973 [1]. The second step in the development of VVER-440 type reactors was the V-230
design which was mainly constructed in the period from 1973 to 1982. The third step in
VVER-440 development was the V-213 reactor design referred as the second generation of
the standard VVER-440 reactors equipped by many upgrades and enhancements. Slovakia has
four nuclear reactors generating half of its electricity and two more under construction. In
1972, construction of the Bohunice V1 plant commenced, with two VVER-440 V-230
reactors. The first was grid connected in 1978, the second two years later. The V2 units
commenced operation in 1984 and 1985. The Slovak NPP Mochovce with VVER-440/V213
units 1 and 2 were put in operation in the summer of 1998 and the end of year 1999 due to the
construction delay caused by political changes in the early 1990s. As a result of continuous
upgrades implemented in NPP Bohunice V2 the reactors power level was increased from
original thermal power level of 1375 MWth to current 1471.25 MWth in 2010. In order to
extend the fuel residence time in active core accompanied by the improvement of fuel cycle
efficiency the new second generation fuel with an average enrichment of 4.87 wt % 235U and
Gadolinium burnable absorbers (3.35 wt % Gd2O3) was incorporated in fuel loading patterns
of NPP Bohunice and Mochovce unit in the last years. Two another units 3&4 of VVER-
440/213 are currently under construction in Mochovce locality and are planned to be put in
operation in 2017 and 2018 respectively.
2 VVER-440 GEOMETRY MODEL DESRIPTION
Detailed and precise KENO 3D model of the VVER-440/V213 reactor has been
developed for criticality and shielding calculations. The whole-core 3D model shown in Fig.
1-a consists of the reactor in-vessel components such as fuel assemblies (including fuel rods,
upper spacer grid, intermediate spacer grids, supporting grid, mixing grid, central tube and
fuel endings), emergency reactor control assemblies (ERC - absorber and fuel part), core
basket, barrel and the reactor pressure vessel. The boundaries of the created VVER-440
whole-core model are given by the outer surface of the dry shielding, the level of hot-leg
piping and the basement of filtration mechanism.
All the VVER-440 fuel assemblies (FAs) are hexagonal and the fuel rods are placed in
the assembly in a triangular grid pattern. The fuel rod bundle of the assembly is enclosed in a
hexagonal wrapper with the width across the flats equal to 145 mm (the 2nd gen. FA). The FA
and emergency reactor control assemblies are positioned in a hexagonal grid with a spacing of
147 mm. The fuel rods are located in the bundle in a triangular grid pattern with a pitch of
12.3 mm. The fuel rod claddings are made of the E110 zirconium alloy, while the wrapper
tubes of FA and ERC are made of the E125 zirconium alloy.

322.3
Proceedings of the International Conference Nuclear Energy for New Europe, Portorož, Slovenia, September 5-8, 2016
a) 3D model geometry b) 30th fuel loading pattern of NPP EBO unit 4
Figure 1: KENO 3D model of the VVER-440/V213 and fuel loading pattern
The outside diameter of fuel rod cladding is 9.1 mm, the inside diameter is 7.75 mm.
The cladding houses a fuel column assembled of UO2 pellets. The rods are filled with helium
and the fuel pellet density is 10.55 g/cm3. Several types of profiled fuel assemblies are used to
maintain power peaking factors under the design limits. A Gd2O3 absorber is integrated with a
mass content of 3.35% into FAs to aid fuel profiling. The fuel loading pattern in the
representative sixth of NPP Bohunice unit 4 during cycle 30 is shown in the Fig. 1-b. The
profiling diagrams with various initial enrichments can be found elsewhere [4]. The FA with
the average enrichment of 4.25 wt % 235U exists in two modifications differing in rod
claddings outer diameters. The fuel rod cladding outer diameter of the first modification is
equal to 9.07 mm and the second modification diameter is identical to other FAs. In addition,
another type of fuel rod bundle with the uniform enrichment of 1.6 wt % 235U is used as a fuel
part of central ERC.
3 CALCULATION METHODOLOGY
3.1 Burnup calculation
An accurate treatment of neutron transport and depletion in modern fuel assemblies
characterized by heterogeneous, complex designs, such as the VVER assembly configuration,
requires the use of advanced computational tools capable of simulating multi-dimensional
geometries. The depletion module TRITON [5], which is part of the SCALE system, was
used to perform depletion simulations for 2D FA and ERC models. The isotopic compositions
of the FAs and ERCs following burnup values shown in Fig. 1-b were calculated by SCALE
6.1.3 system - TRITON depletion sequence and NEWT flux solver. Our modelling approach
is based on parametric study of burnup modelling issues associated with VVER-440 fuel and
on best modelling approach (BMA) extensively described in [4]. In this work the effects of
variations in the depletion parameters, operation history, assembly type, Gadolinium
presence, used energy group structure and time steps are investigated and graphically
illustrated. For the sake of brevity, just the most important options used in burnup
calculations are listed here.
The developed models for the criticality calculations are 2D assembly models with
reflective boundary conditions on all sides which represent infinite radial arrays of
infinite length fuel assemblies.
An unstructured coarse-mesh finite-difference acceleration approach (CMFD) is used
with “partial-current” acceleration scheme. The 25 fine-mesh cells are used in the

322.4
Proceedings of the International Conference Nuclear Energy for New Europe, Portorož, Slovenia, September 5-8, 2016
global NEWT grid per coarse-mesh cell. The 40 x 40 global unit coarse-mesh and 4 x
4 individual mesh for each unit is used in the all prepared models.
All models were calculated with the standard SCALE V7-238 multigroup neutron
library based on ENDF/B-VII.0 evaluated data [6].
Fuel pins with burnable absorbers were depleted by constant flux option instead of
constant power approach.
To allow more realistic depletion in outer edge of fuel pin driven by the high thermal
flux in the moderator, the Gadolinium bearing pin is divided into the five regions so
that they are equal-area rings.
The average specific power of each model is derived from the average reactor power
of NPP Bohunice unit 4 during cycle 30 and equals 33.05421 kWth/kgHM. The
average concentration of boron acid (H3BO3) is obtained using the same approach and
reaches cb=2.56 g/kg. The fuel is modelled with temperature of 933 K and the
temperature of structural materials and water coolant is 555 K.
Very fine depletion steps (<0.5 MWd/kgHM) are used before Gadolinium peak
reactivity to tract the fast poison concertation changes. After peak reactivity longer
steps are used but are kept smaller than 1 MWd/kgHM.
The isotopic vectors calculated for the each FA and ERC and associated burnup value
are used in the following criticality calculation.
3.2 Criticality calculation
The core material composition was based on the representative sixth described in model
definition. Following burnup calculation of 59 isotopic vectors of fuel material were defined
and homogeneously distributed in the individual FA’s and ERC’s definitions. All of these
FAs and ERCs were placed to the model of core based on the real loading pattern shown in
the Fig. 1-b. The used temperature specification was the same as in burnup calculation; 933
K for fuel, 555 K for incore structural materials and coolant, 541 K respectively 571 K for
coolant and structural materials depending on the inlet or outlet coolant site of model. The
boric acid concentration (0.09 g/kg) and the position of sixth group of ERCs (232 cm)
correspond to the values of operational day for which the fuel depletion was determined.
Criticality calculation was carried out with four cross section (XS) libraries; Continuous
Energy, 27 group and 238 group ENDF/B-VII, and 44 group ENDF/B-V. In case of
multigroup libraries the self-shielding calculation was necessary to perform, which means that
59 cells calculation using BONAMI/CENTRM/PMC codes were invoked within each
multigoup criticality calculation. For 44 and 238 group libraries a default parameters were
retained during cell calculation but for 27 group library the re-evaluation by CENTRM code
was extended to area of U238 resonances due to course energy structure and library
optimization for shielding transport applications [7]. To achieve acceptable statistical
uncertainty of investigated parameters in peripheral regions of the core from 80 to 900 mill.
neutron histories were calculated. The 44 group ENDF/B-V XS library is used for other
analyses in paper if not stated otherwise.
3.3 Sensitivity analysis
The sensitivity and uncertainty analysis of VVER-440/213 core was performed by the
TSUNAMI-3D code using the SCALE 44-group ENDF/B-V library [3] recommended for
LWR and mixed-oxide lattices. Forward and adjoint transport calculations were carried out
with KENO6 and the sensitivity coefficients were computed by the SAMS module. For the
neutron flux calculations square mesh was placed through the core with a uniform step of 2
322.5
Proceedings of the International Conference Nuclear Energy for New Europe, Portorož, Slovenia, September 5-8, 2016
cm in the inner core region. In outer part, the size of the mesh varies from 3 to 4 cm in order
to achieve the best statistical uncertainty. In case of reactor internals and direct core vicinity
the size of mesh was directly proportional to the distance from the core centre in a range from
6 to 50 cm. Based on Standard Perturbation Theory implemented in the TSUNAMI the
sensitivity coefficients can be written in a simple form as follows:
where 𝑆𝑘,𝜎 is the sensitivity coefficient of 𝑘𝑒𝑓𝑓 with respect to 𝜎, which represents nuclear
data like cross sections, fission spectrum or nubar. Symbols 𝐿 and 𝑃 in Eq. (1) are net loss and
production Boltzman operators; 𝛷∗ and 𝛷 are adjoint and forward fluxes respectively. All
information necessary to determine the sensitivity coefficients by Eq. (1) can completely
characterize the investigated system, therefore the sensitivity coefficients serve as the basis
for evaluation of the keff uncertainty induced by cross section data, for the similarity
assessment and for the application of cross section adjustment methods. For validation
purposes the sensitivity coefficients for VVER-440/213 core were also calculated using
SCALE 238 group ENDF/B-VII library. Afterwards the 238 group data were collapsed to 44
group structure for better visual comparison and evaluation of energy profiles.
3.4 Uncertainty and similarity analysis
TSUNAMI-IP utility uses sensitivity data generated by TSUNAMI-3D sequence and
cross section-covariance data stored in the 44GRPCOV library for estimation of the response
uncertainty. The SCALE covariance library includes evaluated covariances obtained from
ENDF/B-VII, ENDF/B-VI [8], and JENDL3.3 [9] for more than 50 materials. ORNL has a
database of pre-calculated sensitivity profiles for several hundred critical benchmark
experiments specified in the International Handbook of Evaluated Criticality Safety
Benchmark Experiments (IHECSBE) [10]. These sensitivities may be input to TSUNAMI-IP
utility, along with calculated sensitivity profile of application system. In our approach 543
benchmark experiments and cases with various energy group structures were used. Three
global integral indices [3] are used in the analysis to assess the similarity of VVER 440/V213
neutronic core design (hereinafter application – index a) and a single experiment (e) on a
system-wide basis for all nuclides and reactions. Each integral index is normalized such that a
value of 1.0 represents complete similarity between application core design and specific
benchmark experiment and the value of 0.0 indicates no similarity. The uncertainty of the
integral response ∆R (for instance keff) on the target integral parameter by the use of XS
sensitivity coefficients denoted by symbol S and XS covariance matrix M is evaluated by the
well-known sandwich formula:
where the impact of the individual reactions and energy groups can be evaluated separately.
The diagonal elements of the resulting matrix, defined as the solution of Eq. (2), represent the
relative variance values for each of the system under consideration. The off-diagonal elements
are the relative covariances between given experiments. These covariances transformed to
correlation coefficients (ck) describe the level of similarity in the predicted response biases
between various systems in the frame of XS induced uncertainties. The E parameter given by
Eq. (3) assesses similarity between two systems based on the magnitude and shape of all
sensitivity profiles.
𝑆𝑘,𝜎 =𝜎
𝑘
∆𝑘
∆𝜎≅
∆𝜎
𝜎
⟨Φ∗(1
𝑘
𝜕𝑃
𝜕𝜎−
𝜕𝐿
𝜕𝜎)Φ⟩
1
𝑘⟨Φ∗𝑃Φ⟩
, (1)
T
RRMSSR
2
, (2)

322.6
Proceedings of the International Conference Nuclear Energy for New Europe, Portorož, Slovenia, September 5-8, 2016
The G index assesses the similarity of two systems based on normalized differences in
the energy dependent sensitivity data for fission, capture and scatter. A physical interpretation
of the G index is the ratio of the sum of the sensitivity coefficients of the application that are
covered by the experiment to the sum of the sensitivity coefficients of a given application.
The G index is defined as follows:
where the symbol n stands for the number of application system nuclides, x represents the
reaction and j the summation which is performed over all energy groups. The nuclide-
reaction specific partial integral index based on the same coverage criteria as G is denoted g.
Undercoverage or noncoverage can be penalized with a penalty defined as
where �̃� is a vector of all groupwise sensitivity differences 𝑍�̃� for all nuclides defined as 𝑍�̃� =
𝑆𝑗𝑎 − 𝑆𝑗
𝑒 if |𝑆𝑗𝑎| > 𝑆𝑗
𝑒 otherwise 𝑍�̃� = 0.
3.5 Use of cross section adjustment method
As stated in SCALE manual [3], the TSURFER code uses the generalized linear least-
squares method (GLLS) to consolidate a prior set of measured integral responses (such as keff)
and corresponding calculated values obtained using the SCALE nuclear analysis code system.
The initial estimates for the computed and measured responses are improved by adjusting the
experimental values and the nuclear data used in the transport calculations - taking into
account their correlated uncertainties—so that the most self-consistent set of data is obtained.
By the application of cross section adjustment method, TSURFER provides an estimate for
the computational bias and application uncertainty.
3.6 Determination of Upper Subcritical Limit (USL)
Based on the criteria for subricitality listed in [1], a USL may be determined based on
the analysis of a number of critical systems. Basically two methods of USL estimation are
available. The first method called Confidence Band with Administrative Margin applies a
statistical calculation of the bias and its uncertainty plus and administrative margin to a linear
fit of critical experiment benchmark data. Here calculational bias 𝛽 is defined is given as 𝑘𝑐-1,
where 𝑘𝑐 is the mean value of keff resulting from the calculation of benchmark criticality
experiments. The USL Method 1 is defined as
where Δ𝑘𝑚 is administrative limit, W is the confidence band which accounts for
uncertainties in the experiments, the calculational approach and XS data and ∆𝛽 stands for the
bias uncertainty. Usually adjustments are applied to prevent taking credit for a positive bias
by assuming 𝑘𝑐(𝑥) = 1 everywhere that 𝑘𝑐(𝑥) > 1. In the second method referred as a lower
tolerance band approach, statistical techniques are applied in order to determine a combined
lower confidence band plus subcritical margin. The USL Method 2 is defined as
ea
T
eaSSSSE . (3)
n x j
na
jx
n x j
ne
jx
na
jxSSSG
,
,
',
,
,
,1 , (4)
𝑝𝑔 = √�̃�𝑀�̃�𝑇, (5)
USL1(x) = 1 − Δ𝑘𝑚 − 𝑊 + ∆𝛽, (6)

322.7
Proceedings of the International Conference Nuclear Energy for New Europe, Portorož, Slovenia, September 5-8, 2016
where 𝑠𝑃 is the pooled standard deviation for the set of criticality calculations and term
𝐶 𝛼 𝑃⁄ . 𝑠𝑃 provides a band for which there is a probability P with a confidence 𝛼 that an
additional calculation of keff for critical system will lie within the band. The recommended
purpose of Method 2 is to apply it in parallel with Method 1 to verify that the chosen
administrative margin is conservative relative to a purely statistical basic. More details of
USL calculation methods can be found in [12]. A computer program USLSTATS available in
SCALE package is used to evaluate USLs based on Methods 1 and 2.
4 RESULTS
4.1 Criticality calculation
First verification of the prepared material and geometrical model was aimed to
comparison of integral parameter keff. Calculated results based on different energy structure
and evaluated data were subjected to comparison with real operational criticality of NPP
Bohunice V2. All calculated values are presented in Tab. 1. Lowest computational bias was
achieved by calculation with CE library. Best result using multigroup approach was
calculated with 27 group library which can be explained by applied re-evaluation during cell
calculation compared to finer group structures. Positive finding, from the point of
computational time, was also almost identical keff calculated with 44 and 238 group library.
Each multigroup calculation is able to determine local parameters like fission source
distribution, whole core neutron flux and quantities connected to reaction rates like spatial
power distribution.
Table 1: Comparison of keff for different energy structures. Energy
structure CE 27 group 44 group 238 group
keff 1.00465±0.00006 1.00681±0.00003 1.00769±0.00006 1.00751±0.00007
4.2 Sensitivity, uncertainty and similarity analysis
As it was mentioned above, the TSUNAMI sequence computes the contributors to the
application response uncertainty due to the XS covariance data.
Table 2: Uncertainty contribution in keff of VVER-440/213 core
No.
Covariance Matrix
Contributions
to Uncertainty
in keff (% Δk/k) No.
Covariance Matrix
Contributions
to Uncertainty
in keff (% Δk/k)
Nuclide-
Reaction
Nuclide-
Reaction
Due to the
Matrix
Nuclide-
Reaction
Nuclide-
Reaction
Due to the
Matrix
1 239Pu nubar 239Pu nubar 3.99E-01 9 238U nubar 238U nubar 9.39E-02
2 238U n,gamma 238U n,gamma 3.26E-01 10 235U n,gamma 235U n,gamma 8.23E-02
3 239Pu fission 239Pu fission 1.43E-01 11 240Pu n,gamma 240Pu n,gamma 6.99E-02
4 239Pu fission 239Pu n,gamma 1.32E-01 12 239Pu chi 239Pu chi 6.81E-02
5 238U n,n' 238U n,n' 1.31E-01 13 235U fission 235U fission 5.39E-02
6 239Pu n,gamma 239Pu n,gamma 1.26E-01 14 235U fission 235U n,gamma 5.37E-02
7 235U nubar 235U nubar 1.22E-01 15 235U chi 235U chi 4.66E-02
8 135Xe n,gamma 135Xe n,gamma 1.04E-01 16 143Nd n,gamma 143Nd n,gamma 4.26E-02
USL2(x) = 1 − (𝐶 𝛼 𝑃⁄ . 𝑠𝑃) + 𝛽(𝑥), (7)
322.8
Proceedings of the International Conference Nuclear Energy for New Europe, Portorož, Slovenia, September 5-8, 2016
The relative standard deviation of VVER-440/213 keff due to XS covariance data is
0.64%. Tab. 2 lists the top 16 covariance matrices that contribute to the keff uncertainty. These
contributors represent more than 98.15% of the total uncertainty induced by XS data. The top
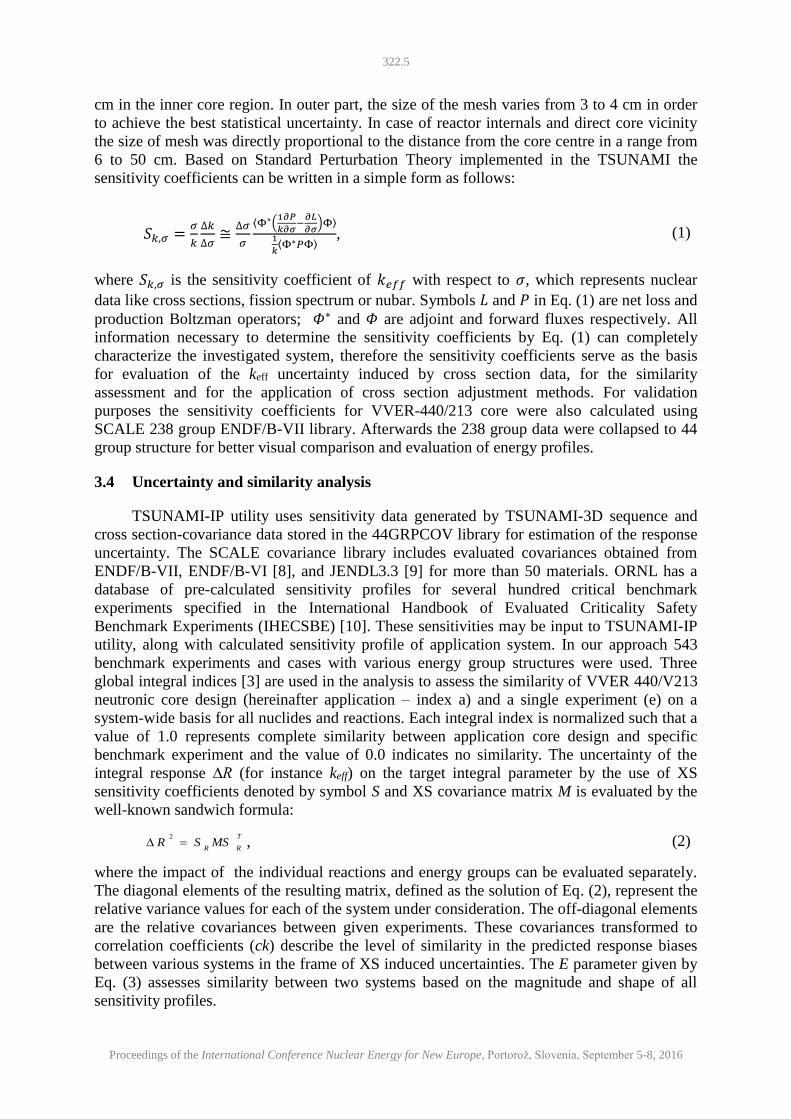
contributor to keff uncertainty is the 239Pu nubar reaction, see Fig. 2. This is due to high values
of burnup reached in the core and, as can be seen in Fig. 1-a, also due to the very high
sensitivities below 1 eV threshold. In case of 239Pu fission large positive sensitivities exist
bellow 1 eV and 100 keV thresholds. The uncertainty associated to the XS data in the energy
range bellow 100 keV is quite large and reaches almost 2.5%. The contribution of 239Pu n,
gamma reaction to the total keff uncertainty is mainly driven by large XS uncertainty above 1
keV. Despite the low sensitivities in this energy range, this contribution is the sixth largest as
it is shown in Tab. 1.
a) b)
Figure 2: Sensitivity and covariance profiles to 239Pu nubar; fission and n,γ reactions
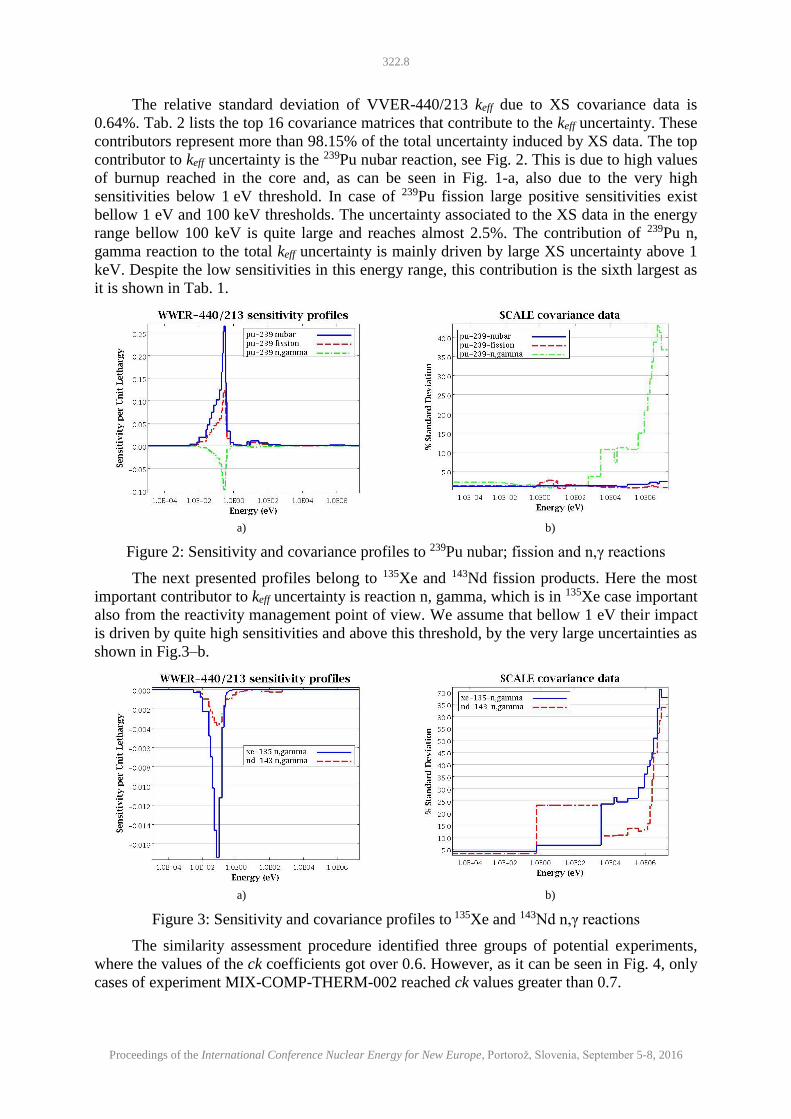
The next presented profiles belong to 135Xe and 143Nd fission products. Here the most
important contributor to keff uncertainty is reaction n, gamma, which is in 135Xe case important
also from the reactivity management point of view. We assume that bellow 1 eV their impact
is driven by quite high sensitivities and above this threshold, by the very large uncertainties as
shown in Fig.3–b.
a) b)
Figure 3: Sensitivity and covariance profiles to 135Xe and 143Nd n,γ reactions
The similarity assessment procedure identified three groups of potential experiments,
where the values of the ck coefficients got over 0.6. However, as it can be seen in Fig. 4, only
cases of experiment MIX-COMP-THERM-002 reached ck values greater than 0.7.

322.9
Proceedings of the International Conference Nuclear Energy for New Europe, Portorož, Slovenia, September 5-8, 2016
Figure 4: Graphical results of similarity assessment procedure
The E coefficients for these cases reach unsatisfactory values above 0.6, just one case
got score above 0.73. Nevertheless the big portion (around 40%) of VVER-440 sensitivities is
uncovered (G) by above mentioned cases. More details with description of the first 20
experiments with the highest ck values can be found in Tab. 4. The values of g indices for
nuclide – reaction pairs, having a great impact on the neutron balance of the active core, are
given in Tab. 3. The presented data highlight those nuclide – reaction pairs which are not
sufficiently covered by the MIX-COMP-THERM-002 experiment.
Table 3: Results of nuclide-reaction specific partial integral index g
ID 1H
scatter
1H
total
10B
total
16O
capture
235U
fission
238U
n,n'
238U
scatter
238U
capture
238U
total
239Pu
fission
239Pu
nubar
219 0.87 0.88 1.00 0.66 0.28 0.04 0.16 0.34 0.62 0.99 1.00
As it is stated in [11], Eq. 5 does not provide a proper penalty for dissimilarities
between two sensitivity profiles. However, our results are based on the approach which is
already implemented in SCALE system. As it is recommended, just experiments that exhibit a
certain degree of similarity to the application are used in the penalty assessment calculation.
Data in Tab. 4 show that just 4 cases reach ck values higher than 0.7, therefore our penalty
assessment based on the small amount of experiments cannot be considered as decisive.
According to calculation the standard deviation in the keff of VVER-440/213 due to uncovered
sensitivity coefficients reach 0.26%. Results prove that the most important contributor to
additional penalty, bringing almost 55% of the total value, is 238U n,n’ reaction. The rest
portion mainly consists from contribution of fission products (135Xe, 143Nd and 103Rh).
4.3 Use of cross section adjustment method
Based on the similarity assessment results, 20 experiments listed in Tab. 4 were selected
for inclusion in the adjustment procedure performed by the TSURFER code. In our analyses,
all within-series experiments were assumed to have a correlation of 0.9, and following the
data published in current version of DICE database [13], all experiments not in the same
series were assumed to be uncorrelated. The achieved goodness of fit represented by 𝜒2
parameter reached acceptable value of 1.562E-01. According to calculation the new adjusted
value of keff equals to 1.0075 with XS induced uncertainty of 0.45% what approximately gives
the relative bias of -2.26%. We can conclude that GLLS calculation identified the small
tendency of our calculation approach to overestimate the keff where the 238U n,gamma and 238U
n,n’ nuclide reaction pairs were found to be the most important contributors to the calculated
bias value. As it can be seen in Fig. 5-a), the case of capture reaction adjustments were
applied almost in all reactions above 1 eV. We conclude that these XS adjustments mainly
322.10
Proceedings of the International Conference Nuclear Energy for New Europe, Portorož, Slovenia, September 5-8, 2016
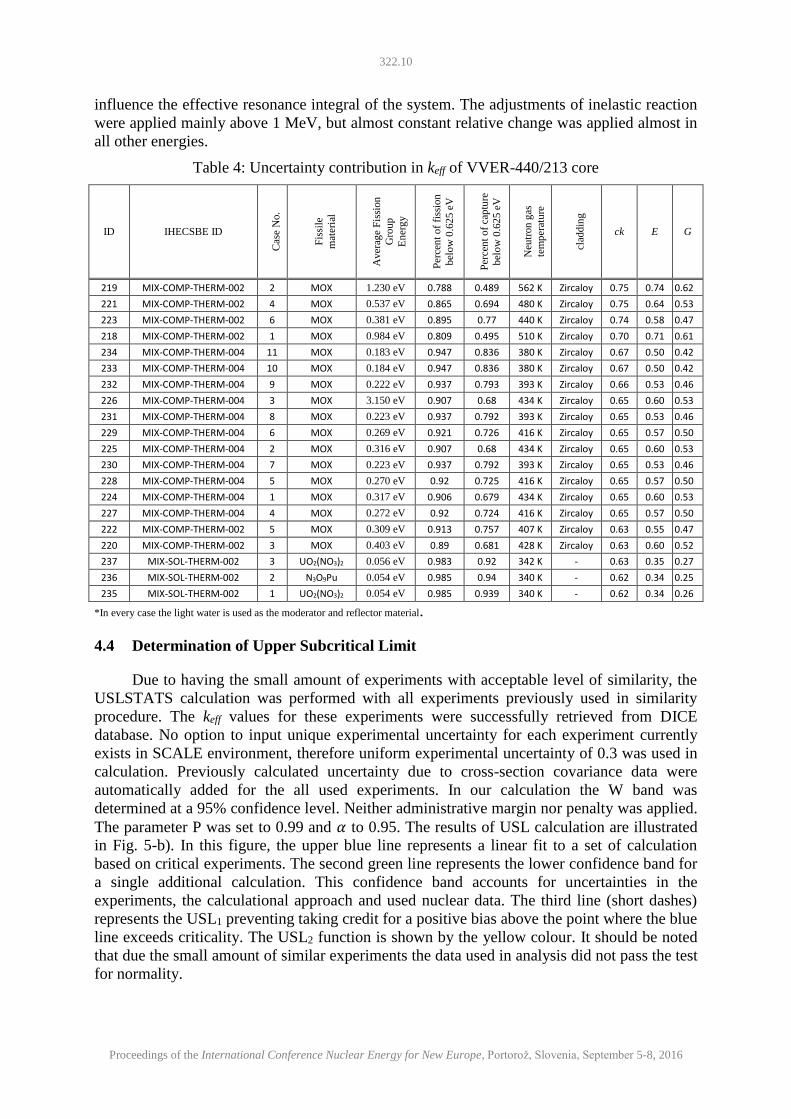
influence the effective resonance integral of the system. The adjustments of inelastic reaction
were applied mainly above 1 MeV, but almost constant relative change was applied almost in
all other energies.
Table 4: Uncertainty contribution in keff of VVER-440/213 core
ID IHECSBE ID
Cas
e N
o.
Fis
sile
mat
eria
l
Av
erag
e F
issi
on
Gro
up
En
erg
y
Per
cen
t o
f fi
ssio
n
bel
ow
0.6
25 e
V
Per
cen
t o
f ca
ptu
re
bel
ow
0.6
25 e
V
Neu
tron
gas
tem
per
atu
re
clad
din
g
ck E G
219 MIX-COMP-THERM-002 2 MOX 1.230 eV 0.788 0.489 562 K Zircaloy 0.75 0.74 0.62
221 MIX-COMP-THERM-002 4 MOX 0.537 eV 0.865 0.694 480 K Zircaloy 0.75 0.64 0.53
223 MIX-COMP-THERM-002 6 MOX 0.381 eV 0.895 0.77 440 K Zircaloy 0.74 0.58 0.47
218 MIX-COMP-THERM-002 1 MOX 0.984 eV 0.809 0.495 510 K Zircaloy 0.70 0.71 0.61
234 MIX-COMP-THERM-004 11 MOX 0.183 eV 0.947 0.836 380 K Zircaloy 0.67 0.50 0.42
233 MIX-COMP-THERM-004 10 MOX 0.184 eV 0.947 0.836 380 K Zircaloy 0.67 0.50 0.42
232 MIX-COMP-THERM-004 9 MOX 0.222 eV 0.937 0.793 393 K Zircaloy 0.66 0.53 0.46
226 MIX-COMP-THERM-004 3 MOX 3.150 eV 0.907 0.68 434 K Zircaloy 0.65 0.60 0.53
231 MIX-COMP-THERM-004 8 MOX 0.223 eV 0.937 0.792 393 K Zircaloy 0.65 0.53 0.46
229 MIX-COMP-THERM-004 6 MOX 0.269 eV 0.921 0.726 416 K Zircaloy 0.65 0.57 0.50
225 MIX-COMP-THERM-004 2 MOX 0.316 eV 0.907 0.68 434 K Zircaloy 0.65 0.60 0.53
230 MIX-COMP-THERM-004 7 MOX 0.223 eV 0.937 0.792 393 K Zircaloy 0.65 0.53 0.46
228 MIX-COMP-THERM-004 5 MOX 0.270 eV 0.92 0.725 416 K Zircaloy 0.65 0.57 0.50
224 MIX-COMP-THERM-004 1 MOX 0.317 eV 0.906 0.679 434 K Zircaloy 0.65 0.60 0.53
227 MIX-COMP-THERM-004 4 MOX 0.272 eV 0.92 0.724 416 K Zircaloy 0.65 0.57 0.50
222 MIX-COMP-THERM-002 5 MOX 0.309 eV 0.913 0.757 407 K Zircaloy 0.63 0.55 0.47
220 MIX-COMP-THERM-002 3 MOX 0.403 eV 0.89 0.681 428 K Zircaloy 0.63 0.60 0.52
237 MIX-SOL-THERM-002 3 UO2(NO3)2 0.056 eV 0.983 0.92 342 K - 0.63 0.35 0.27
236 MIX-SOL-THERM-002 2 N3O9Pu 0.054 eV 0.985 0.94 340 K - 0.62 0.34 0.25
235 MIX-SOL-THERM-002 1 UO2(NO3)2 0.054 eV 0.985 0.939 340 K - 0.62 0.34 0.26
*In every case the light water is used as the moderator and reflector material.
4.4 Determination of Upper Subcritical Limit
Due to having the small amount of experiments with acceptable level of similarity, the
USLSTATS calculation was performed with all experiments previously used in similarity
procedure. The keff values for these experiments were successfully retrieved from DICE
database. No option to input unique experimental uncertainty for each experiment currently
exists in SCALE environment, therefore uniform experimental uncertainty of 0.3 was used in
calculation. Previously calculated uncertainty due to cross-section covariance data were
automatically added for the all used experiments. In our calculation the W band was
determined at a 95% confidence level. Neither administrative margin nor penalty was applied.
The parameter P was set to 0.99 and 𝛼 to 0.95. The results of USL calculation are illustrated
in Fig. 5-b). In this figure, the upper blue line represents a linear fit to a set of calculation
based on critical experiments. The second green line represents the lower confidence band for
a single additional calculation. This confidence band accounts for uncertainties in the
experiments, the calculational approach and used nuclear data. The third line (short dashes)
represents the USL1 preventing taking credit for a positive bias above the point where the blue
line exceeds criticality. The USL2 function is shown by the yellow colour. It should be noted
that due the small amount of similar experiments the data used in analysis did not pass the test
for normality.

322.11
Proceedings of the International Conference Nuclear Energy for New Europe, Portorož, Slovenia, September 5-8, 2016
a) TSURFER relative cross section adjustments b) USLSTATS results
Figure 5: Relative changes in cross sections and ULS results
The calculated values of USL1 are 0.9768 and 0.9510 respectively, which suggests the
relevancy of 5% administrative margin requested by Slovak Regulatory Authority for
subriticality calculations.
5 CONCLUSION
The detailed model of VVER-440/213 reactor was developed by B&J NUCLEAR ltd.
for criticality and shielding analyses including reactor core, core basket, core barrel, pressure
vessel with all internals in an appropriate level of accuracy. Applied simplifications result in
the low computational bias of keff which did not exceed 0.8% in all computational cases.
Special attention was given to the methodology applied to determination of fuel isotopic
vectors modelled in one sixth symmetry core configuration what is one of the reasons of small
calculation bias. Subsequently the defined model was introduced to sensitivity, uncertainty
and similarity analysis. The relative standard deviation of keff induced by XS data was
determined to 0.64%, which is comparable to bias identified in criticality calculations. The
similarity assessment was not so successful. Only 20 benchmarks from more than 500 were
identified with ck value greater than 0.6 and only 4 with ck value greater than 0.7. Low
correlation is accompanied by not sufficient coverage of sensitivity profiles between selected
benchmarks and target VVER-440/213 core. Significant portion of uncovered sensitivity
profiles belong to fission products. The new adjusted of calculated keff value was found by use
of GLLS method. The relative bias between original and adjusted response reached -2.26%.
This result shows the small overestimation of used calculation methodology, adopted cross
section data and applied simplifications. However, the identified overestimation is in principle
consistent with previous results. It should be noted, that the results of TSURFER analyses rely
on the availability of quality uncertainty and correlation data. The determination of Upper
Subcriticality Limit pointed out the necessity of having the administrative margin about the
level of 5% for subcriticality calculations. Moreover, the results of USL method 1 shown that
if more benchmarks suitable for VVER-440 are available, the administrative margin can be
lowered almost to the half of the original value.
Even though our core belongs to PWR’s family the ORNL pre-calculated sensitivity
profiles and benchmarks in DICE database do not cover the Russian technology in a frame of
similarity assessment and biasing methods. Especially the data for fission products will be
welcomed. Finally more effort is needed to extend the DICE database by benchmarks based
on experiments denoted to VVER reactors.

322.12
Proceedings of the International Conference Nuclear Energy for New Europe, Portorož, Slovenia, September 5-8, 2016
ACKNOWLEDGMENTS
The authors would like to thank Martin Gajdoš, head of Nuclear safety department at
Slovenské elektrárne, a.s. for valuable comments and support.
REFERENCES
[1] ANS, Nuclear criticality safety in operations with fissionable materials outside reactors,
American National Standards Institute, 2014, La Grande Park Illinois, USA.
[2] B. L. Broadhead, B. T. Rearden, C. M. Hopper, J. J. Wagschal, C. V. Parks, "Sensitivity
and Uncertainty Analysis Capabilities and Data in Scale", Nucl. Technol., 174, 236,
2011.
[3] ORNL, SCALE, A Comperhensive Modeling and Simulation Suite for Nuclear Safety
Analysis and Design, Version 6.1, ORNL/TM-2005/39, 2011.
[4] B. Vrban, Š. Čerba, J. Lűley, J. Haščík, "Investigation of burnup modelling issues
associated with VVER-440 fuel", Proc. The 9th Int. Conf. on Sust. Develop. Thr.Nuc.
Res. and Edu., Pitesti, Romania, May 18-20, RATEN ICN Pitesti, 2016.
[5] D. DeHart, "High-Fidelity Lattice Physics Capabilities of the SCALE Code System
Using TRITON", The ANS and the ENS 2007 Int. Conf. on Making the Renaissance
Real, Washington, D.C., Trans. Am. Nucl. Soc. 97, pp. 598-600, 2007.
[6] M. B. Chadwick, et. al.: "ENDF/B-VII.0: Next Generation Evaluated Nuclear Data
Library for Nuclear Science and Technology", Nuclear Data Sheets, Volume 107, 2931-
3060, 2006.
[7] D. Wiarda, et. al.: Development and Testing of ENDF/B-VI.8 and ENDF/B-VII.0
Coupled Neutron-Gamma Libraries for SCALE 6, ORNL/TM-2008/047, Oak Ridge
National Laboratory, 2009
[8] P. F. Rose: "ENDF-201, ENDF/B-VI Summary Documentation", BNL-NCS-17541, 4th
Edition, 1991.
[9] K. Shibata, et. al.: "Japanese Evaluated Nuclear Data Library Version 3 Revision-3:
JENDL-3.3", J. Nucl. Sci. Technol. 39, 2002.
[10] Nuclear Energy Agency, International Handbook of Evaluated Criticality Safety
Benchmark Experiments, NEA/NSC/DOC(95)/03/1-VIII, Organisation for Economic
Co-operation and Development, 2014.
[11] J. A. Roberts, B. T. Rearden: "Determination and Application of Partial Biases in
Criticality Safety Validation", Nuc. Sci. and Eng,, 173, 43-57, 2013.
[12] J. J. Lichtenwaller, et. al.: Criticality Benchmark Guide for Light-Water-Reactor Fuel in
Transportation and Storage Packages, NUREG/CR-6361, Oak Ridge National
Laboratory, 1997.
[13] A. Nouri, et al. DICE: "Database for the International Criticality Safety Benchmark
Evaluation Program Handbook", Nuc. Sci. and Eng, 145, 2003.


![[ON TIME-CRITICALITY] TIME-CRITICALITY … · ["ON TIME-CRITICALITY"] TIME-CRITICALITY Time-critical signal processing in humans and machines ... - ancient Greek prosody based on](https://cdn.vdocuments.net/doc/165x107/5b914fb509d3f215288b5a2b/on-time-criticality-time-criticality-on-time-criticality-time-criticality.jpg)


