DEVELOPMENT OF CHOCOLATE-FLAVORED, PEANUT-SOY BEVERAGE
by
RASHMI PRAKASH DESHPANDE
(Under the Direction of Manjeet Singh Chinnan)
ABSTRACT
A novel formulation and pilot-plant scale processing protocol was developed for a protein-based,
nutritious beverage. Roasted peanut and chocolate flavors were utilized to enhance acceptability
and soy flour or soy protein isolate to improve nutritional profile. Extreme vertices, constrained-
mixture design for peanut (X1:30.56%-58.70%), soy (X2:28.26%-43.52%), and chocolate syrup
(X3:13.04%-25.93%) yielded 28 formulations for sensory evaluation. Commercial chocolate
milk was used as a control. Optimization of sensory data was done using response surface
methodology. Since control ratings were 6-7, the regions of maximum consumer acceptability
for each sensory attribute were ratings ≥ 5.0. Optimum formulations for soy flour were all
combinations of 34.1%-45.5% X1, 31.2%-42.9% X2, and 22.4%-24.1% X3; and for soy protein
isolate 35.8%-47.6% X1, 31.2%-43.5% X2, and 18.3%-23.6% X3. A formulation with 43.9%
peanut, 36.3% soy protein isolate, and 19.8% chocolate syrup had the highest consumer
acceptability. Soy protein isolate performed better than soy flour and gave beverage
characteristics closer to that of control.
INDEX WORDS: Chocolate-flavored, peanut-soy beverage, Soy flour, Soy protein isolate,
Extreme vertices constrained mixture design, Sensory evaluation,
Response surface methodology (RSM), Consumer acceptability
DEVELOPMENT OF CHOCOLATE-FLAVORED, PEANUT-SOY BEVERAGE
by
RASHMI PRAKASH DESHPANDE
B. Tech., Laxminarayan Institute of Technology, Nagpur University, India, 1999
A Thesis Submitted to the Graduate Faculty of The University of Georgia in Partial Fulfillment
of the Requirements for the Degree
MASTER OF SCIENCE
ATHENS, GEORGIA
2004

© 2004
Rashmi Prakash Deshpande
All Rights Reserved
DEVELOPMENT OF CHOCOLATE-FLAVORED, PEANUT-SOY BEVERAGE
by
RASHMI PRAKASH DESHPANDE
Major Professor: Manjeet S. Chinnan
Committee: Robert D. Phillips Philip E. Koehler
Electronic Version Approved: Maureen Grasso Dean of the Graduate School The University of Georgia December 2004

iv
DEDICATION
To
Aai, Baba and Kanchu
Their encouragement at every tiny little moment led to this life-long achievement. Their love
and support is my biggest asset and I am fortunate to have their blessings with me, always!
v
ACKNOWLEDGEMENTS
I extend sincere thanks to my major professor Dr. Manjeet S. Chinnan for his remarkable
guidance, careful attention, and timely encouragement. I thank my committee members Dr.
Robert D. Phillips, and Dr. Philip E. Koehler for their valuable input. Special thanks to Ms. Kay
McWatters for her methodical guidance and diligent contribution towards successful sensory
evaluation of the new product developed. Exploring all the possibilities under their direction and
supervision was a great pleasure. I am grateful to the United States Agency for International
Development/ Peanut Collaborative Research Support Program (USAID/Peanut CRSP) for their
financial support. I would like to thank various companies for the supplies used in my research.
I would also like to thank Mr. Glenn Farrell and Mrs. Vijayalakshmi Mantripragada (VJ) for
their technical assistance and friendly encouragement throughout my work. I appreciate the
cooperation and help provided by Mrs. Sue Ellen McCullough in conducting sensory tests, Dr. F.
K. Saalia and Mr. Jerry Davis in statistical data analysis, and all the consumer sensory test
panelists from various departments of The University of Georgia, Griffin Campus. Being a part
of Engineering Laboratory felt like ‘family away from home’, because of the care and affection
of all my friends, especially VJ. I enjoyed the jovial company of my colleagues, Sharon,
Srisuwan, Worapong, Nikolina, Dida, Emine, Dharmendra, and Sudeep in making my work
easy, yet keeping me motivated.
vi
TABLE OF CONTENTS
Page
ACKNOWLEDGEMENTS............................................................................................................ v
LIST OF TABLES......................................................................................................................... ix
LIST OF FIGURES ....................................................................................................................... xi
CHAPTER 1 ................................................................................................................................... 1
INTRODUCTION ...................................................................................................................... 1
Beverage business and current market trends ....................................................................... 1
Why a new beverage product?................................................................................................. 3
Role of consumers in the new product development ............................................................. 5
Development of a chocolate-flavored, peanut-soy beverage ................................................. 6
CHAPTER 2 ................................................................................................................................. 12
LITERATURE REVIEW ......................................................................................................... 12
Sources of protein for a nutritional beverage....................................................................... 12
Peanut (Arachis hypogeae L.) as a source of protein ............................................................ 13
Soybean as a source of protein............................................................................................... 16
Key ingredients of the nutritional beverage ......................................................................... 21
Processing parameters for the nutritional beverage............................................................ 26
Analyzing beverage products: Important physical attributes ............................................ 35
Analyzing beverage products: Important sensory attributes ............................................. 38
Sensory Evaluation ................................................................................................................. 41
Experimental design for sensory evaluation......................................................................... 46
vii
Conducting a well organized sensory test ............................................................................. 48
Response surface methodology and product optimization.................................................. 49
CHAPTER 3 ................................................................................................................................. 75
FORMULATION AND PROCESSING PROTOCOL OF A CHOCOLATE-FLAVORED
PEANUT-SOY BEVERAGE ................................................................................................... 75
ABSTRACT.............................................................................................................................. 76
INTRODUCTION .................................................................................................................... 77
MATERIALS AND METHODS.............................................................................................. 80
RESULTS AND DISCUSSION............................................................................................... 84
CONCLUSIONS....................................................................................................................... 93
REFERENCES ......................................................................................................................... 94
ACKNOWLEDGEMENTS...................................................................................................... 98
CHAPTER 4 ............................................................................................................................... 109
SENSORY ATTRIBUTES AND CONSUMER ACCEPTABILITY OF NEW CHOCOLATE-
FLAVORED PEANUT-SOY BEVERAGE........................................................................... 109
ABSTRACT............................................................................................................................ 110
INTRODUCTION .................................................................................................................. 111
MATERIALS AND METHODS............................................................................................ 114
RESULTS AND DISCUSSION............................................................................................. 121
CONCLUSIONS..................................................................................................................... 131
REFERENCES ....................................................................................................................... 133
ACKNOWLEDGEMENTS.................................................................................................... 137
CHAPTER 5 ............................................................................................................................... 149
viii
OPTIMIZATION OF A CHOCOLATE-FLAVORED, PEANUT-SOY BEVERAGE USING
RESPONSE SURFACE METHODOLOGY (RSM) AS APPLIED TO CONSUMER
ACCEPTABILITY DATA ..................................................................................................... 149
ABSTRACT............................................................................................................................ 150
INTRODUCTION .................................................................................................................. 151
MATERIALS AND METHODS............................................................................................ 154
RESULTS AND DISCUSSION............................................................................................. 159
CONCLUSIONS..................................................................................................................... 171
REFERENCES ....................................................................................................................... 173
ACKNOWLEDGEMENTS.................................................................................................... 179
CHAPTER 6 ............................................................................................................................... 193
SUMMARY AND CONCLUSIONS ..................................................................................... 193
REFERENCES ........................................................................................................................... 196
APPENDICES ............................................................................................................................ 209
APPENDIX A ........................................................................................................................ 209
APPENDIX B ........................................................................................................................ 212
APPENDIX C ........................................................................................................................ 217
APPENDIX D ........................................................................................................................ 219
APPENDIX E ........................................................................................................................ 222
ix
LIST OF TABLES
Page
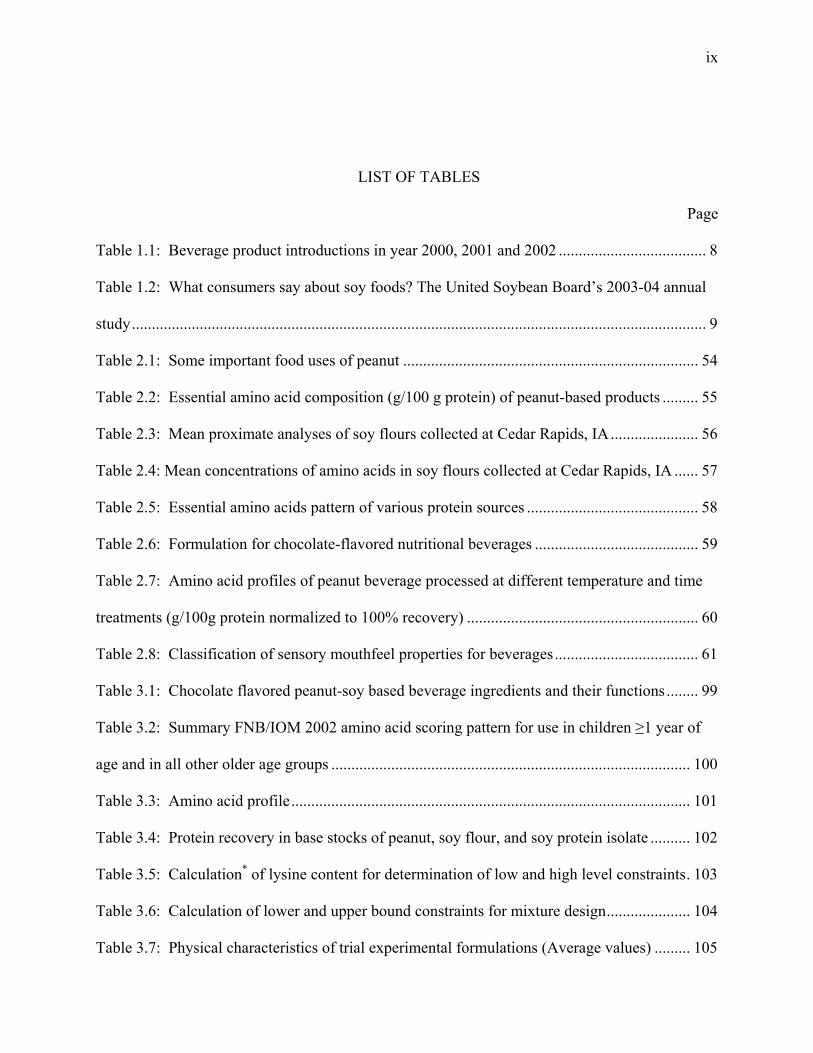
Table 1.1: Beverage product introductions in year 2000, 2001 and 2002 ..................................... 8
Table 1.2: What consumers say about soy foods? The United Soybean Board’s 2003-04 annual
study................................................................................................................................................ 9
Table 2.1: Some important food uses of peanut .......................................................................... 54
Table 2.2: Essential amino acid composition (g/100 g protein) of peanut-based products ......... 55
Table 2.3: Mean proximate analyses of soy flours collected at Cedar Rapids, IA...................... 56
Table 2.4: Mean concentrations of amino acids in soy flours collected at Cedar Rapids, IA ...... 57
Table 2.5: Essential amino acids pattern of various protein sources ........................................... 58
Table 2.6: Formulation for chocolate-flavored nutritional beverages ......................................... 59
Table 2.7: Amino acid profiles of peanut beverage processed at different temperature and time
treatments (g/100g protein normalized to 100% recovery) .......................................................... 60
Table 2.8: Classification of sensory mouthfeel properties for beverages.................................... 61
Table 3.1: Chocolate flavored peanut-soy based beverage ingredients and their functions........ 99
Table 3.2: Summary FNB/IOM 2002 amino acid scoring pattern for use in children ≥1 year of
age and in all other older age groups .......................................................................................... 100
Table 3.3: Amino acid profile.................................................................................................... 101
Table 3.4: Protein recovery in base stocks of peanut, soy flour, and soy protein isolate .......... 102
Table 3.5: Calculation* of lysine content for determination of low and high level constraints. 103
Table 3.6: Calculation of lower and upper bound constraints for mixture design..................... 104
Table 3.7: Physical characteristics of trial experimental formulations (Average values) ......... 105
x
Table 4.1: Fourteen mixture proportions obtained from three component mixture design ....... 138
Table 4.2: Visual stability index (VSI) of various beverage formulations ................................ 139
Table 4.3: Comments by sensory panelists describing beverages containing soy protein isolate
(SPI) or soy flour (SF) ................................................................................................................ 140
Table 5.1: Twenty-eight formulations obtained from mixture design and corresponding mean
hedonic ratings for various sensory attributes ............................................................................ 180
Table 5.2: Parameter estimates for mixture variables for soy flour (SF) formulations before
introducing L-pseudocomponents............................................................................................... 181
Table 5.3: Parameter estimates for mixture variables for soy protein isolate (SPI) formulations
before introducing L-pseudocomponents ................................................................................... 182
Table 5.4: Experimental beverage formulations after introduction of L-pseudocomponents ... 183
Table 5.5: Second degree models in terms of nine sensory attributes for soy flour (SF)
formulations after introduction of L-pseudocomponents ........................................................... 184
Table 5.6: Second degree models in terms of nine sensory attributes for soy protein isolate (SPI)
formulations after introduction of L-pseudocomponents ........................................................... 185
xi
LIST OF FIGURES
Page
Figure 1.1: Consumers are open to variety of new food concepts, as long as they provide
convenience first ........................................................................................................................... 10
Figure 1.2: Interaction of key elements in new product development......................................... 11
Figure 2.1: Different types of stabilizers available over a broad pH spectrum ........................... 62
Figure 2.2: Preparation of soybean beverage............................................................................... 63
Figure 2.3: Process flow sheet for LPC (lipid protein concentrate) and LPC beverage base
preparation .................................................................................................................................... 64
Figure 2.4: Modified Illinois method for preparation of flavored soymilk ................................. 65
Figure 2.5: Miltone- Vegetable toned milk preparation .............................................................. 66
Figure 2.6: Modified Illinois process for peanut beverage preparation....................................... 67
Figure 2.7: Preparation of peanut protein isolate and chocolate flavored peanut beverage ........ 68
Figure 2.8: Preparation of peanut extract for nutritional beverage formulation .......................... 69
Figure 2.9: UHT-sterilized peanut beverage preparation ............................................................ 70
Figure 2.10: Peanut beverage preparation ................................................................................... 71
Figure 2.11: A vegetable milk preparation from bambara groundnut ......................................... 72
Figure 2.12: Making a natural food peanut punch....................................................................... 73
Figure 2.13: Classification of fluids based on the relationship between the shear stress required
to induce flow at various rates of shear ........................................................................................ 74
Figure 3.1a: Base stocks of peanut, soy flour (SF) and soy protein isolate (SPI) ..................... 106
Figure 3.1b: Preparation of chocolate syrup for chocolate-flavored, peanut-soy beverage ...... 107
xii
Figure 3.1c: Processing steps for chocolate-flavored, peanut-soy beverage ............................. 108
Figure 4.1: Experimental region on a ternary plot showing vertex and centroid points of a three-
component constrained mixture design ...................................................................................... 141
Figure 4.2: Selection of different design points in the experimental region for various
formulations in order to conduct sensory evaluation.................................................................. 142
Figure 4.3: An example of a hedonic scale for overall acceptance ........................................... 143
Figure 4.4: Viscosity values of various soy flour and soy protein isolate – based formulations in
comparison to the control (Hershey®’s creamy chocolate milk shake; η=36.9 mPa s) ............. 144
Figure 4.5 A, B, C: Trends of sensory attributes (aftertaste, appearance, and aroma) for soy flour
(SF) and soy protein isolate (SPI) formulations compared to control (Hershey®’s creamy
chocolate milk shake) ................................................................................................................. 145
Figure 4.5 D, E, F: Trends of sensory attributes (color, consistency, and flavor) for soy flour
(SF) and soy protein isolate (SPI) formulations in comparison to control (Hershey®’s creamy
chocolate milk shake) ................................................................................................................. 146
Figure 4.5 G, H, I: Trends of sensory attributes (mouthfeel, overall acceptability, and sweetness)
for soy flour (SF) and soy protein isolate (SPI) formulations compared to control (Hershey®’s
creamy chocolate milk shake)..................................................................................................... 147
Figure 4.6: Comparison of the best formulation (#8 using SPI) with control (Hershey®’s creamy
chocolate milk shake) for mean (n=41) hedonic ratings of various sensory attributes .............. 148
Figure 5.1: Experimental region showing design points those can be used as sample
formulations ................................................................................................................................ 186
Figure 5.2: Experimental design points and the beverage formulation region after introducing
lower bound pseudocomponents (L-pseudocomponents)........................................................... 187
xiii
Figure 5.3: Response surfaces (three-dimensional plots) for overall acceptability obtained using
L-pseudocomponents for soy flour (SF) and soy protein isolate (SPI) formulations ................. 188
Figure 5.4: Contour plots for aftertaste, appearance, and aroma for soy flour (SF) and soy
protein isolate (SPI) formulations............................................................................................... 189
Figure 5.5: Contour plots for color, consistency, and flavor for soy flour (SF) and soy protein
isolate (SPI) formulations ........................................................................................................... 190
Figure 5.6: Contour plots for mouthfeel, overall acceptability, and sweetness for soy flour (SF)
and soy protein isolate (SPI) formulations.................................................................................. 191
Figure 5.7: Optimum regions (shaded areas) obtained by superimposing contour plots for all
nine attributes for soy flour (SF) and soy protein isolate (SPI) formulations............................. 192
1
CHAPTER 1
INTRODUCTION
Beverage business and current market trends
Beverage business is taking a new shape and has tremendous potential for future developments.
Beverage industry is focusing on consumer desires. Both consumers and industry are looking for
alternative product options suitable for a changing marketplace. Recently, beverage products
have created a new category, a whole new business through innovative new products. In
addition to the traditional kinds like alcoholic beverages, carbonated soft drinks, ready-to-drink
fruit or dairy based beverages, and smoothies, a wave of innovative terminologies such as
flavored milks, energy beverages (Xtreme Exquisite™), liquid meal-replacements (Nouriche™),
weight-directed products (Slim-Fast™), ready-to-drink meals (Golean™, a soy drink segment),
and functional beverages are becoming popular in the beverage market. Almond, rice, and oat
milks are helping to fill the milk and cereal void (Sloan 2003c). All these beverage categories
are available in various distribution locations such as supermarkets, convenience stores,
restaurants, wholesale clubs, retail stores, and fountain or vending machines. In short, there is a
scope and market for the beverage products in a variety of ways.
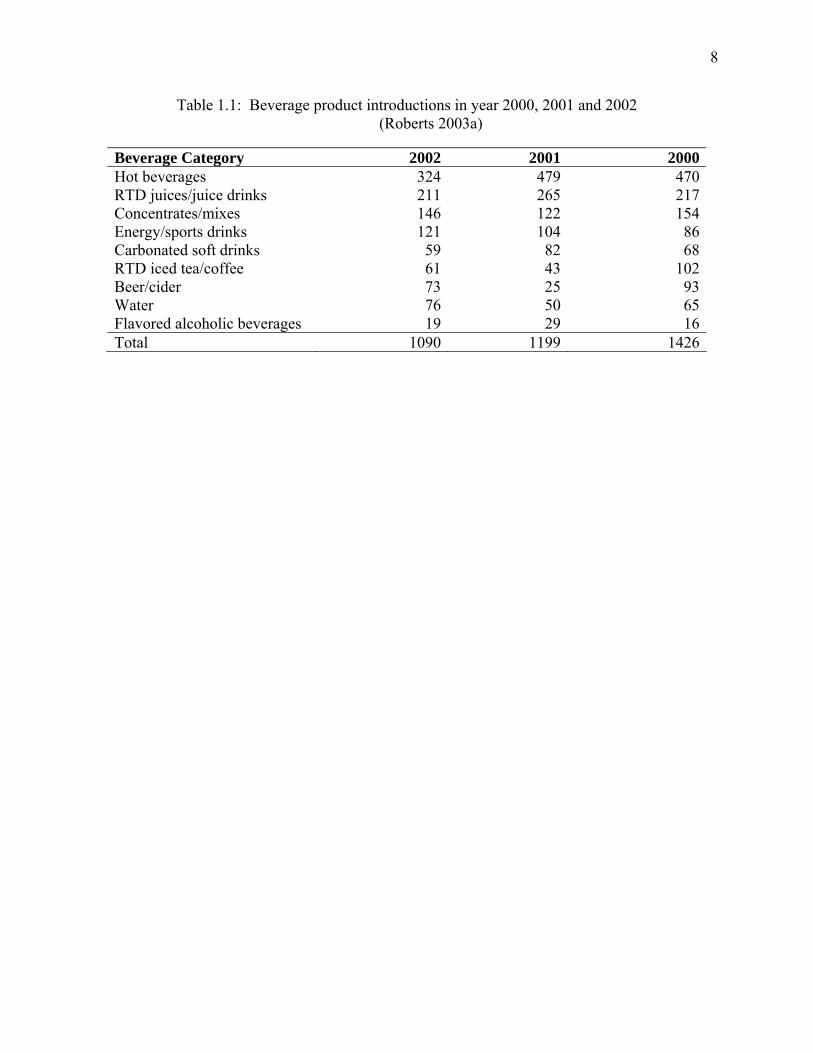
A synopsis of the new beverage product categories and major areas of interest are
presented in Table 1.1. It can be observed that there has been substantial decrease in hot
beverages, carbonated soft drinks, RTD (ready-to-drink) iced tea/coffee, and beer/cider category,
whereas the energy/sports drinks category shows significant growth. As per the survey done by
BevNet.com, 2003 was an interesting year for a soft drink industry, since the sales of carbonated
2
soft drinks did not show much growth on the other hand the energy drinks sales boomed along
with the continued emergence of many health-directed products (Anonymous 2004c). From the
top 10 trends to be watched and worked on in year 2003 (Sloan 2003a), Figure 1.1, ready-to-eat,
packaged for on-the-go, high protein, and anything that could replace a meal are some of the
trends consumers are willing to try over the next few years.
As a part of convenience and single serving choices, “meals in motion” are becoming
popular. The changing life-styles and eating preferences have inspired a new generation of
portable products. One in ten meals was eaten “on-the-go” in 2002, and the liquid and bar meal-
replacement products represented the ultimate in contemporary one-dish meals (Sloan 2003b). A
new generation of great-tasting products (Sloan 2003b), such as Snapple’s Snapple-A-Day™ and
Yoplait’s Nouriche™, has helped the liquid meal replacements skyrocket to a $2.5-billion
market segment, up 11% compared to 2002. The “Meal in a Bottle”, a combination of whey and
soy protein with more than 20 vitamins and minerals, is the latest addition to the explosive soy
and dairy based market segment (Sloan 2003b).
Next to the single-serve, health has been the most dramatic factor influencing beverage
sales in the past few years with PepsiCo and Nestle focusing on the health for their future
acquisitions (Sloan 2003b). The desire for good health and concern over carbonated soft drink
consumption has driven consumers to juice and juice drinks (Sloan 2003b). While purchasing a
food item for the first time, price and brand name are deciding factors but the impact of health
claims, types of preservatives/additives, and organic claims have increased. In 2002, 72%
shoppers which was up 6% over the previous year, said that they almost always/sometimes look
at the health claims (Sloan 2003a). Annual soymilk sales have grown to $550 million with 8%
of the households using it on a regular basis (Sloan 2003a). Healthier product alternatives
3
including juice/soy combinations, juice/fruit/dairy smoothies, fortified juices/drinks, single-serve
lemonade, and organic drinks are among those enjoying the strongest growth (Sloan 2003b).
Consumers are fascinated by functional beverages, showing increase in the sales from $10.35
billion in 2002 to projected $15.9 by 2010 (NBJ 2003). The growth of
“Functional/Nutraceutical/Wellness Foods and Beverages” has been attributed to several factors
such as consumers interest in maintaining better health; rise in available information regarding
the link between diet and health; changes in food laws that have affected label and product
claims; and an increasing sector of the public aging quickly and purchasing functional food
products (Ohr and others 2003).
Overall, consumers are looking to lead more healthy lives, thus consuming more
nutritious foods. Taking advantage of this fact, companies also are developing new functional
beverage products. For example, Minute Maid Co. recently introduced Minute Maid® Premium
Heart WiseTM Orange Juice, a cholesterol-reducing orange juice that contains 1 g of plant sterols
per serving. The functional beverage market is expected to grow at an annual growth rate of
5.7% (Ohr and others 2003). “Better for you” products can help boost up the beverage sales and
have great applications in the beverage industry.
Why a new beverage product?
One of the ways to increase chances of obtaining a successful product is to gather market
information so that new market niches can be located for new product ideas prior to product
development and to follow a consumer driven food product development process (Knox and
Mitchell 2003). Looking at current market scenario and health driven food choices, the beverage
category seems to receive consumer attention the most. Hence, a novel protein-based nutritious
beverage from peanut and soy was developed. Both peanut and soy are two important protein-
4
rich oilseed sources which can complement each other in order to enhance the nutritional
characteristics of the final product. Both of them have functional benefits which can result into
an optimum blend in combination with a popular chocolate flavor.
New food products may be innovative, adaptive, imitative, line extensions, or new forms.
New products and line extensions, typically representing 10-15% of category volume each year,
are going to be a very meaningful percentage of total category volume over next 3-to 5-year
period (Lord 2000). Brand and line extensions are still a good way to leverage consumer
awareness and reduce risk and entry cost, but innovative new products potentially reap more
rewards (Lord 2000). A new product is a product not previously marketed or produced by the
organization for which it is developed or made available (Segall 2000). Also, the new product
which is novel, unique, and distinctly untried, unfamiliar, or even previously nonexistent is
called an invention, especially if it is innovation in technology, and is eligible for protection by
patent (Segall 2000). As per the definition a chocolate-flavored, peanut-soy beverage being
developed in this study was termed as the invention.
In a completely new product category, researcher develops a new process and a prototype
product by optimum methods to test the acceptance. The prototype development and consumer
acceptance study are therefore, essential parts of a new product development process. The
consumer input in the form of sensory analysis of the new product is crucial in the development
stages. Although commercially processed foods must attract consumer by appearance of the
package, repeat purchases will depend on how pleasing a sensory experience is perceived when
the product is eaten (Toledo and Brody 2000). Hence, analyzing consumer response in terms of
sensory acceptability of the new product was considered important during this study.
5
Role of consumers in the new product development
The basic reason for any research and development is to increase current profits and ensure
future sales. Product development has always been at the heart of food industry and rapid
technological changes, accompanied by a steady increase in the standard of living, resulted in
even greater opportunities for product development (Earle 1997). Globally a new product is
launched every twenty minutes and speed is the fuel that drives the process (Robinson 2000).
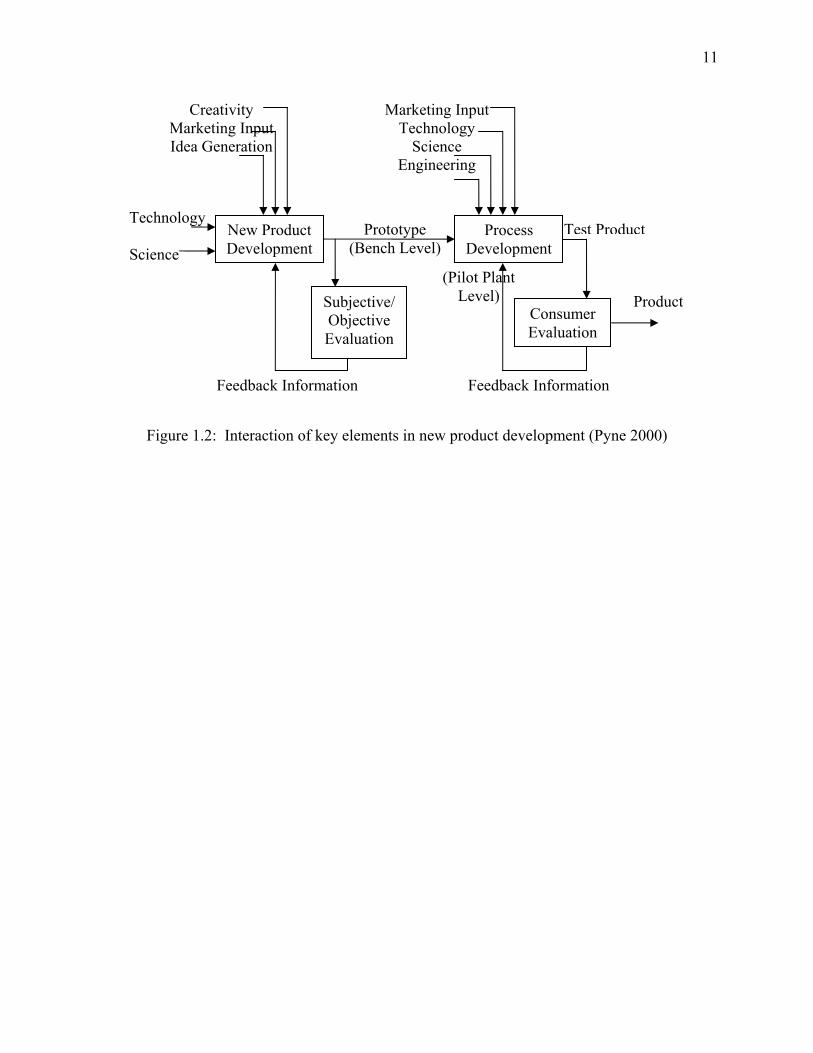
The process of new product development is at the best a delicate and tortuous path (Figure 1.2)
The consumer needs/desires are major driving force of the new food product
development, and perceptions about the food form the basis of those perceived needs (Bursey
1983). According to Brody and others (2000), today’s food consumers have adopted different
patterns of food consumption suitable to their more mobile and more diversified lifestyles and
hence the task of food system is changing from “bringing the consumer to the food” to “bringing
the food to the consumer”. Any single product on the supermarket shelf must compete with
some 10000 others to get into a shopper’s grocery cart and hence constant market appraisal is
necessary (Desrosier and Desrosier 1971). A sequence of activities that leads to the introduction
of a successful new product into today’s highly competitive marketplace has its beginnings and
foundation in the extensive and ongoing market research which elicits and defines the changing
consumer desires (Bursey 1983). The consumers want access to novel and interesting foods that
are fresh, convenient, and tasty. The changing scenario poses a challenge for the industry as well
as an opportunity for the new product development.
The new food product development should be a systematic effort founded in a strategic
plan to please-and even delight-consumers (Robinson 2000). Earlier, consumers wanted value
for money, variety, convenience and foods that were attractive to their senses but now-a-days,
6
they are also aware of nutrition, food safety, as well as the social and environmental effects of
food production (Earle 1997). The developers of new food products, or of more convenient
forms of processed foods, should consider retention of nutritional quality as a primary factor in
their measure of success (Anonymous 1973). The nutritional quality should be ranked alongside
safety, acceptability and convenience in this modern, mechanized, and computer-run society,
where most of the food eaten is processed and mass-distributed. The relation of diet to health is
but one of the many factors that influence food purchase decisions and, thus, the stimulus for
developing new food products (Bursey 1983).
Development of a chocolate-flavored, peanut-soy beverage
New food product innovation is necessary for survival in today’s competitive global market and
the innovation is important because unique product that fills the need/desire will succeed in the
current market which is becoming rapidly overcrowded (Knox and Mitchell 2003). However, it
is important and absolutely necessary to integrate technology, consumer understanding and
marketing in order to maximize a product’s potential (Robinson 2000).
The main objective of this study was to develop a new nutritional beverage which was
accomplished by utilizing peanut and soy proteins. A market survey of flavored milk-type
products, the literature search on similar products, beverage ingredients, and various processing
methods, and the pilot-plant scale beverage preparation trials were crucial in order to get the
possible new alternatives. Once the list of ingredients, ingredient levels, and the definite pilot-
plant scale processing protocol were obtained, a three component mixture design approach was
used to get the number of possible formulations required for a consumer sensory evaluation.
Using the mixture design, a set of formulations were prepared and subjected to the sensory
evaluation. The consumers responded to various sensory attributes using a 9-point hedonic
7
scale. The hedonic ratings were analyzed in comparison with a commercial chocolate milk
(control) to obtain the most acceptable formulation. Also, the optimum formulation of the new
product developed was obtained using a response surface methodology (RSM) applied to the
consumer sensory data. Two optimum formulations, one with soy flour and another using soy
protein isolate as a source of soy protein in the combination with peanut flour and chocolate
syrup were achieved. These formulations had the maximum consumer acceptability, and
physical and sensory properties close to the commercial chocolate milk. In this way, a new
nutritionally enhanced product having the physical and sensory characteristics similar to that of
the commercial chocolate milk was developed.
8
Table 1.1: Beverage product introductions in year 2000, 2001 and 2002 (Roberts 2003a)
Beverage Category 2002 2001 2000Hot beverages 324 479 470RTD juices/juice drinks 211 265 217Concentrates/mixes 146 122 154Energy/sports drinks 121 104 86Carbonated soft drinks 59 82 68RTD iced tea/coffee 61 43 102Beer/cider 73 25 93Water 76 50 65Flavored alcoholic beverages 19 29 16Total 1090 1199 1426
9
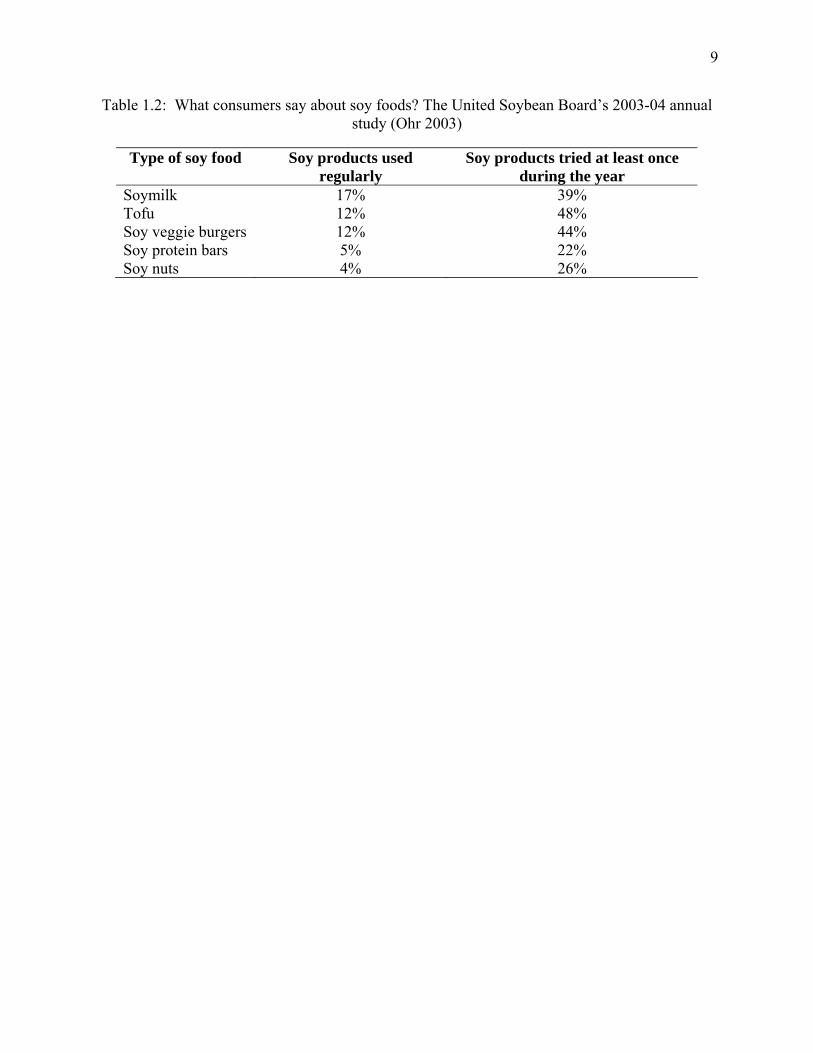
Table 1.2: What consumers say about soy foods? The United Soybean Board’s 2003-04 annual study (Ohr 2003)
Type of soy food Soy products used
regularly Soy products tried at least once
during the year Soymilk 17% 39% Tofu 12% 48% Soy veggie burgers 12% 44% Soy protein bars 5% 22% Soy nuts 4% 26%

10
Top New Food Attributes-Total(as % Consumers "Definitely" or "Probably" try)
7776
656462
6059
4543
0 20 40 60 80 100
Ready-to-eatHeat-and-eat
Packaged for on-the-goconsumption
No utensils requiredLow carbohydrate
Low fat/Fat-freeHigh protein
OrganicAnything that could replace meal
Figure 1.1: Consumers are open to variety of new food concepts, as long as they provide
convenience first (Sloan 2003a)
11
Test Product
Product
Feedback Information Feedback Information
(Pilot Plant Level)
Prototype (Bench Level)
Marketing Input Technology
Science Engineering
Creativity Marketing Input Idea Generation
Technology Science
New Product Development
Process Development
Subjective/Objective Evaluation
Consumer Evaluation
Figure 1.2: Interaction of key elements in new product development (Pyne 2000)

12
CHAPTER 2
LITERATURE REVIEW
Sources of protein for a nutritional beverage
Proteins are added as ingredients to foods to achieve functional and nutritional goals (Giese
1994). Proteins are fundamental, integral, and essential food components. Proteins serve as a
source of energy and amino acids essential for growth and maintenance. Proteins provide unique
properties to foods such as emulsification, water and/or fat binding, foam or gel formation and
alteration of flavor, texture and appearance.
There are two basic types: animal protein and plant protein. Milk is an important animal
protein which has casein and whey proteins as two principle proteins. Whole milk is about
87.5% water, 4.5% lactose, 3.5% fat, 1.0% ash and the remainder -3.5%-is protein (Giese 1994).
Plant seeds are the most utilized components of plants as possible source of protein. Other plant
components being explored to some extent include leaves, stems and roots. Cereals especially
wheat and corn are one of the important category of plant proteins having commercially
available products. Oilseeds such as soybean, cottonseed, and peanut have also been studied to
obtain protein ingredients. Soybeans are available in various processed forms like soy flour,
grits, concentrates, isolates, and textured products (Giese 1994). A variety of textured products
are made from soy protein by processing flours, concentrates and isolates. Hydrolyzed soy
proteins are used in dairy products, confectionery, baked goods, and beverages (Roberts 2003b).
13
Milk, whey, and soy are main proteins having applications in infant formulas, protein
enriched foods, and beverages. Nutrition, solubility, viscosity, and emulsification are some of
the important functions of food proteins which play a significant role in beverage products.
Protein additives are useful in the beverage applications (nutritional or sports drink) where the
main functionality is imparting flavor and providing soluble proteins. Whey and soy proteins
can be used in various fruit-based beverages that are high in protein for example, children’s
health drinks, weight management products or fruit-based sports drink, and products with pH
ranging from 3 to 4. Once a desirable function is known such as enhancing nutritive value,
emulsification, or modifying flavor and appearance, suitable form of protein can be selected to
impart those characteristics to the food product.
Peanut (Arachis hypogeae L.) as a source of protein
Worldwide, about 67% of the peanut crop is processed for peanut oil, 20% is used in
confectionary, and remainder for other peanut-based products. Georgia produces almost half of
the total U.S. peanut crop. In the United States, more than 50% of the crop goes to peanut butter
production (Anonymous 2004d). Although peanuts come in many varieties, there are four basic
market types: Runner, Virginia, Spanish and Valencia. Within four basic types of peanuts, there
are several "varieties" for seed and production purposes. Each variety contains distinct
characteristics which allow a producer to select the peanut that is best suited for its region and
market (Anonymous 2004a).
Among the major oil seed crops, peanut has specific advantages as it can be used in many
food forms. From consumption point of view, pleasant aroma, nutty flavor and desirable
textured raw and roasted nuts are the unique features of peanuts that place them above all other
edible grain legume (Singh and Singh 1991; Table 2.1).
14
Other Peanut Products:
• Specially processed, defatted peanuts are available as roasted snack peanuts; they are
ground into flour, which can be used to make high protein drinks and snacks
(Anonymous 2004b)
• Peanut in the form of flour, protein isolates, and meal in a mixed product are desirable
from a sensory quality point of view (Singh and Singh 1991)
• Peanuts are utilized to make imitation milk, cheese and ice cream.
• A chocolate-flavored shake-type beverage containing 84% whey and 8% peanuts has
been developed by soaking peanuts in sodium bicarbonate solution overnight to develop
desirable flavor before being incorporated into a whey slurry (Nolan 1983)
• Peanut meal (made from the by-product of peanuts pressed for oil) is an important high
protein animal feed (Anonymous 2004b)
In recent years, several cereal and legume-based foods using peanuts as the protein
supplements have been developed to alleviate a protein calories-malnutrition problem (Singh and
Singh 1991). Millions of people in the developing countries like Asia and Africa depend on
vegetable products for protein source. About 80% of the proteins consumed by humans are
supplied by plants especially cereals and legumes taking larger share as sources of dietary
proteins. Dietary deficiencies of protein and calories particularly among preschool children and
lactating women in such countries is one of the essential factors causing food scientists and
nutritionists to think in the direction of development of nutritionally balanced protein based
foods. Oilseeds and grain legumes are principle raw materials utilized to manufacture and
market high protein foods at reasonably low prices. Defatted and full fat soy flour, non-fat dry
milk, dry whey, dry butter milk, processed corn germ, wheat concentrates, several peanut and
15
soy fortified food blends have been extensively used as the sources of concentrated proteins for
various cereal-based fortified formulations.
The research shows that regular peanut consumption helps to reduce the risk of
cardiovascular disease without weight gain (Alper and Mattes 2003; Kirkmeyer and Mattes
2000). Peanuts also contain powerful plant chemicals such as phytosterols which can inhibit
cancer growth. Rick Mattes from Purdue University in Indiana, USA suggests three mechanisms
of lowering body weight due to frequent consumption of peanuts (Mattes 2004). Firstly, peanuts
have high satiety value which means that eating peanuts satisfies hunger and gives the feeling of
fullness. Secondly, peanuts have raising metabolic rates or they burn more energy. And lastly,
peanuts have low absorption rates or tend to pass through our digestive system. Peanuts are a
rich source of monosaturated fatty acids, magnesium and folate, vitamin E, copper, arginine, and
fiber, all of which have cardiovascular disease risk reducing properties.
The nutritive value of peanut protein is a function of its protein content (Peanuts = 15.4-
30.2%, peanut flour = 47.0-55.0%, and peanut protein concentrates = 70.2%), amino acid
composition (Table 2.2), and protein digestibility. Although, the peanut protein is deficient with
respect to certain essential amino acids, for example, lysine, tryptophan, threonine and sulphur
containing amino acids, its true digestibility is comparable with that of the animal protein (Singh
and Singh 1991). During the past decade, research directions concerning the evaluation of plant
proteins as human foods have considerably changed and emphasis is being placed on designing
the protein blends of cereals and legumes to correct imbalances between amino acids from the
nutritional point of view (Singh and Singh 1991). Keeping this trend and the essential amino
acid profile of peanut protein in mind, other oilseed rich in protein- soybean, either in the form of
soy flour or soy protein isolate- was thought of as a supplementary source of protein.
16
Soybean as a source of protein
Soybeans are 30% carbohydrate, 18% oil, 14% moisture, and 38% protein. Soybean is the only
legume that contains nine essential amino acids at the levels that meet the human requirements.
Thus, soy proteins are categorized as a source of high-quality protein, making them equivalent to
meat, milk, fish, and eggs as a source of important nutrients (Tockman 2002). Soy foods provide
excellent nutrition, they are low in saturated fat, are lactose free and the quality of soy protein is
equal to the quality of animal protein (Schaafsma 2000; Sarwar and others 1985; Sarwar 1997;
and U.S.D.A. 2000; Riaz 1999). Soybean is a very rich source of essential nutrients suitable for
all ages from infants to the elderly that provides an alternative source of easily digestible protein
for people who are allergic to the protein in cow’s milk (Riaz 1999). Although relatively low in
methionine, it is a good source of lysine (Riaz 1999). Various soy ingredients have different
nutritional and functional properties which enable developers to give consumers healthful, high-
protein snacks, while allowing the processor to optimize nutrition, functionality and cost.
Soy is a source of high quality protein that helps one eat less often thereby decreasing
hunger and maintaining muscle mass during weight loss (Anonymous 2003). One emerging
trend is the design of cereal and other food products formulated with soy protein because of its
proven health benefits; women in particular represent new markets for food manufacturers
developing products to meet specific nutritional needs (Tockman 2002). Whether due to its
health benefits or its ability to solve a variety of formulation challenges, soy protein can be found
in foods ranging from ice cream to burgers, from milk to nut products, and tofu to a variety of
meat alternatives (Roberts 2003b). Soy protein can be incorporated in food in many different
forms (Anonymous 2003) such as soy flour, relecithinated soy flour, textured soy flour/
17
concentrate, enzyme active soy flour, soy grits, soy protein concentrate, soy isoflavones, and
isolated soy protein.
Soy Flour: The full-fat flakes or defatted soy flakes are ground into soy flour. The heat
treatment, processing method, particle size and amount of fat govern different types of soy
flours. Typical soy flours available are 20, 70 and 90 PDI. The PDI is the Protein Dispersibility
Index and indicates the amount of heat treatment received by the flour. Soy flour is 40-50%
protein. Tables 2.3 and 2.4 show mean proximate analyses and mean concentrations of amino
acids in soy flours, respectively.
Isolated Soy Protein: Isolated soy protein (ISP) or soy protein isolate (SPI) has the most
of the non-protein components removed from defatted flake. ISP is the most concentrated form
of soy protein and is about 90% protein. Isolates are highly dispersible, contain all amino acids,
and usually sold as fine powder. Isolates can be lecithinated to improve dispersibility or
extruded to yield a wet fibrous protein. New processing methods have improved the flavor of
the isolates making it easier to choose an isolate with reduced beany flavor. Processing method
affects the functionality, so different isolates have various viscosities, emulsification and
whipping properties.
The isolated soy proteins (minimum 90% protein content) are virtually pure, bland-
flavored and the most functional of the soy proteins having excellent nutritional qualities. Some
can emulsify fat and bind water and are designed to function in a given system in exactly the
same way as animal proteins. Some isolates can be used to provide an elastic gel texture,
imparting characteristic mouthfeel, while others control viscosity in drinks, making them
creamier or full bodied. Various commercial products now take advantage of these
characteristics offered by soy proteins (Riaz 1999). Some useful characteristics of soy protein
18
concentrates and isolates as ideal source of highly digestible protein in a beverage– an easy way
for consumers to add soy protein into their diets (Riaz 1999) are:
Soy protein is low in viscosity
Soy protein helps achieve desired mouthfeel
Viscosity contributed by isolates makes it ideal for other nutritious liquid products, such
as infant formulas, creamers, milk replacers, and spray-dried products
Soy products add fiber, mineral, and other nutrients to the formulation
Water-washed special proteins are available which deliver significant amount of
isoflavones and fiber
Soy isolates are blandest traditionally
Soy protein isolates are highly digestible source of amino acids which are regarded as the protein
building blocks needed for proper human growth and maintenance (Roberts 2003b).
Some of the reasons for the use of soy proteins include their relatively low cost and easy
availability compared to other competing food ingredients and wide range of functional
properties that help to stabilize food systems as well as provide sensory properties such as
texture that consumer demands (Myers and others 2003a). Studies have undertaken to develop
soymilk and soymilk powder from defatted soymeal with protein content as high as factors such
as stability, whiteness and consumer acceptability would allow (Ang and others 1985). Studies
have been done to observe various functional properties of the soy protein fractions and
simplified ways to obtain them (Myers and others 2003a, 2003b). Numerous isolated soy
proteins with a variety of viscosity profiles provide varying degrees of consistency in the
finished beverages, for example, a soy shake possessing a smoothie-like consistency demands a
high viscosity protein however a high-protein shake with a milky consistency requires a low-

19
viscosity product, and in the juice based beverage applications, special stabilization is needed;
pectin often serving as a stabilizer (Roberts 2003a). As an added benefit, soy protein is
complementary to many other essential ingredients, such as calcium, fiber, and probiotics.
Different soy proteins have different functionalities, for example, isolated soy protein and soy
protein systems can be added to provide a silky mouthfeel and can be used in traditional milk
and egg formulas to improve the overall costs of producing a finished product (Tockman 2002).
The compositions of essential amino acids for infant/adult requirements, and of whole
eggs, cow’s milk, human milk and soy products from defatted meal are shown in Table 2.5.
From such compositions it will be seen that the quality of soy protein compares favorably with
that of the foods listed. A considerable amount of research has been conducted to explore the
health benefits of soy protein (Messina 2003; Ohr 2003; Roberts 2003b, and Riaz 1999). Based
on past and ongoing global clinical studies (Tockman 2002), soy protein ingredients may reduce
cholesterol, reduce blood pressure, improve bone health, protect against heart disease, improve
athletic performance, help with weight management, and ease menopausal symptoms.
Consumer enthusiasm regarding soy protein-based foods and beverages is growing, and
retailers are responding by offering more products. In October 1999, the United States Food and
Drug Administration (FDA) issued a heart health claim stating that consuming a minimum of 25
g of soy protein per day as a part of a low-fat, low-cholesterol diet may reduce the risk of
coronary heart disease. In addition to qualifying as low-fat and low-cholesterol, soy-based foods
bearing this heart health claim must provide at least 6.25 g of soy protein per serving (Tockman
2002). The health claim is based on clinical trials showing that consumption of soy protein can
lower total and low-density-lipoprotein (LDL) cholesterol levels (Ohr 2003). Nearly 1000 new
soy products have been introduced since the FDA approved the heart health claim in 1999. The
20
evidence of mainstream consumer interest in soy foods is obvious in the most recent study
published by the United Soybean Board, “Consumer Attitudes About Nutrition: National Report
2001-2002.” The percentage of Americans who consume soy foods weekly increased from 24%
in 1999 to 27% in 2001 (Tockman 2002). A survey in 2003 reported heat 28% of Americans use
soy products at least once a week (Messina 2003). Additional research and clinical trials are
pointing to other potential health benefits of soy protein and soy isoflavones: Bone health,
prostate cancer, and menopause are three main areas where consumers may soon be learning
more about soy’s benefits (Ohr 2003).
Since soybeans have such health benefits, it can be considered as a functional food.
Functional food is a product that provides health benefits beyond the traditional nutrients it
contains or a food containing significant levels of biologically active components that impart
health benefits beyond basic nutrition (Riaz 1999). The interest in health has led to the
development of so-called New Age beverage market in the United States, which is estimated to
be worth about $1 billion a year at wholesale prices (Hilliam 1993). The beverage industry is the
biggest market producing functional foods (Ohr 1997).
Soy beverages look like milk, have good mouthfeel, and clean aftertaste; however, heat
and processing may change the flavor profile of the beverage (Riaz 1999). As these soy based
foods are consumed in the national diets they are suitable vehicles for fortification to meet
known deficiencies in the essential nutrients and such fortifications would serve to provide a
complete nutritional supplement in the form of a beverage for children of primary school age and
for specific groups of people (Ang and others 1985). Besides providing an alternative to the
traditional dairy products, soy protein is being incorporated into many of today’s nutritious meal-
21
replacement beverages, offering ‘on-the-go’ consumers a way to skip a sit-down meal for the
convenience that a liquid option offers (Riaz 1999).
Key ingredients of the nutritional beverage
Due to various advantages of incorporating soy proteins in the beverage products and
considering their functional and nutritional properties, two sources: defatted soy flour and soy
protein isolate were thought to be suitable protein supplements for a peanut-based beverage. Soy
protein was considered to be the best in accomplishing two major objectives- supplement the
amino acid profile of peanut protein in order to get a nutritious drink and formulate a novel
functional drink suitable to the demand of current trend of health aware consumers.
However, soy proteins have few drawbacks; they can not be used in a clear liquid-based
beverage because of the presence of suspended long-chain protein molecules. Also some soy
protein ingredients impart undesirable beany flavor. Flavor is a major factor that limits the use
of many vegetable proteins in foods (Rackis and others 1979). Combining roasted, partially
defatted peanut flour and soy protein (defatted soy flour/soy protein isolate) was thought to be a
potential approach to overcome the flavor problem to some extent. Also, formulation of peanut/
milk protein blends can be a technique for expanding the use of peanut proteins and these
blended food ingredients could be of superior nutritional and sensory quality to either protein
individually (Schmidt 1978). Beverage and yoghurt systems prepared from peanut and soybean
protein/ milk blends are generally more acceptable than those prepared from soybean or peanut
milk (Schmidt and Bates 1976; Schmidt and others 1977). Cereal and snack foods fortified with
17% defatted peanut flour appear to have no adverse effect on sensory acceptability; a peanut-
fortified corn-base cereal received a hedonic score of 6.1, which compared favorably with that
for a commercial breakfast corn product; meat patties containing peanut flour were rated equal to
22
or better than similar patties containing equivalent amounts of soy flour (Rackis and others
1979). However, the use of peanut-soy combination in the beverage product is a relatively new
concept. Recognition of acceptable sensory qualities involves taste, odor, color, texture, and
other factors; the successful introduction of a new protein food becomes especially difficult if its
sensory qualities are different (Rackis and others 1979). As consumers have become better
informed about nutrition, food manufacturers face the challenge of providing nutritious food,
while at the same time, ensuring that the product has an appealing taste, texture, and appearance
(Riaz 1999). Acceptance may require a long period of consumption so that one can acquire a
taste for the new protein food otherwise, agents that impart acceptable sensory properties must
be added to mask objectionable flavors of the new protein food (Rackis and others 1979). As
stated by Daniele Karleskind there are several issues with proteins and flavors- one is the taste of
the protein itself and the other is how the protein interacts with the flavor (Brandt 2002). The
effect of flavor binding on perceived flavor intensity depends on the flavor molecule and the
type, amount and composition of the protein, as well as the presence of ingredients such as lipids
or polysaccharides (Brandt 2002).
Chocolate has proven to be a popular flavor for soy-based beverages, due to its ability to
mask protein flavor and provide a smooth flavor profile. Formulators have more difficulty
getting subtle flavors such as vanilla and fruit flavors to come through (Brandt 2002). Addition
of chocolate, almond, and vanilla flavorings diminished the beany flavor of soymilk, but the
chocolate flavoring exhibited the best effect in enhancing overall sensory quality (Wang and
others 2001). Hence in case of peanut-soy protein-based beverage the most accepted beverage
flavor was thought to be introduced using cocoa powder and artificial chocolate flavor. The idea

23
was to use roasted peanut, soy and chocolate flavors at the optimum levels resulting in the most
acceptable flavor of the new beverage.
The important factor while using cocoa powder as an ingredient in liquid products is the
stability. Preventing physical instability of chocolate milk is both a technological and a scientific
challenge (Boomgaard and others 1987). In industrial production three types of instability are
important:
1) Sedimentation of cocoa particles forming a densely packed layer at the bottom
2) Formation of large flocs and
3) Formation of light and dark chocolate layers or segregation
The inhibition of sedimentation in chocolate milk by adding stabilizers has been partially
successful; the floc formation can be prevented by adjusting the concentration of added
stabilizers or lowering the sterilization time; and maintaining a continuous network formed by an
interaction of protein and protein-covered cocoa particles in the presence of a suitable stabilizer
(carrageenan) can help preventing the sedimentation and segregation to some extent (Vliet and
Hooydonk 1984; Boomgaard and others 1987).
A family of carrageenan products that bring special functional properties to many
applications are offered by CP Kelco, San Diego, CA (Pszczola 2003). Figure 2.1 shows a range
of different stabilizers available as per its application. Genuvisco is one of their carrageenan
products designed to thicken and stabilize water- and protein-based formulations; Genulacta,
another carrageenan, primarily used in milk-based systems and suitable for ice cream, chocolate
milk, and dairy dessert applications, providing excellent texture, mouthfeel, and shelf-life
stability; and several others, including a new technology for meat applications (Pszczola 2003).
High degree of reactivity of carrageenan with proteins results in a three-dimensional network
24
holding cocoa powder in suspension at levels as low as 0.25%. This makes it especially valuable
and for this reason, kappa-carrageenan is found in majority of flavored refrigerated dairy-and
soy-based beverages with its effectiveness being enhanced through the addition of other
hydrocolloids that impart viscosity such as xanthan gum, guar gum and others (Klahorst 2002).
Sodium alginate, xanthan gums, locust bean gums, kappa, lambda, and iota carrageenan gums
were tested in the preliminary studies done by Wang and others (2001) and iota-carrangeenan
was found to be the most ideal gum that was not only able to help suspend chocolate powder, but
also compatible with soymilk without forming curds or bringing the off-flavor. It also had the
ability to improve consistency and mask the beany flavor of soymilk.
Hydrocolloids or more commonly gums are long-chain polymers that dissolve or disperse
in water to give a thickening or viscosity-building effect. The gums are also used for secondary
effects like stabilization or emulsions, suspension of particulates, control of crystallization,
inhibition syneresis, encapsulation, and formation of a film (Dziezak 1991). Building texture,
stability, and emulsification are just some of the ways in which gums aid product development.
The United States Food and Drug Administration regulates gums, classifying these compounds
as either food additives or “generally recognized as safe” (GRAS) substances. The most
common sources of gums are
• Plant materials
Seaweed extracts (alginates, agar, and carrageenan)
Seed gums (locust bean gum and guar gum)
Tree exudates (gum arabic, gum ghatti, gum karaya, and gum tragacanth)
• Products of microbial biosynthesis (xanthan gum and gellan gum); and
25
• Products produced by chemical modification of natural polysaccharides (cellulose
derivatives and pectins)
Carrageenan falls under the first category, an extract from red seaweeds, the most
important source being Chondrus crispus or Irish moss growing abundantly along the North
Atlantic coasts. They are sulfated polymers which consist of galactose and anhydrogalactose
units. The structure and molecular weight of the fractions- iota, kappa, and lambda carrageenan
identified based primarily on the content and distribution of sulfate ester groups- determine their
functional properties (Dziezak 1991; Penna and others 2003). Carragennan has been used for its
gelling, thickening, stabilizing, emulsifying, and suspending properties in milk and other food
products (Dziezak 1991; Penna and others 2003). Because of its reactivity with certain proteins,
the gum has found use at low concentrations (typically 0.01 to 0.03%) in a number of milk-based
products such as chocolate milk, ice cream, puddings, and cheese analogues (Dziezak 1991).
Soy lecithin can be used as an emulsifier. An emulsifier consists of water soluble
hydrophilic parts and water-insoluble/ oil soluble lipophilic parts within it. When an emulsifier
is added to a mixture of water and oil, the emulsifier is arranged on the interface, anchoring its
hydrophilic part into water and its lipophilic part into oil. The interfacial tension is thus reduced
by emulsifier which means that the force separating oil and water is weakened, resulting in the
easily mixing oil and water (Anonymous 2002). Only food emulsifiers defined as food additives
are usable by law, lecithin being one among them. Lecithin is a mixture containing phospholipid
as the major component, widely found in animals and plants and has long been used as a natural
emulsifier (Anonymous 2002). Lecithin is available in the market as paste lecithin and
powdered lecithin of high purity. It is classified into plant lecithin (derived from soybeans, corn,
rapseed, and others); fractionated lecithin (isolated from special components of the raw
26
materials); and yolk lecithin (made by excluding the phospholipids) which occupies about 30%
of an egg yolk.
Several nutritional beverages are commercially available for supplemental use with or
between meals, or as a sole source of nutrition (Osborn and others 2003). In addition to flavors,
beverage formulations often contain sweeteners, acidifiers, emulsifiers, colors, and botanicals in
many different bases- from coffee and tea to dairy and soy proteins (Brandt 2002). Sweeteners
are necessary to enhance the palatability of soymilks (Wang and others 2001). Deciding on
which sweetening system to use often is a factor of cost and labeling requirement (Brandt 2002).
Each sweetener and sweetener blend has its own profile in different beverage bases and greatly
impacts overall flavor profile (Brandt 2002). Commonly used sweeteners in the beverages
include dry sugar, liquid sucrose, and high fructose corn syrup (Brandt 2002). Many beverage
manufacturers are using sweetener blends, one of the good approaches, because many sweeteners
have synergies and when used together round out each other’s sweetness profiles (Brandt 2002).
Processing parameters for the nutritional beverage
The beverage creation involves balancing the effects of sweeteners, acidifiers, and other
ingredients to maximize the flavor impact (Brandt 2002). The processing variables and many
ingredients to consider make a good-tasting beverage formulation an increasingly complex task.
Soymilk processing
Soybean “milks” are conventionally made in the Orient by soaking soybeans, grinding in water,
filtering to remove sediment and then heating the extract (Piper and Morse 1923). The product
thus obtained can be taken as such or flavored with syrup and taken as a drink (Ang and others
1985). Although this process is simple, the resulting beverage has a distinct painty (linseed oil)
off-flavor and odor (Nelson and others 1976). Soymilk has not gained popularity in the Western
27
countries, chiefly because of its ‘beany’ flavor and availability of cheap cow’s milk, and is used
only as a milk substitute by a group of people who cannot tolerate cow’s milk. So, much effort
has been directed to elimination of this ‘beany’ flavor to produce a bland product that is
acceptable (Ang and others 1985). To reduce beany flavor, Wilkens and others (1967)
developed the Cornell method and Nelson and others (1976) developed the Illinois method.
Numerous modifications of this traditional Oriental process have been reported to partially
improve the off-flavor and odor defects. Some of these modifications of the cold water extracts
gave some flavor improvement but resulted in the lower protein recovery than the traditional
Oriental process (Nelson and others 1976). Further attempts to improve flavor or protein
recovery or both included the methods of using dehulled soybeans, often partially desludged,
and some with added stabilizers for colloidal stability (Nelson and others 1976). The Illinois
method is touted as “the greatest milestone in soymilk history” because it produces a very bland
soymilk (Wilson 1989).
Another characteristic problem of soymilk and soymilk-based beverage products making
them unacceptable to consumers is chalkiness: a defect in a liquid food which coats mouth and
throat with fine, grainy particles (Kuntz and others 1978). Several attempts to improve the
mouthfeel characteristic include application of high pressure homogenization (34456-55130
kPa), colloid milling, and centrifugal clarification methods (Kuntz and others 1978). The Illinois
process soymilk made from whole soybeans was reported to have good mouthfeel when the
soybeans were sufficiently softened by blanching and homogenization was done at 93.3º C and
24119 kPa (Nelson and others 1976). Another approach to reduce the chalky sensation as well
as to improve the physical stability and global flavor of soymilk was giving an enzyme treatment
(Rosenthal and others 2003).
28
A different approach than the traditional way of soymilk formulation is using an extract
of defatted soy meal (1:10 ratio of meal:water), sucrose (12%), palm oil (2.0%), emulsifier
(0.2%), lecithin (0.2%), and total solids (19.2%). This soymilk formulation (Ang and others
1985) was spray dried to give a reconstitutable soymilk powder. The protein beverages based on
soybeans have been tested and found acceptable in several countries (Mustakas 1974). A
process was also developed for using full-fat soy flours by extrusion to make a low-cost, spray
dried infant beverage that can be reconstituted with water (Mustakas and others 1971). Alternate
methods have used the water soluble protein isolates (preparing an emulsion by adding water,
emulsifier, oil, minerals, and sugars). Although more expensive, the isolate route permits better
control of composition of the ultimate beverage (Mustakas 1974). A soy protein based beverage
can also be prepared from a lipid protein concentrate-LPC (Figure 2.3).
Colloid milling can serve as a wet-grinding step before homogenizing. High-pressure
homogenization (55130 kPa) reduced particle size and gave beverages with better mouthfeel than
low-pressure homogenization (24119 kPa). Also without the use of two mills (colloid mill and
homogenizer), lesser solids were dispersed in the liquid, mouthfeel was poor, viscosity was
higher, and some sedimentation occurred (Mustakas 1974). Two types of beverages having
acceptable sensory properties were prepared from the LPC beverage base (200 ml) by adding:
A) Sugar (3.2 g), salt (0.25 g), and synthetic milk flavoring (0.02 g)
B) Dutch chocolate-flavored prepared mix (30 g)
Another trend in manufacturing vegetable milk is to fortify it with a vegetable oil (for
adjusting the ratio of protein and fat to either that of cow’s milk or mother’s milk), and to fortify
further with vitamins and minerals (Mustakas 1974). A study on the flavored soymilks (Figure
2.4) reported that chocolate and almond flavorings improved aroma of soymilks (P<0.05) and
29
addition of gum partially masked beany flavor and off-flavor. In order to extend shelf-life and
facilitate distribution, soymilks were typically subjected to intense heat treatment for sterilization
(Kwok and Niranjan 1995). From the preliminary investigation done by Ang and others (1985),
it appeared that soymilk of high protein content (~2%) generally underwent precipitation during
sterilization at 120º C for 10 to 15 min and there was a tendency for the soymilk of high protein
content to impart a darker color to product which was slightly intensified during sterilization.
Also protein denaturation or unfolding of a three-dimensional protein structure resulting from a
chemical or heat treatment, altered the binding sites for flavor molecules; proteins could bind
more or less of a flavor compound, depending on the amount of heat treatment (Brandt 2002).
Since health-conscious consumers generally like fresh food, soymilks with mild thermal
treatment (pasteurization) would conceivably better suit consumers than those that receive
intense thermal treatment (Wang and others 2001). The pasteurized soymilks were stable for one
month with refrigeration storage. The formulations with a combination of chocolate flavoring
and iota-carrageenan gum permitted the production of low-heat-treated soymilk acceptable to
consumers (Wang and others 2001).
Peanut milk processing
Early in 1970’s different methods of supplementation of cow’s milk and various terminologies
associated with it were introduced: Filled milk, imitation milk, and toned milk being used in
different parts of the world for different reasons. According to the U.S. Filled Milk Act, the
filled milk is a product resembling milk, made by combining skim milk solids with fat other than
butter fat (Chandrasekhara and others 1971). The imitation milk is a product resembling milk
but of non-dairy origin (Rubini 1969) and United Nations Protein Advisory Group recommended
that the imitation milk should contain 3.5% fat, 3.5% protein, and 5.0% carbohydrate (all w/w)
30
which necessitates the ratio of partially defatted peanuts to water to be greater than 1:6 (Rubico
and others 1987). The peanut milk having composition lower than these imitation milk
specifications can be reclassified as a peanut beverage (Rubico and others 1987). And according
to the Prevention of Food Adulteration rules of 1959, the toned milk contains 3.0% fat and 8.5%
nonfat solids, and double toned milk contains 1.5% fat and 9.0 % nonfat solids (Chandrasekhara
and others 1971).
Various reasons for emergence of such products include dietary concerns, scarcity of
cow’s milk, lower cost, and extension of available milk supply. In India, a process for Miltone
vegetable toned milk preparation was developed for the purpose of replacement of imported
skim milk powder by indigenously available vegetable protein- peanut protein isolate
(Chandrasekhara and others 1971; Figure 2.5). A nutritious milk-like beverage-Miltone-
consequently had other applications such as for yoghurt and other milk based preparations, in
coffee or tea or as a mildly flavored drink.
Peanut milk preparation methods developed needed further modifications to improve
flavor, texture, emulsion stability and shelf-life of peanut beverage (Rubico and others 1987). A
non-defatted peanut beverage (NDPB) and a partially defatted peanut beverage (PDPB) were
processed (Figure 2.6). Chalkiness, a defect related to large size particles which cause creaming
and layering due to flocculation and coalescence, was evident in the peanut milk, even after
homogenization and addition of stabilizers (Rubico and others 1987). High pressure double
homogenization can reduce these defects like in soymilks.
Aside from beany flavor, the most common problem that limited the consumption of
peanut beverage was its short shelf-life, particularly if processing was done at a temperature
below 85 ºC (Rubico and others 1988). Refrigeration and higher processing temperature for
31
longer time can extend the shelf-life of peanut beverage. A peanut beverage was prepared using
a modified Illinois method and deskinned full-fat peanut kernels by Rubico and others (1988) as
shown in Figure 2.6 with slight modification at the high temperature heating stage. It was
observed that temperature had a significant effect on cooked flavor, raw and cooked odors,
viscosity and color whereas time significantly affected only cooked flavor and color. Processing
at 100 ºC gave the beverage with sensory quality better than the product processed at either 121
ºC or 85 ºC. Rubico and others (1989) conducted another study for nutritional, microbiological
and sensory qualities of the peanut beverages prepared by the modified Illinois process for non-
defatted peanuts as shown in Figure 2.6 with four different high temperature treatments
1) Processed at 85 ºC for 15 min, bottled and stored
2) Processed at 100 ºC for 15 min, bottled and stored
3) Bottled, processed at 121 ºC for 15 min and stored
4) Processed at 121 ºC for 3 sec, bottled, and stored
The amino acid analysis data of these different treatments are shown in Table 2.7. The
microbiological results in this study indicated that refrigeration was required to preserve the
peanut beverage processed at 85 ºC for 15 min however, no microbial growth was observed in
the products processed at 100 ºC and 121 ºC followed by storage at 4 ºC and 30 ºC for 20 days.
Beany flavor was least pronounced in the beverages processed at 100 ºC for 15 min and the most
intense at 121 ºC for 3 sec. This indicated that pasteurization at a temperature lower than 100 ºC
for a short time followed by refrigerated storage will be the best possible heat treatment in order
to achieve the balance between microbial and sensory characteristics.
Chompreeda and others (1989) developed a chocolate flavored peanut beverage using
defatted peanut flour (Figure 2.7). The quality attributes such as color, aroma, viscosity, and
32
flavor of this chocolate flavored peanut beverage were similar to that of chocolate milk; also
total aerobic population of the beverage before and after refrigeration for 7 days was less than 10
and 200 colonies/g, respectively and no coliform bacteria was detected in this product. Sensory
evaluation and response surface methodology indicated that the optimum formulation of the
beverage was obtained by using protein isolate 3.5%, butter fat 3.5%, sugar 8%, cocoa powder
0.7%, stabilizer 0.1%, and water with all sensory characteristics acceptable in the range of like to
extremely like (on a 5-point hedonic scale).
Response surface methodology was employed by Galvez and others (1990) to optimize
the process reported by Rubico and others (1988). They used different homogenization
pressures: 13782, 27565 and 41347 kPa. One portion of the homogenized mixture was cooked at
100 ºC for 10, 15, and 20 min, bottled then capped and other portion was bottled, capped and
processed at 121 ºC for 5, 10, and 15 min; all the samples were cooled and stored at 4 ºC (Galvez
and others 1990). It was observed that sulfur aromatic was sufficient to discriminate between the
samples processed at 100 ºC whereas sulfur aromatic, cooked peanut flavor, and bitterness
provided the most efficient combination for discriminating between the samples processed at 121
ºC. The optimum conditions for processing were found to be homogenization pressure >21363
kPa and process time >16 min at a processing temperature of 100 ºC.
The homogenized peanut extract was found to be a suitable base for production of a
nutritious beverage with addition of other ingredients such as sugar, colors and flavors to
improve its overall acceptability (Rustom and others 1995a; Figure 2.8). Various types of
emulsifiers, homogenization temperatures and pressures were studied to observe the effect on
physical stability of the extract. The clarified extract prepared as shown in Figure 2.8 was
further utilized for UHT-sterilized peanut beverages (Rustom and others 1996; Figure 2.9). The
33
UHT peanut beverage would be a suitable product in developing countries, since its quality
remained good for up to 5 months of storage at 37 ºC (Rustom and others 1995b).
Various milk-like beverages have been formulated from the aqueous extracts of
unroasted peanuts or soybeans, however, undesirable characteristics such as beany or green
flavors, suspension stability and chalky mouthfeel have been associated with these beverages
(Hinds and others 1997b). A method developed using partially defatted, roasted peanuts gives an
acceptable peanut beverage formulation (Hinds and others 1997a, 1997b, 1997c; Figure 2.10). A
low-fat beverage with roasted peanut flavor developed was a potential milk-substitute containing
11.8% total solids, 2.0% fat and 3.7% protein with whitish orange-yellow color. The suspension
stability was improved by the addition of a carrageenan [Benlacta CM61-B (CM), 0.02-0.04%]
or a hydrogenated mono- and diglyceride [Emuldan HV52K (HV), 0.2-0.4%]. Treatments
yielding the best combination, compared to cow’s milk values, of high suspension stability
(0.5±0.03, 1.0=Maximum stability) and low viscosity (3.7±0.89 cps) were those containing 0.2%
HV and homogenized at 13.8x10⁶ Pa (Hinds and others 1997b). The sensory attribute
‘smoothness’ or ‘absence of chalkiness’ is influenced by size, mass, density and distribution of
particles and by the nature of the medium in which particles are dispersed; as frictional resistance
increases, smoothness decreases and chalky or grainy sensation of mouthfeel becomes prominent
(Hinds and others 1997c). The imitation milks prepared from oilseeds contain protein, fat and
cellulose particles from cell wall fragments which contribute to particulates and thus to the
chalkiness. Chalkiness is also related to size distribution of particles which may be influenced
by the nature of the complexes formed during heat-processing (Hinds and others 1997b).
Suspension stability of proteins in animal milks and oilseed beverages is a complex phenomenon
(Hinds and others 1997a) influenced by heating and cooling protocols, protein and lipid
34
concentration, type of stabilizer or emulsifier, and pH, ionic strength, and dielectric constant of
the medium. Various heat processing protocols, homogenizing parameters, filtration, and
microparticulation techniques have been used to improve smoothness in milk products and
oilseed beverages (Hinds and others 1997b).
In the milk and yoghurt fortification by oilseed proteins study (Schmidt and others 1980),
cow’s milk systems were fortified to 15.0% and 18.0% total solids with nonfat dry milk (NDM),
peanut flour (PF), or soy protein isolate (SPI) and heated at 70, 80, 85, and 90 ºC for 30 min. It
was observed that all the milks exhibited pseudoplastic (or shear thinning) flow behavior as
would be expected for cow’s milk at 4 ºC. Consistency index (K), or apparent viscosity (η) at
shear rate of unity, of PF and SPI milks was generally higher than that of similarly processed
NDM milk. Also increased total solids and increased heat treatment more dramatically increased
the K value for oilseed milks than for NDM milk and storage (10 days at 4 ºC) increased K value
of SPI milk heated at 80 ºC or above (Schmidt and others 1980). Ramanna and Ramannathan
(1992) observed that degree of heat treatment, total solids content, and storage have a
pronounced effect on the apparent viscosity, consistency index, and yield stress of the fortified
milk systems. They found that heat treatment and refrigerated storage could be used to modify
the rheological properties of peanut protein/ milk beverages. Also, beverage and curd prepared
from peanut flour/ milk blend fortified to 7.7% protein content were found to have more
favorable rheological properties than those prepared from a peanut protein isolate/ milk blend.
In order to encourage wide production of bambara groundnut (Vigna subterranea), an
underutilized but important African legume, the possibility of producing a vegetable milk for
local use or an extracted protein with functional properties for use in food processing
applications was investigated by Brough and others (1993) (Figure 2.11). To evaluate the
35
bambara groundnut milks, a comparison with other vegetable milks made from cowpea,
pigeonpea and soybean under the same conditions (Figure 2.11) was done. It was observed that
the simple vegetable milk produced from bambara groundnut was as acceptable as the milks
from other common legumes, and the taste of bambara groundnut milk was preferred to the other
legume milks tested.
Another innovative beverage product prepared from peanut butter was Peanut Punch, a
beverage popular in the West Indies Islands (Abdul 1988; Figure 2.12). The ingredients of
peanut punch (by weight) include liquid skim milk (85.41%), fine sugar (6.50%), stabilizer
(carrageenan; 0.04%), peanut butter (natural, smooth; 8.0%) and liquid caramel (0.05%).
Analyzing beverage products: Important physical attributes
Viscosity
A relationship between the stress required to induce a given rate of shear defines rheological
behavior of a fluid. For a Newtonian fluid, the shear stress is directly proportional to the rate of
shear, the proportionality constant being viscosity. The term viscosity can only be correctly
applied to Newtonian fluids. For fluids that deviate from this behavior, the term ‘apparent
viscosity’ is used as an index of fluid consistency. Figure 2.13 shows curves representing
different relationships between the shear stress and rate of shear (Toledo 1980).
The primary purpose of viscosity in the keenly competitive beverage market is delivering
sensory attributes, including eye appeal and creaminess which is one of the desirable attributes to
denote flavor, richness, mouthfeel, and ultimately, satisfaction (Klahorst 2002). Beverage
viscosity is an important property because
• It adds body to a beverage product by producing the sensation of substance in the mouth
and upon swallowing
36
• It enhances and releases the flavor, since flavor components shun the hydrophilic phase
of the beverage and seek out association with colloidal molecules
• It determines the stability which is important for maintaining appearance, since beverage
water phases suspend fiber, flavor, pulp and protein
• Also it is a primary factor in the prevention of settling and the aggregation of solids
suspended in drinks
• And the molecules that lend viscosity also have other important properties as foam
stabilizers in beverages where foam plays an important role in the overall sensory
experience
Various ingredients such as proteins, sugar, stabilizers, emulsifiers and process
conditions especially heat processing and homogenization (the process that keeps fat droplets
from aggregating and rising to the top) control the flow properties of beverage products.
Viscosity was significantly affected by different types of stabilizing agents and homogenization
pressure (Hinds and others 1997b). The beverages which contain hydrocolloids exhibit the
property of shear thinning, possessing high viscosity until the force is applied and after which the
viscosity decreases. Like stabilizers and emulsifiers, source of sweetness also changes the flow
properties and hence affect the viscosity of beverages. Sugars, whether sucrose, corn syrup,
high-fructose corn syrup, fructose, rice syrup, cane sugar or honey, contribute to viscosity,
depending on the level added and other components of the solution (Klahorst 2002). Proteins
form gel thus they have been used as a source to influence texture and viscosity of foods. For
beverages, the primary role of protein is to provide nutritive value in a pleasant matrix, and that
usually results in increased viscosity (Klahorst 2002). Protein viscosity is largely affected by
heat, and proteins vary in their ability to withstand high-temperature processing. Sometimes
37
when heated to a point of denaturation, irreversible gels form from coagulated protein. Heat,
homogenization and pH are important factors that influence the functional characteristics of
isolated soy proteins (Klahorst 2002). As technology has developed, soy has joined dairy as one
of the principle proteins for beverage fortification and viscosity modification. As soy protein use
increases, especially in beverages that serve as quick, high-protein meals, the challenge has been
to mimic the consistency of a milkshake or fresh-blended smoothie. One solution is to enhance
the viscosity contributed by soy protein with combinations of other stabilizers, emulsifiers and
proteins to make the soy more palatable (Klahorst 2002).
Visual Stability Index
The stability of chocolate flavored milk can be determined from sedimentation of cocoa
particles, formation of large flocs and formation of light and dark colored layers also called as
segregation (Boomgaard and others 1987). Addition of stabilizers helps in reducing formation of
densely packed layer at the bottom. The suspension stability of beverage was improved by the
addition of stabilizer CM or emulsifier HV as compared to the control without CM or HV (Hinds
and others 1997b). Sedimentation or creaming of suspended particles in liquids can be retarded
by diminishing the size of the particles and prevented by changing the rheological properties of a
continuous phase by the addition of stabilizers to form a continuous network of sufficient
strength (Boomgaard and others 1987). The presence of protein molecules also plays an
important role in the stability of beverage products. Amount of heat treatment, homogenization
and particle size of ingredient molecules are crucial in order to monitor the stability (Hinds and
others 1997b). Heat processing has considerable effect on the stabilizer-protein interactions,
protein denaturation, and formation of long chains of these molecules. Denaturation and
aggregation of protein molecules are heat dependent processes. The process of aggregation
38
between oilseed proteins and properties of their aggregates differ from those of other common
proteins like milk (Hinds and others 1997a).
When the beverage product is stored overnight under refrigerated conditions, a layer will
appear separating the beverage into two parts if it has particulate material in suspension. The
stability of beverage products can be determined by visual observation of the beverage for the
layer formation. Visual stability index can be calculated by measuring the total height of the
beverage and taking the ratio of height of sediment to the total height of beverage.
Visual Stability Index = Height of the sludge/ Total height of the beverage
One way of determination of quality of a beverage product can be a comparison with cow’s milk
which ideally will show no separation and hence has visual stability index of 1.00. A similar
procedure was used to determine the visual stability of peanut beverage formulations prepared
from partially defatted, roasted peanuts (Hinds and others 1997b).
Analyzing beverage products: Important sensory attributes
Appearance and color are important visual attributes deciding the liking of a new product being
considered for consumer acceptability. These properties will mainly depend on composition,
added coloring agents, stabilizing agents and processing parameters, especially heat treatment.
In case of a chocolate flavored protein-based beverage, amount of cocoa powder and stabilizer
will mainly control color and appearance of the product. Starch, sugars, proteins, and fats
interact significantly in a product to set its texture and flavor. Manipulation of these interactions
to produce desirable product attributes tests the creativity of food scientists in food product
development (Toledo and Brody 2000). Texture, flavor and appearance are perhaps the most
important characteristics of foods because they are the attributes consumer can readily assess
(Lund 1982). The instrumental measurement of texture is usually in terms of viscosity for liquid
39
products and the same characteristic can be judged by observing the consistency or thickness as a
sensory attribute. The compounds present in trace quantities in food contribute to the color and
flavor of foods. When volatile, these compounds are responsible for the aroma of food and when
nonvolatile they contribute to the taste sensation. Aroma, taste, and mouthfeel together
constitute the flavor (Toledo and Brody 2000).
Flavor is very important factor in products formulated using oilseed proteins because raw
legumes and oilseeds enriched with respect to lipoxygenases and other metallo-proteins possess
lipid-derived, objectionable flavor compounds. N-hexanal, 3-cis-hexanal, n-pentylfuran, 2(1-
pentenyl) furan, and ethyl vinyl ketone are major contributors to grassy-beany and green flavor.
Geosmin, an oxygenated hydrocarbon may contribute to musty, moldy, earthy flavor in soy
protein isolates. Oxidized phosphatidylcholine most likely accounts for a bitter taste of soy
products. Grassy-beany, bitter flavor compounds preexist in the maturing soybeans and are also
generated during processing (Rackis and others 1979). In some legumes development of off-
flavors can be readily controlled by rapid inactivation of lipoxygenase with heat, alcohol, or acid
treatment (Rackis and others 1979). Also agents that impart acceptable sensory properties can be
added to mask the objectionable flavors in protein foods. The beany flavor in flavored soymilks
was defined as the offensive beany or grassy flavor related to lipoxygenases whereas aroma was
defined as the desirable flavor with respect to soy, chocolate, almond and vanilla (Wang and
others 2001). In addition to the beany flavor, astringent and bitter aftertaste contributes to low
acceptability of products like soymilk. Aftertaste was defined as the undesirable feeling such as
bitterness and astringent that remained in the mouth after expectorating (Wang and others 2001).
Aftertaste can be rated as acceptable if desirable flavor is persistent; there is no coating on throat
cavity and no sensation of bitterness once the liquid product is swallowed completely.
40
An important component which participates in flavor development during heating is the
group of compounds called carbonyls (Toledo and Brody 2000). Carbonyl compounds usually
participate in reactions which result in roasted flavors. The flavor of coffee and cocoa, roasted
nuts, and roast beef may be attributed to the reactions involving these carbonyls. Although these
compounds may be naturally present, formulations may be developed where these compounds
are added to intensify the desired effect. The roasted flavors develop as a result of reactions
between the carbonyl compounds and free amino acids in a reaction called the Maillard reaction
(Toledo and Brody 2000). This reaction results in the formation of large complex molecules
which have brown color and a characteristic roasted flavor. Flavor development through the
Maillard reaction depends on the concentration of carbonyls and amino acids in the food,
moisture content, temperature, and time. Also, defatted peanut flours contain significant
amounts of residual oil and phospholipids that can give rise to oxidative deterioration and in
roasted peanuts, metalloproteins can initiate formation of off-flavors derived from lipid oxidation
(Rackis and others 1979).
Mouthfeel is a property of great importance for the sensory impression of many foods
and is thus associated with consumer acceptability (Folkenberg and others 1999). Szczesniak,
among others (1979), investigated that mouthfeel property of a beverage is affected by 11
different categories of underlying properties as shown in Table 2.8. Mouthfeel can be defined in
various different ways but sense of touch is the most important for the perception of mouthfeel.
According to the ISO-standard, mouthfeel is a tactile sensation perceived at the lining of the
mouth, including, tongue, gums, and teeth (Folkenberg and others 1999). Mouthfeel of instant
cocoa drinks was found to be positively correlated with the cocoa properties (cocoa content,
cocoa odor, cocoa flavor, color) and the viscosity properties (viscosity, thickness appearance,

41
thickness in mouth and resistance), and the addition of stabilizer can significantly change the
mouthfeel characteristics of the beverage since it increases the viscosity of the product
(Folkenberg and others 1999).
Mouthfeel sometimes refers to absence of chalkiness or smoothness of a beverage
product and this sensory attribute can be used to describe presence or absence of particulate
matter in the product. Chalkiness is a defect used to describe a food which coats the mouth and
throat with fine, grainy particles and investigators have claimed that beverages produced by
boiling-water extraction and filtration lack the chalky mouthfeel that is characteristic of
nonextracted products (Kuntz and others 1978). The degree of chalkiness is controlled by the
particle size of suspended molecules in the liquid product and subsequent processing operations
such as filtration and heat treatment. Peanut beverages were less chalky compared to
commercial chocolate low-fat milk and chocolate drink, and similar in smoothness to
commercial low-fat cows milks since all the particles were ≤ 125 µm (Hinds and others 1997c).
Overall acceptability is a sensory attribute which defines combination of all the different
attributes together. Higher overall acceptability scores indicate that the product has good
chances of being purchased and tried by consumers if launched in the market. Most of the times
the consumer response is judged on the overall acceptability in optimization studies along with
other characteristics such as flavor.
Sensory Evaluation
Definition and consumer sensory acceptance tests
Sensory analysis is the definition and scientific measurement of the attributes of a product
perceived by the senses: sight, sound, smell, taste and touch (Lyon and others 1992). Sensory
Analysis or Sensory Evaluation is a useful tool in the development of new products and new

42
food resources, in storage and shelf-life studies, and in quality assurance of products, especially
with changes of formulation, processing, and packaging (O’Mahony 1988). Sensory acceptance
tests indicate the acceptance of a product without the package, label, price, etc. The difference
between consumer sensory and market research testing is that the sensory test is generally
conducted with coded, unbranded products whereas market research is most frequently done
with branded products (Resurreccion 1998). Sensory tests are used for grading and pricing of
products and in more basic research to determine exactly what chemical changes in a food affect
its flavor. While sensory evaluation is used to determine “What is the flavor of the food?”
consumer testing is used to determine “Do the customers like the food? Will they buy it?”
(O’Mahony 1988). Consumer testing is one of the most important activities in product
development. The primary purpose of consumer affective tests is to assess personal response by
current and potential customers of a product, product ideas, or specific product characteristics
(Resurreccion 1998).
Various applications of sensory evaluation include new product development, product
matching, product improvement, process change, cost reduction and/or selection of a new source
of supply, quality control, storage stability, product grading or rating, consumer acceptance and
or preference, panelist selection and training and correlation of sensory with chemical and
physical measurements (IFT/SED 1981). The uses of sensory evaluation are diverse,
encompassing a range of disciplines of which food science forms only one part (O’Mahony
1988). The implicit goal behind any and all sensory evaluation efforts in the food industry is to
enhance quality, improve appearance, flavor and texture as perceived by consumers in order to
influence their food choices (translated into purchases) at the point of sale (Resurreccion 1998).
Now-a-days there is more integration of sensory analysis and consumer research methods into an
43
array of complementary product tests focusing on sensory questions. This integration has been
encouraged by customer choice-driven markets, need to identify customers’ ideals and
expectations of sensory quality to help set sensory targets in the design and development of
products (Lyon and others 1992).
Consumer evaluation concerns itself with testing certain products using untrained people
who are or will become the ultimate users of the product (Resurreccion 1998). There are two
major classifications of sensory tests- Analytical (includes two major types: discriminative and
descriptive tests) and Affective tests (IFT/SED 1981). The sensory affective tests evaluate
preference and or acceptance and/or opinions of a product using paired-preference, ranking or
rating (Hedonic scale or Food Action scale) in which untrained panelists representative of a
target population and consumers of test product are randomly selected; minimum 24 and 50-100
panelists considered adequate (IFT/SED 1981). The recommended sensory test method for new
product development, consumer acceptance and/or opinions and consumer preference is the
hedonic scale rating in which the suggested number of samples per test is 1-18 (the larger the
number only if mild-flavored or rated texture only) and analysis of variance or rank analysis are
suggested methods for analyzing the data (IFT/SED 1981).
Acceptance tests are used to evaluate product acceptability or to determine whether one
or more products are more acceptable than others but acceptance and preference are two different
things because a person may prefer one sample to another sample, still find both of them
unacceptable (Lyon and others 1992). Consumer acceptance of a food may be defined as an
experience, or feature of experience, characterized by a positive attitude toward the food; and/or
actual utilization (such as purchase or eating) of food by consumers (Resurreccion 1998). There
are three main types of acceptance test presentations (Lyon and others 1992):
44
1) Monadic tests: Samples are presented one at a time
2) Paired tests: Samples are presented two at a time
3) Sequential monadic tests: Samples are presented in sequence to be assessed one at a time
The monadic test method is appropriate for determining the acceptability of a new or
unusual food product where there are no similar products for comparison (IFT/SED 1981).
There are a number of different methods and scales used to determine and/or measure
acceptance, including rank tests, paired preference tests, hedonic scaling and magnitude
estimation (Lyon and others 1992). The two most frequently used tests to measure consumer
preference and acceptance are the paired preference and the hedonic scale, respectively (Lyon
and others 1992). In hedonic rating the assessor is asked to indicate the extent of liking for the
product from extreme dislike to extreme like; a popular scale being the nine-point hedonic scale
(Peryam and Pilgrim 1957). The 9-point hedonic scale (Figure 4.3; Appendix C) is a rating scale
that has been used for many years in sensory evaluation in the food industry to determine the
acceptance of a food and to provide a benchmark on which to compare results and its use has
been validated in the scientific literature (Resurreccion 1998).
The essential features of the hedonic scale are its assumption of a continuum of
preference and the direct way it defines the categories of response in terms of like and dislike
(Peryam and Pilgrim 1957). In the analysis, each descriptor is assigned a value and it is usually
assumed that it is an equal interval scale. Another approach is to score on a continuous line scale
with the extremes at either end, the distance of the mark along the line is then used as a rating
(Lyon and others 1992). It can be observed from Figure 4.3 that the instructions given on a
sensory ballot with hedonic scale have two functions: first, to describe the mechanism of the
test; second, to encourage freedom of response. The intent is to have the subject answer on the
45
basis of his first impression and to minimize the intellectual approach, that is, one involving
conscious reasoning and judgment, though, of course, these cannot be entirely avoided (Peryam
and Pilgrim 1957). The hedonic scale ratings are converted to numerical scores, and statistical
analysis is applied to determine difference in degree of liking between or among samples
(IFT/SED 1981).
It must be considered whether products being tested are safe to consume or inhale by
considering the safety factors like microbiological status, chemical or toxic residues and
ingredients which cause allergic responses or other health hazards. It is the primary
responsibility of those carrying out sensory analysis to ensure that the assessors are not exposed
to unacceptable risk as a result of participating in the tests and they should be aware of any
statutory regulations which exist with respect to the control of substance which are considered
hazardous to health (Lyon and others 1992). Also it is important to get permission from the
regulatory authority controlling the use of human subjects as a part of research. The procedure
to get permission for using the human subjects at the University of Georgia is given at the
website http://www.ovpr.uga.edu/hso.
The preference or acceptance tests are usually conducted ‘in-house’ -carried out on
company premises with company staff- with the suitable assessors being any member of the staff
who is likely to eat the product, provided they are not involved in any way with the product
under test, or have been previously selected and trained for discrimination and descriptive tests
(Lyon and others 1992). The number of assessors required depends on the test procedure, the
purpose of the test, the amount of assessor training, the reproducibility of their results and the
variability of the product; the panel should be large enough to overcome such variability (Lyon
and others 1992). For laboratory consumer tests usually twenty-five to fifty responses are
46
obtained; at least forty responses per product are recommended by Stone and Sidel (1993). In a
test consisting of 24 or lesser number of panelists, it may be difficult to establish a statistically
significant difference. However, it is still possible to identify trends and provide direction;
whereas with 50-100 responses per product, statistical significance increases to a large extent
(Resurreccion 1998). The consumer panelists should be selected from the target population and
screening can be done based on various criteria such as demographic characteristics. The overall
objective is to select a relatively homogenous group from a fairly broad cross section, all of
whom like and use the product or the product category, and exclude those individuals who
exhibit extreme or unusual response patterns (Stone and Sidel 1993). Specific training is not
required for acceptance test; however, assessors should be made familiar with the test procedure
and be clear about the instructions given (Lyon and others 1992). The orientation of consumer
panelists should consist only of describing the mechanics of the test that they need to know, for
example, orientation regarding the booth area, explanations about the sample pass-through door,
signal lights etc (Resurreccion 1998; Appendix B).
Experimental design for sensory evaluation
The development of any new food product involving more than one ingredient requires some
form of mixture experimentation as opposed to factorial experimentation (Hare 1974). In a
mixture experiment, two or more ingredients are mixed or blended together in varying
proportions to form some end product, quality characteristics of which are recorded for each
blend, to see if the characteristics change from one blend to the next (Cornell and Harrison
1997). In mixture experimentation, it is impossible to vary one ingredient or component while
holding all the others constant because as soon as the proportion of one component is altered, so
is that of at least one other component since the sum of all components is always 1.0.
47
q ∑ Xi = 1.0 i=1
Where, q is the number of components in the mixture.
Mathematical models are used to analyze data generated in the mixture experimentation,
a familiar two variable model applied to a mixture space by subjecting it to the constraint
X1+X2=1, can be expressed as:
E(y) = β’1X1+ β’
2X2+ β’12X1X2
Estimates of the coefficients can be obtained from most multiple regression computer programs
by forcing the intercept through 0 (Hare 1974). Similar calculations applied to other factorial
models have lead to following model for a mixture data as suggested by Scheffe (1958) and
presented by Snee (1971):
Linear:
q E(y) = ∑ βiXi
i=1 Quadratic:
q q E(y) = ∑ βiXi +∑ βijXiXj
i=1 1≤i<j
Frequently in the mixture experimentation, it is impossible to vary the proportion of each
component from 0 to 1.0. Each component is constrained within certain limits. Mathematically,
0 ≤ ai ≤ Xi ≤ bi ≤ 1.0, i = 1, 2,….., q
Because constraints on the individual factors determine the design, the choice of constraints is
crucial (Gorman 1966). Often in exploratory work the constraints can not be set precisely and, in
fact, may have to be estimated experimentally (Gorman 1966). Once the constraints are decided,
the experimental points can be found by using extreme vertices design method. The extreme
48
vertices design is developed as a procedure for conducting experiments with mixtures when
several factors have constraints placed on them (McLean and Anderson 1966). According to
McLean and Anderson (1966) the selection of vertices and various centroids of the resulting
hyper-polyhedron as the design is a method of determining unique set of treatment combinations
(the design of the experiment) which may be used to estimate the response surface. In case of
the quadratic model, a minimum of ½ q (q+1) points are required. The maximum number of
design points for a q-component design will be q 2q-1. In case additional points are desired in
any given design they may be obtained, for example, by using mid points of the edges of the
hyper-polyhedron or repeating some of the existing points (McLean and Anderson 1966). There
are computer software programs available to get extreme vertices design points and dealing with
the data analysis of such mixture experiments.
Conducting a well organized sensory test
Design, organization, implementation, and management of the consumer sensory test require
meticulous planning in order to obtain the desired information (Resurreccion 1998). The
planning for testing include definition of objectives, selection of an appropriate test and
experimental design, identification of the tests, screening of samples, selection of sample
preparation method, data collection, data processing and analysis, interpretation, and reporting of
results in timely manner. Lyon and others (1992) gives detailed guidelines on carrying out a
well organized sensory test.
The conditions of sample preparation and presentation should be identical to those under
which a product is usually consumed, for example, cold beverages such as carbonated beverages,
chocolate drinks, and milk, are best served at approximately 5-9 ºC (Resurreccion 1998). The
test objectives determine the sample size. It should be adequately large so that consumers will
49
be able to evaluate product acceptance and any other attributes being evaluated. Preliminary
testing will help to determine the amounts of sample to be consumed during evaluation. It is
often necessary to provide instructions to panelists to ensure that enough products are evaluated
to give a reliable result. The preliminary testing needs to be conducted whenever possible to
determine if the selected sample preparation and presentation procedures are appropriate for a
specific test, to specify any special requirements related to preparation and serving, and to
identify any additional procedures required as they relate to the product or test (Resurreccion
1998). Appropriate modifications should be done as a result of pre-testing. It is recommended
that a complete dry-run of all testing procedures be conducted on the test date, from the
preparation of samples, and orientation of panelists, to actual test procedures conducted using
two or three untrained individuals as panelists one week before the test date (Resurreccion 1998).
This will allow sufficient time for changes to be made if necessary.
Once consumer acceptance for the product has been quantified, the sensory practitioner
defines the lower boundary for consumer acceptance: some companies that pride themselves on
the quality of their products may be unwilling to produce a product that is only “liked slightly”
(=6) on a 9-point hedonic scale and may opt to accept a higher limit set at “like moderately or
higher” (=7) for the product (Resurreccion 1998). An action standard specifies a performance
requirement for a new or improved product. If there is no competitive framework, the optimal
formulation must receive a score equal to or greater than a chosen value that has, in the past,
been associated with a product success (Fishken 1983).
Response surface methodology and product optimization
Optimization can be defined as the determination of values for process and formulation variables
(factors) that result in a product or products with physical properties and sensory characteristics
50
that satisfy some specific predetermined values which make them acceptable to consumers
(Galvez and others 1995). Modeling of quality or consumer acceptance using a response surface
methodology (RSM) can be done in a simplified manner when the effect of two or more
variables on the product acceptance and its interrelationship with sensory attribute intensities is
of interest (Resurreccion 1998). When RSM is utilized, product optimization time is greatly
reduced from the traditional “cook and look” optimization techniques that depend on subjective
formulation and evaluation procedures (Rudolph 2000).
RSM is a designed regression analysis meant to predict the value of a response variable,
or dependent variable, based on the controlled values of the experimental factors, or independent
variables (Meilgaard and others 1991). The samples are evaluated by the consumer and
descriptive panels, and regression analysis results in the predictive equations. From the
parameter estimates, it can be determined which variable contributes the most to the prediction
model, thereby allowing the product researcher to focus on the variables that are most important
to the product acceptance (Schutz 1983). The dependent variable is the acceptance rating and is
the only rating that is absolutely necessary to obtain optimal formulations. Contour plots of the
prediction models allow the researcher to determine the predicted value of the response at any
point inside the experimental region without requiring that a sample be prepared at the point
(Meilgaard and others 1991). RSM is applicable in wide variety of areas including food research
and has constantly been successfully demonstrated to be used in optimizing ingredients
(Henselman and others 1974; Johnson and Zabik 1981; Vaisey-Genser and others 1987; Chow
and others 1988; Shelke and others 1990) and process variables (Oh and others 1985; Floros and
Chinnan 1988; Mudahar and others 1990; Galvez and others 1990; Vainionpaa 1991) or both
(Bastos and others 1991).
51
Optimization of all the aspects of a product is the goal in product development. Sensory
evaluation is often called upon to determine whether or not the optimum product has been
developed and response surface methodology seems to be a popular method of discussion for
product optimization within the sensory evaluation field (Giovanni 1983). In optimization
research, the like/prefer measure is the dependent variable, while the independent variables are
the properties of the products (sensory characteristics, ingredients and others) that were the basis
for differentiation (Sidel and Stone 1983). To achieve the objective of developing products with
optimal sensory acceptance, one must identify those properties and levels that are important to
acceptance (Schutz 1983). Methods of optimization range from the individual specialist’s
orchestrating optimization on the basis of his or her professional skill and experience to
structured statistical approaches of response surface methodology (Sidel and Stone 1983).
According to Giovanni (1983) the classical sensory evaluation approaches are inefficient because
• A large number of experiments is required, which can be expensive and time consuming
• Optimum product might not be determined because the experimenter must use educated
guesses to specify the levels of ingredients to test and it is difficult for the experimenter
to consider the interactions among the variables without assistance of the computer and
• Neither of these approaches establishes mathematical relation which describes the
relationship between the variables and responses to these variables
Resources in sensory evaluation and availability of statistical models are intended to
expand the intellectual limits about products and to provide a perspective that is not readily
apparent by other means. Creative efforts are still an integral part of the system and the intention
of optimization is to provide a more precise map of the path that has the highest probability for
success (Sidel and Stone 1983). RSM is a statistical method that uses quantitative data from
52
appropriate experimental designs to determine and simultaneously solve multivariate equations
graphically represented as response surfaces which can be used in three ways (Giovanni 1983):
1) To describe how the test variables affect the response;
2) To determine the interrelationships among the test variables; and
3) To describe the combined effect of all test variables on the response
Basically RSM is a four step process. First, two or three factors that are the most important to
the product or process under study are identified. Second, the ranges of factor levels which will
determine the samples to be tested are defined. Third, the specific test samples are determined
by the experimental design and then tested. Fourth, the data from these experiments are
analyzed by RSM and then interpreted (Giovanni 1983).
Response surface methodology was used to optimize formulations of a chocolate peanut
spread by using a three-component constrained simplex lattice design (Chu and Resurreccion
2004). The optimum formulations (consumer acceptance rating of ≥6.0 for all attributes) for the
chocolate peanut spread were all combinations of 29-65% peanut, 9-41% chocolate, and 17-36%
sugar, adding up to 100%, at a medium roast. In an optimization study done by Galvez and
others (1995), consumer acceptance scores for two commercial mungbean noodle samples were
used in order to attain the optimum formulation. The commercial samples A and B were
preferred by consumers in the earlier study. In order to prepare better quality noodles than these
commercial samples, the process was optimized using the acceptance scores for samples A and B
as constraints. The contour plots were developed using predictive models. The shaded areas
represented the optimum ranges for consumer acceptance of attributes tested which satisfied
acceptance ratings described for commercial samples and the optimum region was found by
outlining the regions representing the overlap of the shaded areas. Response surface
53
methodology using the mixture design was used to determine the optimum ratio of pineapple,
papaya, and carambola in the formulation of reduced calorie tropical mixed fruit jam (Abdullah
and Cheng 2001). In this study, the limit of acceptance for viscosity, aroma, sourness, color and
overall acceptability were set 3.4-4.4, 4.1, 3.7-4.3, 3.7 and 4.8 respectively. This was based on
the closeness of the attributes to the acceptance of the commercial product. To obtain the
optimum region, contour plots with limits of acceptance were superimposed; the shaded region
where contours within limits of acceptance overlapped was considered the predicted optimum
region. Thus, a commercial sample can be used as a control and the consumer acceptance scores
can be set as criteria to attain the optimum. The three dimensional plots as well as the contour
maps provide a useful visual aid for examining the behavior of the response surface and location
of the optimum (Vatsala and others 2001). For product development, RSM can be used to
establish the optimum level of the primary ingredients in a product, once these ingredients have
been identified. This information helps the product developer to understand ingredient
interactions in the product which guide the final product formulation and future cost and quality
changes (Giovanni 1983).
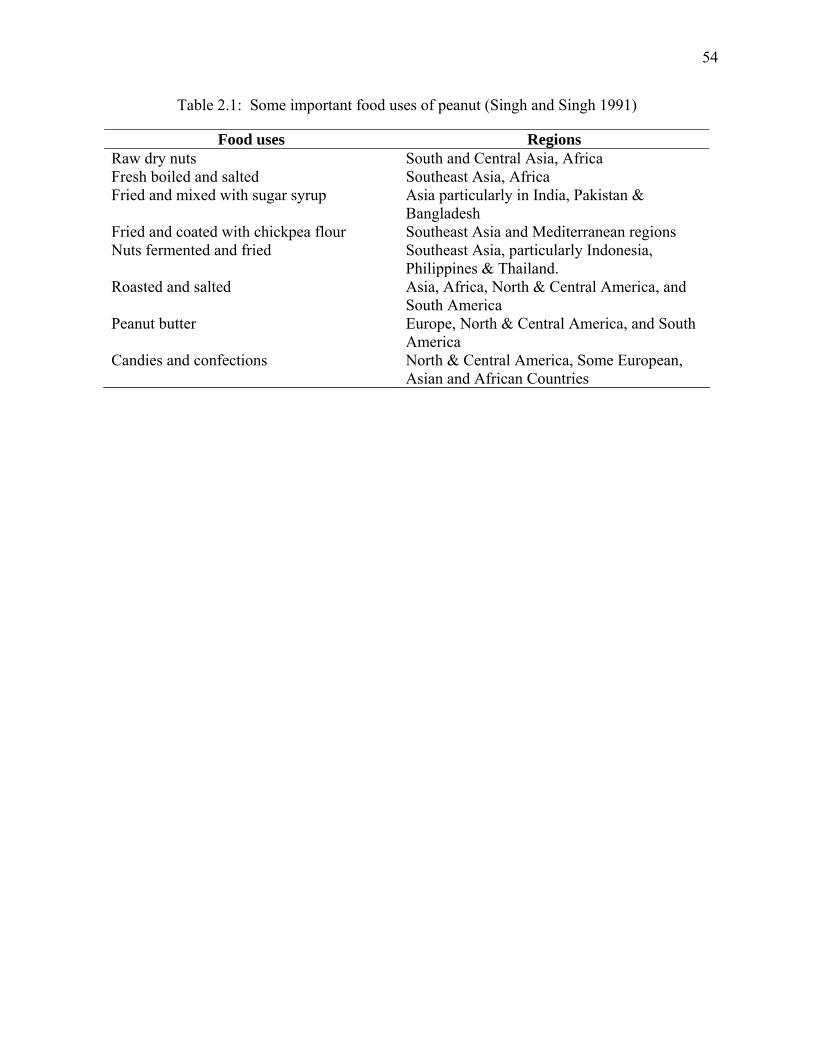
54
Table 2.1: Some important food uses of peanut (Singh and Singh 1991)
Food uses Regions Raw dry nuts South and Central Asia, Africa Fresh boiled and salted Southeast Asia, Africa Fried and mixed with sugar syrup Asia particularly in India, Pakistan &
Bangladesh Fried and coated with chickpea flour Southeast Asia and Mediterranean regions Nuts fermented and fried Southeast Asia, particularly Indonesia,
Philippines & Thailand. Roasted and salted Asia, Africa, North & Central America, and
South America Peanut butter Europe, North & Central America, and South
America Candies and confections North & Central America, Some European,
Asian and African Countries
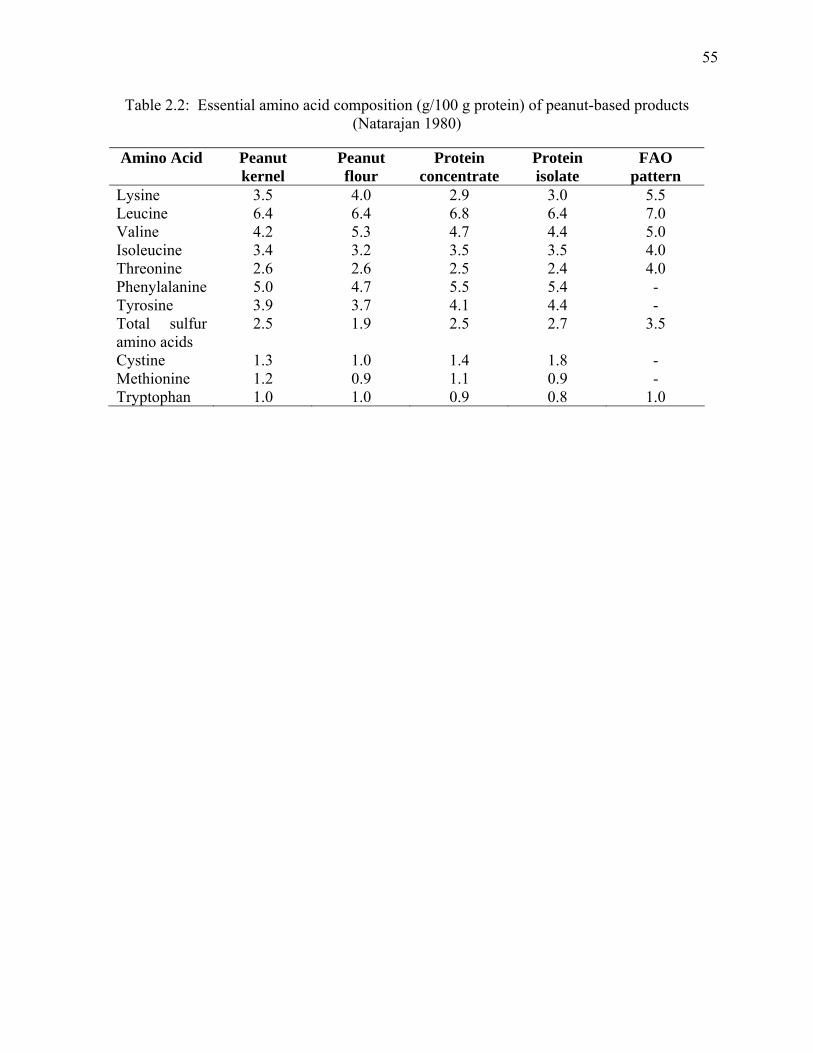
55
Table 2.2: Essential amino acid composition (g/100 g protein) of peanut-based products (Natarajan 1980)
Amino Acid Peanut
kernel Peanut flour
Protein concentrate
Protein isolate
FAO pattern
Lysine 3.5 4.0 2.9 3.0 5.5 Leucine 6.4 6.4 6.8 6.4 7.0 Valine 4.2 5.3 4.7 4.4 5.0 Isoleucine 3.4 3.2 3.5 3.5 4.0 Threonine 2.6 2.6 2.5 2.4 4.0 Phenylalanine 5.0 4.7 5.5 5.4 - Tyrosine 3.9 3.7 4.1 4.4 - Total sulfur amino acids
2.5 1.9 2.5 2.7 3.5
Cystine 1.3 1.0 1.4 1.8 - Methionine 1.2 0.9 1.1 0.9 - Tryptophan 1.0 1.0 0.9 0.8 1.0
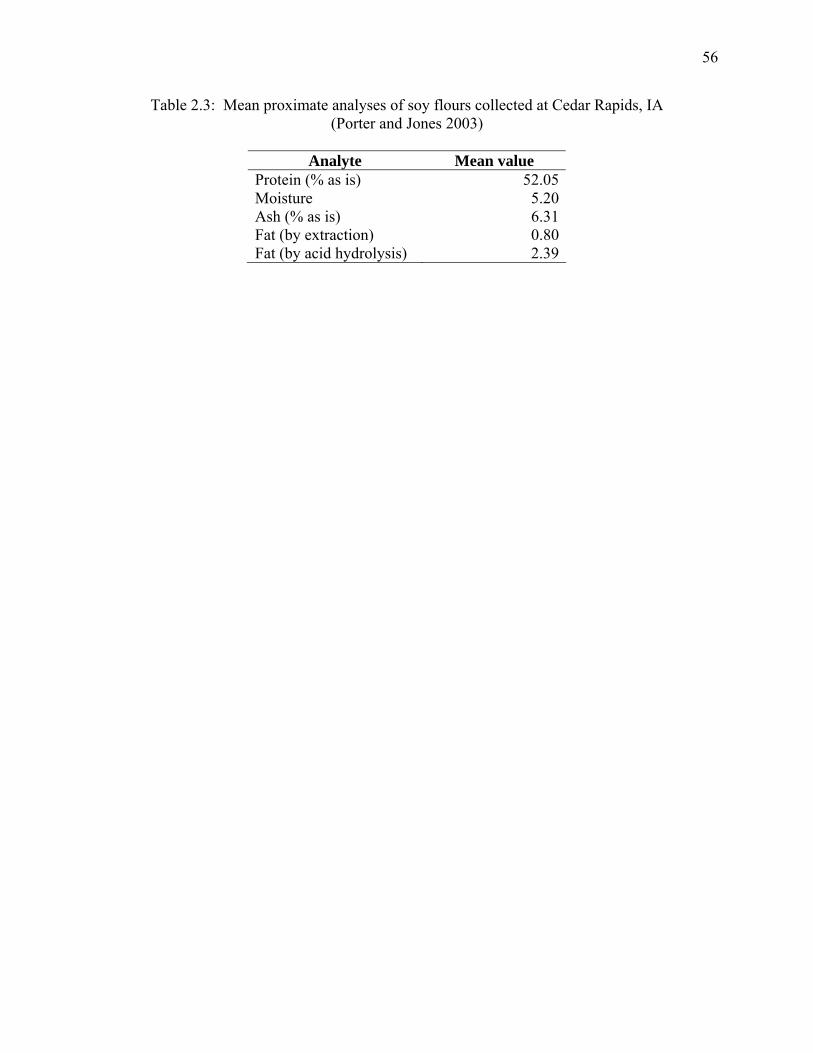
56
Table 2.3: Mean proximate analyses of soy flours collected at Cedar Rapids, IA (Porter and Jones 2003)
Analyte Mean value
Protein (% as is) 52.05Moisture 5.20Ash (% as is) 6.31Fat (by extraction) 0.80Fat (by acid hydrolysis) 2.39
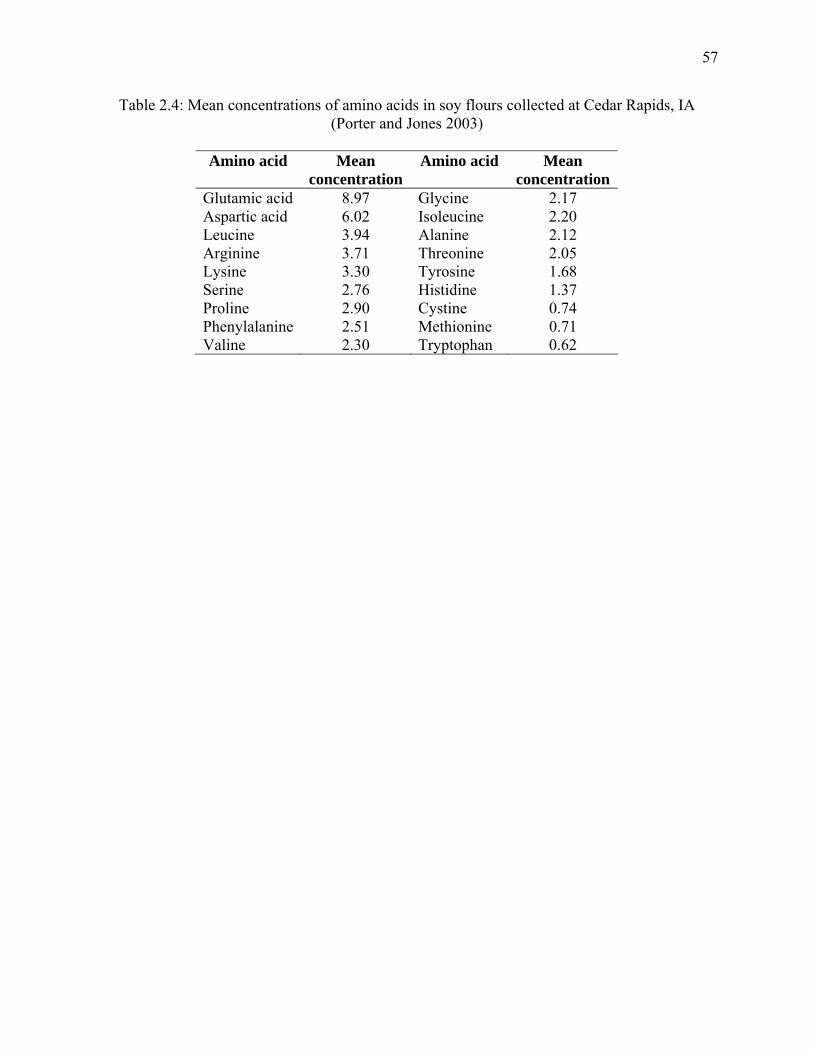
57
Table 2.4: Mean concentrations of amino acids in soy flours collected at Cedar Rapids, IA (Porter and Jones 2003)
Amino acid Mean
concentration Amino acid Mean
concentration Glutamic acid 8.97 Glycine 2.17 Aspartic acid 6.02 Isoleucine 2.20 Leucine 3.94 Alanine 2.12 Arginine 3.71 Threonine 2.05 Lysine 3.30 Tyrosine 1.68 Serine 2.76 Histidine 1.37 Proline 2.90 Cystine 0.74 Phenylalanine 2.51 Methionine 0.71 Valine 2.30 Tryptophan 0.62
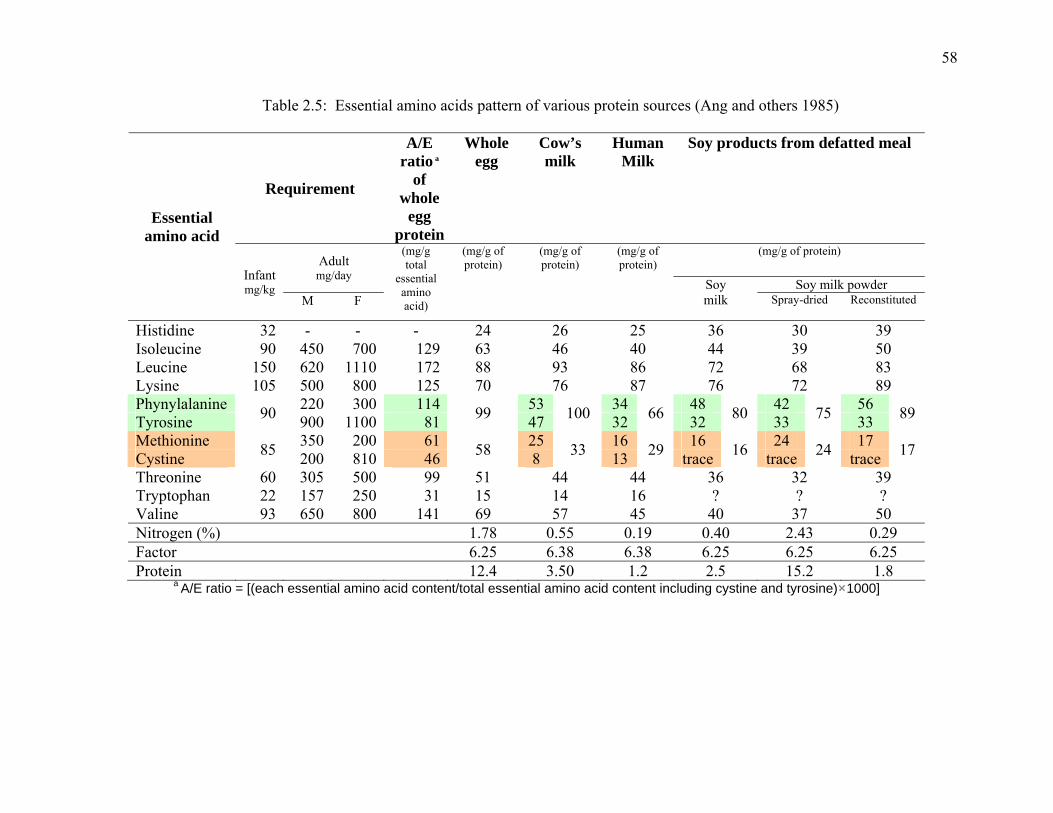
58
Table 2.5: Essential amino acids pattern of various protein sources (Ang and others 1985)
Requirement
A/E ratio a
of whole
egg protein
Whole egg
Cow’s milk
Human Milk
Soy products from defatted meal
(mg/g of protein) Adult
mg/day Soy milk powder
Essential amino acid
Infant mg/kg
M F
(mg/g total
essential amino acid)
(mg/g of protein)
(mg/g of protein)
(mg/g of protein)
Soy milk Spray-dried
Reconstituted
Histidine 32 - - - 24 26 25 36 30 39 Isoleucine 90 450 700 129 63 46 40 44 39 50 Leucine 150 620 1110 172 88 93 86 72 68 83 Lysine 105 500 800 125 70 76 87 76 72 89 Phynylalanine 220 300 114 53 34 48 42 56 Tyrosine 90 900 1100 81 99 47 100 32 66 32 80 33 75 33 89
Methionine 350 200 61 25 16 16 24 17 Cystine 85 200 810 46 58 8 33 13 29 trace 16 trace 24 trace 17
Threonine 60 305 500 99 51 44 44 36 32 39 Tryptophan 22 157 250 31 15 14 16 ? ? ? Valine 93 650 800 141 69 57 45 40 37 50 Nitrogen (%) 1.78 0.55 0.19 0.40 2.43 0.29 Factor 6.25 6.38 6.38 6.25 6.25 6.25 Protein 12.4 3.50 1.2 2.5 15.2 1.8
a A/E ratio = [(each essential amino acid content/total essential amino acid content including cystine and tyrosine) 1000]
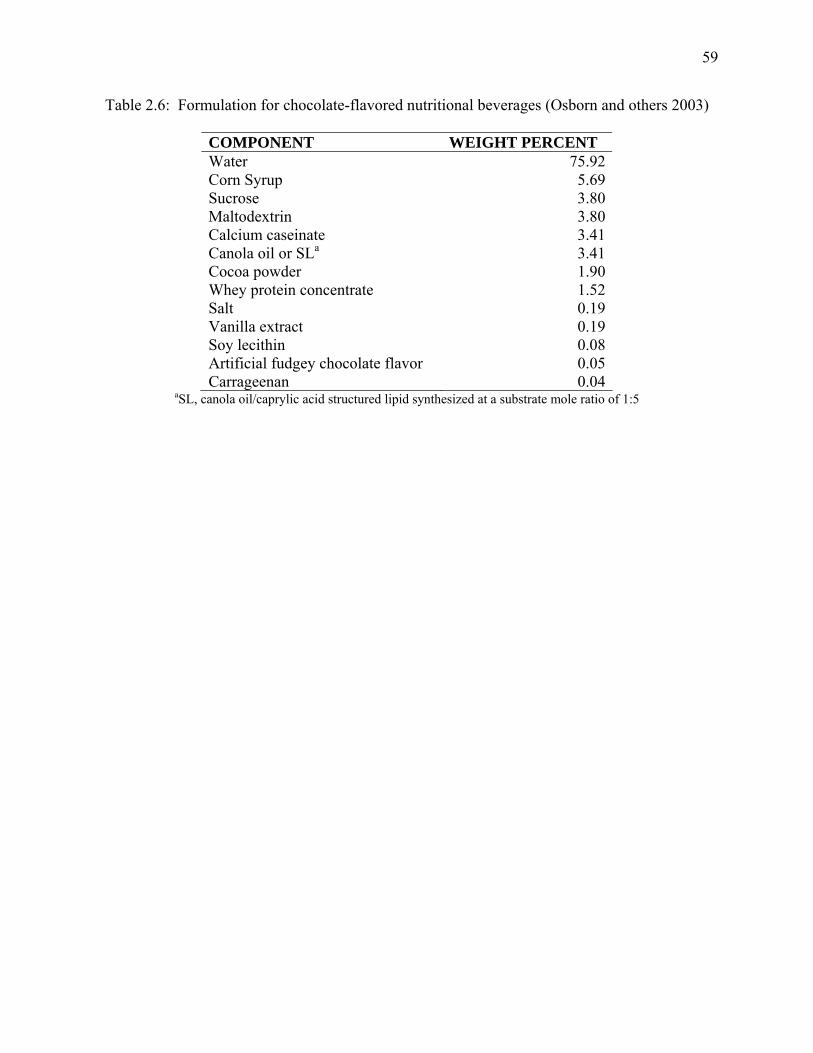
59
Table 2.6: Formulation for chocolate-flavored nutritional beverages (Osborn and others 2003)
COMPONENT WEIGHT PERCENT Water 75.92 Corn Syrup 5.69 Sucrose 3.80 Maltodextrin 3.80 Calcium caseinate 3.41 Canola oil or SLa 3.41 Cocoa powder 1.90 Whey protein concentrate 1.52 Salt 0.19 Vanilla extract 0.19 Soy lecithin 0.08 Artificial fudgey chocolate flavor 0.05 Carrageenan 0.04
aSL, canola oil/caprylic acid structured lipid synthesized at a substrate mole ratio of 1:5
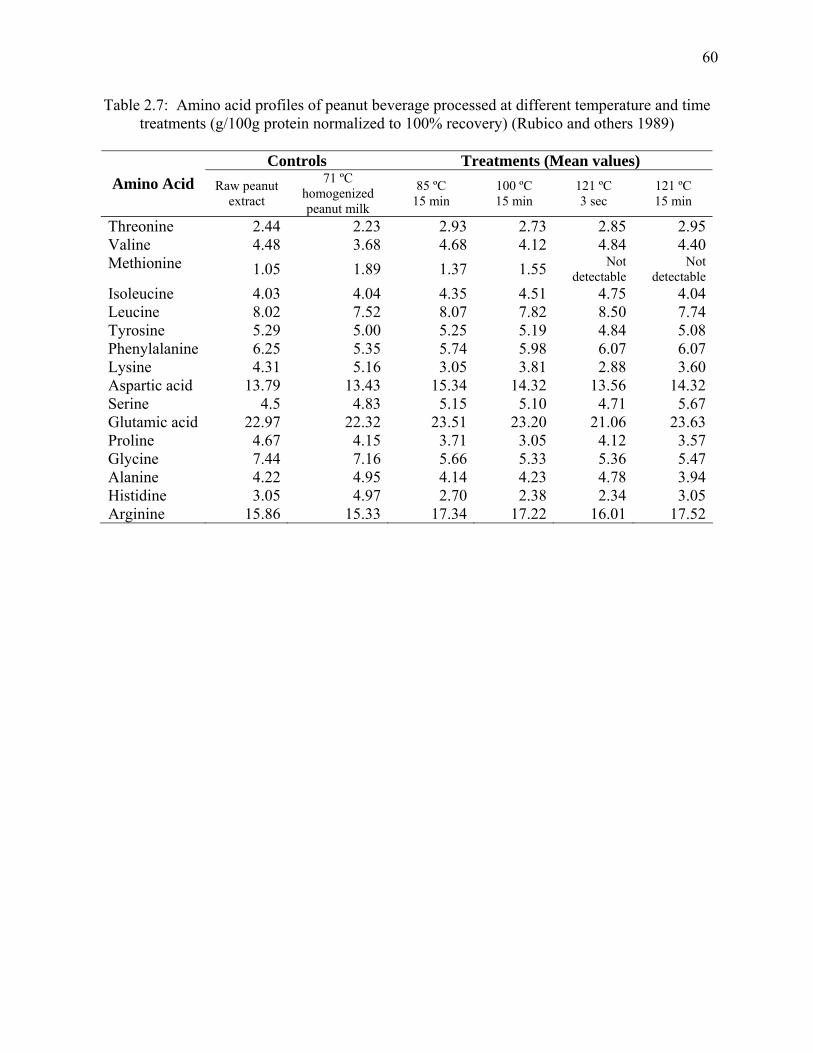
60
Table 2.7: Amino acid profiles of peanut beverage processed at different temperature and time treatments (g/100g protein normalized to 100% recovery) (Rubico and others 1989)
Controls Treatments (Mean values)
Amino Acid Raw peanut extract
71 ºC homogenized peanut milk
85 ºC 15 min
100 ºC 15 min
121 ºC 3 sec
121 ºC 15 min
Threonine 2.44 2.23 2.93 2.73 2.85 2.95Valine 4.48 3.68 4.68 4.12 4.84 4.40Methionine 1.05 1.89 1.37 1.55 Not
detectable Not
detectable Isoleucine 4.03 4.04 4.35 4.51 4.75 4.04Leucine 8.02 7.52 8.07 7.82 8.50 7.74Tyrosine 5.29 5.00 5.25 5.19 4.84 5.08Phenylalanine 6.25 5.35 5.74 5.98 6.07 6.07Lysine 4.31 5.16 3.05 3.81 2.88 3.60Aspartic acid 13.79 13.43 15.34 14.32 13.56 14.32Serine 4.5 4.83 5.15 5.10 4.71 5.67Glutamic acid 22.97 22.32 23.51 23.20 21.06 23.63Proline 4.67 4.15 3.71 3.05 4.12 3.57Glycine 7.44 7.16 5.66 5.33 5.36 5.47Alanine 4.22 4.95 4.14 4.23 4.78 3.94Histidine 3.05 4.97 2.70 2.38 2.34 3.05Arginine 15.86 15.33 17.34 17.22 16.01 17.52
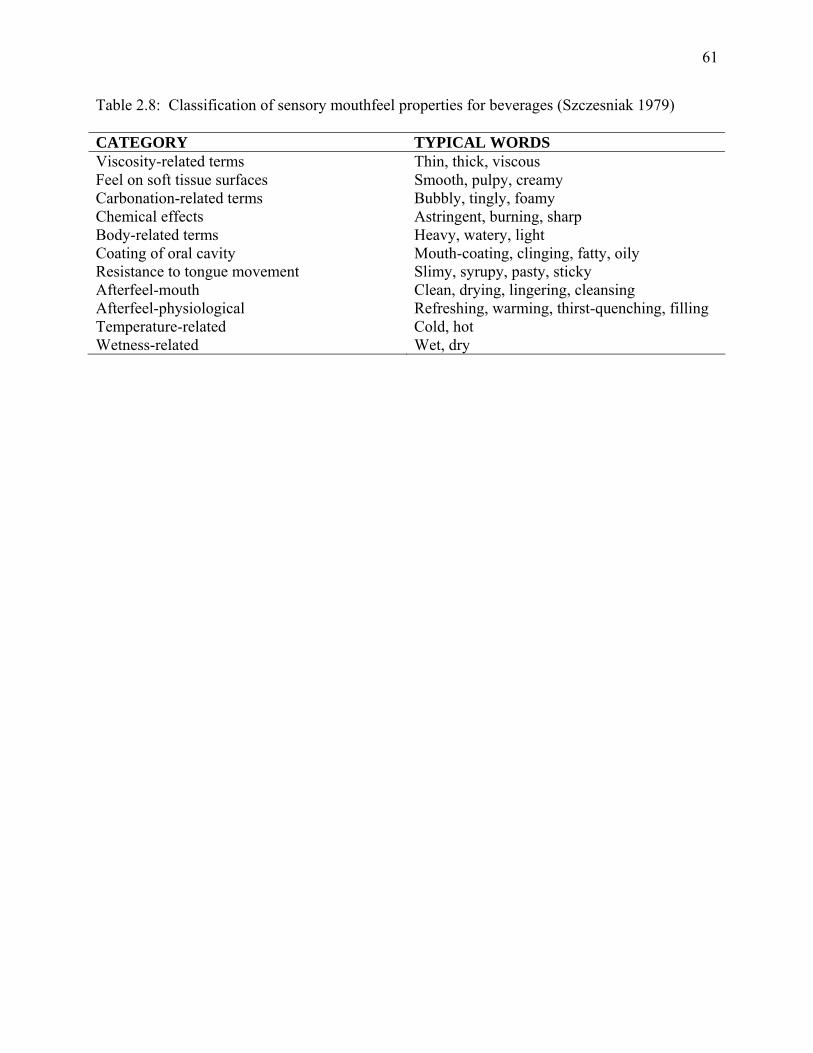
61
Table 2.8: Classification of sensory mouthfeel properties for beverages (Szczesniak 1979) CATEGORY TYPICAL WORDS Viscosity-related terms Thin, thick, viscous Feel on soft tissue surfaces Smooth, pulpy, creamy Carbonation-related terms Bubbly, tingly, foamy Chemical effects Astringent, burning, sharp Body-related terms Heavy, watery, light Coating of oral cavity Mouth-coating, clinging, fatty, oily Resistance to tongue movement Slimy, syrupy, pasty, sticky Afterfeel-mouth Clean, drying, lingering, cleansing Afterfeel-physiological Refreshing, warming, thirst-quenching, filling Temperature-related Cold, hot Wetness-related Wet, dry
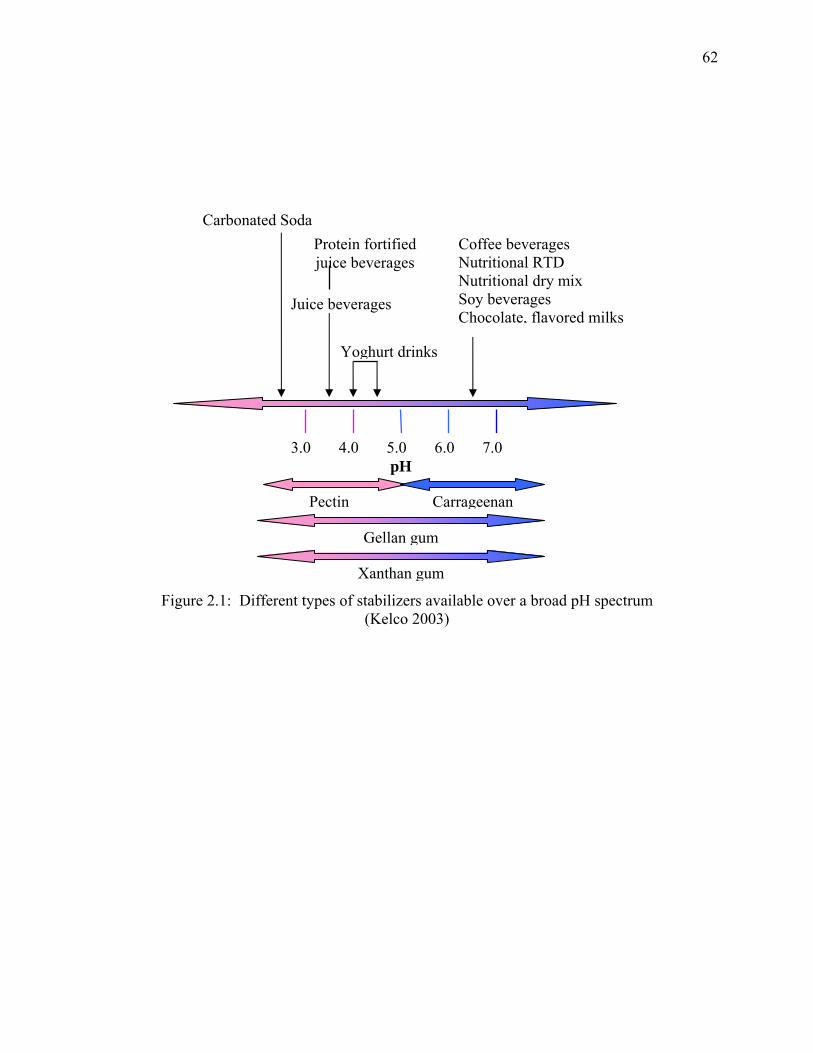
62
Juice beverages
Yoghurt drinks
CarrageenanPectin
Gellan gum
Xanthan gum
3.0 4.0 5.0 6.0 7.0 pH
Carbonated Soda Protein fortified juice beverages
Coffee beverages Nutritional RTD Nutritional dry mix Soy beverages Chocolate, flavored milks
Figure 2.1: Different types of stabilizers available over a broad pH spectrum (Kelco 2003)
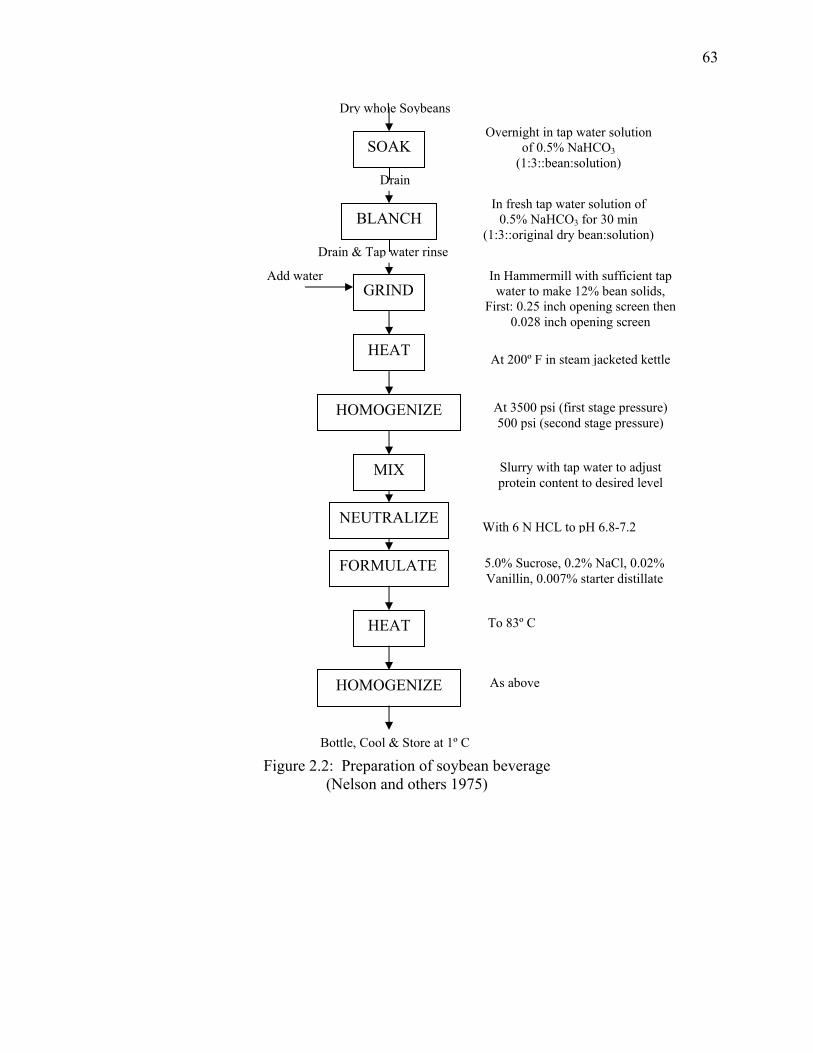
63
Add water
Drain & Tap water rinse
Drain
SOAK
BLANCH
GRIND
HEAT
HOMOGENIZE
MIX
Overnight in tap water solution of 0.5% NaHCO3
(1:3::bean:solution)
In fresh tap water solution of 0.5% NaHCO3 for 30 min
(1:3::original dry bean:solution)
In Hammermill with sufficient tap water to make 12% bean solids,
First: 0.25 inch opening screen then 0.028 inch opening screen
At 200º F in steam jacketed kettle
At 3500 psi (first stage pressure) 500 psi (second stage pressure)
Slurry with tap water to adjust protein content to desired level
NEUTRALIZE With 6 N HCL to pH 6.8-7.2
FORMULATE
HEAT
HOMOGENIZE
Bottle, Cool & Store at 1º C
Dry whole Soybeans
5.0% Sucrose, 0.2% NaCl, 0.02% Vanillin, 0.007% starter distillate
To 83º C
As above
Figure 2.2: Preparation of soybean beverage (Nelson and others 1975)
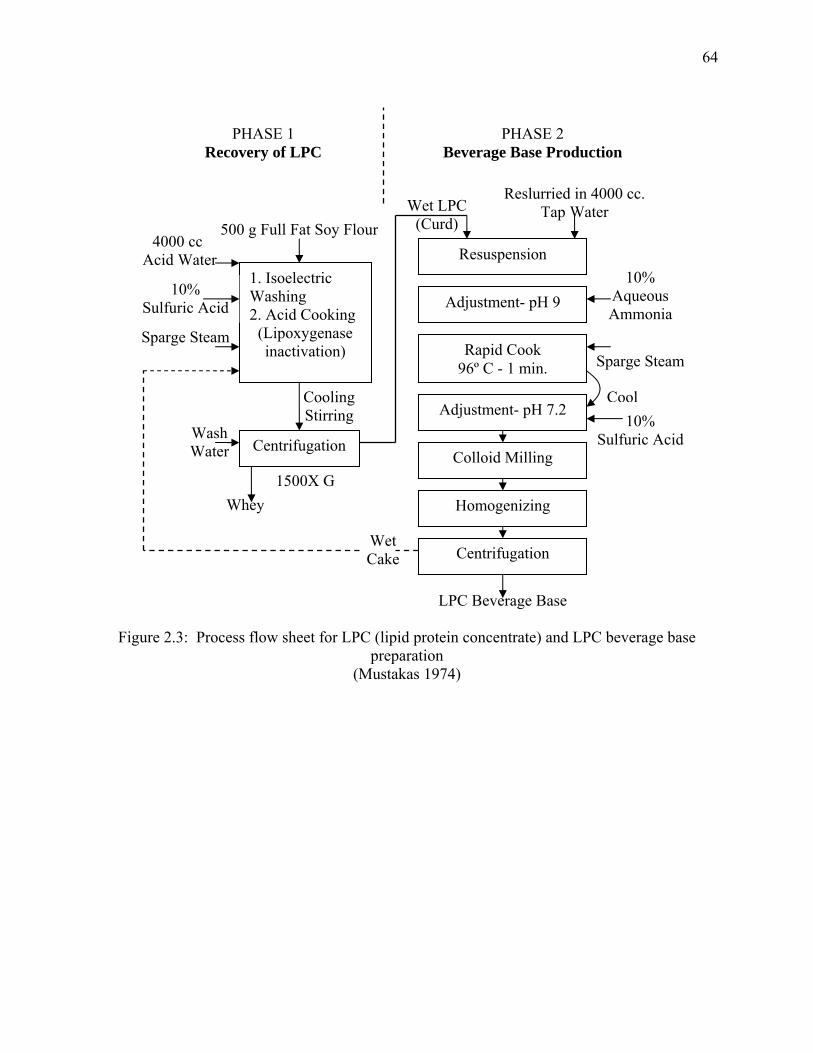
64
Wet Cake
Wet LPC (Curd)
Whey 1500X G
Wash Water
Cooling Stirring
Sparge Steam
4000 cc. Acid Water
500 g Full Fat Soy Flour
10% Sulfuric Acid
Cool
Sparge Steam
10% Aqueous Ammonia
Reslurried in 4000 cc. Tap Water
Resuspension
Adjustment- pH 9
Rapid Cook 96º C - 1 min.
Adjustment- pH 7.2
Colloid Milling
Homogenizing
Centrifugation
LPC Beverage Base
Centrifugation
1. Isoelectric Washing 2. Acid Cooking
(Lipoxygenase inactivation)
10% Sulfuric Acid
PHASE 1 Recovery of LPC
PHASE 2 Beverage Base Production
Figure 2.3: Process flow sheet for LPC (lipid protein concentrate) and LPC beverage base preparation
(Mustakas 1974)
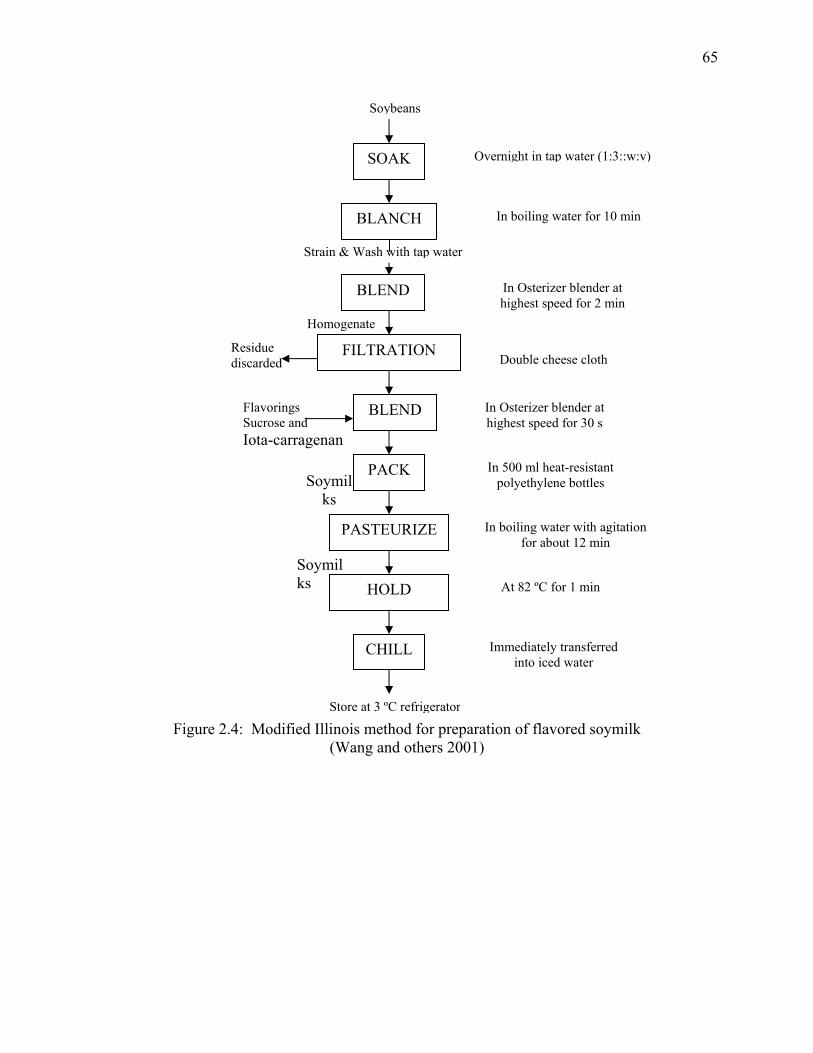
65
Flavorings Sucrose and Iota-carragenan
Homogenate
Soymilks
Soymilks
Residue discarded
Strain & Wash with tap water
SOAK
BLANCH
BLEND
FILTRATION
PACK
Overnight in tap water (1:3::w:v)
In boiling water for 10 min
In Osterizer blender at highest speed for 2 min
Double cheese cloth
In Osterizer blender at highest speed for 30 s
In 500 ml heat-resistant polyethylene bottles
PASTEURIZE In boiling water with agitation for about 12 min
HOLD
CHILL
Store at 3 ºC refrigerator
Soybeans
At 82 ºC for 1 min
Immediately transferred into iced water
BLEND
Figure 2.4: Modified Illinois method for preparation of flavored soymilk (Wang and others 2001)
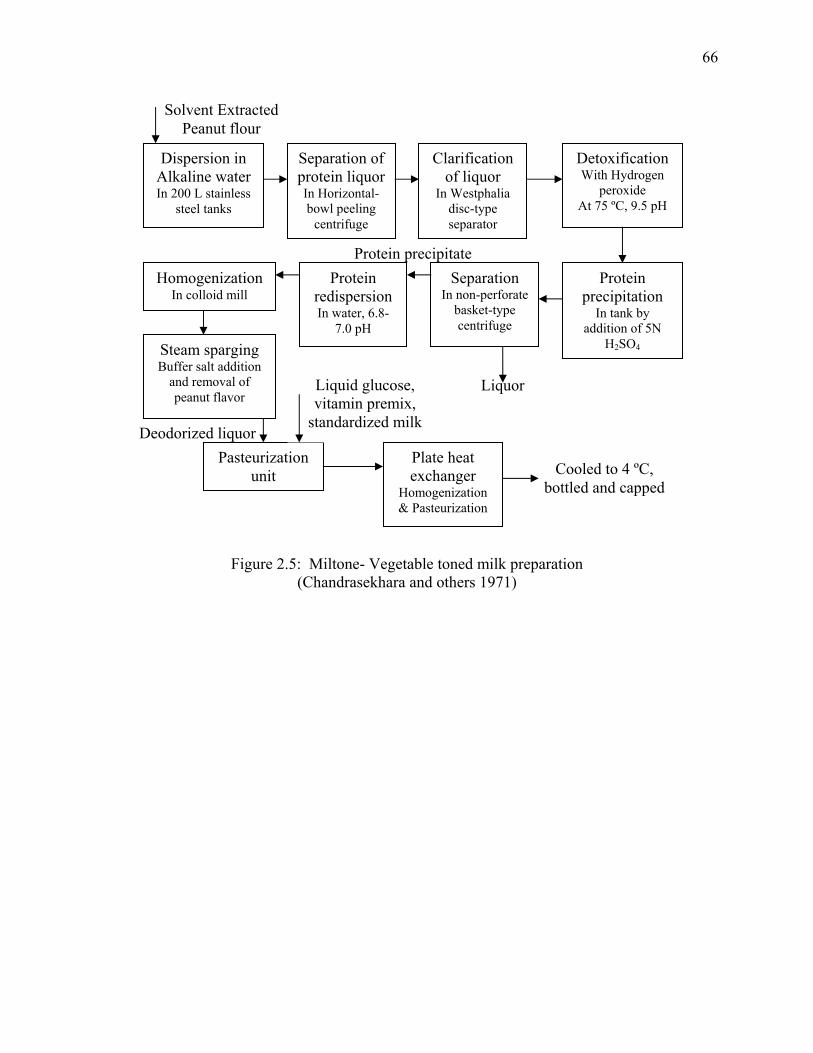
66
Solvent Extracted Peanut flour
Protein precipitate
Dispersion in Alkaline water In 200 L stainless
steel tanks
Separation of protein liquor In Horizontal-bowl peeling
centrifuge
Clarification of liquor
In Westphalia disc-type separator
Detoxification With Hydrogen
peroxide At 75 ºC, 9.5 pH
Protein precipitation
In tank by addition of 5N
H2SO4
Separation In non-perforate
basket-type centrifuge
Liquor
Protein redispersion In water, 6.8-
7.0 pH
Homogenization In colloid mill
Deodorized liquor
Steam sparging Buffer salt addition
and removal of peanut flavor
Pasteurization unit
Liquid glucose, vitamin premix,
standardized milk
Plate heat exchanger
Homogenization & Pasteurization
Cooled to 4 ºC, bottled and capped
Figure 2.5: Miltone- Vegetable toned milk preparation (Chandrasekhara and others 1971)
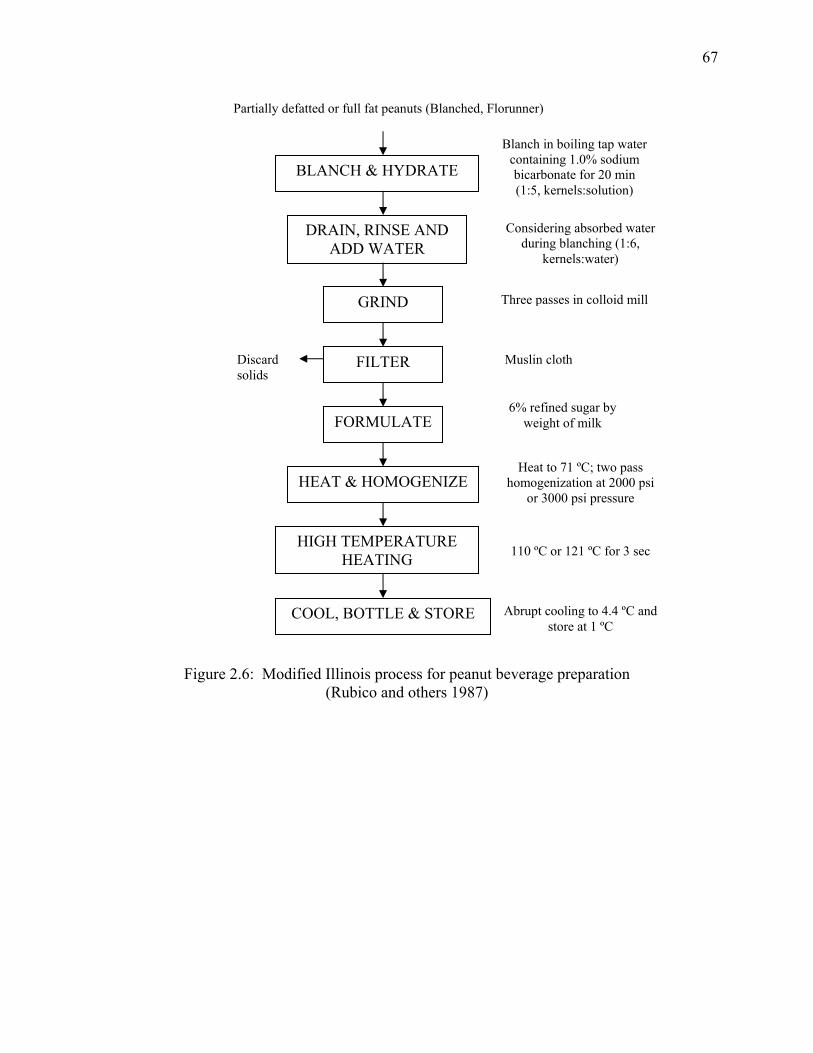
67
Abrupt cooling to 4.4 ºC and store at 1 ºC
BLANCH & HYDRATE
Blanch in boiling tap water containing 1.0% sodium bicarbonate for 20 min (1:5, kernels:solution)
DRAIN, RINSE AND ADD WATER
Considering absorbed water during blanching (1:6,
kernels:water)
GRIND
FILTER
FORMULATE
HEAT & HOMOGENIZE
HIGH TEMPERATURE HEATING
COOL, BOTTLE & STORE
Three passes in colloid mill
Muslin cloth
6% refined sugar by weight of milk
Heat to 71 ºC; two pass homogenization at 2000 psi
or 3000 psi pressure
110 ºC or 121 ºC for 3 sec
Discard solids
Partially defatted or full fat peanuts (Blanched, Florunner)
Figure 2.6: Modified Illinois process for peanut beverage preparation (Rubico and others 1987)
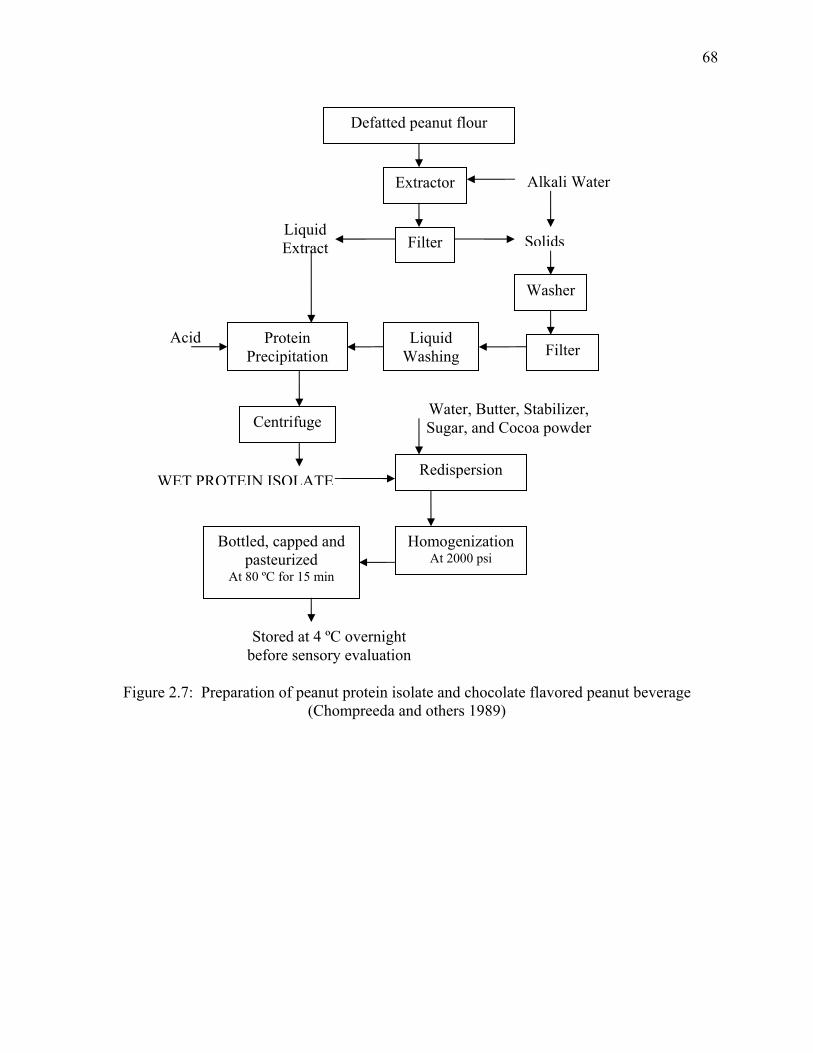
68
Liquid Extract
Alkali Water
Solids
Defatted peanut flour
Extractor
Filter
Protein Precipitation
Acid Liquid Washing Filter
Washer
Centrifuge
WET PROTEIN ISOLATERedispersion
Water, Butter, Stabilizer, Sugar, and Cocoa powder
Homogenization At 2000 psi
Bottled, capped and pasteurized
At 80 ºC for 15 min
Stored at 4 ºC overnight before sensory evaluation
Figure 2.7: Preparation of peanut protein isolate and chocolate flavored peanut beverage (Chompreeda and others 1989)
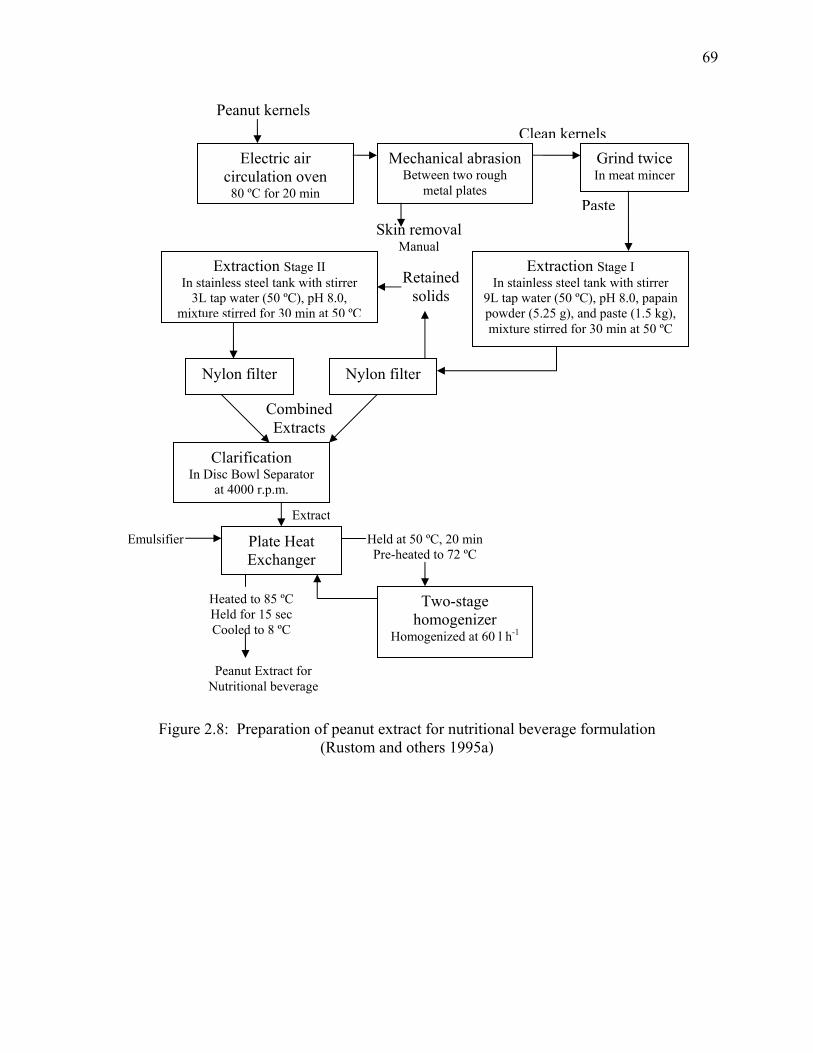
69
Extract
Combined Extracts
Retained solids
Paste
Clean kernels
Skin removal Manual
Peanut kernels
Electric air circulation oven
80 ºC for 20 min
Mechanical abrasion Between two rough
metal plates
Grind twice In meat mincer
Extraction Stage I In stainless steel tank with stirrer
9L tap water (50 ºC), pH 8.0, papain powder (5.25 g), and paste (1.5 kg), mixture stirred for 30 min at 50 ºC
Extraction Stage II In stainless steel tank with stirrer
3L tap water (50 ºC), pH 8.0, mixture stirred for 30 min at 50 ºC
Nylon filter Nylon filter
Clarification In Disc Bowl Separator
at 4000 r.p.m.
Plate Heat Exchanger
Two-stage homogenizer
Homogenized at 60 l h-1
Held at 50 ºC, 20 min Pre-heated to 72 ºC
Heated to 85 ºC Held for 15 sec Cooled to 8 ºC
Emulsifier
Peanut Extract for Nutritional beverage
Figure 2.8: Preparation of peanut extract for nutritional beverage formulation (Rustom and others 1995a)
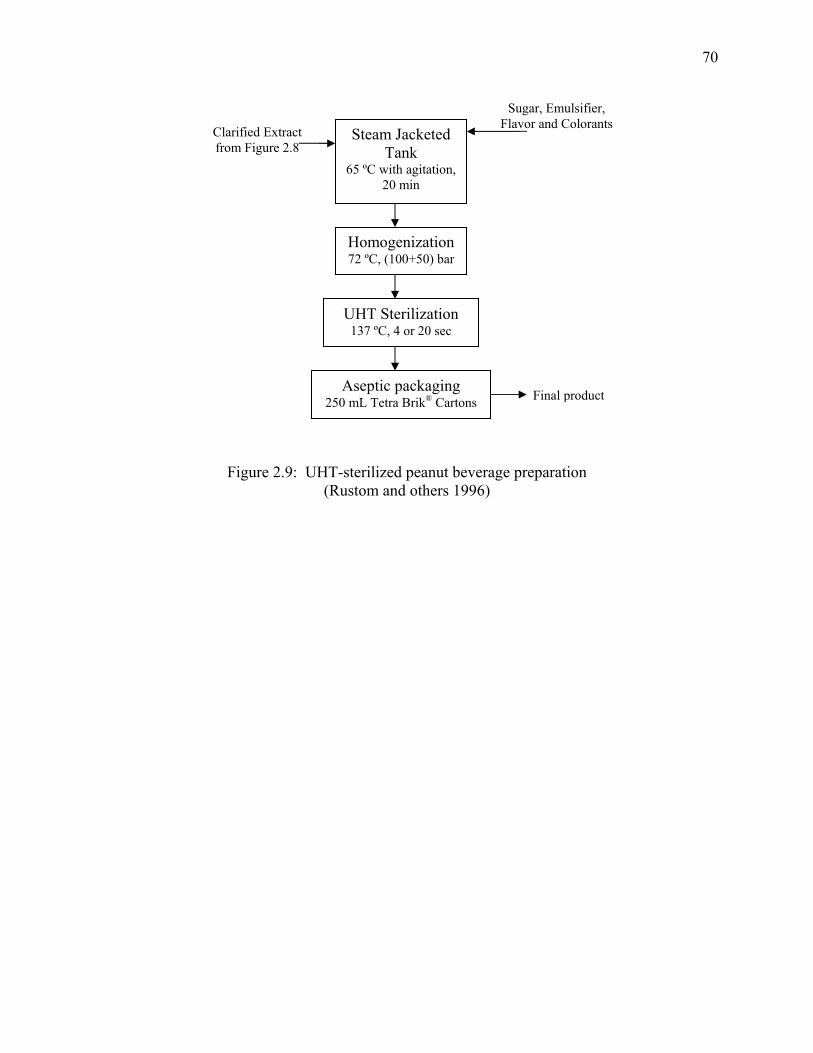
70
Clarified Extract from Figure 2.8
Final product
Sugar, Emulsifier, Flavor and Colorants
Steam Jacketed Tank
65 ºC with agitation, 20 min
Homogenization 72 ºC, (100+50) bar
UHT Sterilization 137 ºC, 4 or 20 sec
Aseptic packaging 250 mL Tetra Brik® Cartons
Figure 2.9: UHT-sterilized peanut beverage preparation (Rustom and others 1996)
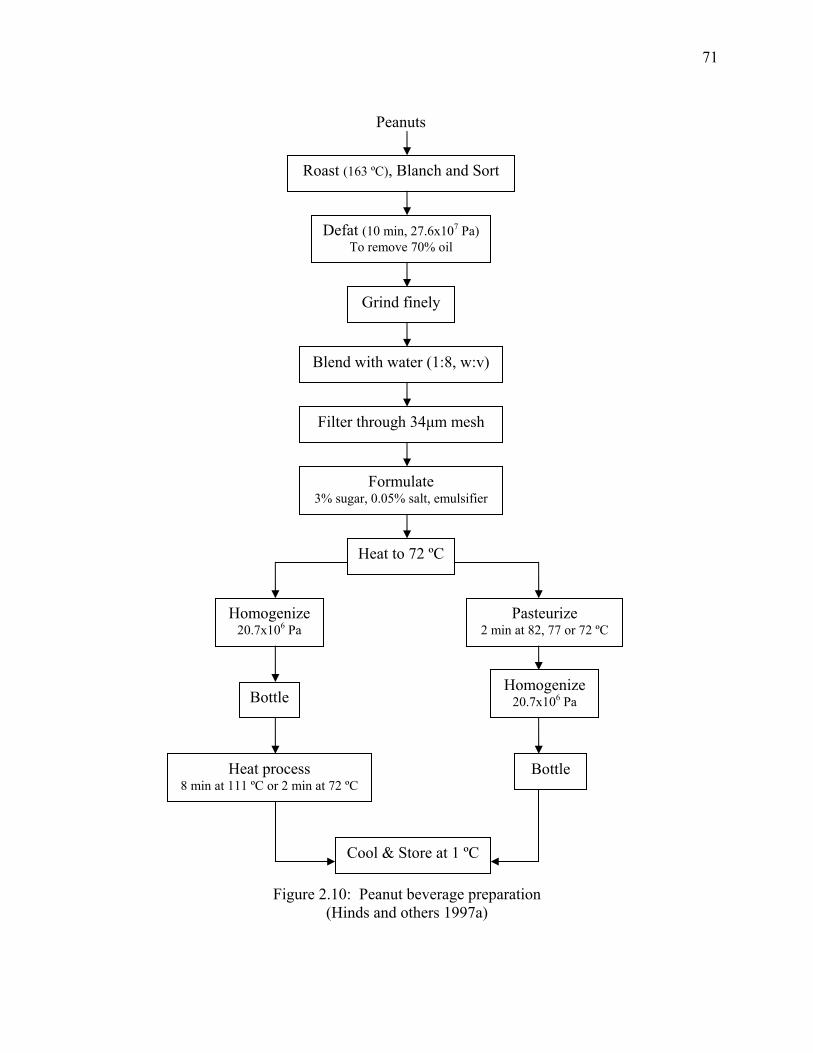
71
Peanuts
Roast (163 ºC), Blanch and Sort
Defat (10 min, 27.6x10⁷ Pa) To remove 70% oil
Grind finely
Blend with water (1:8, w:v)
Filter through 34µm mesh
Formulate 3% sugar, 0.05% salt, emulsifier
Heat to 72 ºC
Homogenize 20.7x10⁶ Pa
Bottle
Heat process 8 min at 111 ºC or 2 min at 72 ºC
Pasteurize 2 min at 82, 77 or 72 ºC
Homogenize 20.7x10⁶ Pa
Bottle
Cool & Store at 1 ºC
Figure 2.10: Peanut beverage preparation (Hinds and others 1997a)
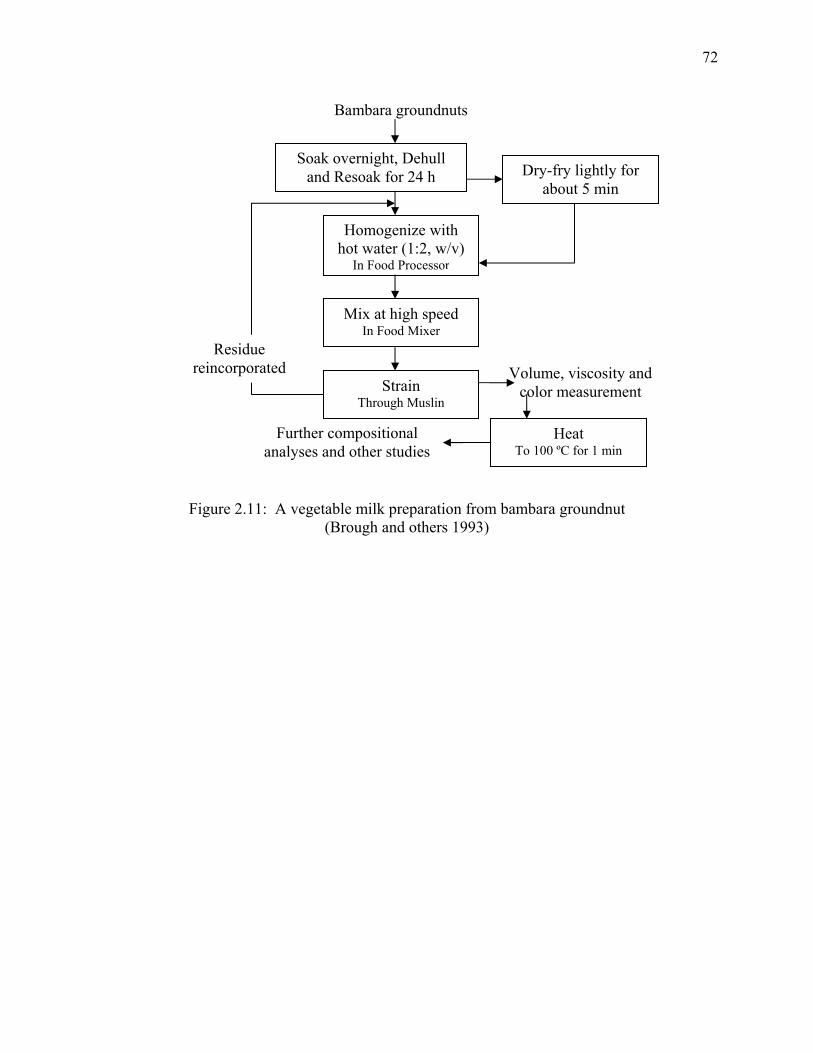
72
Further compositional analyses and other studies
Bambara groundnuts
Soak overnight, Dehull and Resoak for 24 h
Homogenize with hot water (1:2, w/v)
In Food Processor
Mix at high speed In Food Mixer
Dry-fry lightly for about 5 min
Strain Through Muslin
Residue reincorporated
Heat To 100 ºC for 1 min
Volume, viscosity and color measurement
Figure 2.11: A vegetable milk preparation from bambara groundnut (Brough and others 1993)
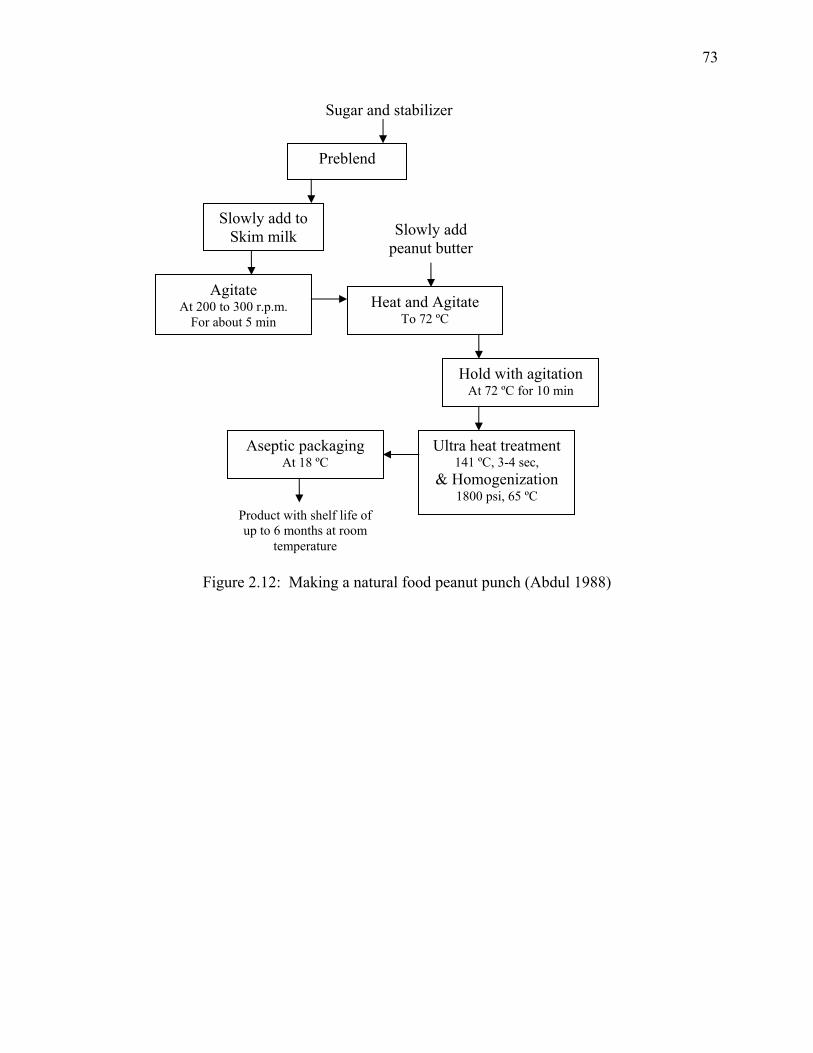
73
Sugar and stabilizer
Preblend
Slowly add to Skim milk
Agitate At 200 to 300 r.p.m.
For about 5 min
Ultra heat treatment 141 ºC, 3-4 sec,
& Homogenization 1800 psi, 65 ºC
Heat and Agitate To 72 ºC
Slowly add peanut butter
Hold with agitation At 72 ºC for 10 min
Aseptic packaging At 18 ºC
Product with shelf life of up to 6 months at room
temperature
Figure 2.12: Making a natural food peanut punch (Abdul 1988)
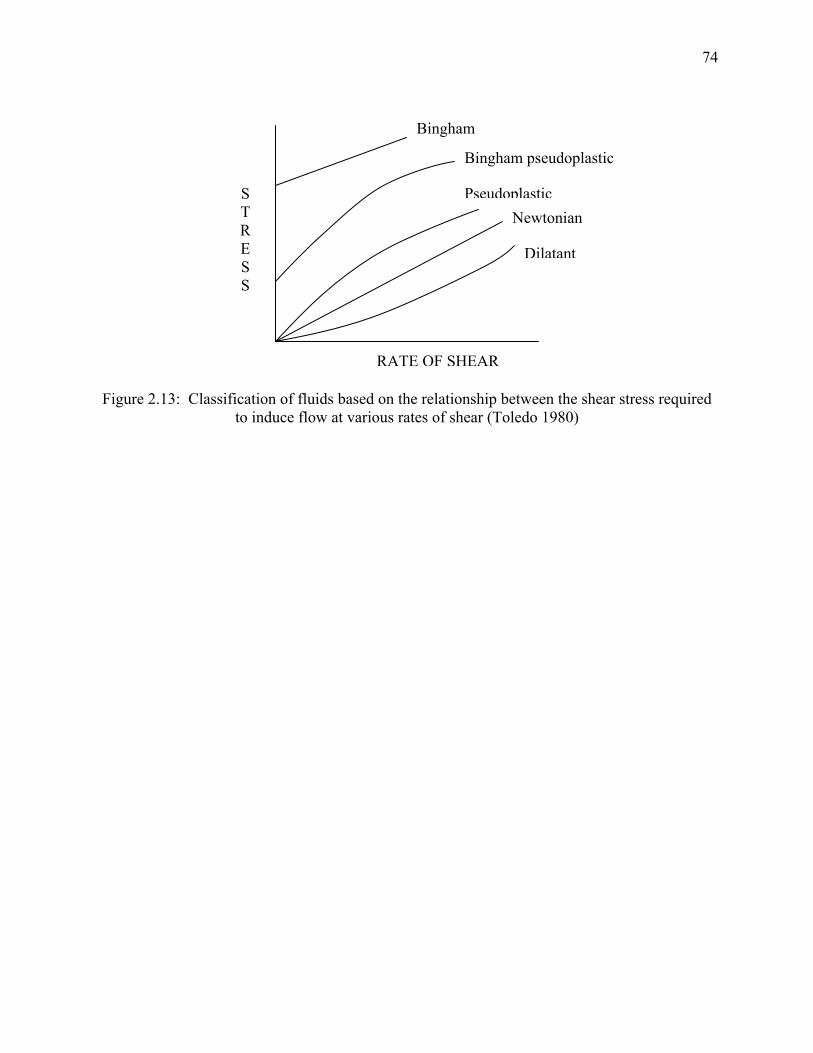
74
Figure 2.13: Classification of fluids based on the relationship between the shear stress required
to induce flow at various rates of shear (Toledo 1980)
STRESS
Dilatant
PseudoplasticNewtonian
Bingham pseudoplastic
Bingham
RATE OF SHEAR
75
CHAPTER 3
FORMULATION AND PROCESSING PROTOCOL OF
A CHOCOLATE-FLAVORED PEANUT-SOY BEVERAGE1
______________________________
1 Deshpande, R. P., Chinnan, M. S., and Phillips, R. D. To be submitted to the Journal of Food Science.
76
ABSTRACT
A new beverage product was developed utilizing two protein rich oilseed sources namely peanut
and soy. Medium roasted peanut flour and chocolate flavor were incorporated to offer pleasant
flavor profile. The peanut-soy combination would also improve essential amino acid profile
especially that of lysine, compared to an all-peanut product. A pilot-plant scale beverage
processing protocol involved filtration, homogenization, and pasteurization as the major
operating steps. Beverage formulation employed a three-component constrained mixture design.
Low and high bound constraints were determined for peanut (30.56%-58.70%), soy (28.26%-
43.52%) and chocolate syrup (13.04%-25.93%) based on lysine content, viscosity and visual
stability index values of 51 mg/g protein, 36.9 mPa s, and 1.00, respectively.
INDEX WORDS: Chocolate-flavored peanut-soy beverage, Three-component constrained
mixture design, Lysine content, Viscosity, Visual stability index
77
INTRODUCTION
The United States ranks third in world peanut production with about 39% of the total crop grown
in Georgia. Apart from the ever increasing range of traditional peanut-based products, recently,
there is growing interest in expanding the utilization of peanuts through protein-based beverage
products. Earlier studies on Miltone vegetable toned milk (Chandrasekhara and others 1971),
peanut beverage (Rubico and others 1987, 1988, 1989; Galvez and others 1990), chocolate
flavored peanut beverage (Chompreeda and others 1989), UHT-Sterilized peanut beverage
(Rustom and others 1995, 1996), and partially defatted, roasted peanut beverage (Hinds and
others 1997a, 1997b, 1997c) show that peanut has been exploited in several milk-type products
with continual advancements with respect to physicochemical, nutritional and sensory
characteristics as well as beverage preparation methods.
Several cereal- and legume-based foods using peanuts as protein supplement have been
developed to alleviate malnutrition (Singh and Singh 1991). Dietary deficiencies of protein and
calories, particularly among preschool children and lactating women in developing countries, is
one of the essential factors causing food scientists and nutritionists to undertake development of
nutritionally balanced protein-based foods. The nutritive value of peanut protein is function of
its protein content (peanut flour = 47.0-55.0%), amino acid composition, and protein
digestibility. Peanut protein is deficient with respect to certain essential amino acids, for
example, lysine, tryptophan, threonine and sulphur containing amino acids but its true
digestibility is comparable with that of animal protein (Singh and Singh 1991). When plant
proteins are consumed as human foods considerable emphasis is given on designing protein
blends of cereals and legumes to correct imbalances among amino acids from the nutritional
point of view (Singh and Singh 1991). As soy-based foods are increasingly included in the
78
national diets they are suitable vehicles for fortification to meet known deficiencies in essential
nutrients. Such fortification would serve as a complete nutritional supplement in the form of a
beverage for children and specific groups of people (Ang and others 1985). Besides providing
an alternative to traditional dairy products, soy protein is being incorporated into many nutritious
meal-replacement beverages, offering convenience to on-the-go consumers (Riaz 1999).
Soybean is the only legume that contains all nine essential amino acids at the levels that meet the
human requirements (Ang and others 1985). It is categorized as a source of high-quality protein
– equivalent to meat, milk, fish, and eggs – that also provides other essential nutrients (Tockman
2002). The soy ingredients have different nutritional and functional properties which enable
developers to formulate high-protein foods and allow processors to optimize product nutrition,
functionality and cost. Whether due to its health benefits or its ability to solve a variety of
formulation challenges, soy protein can be found in foods ranging from ice cream to burgers,
from milk to nut products, and tofu to a variety of meat alternatives (Roberts 2003). Therefore,
two sources of soy protein: soy flour (40-50% protein) and soy protein isolate (90% protein)
were selected to combine with the peanut protein.
Although advances are being made in the utilization of soy proteins in beverages, they
can not be used in a clear liquid-based product (because of suspended particles resulting from
long-chain protein molecules) and they also impart a beany flavor (Roberts 2003). The
undesirable bitter or green, beany notes of soy proteins have led to low consumer acceptability
limiting its use in vegetable protein-based foods (Rackis and others 1979). Still, consumer
enthusiasm for soy protein-based beverages is growing as attempts to combine flavors and
ingredients are on the rise. Flavor masking, using several approaches, is the best tool that has
been developed to compensate for bitter, green, beany, and other off-flavors of individual protein
79
sources or combinations in various applications (Gonzalez and Draganchuk 2003). Chocolate
has proven to be a popular flavor for soy-based beverages, due to its ability to provide a smooth
and pleasant flavor profile. Formulators have more difficulty getting subtle flavors such as
vanilla and fruit flavors to come through since soy proteins have tendency to “soak up” flavors
(Brandt 2002). Wang and others (2001) observed that addition of chocolate, almond, and vanilla
flavorings diminished beany flavor of soymilk, but the chocolate flavoring exhibited the best
effect in enhancing overall sensory quality. When determining a flavor for a new product,
consideration should be given at the outset to the types of flavors that are appropriate for the
target consumer, as well as flavors that will work well with other ingredients in the formulation
(Gonzalez and Draganchuk 2003). Hence, in this study of peanut-soy protein-based beverage the
most popular beverage flavor – chocolate – in the form of added ingredients (cocoa powder and
artificial chocolate flavor) was used. As consumers have become better informed about
nutrition, food manufacturers face the challenge of providing nutritious food that ensures
appealing taste, texture, and appearance (Riaz 1999). The beverage business is beginning to
focus more on consumer needs as both are seeking new product options. Thus, innovative
terminologies such as flavored milks, energy beverages, ready-to-drink meals and functional
beverages have been created (Sloan 2003). Keeping the current consumer trend of convenience
and nutrition in mind, this study to develop a new chocolate-flavored, peanut-soy-based,
nutritious beverage was undertaken.
The objective of this study was to develop a nutritional beverage formulation utilizing
three major components: peanut, soy and chocolate. The idea was to achieve nutritional and
functional benefits of roasted peanut flour, soy (either flour or protein isolate) and chocolate at
optimum levels so as to complement each other giving the most acceptable new beverage
80
product. The ranges of three components were based on viscosity, visual stability, and essential
amino acid content, especially lysine. The use of various other ingredients (stabilizers,
emulsifiers, peanut oil, flavoring agents, and sweeteners), variations in beverage formulation,
and various beverage processing parameters were identified through extensive literature review
and preliminary beverage preparation trials. The new beverage product developed is expected to
have improved nutritional and sensory attributes.
MATERIALS AND METHODS
Materials Medium roast, partially defatted (12% fat) peanut flour was obtained from Golden
Peanut Company, Alpharetta, Ga., U.S.A. Soy protein isolate (Prolisse™) and defatted soy flour
were obtained from two different plants of Cargill Soy Protein Solutions, one of them at Sidney,
OH and another at Cedar Rapids, IA, U.S.A., respectively. Maltodextrin (AVEBE MD 20) was
donated by AVEBE America Inc., Princeton, N.J., U.S.A. Soy lecithin (LECIGRAN™ 5750)
was provided by Riceland Foods, Inc., Lecithin Division, Stuttgart, Ark., U.S.A. Artificial
chocolate flavor was supplied by Carmi Flavor & Fragrance Co., Inc., Commerce, Calif., U.S.A.
The carrageenan stabilizer (Satiagel X-amp 4000) was provided by Degussa Texturant Systems
Sales, LLC, Atlanta, Ga., U.S.A. Commercial chocolate milk (Hershey®’s creamy chocolate
milk shake), corn syrup (light), vanilla extract (pure), cocoa powder (Hershey®’s European
style, Dutch processed cocoa), sucrose, peanut oil, and salt were purchased locally.
Formulation and processing parameters The selection of key ingredients was based on a
survey of popular nutritious drinks and flavored soymilks available in the market. Ingredient
proportions and necessary processing parameters for the beverage preparation were derived from
an extensive literature review on peanut and soy – based milk-type products. Preliminary trials
done were also instrumental in deriving a pilot-plant scale beverage preparation protocol.
81
Product design A three-factor constrained mixture design was developed using peanut
(30.56%-58.70%), soy (28.26%-43.52% either soy flour, SF or soy protein isolate, SPI) and
chocolate syrup (13.04%-25.93%). The lower and upper bound constraints for the primary
components were based on lysine content (51.0 mg/ g protein), viscosity (36.9 mPa s), and visual
stability index (VSI = 1.00). The physical property, VSI is a measure of stability of beverage
sample which is based on the visual separation of solid and liquid phases. The viscosity of
samples was measured instrumentally. The lysine content was obtained from the dietary
reference intake guidelines on essential amino acid consumption (Table 3.2). The viscosity of
commercial chocolate milk (Hershey®’s creamy chocolate milk shake) and visual stability of
commercial cow’s milk were the basis of determination of physical properties of the beverage
developed.
Beverage preparation Base stocks of filtered slurries of peanut flour, soy flour (SF) and soy
protein isolate (SPI) were prepared separately for use in beverage formulations. The pilot-plant
scale processing protocol as shown in Fig. 3.1a, 3.1b and 3.1c was designed.
Preparation of base stocks All the three base stocks, peanut, soy flour, and soy protein isolate,
were prepared separately as per the following steps. Medium roast partially-defatted peanut
flour, defatted soy flour and soy protein isolate were finely ground in a Morehouse mill (Model
M-MS-3, Morehouse Industries, Los Angeles, Calif., U. S. A.). The ground flours (250 g) were
mixed with tap water (2400 g) and homogenized (34474 kPa, room temperature, five passes) in a
laboratory homogenizer (APV Gaulin Homogenizer Model 15 15MR-8TBA, Everett, Mass., U.
S. A.). The homogenized slurries were filtered separately, through 273-mesh filter screen
fabricated from PVC pipe and polyester mesh material (McMaster Co., Fulton Industrial Blvd.,
82
Atlanta, Ga., U. S. A.) having quoted mesh size of 53 microns. The residues collected on the
filter screen were discarded and filtrates stored for use as the base stocks (Fig. 3.1a).
Preparation of chocolate syrup Various ingredients such as water, sucrose, corn syrup,
matlodextrin, cocoa powder, peanut oil, vanilla extract, salt, soy lecithin, artificial chocolate
flavor, and stabilizer (Fig. 3.1b) were mixed in appropriate quantities. [The exact proportions of
these ingredients have not been disclosed since the product being developed is an invention
under review by The University of Georgia Research Foundation, Inc., Athens, Ga., U. S. A.].
The mixture was heated to 75 ºC in a steam kettle, mixing continuously with a hand-held
blender. It was allowed to cool to room temperature and then ready to be used in the beverage.
Processing of beverage The final beverage formulations were prepared using the base stocks of
peanut slurry, soy slurry (either SF or SPI) and chocolate syrup (a liquid blend of various other
ingredients prepared as described in Fig. 3.1b) mixed in predetermined proportions (Fig. 3.1c).
The mixture was heated to 75 ºC in a steam kettle, stirring constantly with a hand-held blender.
It was homogenized (34474 kPa, 72 ºC, three passes) in a laboratory homogenizer and
pasteurized (93 ºC for 1 s) followed by cooling (to about 35 ºC) in a plate heat exchanger
(Armfield FT74, UHT Unit, Airfield Ltd., Ringwood, Hampshire, England, BH24 1 DY). The
beverage was then filled into sterililized, labeled 250 ml bottles and stored at 4 ºC.
Measurement of nutritional and physical properties Nutritional properties of the beverage
were based on lysine content (mg/ g protein) of final beverage formulation. The lysine contents
were calculated based on the compositions of peanut flour, soy flour and soy protein isolate
(Table 3.3) and the estimated percent protein recovery (Table 3.4) in the base stocks. Different
beverage samples prepared using the pilot-plant scale processing protocol were evaluated after
storing overnight as well as for a period of one week. Physical properties - viscosity (η) and
83
visual stability index (VSI) were measured. The viscosity was measured using a Brookfield
Viscometer (Model LVDV-II+, Brookfield Engineering Laboratories, Inc., Stoughton, Mass.)
equipped with small sample adaptor (SSA 18/13R, 25 ºC, 20 rpm). The visual stability index
was measured by taking the ratio of the total height of the beverage to the height of the sediment
collected after separation (Hinds and others 1997a, 1997b).
Percentage protein recovery Percentage protein recovered in the base stocks (filtered protein
slurries) were calculated as shown in Table 3.4. It was based on the amount of flour used as a
starting material, amount of water added and average weight of dry residue collected after
filtration. Following formula was used for the calculation of recovery:
(g of flour as a starting material) – (g of dry residue after filtration) Protein recovery (%) = ---------------------------------------------------------------------------------x 100
(g of total filtrate collected) The respective protein recovery values of peanut (7.69%), soy flour (8.19%), and soy protein
isolate (9.43%) were used to calculate protein and lysine content of mixture of peanut and soy
slurries for different experimental formulations.
Low and high level constraints from lysine content Based on lysine content of 51 mg/g
protein (Table 3.2) as a reference value, high and low constraints of lysine content were
determined as 58.7 mg/g protein (115% of reference value) and 43.4 mg/g protein (85% of
reference value), respectively. In order to get these desired high and low levels of lysine
contents in the final beverage, different amounts of peanut and soy slurries containing the known
amount of protein and lysine contents were used. Details of calculations are given in the
APPENDIX A. From various combinations of peanut and soy slurries it was found that a
combination of 1350 g of peanut slurry and 650 g of soy flour slurry resulted in lysine content of
44.1 mg/ g protein (a value close to lower limit of 43.4 mg/g protein) and another combination of
84
1175 g of peanut slurry and 825 g of soy protein isolate slurry resulted in lysine content of 57.1
mg/g protein (value close to higher limit of 58.7 mg/g protein). Based on these lysine content
values the low and high bound constraints were determined as 825 g and 1350 g for peanut; 650
g and 1175 g for soy, respectively (Table 3.5).
Beverage preparation trials Using the beverage processing protocol described in Fig. 3.1a,
3.1b, and 3.1c preliminary beverage formulation trials were conducted. In high peanut (1350 g)
low soy (650 g) and low peanut (1175 g) high soy (825 g) experimental combinations different
levels of chocolate syrup (300 g, 500 g, and 700 g) were added. These preliminary formulations
were analyzed for viscosity and VSI values (data not reported). Viscosity of commercial
chocolate milk (36.9 m Pa) and VSI of commercial cow’s milk (1.00) was the basis to obtain 300
g as the lower limit and 700 g as the higher limit of chocolate syrup in the beverage. These
limits gave the low and high level constraints of chocolate in the mixture design (Table3.6).
Using the lower and upper bound constraints for peanut, soy and chocolate as given in
Table 3.6 a three component constrained mixture design was obtained. Six mixture proportions
(3 with 13.04% and 3 with 25.93% of chocolate syrup) were selected for experimental beverage
preparation trials. Using these proportions and the beverage processing protocol 12 experimental
beverage formulations were prepared (6 soy flour based and 6 soy protein isolate based). All
these formulations were analyzed for viscosity and VSI properties (Table 3.7).
RESULTS AND DISCUSSION
Development of new beverage product
Processing parameters Earlier work done in our laboratory on peanut beverage preparation
(Hinds and others 1997a, 1997b, 1997c) guided the development process of chocolate-flavored,
peanut-soy beverage. The selection of type of stabilizer (carrageenan) and choice of milling and
85
homogenization operations were based on particle recovery and stabilizer evaluation study
(Deshpande and others 2003). Initial trials for determination of processing steps were done
using mixtures of 50% soy (either flour or isolate) and 50% dark roasted peanut flour. Different
treatments such as Morehouse milling and filtration, homogenization and filtration, and
Morehouse milling, homogenization and filtration indicated that the combination of all three
operations was the best treatment giving smooth mouthfeel to the beverage. These observations
were in agreement with the findings of Mustakas (1974) during the study on LPC (lipid protein
concentrate)-based beverages which mentioned that high pressure homogenization (55158 kPa)
reduced particle size and yielded beverages with better mouthfeel than low-pressure
homogenization (24132 kPa). Also, without the use of both colloidal mill and homogenizer,
poor mouthfeel, higher viscosity, and some sedimentation occurred. Hence peanut flour, soy
flour, and soy protein isolate powder were ground in Morehouse mill, homogenized after mixing
with water, and the slurries were filtered to give base stock slurries of peanut, soy flour and soy
protein isolate (Figure 3.1a). Thus, milling, homogenization, and filtration were important
operating stages of beverage preparation.
Pasteurization in a plate heat exchanger was done in order to increase shelf-life of the
beverage and allow instantaneous cooling while the product is in motion thereby, improving
stability and consistency of the final product. The pasteurization temperature-time conditions
were obtained by referring to Grade “A” Pasteurized Milk Ordinance (PMO). From the various
suggested temperature-time combinations, 93 ºC and 1 s combination was selected. Since the
product contains added ingredients (sweeteners, cocoa powder, flavors etc.) the operating
temperature (93 ºC) was slightly higher (by 4 ºC) than that suggested for milk (89 ºC). Health-
conscious consumers generally like fresh food, so soymilks with mild thermal treatment
86
(pasteurization) would conceivably better suit consumers than those receiving intense thermal
treatment (Wang and others 2001). Wang and others (2001) observed that pasteurized soymilks
were stable for one month with refrigeration storage, and formulations with a combination of
chocolate flavoring and iota-carrageenan gum permitted production of low-heat-treated soymilk
acceptable to consumers. Also, Ang and others (1985) observed that soymilk of high protein
content (~2%) generally undergoes precipitation during sterilization at 120 ºC for 10 to 15 min.
They also observed that there is a tendency to impart a darker color to product which is slightly
intensified during sterilization. Considering such observations, mild heat treatment
(pasteurization at 93 ºC) for short time (1 second) was finalized for this study.
Peanut milk preparation studies done by Rubico and others (1987, 1988, 1989), a
chocolate flavored peanut beverage study by Chompreeda and others (1989), peanut beverage
optimization study by Galvez and others (1990), a study on utilization of peanut extract for
beverage preparation by Rustom and others (1995, 1996), and a roasted peanut beverage
investigations done by Hinds and others (1997) were instrumental in deciding final pilot-plant
scale protocol of the chocolate-flavored, peanut-soy beverage being developed in this study.
Selection of key ingredients Various milk-like beverages have been prepared from aqueous
extracts of oilseeds such as peanuts or soybeans (Lee and Beuchat 1992; Nelson and others
1976). These oilseeds usually contain the base ingredient but sugar, emulsifiers, stabilizers,
additives, and flavors are added to improve the stability and acceptance of the product (Lee and
Rhee 2003). Apart from off-flavor, astringent or bitter aftertaste is another factor contributing to
low acceptability of soymilks, and may explain the reason that many commercial soymilks in the
U. S. are formulated with a variety of adjunct ingredients, cocoa powder, vanilla extract, malt
extract, seaweed extract, β-carotene, gums, and others to improve the palatability of soymilk
87
(Wang and others 2001). In general, physicochemical properties of the beverages are influenced
by many factors including functionality of ingredients, processing conditions, and interactions
between colloidal ingredients (Cano-Ruiz and Richter 1998). Protein-flavor interactions are a
hot topic that continues to spur research at both supplier and research institutes (Brandt 2002).
Sensory analysis results by Wang and others (2001) showed that chocolate and almond
flavorings improved the aroma of soymilks (p <0.05), and addition of gum partially masked the
beany off-flavor. Sensory evaluation and response surface methodology study done by
Chompreeda and others (1989) indicated that the optimum formulation of the chocolate flavored
peanut beverage was obtained by using protein isolate 3.5%, butter fat 3.5%, sugar 8%, cocoa
powder 0.7%, stabilizer 0.1%, and water with all sensory characteristics acceptable in the range
of like to extremely like. A low fat beverage with roasted peanut flavor developed by Hinds and
others (1997a, 1997b, 1997c) was a potential milk-substitute containing 11.8% total solids, 2.0%
fat, and 3.7% protein with whitish orange-yellow color. A formulation developed by Osborn and
others (2003) for chocolate-flavored nutritional beverages had various ingredients like corn
syrup, sucrose, maltodextrin, soy lecithin, cocoa powder and others in water.
To our knowledge, a combination of peanut and soy in the beverage product has not been
previously reported. Also, soy proteins have a major problem of imparting beany flavor (Rackis
and others 1979; Roberts 2003). Wang and others (2001) observed that panelists preferred
flavored soymilk over plain soymilk, and they liked chocolate flavor better than other flavors.
Also, chocolate has ability to mask protein flavor and provide a smooth profile (Brandt 2002).
However, the important factor, while using cocoa powder as an ingredient in liquid products, is
the stability. Maintaining a continuous network formed by interaction of protein and protein
covered cocoa particles in the presence of a suitable stabilizer (carrageenan) helps to prevent
88
sedimentation and to some extent segregation (Vliet and Hooydonk 1984; Boomgaard and others
1987). Carrageenan’s high degree of reactivity with proteins which results in a three-
dimensional network holding cocoa powder in suspension at levels as low as 0.25% makes it
especially valuable, and for this reason, kappa-carrageenan is found in majority of flavored
refrigerated dairy-and soy-based beverages, its effectiveness being enhanced through addition of
other hydrocolloids imparting viscosity (Klahorst 2002).
Hence, after finalizing the operating conditions for the beverage processing, various
pilot-plant scale beverage preparation trials were performed to derive suitable ingredient
proportions [The exact proportions of these ingredients and data related to these trials have not
been reported since the product being developed is an invention under review by The University
of Georgia Research Foundation, Inc., Athens, Ga., U. S. A.]. The key ingredients (Table 3.1)
for the experimental trials were selected from the most common ingredients listed on nutritional
beverage products available in the market and their respective functional advantages.
The ingredient proportions except for the protein sources were based on the beverage
preparation trials using 50% peanut (dark and medium roasted flours) and 50% soy sources. The
preliminary sensory evaluation by the members of our laboratory (data not reported) indicated
that medium roasted peanut flour gave better flavor and aftertaste. The sensory attributes along
with viscosity and visual stability measurements were helpful in deciding the amounts of
stabilizer, emulsifier, oil, sweeteners and flavoring agents. However, it was observed that the
proportions of peanut, soy and all other ingredients were interdependent. This observation led to
a mixture design approach for the experimental trials. A mixture experiment is an experiment in
which the response is a function only of the proportions of the components (constituents) present
in the mixture and is not a function of the total amount of the mixture (Cornell 1973). Therefore,
89
the beverage ingredients were grouped into three major components as peanut, soy and
chocolate. The two components peanut and soy represent the base stocks and the third
component chocolate represent chocolate syrup obtained by the definite protocols developed as
shown in Fig. 3.1a,3.1b,3.1c. The determination of acceptable ranges of these three major
components in the mixture design (Table 3.6) based on physical properties of beverage (Table
3.7) was done by further trials on the beverage preparation.
Mixture design approach and determination of high and low level constraints It was
observed from the beverage preparation trials (Table 3.7) that very low levels of chocolate syrup
resulted in poor suspension of particles in the beverage, on the other hand very high amounts
resulted in very thick formulations as compared to the control (Hershey®’s creamy chocolate
milk shake). Thus, the chocolate syrup (the liquid blend of various other ingredients prepared as
described in Fig. 3.1b) had a functional as well as flavor role. However, it is most probably
specific components of the syrup such as sucrose, corn syrup, maltodextrin, soy lecithin, and
stabilizer that had this effect. Higher proportions of peanut and soy also resulted in thicker
formulations due to increased concentrations of proteins which play important role during heat
treatment. In a peanut beverage study done by Rubico and others (1988) viscosity (55-1950 mPa
s) was dependent on composition, homogenization pressure, and temperature; temperature
significantly affecting viscosity probably due to changes in protein and carbohydrate structures.
In agreement to findings of Rustom and others (1996) a possible cause of gelation in chocolate-
flavored peanut beverages could be interaction of peanut protein with polysaccharide thickening
agent (carragennan) leading to aggregation of molecules and subsequently increasing the
viscosity. As observed by Hinds and others (1997a, 1997b, 1997c) stability, viscosity, and
mouthfeel characteristics of peanut beverage were dependent upon amount and type of stabilizer
90
used, heating and cooling protocols, protein-lipid concentrations, and particle size. In agreement
to the fact stated by Brandt (2002) that protein denaturation or the unfolding of the three-
dimensional protein structure resulting from chemical or heat, altered the binding sites for flavor
molecules, and protein could bind more or less of a flavor compound depending upon the amount
of heat treatment. The protein sources also imparted off-flavor at higher proportions.
Therefore, desirable range of all the key ingredients which can result in an acceptable
beverage product was of interest. The choice of constraints is crucial because the constraints on
the individual factors influence the design (Gorman 1966). Often in exploratory work the
constraints can not be set precisely and, in fact, may have to be estimated experimentally
(Gorman 1966). Hence, the lower and upper bound constraints of three major components
(peanut, soy, and chocolate syrup) in this study were based on three factors:
1) Lysine content
2) Viscosity and
3) Visual stability index
Lysine content Since peanut is mainly deficient in lysine and soy is a good
complementary lysine source, an essential amino acid, lysine was chosen as the basis for
deriving a range of the best combinations of peanut and soy that can be expected to result in a
nutritionally superior beverage product. Lysine content in mg/g protein of experimental
beverage formulations was calculated as explained in APPENDIX A.
The comparison of different lysine content values of different combinations of peanut and
soy slurries was done. The high (58.7 mg/g protein) and low (43.4 mg/g protein) constraints of
lysine content were basis for this comparison. This resulted into maximum and minimum
quantities of peanut and soy slurries that can be used in the beverage. The highest amount of

91
peanut slurry (1350 g) that can be added to the lowest amount of soy slurry (625 g) resulted into
44.1 and 50.2 mg/g protein for SF and SPI formulations, respectively. Similarly the lowest
amount of peanut slurry (825 g) added to the highest amount of soy slurry (1125 g) resulted into
50.8 and 57.1 mg/g of protein for SF and SPI, respectively. The calculated values were close to
the reference value of 51 mg/g protein.
Essential amino acid composition of peanut protein products showed that lysine contents
(g/100 g protein) of peanut kernel, flour, protein concentrate, protein isolate were 3.5, 4.0, 2.9,
and 3.0, respectively, as against the FAO pattern of 5.5 (Natarajan 1980). Another study done by
Ang and others (1985) showed that lysine content (mg/g of protein) was 70, 76, 87, 76, and 72 in
whole egg, cow’s milk, human milk, soymilk, and spray dried soymilk powder, respectively,
with lysine requirement for an adult being 500 (male)-800 (female) mg/day. From the amino
acid profiles of peanut beverages developed by Rubico and others (1989), it was observed that
raw peanut extract had lysine content (g/100 g protein) of 4.31, for 71 ºC homogenized peanut
milk it was 5.16, and it decreased to the range of 2.88-3.81 for samples processed at higher
temperatures and time conditions (85 ºC, 100 ºC, and 121 ºC for 15 min, and 121 ºC for 3 sec).
It was suggested that various heat treatments can affect some amino acids; however, actual
significance of the apparent changes in the lysine content was not clear in the absence of
biological data. These lysine content values in the literature indicated that those estimated in this
study (Table 3.5) were in the expected range and close to the reference lysine content value of 51
mg/g protein (Table 3.2).
Viscosity and visual stability index It was found that visual stability index (VSI) and
viscosity (η) values ranged from 0.87-0.99 and 17.7-131.8 mPa s, respectively (Table3.7). It can
be observed that the visual stability was improved by the addition of carrageenan since VSI
92
values closer to commercial cows milk (VSI = 1.00) as compared to VSI of peanut beverage
(0.49-0.71) prepared by Hinds and others (1997a, 1997b, and 1997c). Table 3.7 showed that the
new product being developed had stability values similar to that of cow’s milk (VSI = 1.00), and
viscosity values comparable to that of commercial chocolate milk (η = 36.9 mPa s).
The estimated range of lysine contents from 44.1 to 57.1 mg/g protein resulted in the trial
formulations having viscosity and visual stability values ranging from 17.7 to131.8 mPa s and
0.63 to 0.99, respectively. In this way, based on the estimated lysine contents and measured
values of physical properties of beverage formulations, peanut range of 825 g-1350 g, soy range
of 650 g-1175 g, and chocolate range of 300 g-700 g ultimately gave the lower and upper bound
constraints of the mixture design as 30.56%-58.70%, 28.26%-43.52%, and 13.04%-25.93%,
respectively (Table 3.6).
The purpose of finding low and high level constraints for three major components of the
mixture design was obtaining the range of possible number of mixture formulations in order to
study the acceptability of the new product being developed in this study. The pilot-plant scale
protocol developed in this study will help in obtaining different beverage formulations
repetitively without variations in the method of preparation. The chocolate-flavored, peanut-soy
beverage thus developed is expected to have improved nutritional and sensory properties because
of the combination of low cost, easily available peanut protein, high quality soy protein and
popular chocolate flavor. Further study on consumer acceptability and nutritional characteristics
of the chocolate-flavored, peanut-soy beverage will help ensuring the success of the new product
developed in this study.

93
Future work
The extreme vertices design will be developed as a procedure for conducting experiments with
mixtures since several factors have constraints placed on them (McLean and Anderson 1966).
The experimental points will be obtained by using such extreme vertices design. All those
formulations will then be subjected to consumer affective sensory evaluation in order to study
sensory attributes of the new product developed and know its acceptability among the target
consumers. Hence, the future work of this study will be conducting sensory evaluation of the
new product developed and studying its consumer acceptability.
CONCLUSIONS
A chocolate-flavored, peanut-soy beverage was developed by utilizing two oilseed protein
sources: peanut and soy. The key ingredients were selected; the formulation and processing
parameters were obtained to develop a pilot-plant scale beverage processing protocol useful for
further study on sensory attributes of the beverage. The lysine contents were estimated to be in
the range of 44.1-57.1 (mg/g protein) as compared to the desired value of 51.0 mg/g protein.
The viscosity (η) values of the trial formulations were in the range of 17.7-131.8 mPa s as
compared to commercial chocolate milk (Hershey®’s creamy chocolate milk shake) viscosity
measured as 36.9 mPa s. The visual stability index (VSI) values of trial formulations were also
found to be in the range of 0.63-0.99 which was close to that of commercial cow’s milk value of
1.00. The ranges of lysine content, η and VSI values resulted into the low and high level
constraints for a three factor mixture design. The three major components of this mixture design
were peanut, soy and chocolate syrup (a liquid blend of various other ingredients) with low and
high level constraints as 30.56%-58.70%, 28.26%-43.52% and 13.04%-25.93%, respectively.
94
REFERENCES
Ang HG, Kwik WL, and Theng CY. 1985. Development of soymilk- A review. Food
Chemistry 17:235-250.
Boomgaard T van den, Vliet T van, and Hooydonk ACM van. 1987. Physical stability of
chocolate milk. International Journal of Food Science and Technology 22:279-291.
Brandt LA. 2002. Pouring on flavor in beverages. Prepared Foods October:53-64. Available
from www.preparedfoods.com.
Cano-Ruiz ME and Richter RL. 1998. Changes in physicochemical properties of retort
sterilized dairy beverages during storage. Journal of Dairy Science 81:2116-2123.
Chandrasekhara MR, Ramanna BR, Jagannath KS, and Ramanathan PK. 1971. Miltone-
Vegetable toned milk: Use of peanut protein expands supply of milk. Food Technology
25(June):596-598.
Chompreeda P, Haruthaithanasan V, Oupadissakoon C and Suknak K. 1989. A research note:
Development of a chocolate flavored peanut beverage. Journal of Food Science 54(5):1359-
1360.
Cornell JA. 1973. Experiments with mixtures: A review. Technometrics 15(3):437-455.
Deshpande RP, Phillips RD, and Chinnan MS. 2003. Recovery of fine particles and stability of
beverages developed from peanut and soy. 2003 IFT Annual Meeting Book of Abstracts
14F-33:42.
Galvez FCF, Resurreccion AVA, and Koehler PE. 1990. Optimization of processing of peanut
beverage. Journal of Sensory Studies 5:1-17.
Gonzalez E and Draganchuk M. 2003. Flavoring nutrition bars. Cereal Foods World 48(5):250-
251.
95
Gorman JW. 1966. Discussion of “Extreme Vertices Design of Mixture Experiments” by R. A.
McLean and V. L. Anderson. Technometrics 8(3):455-456.
Hinds MJ, Beuchat LR, and Chinnan MS. 1997a. Properties of a thermal-processed beverage
prepared from roasted partially defatted peanuts. International Journal of Food Science and
Technology 32:203-211.
Hinds MJ, Beuchat LR, and Chinnan MS. 1997b. Effects of homogenization pressure and
stabilizers on some physical characteristics of a beverage prepared from partially defatted,
roasted peanuts. Plant Foods for Human Nutrition 50:269-277.
Hinds MJ, Beuchat LR, and Chinnan MS. 1997c. Particle size distribution in a heat-processed
beverage prepared from roasted peanuts. Food Research International 30(1):59-64.
Klahorst SJ. 2002. Beverage viscosity, any way you like it! Available from
http://www.foodproductdesign.com/archive/2002/0102AP.html. Accessed on 11/15/02.
Lee C, Beuchat LR. 1992. Chemical, physical and sensory characteristics of peanut milk as
affected by processing conditions Journal of Food Science 57:401-405.
Lee SW and Rhee C. 2003. Processing suitability of a rice and pine nut (Pinus koraiensis)
beverage. Food Hydrocolloids 17:379-385.
McLean RA and Anderson VL. 1966. Extreme vertices design of mixture experiments.
Technometrics 8(3):447-454.
Mustakas GC. 1974. A new soy lipid-protein concentrate for beverages. Cereal Science Today
19(2):62-73.
Natarajan KR. 1980. Peanut protein ingredients: Preparation properties and food uses.
Advanced Food Research 26:216-273.
96
National Academies Press (NAP). 2002. Protein and amino acids (Chapter 10). In: Dietary
Reference Intakes for Energy, Carbohydrate, Fiber, Fat, Fatty Acids, Cholesterol, Protein,
and Amino Acids (Macronutrients). p 465-608. Available from
http://www.nap.edu/books/0309085373/html. Accessed on 09/ 2003.
Nelson AI, Steinberg MP, and Wei LS. 1976. Illinois process for preparation of soymilk.
Journal of Food Science 41:57-61.
Osborn HT, Shewfelt RL, and Akoh CC. 2003. Sensory evaluation of a nutritional beverage
containing canola oil/caprylic acid structural lipid. Journal of the American Oil Chemists
Society 80(4):357-360.
Rackis JJ, Sessa DJ, and Honig DH. 1979. Flavor problems of vegetable food proteins. Journal
of American Oil Chemists’ Society 56(March):262-271.
Riaz MN. 1999. Soybeans as functional foods. Cereal Foods World 44(2):88-92.
Roberts WA, Jr. 2003. Ingredients in use: soy proteins. (formulation & ingredient challenges).
Prepared Foods. October. Available from www.preparedfoods.com. Accessed on
01/17/2004.
Rubico SM, Resurreccion AVA, Frank JF, and Beuchat LR. 1987. Suspension stability, texture,
and color of high temperature treated peanut beverage. Journal of Food Science 52(6):1676-
1679.
Rubico SM, Phillips RD, Resurreccion AVA, and Beuchat LR. 1988. Comparison of sensory
properties and headspace volatiles of a peanut beverage processed at different temperature
and time conditions. Journal of Food Science 53(1):176-180.
97
Rubico SM, Phillips RD, Resurreccion AVA, and Beuchat LR. 1989. Nutritional,
microbiological, and sensory qualities of a peanut beverage prepared using various processes.
Journal of Food Science 54(6):1540-1543.
Rustom IYS, Lopez-Leival MM, and Nair BM. 1995. UHT-Sterilized peanut beverages:
changes in physicochemical properties during storage. Journal of Food Science 60(2):378-
383.
Rustom IYS, Lopez-Leival MM, and Nair BM. 1996. UHT-Sterilized peanut beverages:
kinetics of physicochemical changes during storage and shelf-life prediction modeling.
Journal of Food Science 61(1):198-203, 208.
Singh B and Singh U. 1991. Peanut as a source of protein for human foods. Plant Foods for
Human Nutrition 41:165-177.
Sloan AE. 2003. Sea change in the beverage business. Food Technology 57(12):20.
Tockman J. 2002. Capitalizing on increasing consumer interest in soy protein. Cereal Foods
World 47(5):172-174.
United States Department of Agricultural- National Agricultural Library (USDA-NAL). 2003.
USDA Nutrient Database for Standard Reference, Release 16. Available from
http://www.nal.usda.gov/fnic/cgi-bin/nut_search.pl. Accessed on 07/2003.
Vliet T van and Hooydonk ACM van. 1984. The gel properties of some beverages.
Proceedings of the 9th International Congress on Rheology, Mexico 4:115-122.
Wang B, Xiong YL, and Wang C. 2001. Physicochemical and sensory characteristics of
flavored soymilk during refrigeration storage. Journal of Food Quality 24:513-526.
98
ACKNOWLEDGEMENTS
This research study was funded by the United States Agency for International Development/
Peanut Collaborative Research Support Program (USAID/Peanut CRSP) Grant #LAG-G-00-96-
90013-00. The technical assistance, valuable guidance, and contribution in product development
by Mr. Glenn Farrell, Research Coordinator, Department of Food Science and Technology,
University of Georgia, Griffin, Ga., is greatly appreciated.
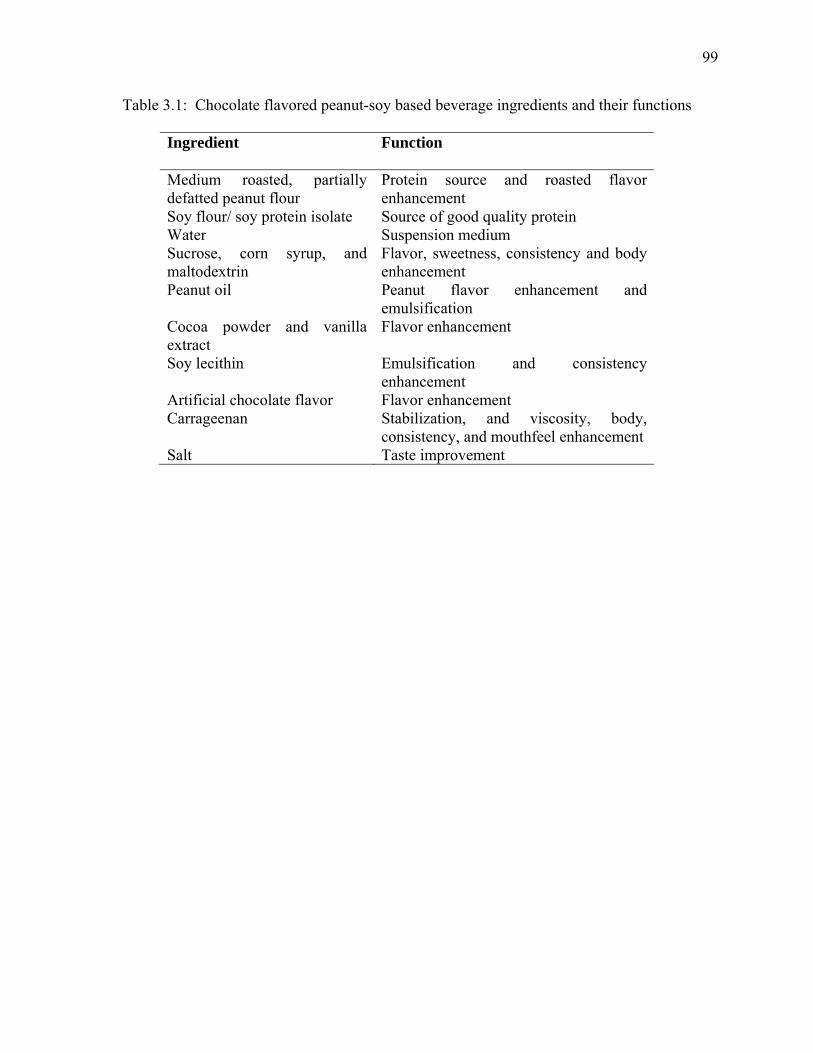
99
Table 3.1: Chocolate flavored peanut-soy based beverage ingredients and their functions
Ingredient Function
Medium roasted, partially defatted peanut flour
Protein source and roasted flavor enhancement
Soy flour/ soy protein isolate Source of good quality protein Water Suspension medium Sucrose, corn syrup, and maltodextrin
Flavor, sweetness, consistency and body enhancement
Peanut oil Peanut flavor enhancement and emulsification
Cocoa powder and vanilla extract
Flavor enhancement
Soy lecithin Emulsification and consistency enhancement
Artificial chocolate flavor Flavor enhancement Carrageenan Stabilization, and viscosity, body,
consistency, and mouthfeel enhancement Salt Taste improvement
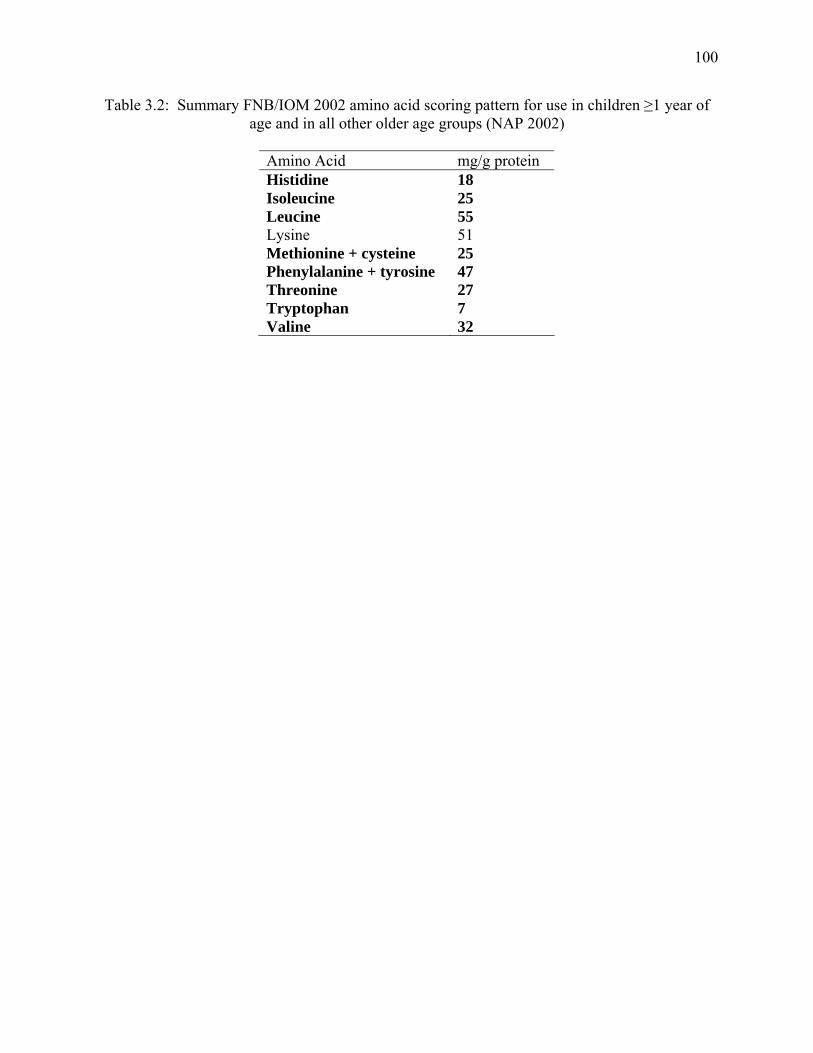
100
Table 3.2: Summary FNB/IOM 2002 amino acid scoring pattern for use in children ≥1 year of age and in all other older age groups (NAP 2002)
Amino Acid mg/g protein Histidine 18 Isoleucine 25 Leucine 55 Lysine 51 Methionine + cysteine 25 Phenylalanine + tyrosine 47 Threonine 27 Tryptophan 7 Valine 32
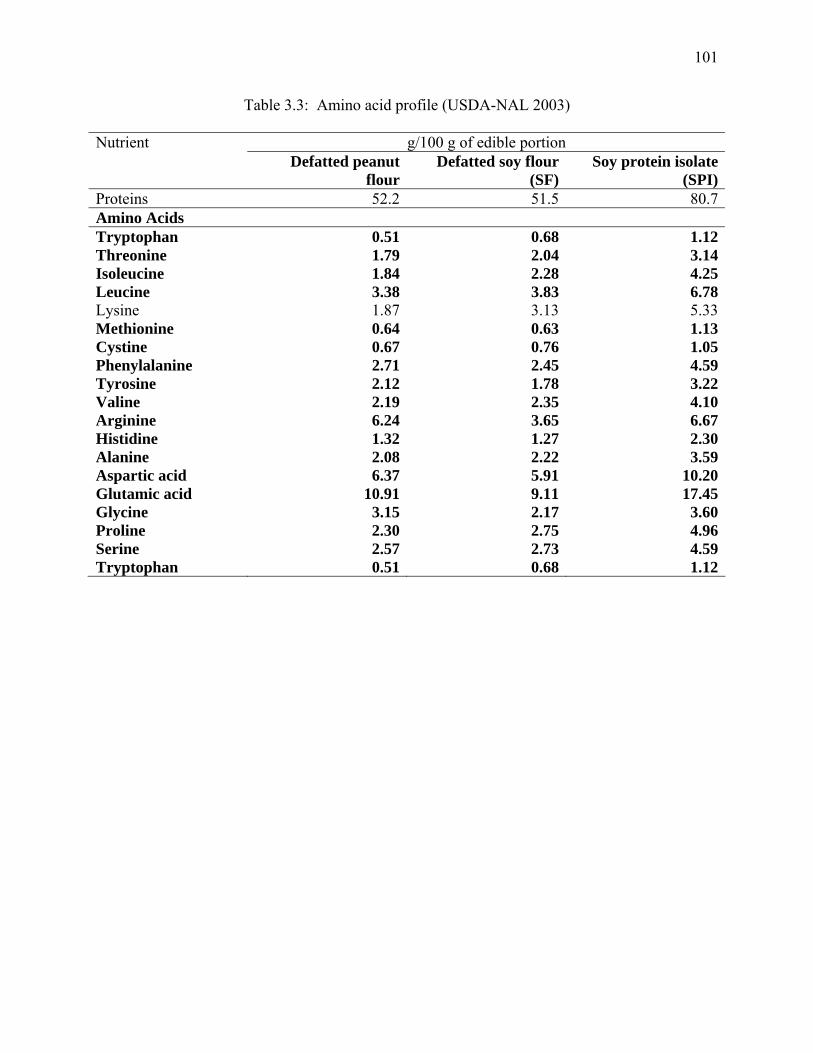
101
Table 3.3: Amino acid profile (USDA-NAL 2003) Nutrient g/100 g of edible portion Defatted peanut
flourDefatted soy flour
(SF)Soy protein isolate
(SPI)Proteins 52.2 51.5 80.7Amino Acids Tryptophan 0.51 0.68 1.12Threonine 1.79 2.04 3.14Isoleucine 1.84 2.28 4.25Leucine 3.38 3.83 6.78Lysine 1.87 3.13 5.33Methionine 0.64 0.63 1.13Cystine 0.67 0.76 1.05Phenylalanine 2.71 2.45 4.59Tyrosine 2.12 1.78 3.22Valine 2.19 2.35 4.10Arginine 6.24 3.65 6.67Histidine 1.32 1.27 2.30Alanine 2.08 2.22 3.59Aspartic acid 6.37 5.91 10.20Glutamic acid 10.91 9.11 17.45Glycine 3.15 2.17 3.60Proline 2.30 2.75 4.96Serine 2.57 2.73 4.59Tryptophan 0.51 0.68 1.12
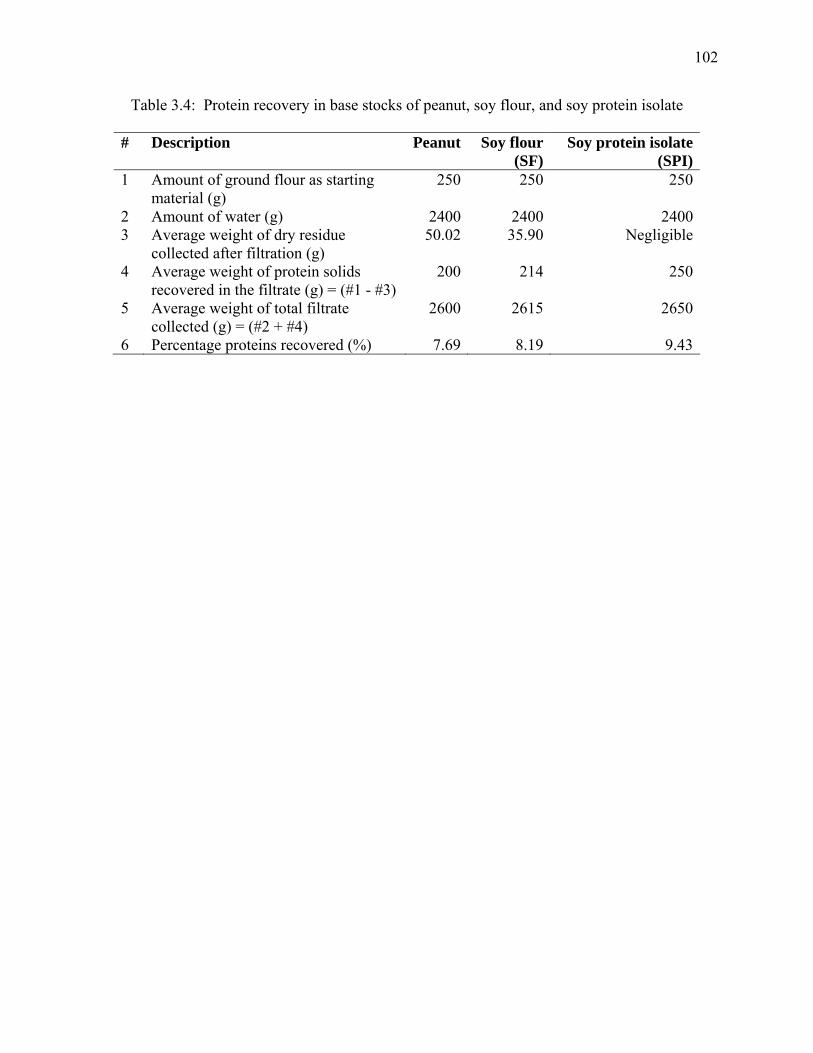
102
Table 3.4: Protein recovery in base stocks of peanut, soy flour, and soy protein isolate
# Description Peanut Soy flour(SF)
Soy protein isolate(SPI)
1 Amount of ground flour as starting material (g)
250 250 250
2 Amount of water (g) 2400 2400 2400 3 Average weight of dry residue
collected after filtration (g) 50.02 35.90 Negligible
4 Average weight of protein solids recovered in the filtrate (g) = (#1 - #3)
200 214 250
5 Average weight of total filtrate collected (g) = (#2 + #4)
2600 2615 2650
6 Percentage proteins recovered (%) 7.69 8.19 9.43
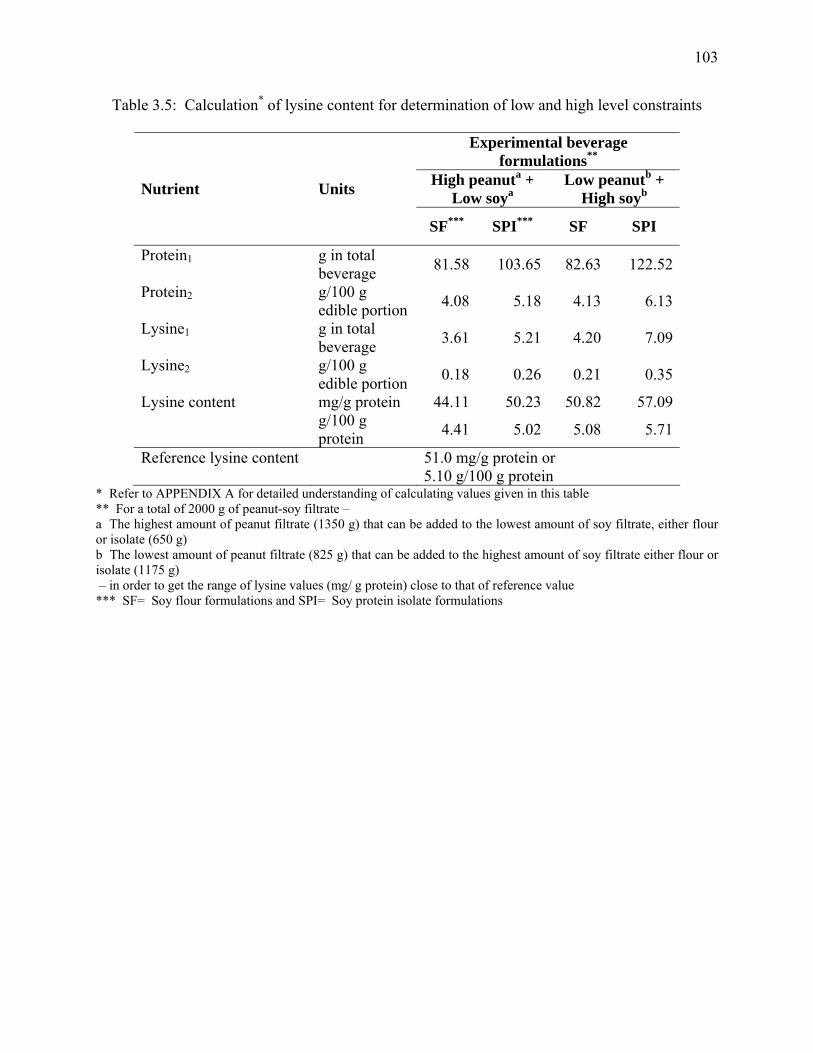
103
Table 3.5: Calculation* of lysine content for determination of low and high level constraints
Experimental beverage formulations**
High peanuta + Low soya
Low peanutb + High soyb Nutrient Units
SF*** SPI*** SF SPI
Protein1 g in total beverage 81.58 103.65 82.63 122.52
Protein2 g/100 g edible portion 4.08 5.18 4.13 6.13
Lysine1 g in total beverage 3.61 5.21 4.20 7.09
Lysine2 g/100 g edible portion 0.18 0.26 0.21 0.35
mg/g protein 44.11 50.23 50.82 57.09Lysine content g/100 g
protein 4.41 5.02 5.08 5.71
Reference lysine content 51.0 mg/g protein or 5.10 g/100 g protein
* Refer to APPENDIX A for detailed understanding of calculating values given in this table ** For a total of 2000 g of peanut-soy filtrate – a The highest amount of peanut filtrate (1350 g) that can be added to the lowest amount of soy filtrate, either flour or isolate (650 g) b The lowest amount of peanut filtrate (825 g) that can be added to the highest amount of soy filtrate either flour or isolate (1175 g) – in order to get the range of lysine values (mg/ g protein) close to that of reference value *** SF= Soy flour formulations and SPI= Soy protein isolate formulations
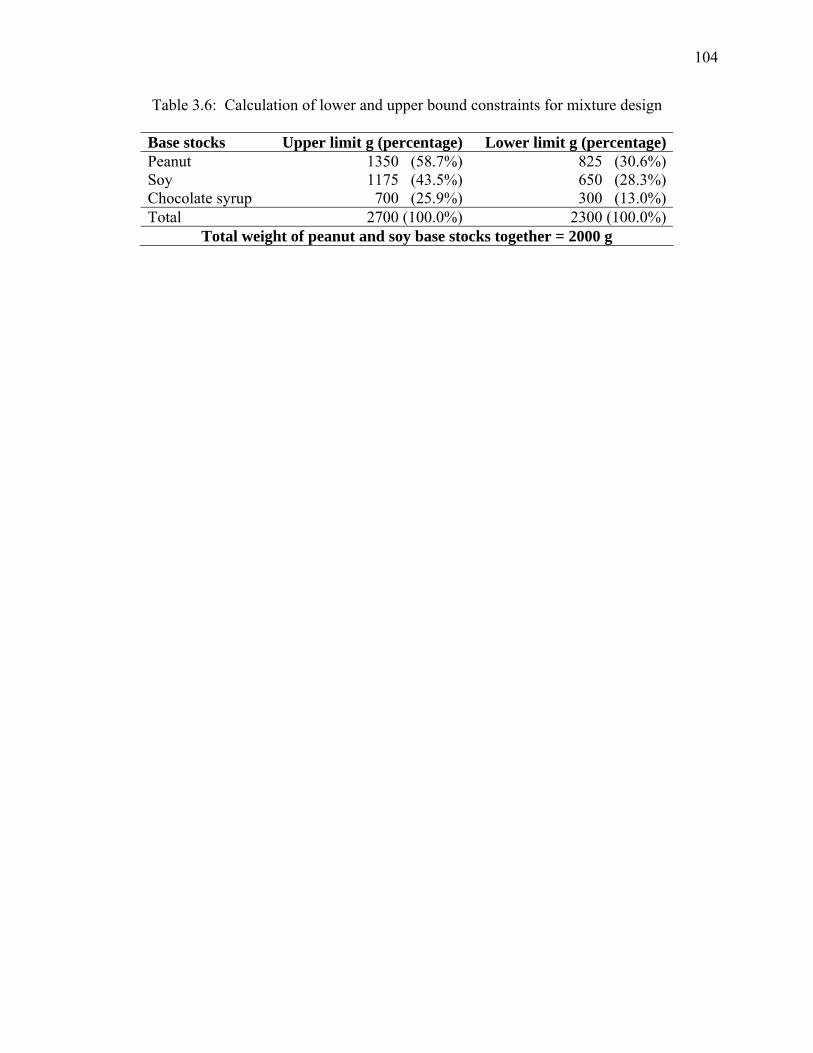
104
Table 3.6: Calculation of lower and upper bound constraints for mixture design
Base stocks Upper limit g (percentage) Lower limit g (percentage)Peanut 1350 (58.7%) 825 (30.6%)Soy 1175 (43.5%) 650 (28.3%)Chocolate syrup 700 (25.9%) 300 (13.0%)Total 2700 (100.0%) 2300 (100.0%)
Total weight of peanut and soy base stocks together = 2000 g
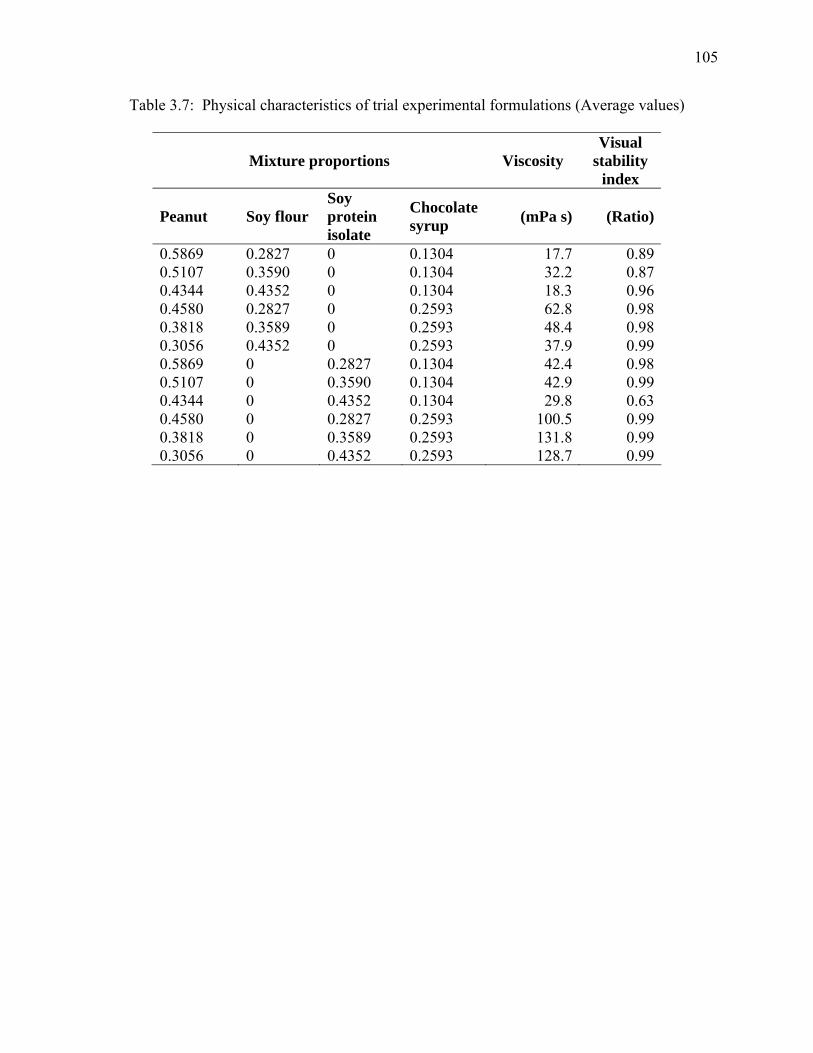
105
Table 3.7: Physical characteristics of trial experimental formulations (Average values)
Mixture proportions Viscosity Visual
stability index
Peanut Soy flour Soy protein isolate
Chocolate syrup (mPa s) (Ratio)
0.5869 0.2827 0 0.1304 17.7 0.890.5107 0.3590 0 0.1304 32.2 0.870.4344 0.4352 0 0.1304 18.3 0.960.4580 0.2827 0 0.2593 62.8 0.980.3818 0.3589 0 0.2593 48.4 0.980.3056 0.4352 0 0.2593 37.9 0.990.5869 0 0.2827 0.1304 42.4 0.980.5107 0 0.3590 0.1304 42.9 0.990.4344 0 0.4352 0.1304 29.8 0.630.4580 0 0.2827 0.2593 100.5 0.990.3818 0 0.3589 0.2593 131.8 0.990.3056 0 0.4352 0.2593 128.7 0.99
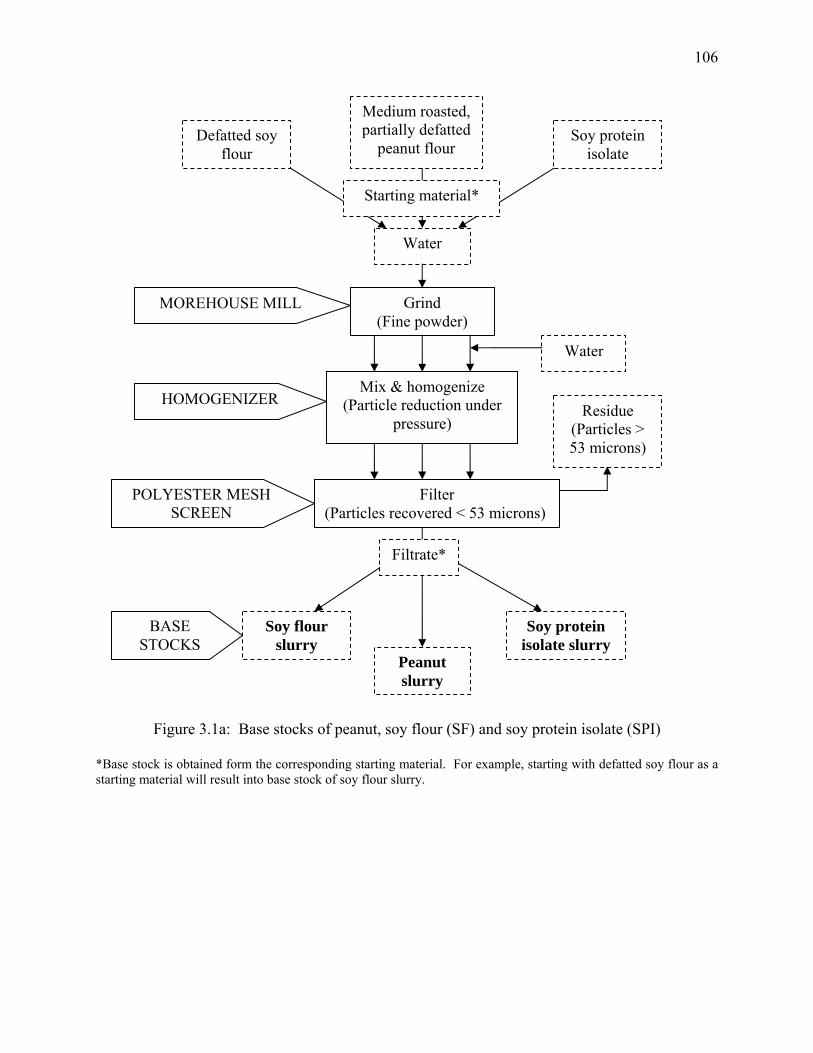
106
Defatted soy flour
Soy protein isolate
MOREHOUSE MILL
HOMOGENIZER
Grind (Fine powder)
Mix & homogenize (Particle reduction under
pressure)
Water
Filter (Particles recovered < 53 microns)
POLYESTER MESH SCREEN
Peanut slurry
Medium roasted, partially defatted
peanut flour
Soy flour slurry
Soy protein isolate slurry
Residue (Particles > 53 microns)
BASE STOCKS
Water
Starting material*
Filtrate*
Figure 3.1a: Base stocks of peanut, soy flour (SF) and soy protein isolate (SPI)
*Base stock is obtained form the corresponding starting material. For example, starting with defatted soy flour as a starting material will result into base stock of soy flour slurry.
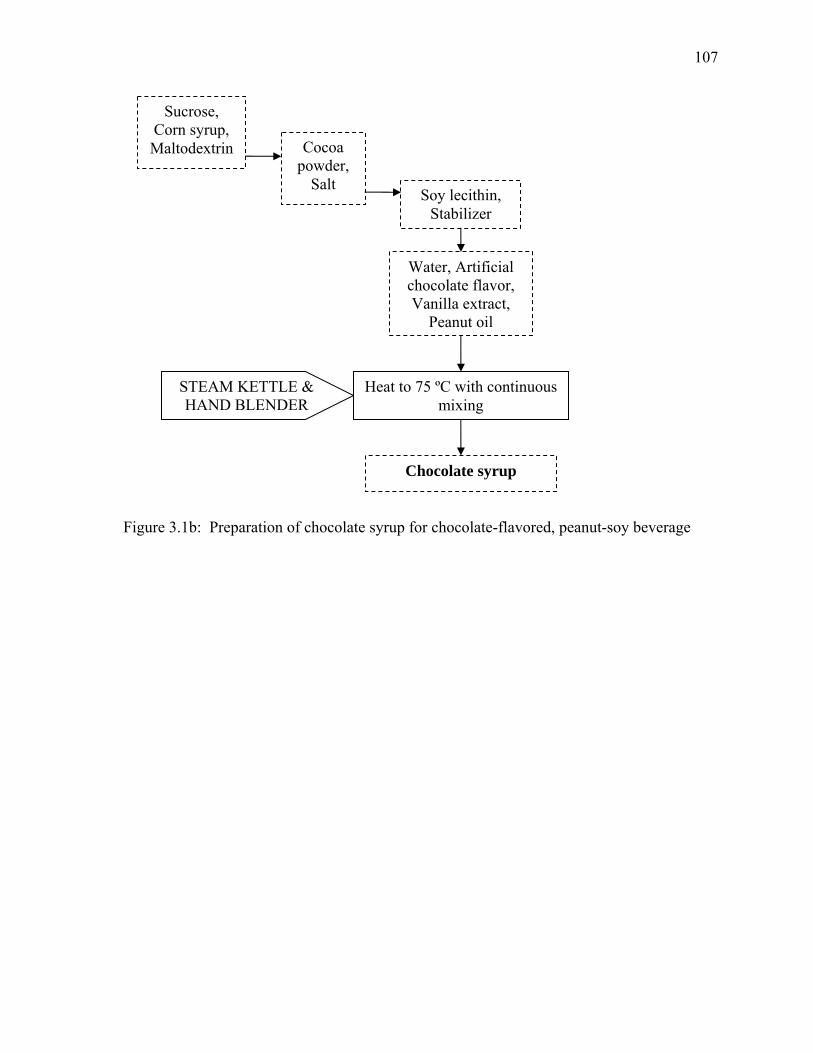
107
Chocolate syrup
Heat to 75 ºC with continuous mixing
STEAM KETTLE & HAND BLENDER
Sucrose, Corn syrup, Maltodextrin Cocoa
powder, Salt
Water, Artificial chocolate flavor, Vanilla extract,
Peanut oil
Soy lecithin, Stabilizer
Figure 3.1b: Preparation of chocolate syrup for chocolate-flavored, peanut-soy beverage
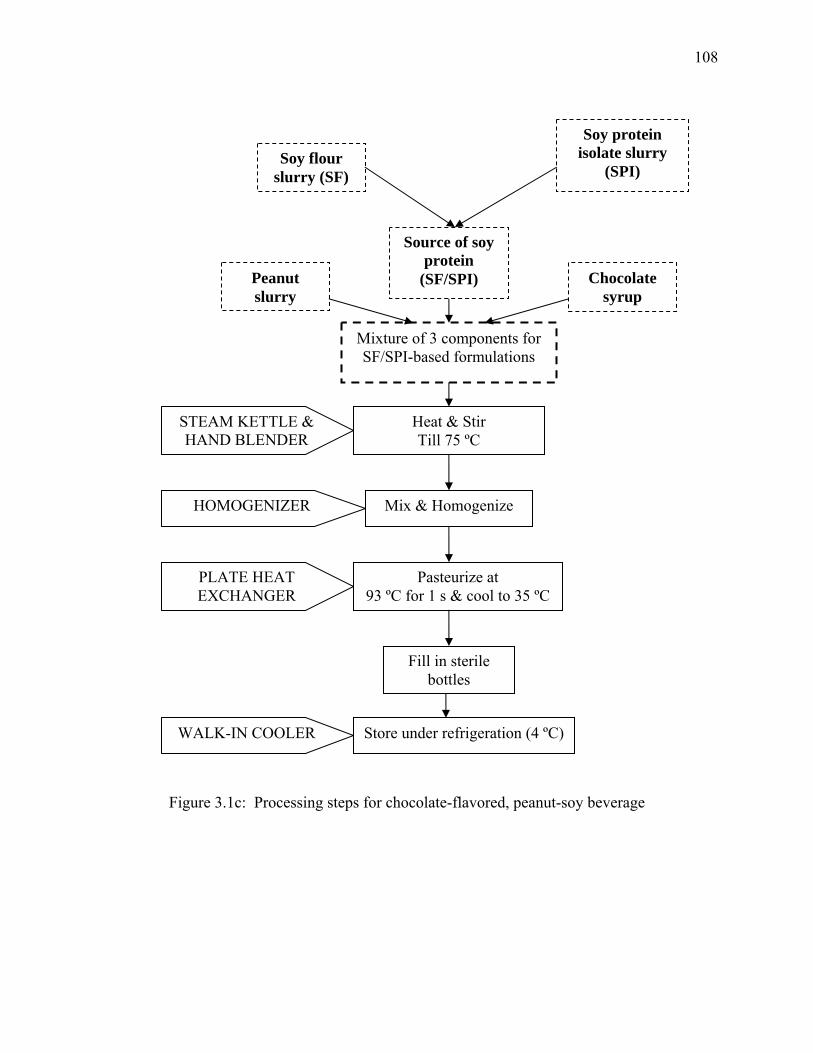
108
Mixture of 3 components for SF/SPI-based formulations
Heat & Stir Till 75 ºC
STEAM KETTLE & HAND BLENDER
Mix & Homogenize HOMOGENIZER
Pasteurize at 93 ºC for 1 s & cool to 35 ºC
PLATE HEAT EXCHANGER
WALK-IN COOLER
Peanut slurry
Soy flour slurry (SF)
Soy protein isolate slurry
(SPI)
Source of soy protein
(SF/SPI) Chocolate syrup
Store under refrigeration (4 ºC)
Fill in sterile bottles
Figure 3.1c: Processing steps for chocolate-flavored, peanut-soy beverage
109
CHAPTER 4
SENSORY ATTRIBUTES AND CONSUMER ACCEPTABILITY OF
NEW CHOCOLATE-FLAVORED PEANUT-SOY BEVERAGE1
_______________________________
1 Deshpande, R. P., Chinnan, M. S., and McWatters, K. H. To be submitted to the Journal of Food Science.
110
ABSTRACT
A chocolate-flavored peanut-soy beverage was investigated for nine sensory attributes
employing consumer affective sensory evaluation. Twenty-eight beverage formulations with
commercial chocolate milk as a control, were evaluated by untrained panelists (n=41) using a 9-
point hedonic scale (1=dislike extremely; 9=like extremely). Mean ratings for the control were
between 6 (like slightly) and 7 (like moderately). Formulation #8 having 43.9% peanut, 36.3%
soy protein isolate (SPI), and 19.8% chocolate syrup had highest consumer acceptability. As
compared to the control, it was rated significantly higher for appearance, color, and sweetness.
SPI- based formulations #7, #6, and soy flour-based formulation #14 had the highest mean
ratings for color (7.0), aroma (6.2), and flavor (6.0), respectively.
INDEX WORDS: Chocolate-flavored peanut-soy beverage, Sensory evaluation, Chocolate
milk, Hedonic scale, Consumer acceptability
111
INTRODUCTION
Product development is a part of business strategy as well as a research method in the food
industry. It is the starting point for the introduction of a new product and the continuous
improvement of a product (Earle 1997). It has always been the heart of the food industry where
rapid technological changes, accompanied by a steady increase in the standard of living, resulted
in even greater opportunities for product development. Insight into new product development is
hinged on insights into human needs (Desrosier and Desrosier 1971). Consumer needs/desires
are a major driving force of new food product development, and perceptions about food form the
basis of those perceived desires (Bursey 1983). Today’s food consumers have adopted different
patterns of food consumption suitable to their more mobile and diversified lifestyles; hence the
task of the food system is changing from “bringing the consumer to the food” to “bringing the
food to the consumer” (Brody and others 2000). The sequence of activities leading to the
introduction of a successful new product into today’s highly competitive marketplace is founded
on extensive and ongoing market research which elicits and defines the changing consumer
needs (Bursey 1983).
The beverage business is taking a new shape. The beverage industry is focusing more on
consumer desires and looking for alternative product options suitable for a changing
marketplace. Recently, beverage products have created new categories and a whole new
business through innovative product options. Ready-to-eat, packaged for on-the-go, high protein
drinks and meal replacers are some of the top trends consumers are willing to try over the next
few years (Sloan 2003a). As a part of convenience and single serving choices, “meals in
motion” are becoming more and more popular. Changing life-styles and eating preferences have
inspired a new generation of portable products. Health awareness follows the trend of
112
convenience while choosing suitable food products from a variety of options available.
Consumers want access to novel and interesting foods that are fresh, convenient, and tasty.
Health is important but not at the expense of flavor. The explosion of scientific information
relating diet to health, coupled with the rapid communication of that knowledge to the consumer,
has provided a challenge to the American food industry (Bursey 1983). The desire for good
health and the concern over carbonated soft drink consumption have driven consumers to juice
and juice drinks (Sloan 2003b). Healthier product alternatives, including juice/soy combinations,
juice/fruit/dairy smoothies, fortified juices/drinks, and organic drinks, are among those enjoying
rapid growth (Sloan 2003b) with 28% of Americans consuming soy foods or soy beverages once
a week or more (Ohr 2003). Functional beverages is an altogether new category showing
increase in sales indicating that today’s health issues drive sales as well. “Better for you”
products can help boost beverage sales and have great applications in the beverage industry.
Overall, consumers are looking to lead healthier lives, and the beverage industry has tremendous
potential for future developments; this is creating a wave of innovative terminologies such as
flavored milks, energy beverages, liquid meal-replacements, weight directed products, ready-to-
drink meals, and functional beverages.
The nature of change in the beverage industry is remarkable; this changing scenario poses
a challenge for the industry as well as opportunity for new product development. However, if a
food product cannot be re-engineered or modified to fulfill the consumer desire and ultimately
the demand for the product, thus meeting the benchmark goals, it will not succeed (Robinson
2000). Food quality is in the mind of the observer, response to food quality may be a
conditioned response which is subject to many variables outside the control of the food processor
(Lund 1982). Although commercially processed foods must attract the consumer by the
113
appearance of the package, repeat purchases will depend on how pleasing a sensory experience is
perceived when the product is eaten. And based on the feedback from sensory testing,
adjustments then must be made to optimize the sensory properties of the food product, such as,
flavor, sweetness, texture, thickness, color, and many such aspects of the product (Pyne 2000).
Hence, sensory evaluation can be the best tool to understand consumer preferences in order to
direct the process of successful product development.
Sensory evaluation has been defined as “a scientific discipline used to evoke, measure,
analyze, and interpret reactions to those characteristics of foods and materials as they are
perceived by the senses of sight, smell, taste, touch, and hearing” (IFT 1975). In other words,
the use of human senses to measure flavor and other sensory characteristics of foods and other
products is called Sensory Analysis or Sensory Evaluation, a useful tool in the development of
new products and new food resources (O’Mahony 1988). Sensory acceptance tests indicate the
acceptance of a product without the influence of package, label, price and other such factors.
Consumer testing is one of the most important activities in product development; the primary
purpose of consumer affective tests is to assess the personal response by current and potential
customers of a product, product ideas, or specific product characteristics (Resurreccion 1998).
The implicit goal behind any and all sensory evaluation efforts in the food industry is to enhance
quality, to improve appearance, flavor and texture as perceived by consumers in order to
influence their food choices (translated into purchases) at the point of sale (Resurreccion 1998).
Keeping the current consumer trend of convenience and nutrition in mind, this study to
develop a new chocolate-flavored, peanut-soy protein-based, nutritious beverage was
undertaken. The main objective was to evaluate this new beverage product for its sensory
characteristics. It has been developed from two important vegetable protein sources: peanut and
114
soy, complementing each other to benefit the goal of a nutritionally superior product. However,
it is challenging to provide a nutritious food that ensures appealing taste, texture, and
appearance. Hence, it was desired to achieve balance between nutrition and acceptability by
subjecting a number of possible product formulations to consumer affective sensory testing. The
consumer response to experimental product formulations in comparison to a commercial control
sample was expected to ultimately lead to the development of a successful product. Sensory
evaluation was essentially conducted to obtain first-hand information on consumer acceptability
to guide the development process.
MATERIALS AND METHODS
Materials The source of peanut protein was medium roast, partially defatted (12% fat) peanut
flour, obtained from Golden Peanut Company, Alpharetta, Ga., U.S.A. Two soy protein sources
were soy protein isolate (Prolisse™) and defatted soy flour, obtained from Cargill Soy Protein
Solutions, Sidney, OH and Cedar Rapids, IA, U.S.A., respectively. The carrageenan stabilizer
(Satiagel X-amp 4000) was provided by Degussa Texturant Systems Sales, LLC, Atlanta, Ga.,
U.S.A. Soy lecithin (LECIGRAN™ 5750) was offered by Riceland Foods, Inc., Lecithin
Division, Stuttgart, Ark., U.S.A. Artificial chocolate flavor was donated by Carmi Flavor &
Fragrance Co., Inc., Commerce, Calif., U.S.A. Maltodextrin (AVEBE MD 20) was provided by
AVEBE America Inc., Princeton N.J., U.S.A. Corn syrup (light), sucrose, cocoa powder
(Hershey®’s European style, Dutch processed cocoa), peanut oil, vanilla extract (pure), salt and
commercial chocolate milk (Hershey®’s creamy chocolate milk shake) were purchased locally.
A new chocolate-flavored peanut-soy beverage Two important protein sources, peanut and
soy, were used to prepare a nutritional beverage. The initial formulation and processing steps for
beverage formulations were based on extensive literature review and preliminary beverage
115
preparation trials (Deshpande and others Unpublished). A pilot-plant scale beverage processing
protocol involved a three-component constrained-mixture-design approach. Upon finalizing the
operating protocol, the experimental design was created to determine the total number of
beverage formulations required to conduct sensory evaluation.
Mixture design A three-component constrained mixture design was developed using Peanut
(X1: 30.56%-58.70%), Soy (X2: 28.26%-43.52% either soy flour, SF or soy protein isolate, SPI)
and Chocolate syrup (X3: 13.04%-25.93%). The third component of the mixture, chocolate
syrup, was a liquid blend of various other ingredients such as stabilizers, emulsifiers, sweeteners,
and flavor additives (Deshpande and others Unpublished). Preliminary studies on the calculation
of lysine content (Reference lysine content = 51.0 mg/g protein), measurement of viscosity (η =
36.9 mPa s), and visual stability index (VSI = 1.00) were the basis of determination of lower and
upper bound constraints (Deshpande and others Unpublished). The reference lysine content (51
mg/g protein) was obtained from the guidelines on essential amino acid consumption (NAP
2002). The acceptable range of viscosity for design formulations was based on the measurement
of viscosity of Hershey®’s creamy chocolate milk shake. Similarly the VSI was based on the
stability of commercial cow’s milk.
The extreme vertices design for the mixture experiment (McLean and Anderson 1966)
was obtained using design of experiment (DOE) software: STATISTICA™, Version 6.0 for
windows (StatSoft®, Tulsa, OK). The lower and upper bound constraints determined for each
mixture component (X1: 0.3056-0.5870; X2: 0.2826-0.4352; and X3: 0.1304-0.2593) were used
to generate this design, which gave 11 experimental design points. As shown in Figure 4.1, the
parallelogram bound by dashed (-------) lines represented an experimental region on a ternary
plot with the three components, peanut (X1), soy (X2), and chocolate or chocolate syrup (X3),
116
being respective triangular coordinates. There were three overlapping points shown as a vertex
point ‘V2’ in the figure. Since all three points had similar coordinates, only one was selected
resulting in a parallelogram as the experimental region. It had four corner points representing
extreme vertices outlying the constrained region, four midpoints of each edge, and a point inside
the parallelogram representing the centroid of the constrained region. The relative proportions of
each component were constrained to add up to the same value of 1 where:
The minimum number of points needed to estimate the parameters for the quadratic
model for optimization by response surface methodology were determined using following
equation:
y = q (2q-1)
Where, the variable q described as the number of mixture variables in the design was three (X1,
X2, and X3) in this case resulting in a y value of twelve.
Hence, the experimental region was represented separately in Figure 4.2. Five additional
design points (C1, C2, C3, C4, and C5) were selected as the centroids of smaller parallelograms,
for example, point C1 was the centroid of smaller parallelogram formed by points V1, M3, C5,
and M1. All of these design points represented fourteen mixture proportions of three major
components as given in Table 4.1.
Two sets of formulations were prepared using the 14 mixture proportions. One set had
soy flour as a source of soy protein (SF-based formulations), and another soy protein isolate
(SPI-based formulations); all other ingredients and processing parameters were kept constant.
The twenty-eight experimental beverage samples were formulated in small batches containing
3 ∑ Xi = X1 + X2 + X3 = 1 i=1

117
2000g fixed weight of peanut(X1) – soy(X2) base stocks blended in predetermined mixture
proportions (Table 4.1). The amount of chocolate syrup required in each batch was based on the
total weight of beverage formulation and the proportion of chocolate syrup (or chocolate: X3)
from the corresponding mixture proportion. These twenty-eight beverage formulations served
along with the control in each sensory sub-session resulted in a total of 32 samples for sensory
evaluation.
Beverage processing protocol A pilot-plant scale processing protocol was used. This protocol
was designed based on the preliminary study of development of a new chocolate-flavored,
peanut-soy beverage (Deshpande and others Unpublished).
Base stocks of filtered peanut, soy flour (SF) and soy protein isolate (SPI) slurries were
prepared separately for use in beverage formulations as per the three component mixture design.
Morehouse mill (Model M-MS-3, Morehouse Industries, Los Angeles, Calif.) grinding of
medium roast partially-defatted peanut flour, defatted soy flour and soy protein isolate gave
finely ground flours as the starting materials for base stock preparation. The fine flours (250 g
each), mixed separately with tap water (2400 g), were homogenized (34474 kPa, room
temperature, five passes) in a laboratory homogenizer (APV Gaulin Homogenizer Model 15
15MR-8TBA, Everett, MA). The homogenized slurries were filtered using 273-mesh (53
microns), polyester filter screen (McMaster Co., Fulton Industrial Blvd., Atlanta, Ga.), residues
discarded and filtrates stored for use as base stocks.
The key ingredients (sucrose, corn syrup, maltodextrin, cocoa powder, peanut oil, vanilla
extract, salt, soy lecithin, artificial chocolate flavor, and carrageenan) were mixed in water for
making the chocolate syrup. The mixture was heated to 75 ºC in a steam kettle, mixing
118
constantly with a hand-held blender while heating. At this stage the syrup was ready to be used
in the beverage formulations.
Twenty-eight beverage formulations were prepared using the base stocks of peanut
slurry, soy slurry (either SF or SPI) and chocolate syrup mixed in predetermined proportions as
explained in the mixture design. The mixture was heated to 75 ºC in a steam kettle, mixing
constantly with a hand-held blender while heating and then homogenized (34474 kPa, 72 ºC) in a
laboratory homogenizer. Pasteurization at 93 ºC for 1 s followed by cooling to about 35 ºC was
done in a plate-heat-exchanger (Armfield FT74, UHT Unit, Armfield Ltd., Ringwood,
Hampshire, England, BH24 1 DY). The beverage was then filled into labeled 250 ml bottles and
stored at 4 ºC until presented in sensory evaluation sessions.
Sensory evaluation Sensory evaluation was conducted by performing a consumer acceptance
test in the sensory laboratory of the Department of Food Science and Technology, University of
Georgia, Griffin Campus. Untrained panelists were recruited from the staff and students of the
Griffin campus. The panelists (n = 41) were screened and enlisted by ensuring that they were not
allergic to any of the ingredients used in the beverage formulations, consumed chocolate milk or
similar flavored non-carbonated milk-type drink, and liked eating peanuts. Panelists participated
voluntarily in the sensory evaluation.
There were five sensory sessions; each session was administered twice a week (two sub-
sessions/ week), and each sub-session was monitored at three different time slots (three sensory
tests/ sub-session). Thirty-two samples including Hershey®’s creamy chocolate milk shake as
the control were presented in four sensory sessions (8 samples served per session). Apart from
these four sessions, one sensory session conducted in the beginning of the actual evaluation was
considered as a ‘dry-run’. All procedures of sample preparation and sensory evaluation were
119
similar in the case of the dry-run as well as the other four sessions. The panelists were allowed
to select any of the available time slots on one of the sub-sessions per week. They were
instructed to evaluate the test samples for nine different sensory attributes using a nine-point
hedonic scale. A complete randomized block design was used whereby each panelist evaluated
all 32 samples over a period of one month. Each panelist evaluated eight samples (7
experimental beverage formulations and one control) served one at a time with a compulsory
break of 3-5 min after evaluation of the 4th sample. Panelists were requested to complete brief
questionnaires during the break in each sensory test. Some refreshments were provided at the
end of each sensory test.
The sensory evaluation was carried out by performing three 30-minute sensory tests at
9:30 AM, 10:30 AM, and 11:15 AM, every Tuesday and Friday, for five consecutive weeks.
Every test began by greeting the panelists and giving them a brief overview of how the sensory
tests would be conducted. In the first week, they were given instructions regarding the use of the
sensory booths, signal light buttons, and ballot forms (sensory data collection sheets,
APPENDIX C) with a short summary of sample evaluation procedures. They were then
requested to read and sign two copies of a consent form approved earlier by the University of
Georgia’s Institutional Review Board (IRB). The greeter confirmed that panelists had no
allergies towards any of the product ingredients by recording their answer in the space provided
on the consent form and then co-signed the form. The panelists were then led to well-equipped,
environmentally-controlled partitioned booths in the sensory laboratory for the evaluation.
The bottled beverage formulations stored at 4 ºC in a walk-in cooler were transferred into
two ice-filled boxes prior to the sensory sub-session. Care was taken that the samples were
maintained at approximately 5-9 ºC. Each sample was partially filled into 90 ml plastic cups
120
(about 60 ml) and immediately served for sensory evaluation. The sample cups were labeled
using three-digit sample identification numbers obtained from a random number table. The
samples were presented in a monadic sequential order accompanied by paper ballots to record
corresponding sensory responses. The ballot (APPENDIX C) was designed to have nine
questions asking the panelists to express their feeling about each sensory attribute using a 9-point
hedonic scale, where 1 = dislike extremely, 5 = neither like nor dislike, and 9 = like extremely
(Peryam and Pilgrim 1957) as shown in Figure 4.3. They were also asked whether they would
like to buy the product if available in the marketplace and were given a further option of writing
comments about it. The sensory attributes evaluated included overall liking, appearance, color,
aroma, consistency, flavor, sweetness, mouthfeel, and aftertaste. The panelists were instructed to
visually observe, smell, and drink at least four sips of each sample before finishing the
evaluation. They were provided unsalted crackers and drinking water to cleanse their palate in
between samples as well as cups with lids for expectoration. The sensory data thus collected was
statistically analyzed, and the mean ratings for beverage formulations were compared to those of
the control to determine the best formulation.
Measurement of nutritional and physical properties The nutritional characteristics of the
beverage were evaluated on the basis of lysine contents (mg/g protein) calculated from the
compositions of peanut flour, soy flour and soy protein isolate, and the expected percentage
protein recovery in the respective slurries/base stocks (Deshpande and others Unpublished).
Physical properties such as viscosity (η) and visual stability index (VSI) were also measured. A
Brookfield Viscometer (Model LVDV-II+, Brookfield Engineering Laboratories, Inc.,
Stoughton, MA) equipped with a small sample adaptor (SSA 18/13R, 25 ºC, 20 rpm) was used
121
for measurement of η, and a method suggested by Hinds and others (1997b) was used to
determine VSI of various samples.
Statistical analysis The experimental design was obtained using a statistical software
STATISTICA™, Version 6.0 for windows (StatSoft®, Tulsa, OK, USA). The statistical analysis
software (SAS® Proprietary Software, 1999-2001), Release 8.2 for Windows (SAS® Institute
Inc., Cary, NC, USA) was used for data analysis. The ANOVA and Duncan’s Multiple Range
Test were used to compare different attributes at the 95% significance level (α = 0.05).
RESULTS AND DISCUSSION
Physical properties of beverage formulations The ranges of lysine contents in experimental
beverage formulations were 44.1-57.1 mg/g protein (equivalent to lysine content of 4.41-5.71
g/100 g protein) compared to the reference lysine content of 51.0 mg/g protein or 5.10 g/100 g
protein (Deshpande and others Unpublished). A study done by Ang and others (1985) showed
that whole egg, cow’s milk, human milk, soymilk, and spray dried soymilk powder had lysine
content (mg/g of protein) of 70, 76, 87, 76, and 72, respectively. According to them the lysine
requirement for an adult was 500 (male)-800 (female) mg/day. Also, the amino acid profiles of
various peanut beverage treatments studied by Rubico and others (1989) indicated that the lysine
content (g/100 g protein) of raw peanut extract was 4.31, that of 71 ºC homogenized peanut milk
was 5.16, and it was below 4 (in the range of 2.88-3.81) for samples processed at different
temperature and time conditions (85 ºC, 100 ºC, and 121 ºC for 15 min, and 121 ºC for 3 sec).
They suggested that it can be expected to see various heat treatments affecting some amino
acids; however, actual significance of these apparent changes was not clear in the absence of
biological data. In general, the lysine contents of beverage formulations prepared in this study
were close to the range observed in the literature.
122
The values for two physical properties, viscosity (η) and visual stability index (VSI),
were in the range of 17.7-131.8 mPa s and 0.63-0.99, respectively, compared to the viscosity of
Hershey®’s creamy chocolate milk shake (36.9 mPa s) and the VSI of commercial cow’s milk
(1.00). The viscosity measurements of various beverage formulations (Figure 4.4) indicated that
the formulations containing higher amounts of soy protein isolate (SPI) and chocolate syrup were
significantly more viscous (100.5-131.8 mPa s) as compared to the respective soy flour (SF)-
based formulations (37.9-62.8 mPa s). The SF-based formulations followed a viscosity pattern
more closely to the control (Hershey®’s creamy chocolate milk shake) as compared to the SPI-
based formulations. Besides, the viscosity of SPI-based formulations increased sharply with the
subsequent increase in the amount of chocolate syrup resulting in the viscosity values from 42.4
mPa s to 131.8 mPa s for formulations 8, 9, 10, 11, 12, 13, and 14, all of the formulations being
more viscous than the control.
However, the visual stability index values (Table 4.2) for both SPI- and SF-based
formulations containing a low amount of chocolate syrup were low (0.63-0.89). It was
speculated that since the chocolate syrup was a liquid blend of various ingredients, there was a
simultaneous decrease in the amount of stabilizer and emulsifier with a decrease in the amount of
chocolate syrup in the beverage formulations resulting in lower VSI values. At low chocolate
syrup concentrations, the amount of stabilizer and emulsifier might not be enough to form a
stable suspension, causing separation and settling of most of the particles.
On the other hand, at higher chocolate syrup concentrations, the SPI proteins might also
have played an important role of forming larger protein molecules, producing more viscous
formulations. Heat, homogenization and pH are important factors that influence the functional
characteristics of isolated soy proteins (Klahorst 2002). The process of aggregation between
123
oilseed proteins and the properties of their aggregates differs from those of other common
proteins like milk, and when liquids containing soy protein are heated at ≥ 100 ºC, gel-type
aggregates involving covalent disulphide bonds are formed (Hinds and others 1997a). As soy
protein use increases, especially in the beverages that serve as quick, high-protein meals, the
challenge has been to mimic the consistency of a milkshake or fresh-blended smoothie. One
solution is to enhance the viscosity contributed by soy protein with combinations of other
stabilizers, emulsifiers and proteins to make the soy more palatable (Klahorst 2002).
The type and amount of stabilizer or emulsifier, heating-cooling protocols, temperature,
protein-lipid concentration, and particle size are important factors influencing viscosity, stability,
and mouthfeel or chalkiness of peanut beverages (Hinds and others 1997c). Since heat treatment
is a major factor altering physical and chemical properties of homogenized liquids containing
protein and fat, it can be thought to play a role in governing the physical properties of the
beverage. Consistency index (K), or apparent viscosity (η) at shear rate of unity, of PF (peanut
flour) and SPI milks was generally higher than that of similarly processed NDM (non-fat dry
milk) milk (Schmidt and others 1980). Also increased total solids and increased heat treatment
more dramatically increased the K value for oilseed milks than for NDM milk, and storage (10
days at 4 ºC) increased K value of SPI milk heated at 80 ºC or above. Degree of heat treatment,
total solids content and storage were shown to have a pronounced effect on the apparent
viscosity, consistency index, and yield stress of the fortified milk systems (Ramanna and
Ramanathan 1992). Also, sugars whether sucrose, corn syrup, high fructose corn syrup, fructose,
rice syrup, cane sugar or honey, contribute to viscosity, depending on the level added and other
components of the solution (Klahorst 2002).
124
Temperature significantly affected viscosity of peanut beverages prepared by Rubico and
others (1988) probably due to changes in protein and carbohydrate structures. A possible cause
of gelation in the chocolate-flavored peanut beverages could be interaction of peanut protein
with polysaccharide thickening agents (carragennan and guar gum) leading to aggregation of
molecules (Rustom and others 1996). Hinds and others (1997b) observed that the visual stability
and viscosity values of their preliminary experimental beverages ranged from 0.49-0.71 and 3.7-
23.6 mPa s depending on the type of stabilizer or emulsifier used. Soybean beverages heated to
82 ºC then homogenized twice at 24.1 x 10⁶ Pa had suspension and visual stability indices of 0.9
and 1.0, respectively, after a 7-day quiescent storage time at 1.1 ºC (Nelson and others 1976;
Priepke and others 1980). The physical properties of the peanut-soy beverage product under
study were found to be in close correlation to these findings.
Among all the SF- and SPI-based formulations, only #8, #9, and #10 had viscosity as
well as VSI close to the desired values. The SPI-based formulation #8 had the best balance of
both the physical properties (η = 41.5 mPa s; VSI = 0.99). For beverages, the primary role of
protein is to provide nutritive value in a form that has desirable physical as well as sensory
attributes. Because protein viscosity is largely affected by heat, proteins vary in their ability to
withstand high-temperature processing; when heated to a point of denaturation, irreversible gels
form from coagulated protein (Klahorst 2002). Evidently, the concentration of SPI and
chocolate syrup appeared to govern the viscosity pattern of the various beverage formulations.
Correlation of physical and sensory properties Figure 4.5 shows that the SPI-based
formulations having higher viscosity values were rated lower than the corresponding SF-based
formulations for four sensory attributes: appearance (SPI: 5.6-6.2; SF: 6.3-6.5), color (SPI:
5.7-6.2; SF: 6.2-6.5), consistency (SPI: 5.4 -5.8; SF: 6.2-6.3), and mouthfeel (SPI: 5.6-5.8; SF:
125
5.7-6.0). It can be observed that higher amounts of chocolate syrup not only increased viscosity
of the beverages resulting in lower ratings for consistency, but also resulted in visibly darker
formulations having lower ratings for appearance and color. Since chocolate syrup was a blend
of various other ingredients, increase in the concentration of chocolate syrup can be correlated to
the increased concentration of stabilizer, sweeteners, and cocoa powder resulting in thicker and
visually darker formulations. Higher amounts of SPI might also be responsible for lower ratings
of consistency and mouthfeel because of a simultaneous increase in protein concentration giving
thicker formulations. Higher viscosity resulted in lower sensory acceptability but lower viscosity
consequently resulted in lower visual stability, hence the formulation that had balanced physical
and sensory characteristics was of interest.
Comparison of sensory properties of SF and SPI formulations All of the sensory attributes
were significantly different with the exception of appearance (α = 0.05). Graphs plotted for
mean hedonic ratings against various formulations arranged in increasing amount of chocolate
syrup (Figure 4.5) indicated that formulations prepared with SPI were better than those with SF,
especially for the sensory attributes aftertaste, aroma, flavor and overall acceptability. Aftertaste,
flavor, overall acceptability, and sweetness of SPI formulations showed a gradual increase in the
mean ratings as the amount of chocolate syrup increased. For all of the sensory attributes except
mouthfeel, formulations #7, #8, and #9 prepared from SPI had higher mean ratings compared to
the corresponding formulations prepared using SF. SPI-based formulation #8 was the best
formulation receiving the highest ratings for all sensory attributes.
The higher the concentration of SPI, the greater the stability and nutritional benefits due
to a higher concentration of high quality soy proteins. However, such formulations containing
high amounts of both SPI and chocolate syrup resulted in higher viscosity and sweetness, thicker
126
consistency, visibly darker color, and less appealing appearance, ultimately lowering the
consumer acceptability. This was in agreement with the observation that protein denaturation
and aggregation, carragennan interaction with water, hydrated polysaccharide-protein networks,
and hydrated lipid-protein complexes play important roles in controlling beverage
characteristics. With respect to all sensory attributes, the formulations which had consumer
acceptability close to the control (Hershey®’s creamy chocolate milk shake) were those
containing a medium range of chocolate syrup. And among those again, the SPI-based
formulations were rated higher compared to the SF-based formulations. It was evident that the
SPI-based formulations were preferred compared to the SF-based formulations.
Proteins are added as ingredients to foods to achieve functional and nutritional goals
(Giese 1994), and the beverage industry is the biggest market producing functional foods (Ohr
1997). Isolated soy proteins (minimum 90% protein content) are virtually pure, bland-flavored,
and the most functional of the soy proteins having excellent nutritional qualities. Some can
emulsify fat, bind water, and are designated to function in a given system in exactly the same
way as animal proteins. Some isolates can be used to provide elastic gel texture, imparting
interesting mouthfeel, while others control viscosity in drinks, making them creamier or full
bodied. Various commercial products now take advantage of the characteristics offered by soy
proteins (Riaz 1999). A sensory evaluation of 18 commercial soy flours, concentrates, and
isolates confirmed that these products are not bland; had odor scores ranging from 5.8 to 7.7 and
flavor scores, from 4.2 to 7.0 (scores rated on a 10-point scale where 10 was bland and 1 was
strong) (Rackis and others 1979). It was observed that flavor scores of the products do not show
a great reduction in flavor intensity when flours were processed into concentrates and isolates, in
127
spite of the removal of non-protein constituents; however, differences exist between flavor
descriptors of flours, concentrates, and isolates.
Comparison of beverage formulations with control (Hershey®’s creamy chocolate milk
shake) based on sensory data Mean ratings for Hershey®’s creamy chocolate milk shake were
between 6 (like slightly) and 7(like moderately). SPI-based formulation #8, the best formulation
with respect to both physical and sensory attributes, received mean ratings comparable to that of
the control. As shown in Figure 4.6 it had significantly higher ratings for appearance (7.0), color
(6.8), and sweetness (6.4). All sensory attributes except aftertaste were rated close to 6.0 or
higher; aftertaste was the lowest-rated attribute with a mean score of 5.8 while appearance was
the highest-rated attribute, having a mean score of 7.0. The sensory attribute sweetness was
important because it was the attribute for which the control received the lowest mean rating
(5.9).
It can be observed that the SPI-based formulation #8 having 43.9% peanut (X1), 36.3%
soy (X2), and 19.8% chocolate syrup (X3) had the highest overall acceptability (Figure 4.5 H).
Also SPI-based formulation #7 (X1 = 37.0%, X2 = 43.5%, X3 = 19.5%), #6 (X1 = 52.3%, X2 =
28.3%, X3 = 19.5%), and SF-based formulation #14 (X1 = 30.6%, X2 = 43.5%, X3 = 25.9%)
received the highest mean ratings for color (7.0), aroma (6.2), and flavor (6.0), respectively
(Refer to Table 4.2; Figure 4.5 C, D, and F). Interestingly, sweetness, color, and appearance
were some of the main attributes for which the control was rated lower compared to some
experimental formulations.
Wang and others (2001) found that chocolate and almond flavorings improved the aroma
of soymilks (p < 0.05) and that addition of gum partially masked the beany off-flavor. Thus, the
combination of chocolate flavoring and iota-carrageenan gum permitted production of low-heat-
128
treated soymilk acceptable to consumers. Chocolate-flavored soymilk received the lowest off-
flavor score (2.3) while vanilla soymilk without gum was given the highest (3.1) (p < 0.05) on a
scale represented by 1 as minimum and 7 as maximum intensity ratings. It was observed that all
samples received a “weak” score for aftertaste and chalkiness, on the other hand, samples with
gum were found to be more (p < 0.05) viscous (average viscosity score: 4.9) than those without
gum (average viscosity score: 3.7). Chompreeda and others (1989) reported that the color of a
chocolate-flavored peanut beverage was affected mainly by cocoa powder whereas sweetness
was affected by both sugar and cocoa powder; sugar and cocoa powder had little influence on
aroma, however. Also, the overall flavor was more greatly influenced by level of sugar than
level of cocoa powder.
In the present study, the mean ratings for the sensory attributes were obtained from 41
consumer responses for each formulation on a 9-point hedonic scale. The responses for the first
sensory session (dry-run) were not considered in the final analysis. However, the purpose of the
dry-run was to avoid any major inconsistencies due to sample preparation or sensory procedures.
Also it was helpful in becoming familiar with the organization and conduct of sensory testing,
allowing sufficient time to make the necessary changes before carrying out the actual tests.
Since it is recommended to conduct a complete dry run of all the testing procedures, one week
before the test date (Resurreccion 1998), the first sensory session out of five total sessions was
considered as the dry run.
Consumer responses in terms of buying tendency and common descriptors used for the
new beverage Based on the consumer comments about different beverage formulations and
their responses to the question whether they would like to buy the new beverage product
(APPENDIX C), overall consumer opinion about the chocolate-flavored, peanut-soy beverage
129
was judged qualitatively. Consumers were less willing to buy formulations having lower
amounts of chocolate syrup (about 5-15% saying yes) than high chocolate syrup formulations
(45-52% saying yes). About 51.2% said that they would buy SF-based formulation #13 followed
closely by 48.8% opting for SPI-based formulation #8. Almost all of the participants agreed that
nutritional benefit could help boost the acceptability of the product under study; a few suggested
that some changes in sweetness level, thickness, and flavor of some of the formulations might
change their opinion about buying the product. Various descriptors used by the panelists in the
comments option on the sensory ballot were summarized and grouped as shown in Table 4.3.
In general, the best blends or good balance of peanut and chocolate giving the smoothest
mouthfeel in the case of SPI-based formulations were those containing medium peanut, medium
SPI and high chocolate syrup concentrations. Some grainy or chalky mouthfeel was recognized
in formulations having higher concentrations of soy flour along with medium to high levels of
peanut. Such formulations were also described as having noticeable bitterness. Higher peanut
concentrations were perceived to have an undesirable burnt aftertaste or somewhat odd flavor
described as coffee beans/ tea/ mocha flavor. In some SPI-based formulations having lower
concentrations of chocolate syrup, a slight beany flavor was perceived. At higher chocolate
syrup concentrations, sweetness and chocolate flavor overpowered the peanut flavor which was
considered undesirable by some consumers. Sweetness was the major concern for such high
chocolate syrup formulations.
Consumer preferences and awareness of ‘good for you’ product options available in the
market Based on the survey done with the help of questionnaires (APPENDIX E) provided
during a 3-5 min break in the sensory test, consumer preferences and health awareness were
judged. About 95% of the consumers knew that peanut is a good source of nutrition with 35%
130
eating peanuts at least twice a week; 65% believed that including peanuts in a healthy diet can
help people lose weight. About 80% knew that diets high in monounsaturated fat from foods
like peanuts, peanut butter, peanut oil and olive oil are superior to low-fat diets for heart health.
Among the sensory test consumers, 89% consumers drank milk at least once a week
whereas the remainder did not prefer milk at all. All of the panelists liked chocolate milk;
however, only 48% consumers preferred consuming chocolate milk or a milk-type, non-
carbonated beverage once a week; the remainder bought such products very rarely. Almost 75%
said that they never drank soymilk, even though 92% thought that it could be a protein-rich, low-
fat, nutritious component of the diet; 75% knew that soymilk is an excellent lactose-free
alternative to milk. Those who consumed soymilk preferred it at least once a week or more.
The most important attribute associated with consumption of health-directed products
was taste. Other attributes such as color, consistency, sweetness, flavor and, nutrition were given
more or less equal preference. The preferred serving style for nutritional beverages similar to the
one under study was ‘ready off-the-shelf but requiring refrigeration’ followed by ‘refrigerated
packs sold in the grocery stores’, ‘instant powdered mix to be added in milk/water’, and ‘cold
packs from vending machine’. If available, most of the panelists (47.6%) preferred consuming
the chocolate-flavored, peanut-soy beverage at home. About 24% said that they could consume
it anywhere, some preferring it on a bike ride or on a long drive, while a few selected the
vending machine option. Chocolate was the most popular beverage flavor with 56% people
choosing it as their favorite followed by vanilla and strawberry. Consumers showed more or less
equal interest in ‘low-fat’ and ‘good to eat’ kinds of products with the remainder showing greater
interest in ‘low-calorie’ than ‘high-protein’ foods. Although 85% believed that ‘Nutritional
Facts’ information would definitely or might influence their purchase decision of the peanut-

131
based beverage under study, 51% said they would consider buying and 31% said they might buy
it if a ‘health claim’ accompanied the product. For a single serving (240 ml) bottle of chocolate-
flavored, peanut-soy beverage, 95% of the consumers were willing to pay about $1.69 or less.
Many of the panelists expressed that the more often they consumed the product under study, the
more they got used to the taste. Even though they did not like the taste at first, their liking
gradually seemed to increase as they became more familiar with the product. Since the product
was relatively a new concept, it took time for the panelists to become accustomed to the taste.
Overall, the new concept was very favorably received. The panelists showed enthusiasm and
interest in evaluating and assisting with the development of the new chocolate-flavored, peanut-
soy beverage.
Future work Optimization of chocolate-flavored, peanut-soy beverage using response surface
methodology (RSM) can be the next objective of this work. The optimization procedure for
product development has been found to save time, costs less than repeated consumer testing of
one or two products at a time, and provides a level of certainty about the performance of the
product formulation (Fishken 1983). The sensory response in terms of various attributes can be
modeled to give the optimum range of the three mixture components, leading to the most
acceptable product formulation.
CONCLUSIONS
Peanut flour was successfully combined with soy (either soy flour-SF or soy protein isolate-SPI)
and chocolate syrup to obtain a new beverage product with acceptability ratings comparable to
that of Hershey®’s creamy chocolate milk shake. Based on consumers’ willingness to buy the
new product, suggestions provided, and responses to the questionnaires, preferences of target
consumers towards the new product were studied. Overall, the concept was well received and
132
consumers showed enthusiasm in evaluating the new beverage. The nutritional, physical, and
sensory properties of twenty-eight chocolate-flavored, peanut-soy beverage formulations, and a
control (Hershey®’s creamy chocolate milk shake) were studied effectively. The sensory
properties revealed that soy protein isolate (SPI)-based formulation #8, having 43.9% peanut,
36.3% SPI, and 19.8% chocolate syrup, was the best overall. It received significantly higher
ratings than the control for appearance, color, and sweetness. SPI- based formulations #7, #6,
and SF-based formulation #14 had highest mean ratings for color (7.0), aroma (6.2), and flavor
(6.0), respectively. Involving the target consumer early in the development process is expected
to enhance the probability of the product’s success in the marketplace.
133
REFERENCES
Ang HG, Kwik WL, and Theng CY. 1985. Development of soymilk- A review. Food
Chemistry 17:235-250.
Brody AL, Connor JM, and Lord JB. 2000. The United States’ food industry and its imperative
for new products. In: Brody AL and Lord JB, editors. Developing New Food Products for a
Changing Marketplace. Pennsylvania: Technomic Publishing Co., Inc., Lancaster. p 1-18.
Bursey RG. 1983. Diet modification and the development of new food products. Annals of
Internal Medicine 98 (Part 2):872-874.
Chompreeda P, Haruthaithanasan V, Oupadissakoon C, and Suknak K. 1989. A research note:
Development of a chocolate flavored peanut beverage. Journal of Food Science 54(5):1359-
1360.
Deshpande RP, Chinnan MS, and Phillips RD. Unpublished. Formulation and processing
protocol of a chocolate flavored peanut-soy beverage. To be submitted to the Journal of
Food Science.
Desrosier NW and Desrosier JN. 1971. Economics of new product development. Connecticut:
The AVI publishing company, Inc. Westport. p 1-217.
Earle MD. 1997. Changes in the food product development process. Trends in Food Science &
Technology 8(January):19-24.
Fishken D. 1983. Consumer-oriented product optimization. Food Technology 37(11):49-52.
Giese J. 1994. Proteins as ingredients: Types, Functions, Applications. Food Technology
48(10):50-60.
134
Hinds MJ, Beuchat LR, and Chinnan MS. 1997a. Properties of a thermal-processed beverage
prepared from roasted partially defatted peanuts. International Journal of Food Science and
Technology 32:203-211.
Hinds MJ, Beuchat LR, and Chinnan MS. 1997b. Effects of homogenization pressure and
stabilizers on some physical characteristics of a beverage prepared from partially defatted,
roasted peanuts. Plant Foods for Human Nutrition 50:269-277.
Hinds MJ, Beuchat LR, and Chinnan MS. 1997c. Particle size distribution in a heat-processed
beverage prepared from roasted peanuts. Food Research International 30(1):59-64.
IFT. 1975. Minutes of Sensory Evaluation Division business meeting at 35th Ann. Meet., Inst.
of Food Technologists, Chicago. June 10.
Klahorst SJ. 2002. Beverage viscosity, any way you like it! Available from
http://www.foodproductdesign.com/archive/2002/0102AP.html Accessed on 11/15/02.
Lund DB. 1982. Quantifying reactions influencing quality of foods: Texture, Flavor, and
Appearance. Journal of Food Processing and Preservation 6:133-153.
McLean RA and Anderson VL. 1966. Extreme vertices design of mixture experiments.
Technometrics 8(3):447-454.
National Academies Press (NAP). 2002. Protein and amino acids (Chapter 10). In: Dietary
Reference Intakes for Energy, Carbohydrate, Fiber, Fat, Fatty Acids, Cholesterol, Protein,
and Amino Acids (Macronutrients). Available from
http://www.nap.edu/books/0309085373/html. Accessed on 09/ 2003. p 465-608.
Nelson AI, Steinburg MP, and Wei LS. 1976. Illinois process for preparation of soymilk.
Journal of Food Science 41:57-61.
135
O’Mahony M. 1988. Sensory difference and preference testing: The use of signal detection
measures. In: Moskowitz H., editor. Applied Sensory Analysis of Foods. Volume I. CRC
Press, Inc. Boca Raton, FL. p 146-147.
Ohr LM. 1997. Fortifying for the health of it. Prepared Foods 166:55.
Ohr LM. 2003. The latest scoop on soy. Food Technology 57(8):87-91.
Peryam DR and Pilgrim FJ. 1957. Hedonic scale method for measuring food preferences. Food
Technology 11(9):9-14 (Symposium: Studies in Food Science and Technology-
Methodology of Sensory Testing- Contributions to the IFT Symposium in Pittsburgh).
Priepke PE, Wei LS, Nelson AI, and Steinberg MP. 1980. Suspension stability of Illinois
soybean beverage. Journal of Food Science 45:242-245.
Pyne AW. 2000. Innovative new products: Technical development in the laboratory. In: Brody
AL and Lord JB, editors. Developing New Food Products for a Changing Marketplace.
Pennsylvania: Technomic Publishing Co., Inc., Lancaster. p 259-275.
Rackis JJ, Sessa DJ, and Honig DH. 1979. Flavor problems of vegetable food proteins. Journal
of the American Oil Chemists Society 56(March):262-271.
Ramanna SV and Ramanathan G. 1992. Effect of processing and storage on rheological
properties of fortified milk and curd systems. International Journal of Food Science and
Technology 27:305-312.
Resurreccion AVA. 1998. Consumer Sensory Testing for Product Development. Maryland:
Chapman & Hall Food Science Book, Aspen Publishers, Inc., Gaithersburg. 254 p.
Riaz MN. 1999. Soybeans as functional foods. Cereal Foods World 44(2):88-92.
136
Robinson L. 2000. The marketing drive for new food products. In: Brody AL, Lord JB, editors.
Developing New Food Products for a Changing Marketplace. Pennsylvania: Technomic
Publishing Co., Inc., Lancaster. p 19-27.
Rubico SM, Resurreccion AVA, and Beuchat LR. 1988. Comparison of sensory properties and
headspace volatiles of a peanut beverage processed at different temperature and time
conditions. Journal of Food Science 53(1):176-180.
Rubico SM, Phillips RD, Resurreccion AVA, and Beuchat LR. 1989. Nutritional,
microbiological, and sensory qualities of a peanut beverage prepared using various processes.
Journal of Food Science 54(6):1540-1543.
Rustom IYS, Lopez-Leival MM, and Nair BM. 1996. UHT-Sterilized peanut beverages:
Kinetics of physicochemical changes during storage and shelf-life prediction modeling.
Journal of Food Science 61(1):198-203, 208.
Schmidt RH, Sistrunk CP, Richter RL, and Cornell JA. 1980. Heat treatment and storage effects
on texture characteristics of milk and yoghurt systems fortified with oilseed proteins. Journal
of Food Science 45:471-475.
Sloan AE. 2003a. Top 10 trends to watch and work on: 2003. Food Technology 57(4):30-50.
Sloan AE. 2003b. What, when, and where Americans eat: 2003. Food Technology 57(8):48-66.
Wang B, Xiong YL, and Wang C. 2001. Physicochemical and sensory characteristics of
flavored soymilk during refrigeration storage. Journal of Food Quality 24:513-526.
137
ACKNOWLEDGEMENTS
This research study was funded by the United States Agency for International Development/
Peanut Collaborative Research Support Program (USAID/Peanut CRSP) Grant #LAG-G-00-96-
90013-00. Voluntary participation and cooperation of consumer panelists during the study is
valued to a great extent. Help provided by Mrs. Sue Ellen McCullough and Mrs. Vijaylakshmi
Mantripragada in conducting consumer affective sensory tests, and technical assistance by Mr.
Glenn Farrell, all from the Department of Food Science and Technology, University of Georgia,
Griffin, Ga., is greatly appreciated.
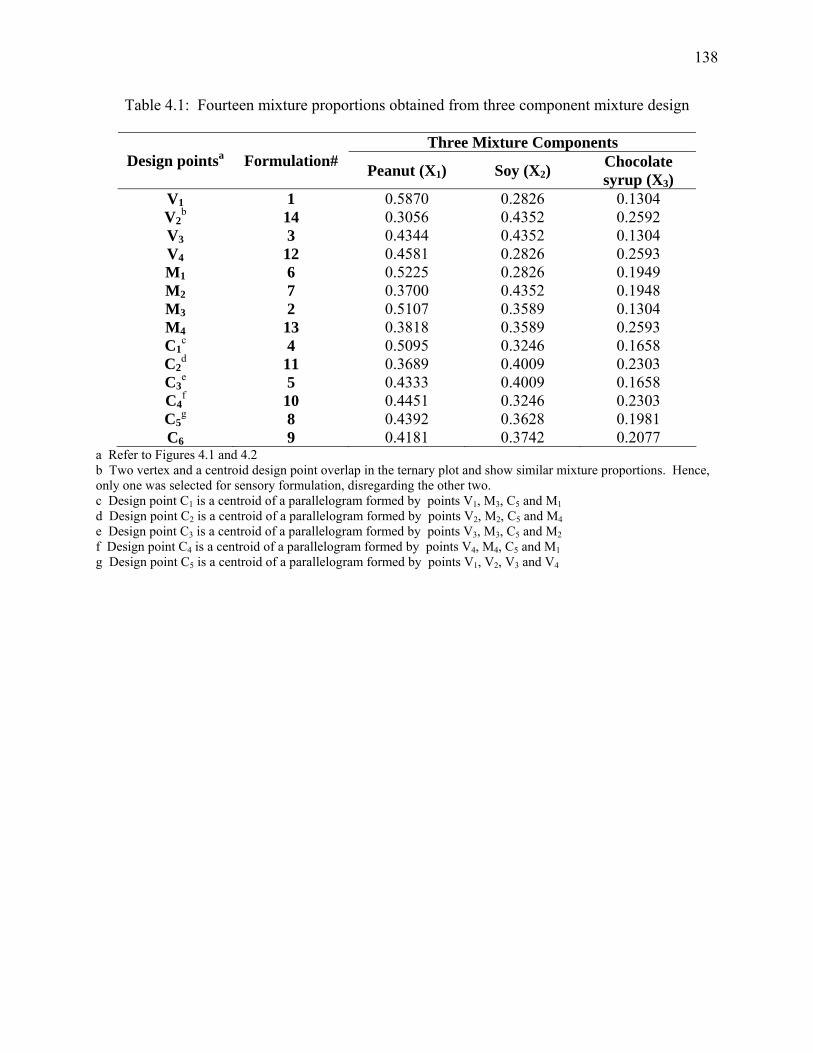
138
Table 4.1: Fourteen mixture proportions obtained from three component mixture design
Three Mixture Components Design pointsa Formulation# Peanut (X1) Soy (X2)
Chocolate syrup (X3)
V1 1 0.5870 0.2826 0.1304 V2
b 14 0.3056 0.4352 0.2592 V3 3 0.4344 0.4352 0.1304 V4 12 0.4581 0.2826 0.2593 M1 6 0.5225 0.2826 0.1949 M2 7 0.3700 0.4352 0.1948 M3 2 0.5107 0.3589 0.1304 M4 13 0.3818 0.3589 0.2593 C1
c 4 0.5095 0.3246 0.1658 C2
d 11 0.3689 0.4009 0.2303 C3
e 5 0.4333 0.4009 0.1658 C4
f 10 0.4451 0.3246 0.2303 C5
g 8 0.4392 0.3628 0.1981 C6 9 0.4181 0.3742 0.2077
a Refer to Figures 4.1 and 4.2 b Two vertex and a centroid design point overlap in the ternary plot and show similar mixture proportions. Hence, only one was selected for sensory formulation, disregarding the other two. c Design point C1 is a centroid of a parallelogram formed by points V1, M3, C5 and M1 d Design point C2 is a centroid of a parallelogram formed by points V2, M2, C5 and M4 e Design point C3 is a centroid of a parallelogram formed by points V3, M3, C5 and M2 f Design point C4 is a centroid of a parallelogram formed by points V4, M4, C5 and M1 g Design point C5 is a centroid of a parallelogram formed by points V1, V2, V3 and V4
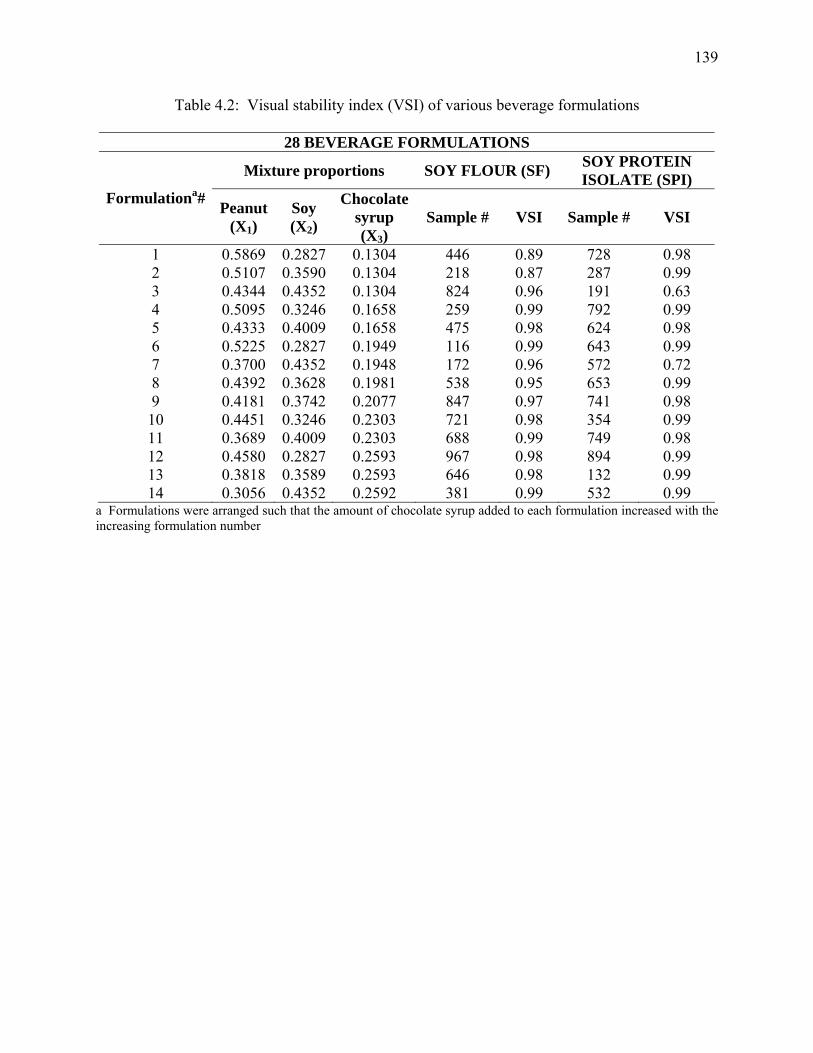
139
Table 4.2: Visual stability index (VSI) of various beverage formulations
28 BEVERAGE FORMULATIONS
Mixture proportions SOY FLOUR (SF) SOY PROTEIN ISOLATE (SPI)
Formulationa# Peanut (X1)
Soy (X2)
Chocolate syrup (X3)
Sample # VSI Sample # VSI
1 0.5869 0.2827 0.1304 446 0.89 728 0.98 2 0.5107 0.3590 0.1304 218 0.87 287 0.99 3 0.4344 0.4352 0.1304 824 0.96 191 0.63 4 0.5095 0.3246 0.1658 259 0.99 792 0.99 5 0.4333 0.4009 0.1658 475 0.98 624 0.98 6 0.5225 0.2827 0.1949 116 0.99 643 0.99 7 0.3700 0.4352 0.1948 172 0.96 572 0.72 8 0.4392 0.3628 0.1981 538 0.95 653 0.99 9 0.4181 0.3742 0.2077 847 0.97 741 0.98 10 0.4451 0.3246 0.2303 721 0.98 354 0.99 11 0.3689 0.4009 0.2303 688 0.99 749 0.98 12 0.4580 0.2827 0.2593 967 0.98 894 0.99 13 0.3818 0.3589 0.2593 646 0.98 132 0.99 14 0.3056 0.4352 0.2592 381 0.99 532 0.99
a Formulations were arranged such that the amount of chocolate syrup added to each formulation increased with the increasing formulation number
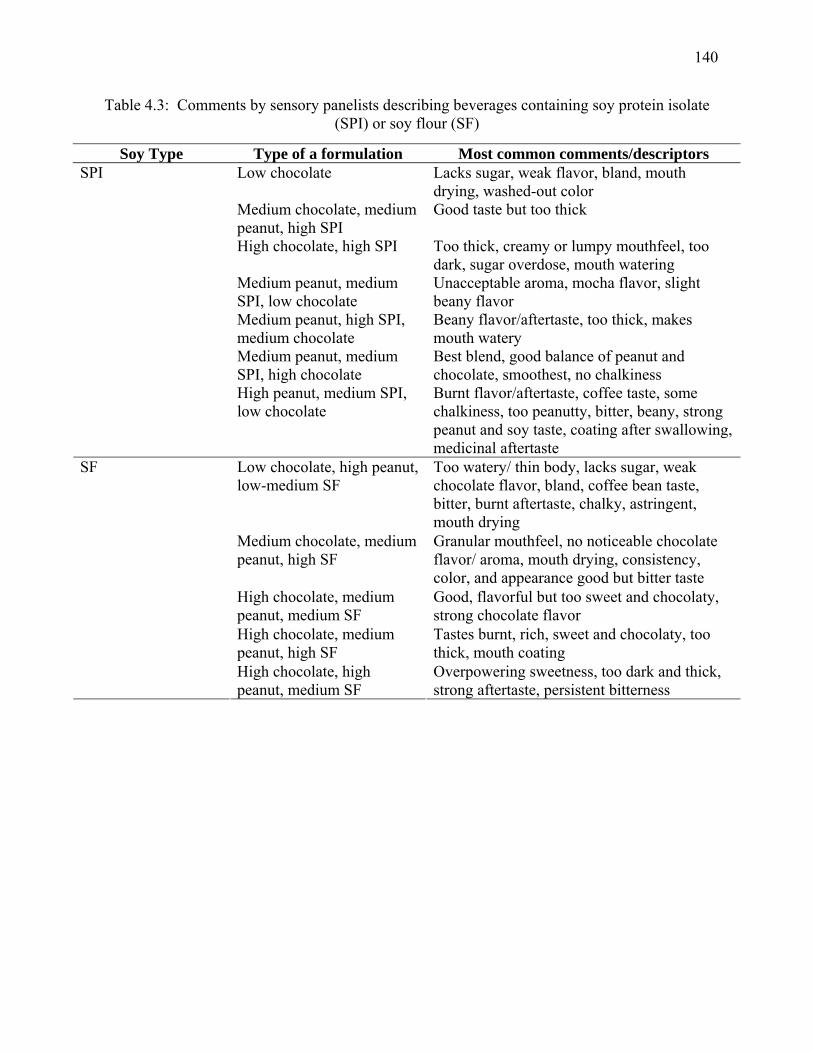
140
Table 4.3: Comments by sensory panelists describing beverages containing soy protein isolate (SPI) or soy flour (SF)
Soy Type Type of a formulation Most common comments/descriptors Low chocolate Lacks sugar, weak flavor, bland, mouth
drying, washed-out color Medium chocolate, medium peanut, high SPI
Good taste but too thick
High chocolate, high SPI Too thick, creamy or lumpy mouthfeel, too dark, sugar overdose, mouth watering
Medium peanut, medium SPI, low chocolate
Unacceptable aroma, mocha flavor, slight beany flavor
Medium peanut, high SPI, medium chocolate
Beany flavor/aftertaste, too thick, makes mouth watery
Medium peanut, medium SPI, high chocolate
Best blend, good balance of peanut and chocolate, smoothest, no chalkiness
SPI
High peanut, medium SPI, low chocolate
Burnt flavor/aftertaste, coffee taste, some chalkiness, too peanutty, bitter, beany, strong peanut and soy taste, coating after swallowing, medicinal aftertaste
Low chocolate, high peanut, low-medium SF
Too watery/ thin body, lacks sugar, weak chocolate flavor, bland, coffee bean taste, bitter, burnt aftertaste, chalky, astringent, mouth drying
Medium chocolate, medium peanut, high SF
Granular mouthfeel, no noticeable chocolate flavor/ aroma, mouth drying, consistency, color, and appearance good but bitter taste
High chocolate, medium peanut, medium SF
Good, flavorful but too sweet and chocolaty, strong chocolate flavor
High chocolate, medium peanut, high SF
Tastes burnt, rich, sweet and chocolaty, too thick, mouth coating
SF
High chocolate, high peanut, medium SF
Overpowering sweetness, too dark and thick, strong aftertaste, persistent bitterness
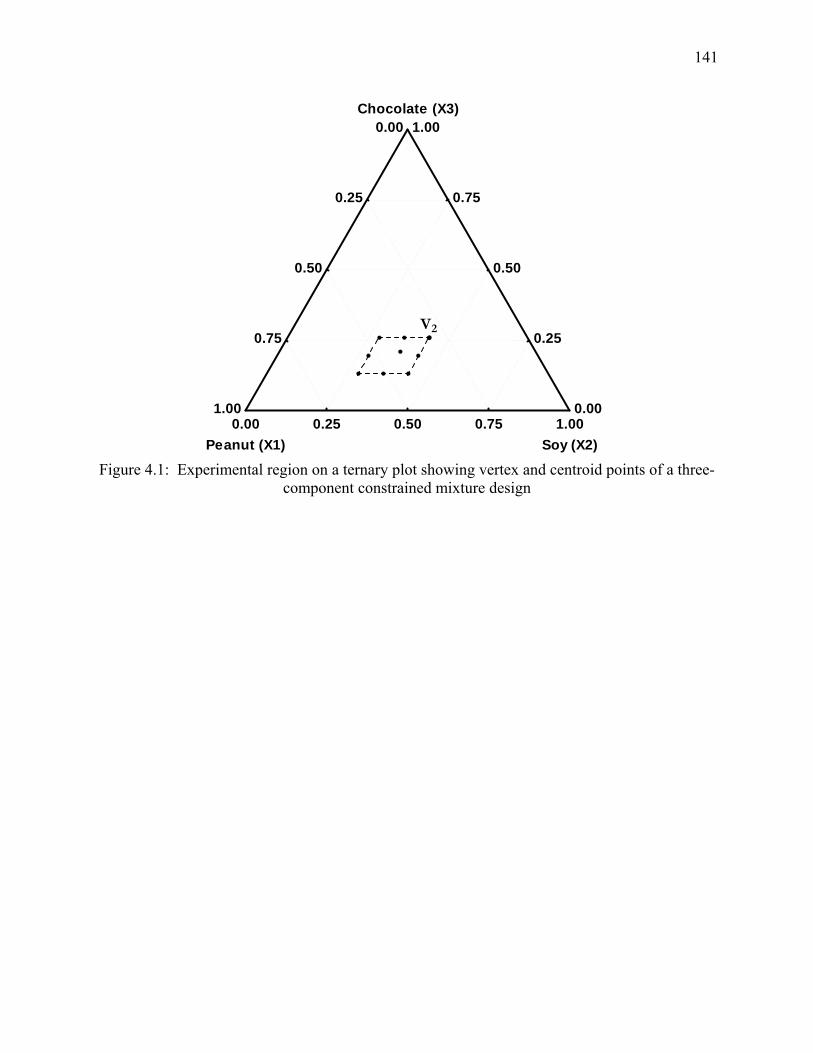
141
V2
0.00
0.25
0.50
0.75
1.00Chocolate (X3)
0.00
0.25
0.50
0.75
1.00
Peanut (X1)0.00 0.25 0.50 0.75 1.00
Soy (X2) Figure 4.1: Experimental region on a ternary plot showing vertex and centroid points of a three-
component constrained mixture design
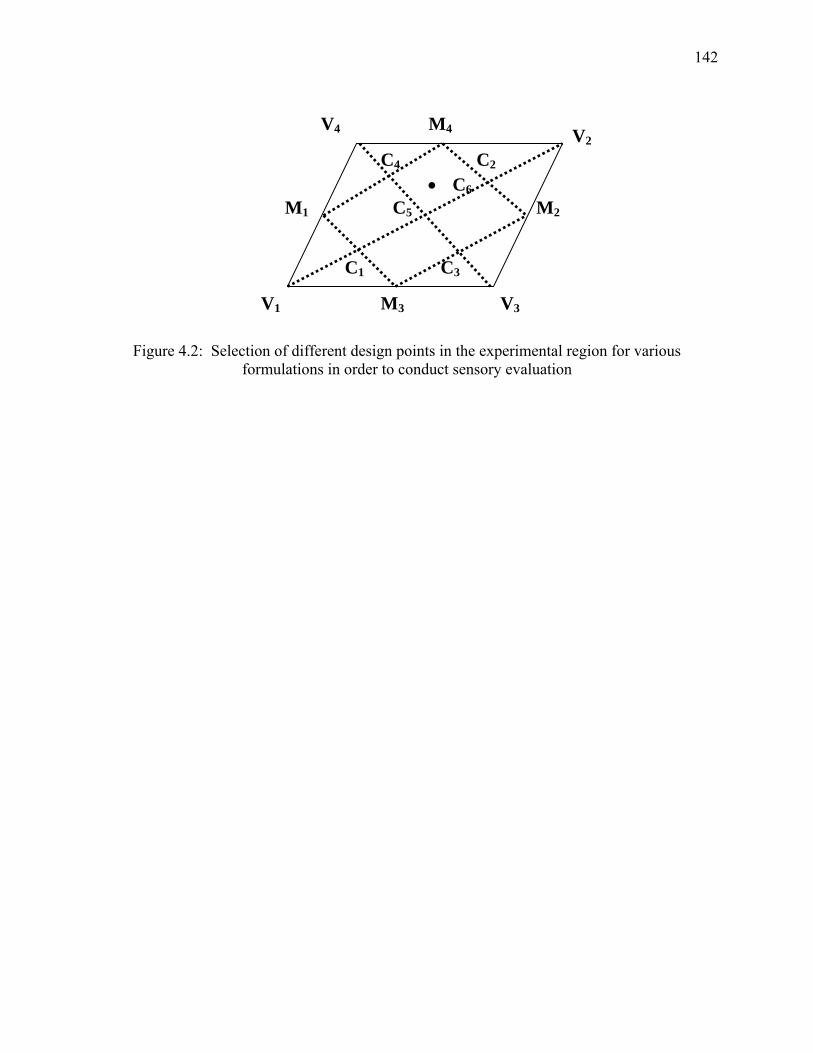
142
Figure 4.2: Selection of different design points in the experimental region for various formulations in order to conduct sensory evaluation
• C6
V1
V2
V3
V4
M1 M2
M3
M4
C1
C2
C3
C4
C5
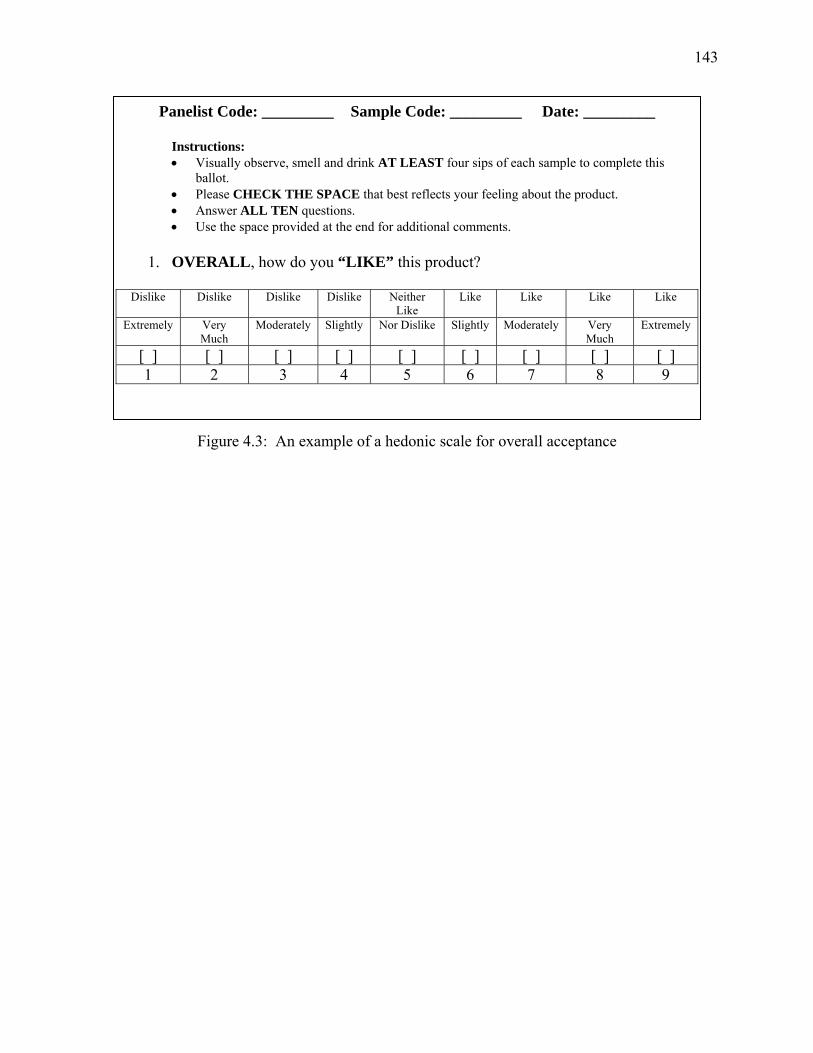
143
Figure 4.3: An example of a hedonic scale for overall acceptance
Panelist Code: _________ Sample Code: _________ Date: _________
Instructions: • Visually observe, smell and drink AT LEAST four sips of each sample to complete this
ballot. • Please CHECK THE SPACE that best reflects your feeling about the product. • Answer ALL TEN questions. • Use the space provided at the end for additional comments.
1. OVERALL, how do you “LIKE” this product?
Dislike Dislike Dislike Dislike Neither
Like Like Like Like Like
Extremely Very Much
Moderately Slightly Nor Dislike Slightly Moderately Very Much
Extremely
[ ] [ ] [ ] [ ] [ ] [ ] [ ] [ ] [ ] 1 2 3 4 5 6 7 8 9
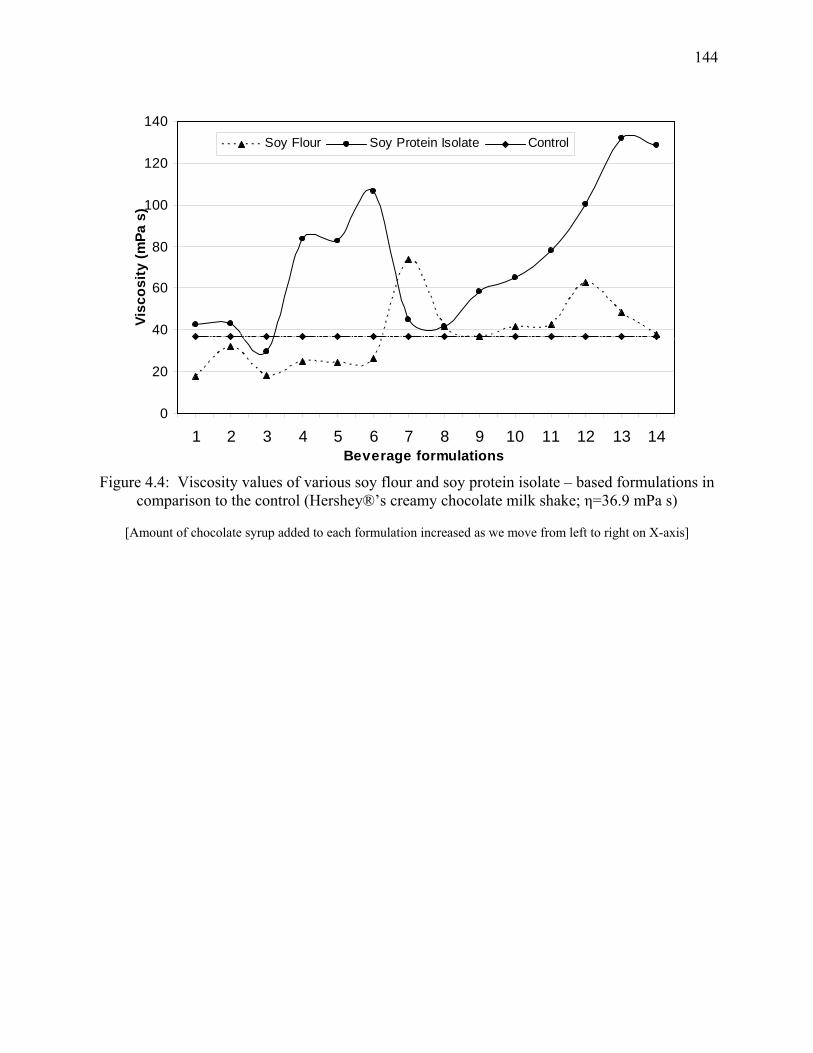
144
36.9 36.9 36.9 36.9 36.9 36.9 36.9 36.9 36.9 36.9 36.9 36.9 36.9 36.9
0
20
40
60
80
100
120
140
1 2 3 4 5 6 7 8 9 10 11 12 13 14Beverage formulations
Visc
osity
(mPa
s)
Soy Flour Soy Protein Isolate Control
Figure 4.4: Viscosity values of various soy flour and soy protein isolate – based formulations in
comparison to the control (Hershey®’s creamy chocolate milk shake; η=36.9 mPa s)
[Amount of chocolate syrup added to each formulation increased as we move from left to right on X-axis]
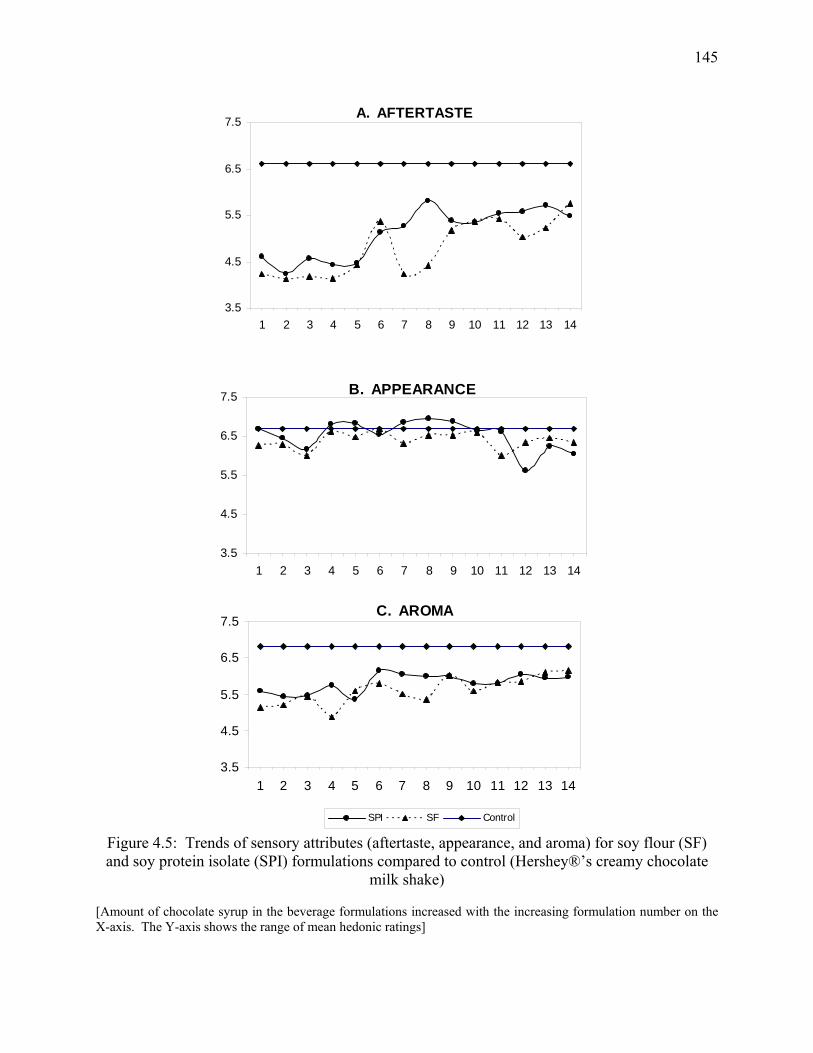
145
A. AFTERTASTE
3.5
4.5
5.5
6.5
7.5
1 2 3 4 5 6 7 8 9 10 11 12 13 14
B. APPEARANCE
3.5
4.5
5.5
6.5
7.5
1 2 3 4 5 6 7 8 9 10 11 12 13 14
C. AROMA
3.5
4.5
5.5
6.5
7.5
1 2 3 4 5 6 7 8 9 10 11 12 13 14
SPI SF Control
Figure 4.5: Trends of sensory attributes (aftertaste, appearance, and aroma) for soy flour (SF) and soy protein isolate (SPI) formulations compared to control (Hershey®’s creamy chocolate
milk shake) [Amount of chocolate syrup in the beverage formulations increased with the increasing formulation number on the X-axis. The Y-axis shows the range of mean hedonic ratings]
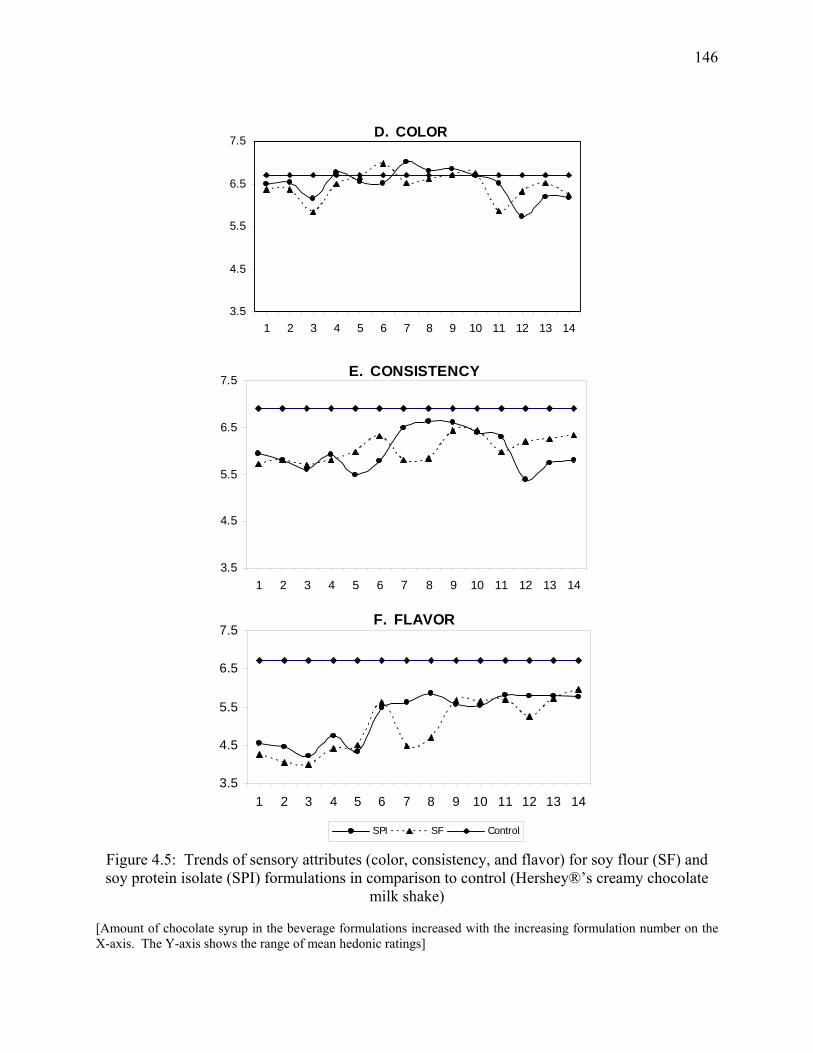
146
D. COLOR
3.5
4.5
5.5
6.5
7.5
1 2 3 4 5 6 7 8 9 10 11 12 13 14
E. CONSISTENCY
3.5
4.5
5.5
6.5
7.5
1 2 3 4 5 6 7 8 9 10 11 12 13 14
F. FLAVOR
3.5
4.5
5.5
6.5
7.5
1 2 3 4 5 6 7 8 9 10 11 12 13 14
SPI SF Control
Figure 4.5: Trends of sensory attributes (color, consistency, and flavor) for soy flour (SF) and soy protein isolate (SPI) formulations in comparison to control (Hershey®’s creamy chocolate
milk shake) [Amount of chocolate syrup in the beverage formulations increased with the increasing formulation number on the X-axis. The Y-axis shows the range of mean hedonic ratings]
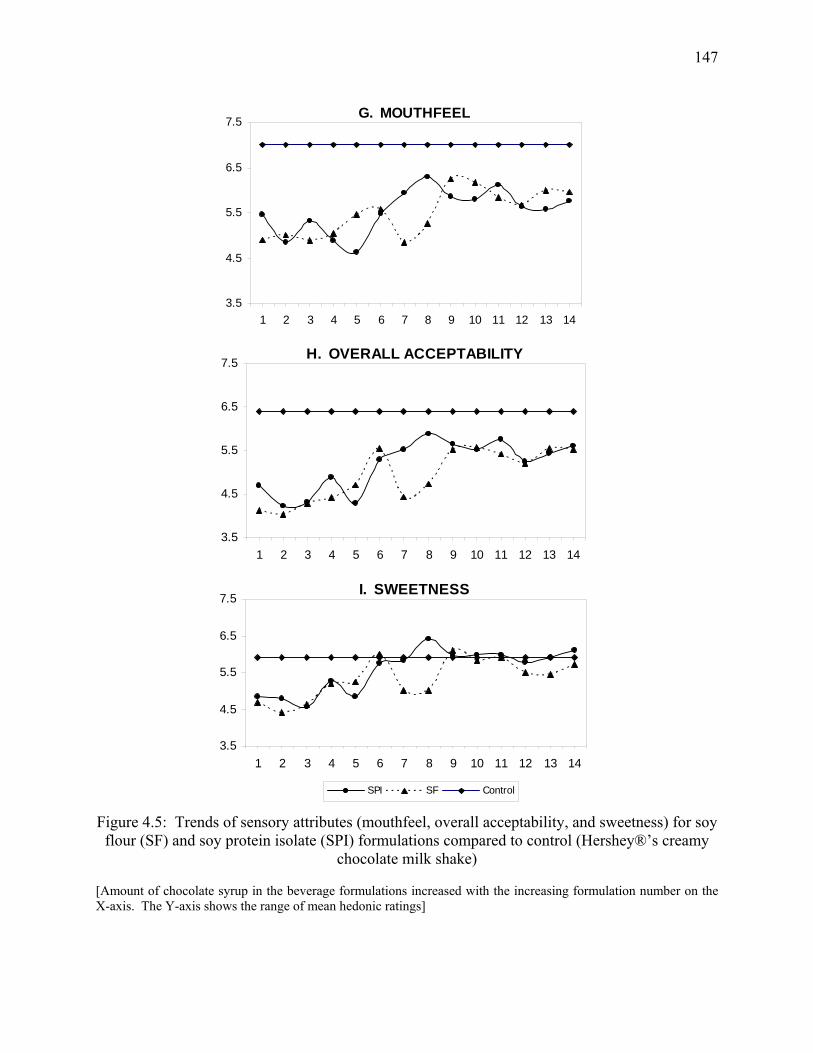
147
G. MOUTHFEEL
3.5
4.5
5.5
6.5
7.5
1 2 3 4 5 6 7 8 9 10 11 12 13 14
H. OVERALL ACCEPTABILITY
3.5
4.5
5.5
6.5
7.5
1 2 3 4 5 6 7 8 9 10 11 12 13 14
I. SWEETNESS
3.5
4.5
5.5
6.5
7.5
1 2 3 4 5 6 7 8 9 10 11 12 13 14
SPI SF Control
Figure 4.5: Trends of sensory attributes (mouthfeel, overall acceptability, and sweetness) for soy
flour (SF) and soy protein isolate (SPI) formulations compared to control (Hershey®’s creamy chocolate milk shake)
[Amount of chocolate syrup in the beverage formulations increased with the increasing formulation number on the X-axis. The Y-axis shows the range of mean hedonic ratings]
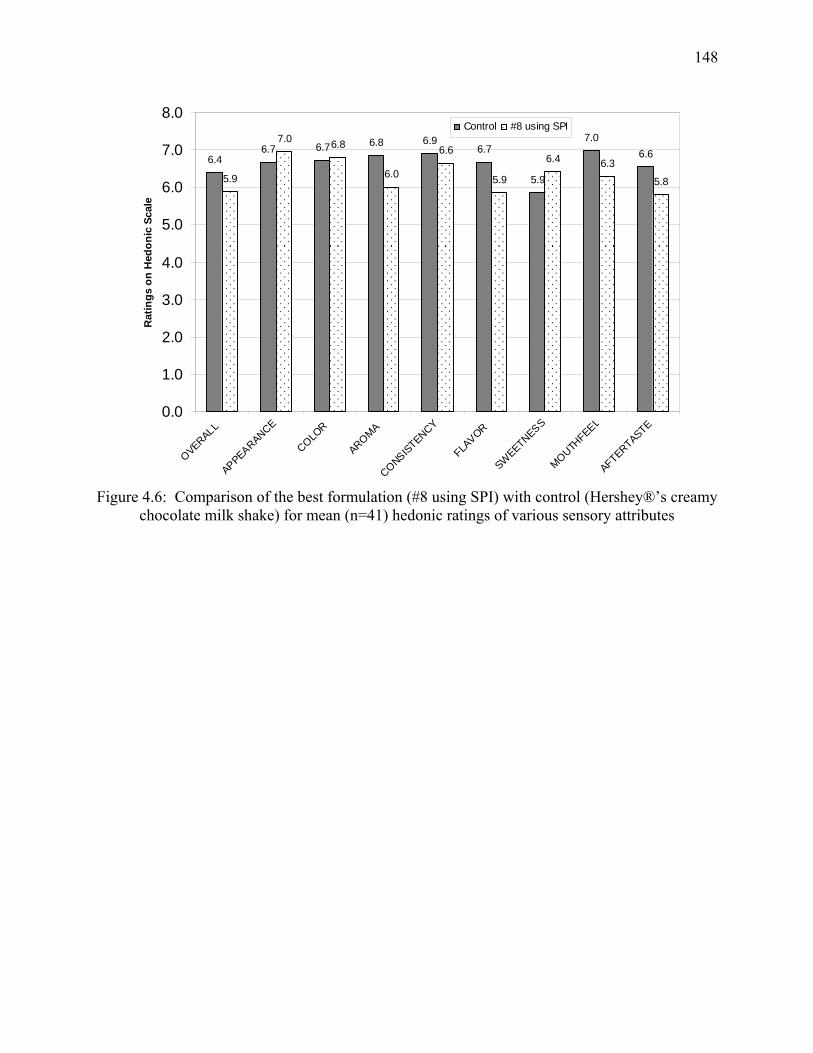
148
6.46.7 6.7 6.8 6.9
6.7
5.9
7.06.6
5.9
7.0 6.8
6.0
6.6
5.9
6.4 6.3
5.8
0.0
1.0
2.0
3.0
4.0
5.0
6.0
7.0
8.0
OVERALL
APPEARANCE
COLOR
AROMA
CONSISTENCY
FLAVOR
SWEETNESS
MOUTHFEEL
AFTERTASTE
Rat
ings
on
Hed
onic
Sca
le
Control #8 using SPI
Figure 4.6: Comparison of the best formulation (#8 using SPI) with control (Hershey®’s creamy
chocolate milk shake) for mean (n=41) hedonic ratings of various sensory attributes
149
CHAPTER 5
OPTIMIZATION OF A CHOCOLATE-FLAVORED, PEANUT-SOY BEVERAGE USING
RESPONSE SURFACE METHODOLOGY (RSM) AS APPLIED TO CONSUMER
ACCEPTABILITY DATA1
_______________________________
1 Deshpande, R. P., Chinnan, M. S., and McWatters, K. H. To be submitted to the Journal of Food Science.
150
ABSTRACT
Optimization of a chocolate-flavored, peanut-soy beverage was done using response surface
methodology (RSM). Twenty-eight beverage formulations were processed by mixing peanut (X1
= 30.6%-58.7%), soy (X2 = 28.3%-43.5%), and chocolate syrup (X3 = 13.0%-25.9%) in the
proportions obtained using a three component, constrained mixture design where, source of soy
was either flour (SF) or protein isolate (SPI). Consumer acceptability was measured in terms of
nine response variables by 41 consumers using a 9-point hedonic scale. Parameter estimates
were determined by performing regression analysis with no intercept option. L-
pseudocomponents were introduced to get equivalent second degree models used to generate
contour plots. Superimposition of contour plots corresponding to each response variable resulted
in optimum regions having consumer acceptability ratings ≥ 5.0; the control (commercial
chocolate milk) ratings were 6.0-7.0. Optimum formulations were all the combinations of
34.1%-45.5% X1, 31.2%-42.9% X2, and 22.4%-24.1% X3 in SF-based formulations and 35.8%-
47.6% X1, 31.2%-43.5% X2, and 18.3%-23.6% X3 in SPI-based formulations.
INDEX WORDS: Optimization, Chocolate-flavored, peanut-soy beverage, Response surface
methodology (RSM), L-pseudocomponents, Contour plots
151
INTRODUCTION
Optimization of all aspects of a product is an effective strategy of accomplishing successful
development of the product. The process of food product development requires intimate
blending of research findings, science, technology, imagination, experience, and skills. It is the
process of initiation and advance, error, iteration, adaptation, and reiteration directed towards an
exclusive goal of a nearly perfect manifestation of the product concept (Segall 2000). The
optimization procedure for product development saves time, ultimately costs less than repeated
consumer testing of one or two products at a time, and provides a level of certainty about the
performance of the product formulation (Fishken 1983). Sensory evaluation is often called upon
to determine whether or not the optimum product has been developed, and response surface
methodology (RSM) is employed for product optimization within the sensory evaluation field
(Giovanni 1983).
Among various categories of new products such as classical innovations, line extensions,
clones and several others (Segall 2000) the chocolate-flavored, peanut-soy beverage developed
in this study falls under the category of ‘Invention’. It has not been previously marketed or
produced but by definition is a novel, unique, and distinctly untried, unfamiliar, or even
previously nonexistent product (Segall 2000). The main intention of development of this product
was utilization of two important vegetable protein sources, peanut and soy, which are readily
available in abundance and at a reasonable price. Proteins are added as ingredients to foods to
achieve functional and nutritional goals (Giese 1994). Peanut protein is deficient with respect to
certain essential amino acids, for example, lysine, tryptophan, threonine and sulfur-containing
amino acids but its true digestibility is comparable with that of animal protein (Singh and Singh
1991). Soybean is very rich in essential nutrients. It is an excellent source of good quality
152
protein equivalent to other animal proteins, such as milk, eggs, meat and fish, and is suitable for
all ages from infants to the elderly (Schaafsma 2000; Sarwar and others 1985; Sarwar 1997;
U.S.D.A. 2000; Riaz 1999). Chocolate has proven to be a popular flavor for soy-based
beverages, due to its ability to mask protein flavor and provide a smooth flavor profile (Wang
and others 2001). Hence, the final product developed as a combination of two proteins with a
chocolate flavor can be expected to have improved essential amino acid profile and pleasant
flavor. However, it is challenging to provide nutritious food that ensures appealing taste, texture,
and appearance. If a food product cannot be re-engineered or modified to fulfill consumer need
and ultimately the demand for the product, thus meeting the benchmark goals, it will not succeed
(Robinson 2000). Thus, involving target consumers in the development process will enhance the
likelihood of obtaining a successful product for the current market place. To obtain first-hand
information on consumer acceptability, the new product developed in this study was evaluated
by consumer sensory analysis.
Data from consumer affective tests are often difficult to understand, hence, graphical
representations are useful in increasing comprehension, for example, scatter plots, bar graphs,
and histograms are especially useful in this task (Resurreccion 1998). Once consumer
acceptance for the product has been quantified, the lower boundary for consumer acceptance
such as “liked slightly” ( = 6) on a 9-point hedonic scale or sometimes an action standard that
specifies a performance requirement for a new or improved product can be set for further
analysis (Resurreccion 1998). The optimal formulation is the one that receives a score equal to
or greater than a chosen value that has been associated with a product’s success (Fishken 1983).
Optimization can be defined as the determination of values for process and formulation variables
that result in a product or products with physical properties and sensory characteristics satisfying
153
such specific predetermined values making them acceptable to consumers (Galvez and others
1995). Modeling of quality or consumer acceptance using response surface methodology (RSM)
can be done in a simplified manner when the effect of two or more variables on product
acceptance and its interrelationship with sensory attribute intensities is of interest (Resurreccion
1998). When RSM is utilized, product optimization time is greatly reduced from traditional
“cook and look” optimization techniques that depend on subjective formulation and evaluation
procedures, and often stop short of fully realized product improvements (Rudolph 2000).
RSM is a designed regression analysis meant to predict the value of a response or
dependent variable based on the controlled values of the experimental factors or independent
variables (Meilgaard and others 1991). RSM is applicable in a wide variety of areas including
food research and has constantly been successfully demonstrated to be used in optimizing: a)
Ingredients (Henselman and others 1974; Johnson and Zabik 1981; Vaisey-Genser and others
1987; Chow and others 1988; Shelke and others 1990); b) Process variables (Oh and others
1985; Floros and Chinnan 1988; Mudahar and others 1990; Galvez and others 1990; Vainionpaa
1991); c) Both ingredient and process variables (Bastos and others 1991).
The objective of this study was to find an optimum chocolate-flavored, peanut-soy
beverage formulation that would have consumer acceptance close to that of commercial
chocolate milk. Since three-dimensional plots as well as contour maps provide useful visual aids
for examining behavior of the response surface and location of the optimum (Vatsala and others
2001), response surface methodology employing mixture design was used to determine the
optimum ratio of peanut, soy (either soy flour, SF, or soy protein isolate, SPI), and chocolate
syrup in the respective SF and SPI formulations.
154
MATERIALS AND METHODS
Materials Soy protein isolate (Prolisse™) and defatted soy flour were obtained from two plants
of Cargill Soy Protein Solutions, one at Sidney, OH, and another at Cedar Rapids, IA,
respectively. Medium roast, partially defatted (12% fat) peanut flour was obtained from Golden
Peanut Co., Alpharetta, Ga. Maltodextrin (AVEBE MD 20) was donated by AVEBE America
Inc., Princeton N.J. Soy lecithin (LECIGRAN™ 5750) was provided by Riceland Foods, Inc.,
Lecithin Division, Stuttgart, Ark. Artificial chocolate flavor was supplied by Carmi Flavor &
Fragrance Co., Inc., Commerce, Calif. The carrageenan stabilizer (Satiagel X-amp 4000) was
provided by Degussa Texturant Systems Sales, LLC, Atlanta, Ga. Sucrose, corn syrup (light),
cocoa powder (Hershey®’s European style, Dutch processed cocoa), vanilla extract (pure),
peanut oil, and salt were purchased locally. The control formulation, commercial chocolate milk
(Hershey®’s creamy chocolate milk shake), was also purchased locally.
New beverage product A new nutritious peanut- and soy-based beverage was developed with
the help of a pilot-plant scale beverage processing protocol involving mixture design (Deshpande
and others Unpublished). A three-component constrained mixture design was developed using
Peanut (X1), Soy (X2; either soy flour, SF or soy protein isolate, SPI) and Chocolate syrup (X3).
The lower and upper bound constraints were determined (Deshpande and others Unpublished)
based on lysine content (Reference lysine content = 51.0 mg/g protein), viscosity (η = 36.9 mPa
s), and visual stability index (VSI = 1.00). The essential amino acid consumption guidelines
(NAP 2002) on lysine gave reference lysine content of 51 mg/g protein. The acceptable range of
viscosity and VSI for the design formulations was based on the viscosity of Hershey®’s creamy
chocolate milk shake and the stability of commercial cow’s milk, respectively.
155
Using design of experiments software: STATISTICA™, Version 6.0 for windows
(StatSoft®, Tulsa, OK, USA), the extreme vertices design for the mixture experiment (McLean
and Anderson 1966) was obtained. The lower and upper bound constraints for each mixture
component (X1: 0.3056-0.5870; X2: 0.2826-0.4352; and X3: 0.1304-0.2593) were used to
generate the design. Joining the vertex points (V1, V2, V3, and V4) resulted in a parallelogram as
an experimental region on a ternary plot with the three components, peanut (X1), soy (X2), and
chocolate or chocolate syrup (X3), representing respective triangular coordinates as shown in
Figure 5.1. The experimental design gave 9 design points (4 vertices, 4 midpoints of the edges
of the parallelogram, and a centroid point). But the minimum number of points (y) needed to
estimate the parameters for the quadratic model for optimization using response surface resulted
in a value of twelve where,
y = q (2q-1)
For q = 3; described as the number of mixture variables in the design (X1, X2, and X3).
Hence the experimental region was represented separately and five additional design
points (C1, C2, C3, C4, and C5) were selected as the centroids of smaller parallelograms. For
example, point C1 was the centroid of smaller parallelogram formed by points V1, M3, C5, and
M1. All of these design points together represented fourteen mixture proportions of the three
components. Two sets of formulations were prepared using such 14 mixture proportions. One
set had soy flour as a source of soy, and another soy protein isolate; all other ingredients and
processing parameters were kept constant. The twenty-eight experimental beverage samples
were formulated in small batches containing 2000 g fixed weight of peanut-soy base stocks
blended in predetermined mixture proportions. These beverage formulations served along with
the control in each sensory sub-session resulted in a total of 32 samples for sensory evaluation.
156
Beverage preparation A pilot-plant scale processing protocol based on the preliminary study of
development of a new chocolate-flavored, peanut-soy beverage (Deshpande and others
Unpublished) was designed for formulating various beverage mixtures. Base stocks of filtered
peanut, soy flour (SF) and soy protein isolate (SPI) slurries were prepared separately for use in
the formulations. Medium roast partially-defatted peanut flour, defatted soy flour, and soy
protein isolate were finely ground. A Morehouse mill (Model M-MS-3, Morehouse Industries,
Los Angeles, Calif.) was used for the dry grinding stage. The ground flours (250 g) and tap
water (2400 g) were mixed and homogenized at room temperature in a laboratory homogenizer
(APV Gaulin Homogenizer Model 15 15MR-8TBA, Everett, Mass.) set at 34474 kPa pressure by
passing five times. The homogenized slurries were filtered through a polyester filter screen with
quoted mesh size of 53 microns (273-mesh). The residues collected on the screen were
discarded and filtrates stored for use as the base stocks.
The chocolate syrup was prepared by mixing the following ingredients in water: sucrose,
corn syrup, maltodextrin, cocoa powder, peanut oil, vanilla extract, salt, soy lecithin, artificial
chocolate flavor, and carrageenan. The dry ingredients were mixed first followed by the addition
of liquid ingredients. The mixture was heated to 75 ºC in a steam kettle with constant stirring by
a hand-held blender. Once the temperature was reached and the syrup was homogenous, it was
ready to be used in the beverage formulations.
The base stocks of peanut slurry, soy slurry (either SF or SPI) and chocolate syrup were
mixed in predetermined proportions suggested by the mixture design. It resulted in twenty-eight
beverage formulations, which were processed further. Each formulation was heated to 75 ºC in a
steam kettle, stirred using a hand-held blender while heating, and then homogenized at 34474
kPa pressure and 72 ºC in a laboratory homogenizer. Pasteurization at 93 ºC for 1 s was done
157
followed by cooling to about 35 ºC in a plate-heat-exchanger (Armfield FT74, UHT Unit,
Armfeild Ltd., Ringwood, Hampshire, England, BH24 1 DY). The beverage thus prepared was
then filled into labeled 250 ml bottles and stored at 4 ºC until presented in sensory evaluation
sessions.
Sensory analysis The consumer acceptance test was conducted in the sensory laboratory of the
Department of Food Science and Technology, University of Georgia, Griffin Campus.
Untrained panelists (n = 41) were recruited from the staff and students of the Griffin campus and
participated voluntarily in the sensory evaluation. Criteria for participation were that panelists
were not allergic to any of the beverage ingredients, consumed chocolate milk or similar flavored
non-carbonated milk-type drink, and liked eating peanuts.
There were five sensory sessions monitored twice a week (two sensory sub-sessions/
week) over a period of one month. The sensory session conducted in the beginning was
considered as a ‘dry-run’ for which all of the sample preparation and sensory evaluation
procedures were similar. Thirty-two samples (8 samples served per sub-session: 7 experimental
beverage formulations and 1 control) were presented in four sessions. Hershey®’s creamy
chocolate milk shake served as the control. A complete randomized block design was used
whereby each panelist evaluated all 32 samples over a period of one month.
Three sensory tests at 9:30 AM, 10:30 AM, and 11:15 AM were performed each Tuesday
and Friday for five consecutive weeks. At the beginning of each test, the panelists were greeted
and briefed about the overall sensory test procedures and use of the sensory booth signal lights.
In the first week, they were requested to read and sign two copies of a consent form. After
confirming that the participants had no allergies towards any of the product ingredients, their
answer was recorded in the space provided on the consent form which was then co-signed by the
158
greeter. Panelists were then led to well-equipped, environmentally-controlled partitioned booths
for the sensory test.
The bottled beverage formulations stored at 4 ºC in a walk-in cooler were transferred into
two ice-filled Styrofoam boxes prior to the sensory sub-session. Care was taken that the samples
were maintained at approximately 5-9 ºC. Each sample was partially filled (about 60 ml) into 90
ml plastic cups and immediately served. The sample cups were labeled using three-digit sample
identification numbers obtained from a random number table. The samples were presented in a
monadic sequential order accompanied by paper ballots (APPENDIX C) to record corresponding
sensory responses. The panelists were instructed to visually observe, smell, and drink at least
four sips of each sample to evaluate overall acceptability, appearance, color, aroma, consistency,
flavor, sweetness, mouthfeel, and aftertaste. A nine-point hedonic scale was used where, 1 =
dislike extremely, 5 = neither like nor dislike, and 9 = like extremely (Peryam and Pilgrim 1957).
Statistical analysis of sensory data and comparison of mean ratings of beverage formulations
with those of the control determined the best formulation.
Statistical methods Statistical software STATISTICA™, Version 6.0 for windows (StatSoft®,
Tulsa, OK, USA) was used for the experimental design and SAS® Proprietary Software,1999-
2001, Release 8.2 for Windows (SAS® Institute Inc., Cary, NC, USA) for data analyses. The
raw data was analyzed by performing regression analysis procedure (PROC REG) with no
intercept option (NOINT) because the model components were required to sum to 100% (or the
three component mixture design in this study had the limitation of X1 + X2 + X3 = 1.0). Two
separate sets of parameter estimates, one for soy flour (SF) and another for soy protein isolate
(SPI) formulations, were obtained by modeling each response variable. Aftertaste, appearance,
aroma, color, consistency, flavor, mouthfeel, overall acceptability, and sweetness were
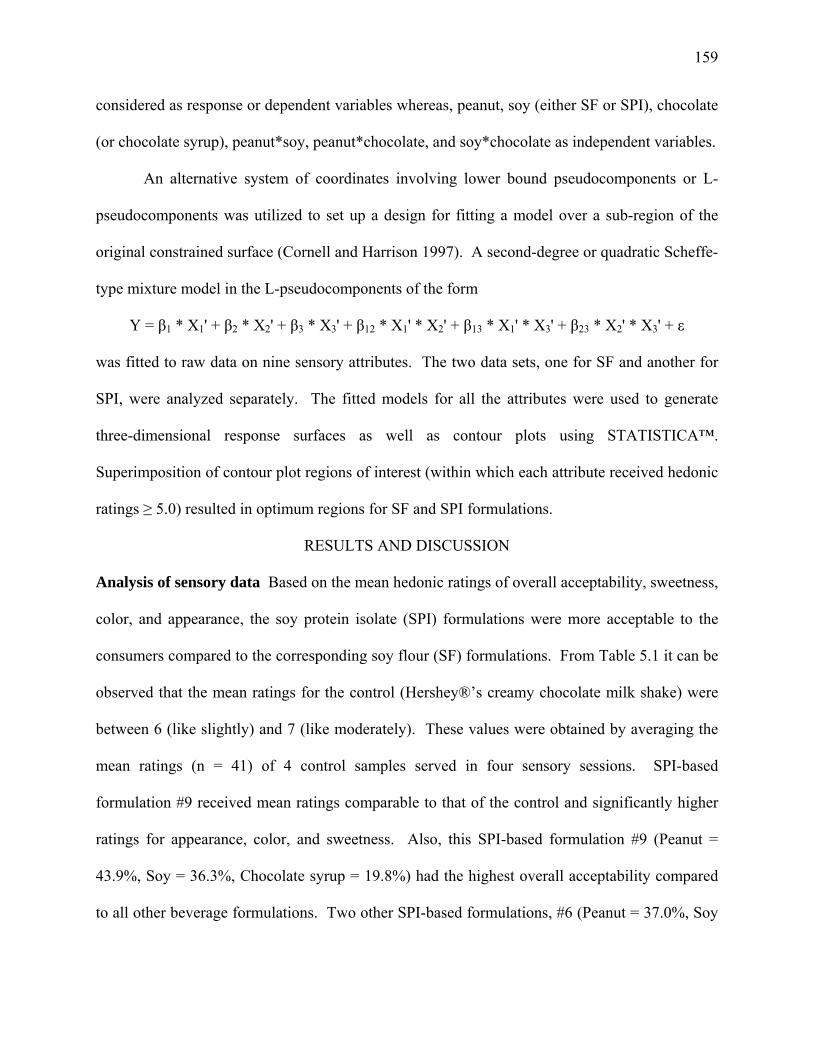
159
considered as response or dependent variables whereas, peanut, soy (either SF or SPI), chocolate
(or chocolate syrup), peanut*soy, peanut*chocolate, and soy*chocolate as independent variables.
An alternative system of coordinates involving lower bound pseudocomponents or L-
pseudocomponents was utilized to set up a design for fitting a model over a sub-region of the
original constrained surface (Cornell and Harrison 1997). A second-degree or quadratic Scheffe-
type mixture model in the L-pseudocomponents of the form
Y = β1 * X1' + β2 * X2' + β3 * X3' + β12 * X1' * X2' + β13 * X1' * X3' + β23 * X2' * X3' + ε
was fitted to raw data on nine sensory attributes. The two data sets, one for SF and another for
SPI, were analyzed separately. The fitted models for all the attributes were used to generate
three-dimensional response surfaces as well as contour plots using STATISTICA™.
Superimposition of contour plot regions of interest (within which each attribute received hedonic
ratings ≥ 5.0) resulted in optimum regions for SF and SPI formulations.
RESULTS AND DISCUSSION
Analysis of sensory data Based on the mean hedonic ratings of overall acceptability, sweetness,
color, and appearance, the soy protein isolate (SPI) formulations were more acceptable to the
consumers compared to the corresponding soy flour (SF) formulations. From Table 5.1 it can be
observed that the mean ratings for the control (Hershey®’s creamy chocolate milk shake) were
between 6 (like slightly) and 7 (like moderately). These values were obtained by averaging the
mean ratings (n = 41) of 4 control samples served in four sensory sessions. SPI-based
formulation #9 received mean ratings comparable to that of the control and significantly higher
ratings for appearance, color, and sweetness. Also, this SPI-based formulation #9 (Peanut =
43.9%, Soy = 36.3%, Chocolate syrup = 19.8%) had the highest overall acceptability compared
to all other beverage formulations. Two other SPI-based formulations, #6 (Peanut = 37.0%, Soy
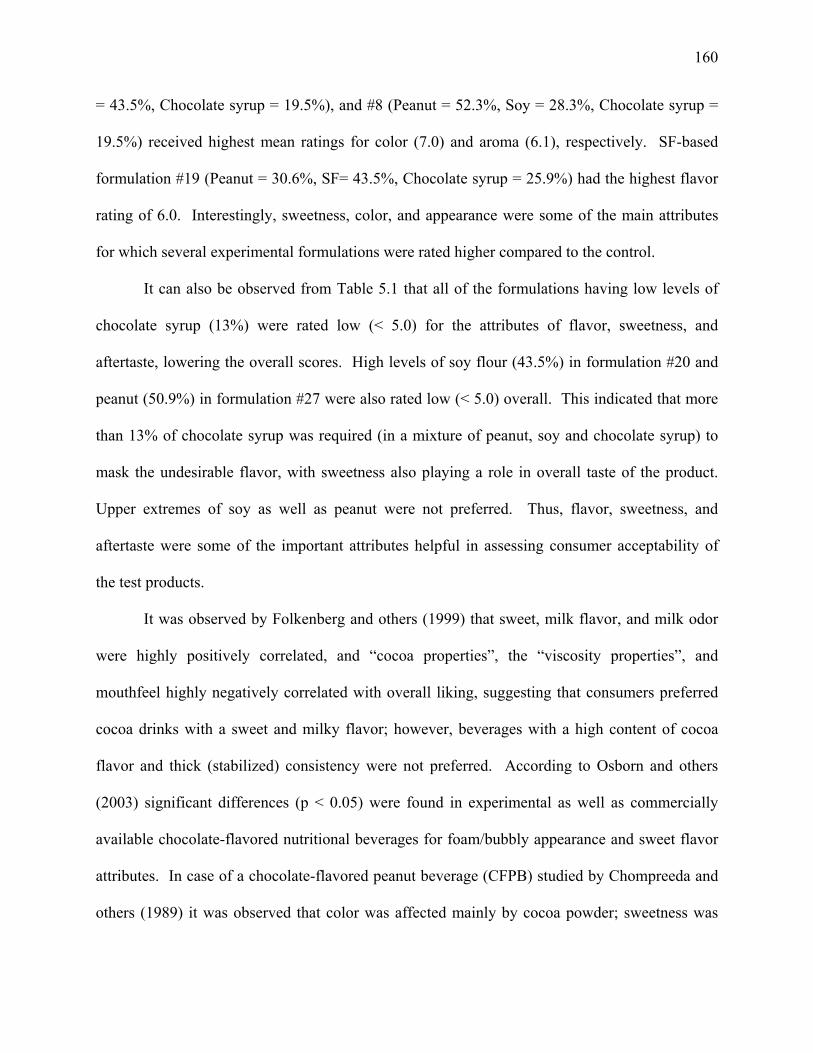
160
= 43.5%, Chocolate syrup = 19.5%), and #8 (Peanut = 52.3%, Soy = 28.3%, Chocolate syrup =
19.5%) received highest mean ratings for color (7.0) and aroma (6.1), respectively. SF-based
formulation #19 (Peanut = 30.6%, SF= 43.5%, Chocolate syrup = 25.9%) had the highest flavor
rating of 6.0. Interestingly, sweetness, color, and appearance were some of the main attributes
for which several experimental formulations were rated higher compared to the control.
It can also be observed from Table 5.1 that all of the formulations having low levels of
chocolate syrup (13%) were rated low (< 5.0) for the attributes of flavor, sweetness, and
aftertaste, lowering the overall scores. High levels of soy flour (43.5%) in formulation #20 and
peanut (50.9%) in formulation #27 were also rated low (< 5.0) overall. This indicated that more
than 13% of chocolate syrup was required (in a mixture of peanut, soy and chocolate syrup) to
mask the undesirable flavor, with sweetness also playing a role in overall taste of the product.
Upper extremes of soy as well as peanut were not preferred. Thus, flavor, sweetness, and
aftertaste were some of the important attributes helpful in assessing consumer acceptability of
the test products.
It was observed by Folkenberg and others (1999) that sweet, milk flavor, and milk odor
were highly positively correlated, and “cocoa properties”, the “viscosity properties”, and
mouthfeel highly negatively correlated with overall liking, suggesting that consumers preferred
cocoa drinks with a sweet and milky flavor; however, beverages with a high content of cocoa
flavor and thick (stabilized) consistency were not preferred. According to Osborn and others
(2003) significant differences (p < 0.05) were found in experimental as well as commercially
available chocolate-flavored nutritional beverages for foam/bubbly appearance and sweet flavor
attributes. In case of a chocolate-flavored peanut beverage (CFPB) studied by Chompreeda and
others (1989) it was observed that color was affected mainly by cocoa powder; sweetness was
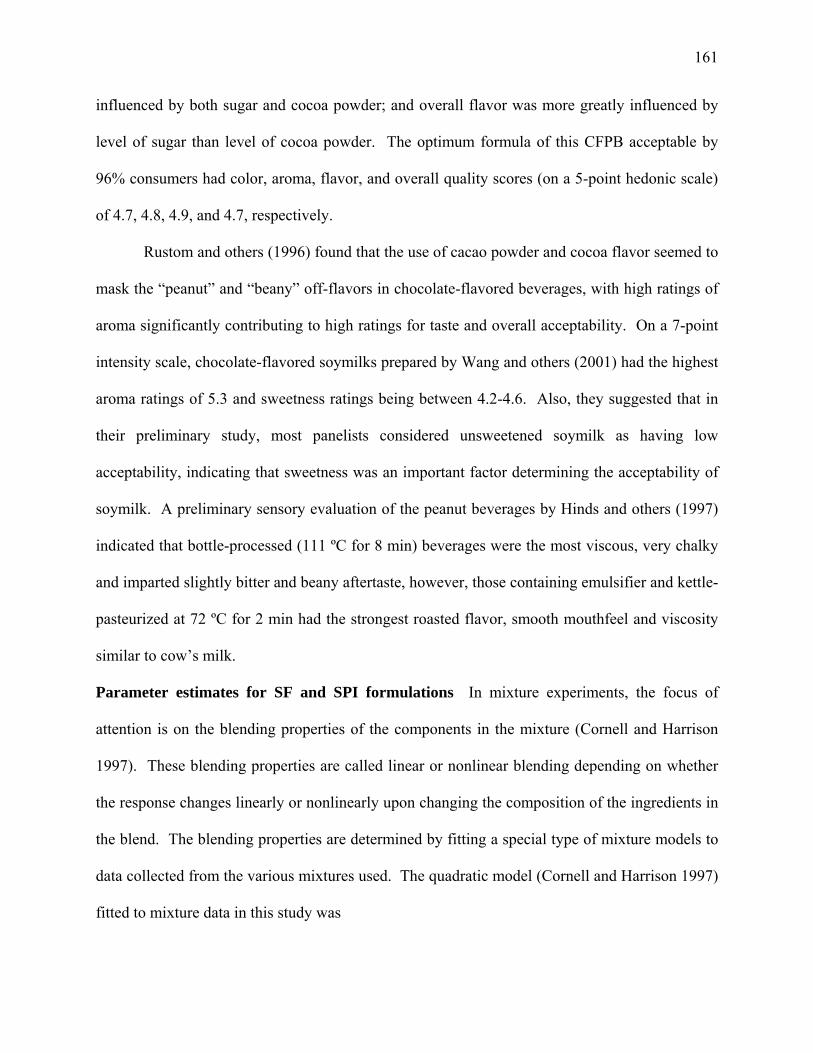
161
influenced by both sugar and cocoa powder; and overall flavor was more greatly influenced by
level of sugar than level of cocoa powder. The optimum formula of this CFPB acceptable by
96% consumers had color, aroma, flavor, and overall quality scores (on a 5-point hedonic scale)
of 4.7, 4.8, 4.9, and 4.7, respectively.
Rustom and others (1996) found that the use of cacao powder and cocoa flavor seemed to
mask the “peanut” and “beany” off-flavors in chocolate-flavored beverages, with high ratings of
aroma significantly contributing to high ratings for taste and overall acceptability. On a 7-point
intensity scale, chocolate-flavored soymilks prepared by Wang and others (2001) had the highest
aroma ratings of 5.3 and sweetness ratings being between 4.2-4.6. Also, they suggested that in
their preliminary study, most panelists considered unsweetened soymilk as having low
acceptability, indicating that sweetness was an important factor determining the acceptability of
soymilk. A preliminary sensory evaluation of the peanut beverages by Hinds and others (1997)
indicated that bottle-processed (111 ºC for 8 min) beverages were the most viscous, very chalky
and imparted slightly bitter and beany aftertaste, however, those containing emulsifier and kettle-
pasteurized at 72 ºC for 2 min had the strongest roasted flavor, smooth mouthfeel and viscosity
similar to cow’s milk.
Parameter estimates for SF and SPI formulations In mixture experiments, the focus of
attention is on the blending properties of the components in the mixture (Cornell and Harrison
1997). These blending properties are called linear or nonlinear blending depending on whether
the response changes linearly or nonlinearly upon changing the composition of the ingredients in
the blend. The blending properties are determined by fitting a special type of mixture models to
data collected from the various mixtures used. The quadratic model (Cornell and Harrison 1997)
fitted to mixture data in this study was
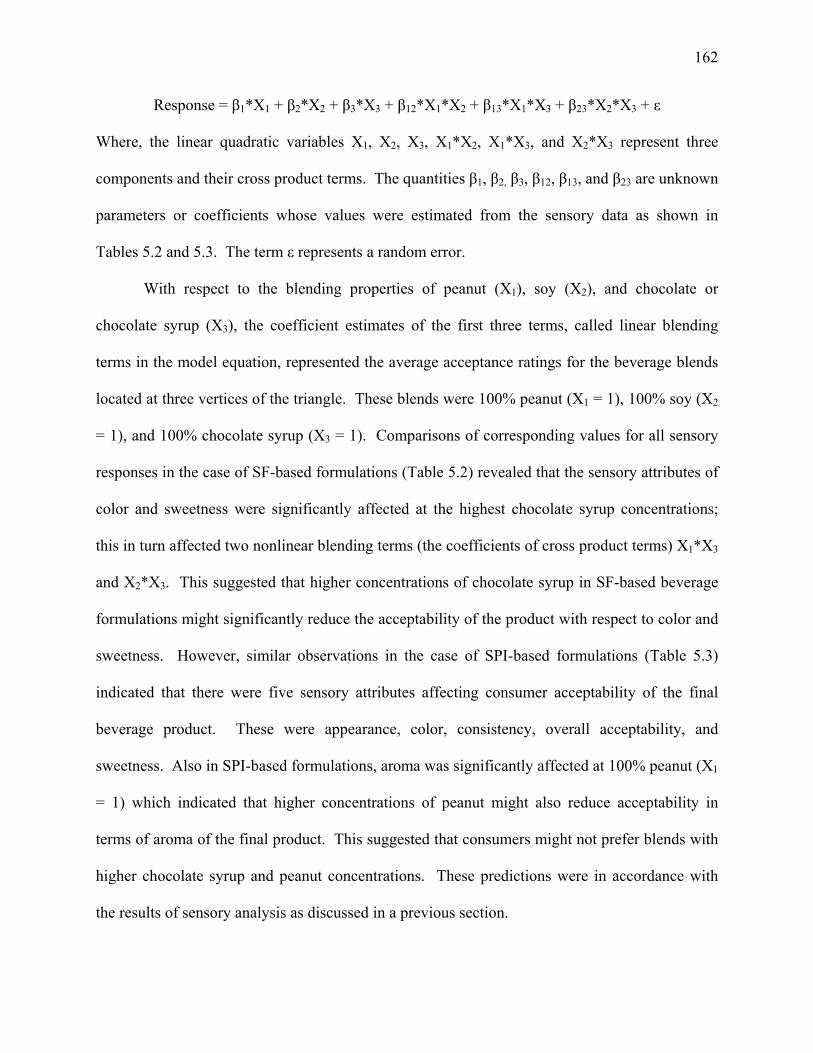
162
Response = β1*X1 + β2*X2 + β3*X3 + β12*X1*X2 + β13*X1*X3 + β23*X2*X3 + ε
Where, the linear quadratic variables X1, X2, X3, X1*X2, X1*X3, and X2*X3 represent three
components and their cross product terms. The quantities β1, β2, β3, β12, β13, and β23 are unknown
parameters or coefficients whose values were estimated from the sensory data as shown in
Tables 5.2 and 5.3. The term ε represents a random error.
With respect to the blending properties of peanut (X1), soy (X2), and chocolate or
chocolate syrup (X3), the coefficient estimates of the first three terms, called linear blending
terms in the model equation, represented the average acceptance ratings for the beverage blends
located at three vertices of the triangle. These blends were 100% peanut (X1 = 1), 100% soy (X2
= 1), and 100% chocolate syrup (X3 = 1). Comparisons of corresponding values for all sensory
responses in the case of SF-based formulations (Table 5.2) revealed that the sensory attributes of
color and sweetness were significantly affected at the highest chocolate syrup concentrations;
this in turn affected two nonlinear blending terms (the coefficients of cross product terms) X1*X3
and X2*X3. This suggested that higher concentrations of chocolate syrup in SF-based beverage
formulations might significantly reduce the acceptability of the product with respect to color and
sweetness. However, similar observations in the case of SPI-based formulations (Table 5.3)
indicated that there were five sensory attributes affecting consumer acceptability of the final
beverage product. These were appearance, color, consistency, overall acceptability, and
sweetness. Also in SPI-based formulations, aroma was significantly affected at 100% peanut (X1
= 1) which indicated that higher concentrations of peanut might also reduce acceptability in
terms of aroma of the final product. This suggested that consumers might not prefer blends with
higher chocolate syrup and peanut concentrations. These predictions were in accordance with
the results of sensory analysis as discussed in a previous section.
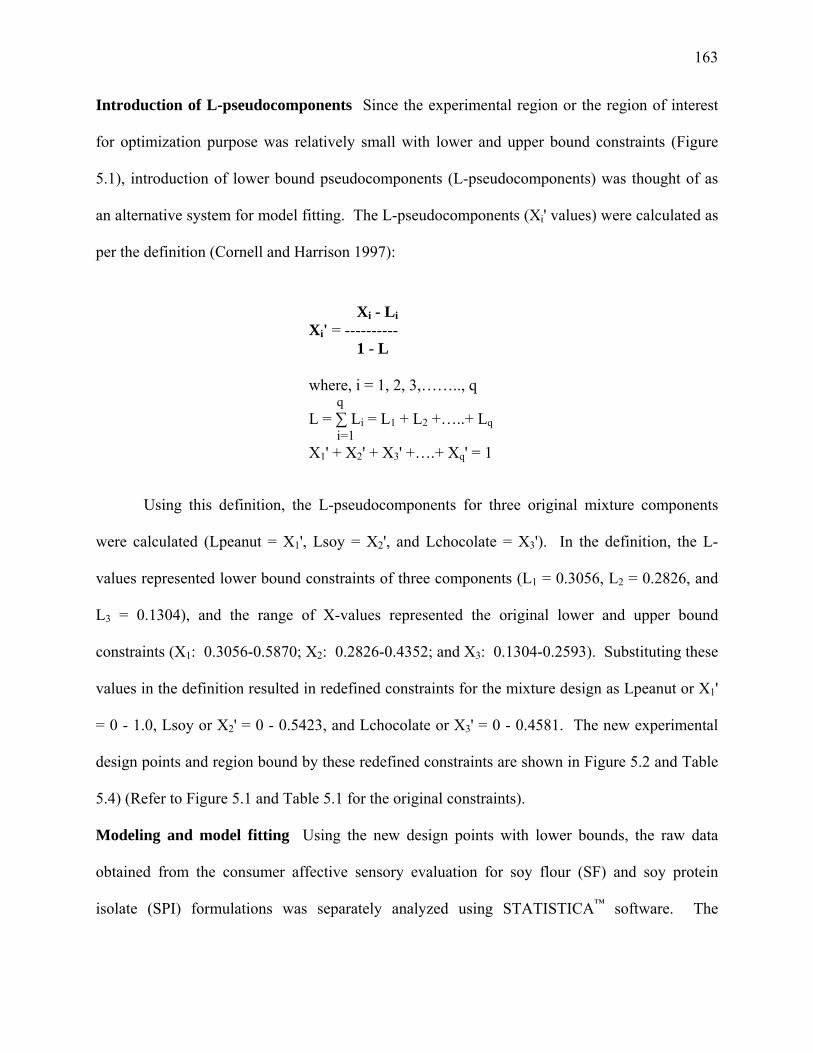
163
Introduction of L-pseudocomponents Since the experimental region or the region of interest
for optimization purpose was relatively small with lower and upper bound constraints (Figure
5.1), introduction of lower bound pseudocomponents (L-pseudocomponents) was thought of as
an alternative system for model fitting. The L-pseudocomponents (Xi' values) were calculated as
per the definition (Cornell and Harrison 1997):
Using this definition, the L-pseudocomponents for three original mixture components
were calculated (Lpeanut = X1', Lsoy = X2', and Lchocolate = X3'). In the definition, the L-
values represented lower bound constraints of three components (L1 = 0.3056, L2 = 0.2826, and
L3 = 0.1304), and the range of X-values represented the original lower and upper bound
constraints (X1: 0.3056-0.5870; X2: 0.2826-0.4352; and X3: 0.1304-0.2593). Substituting these
values in the definition resulted in redefined constraints for the mixture design as Lpeanut or X1'
= 0 - 1.0, Lsoy or X2' = 0 - 0.5423, and Lchocolate or X3' = 0 - 0.4581. The new experimental
design points and region bound by these redefined constraints are shown in Figure 5.2 and Table
5.4) (Refer to Figure 5.1 and Table 5.1 for the original constraints).
Modeling and model fitting Using the new design points with lower bounds, the raw data
obtained from the consumer affective sensory evaluation for soy flour (SF) and soy protein
isolate (SPI) formulations was separately analyzed using STATISTICA™ software. The
Xi - Li Xi' = ---------- 1 - L where, i = 1, 2, 3,…….., q q L = ∑ Li = L1 + L2 +…..+ Lq i=1 X1' + X2' + X3' +….+ Xq' = 1
164
equivalent second degree or Scheffe-type mixture models in the L-pseudocomponents thus
obtained are shown in Tables 5.5 and 5.6.
The quadratic model in the three component proportions was assumed adequate for
describing the shape of the response surface above the constrained region and thus was fitted to
nine sensory attributes or response variables. This resulted in two sets of model equations, one
each for SF and SPI formulations. Since soy flour and soy protein isolate are two separate
ingredients representing source of soy protein (soy: X2'), the consumer acceptability data was
analyzed separately for both sets.
Three dimensional response surfaces for overall acceptability The equivalent second degree
models were further used for generation of contour plots for optimization purpose. Also, the
quadratic models for overall acceptability of SF and SPI formulations were utilized to generate
the three dimensional response surface plots shown in Figure 5.3. The average acceptance scores
were the heights of the estimated general acceptance surface above each of the three vertices of
the triangle in this figure. Comparison of these heights for SF and SPI formulations revealed that
the overall acceptability of SPI formulations was significantly more affected at higher
concentrations of chocolate syrup, whereas for the other two components there was no
significant difference.
Also the comparison of amount or magnitude of the curvature in the shape of the surface
above the X1' – X3' edge of the triangle revealed that change in the proportion of peanut and
chocolate syrup was significant to reduce the overall acceptability scores in the case of SPI
formulations. Similar observations above the X2' – X3' edge showed that changes in chocolate
syrup proportion ultimately affected changes in the proportion of soy in order to achieve
165
maximum overall acceptability of the product. However, this change again was significant only
in the SPI formulations.
Soy beverages look like milk, have good mouthfeel, and clean aftertaste, however, heat
and processing may change the flavor profile of the beverage (Riaz 1999). Temperature
significantly affected viscosity of peanut beverages probably due to changes in protein and
carbohydrate structures (Rubico and others 1988). Protein viscosity is largely affected by heat,
and proteins vary in their ability to withstand high-temperature processing; when heated to a
point of denaturation, irreversible gels form from coagulated protein (Klahorst 2002). Protein
denaturation and aggregation, carragennan interaction with water, hydrated polysaccharide-
protein networks, and hydrated lipid-protein complexes play important roles in controlling
beverage characteristics (Hinds and others 1997). Also, type and amount of stabilizer can
change the physical properties of a peanut-based beverage. It was observed by Schmidt and
others (1980) that increased total solids and increased heat treatment more dramatically increased
the K value (consistency index) for oilseed milks than for NDM (non-fat dry milk) milk, and
storage (10 days at 4ºC) increased K value of SPI milk heated at 80ºC or above. Degree of heat
treatment, total solids content and storage were shown to have a pronounced effect on the
apparent viscosity, consistency index, and yield stress of fortified milk systems (Ramanna and
Ramanathan 1992). Sugars whether sucrose, corn syrup, high fructose corn syrup, fructose, rice
syrup, cane sugar or honey, contribute to viscosity, depending on the level added and other
components of the solution (Klahorst 2002). In this study, since chocolate syrup was prepared
by blending various other ingredients, the increase in chocolate syrup level indicated the
proportional increase in other ingredients. From all of these observations it can be anticipated
that at higher chocolate syrup level together with higher concentrations of other ingredients such
166
as sugar, stabilizer, and cocoa powder, physical and sensory properties of beverage formulations
and overall acceptability would be adversely affected. Similarly, at higher levels of SPI which is
90% protein, the total solids, as well as type of protein interactions, might have been playing
roles in governing the properties of the beverage formulations affecting the overall acceptability.
Generation of contour plots and limit of acceptance The optimization was done by generating
contour plots for each attribute and comparing the SF and SPI plots for respective attributes
(Figures 5.4, 5.5, and 5.6). Since optimization is essentially the determination of values of
formulation variables that result in a product having physical and sensory characteristics
satisfying specific predetermined values making them acceptable to consumers (Galvez and
others 1995), the lower limit of consumer acceptability in this study was determined from the
acceptability scores of the control (Hershey®’s creamy chocolate milk shake). It was observed
that the average consumer acceptability ratings for the control when all nine attributes were
considered ranged from 6.0 (like slightly) to 7.0 (like moderately) on a 9-point hedonic scale
(Table 5.1). Hence, the lower limit of acceptability for both SF and SPI formulations was
decided to be consumer ratings ≥ 5.0 for all of the attributes.
When many factors and interactions affect a desired response, response surface
methodology (RSM) is an effective tool for optimizing the process, and contour plots can be
usefully employed to study the response surface and locate the optimum (Rustom and others
1991). To achieve the objective of developing products with optimal sensory acceptance, one
must identify those properties and levels that are important for acceptance (Schutz 1983). RSM
was used to optimize formulations of chocolate peanut spread by using a three-component
constrained simplex lattice design where the optimum formulations were those having consumer
acceptance rating of ≥ 6.0 for all attributes (Chu and Resurreccion 2004). In an optimization
167
study done by Galvez and others (1995), consumer acceptance ratings for two commercial
mungbean noodle samples were used in order to attain the optimum formulation. Contour plots
were developed, having shaded areas representing the optimum ranges for consumer acceptance
of attributes tested which satisfied acceptance ratings described for commercial samples; the
optimum region was found by outlining the regions representing the overlap of the shaded areas.
RSM using mixture design was also used to determine the optimum ratio of pineapple, papaya,
and carambola in the formulation of reduced calorie tropical mixed fruit jam (Abdullah and
Cheng 2001). In this study, the sensory rating limit of acceptance for viscosity (3.4-4.4), aroma
(4.1), sourness (3.7-4.3), color (3.7), and overall acceptability (4.8) was based on the closeness of
the attributes to the acceptance of the commercial product. To obtain the optimum region,
contour plots with limits of acceptance were superimposed, and the shaded region where
contours within limits of acceptance overlapped was considered the predicted optimum region.
Comparison of SF and SPI formulations from contour plots Once the lower limit of
acceptance for experimental formulations was decided, the regions of acceptability (the region
with ratings ≥ 5.0) for each attribute were determined. These regions were marked as separate
areas represented as circular boundaries as shown in the contour plots. The dashed lines in these
diagrams represent the constrained region of experimental formulations. The numbers represent
hedonic mean ratings corresponding to each contour line in ternary graphs plotted with L-
pseudocomponents. The comparison of such areas in each case for SF and SPI formulations
revealed that SPI formulations had a larger range of acceptability, especially for the attributes of
consistency, flavor, overall acceptability, and sweetness (Figure 5.5 and 5.6). For the attributes
of appearance, aroma, color, consistency, and sweetness, SPI formulations received ratings ≥ 6.0
indicating that they were rated similar to the control; for SF formulations, appearance, color and
168
mouthfeel were the attributes with ratings ≥ 6.0. The attributes which can be considered
responsible for low acceptability of SF formulations might be aftertaste, consistency, flavor, and
overall acceptability, since the areas of acceptability were smaller compared to other attributes.
Similarly, in the case of SPI formulations, attributes that limited acceptance were aftertaste,
aroma, flavor, and mouthfeel. On the whole, SPI formulations seemed to have a better chance of
success compared to the SF formulations when judged for all of the sensory attributes considered
together.
Optimization with the help of contour plots In order to determine the optimum formulation,
the regions of acceptability in the contour plot for each attribute were superimposed. The area of
overlap thus obtained is represented as the shaded region in both SF and SPI formulations
(Figure 5.7). The shaded regions indicate that any point within this area represents a
combination of peanut, soy (either SF or SPI), and chocolate syrup (a liquid blend of various
other ingredients) that would result in consumer acceptance ratings ≥ 5.0 for all of the sensory
attributes tested, and would be comparable to the commercial chocolate milk (Hershey®’s
creamy chocolate milk shake). An optimal formulation maximizes consumer acceptance which
means that it is the best formulation possible with a fixed set of ingredients, and any other
formulation will not perform as well as the optimal (Fishken 1983).
Formulations incorporating SPI resulted in a larger area of overlap. Aroma and aftertaste
were the most important attributes limiting the level of maximum consumer acceptability. It can
be observed that higher levels of peanut or lower levels of chocolate syrup reduced acceptability
ratings for both aftertaste and aroma. Concentration of soy protein isolate was acceptable over a
larger range than soy flour, however, peanut and chocolate syrup levels both at high and low
ends were the limiting factors deciding consumer preferences. The optimum formulations for
169
SPI-based beverage formulations were determined as all combinations of 35.8%-47.6% peanut,
31.2%-43.5% soy protein isolate, and 18.3%-23.6% chocolate syrup, adding up to 100%.
Formulations incorporating SF resulted in a smaller area of overlap than SPI. In this case
also, aroma and aftertaste were the most important attributes limiting the level of maximum
consumer acceptability. Observations similar to SPI formulations indicated that these attributes
were governed by peanut and chocolate syrup levels limiting the consumer acceptability. The
optimum formulations for SF-based beverage formulations were determined as all combinations
of 34.1%-45.5% peanut, 31.2%-42.9% soy flour, and 22.4%-24.1% chocolate syrup, adding up
to 100%.
The levels of third mixture component chocolate or Lchocolate (X3 or X3') represented
the levels of chocolate syrup added in the mixture to obtain the final beverage formulation. The
chocolate syrup was prepared by mixing various other ingredients such as stabilizers,
emulsifiers, sweeteners, and flavor additives in the predetermined proportions. [The exact
proportions of these ingredients have not been disclosed since the product being developed is an
invention under review by The University of Georgia Research Foundation, Inc., Athens, Ga., U.
S. A.]. Any change in the level of chocolate or Lchocolate thus indicated proportional change in
all those ingredients that form the chocolate syrup. From the two optimum regions, it can be
seen that the acceptable range of chocolate syrup was significantly lower in beverages prepared
from soy flour as compared to those from soy protein isolate. Even though the range was low,
the level of chocolate syrup acceptable in SF formulations was high. Comparatively higher
levels of peanut and soy were acceptable in SPI formulations, whereas lower levels of chocolate
syrup were preferred. In general, a larger number of acceptable formulations can be prepared
using soy protein isolate as a source of soy protein than soy flour in combination with peanut and
170
chocolate syrup (all three adding up to 100%) when a chocolate-flavored, peanut-soy beverage is
prepared.
Utilization of soy protein isolate as a soy protein source The advantages of using of soy
protein isolate (SPI) as against soy flour in the beverage product can be recognized due to higher
processing efficiency, better nutritional properties, and higher consumer acceptability of the final
product prepared from SPI. From the preliminary studies (data not shown), it was observed that
SPI was completely soluble in water. The milling treatment given at the dry powder stage
followed by homogenization with water reduced the size of SPI particles such that a negligible
amount of residue was discarded after filtration. Since filtration was the most time-consuming
operation, use of SPI not only saved processing time but also gave maximum protein recovery.
Since the main objective of utilizing soy was to supplement essential amino acids, the final
beverage can be expected to have an improved nutritional profile because of minimum
processing losses. The price (per kg) of SPI, however, was higher compared to that of soy flour.
But considering the other advantages, it can be concluded that SPI would be a better option than
soy flour as a source of soy protein in the chocolate-flavored, peanut-soy beverage.
Besides providing an alternative to traditional dairy products, soy protein is being
incorporated into many of today’s nutritious meal-replacement beverages, and various
commercial products now take advantage of these characteristics offered by soy proteins (Riaz
1999). Isolated soy proteins (minimum 90% protein content) are virtually pure, bland-flavored,
and the most functional of the soy proteins having excellent nutritional qualities. Some isolates
can be used to provide an elastic gel texture, imparting an interesting mouthfeel, while others
control viscosity in drinks, making them creamier or full bodied. Some can emulsify fat and
bind water and are designed to function in a given system in exactly the same way as animal
171
proteins (Riaz 1999). Soy protein isolates are a highly digestible source of amino acids which
are regarded as the protein building blocks needed for proper human growth and maintenance
(Roberts 2003).
Future studies Optimization using response surface methodology resulted in a combination of
ingredients which can be expected to give a beverage product with maximum consumer
acceptability and a product similar to commercial chocolate milk. However, validation of the
optimum region can be done by choosing some combinations in the optimum region and some
outside, for both soy flour- and soy protein isolate-based formulations. Also, a shelf-life study of
the new protein-based nutritious beverage would be a good approach to determine keeping
quality. This would be essential for introduction of the new product into the competitive market.
Another important aspect is studying nutritional profile of the new product, which will also help
in marketing the product based on its compositional and functional benefits.
CONCLUSIONS
The optimization of chocolate-flavored, peanut-soy beverage was accomplished by the use of a
consumer affective sensory evaluation study. Response surface methodology was applied to
obtain quadratic or second degree response surface model equations. The contour plots were
generated, and superimposition of the regions of acceptance (consumer ratings ≥ 5.0 for all of the
sensory attributes) gave optimum regions for soy flour (SF) and soy protein isolate (SPI)
formulations. They were combinations of 34.1%-45.5% peanut, 31.2%-42.9% soy, and 22.4%-
24.1% chocolate syrup in the case of SF formulations, and 35.8%-47.6% peanut, 31.2%-43.5%
soy, and 18.3%-23.6% chocolate syrup, in the case of SPI formulations. The chocolate syrup
used in this study was a liquid blend of various other ingredients and hence change in the levels
of chocolate syrup indicated proportional change in all those other ingredients. The optimum
172
ranges as well as comparison of contour plots indicated that SPI formulations were more
acceptable than those with SF and that a greater number of acceptable formulations can be
prepared using SPI in combination with peanut and chocolate syrup such that all the three
components add up to 100%. The SPI was a better choice than SF as a source of soy protein
since it increased the processing efficiency; SPI can also be expected to give a nutritionally
superior beverage product with high consumer acceptability and sensory characteristics
comparable to commercial chocolate milk. The goal of utilizing of peanut, soy, and chocolate
together in a new beverage product acceptable to target consumers was accomplished.
173
REFERENCES Abdullah A and Cheng TC. 2001. Optimization of reduced calorie tropical mixed fruit jam.
Food Quality and Preference 12:63-68.
Bastos DHM, Domenech CH, and Areas JAG. 1991. Optimization of extrusion cooking of lung
proteins by response surface methodology. International Journal of Food Science and
Technology 26:403-408.
Chompreeda P, Haruthaithanasan V, Oupadissakoon C, and Suknak K. 1989. A research note:
Development of a chocolate flavored peanut beverage. Journal of Food Science 54(5):1359-
1360.
Chow ETS, Wei LS, Devor RE, and Steinberg, MP. 1988. Performance of ingredients in a
soybean whipped topping: A response surface analysis. Journal of Food Science 53:1761-
1765.
Chu CA and Resurreccion AVA. 2004. Optimization of a chocolate flavored peanut spread
using response surface methodology (RSM). Journal of Sensory Studies 19(3):237-260.
Cornell JA and Harrison JM. 1997. Models and designs for experiments with mixtures. Part II-
Exploring a sub-region of the simplex and the inclusion of other factors in mixture
experiments. Technical Bulletin 899. University of Florida, Agriculture Experiment Station,
Institute of Food and Agricultural Sciences. 78 p.
Deshpande RP, Chinnan MS, and Phillips RD. Unpublished. Formulation and processing
protocol of a chocolate-flavored, peanut-soy beverage. To be submitted to the Journal of
Food Science.
Fishken D. 1983. Consumer-oriented product optimization. Food Technology 37(11):49-52.
Floros JD and Chinnan MS. 1988. Seven factor response surface optimization of a double-stage
lye (NaOH) peeling process for pimiento peppers. Journal of Food Science 53:631-638.
174
Folkenberg DM, Bredie WLP, and Martens M. 1999. What is mouthfeel? Sensory-rheological
relationships in instant hot cocoa drinks. Journal of Sensory Studies 14:181-195.
Galvez FCF, Resurreccion AVA, and Koehler PE. 1990. Optimization of processing of peanut
beverage. Journal of Sensory Studies 5:1-17.
Galvez FCF, Resurreccion AVA and Ware GO. 1995. Formulation and process optimization of
mungbean noodles. Journal of Food Processing and Preservation 19:191-205.
Giese J. 1994. Proteins as ingredients: Types, Functions, Applications. Food Technology
48(10):50-60.
Giovanni M. 1983. Response surface methodology and product optimization. Food Technology
37(11):41-45, 83.
Henselman MR, Donatoni SM, and Henika RG. 1974. Use of response surface methodology in
the development of acceptable high protein bread. Journal of Food Science 39:943-946.
Hinds MJ, Beuchat LR, and Chinnan MS. 1997. Properties of a thermal-processed beverage
prepared from roasted partially defatted peanuts. International Journal of Food Science and
Technology 32:203-211.
Johnson TM and Zabik ME. 1981. Response surface methodology for analysis of protein
interactions in angel food cakes. Journal of Food Science 46:1226-1230.
Klahorst SJ. 2002. Beverage viscosity, any way you like it! Available from
http://www.foodproductdesign.com/archive/2002/0102AP.html. Accessed on 11/15/02.
McLean RA and Anderson VL. 1966. Extreme vertices design of mixture experiments.
Technometrics 8(3):447-454.
Meilgaard M, Civille GV, and Carr BT. 1991. Sensory Evaluation Techniques. 2nd edition.
Florida: CRC Press, Boca Raton.
175
Mudahar GS, Toledo RT, and Jen JJ. 1990. A response surface methodology approach to
optimize potato dehydration process. Journal of Food Processing and Preservation 14:93-
106.
National Academies Press (NAP). 2002. Protein and amino acids (Chapter 10). In: Dietary
Reference Intakes for Energy, Carbohydrate, Fiber, Fat, Fatty Acids, Cholesterol, Protein,
and Amino Acids (Macronutrients). Available from
http://www.nap.edu/books/0309085373/html. Accessed on 09/ 2003. p 465-608.
Oh NH, Seib PA, and Chung DS. 1985. Noodles: III. Effects of processing variables on quality
characteristics of dry noodles. Cereal Chemistry 62:437-440.
Osborn HT, Shewfelt RL, and Akoh CC. 2003. Sensory evaluation of a nutritional beverage
containing canola oil/caprylic acid structural lipid. Journal of the American Oil Chemists
Society 80(4):357-360.
Peryam DR and Pilgrim FJ. 1957. Hedonic scale method for measuring food preferences. Food
Technology 11(9):9-14. (Symposium: Studies in Food Science and Technology-
Methodology of Sensory Testing- Contributions to the IFT Symposium in Pittsburgh).
Ramanna SV and Ramanathan G. 1992. Effect of processing and storage on rheological
properties of fortified milk and curd systems. International Journal of Food Science and
Technology 27:305-312.
Resurreccion AVA. 1998. Consumer Sensory Testing for Product Development. Maryland:
Chapman & Hall Food Science Book, Aspen Publishers, Inc., Gaithersburg. 254 p.
Riaz MN. 1999. Soybeans as functional foods. Cereal Foods World 44(2):88-92.

176
Roberts WA, Jr. 2003. Ingredients in use: soy proteins. (formulation & ingredient challenges).
Prepared Foods. October. Available from www.preparedfoods.com. Accessed on
01/17/2004.
Robinson L. 2000. The marketing drive for new food products. In: Brody AL, Lord JB, editors.
Developing New Food Products for a Changing Marketplace. Pennsylvania: Technomic
Publishing Co., Inc., Lancaster. p 19-27.
Rubico SM, Resurreccion AVA, and Beuchat LR. 1988. Comparison of sensory properties and
headspace volatiles of a peanut beverage processed at different temperature and time
conditions. Journal of Food Science 53(1):176-180.
Rudolph MJ. 2000. The food product development process. In: Brody AL, Lord JB, editors.
Developing New Food Products for a Changing Marketplace. Pennsylvania: Technomic
Publishing Co., Inc., Lancaster. p 98.
Rustom IYS, Lopez-Leiva MH, and Nair BM. 1991. Optimization of extraction of peanut
proteins with water by response surface methodology. Journal of Food Science 56(6):1660-
1663.
Rustom IYS, Lopez-Leival MM, and Nair BM. 1996. UHT-sterilized peanut beverages:
Kinetics of physicochemical changes during storage and shelf-life prediction modeling.
Journal of Food Science 61(1):198-203, 208.
Sarwar G. 1997. The protein digestibility-corrected amino acid score method overestimates
quality of proteins containing anti-nutritional factors and of poorly digestible proteins
supplemented with limiting amino acids in rats. Journal of Nutrition 127:758-64.
177
Sarwar S, Peace RW, Botting HG. 1985. Corrected relative net protein ratio (CRNPR) method
based on differences in rat and human requirements for sulfur amino acids. Journal of the
American Oil Chemists Society 68:689-693.
Schaafsma G. 2000. The protein digestibility-corrected amino acid score. Journal of Nutrition
130:1865S-7S.
Schmidt RH, Sistrunk CP, Richter RL, and Cornell JA. 1980. Heat treatment and storage effects
on texture characteristics of milk and yoghurt systems fortified with oilseed proteins. Journal
of Food Science 45:471-475.
Schutz HG. 1983. Multiple regression approach to optimization. Food Technology 37(11):46-
48, 62.
Segall S. 2000. New food products: Technical development. In: Brody AL, Lord JB, editors.
Developing New Food Products for a Changing Marketplace. Pennsylvania: Technomic
Publishing Co., Inc., Lancaster. p 217-258.
Shelke K, Dick JW, Holm YF, and Loo KS. 1990. Chinese wet noodle formulation: A response
surface methodology study. Cereal Chemistry 67:338-342.
Singh B and Singh U. 1991. Peanut as a source of protein for human foods. Plant Foods for
Human Nutrition 41:165-177.
United States Department of Agriculture. 2000. Modification of the vegetable protein products
requirements for the national school lunch program, school breakfast program, summer food
service program and child and adult care food program. Federal Register 2000; 7 CFR Parts
210, 215, 220, 225, and 226:12429-12442.
Vainionpaa J. 1991. Modeling of extrusion cooking of cereals using response surface
methodology. Journal of Food Engineering 13:1-26.
178
Vaisey-Genser M, Ylimaki G, and Johnston B. 1987. The selection of levels of canola oil,
water, and an emulsifier system in cake formulations by response surface methodology.
Cereal Chemistry 64:50-54.
Vatsala CN, Saxena CD, and Rao PH. 2001. Optimization of ingredients and process conditions
for the preparation of puri using response surface methodology. International Journal of
Food Science and Technology 36:407-414.
Wang B, Xiong YL, and Wang C. 2001. Physicochemical and sensory characteristics of
flavored soymilk during refrigeration storage. Journal of Food Quality 24:513-526.
179
ACKNOWLEDGEMENTS
This research study was funded by the United States Agency for International Development/
Peanut Collaborative Research Support Program (USAID/Peanut CRSP) Grant #LAG-G-00-96-
90013-00. We are thankful for the voluntary participation and cooperation of consumer panelists
during the study. We recognize the value of technical assistance provided by Mr. Glenn Farrell,
sensory support by Mrs. Sue Ellen McCullough and Mrs. Vijaylakshmi Mantripragada, statistical
guidance by Mr. Jerry Davis and Dr. F. K. Saalia, all from the University of Georgia, Griffin
Campus, Ga.
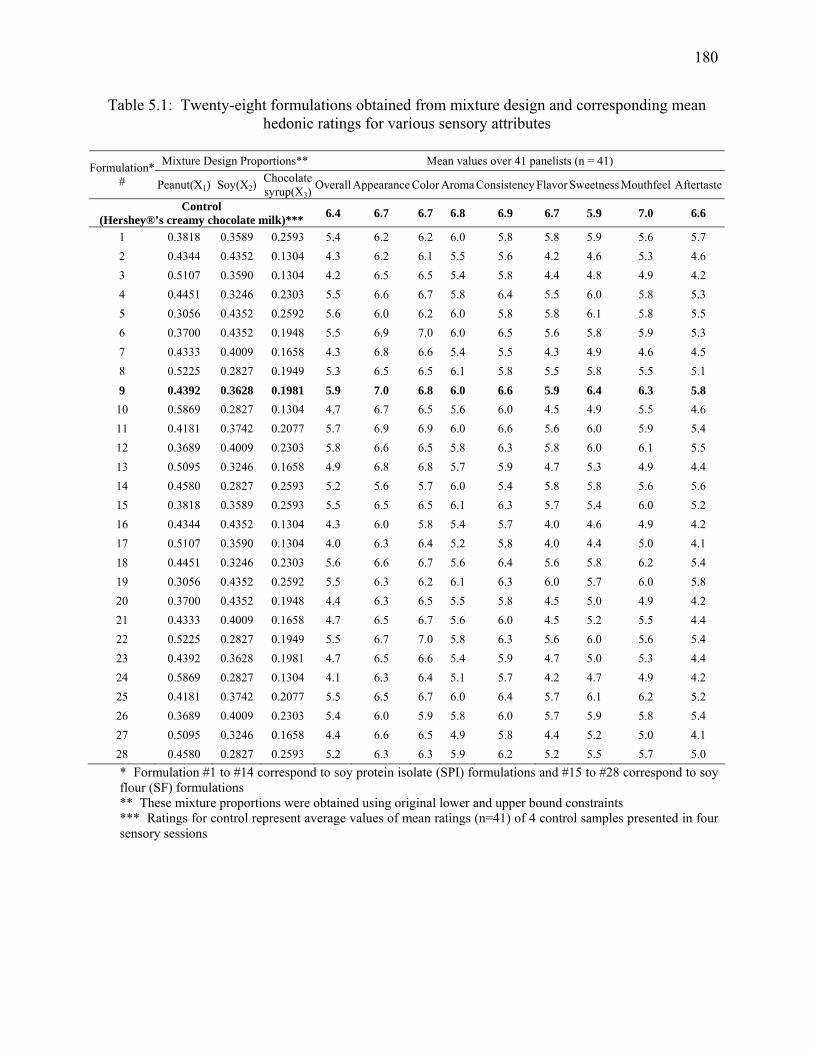
180
Table 5.1: Twenty-eight formulations obtained from mixture design and corresponding mean hedonic ratings for various sensory attributes
Mixture Design Proportions** Mean values over 41 panelists (n = 41) Formulation*
# Peanut(X1) Soy(X2) Chocolate syrup(X3)
Overall Appearance Color Aroma Consistency Flavor Sweetness Mouthfeel Aftertaste
Control (Hershey®’s creamy chocolate milk)*** 6.4 6.7 6.7 6.8 6.9 6.7 5.9 7.0 6.6
1 0.3818 0.3589 0.2593 5.4 6.2 6.2 6.0 5.8 5.8 5.9 5.6 5.7 2 0.4344 0.4352 0.1304 4.3 6.2 6.1 5.5 5.6 4.2 4.6 5.3 4.6 3 0.5107 0.3590 0.1304 4.2 6.5 6.5 5.4 5.8 4.4 4.8 4.9 4.2 4 0.4451 0.3246 0.2303 5.5 6.6 6.7 5.8 6.4 5.5 6.0 5.8 5.3 5 0.3056 0.4352 0.2592 5.6 6.0 6.2 6.0 5.8 5.8 6.1 5.8 5.5 6 0.3700 0.4352 0.1948 5.5 6.9 7.0 6.0 6.5 5.6 5.8 5.9 5.3 7 0.4333 0.4009 0.1658 4.3 6.8 6.6 5.4 5.5 4.3 4.9 4.6 4.5 8 0.5225 0.2827 0.1949 5.3 6.5 6.5 6.1 5.8 5.5 5.8 5.5 5.1 9 0.4392 0.3628 0.1981 5.9 7.0 6.8 6.0 6.6 5.9 6.4 6.3 5.8 10 0.5869 0.2827 0.1304 4.7 6.7 6.5 5.6 6.0 4.5 4.9 5.5 4.6 11 0.4181 0.3742 0.2077 5.7 6.9 6.9 6.0 6.6 5.6 6.0 5.9 5.4 12 0.3689 0.4009 0.2303 5.8 6.6 6.5 5.8 6.3 5.8 6.0 6.1 5.5 13 0.5095 0.3246 0.1658 4.9 6.8 6.8 5.7 5.9 4.7 5.3 4.9 4.4 14 0.4580 0.2827 0.2593 5.2 5.6 5.7 6.0 5.4 5.8 5.8 5.6 5.6 15 0.3818 0.3589 0.2593 5.5 6.5 6.5 6.1 6.3 5.7 5.4 6.0 5.2 16 0.4344 0.4352 0.1304 4.3 6.0 5.8 5.4 5.7 4.0 4.6 4.9 4.2 17 0.5107 0.3590 0.1304 4.0 6.3 6.4 5.2 5.8 4.0 4.4 5.0 4.1 18 0.4451 0.3246 0.2303 5.6 6.6 6.7 5.6 6.4 5.6 5.8 6.2 5.4 19 0.3056 0.4352 0.2592 5.5 6.3 6.2 6.1 6.3 6.0 5.7 6.0 5.8 20 0.3700 0.4352 0.1948 4.4 6.3 6.5 5.5 5.8 4.5 5.0 4.9 4.2 21 0.4333 0.4009 0.1658 4.7 6.5 6.7 5.6 6.0 4.5 5.2 5.5 4.4 22 0.5225 0.2827 0.1949 5.5 6.7 7.0 5.8 6.3 5.6 6.0 5.6 5.4 23 0.4392 0.3628 0.1981 4.7 6.5 6.6 5.4 5.9 4.7 5.0 5.3 4.4 24 0.5869 0.2827 0.1304 4.1 6.3 6.4 5.1 5.7 4.2 4.7 4.9 4.2 25 0.4181 0.3742 0.2077 5.5 6.5 6.7 6.0 6.4 5.7 6.1 6.2 5.2 26 0.3689 0.4009 0.2303 5.4 6.0 5.9 5.8 6.0 5.7 5.9 5.8 5.4 27 0.5095 0.3246 0.1658 4.4 6.6 6.5 4.9 5.8 4.4 5.2 5.0 4.1 28 0.4580 0.2827 0.2593 5.2 6.3 6.3 5.9 6.2 5.2 5.5 5.7 5.0 * Formulation #1 to #14 correspond to soy protein isolate (SPI) formulations and #15 to #28 correspond to soy flour (SF) formulations ** These mixture proportions were obtained using original lower and upper bound constraints *** Ratings for control represent average values of mean ratings (n=41) of 4 control samples presented in four sensory sessions
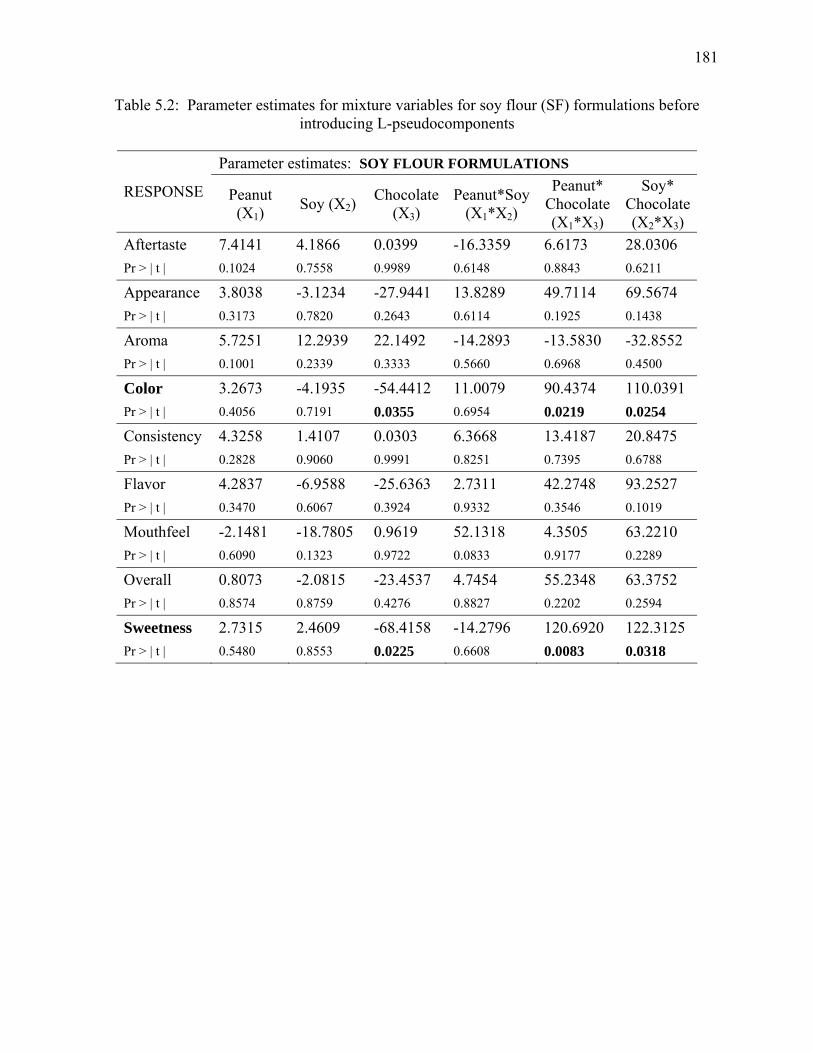
181
Table 5.2: Parameter estimates for mixture variables for soy flour (SF) formulations before introducing L-pseudocomponents
Parameter estimates: SOY FLOUR FORMULATIONS
RESPONSE Peanut (X1)
Soy (X2) Chocolate
(X3) Peanut*Soy
(X1*X2)
Peanut* Chocolate (X1*X3)
Soy* Chocolate(X2*X3)
Aftertaste 7.4141 4.1866 0.0399 -16.3359 6.6173 28.0306 Pr > | t | 0.1024 0.7558 0.9989 0.6148 0.8843 0.6211
Appearance 3.8038 -3.1234 -27.9441 13.8289 49.7114 69.5674 Pr > | t | 0.3173 0.7820 0.2643 0.6114 0.1925 0.1438
Aroma 5.7251 12.2939 22.1492 -14.2893 -13.5830 -32.8552 Pr > | t | 0.1001 0.2339 0.3333 0.5660 0.6968 0.4500
Color 3.2673 -4.1935 -54.4412 11.0079 90.4374 110.0391 Pr > | t | 0.4056 0.7191 0.0355 0.6954 0.0219 0.0254
Consistency 4.3258 1.4107 0.0303 6.3668 13.4187 20.8475 Pr > | t | 0.2828 0.9060 0.9991 0.8251 0.7395 0.6788
Flavor 4.2837 -6.9588 -25.6363 2.7311 42.2748 93.2527 Pr > | t | 0.3470 0.6067 0.3924 0.9332 0.3546 0.1019
Mouthfeel -2.1481 -18.7805 0.9619 52.1318 4.3505 63.2210 Pr > | t | 0.6090 0.1323 0.9722 0.0833 0.9177 0.2289
Overall 0.8073 -2.0815 -23.4537 4.7454 55.2348 63.3752 Pr > | t | 0.8574 0.8759 0.4276 0.8827 0.2202 0.2594
Sweetness 2.7315 2.4609 -68.4158 -14.2796 120.6920 122.3125 Pr > | t | 0.5480 0.8553 0.0225 0.6608 0.0083 0.0318

182
Table 5.3: Parameter estimates for mixture variables for soy protein isolate (SPI) formulations before introducing L-pseudocomponents
Parameter estimates: SOY PROTEIN ISOLATE FORMULATIONS
RESPONSE Peanut (X1)
Soy (X2) Chocolate
(X3) Peanut*Soy
(X1*X2)
Peanut* Chocolate (X1*X3)
Soy* Chocolate(X2*X3)
Aftertaste 2.4333 4.2274 -16.2124 -6.6926 45.8080 40.2094 Pr > | t | 0.5739 0.7435 0.5723 0.8315 0.2992 0.4528
Appearance 1.0967 -16.7019 -103.3798 33.0277 139.0361 217.0805 Pr > | t | 0.7743 0.1441 <.0001 0.2351 0.0004 <.0001
Aroma 8.2780 15.8626 -27.4338 -35.7842 60.7838 31.9783 Pr > | t | 0.0116 0.1047 0.2065 0.1326 0.0687 0.4297
Color 2.0761 -10.2700 -93.8389 20.2796 131.4110 188.8005 Pr > | t | 0.5872 0.3686 0.0002 0.4656 0.0008 <.0001
Consistency 0.3141 -15.2463 -87.5273 29.9373 120.6330 192.0115 Pr > | t | 0.9425 0.2416 0.0026 0.3447 0.0068 0.0004
Flavor 2.9282 0.1733 -46.7621 -9.2967 86.3584 101.4451 Pr > | t | 0.5176 0.9898 0.1198 0.7774 0.0616 0.0705
Mouthfeel 6.0078 9.0832 -37.4408 -22.5970 67.7516 67.0262 Pr > | t | 0.1541 0.4703 0.1808 0.4605 0.1150 0.1989
Overall 3.6792 -1.8558 -80.1911 -12.5764 125.5364 158.9900 Pr > | t | 0.4188 0.8914 0.0081 0.7037 0.0070 0.0049
Sweetness 0.4669 -9.6931 -72.0511 11.6467 115.0188 161.1067 Pr > | t | 0.9170 0.4688 0.0156 0.7206 0.0120 0.0038
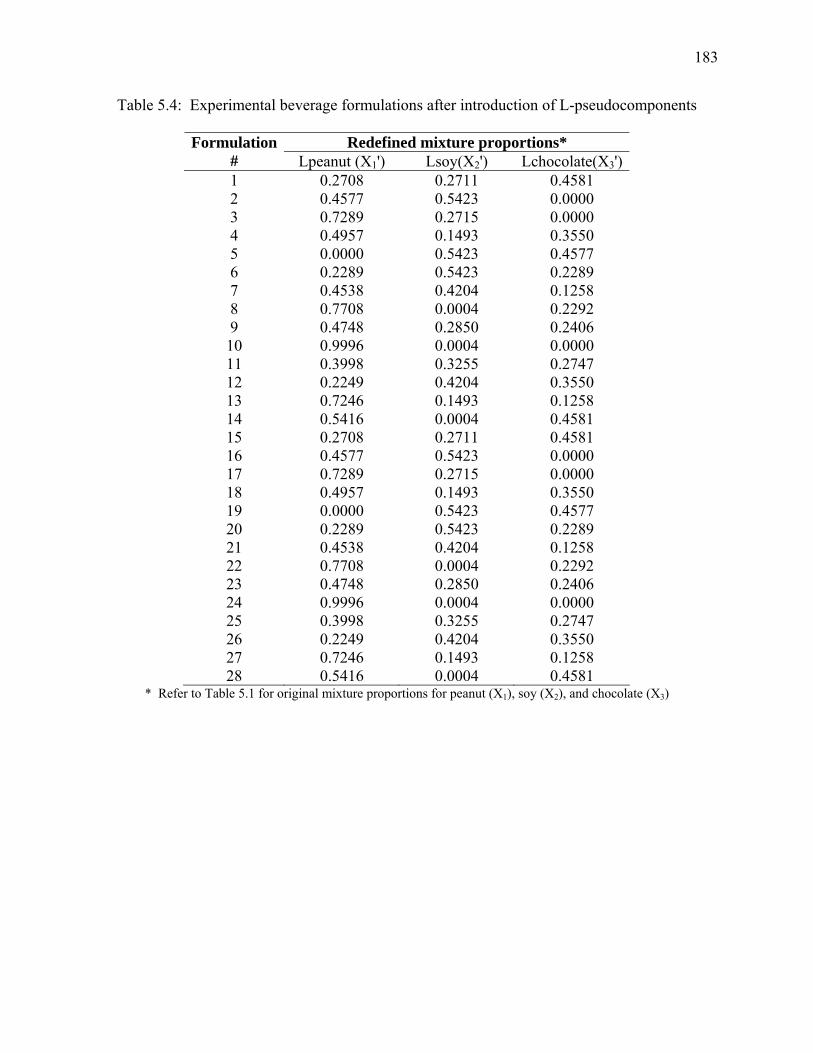
183
Table 5.4: Experimental beverage formulations after introduction of L-pseudocomponents
Redefined mixture proportions* Formulation # Lpeanut (X1') Lsoy(X2') Lchocolate(X3') 1 0.2708 0.2711 0.4581 2 0.4577 0.5423 0.0000 3 0.7289 0.2715 0.0000 4 0.4957 0.1493 0.3550 5 0.0000 0.5423 0.4577 6 0.2289 0.5423 0.2289 7 0.4538 0.4204 0.1258 8 0.7708 0.0004 0.2292 9 0.4748 0.2850 0.2406 10 0.9996 0.0004 0.0000 11 0.3998 0.3255 0.2747 12 0.2249 0.4204 0.3550 13 0.7246 0.1493 0.1258 14 0.5416 0.0004 0.4581 15 0.2708 0.2711 0.4581 16 0.4577 0.5423 0.0000 17 0.7289 0.2715 0.0000 18 0.4957 0.1493 0.3550 19 0.0000 0.5423 0.4577 20 0.2289 0.5423 0.2289 21 0.4538 0.4204 0.1258 22 0.7708 0.0004 0.2292 23 0.4748 0.2850 0.2406 24 0.9996 0.0004 0.0000 25 0.3998 0.3255 0.2747 26 0.2249 0.4204 0.3550 27 0.7246 0.1493 0.1258 28 0.5416 0.0004 0.4581
* Refer to Table 5.1 for original mixture proportions for peanut (X1), soy (X2), and chocolate (X3)
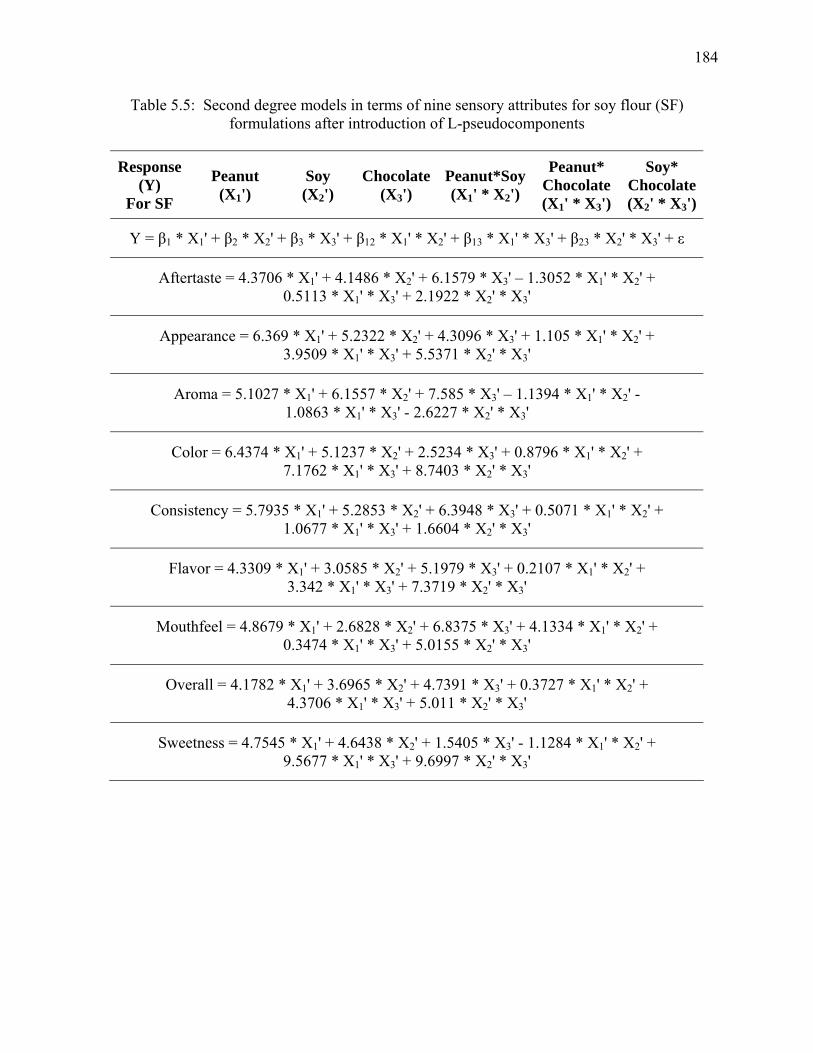
184
Table 5.5: Second degree models in terms of nine sensory attributes for soy flour (SF) formulations after introduction of L-pseudocomponents
Response
(Y) For SF
Peanut (X1')
Soy (X2')
Chocolate (X3')
Peanut*Soy(X1' * X2')
Peanut* Chocolate (X1' * X3')
Soy* Chocolate(X2' * X3')
Y = β1 * X1' + β2 * X2' + β3 * X3' + β12 * X1' * X2' + β13 * X1' * X3' + β23 * X2' * X3' + ε
Aftertaste = 4.3706 * X1' + 4.1486 * X2' + 6.1579 * X3' – 1.3052 * X1' * X2' + 0.5113 * X1' * X3' + 2.1922 * X2' * X3'
Appearance = 6.369 * X1' + 5.2322 * X2' + 4.3096 * X3' + 1.105 * X1' * X2' + 3.9509 * X1' * X3' + 5.5371 * X2' * X3'
Aroma = 5.1027 * X1' + 6.1557 * X2' + 7.585 * X3' – 1.1394 * X1' * X2' - 1.0863 * X1' * X3' - 2.6227 * X2' * X3'
Color = 6.4374 * X1' + 5.1237 * X2' + 2.5234 * X3' + 0.8796 * X1' * X2' + 7.1762 * X1' * X3' + 8.7403 * X2' * X3'
Consistency = 5.7935 * X1' + 5.2853 * X2' + 6.3948 * X3' + 0.5071 * X1' * X2' + 1.0677 * X1' * X3' + 1.6604 * X2' * X3'
Flavor = 4.3309 * X1' + 3.0585 * X2' + 5.1979 * X3' + 0.2107 * X1' * X2' + 3.342 * X1' * X3' + 7.3719 * X2' * X3'
Mouthfeel = 4.8679 * X1' + 2.6828 * X2' + 6.8375 * X3' + 4.1334 * X1' * X2' + 0.3474 * X1' * X3' + 5.0155 * X2' * X3'
Overall = 4.1782 * X1' + 3.6965 * X2' + 4.7391 * X3' + 0.3727 * X1' * X2' + 4.3706 * X1' * X3' + 5.011 * X2' * X3'
Sweetness = 4.7545 * X1' + 4.6438 * X2' + 1.5405 * X3' - 1.1284 * X1' * X2' + 9.5677 * X1' * X3' + 9.6997 * X2' * X3'
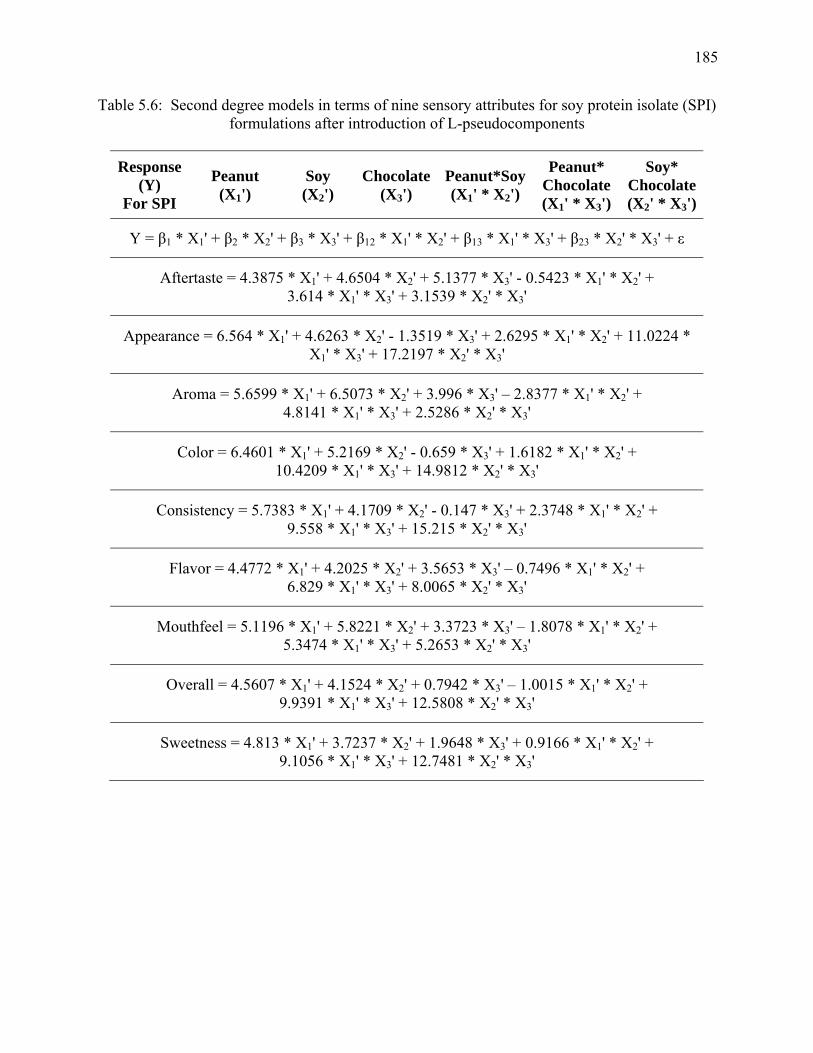
185
Table 5.6: Second degree models in terms of nine sensory attributes for soy protein isolate (SPI) formulations after introduction of L-pseudocomponents
Response
(Y) For SPI
Peanut (X1')
Soy (X2')
Chocolate (X3')
Peanut*Soy(X1' * X2')
Peanut* Chocolate (X1' * X3')
Soy* Chocolate(X2' * X3')
Y = β1 * X1' + β2 * X2' + β3 * X3' + β12 * X1' * X2' + β13 * X1' * X3' + β23 * X2' * X3' + ε
Aftertaste = 4.3875 * X1' + 4.6504 * X2' + 5.1377 * X3' - 0.5423 * X1' * X2' + 3.614 * X1' * X3' + 3.1539 * X2' * X3'
Appearance = 6.564 * X1' + 4.6263 * X2' - 1.3519 * X3' + 2.6295 * X1' * X2' + 11.0224 * X1' * X3' + 17.2197 * X2' * X3'
Aroma = 5.6599 * X1' + 6.5073 * X2' + 3.996 * X3' – 2.8377 * X1' * X2' + 4.8141 * X1' * X3' + 2.5286 * X2' * X3'
Color = 6.4601 * X1' + 5.2169 * X2' - 0.659 * X3' + 1.6182 * X1' * X2' + 10.4209 * X1' * X3' + 14.9812 * X2' * X3'
Consistency = 5.7383 * X1' + 4.1709 * X2' - 0.147 * X3' + 2.3748 * X1' * X2' + 9.558 * X1' * X3' + 15.215 * X2' * X3'
Flavor = 4.4772 * X1' + 4.2025 * X2' + 3.5653 * X3' – 0.7496 * X1' * X2' + 6.829 * X1' * X3' + 8.0065 * X2' * X3'
Mouthfeel = 5.1196 * X1' + 5.8221 * X2' + 3.3723 * X3' – 1.8078 * X1' * X2' + 5.3474 * X1' * X3' + 5.2653 * X2' * X3'
Overall = 4.5607 * X1' + 4.1524 * X2' + 0.7942 * X3' – 1.0015 * X1' * X2' + 9.9391 * X1' * X3' + 12.5808 * X2' * X3'
Sweetness = 4.813 * X1' + 3.7237 * X2' + 1.9648 * X3' + 0.9166 * X1' * X2' + 9.1056 * X1' * X3' + 12.7481 * X2' * X3'
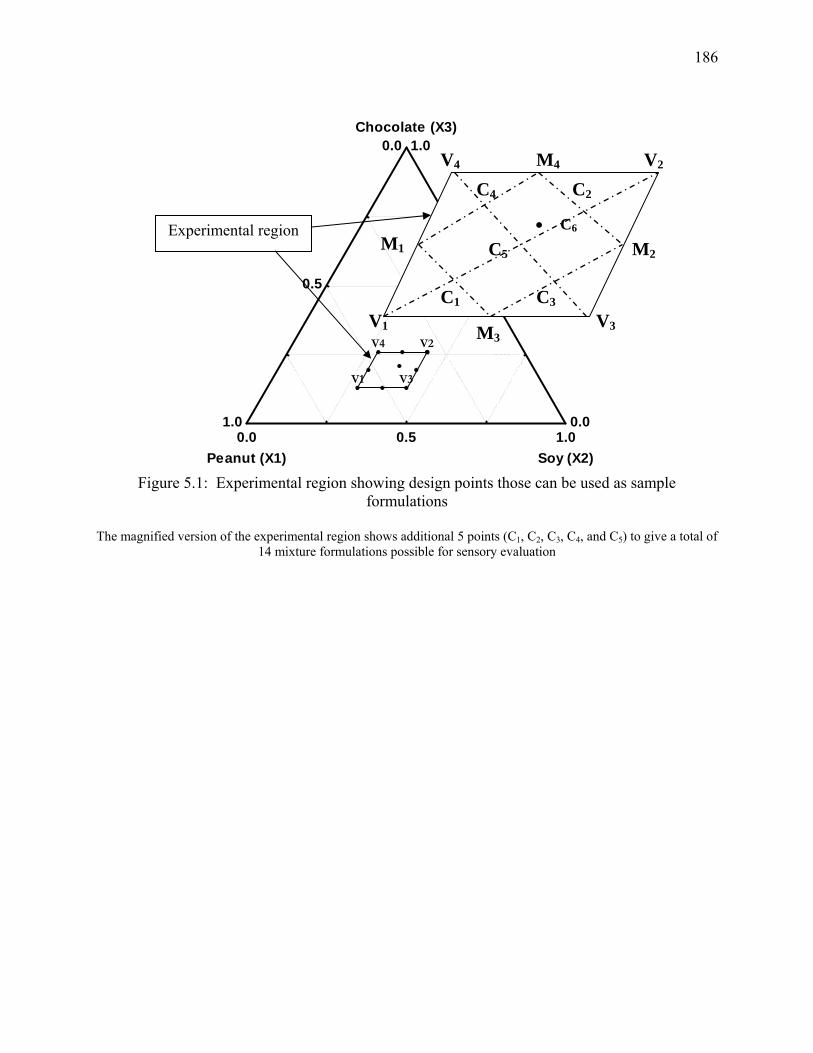
186
V1
V2
V3
V4
0.0
0.5
1.0Chocolate (X3)
0.0
0.5
1.0
Peanut (X1)0.0 0.5 1.0
Soy (X2) Figure 5.1: Experimental region showing design points those can be used as sample
formulations The magnified version of the experimental region shows additional 5 points (C1, C2, C3, C4, and C5) to give a total of
14 mixture formulations possible for sensory evaluation
V4 V2
• C6 M1
V1 M3 V3
M2
C1 C3
C4 C2
C5
M4
Experimental region
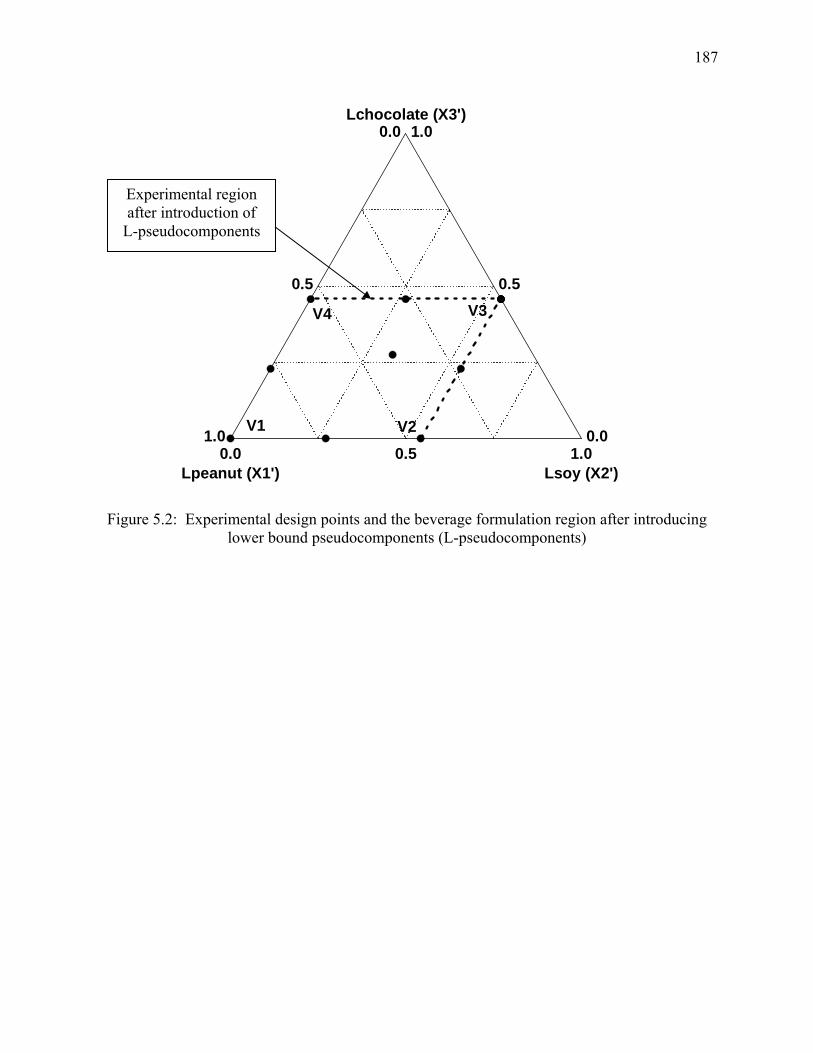
187
0.0
0.5
1.0Lchocolate (X3')
0.0
0.5
1.0
Lpeanut (X1')0.0 0.5 1.0
Lsoy (X2')
V2
V4 V3
V1
Figure 5.2: Experimental design points and the beverage formulation region after introducing lower bound pseudocomponents (L-pseudocomponents)
Experimental region after introduction of
L-pseudocomponents
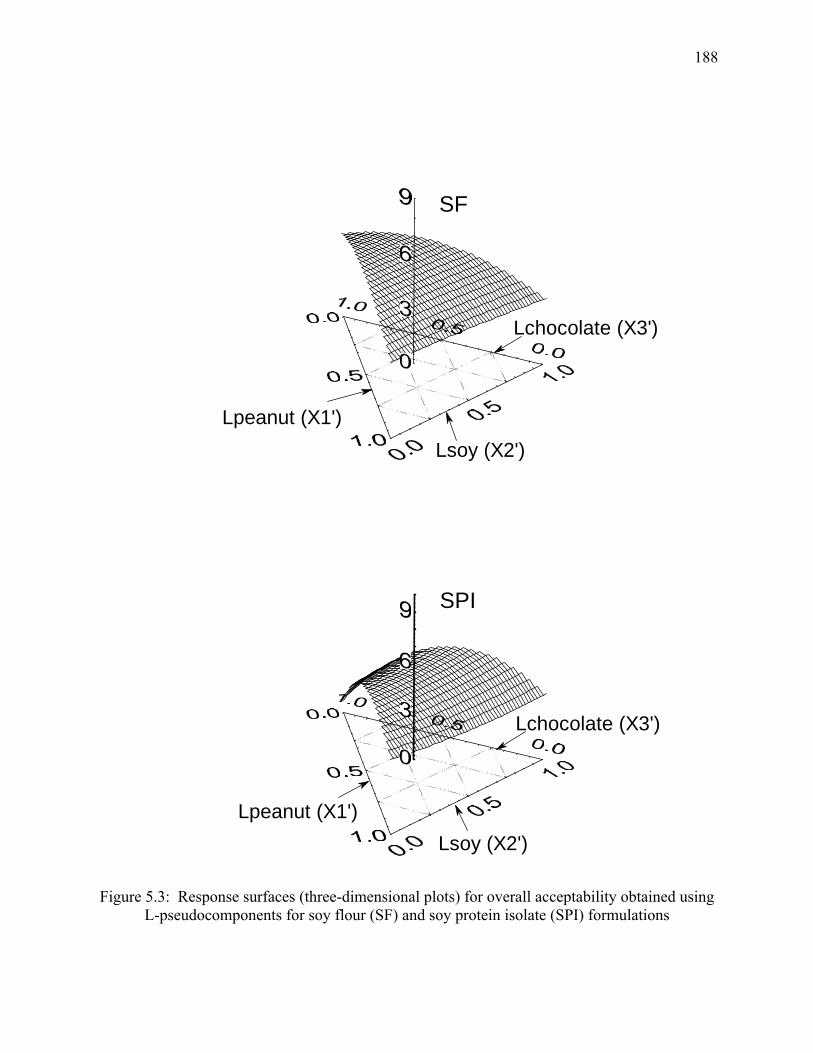
188
SF
Lchocolate (X3')
Lpeanut (X1')Lsoy (X2')
SPI
Lchocolate (X3')
Lpeanut (X1')Lsoy (X2')
Figure 5.3: Response surfaces (three-dimensional plots) for overall acceptability obtained using
L-pseudocomponents for soy flour (SF) and soy protein isolate (SPI) formulations
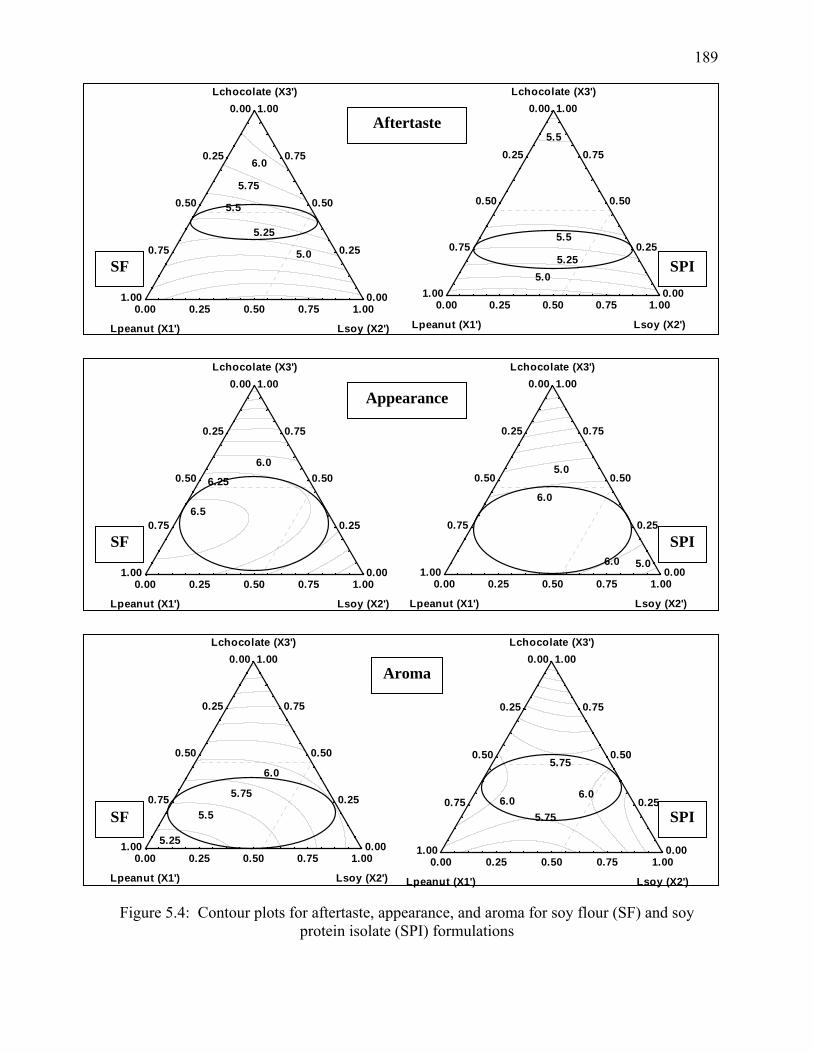
189
Figure 5.4: Contour plots for aftertaste, appearance, and aroma for soy flour (SF) and soy
protein isolate (SPI) formulations
0.00
0.25
0.50
0.75
1.00Lchocolate (X3')
0.00
0.25
0.50
0.75
1.00
Lpeanut (X1')
0.00 0.25 0.50 0.75 1.00
Lsoy (X2')
6.0
5.75
5.756.0
0.00
0.25
0.50
0.75
1.00Lchocolate (X3')
0.00
0.25
0.50
0.75
1.00
Lpeanut (X1')
0.00 0.25 0.50 0.75 1.00
Lsoy (X2')
6.0
5.5
5.75
5.25
Aroma
SF SPI
0.00
0.25
0.50
0.75
1.00Lchocolate (X3')
0.00
0.25
0.50
0.75
1.00
Lpeanut (X1')
0.00 0.25 0.50 0.75 1.00
Lsoy (X2')
6.0
6.0
5.0
5.00.00
0.25
0.50
0.75
1.00Lchocolate (X3')
0.00
0.25
0.50
0.75
1.00
Lpeanut (X1')
0.00 0.25 0.50 0.75 1.00
Lsoy (X2')
6.5
6.25
6.0
Appearance
SF SPI
0.00
0.25
0.50
0.75
1.00Lchocolate (X3')
0.00
0.25
0.50
0.75
1.00
Lpeanut (X1')
0.00 0.25 0.50 0.75 1.00
Lsoy (X2')
6.0
5.75
5.5
5.25
5.0
0.00
0.25
0.50
0.75
1.00Lchocolate (X3')
0.00
0.25
0.50
0.75
1.00
Lpeanut (X1')
0.00 0.25 0.50 0.75 1.00
Lsoy (X2')
5.5
5.5
5.05.25
Aftertaste
SF SPI
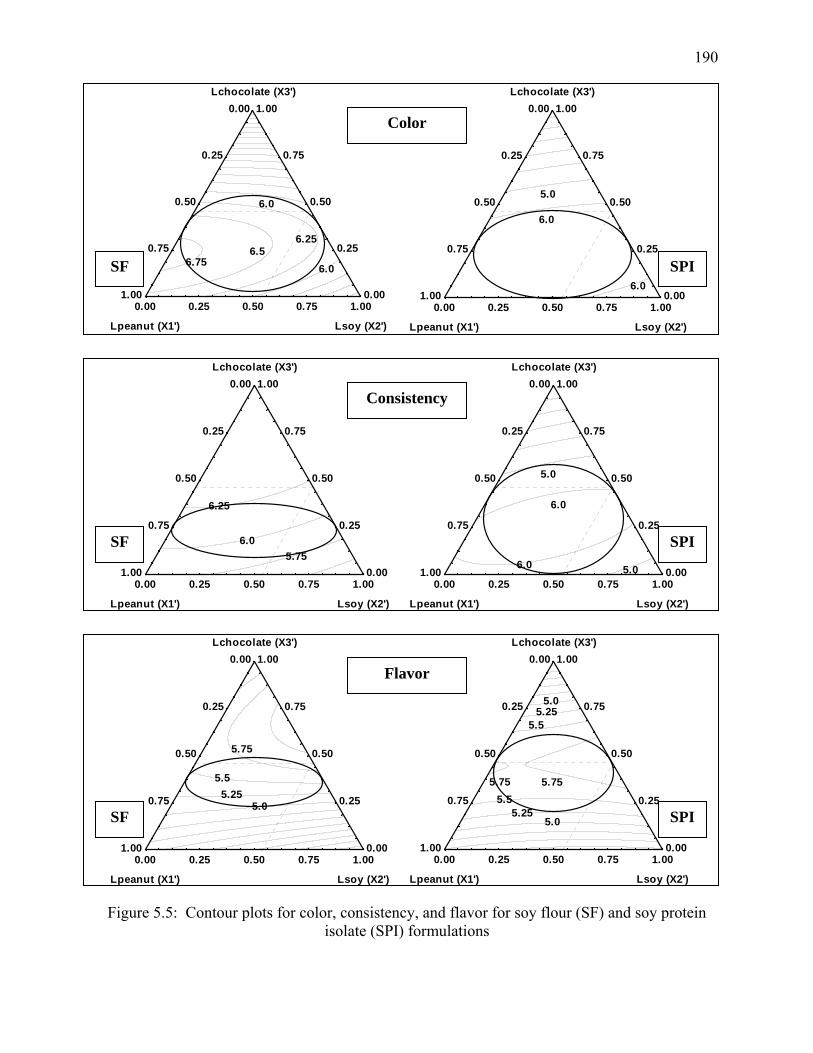
190
Figure 5.5: Contour plots for color, consistency, and flavor for soy flour (SF) and soy protein
isolate (SPI) formulations
0.00
0.25
0.50
0.75
1.00Lchocolate (X3')
0.00
0.25
0.50
0.75
1.00
Lpeanut (X1')
0.00 0.25 0.50 0.75 1.00
Lsoy (X2')
6.75 6.0
6.256.5
6.0
0.00
0.25
0.50
0.75
1.00Lchocolate (X3')
0.00
0.25
0.50
0.75
1.00
Lpeanut (X1')
0.00 0.25 0.50 0.75 1.00
Lsoy (X2')
6.0
6.0
5.0
Color
SF SPI
0.00
0.25
0.50
0.75
1.00Lchocolate (X3')
0.00
0.25
0.50
0.75
1.00
Lpeanut (X1')
0.00 0.25 0.50 0.75 1.00
Lsoy (X2')
6.25
5.756.0
0.00
0.25
0.50
0.75
1.00Lchocolate (X3')
0.00
0.25
0.50
0.75
1.00
Lpeanut (X1')
0.00 0.25 0.50 0.75 1.00
Lsoy (X2')
6.0
5.0
6.0 5.0
Consistency
SF SPI
0.00
0.25
0.50
0.75
1.00Lchocolate (X3')
0.00
0.25
0.50
0.75
1.00
Lpeanut (X1')
0.00 0.25 0.50 0.75 1.00
Lsoy (X2')
5.75
5.55.25
5.0
0.00
0.25
0.50
0.75
1.00Lchocolate (X3')
0.00
0.25
0.50
0.75
1.00
Lpeanut (X1')
0.00 0.25 0.50 0.75 1.00
Lsoy (X2')
5.75
5.25
5.25
5.5
5.5
5.75
5.0
5.0
Flavor
SF SPI

191
Figure 5.6: Contour plots for mouthfeel, overall acceptability, and sweetness for soy flour (SF)
and soy protein isolate (SPI) formulations
0.00
0.25
0.50
0.75
1.00Lchocolate (X3')
0.00
0.25
0.50
0.75
1.00
Lpeanut (X1')
0.00 0.25 0.50 0.75 1.00
Lsoy (X2')
5.75 5.75
5.5
5.5
0.00
0.25
0.50
0.75
1.00Lchocolate (X3')
0.00
0.25
0.50
0.75
1.00
Lpeanut (X1')
0.00 0.25 0.50 0.75 1.00
Lsoy (X2')
6.0
5.0
5.5
5.5
5.25
5.25
5.0
5.75
5.75
0.00
0.25
0.50
0.75
1.00Lchocolate (X3')
0.00
0.25
0.50
0.75
1.00
Lpeanut (X1')
0.00 0.25 0.50 0.75 1.00
Lsoy (X2')
6.25
6.0
5.75
5.5
5.25 5.0 0.00
0.25
0.50
0.75
1.00Lchocolate (X3')
0.00
0.25
0.50
0.75
1.00
Lpeanut (X1')
0.00 0.25 0.50 0.75 1.00
Lsoy (X2')
5.75
5.5
5.56.0
Mouthfeel
SF SPI
0.00
0.25
0.50
0.75
1.00Lchocolate (X3')
0.00
0.25
0.50
0.75
1.00
Lpeanut (X1')
0.00 0.25 0.50 0.75 1.00
Lsoy (X2')
5.75
5.0
5.0
5.55.5
5.25
5.25
0.00
0.25
0.50
0.75
1.00Lchocolate (X3')
0.00
0.25
0.50
0.75
1.00
Lpeanut (X1')
0.00 0.25 0.50 0.75 1.00
Lsoy (X2')
5.5
5.25
5.0
Overall acceptability
SF SPI
Sweetness
SF SPI
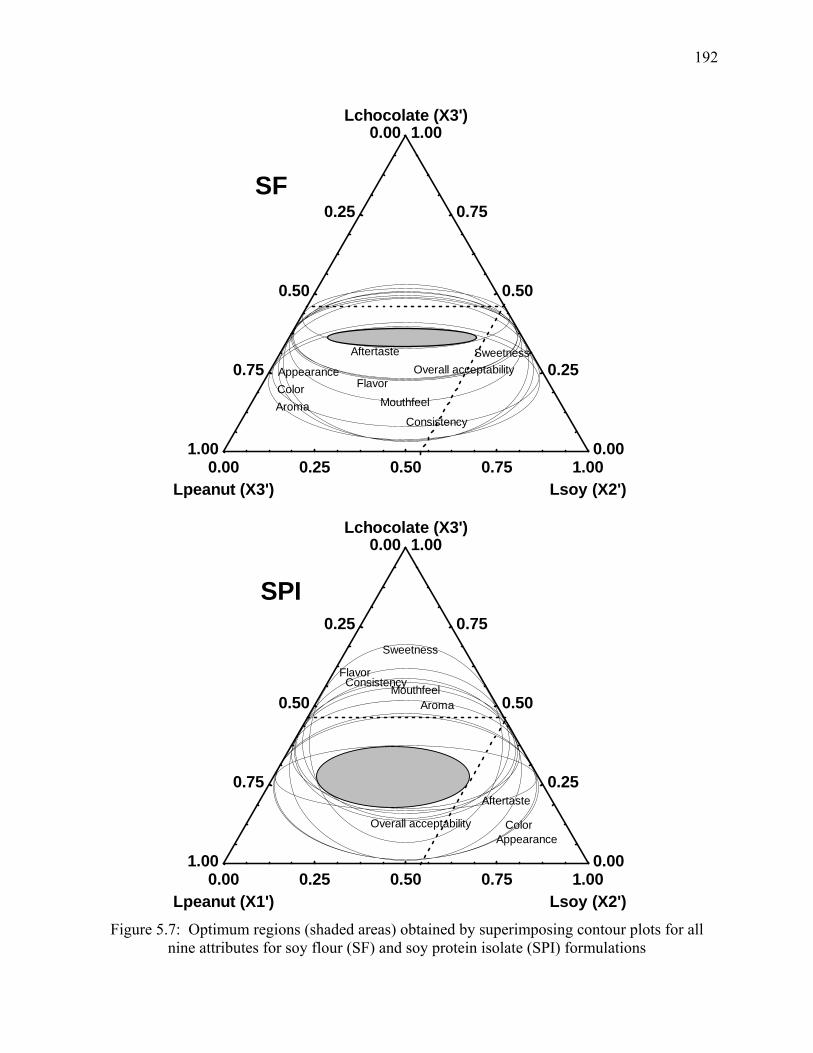
192
0.00
0.25
0.50
0.75
1.00Lchocolate (X3')
0.00
0.25
0.50
0.75
1.00
Lpeanut (X3')0.00 0.25 0.50 0.75 1.00
Lsoy (X2')
Appearance
Aftertaste
AromaColor
Consistency
FlavorMouthfeel
Overall acceptabilitySweetness
SF
0.00
0.25
0.50
0.75
1.00Lchocolate (X3')
0.00
0.25
0.50
0.75
1.00
Lpeanut (X1')0.00 0.25 0.50 0.75 1.00
Lsoy (X2')
Aftertaste
Appearance
Aroma
Color
ConsistencyFlavor
Mouthfeel
Overall acceptability
Sweetness
SPI
Figure 5.7: Optimum regions (shaded areas) obtained by superimposing contour plots for all
nine attributes for soy flour (SF) and soy protein isolate (SPI) formulations
193
CHAPTER 6
SUMMARY AND CONCLUSIONS
A chocolate-flavored, peanut-soy beverage was developed by utilizing two important oilseed
proteins: peanut and soy. The main objectives of enhancing sensory acceptability and nutritional
properties of new beverage were accomplished by incorporating roasted peanut flour, chocolate
flavor, and soy protein. Thorough review of earlier studies, market survey of available
ingredients and milk-type products, and preliminary beverage preparation trials were crucial for
selection of key ingredients, beverage formulation, and development of a pilot-plant scale
beverage processing protocol.
Medium roasted peanut flour, chocolate syrup, and soy protein either in the form of soy
flour (SF) or soy protein isolate (SPI) were processed as per the developed protocol. Physical
characteristics of the beverage such as viscosity (η) and visual stability index (VSI) were
measured. Nutritional properties were estimated based on lysine content (mg/g protein). The
range of lysine contents (mg/g protein): 44.1-57.1 (reference lysine content = 51.0), η (mPa s):
17.7-131.8 (commercial chocolate milk = 36.9), and VSI: 0.63-0.99 (commercial cow’s milk =
1.00) resulted into low and high level constraints for a three-component, constrained mixture
design. Peanut (X1), soy (X2), and chocolate syrup (X3) were major components with constraints
as X1 = 30.56%-58.70%, X2 = 28.26%-43.52%, and X3 = 13.04%-25.93%. An extreme vertices
design for the three-component, constrained mixture resulted into 14 possible beverage
formulations. Two separate sets, one using SF and another using SPI resulted into twenty-eight
chocolate-flavored, peanut-soy beverage formulations for sensory evaluation.
194
Twenty-eight beverage formulations and control (Hershey®’s creamy chocolate milk
shake) were effectively studied for sensory properties by 41 untrained panelists. Nine sensory
attributes including overall acceptability were evaluated using a 9-point hedonic scale (1 =
dislike extremely, 5 = neither like nor dislike, and 9 = like extremely). Consumer response
indicated by ‘likings’ on the hedonic scale was analyzed by comparing mean ratings of various
sensory attributes. The formulation having 43.9% peanut, 36.3% SPI, and 19.8% chocolate
syrup was the best overall. The mean ratings of this SPI-based formulation for various sensory
attributes (as compared to the control) were: overall acceptability 5.9 (6.4), appearance 7.0 (6.7),
color 6.8 (6.7), aroma 6.0 (6.8), consistency 6.6 (6.9), flavor 5.9 (6.7), sweetness 6.4 (5.9),
mouthfeel 6.3 (7.0), and aftertaste 5.8 (6.6). The ratings for appearance, color, and sweetness
were observed to be higher than the control. Two SPI-based formulations, one prepared with
37.0% X1, 43.5% X2, and 19.5% X3; and another with 52.3% X1, 28.3% X2, and 19.5% X3 were
rated highest for color (7.0) and aroma (6.2), respectively. Another SF-based formulation
(30.6% X1, 43.5% X2, and 25.9% X3) had the highest mean ratings for flavor (6.0). Thus, the
beverage had acceptability ratings comparable to that of commercial chocolate milk.
Optimization using response surface methodology (RSM) was done next. The consumer
response in terms of various sensory attributes was modeled to give the optimum range of three
mixture components leading to the most acceptable product formulation. Contour plots were
generated and superimposition of regions of maximum acceptance (consumer ratings ≥ 5.0 for all
the sensory attributes) gave optimum regions for SF and SPI formulations. It was observed that
34.1%-45.5% X1, 31.2%-42.9% X2, and 22.4%-24.1% X3 in case of SF; and 35.8%-47.6% X1,
31.2%-43.5% X2, and 18.3%-23.6% X3, in case of SPI were the ranges that can result into
optimum formulations. In general, the SPI-based formulations were more acceptable than SF-
195
based formulations, and greater number of acceptable formulations can be prepared from SPI in
combination with peanut and chocolate syrup such that all the three components add up to 100%.
Also, SPI was a better choice as a source of soy protein, since it can be expected to give
nutritionally superior beverage product with higher consumer acceptability and characteristics
comparable to that of commercial chocolate milk.
The levels of third mixture component chocolate (X3) represented the levels of chocolate
syrup added in the mixture to obtain the final beverage formulations. The chocolate syrup was
prepared by mixing various other ingredients such as stabilizers, emulsifiers, sweeteners, and
flavor additives in the predetermined proportions. [The exact proportions of these ingredients
have not been disclosed since the product being developed is an invention under review by The
University of Georgia Research Foundation, Inc., Athens, Ga., U. S. A.]. Any change in the
level of chocolate syrup thus indicated proportional change in all those ingredients that form the
chocolate syrup.
Thus, the optimization using response surface methodology was an efficient statistical
technique of handling several factors influencing the acceptability of the chocolate-flavored,
peanut-soy beverage. Involving target consumers in the development process resulted into a
novel beverage suitable to current consumer trend of convenience and nutrition. Using
commercial chocolate milk as the control helped in achieving desired product characteristics
close to that of similar product available in the market. In future, validation, shelf-life, and
nutritional profile studies will complete the process of development of acceptable beverage
product.
196
REFERENCES
Abdul AJ, inventor. 1988 May 24. Making a natural food peanut punch. U. S. Patent 4746530.
Abdullah A, Cheng TC. 2001. Optimization of reduced calorie tropical mixed fruit jam. Food
Quality and Preference 12:63-68.
Alper CM and Mattes RD. 2003. Peanut consumption improves indices of cardiovascular disease
risk in healthy adults. Journal of the American College of Nutrition 22(2):133-141.
Ang HG, Kwik WL, and Theng CY. 1985. Development of soymilk- A review. Food Chemistry
17:235-250.
Anonymous. 1973. Nutritional quality and food product development. Nutrition Reviews
31(7)/July:226-227.
Anonymous 2002. Food Emulsifiers: Properties of emulsifiers. Basic volume. Available from
http://www.rike-vita.co.jp/int/emuls/basic/eBasic0.htm. Accessed on 10/15/2002.
Anonymous. 2003. Soy protein to combat obesity. (R & D Applications). Prepared Foods April.
Available from www.preparedfoods.com. Accessed on 01/17/2004.
Anonymous. 2004a. Types of peanuts. Available from http://aboutpeanuts.com/every.html.
Accessed on 01/16/2004.
Anonymous. 2004b. Oil and other peanut products. Available from
http://aboutpeanuts.com/every.html. Accessed on 01/16/2004.
Anonymous. 2004c. BevNET.com's "Best of 2003" Awards. Available from
http://www.bevnet.com/news/2003/01-08-2004-bestof2003.asp. Accessed on 01/18/2004.
Anonymous. 2004d. Food facts & trivia: Peanuts. Available from
http://www.foodreference.com/html/fpeanuts.html. Accessed on 01/16/2004.

197
Bastos DHM, Domenech CH, and Areas JAG. 1991. Optimization of extrusion cooking of lung
proteins by response surface methodology. International Journal of Food Science and
Technology 26:403-408.
Boomgaard T van den, Vliet T van, and Hooydonk ACM van. 1987. Physical stability of chocolate
milk. International Journal of Food Science and Technology 22:279-291.
Brandt LA. 2002. Pouring on flavor in beverages. Prepared Foods October:53-64. Available from
www.preparedfoods.com.
Brody AL, Connor JM, Lord JB. 2000. The United States’ food industry and its imperative for new
products. In: Brody AL and Lord JB, editors. Developing New Food Products for a Changing
Marketplace. Pennsylvania: Technomic Publishing Co., Inc., Lancaster. p 1-18.
Brough SH, Azam-Ali SN, and Taylor AJ. 1993. The potential of bambara groundnut (Vigna
subterranea) in vegetable milk production and basic protein functionality systems. Food
Chemistry 47:277-283.
Bursey RG. 1983. Diet modification and the development of new food products. Annals of Internal
Medicine 98 (Part 2):872-874.
Chandrasekhara MR, Ramanna BR, Jagannath KS, and Ramanathan PK. 1971. Miltone- Vegetable
toned milk: Use of peanut protein expands supply of milk. Food Technology 25 (June):596-598.
Chompreeda P, Haruthaithanasan V, Oupadissakoon C, and Suknak K. 1989. A research note:
Development of a chocolate flavored peanut beverage. Journal of Food Science 54(5):1359-
1360.
Chow ETS, Wei LS, Devor RE, and Steinberg, MP. 1988. Performance of ingredients in a soybean
whipped topping: A response surface analysis. Journal of Food Science 53:1761-1765.

198
Chu CA and Resurreccion AVA. 2004. Optimization of a chocolate flavored peanut spread using
response surface methodology (RSM). Journal of Sensory Studies 19(3):237-260.
Cornell JA and Harrison JM. 1997. Models and designs for experiments with mixtures. Part II-
Exploring a sub-region of the simplex and the inclusion of other factors in mixture experiments.
Technical Bulletin 899. University of Florida, Agriculture Experiment Station, Institute of Food
and Agricultural Sciences. 78 p.
Desrosier NW and Desrosier JN. 1971. Economics of new product development. Connecticut: The
AVI publishing company, Inc. Westport. p 1-217.
Dziezak JD. 1991. A Focus on gums. Food Technology 45(3):117-132.
Earle MD. 1997. Changes in the food product development process. Trends in Food Science &
Technology 8(January):19-24.
Fishken D. 1983. Consumer-oriented product optimization. Food Technology 37(11):49-52.
Floros JD and Chinnan MS. 1988. Seven factor response surface optimization of a double-stage lye
(NaOH) peeling process for pimiento peppers. Journal of Food Science 53:631-638.
Folkenberg DM, Bredie WLP, and Martens M. 1999. What is mouthfeel? Sensory-rheological
relationships in instant hot cocoa drinks. Journal of Sensory Studies 14:181-195.
Galvez FCF, Resurreccion AVA, and Koehler PE. 1990. Optimization of processing of peanut
beverage. Journal of Sensory Studies 5:1-17.
Galvez FCF, Resurreccion AVA and Ware GO. 1995. Formulation and process optimization of
mungbean noodles. Journal of Food Processing and Preservation 19:191-205.
Giese J. 1994. Proteins as ingredients: Types, Functions, Applications. Food Technology
48(10):50-60.

199
Giovanni M. 1983. Response surface methodology and product optimization. Food Technology
37(11):41-45, 83.
Gorman JW. 1966. Discussion of “Extreme Vertices Design of Mixture Experiments” by R. A.
McLean and V. L. Anderson. Technometrics 8(3):455-456.
Henselman MR, Donatoni SM, and Henika RG. 1974. Use of response surface methodology in the
development of acceptable high protein bread. Journal of Food Science 39:943-946.
Hare LB. 1974. Mixture designs applied to food formulation. Food Technology 28(3):50-56, 62.
Hilliam M. 1993. Designer foods: Current and future market developments in Europe and the USA.
International Food Ingredients 5:40.
Hinds MJ, Beuchat LR, and Chinnan MS. 1997a. Properties of a thermal-processed beverage
prepared from roasted partially defatted peanuts. International Journal of Food Science and
Technology 32:203-211.
Hinds MJ, Beuchat LR, and Chinnan MS. 1997b. Effects of homogenization pressure and
stabilizers on some physical characteristics of a beverage prepared from partially defatted,
roasted peanuts. Plant Foods for Human Nutrition 50:269-277.
Hinds MJ, Beuchat LR, and Chinnan MS. 1997c. Particle size distribution in a heat-processed
beverage prepared from roasted peanuts. Food Research International 30(1):59-64.
IFT/SED. 1981. Sensory evaluation guide for testing food and beverage products. Food
Technology 35(11):550-559.
Johnson TM and Zabik ME. 1981. Response surface methodology for analysis of protein
interactions in angel food cakes. Journal of Food Science 46:1226-1230.
Kelco CP. 2003. Application overview: Beverages. Product catalog for the food industry.
Available from www.cpkelco.com. July 2003.
200
Kirkmeyer SV and Mattes RD. 2000. Effects of food attributes on hunger and food intake.
International Journal of Obesity 24(9):1167-1175.
Klahorst SJ. 2002. Beverage viscosity, any way you like it! Available from
http://www.foodproductdesign.com/archive/2002/0102AP.html. Accessed on 11/15/02.
Knox SB and Mitchell P. 2003. What separates the winners from the losers in new food product
development? Trends in Food Science & Technology 14:58-64.
Kuntz DA, Nelson AI, Steinberg MP, and Wei LS. 1978. Control of chalkiness in soymilk. Journal
of Food Science 43:1279-1283.
Kwok KC and Niranjan K. 1995. Review: Effect of thermal processing on soymilk. International
Journal of Food Science and Technology 30:263-295.
Lord JB. 2000. Product policy and goals. In: Brody AL, Lord JB, editors. Developing New Food
Products for a Changing Marketplace. Pennsylvania: Technomic Publishing Co., Inc., Lancaster.
p 29-53.
Lund DB. 1982. Quantifying reactions influencing quality of foods: Texture, Flavor, and
Appearance. Journal of Food Processing and Preservation 6:133-153.
Lyon DH, Francombe MA, Hasdell TA, Lawson K. 1992. Guidelines for sensory analysis in food
product development and quality control. New York: Chapman & Hall, Van Nostrand Reinhold,
Inc. 131 p.
Mattes RD. 2004. A handful of peanuts a day keeps the doctor away. Available from
http://www.cfs.purdue.edu/pages/alumni_friends/peanutresearch.htm. Accessed on 10/15/2004.
McLean RA and Anderson VL. 1966. Extreme vertices design of mixture experiments.
Technometrics 8(3):447-454.
201
Meilgaard M, Civille GV, and Carr BT. 1991. Sensory Evaluation Techniques. 2nd edition. CRC
Press, Boca Raton, FL.
Messina M. 2003. Soyfoods and disease prevention: Part I-Coronary heart disease. Special
Highlight: Soy Derivatives. AGROFood industry hi-tech: September/October 2003. p7-10.
Mudahar GS, Toledo RT, and Jen JJ. 1990. A response surface methodology approach to optimize
potato dehydration process. Journal of Food Processing and Preservation 14:93-106.
Mustakas GC, Albrecht WJ, Brookwalter GN, Sohns VE, and Griffin EL, Jr. 1971. New process for
low-cost, high-protein beverage base. Food Technology 25:80.
Mustakas GC. 1974. A new soy lipid-protein concentrate for beverages. Cereal Science Today
19(2):62-73.
Myers DJ, Bian Y, Dias K, Lihono MA, Wu S, and Murphy PA. 2003a. Functional properties of
soy protein fractions produced using a pilot plant-scale process. Journal of the American Oil
Chemists Society 80(6):545-549.
Myers DJ, Bian Y, Dias K, Lihono MA, Wu S, and Murphy PA. 2003b. Functional properties of
the acidic and basic subunits of the Glycinin (11S) soy protein fraction. Journal of the American
Oil Chemists Society 80(6):551-555.
Natarajan KR. 1980. Peanut protein ingredients: Preparation properties and food uses. Advanced
Food Research 26:216-273.
NBJ. 2003. 2002 Functional foods report. Nutrition Business J., San Diego. Available from
www.nutritionbusiness.com.
Nelson AI, Steinberg MP, and Wei LS, inventors. 1975 August 26. Soybean beverage base. U. S.
patent 3901978.
202
Nelson AI, Steinberg MP, and Wei LS. 1976. Illinois process for preparation of soymilk. Journal
of Food Science 41:57-61.
Nolan AL. 1983. Peanut solids fortify whey-based drink. Food Engineering 55:11.
O’Mahony M. 1988. Sensory difference and preference testing: The use of signal detection
measures. In: Moskowitz H., editor. Applied Sensory Analysis of Foods. Volume I. CRC
Press, Inc. Boca Raton, FL. p 146-147.
Oh NH, Seib PA, and Chung DS. 1985. Noodles: III. Effects of processing variables on quality
characteristics of dry noodles. Cereal Chemistry 62:437-440.
Ohr LM, Mermelstein NH, and Hlavacek RG. 2003. Functional foods market growing. Food
Technology 57(12):64.
Ohr LM. 1997. Fortifying for the health of it. Prepared Foods 166:55.
Ohr LM. 2003. The latest scoop on soy. Food Technology 57(8):87-91.
Osborn HT, Shewfelt RL, and Akoh CC. 2003. Sensory evaluation of a nutritional beverage
containing canola oil/caprylic acid structural lipid. Journal of the American Oil Chemists
Society 80(4):357-360.
Penna ALB, Oliveira MN, and Tamime AY. 2003. Influence of carrageenan and total solids content
on the rheological properties of lactic beverage made with yoghurt and whey. Journal of Texture
Studies 34:95-113.
Peryam DR and Pilgrim FJ. 1957. Hedonic scale method for measuring food preferences. Food
Technology 11(9):9-14. (Symposium: Studies in Food Science and Technology- Methodology
of Sensory Testing- Contributions to the IFT Symposium in Pittsburgh).
Piper CV and Morse WJ. 1923. The Soybean. New York: McGraw-Hill Co., Inc.
203
Porter MA and Jones AM. 2003. Variability of soy flour composition. Journal of the American Oil
Chemists Society 80(6):557-562.
Pszczola DE. 2003. Plot thicken, as gums add special effects. Food Technology 57(12):34-47.
Pyne AW. 2000. Innovative new products: Technical development in the laboratory. In: Brody AL
and Lord JB, editors. Developing New Food Products for a Changing Marketplace.
Pennsylvania: Technomic Publishing Co., Inc., Lancaster. p 259-275.
Rackis JJ, Sessa DJ, and Honig DH. 1979. Flavor problems of vegetable food proteins. Journal of
the American Oil Chemists Society 56(March):262-271.
Ramanna SV and Ramanathan G. 1992. Effect of processing and storage on rheological properties
of fortified milk and curd systems. International Journal of Food Science and Technology
27:305-312.
Resurreccion AVA. 1998. Consumer Sensory Testing for Product Development. Maryland:
Chapman & Hall Food Science Book, Aspen Publishers, Inc., Gaithersburg. 254 p.
Riaz MN. 1999. Soybeans as functional foods. Cereal Foods World 44(2):88-92.
Roberts WA, Jr. 2003a. Battling beverages: 2003 new products annual beverages. Prepared Foods.
March. Available from www.preparedfoods.com. Accessed on 01/18/2004.
Roberts WA, Jr. 2003b. Ingredients in use: soy proteins. (formulation & ingredient challenges).
Prepared Foods. October. Available from www.preparedfoods.com. Accessed on 01/17/2004.
Robinson L. 2000. The marketing drive for new food products. In: Brody AL, Lord JB, editors.
Developing New Food Products for a Changing Marketplace. Pennsylvania: Technomic
Publishing Co., Inc., Lancaster. p 19-27.
204
Rosenthal A, Deliza R, Cabral LMC, Cabral LC, Farias CAA, and Domingues AM. 2003. Effect of
enzymatic treatment and filtration on sensory characteristics and physical stability of soymilk.
Food Control 14:187-192.
Rubico SM, Resurreccion AVA, Frank JF, and Beuchat LR. 1987. Suspension stability, texture,
and color of high temperature treated peanut beverage. Journal of Food Science 52(6):1676-
1679.
Rubico SM, Resurreccion AVA, and Beuchat LR. 1988. Comparison of sensory properties and
headspace volatiles of a peanut beverage processed at different temperature and time conditions.
Journal of Food Science 53(1):176-180.
Rubico SM, Phillips RD, Resurreccion AVA, and Beuchat LR. 1989. Nutritional, microbiological,
and sensory qualities of a peanut beverage prepared using various processes. Journal of Food
Science 54(6):1540-1543.
Rubini ME. 1969. Filled milk and artificial milk substitutes. American Journal of Clinical
Nutrition 22:163.
Rudolph MJ. 2000. The food product development process. In: Brody AL, Lord JB, editors.
Developing New Food Products for a Changing Marketplace. Pennsylvania: Technomic
Publishing Co., Inc., Lancaster. p 98.
Rustom IYS, Lopez-Leival MH, and Nair BM. 1995a. Effect of emulsifier type and
homogenization temperature and pressure on physical properties of peanut extract. International
Journal of Food Science and Technology 30:773-781.
Rustom IYS, Lopez-Leival MH, and Nair BM. 1995b. UHT-Sterilized peanut beverages: Changes
in physicochemical properties during storage. Journal of Food Science 60(2):378-383.
205
Rustom IYS, Lopez-Leival MM, and Nair BM. 1996. UHT-Sterilized peanut beverages: Kinetics of
physicochemical changes during storage and shelf-life prediction modeling. Journal of Food
Science 61(1):198-203, 208.
Sarwar G. 1997. The protein digestibility-corrected amino acid score method overestimates quality
of proteins containing anti-nutritional factors and of poorly digestible proteins supplemented
with limiting amino acids in rats. Journal of Nutrition 127:758-64.
Sarwar S, Peace RW, Botting HG. 1985. Corrected relative net protein ratio (CRNPR) method
based on differences in rat and human requirements for sulfur amino acids. Journal of the
American Oil Chemists Society 68:689-693.
Schaafsma G. 2000. The protein digestibility-corrected amino acid score. Journal of Nutrition
130:1865S-7S.
Scheffe H. 1958. Experiments with mixtures. Journal of the Royal Statistical Society Series B
20(2):344-360.
Schmidt RH and Bates RP. 1976. Sensory acceptability of fruit flavored oilseed milk formulations.
Proceedings of Florida State Horticulture Society 89:217-219.
Schmidt RH, Matthews RF, and Davidson SM. 1977. Sensory acceptance of tomato salad-type
yoghurt systems from oilseed/dairy combinations. Proceedings of Florida State Horticulture
Society 90:201.
Schmidt RH, Sistrunk CP, Richter RL, and Cornell JA. 1980. Heat treatment and storage effects on
texture characteristics of milk and yoghurt systems fortified with oilseed proteins. Journal of
Food Science 45:471-475.
Schmidt RH. 1978. The effect of heat treatment on aggregation and gelation of peanut/milk protein
blends. Cereal Chemistry 55(1):58-65.
206
Schutz HG. 1983. Multiple regression approach to optimization. Food Technology 37(11):46-48,
62.
Segall S. 2000. New food products: Technical development. In: Brody AL, Lord JB, editors.
Developing New Food Products for a Changing Marketplace. Pennsylvania: Technomic
Publishing Co., Inc., Lancaster. p 217-258.
Shelke K, Dick JW, Holm YF, and Loo KS. 1990. Chinese wet noodle formulation: A response
surface methodology study. Cereal Chemistry 67:338-342.
Sidel JL and Stone H. 1983. An introduction to optimization research. Food Technology
37(11):36-38.
Singh B and Singh U. 1991. Peanut as a source of protein for human foods. Plant Foods for Human
Nutrition 41:165-177.
Sloan AE. 2003a. Top 10 trends to watch and work on: 2003. Food Technology 57(4):30-50.
Sloan AE. 2003b. What, when, and where Americans eat: 2003. Food Technology 57(8):48-66.
Sloan AE. 2003c. Sea change in the beverage business. Food Technology 57(12):20.
Snee RD. 1971. Design and analysis of mixture experiments. Journal of Quality Technology
3(4):159.
Stone H and Sidel JL. 1993. Sensory Evaluation Practices. 2nd ed. California: Academic Press,
San Diego.
Szczesniak AS. 1979. Classification of mouthfeel characteristics of beverages. In: Sherman P,
editor. Food Texture and Rheology. New York: Academic Press. p 1.
Tockman J. 2002. Capitalizing on increasing consumer interest in soy protein. Cereal Foods World
47(5):172-174.
207
Toledo RT and Brody AL. 2000. Food Science, Technology, and Engineering overview for Food
Product Development. In: Brody AL, Lord JB, editors. Developing New Food Products for a
Changing Marketplace. Pennsylvania: Technomic Publishing Co., Inc., Lancaster. p 129-152.
Toledo RT. 1980. Flow of fluids. In: Toledo RT, Author. Fundamentals of Food Process
Engineering. Connecticut: AVI Publishing Company, Westport. p 152-156.
United States Department of Agriculture. 2000. Modification of the vegetable protein products
requirements for the national school lunch program, school breakfast program, summer food
service program and child and adult care food program. Federal Register 2000; 7 CFR Parts 210,
215, 220, 225, and 226:12429-12442.
Vainionpaa J. 1991. Modeling of extrusion cooking of cereals using response surface methodology.
Journal of Food Engineering 13:1-26.
Vaisey-Genser M, Ylimaki G, and Johnston B. 1987. The selection of levels of canola oil, water,
and an emulsifier system in cake formulations by response surface methodology. Cereal
Chemistry 64:50-54.
Vatsala CN, Saxena CD, and Rao PH. 2001. Optimization of ingredients and process conditions for
the preparation of puri using response surface methodology. International Journal of Food
Science and Technology 36:407-414.
Vliet T van and Hooydonk ACM van. 1984. The gel properties of some beverages. Proceedings of
the 9th International Congress on Rheology, Mexico 4:115-122.
Wang B, Xiong YL, and Wang C. 2001. Physicochemical and sensory characteristics of flavored
soymilk during refrigeration storage. Journal of Food Quality 24:513-526.
Wilkens WF, Mattick LR, and Hand DB. 1967. Effect of processing method on oxidative off-flavor
of soybean milk. Food Technology 21(12):86-89.

208
Wilson JC. 1989. The commercial utilization of soybeans, soymilk and soymilk derivatives. In
Proceedings of World Soybean Research Conference, Buenos Aires, Argentina. p 1750-1766.
209
APPENDICES
APPENDIX A
Calculation of lysine content of experimental beverage formulations
Lysine content in mg/g protein for SF (soy flour based) or SPI (soy protein isolate based)
formulation containing ‘a’ g of peanut slurry and ‘b’ g of soy slurry was calculated as follows:
Lysine content (mg/g protein) = (Lysine2 x 1000)/Protein2………………………….................(1)
Where,
Protein2 (g/100 g edible portion) = (100 x Protein1)/2000……………………………................(2)
Lysine2 (g/100 g edible portion) = (100 x Lysine1)/2000……………………………….............(3)
Note: In Eq.2 and Eq.3, basis is 2000 g of total beverage
And
Protein1 (g in total beverage) = (AP + AS)/10000..........................................................................(4)
Lysine1 (g in total beverage) = (BP + BS)/10000...........................................................................(5)
Here, AP and AS represent protein content and BP and BS represent lysine content of peanut and
soy (either soy flour or soy protein isolate) slurries/base stocks. These terms in Eq.4 and Eq.5
were calculated as follows:
AP = a x RP x PP............................................................................................................................(6)
AS = b x RS x PS............................................................................................................................(7)
BP = a x RP x LP............................................................................................................................(8)
BS = b x RS x LS............................................................................................................................(9)
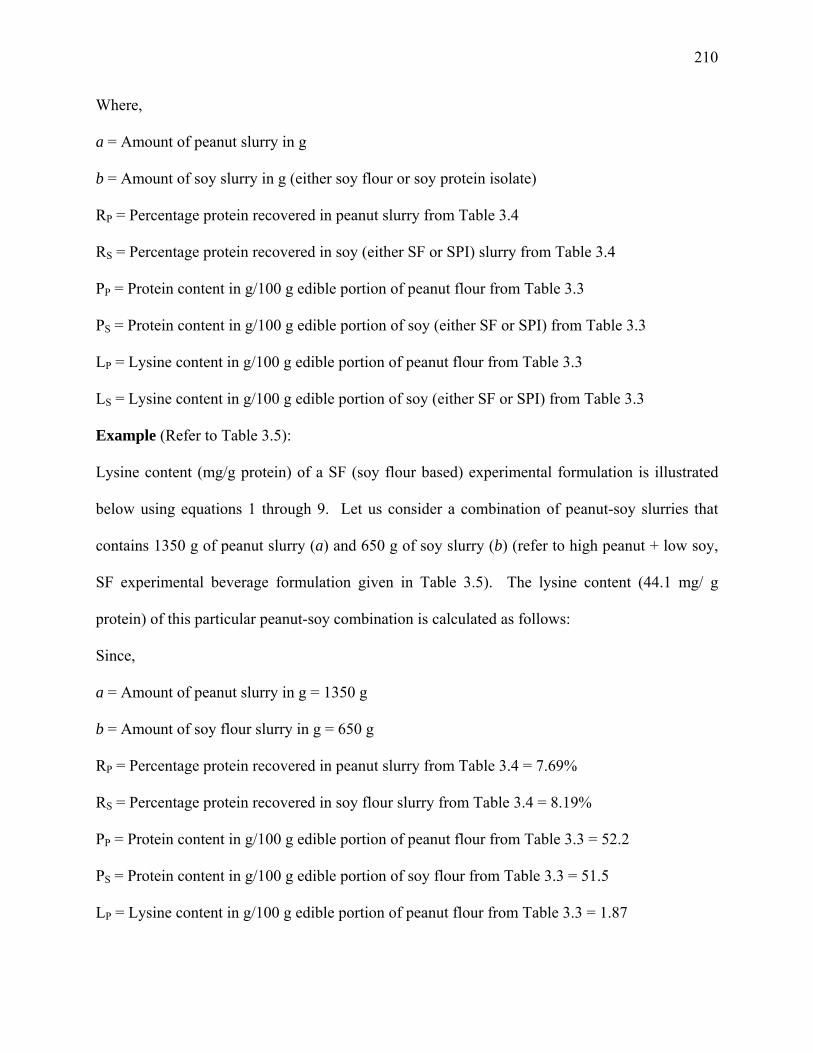
210
Where,
a = Amount of peanut slurry in g
b = Amount of soy slurry in g (either soy flour or soy protein isolate)
RP = Percentage protein recovered in peanut slurry from Table 3.4
RS = Percentage protein recovered in soy (either SF or SPI) slurry from Table 3.4
PP = Protein content in g/100 g edible portion of peanut flour from Table 3.3
PS = Protein content in g/100 g edible portion of soy (either SF or SPI) from Table 3.3
LP = Lysine content in g/100 g edible portion of peanut flour from Table 3.3
LS = Lysine content in g/100 g edible portion of soy (either SF or SPI) from Table 3.3
Example (Refer to Table 3.5):
Lysine content (mg/g protein) of a SF (soy flour based) experimental formulation is illustrated
below using equations 1 through 9. Let us consider a combination of peanut-soy slurries that
contains 1350 g of peanut slurry (a) and 650 g of soy slurry (b) (refer to high peanut + low soy,
SF experimental beverage formulation given in Table 3.5). The lysine content (44.1 mg/ g
protein) of this particular peanut-soy combination is calculated as follows:
Since,
a = Amount of peanut slurry in g = 1350 g
b = Amount of soy flour slurry in g = 650 g
RP = Percentage protein recovered in peanut slurry from Table 3.4 = 7.69%
RS = Percentage protein recovered in soy flour slurry from Table 3.4 = 8.19%
PP = Protein content in g/100 g edible portion of peanut flour from Table 3.3 = 52.2
PS = Protein content in g/100 g edible portion of soy flour from Table 3.3 = 51.5
LP = Lysine content in g/100 g edible portion of peanut flour from Table 3.3 = 1.87
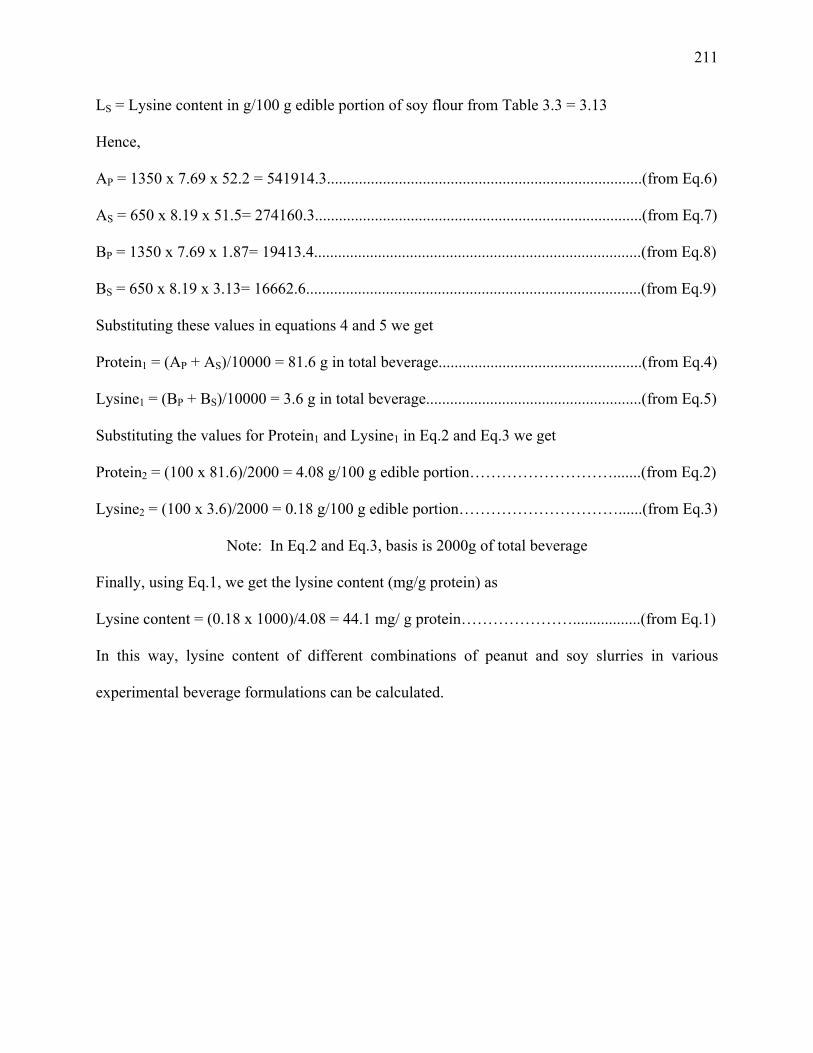
211
LS = Lysine content in g/100 g edible portion of soy flour from Table 3.3 = 3.13
Hence,
AP = 1350 x 7.69 x 52.2 = 541914.3...............................................................................(from Eq.6)
AS = 650 x 8.19 x 51.5= 274160.3..................................................................................(from Eq.7)
BP = 1350 x 7.69 x 1.87= 19413.4..................................................................................(from Eq.8)
BS = 650 x 8.19 x 3.13= 16662.6....................................................................................(from Eq.9)
Substituting these values in equations 4 and 5 we get
Protein1 = (AP + AS)/10000 = 81.6 g in total beverage...................................................(from Eq.4)
Lysine1 = (BP + BS)/10000 = 3.6 g in total beverage......................................................(from Eq.5)
Substituting the values for Protein1 and Lysine1 in Eq.2 and Eq.3 we get
Protein2 = (100 x 81.6)/2000 = 4.08 g/100 g edible portion……………………….......(from Eq.2)
Lysine2 = (100 x 3.6)/2000 = 0.18 g/100 g edible portion…………………………......(from Eq.3)
Note: In Eq.2 and Eq.3, basis is 2000g of total beverage
Finally, using Eq.1, we get the lysine content (mg/g protein) as
Lysine content = (0.18 x 1000)/4.08 = 44.1 mg/ g protein………………….................(from Eq.1)
In this way, lysine content of different combinations of peanut and soy slurries in various
experimental beverage formulations can be calculated.
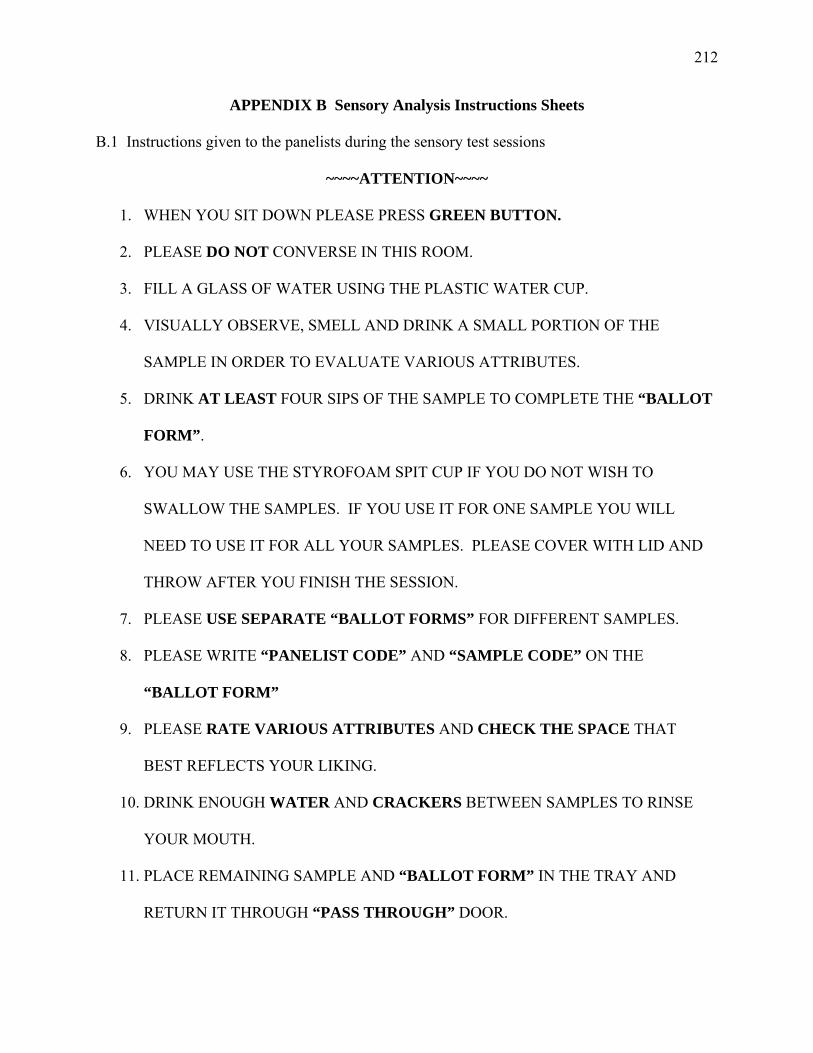
212
APPENDIX B Sensory Analysis Instructions Sheets
B.1 Instructions given to the panelists during the sensory test sessions
~~~~ATTENTION~~~~
1. WHEN YOU SIT DOWN PLEASE PRESS GREEN BUTTON.
2. PLEASE DO NOT CONVERSE IN THIS ROOM.
3. FILL A GLASS OF WATER USING THE PLASTIC WATER CUP.
4. VISUALLY OBSERVE, SMELL AND DRINK A SMALL PORTION OF THE
SAMPLE IN ORDER TO EVALUATE VARIOUS ATTRIBUTES.
5. DRINK AT LEAST FOUR SIPS OF THE SAMPLE TO COMPLETE THE “BALLOT
FORM”.
6. YOU MAY USE THE STYROFOAM SPIT CUP IF YOU DO NOT WISH TO
SWALLOW THE SAMPLES. IF YOU USE IT FOR ONE SAMPLE YOU WILL
NEED TO USE IT FOR ALL YOUR SAMPLES. PLEASE COVER WITH LID AND
THROW AFTER YOU FINISH THE SESSION.
7. PLEASE USE SEPARATE “BALLOT FORMS” FOR DIFFERENT SAMPLES.
8. PLEASE WRITE “PANELIST CODE” AND “SAMPLE CODE” ON THE
“BALLOT FORM”
9. PLEASE RATE VARIOUS ATTRIBUTES AND CHECK THE SPACE THAT
BEST REFLECTS YOUR LIKING.
10. DRINK ENOUGH WATER AND CRACKERS BETWEEN SAMPLES TO RINSE
YOUR MOUTH.
11. PLACE REMAINING SAMPLE AND “BALLOT FORM” IN THE TRAY AND
RETURN IT THROUGH “PASS THROUGH” DOOR.
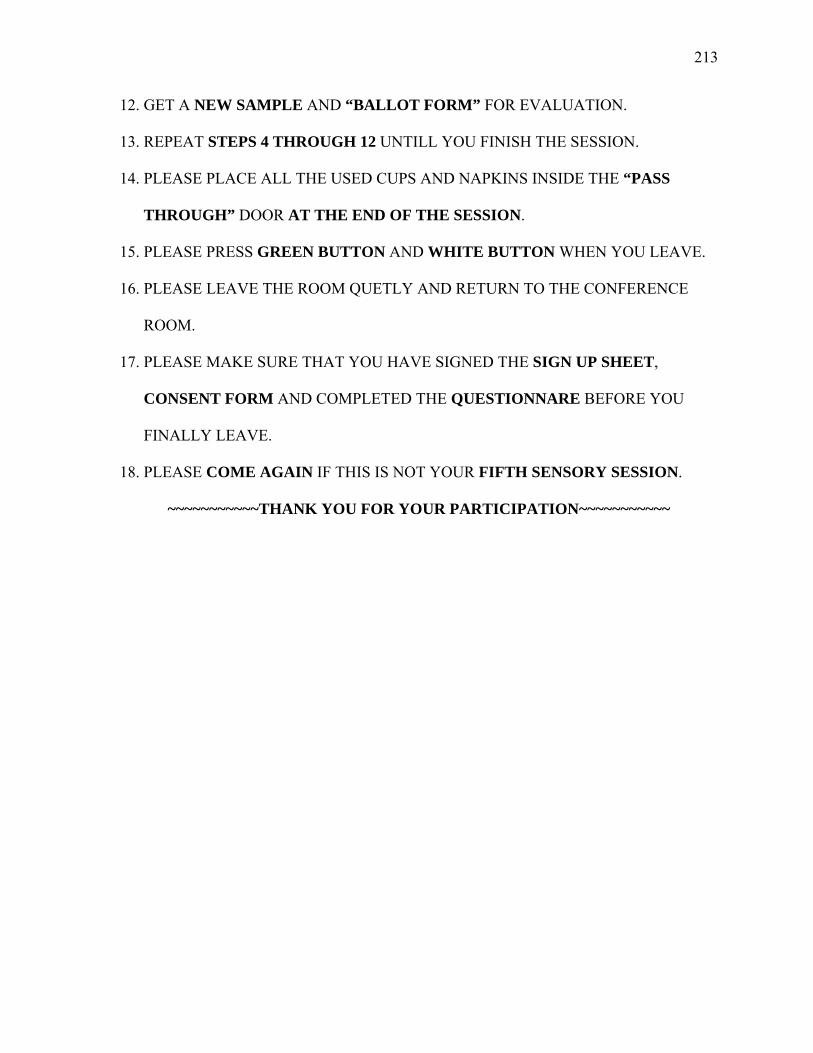
213
12. GET A NEW SAMPLE AND “BALLOT FORM” FOR EVALUATION.
13. REPEAT STEPS 4 THROUGH 12 UNTILL YOU FINISH THE SESSION.
14. PLEASE PLACE ALL THE USED CUPS AND NAPKINS INSIDE THE “PASS
THROUGH” DOOR AT THE END OF THE SESSION.
15. PLEASE PRESS GREEN BUTTON AND WHITE BUTTON WHEN YOU LEAVE.
16. PLEASE LEAVE THE ROOM QUETLY AND RETURN TO THE CONFERENCE
ROOM.
17. PLEASE MAKE SURE THAT YOU HAVE SIGNED THE SIGN UP SHEET,
CONSENT FORM AND COMPLETED THE QUESTIONNARE BEFORE YOU
FINALLY LEAVE.
18. PLEASE COME AGAIN IF THIS IS NOT YOUR FIFTH SENSORY SESSION.
~~~~~~~~~~~THANK YOU FOR YOUR PARTICIPATION~~~~~~~~~~~
214
B.2 Instructions for the person-in-charge to greet and welcome the panelists:
1. Please make sure that you have folders ready for the panelists coming for a particular
sensory sub-session.
2. Please have panelists sign in.
3. Please check the panelist code and give it to each panelist attending a particular sub-
session.
4. Tell them to sign the consent form keeping a copy for their record.
5. Please check that they have signed the “sign up” sheet and consent form.
6. Please go over the instruction sheet once in brief and tell panelists to follow it during the
sample evaluation.
7. Tell them that instruction sheet is posted on the booth wall. Sensory score ballots and
pencil will be provided along with the sample being served once they occupy the booth
area.
8. Tell them that once they occupy the booth they will pass the panelist code to the server.
9. Tell them that they will receive one sample at a time along with a sensory score ballot
which they have to return once all the questions are marked and evaluation of that
particular sample has been finished.
10. Tell them that they have to fill up a questionnaire during a break of 3 min between two
groups of sample servings (4 samples + 3 min break + 4 samples) per session.
11. Show the signboard and explain the functioning of buttons, using dummy tray explain
water cup, spit cup, ballot and the sequence of events.
12. Explain the test protocol: The test will be divided into two parts.
215
a. Panelist will receive a tray with water cup, spit cup, napkins, ballot, pencil and
first cup of sample after they pass the panelist code to the server.
b. After finishing evaluation of first sample they will pass the remaining sample and
“ballot form” through “PASS THROUGH” door.
c. They will receive next sample and “ballot form” for evaluation.
d. Total of 4 such samples will be evaluated one by one.
e. Their will be a break of 3 min after finishing group of 4 sample evaluation.
f. They will fill out the questionnaire provided during the break.
g. After the break they will return the questionnaire and repeat the procedure for
evaluation of remaining four samples one by one as described b through d.
13. Please be sure to explain them the purpose of spit cup, water cup and remind to drink
water and eat crackers between each sample during sensory evaluation to rinse the mouth.
14. Please make sure that panelists are comfortable in the booth area and know they have
understood the procedure.
15. Please give following instructions to the panelists for taste test:
a) Panelist will use separate “ballot forms” for each sample and they will return it with the
remaining sample.
b) Panelist will write his/her panelist code and sample code as shown on the sample cup at
the top space provided on the “ballot form”.
c) They will receive one sample at a time along with the “ballot form”.
d) Please evaluate all the samples by marking on the “ballot form” at the space that best
reflects their liking.
216
e) Please return the remaining sample and the completed “ballot form” in “PASS
THROUGH” door before pressing white button for next set of sample and “ballot form”.
f) Please drink a small portion of sample and start your evaluation.
g) Visually observe, smell and take some more sips to answer all different questions.
h) You may use spit cup to avoid swallowing it completely. You will have to use spit cup
for all the samples if used for one. Caution: Drinking 8 different samples of the beverage
may make them feel full.
i) Eat ½ cracker and drink several sips of water between the samples.
j) After evaluating 4 samples you will have a short break of 3 min. During this break you
have to fill out a short questionnaire. When finished please place it in the doorway and
press white button.
k) You will be served next four samples one at a time. Please evaluate them as described
earlier.
l) When finished you have to place tray, all used cups, napkins if any and pencils in the
“PASS THROUGH” door. Press white button, and then press green button to turn light
off.
m) Please quietly return to the greeting area for some refreshments.
n) Please make sure that you have completed all the paperwork before you finally leave.
o) Please remind the next scheduled session date and time unless this is their fifth and last
session.
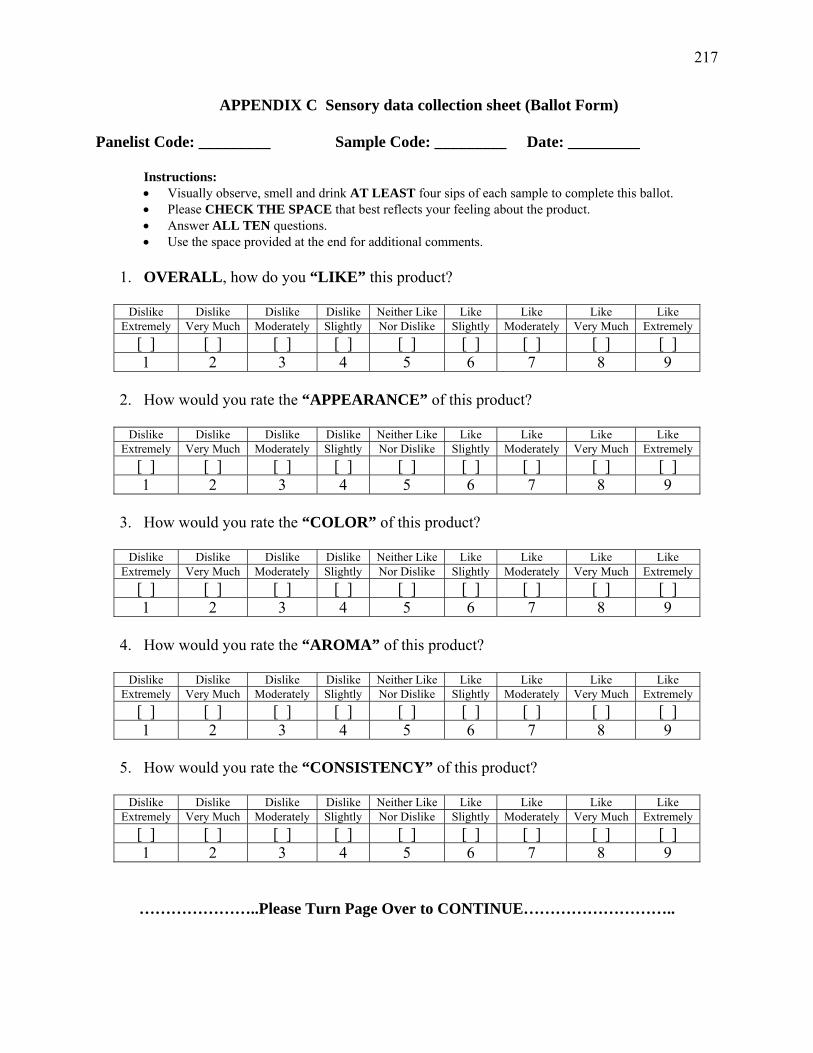
217
APPENDIX C Sensory data collection sheet (Ballot Form)
Panelist Code: _________ Sample Code: _________ Date: _________
Instructions: • Visually observe, smell and drink AT LEAST four sips of each sample to complete this ballot. • Please CHECK THE SPACE that best reflects your feeling about the product. • Answer ALL TEN questions. • Use the space provided at the end for additional comments.
1. OVERALL, how do you “LIKE” this product?
Dislike Dislike Dislike Dislike Neither Like Like Like Like Like
Extremely Very Much Moderately Slightly Nor Dislike Slightly Moderately Very Much Extremely [ ] [ ] [ ] [ ] [ ] [ ] [ ] [ ] [ ] 1 2 3 4 5 6 7 8 9
2. How would you rate the “APPEARANCE” of this product?
Dislike Dislike Dislike Dislike Neither Like Like Like Like Like Extremely Very Much Moderately Slightly Nor Dislike Slightly Moderately Very Much Extremely
[ ] [ ] [ ] [ ] [ ] [ ] [ ] [ ] [ ] 1 2 3 4 5 6 7 8 9
3. How would you rate the “COLOR” of this product?
Dislike Dislike Dislike Dislike Neither Like Like Like Like Like
Extremely Very Much Moderately Slightly Nor Dislike Slightly Moderately Very Much Extremely [ ] [ ] [ ] [ ] [ ] [ ] [ ] [ ] [ ] 1 2 3 4 5 6 7 8 9
4. How would you rate the “AROMA” of this product?
Dislike Dislike Dislike Dislike Neither Like Like Like Like Like
Extremely Very Much Moderately Slightly Nor Dislike Slightly Moderately Very Much Extremely [ ] [ ] [ ] [ ] [ ] [ ] [ ] [ ] [ ] 1 2 3 4 5 6 7 8 9
5. How would you rate the “CONSISTENCY” of this product?
Dislike Dislike Dislike Dislike Neither Like Like Like Like Like
Extremely Very Much Moderately Slightly Nor Dislike Slightly Moderately Very Much Extremely [ ] [ ] [ ] [ ] [ ] [ ] [ ] [ ] [ ] 1 2 3 4 5 6 7 8 9
…………………..Please Turn Page Over to CONTINUE………………………..
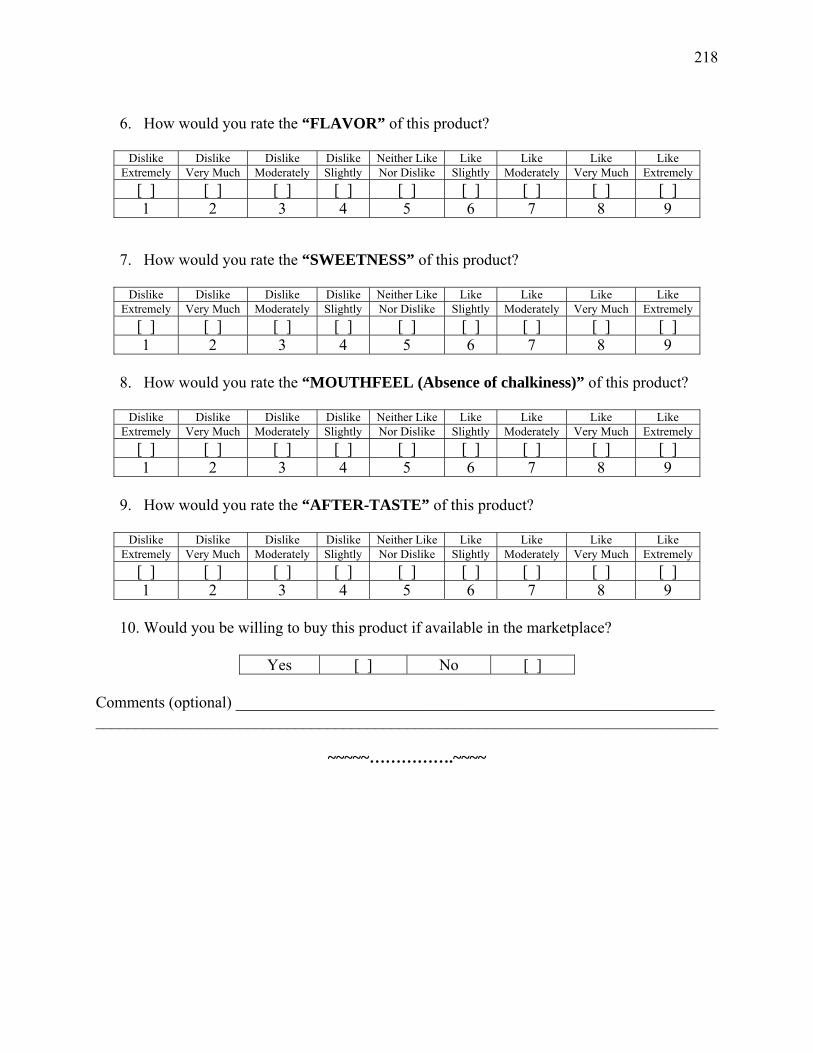
218
6. How would you rate the “FLAVOR” of this product?
Dislike Dislike Dislike Dislike Neither Like Like Like Like Like
Extremely Very Much Moderately Slightly Nor Dislike Slightly Moderately Very Much Extremely [ ] [ ] [ ] [ ] [ ] [ ] [ ] [ ] [ ] 1 2 3 4 5 6 7 8 9
7. How would you rate the “SWEETNESS” of this product?
Dislike Dislike Dislike Dislike Neither Like Like Like Like Like Extremely Very Much Moderately Slightly Nor Dislike Slightly Moderately Very Much Extremely
[ ] [ ] [ ] [ ] [ ] [ ] [ ] [ ] [ ] 1 2 3 4 5 6 7 8 9
8. How would you rate the “MOUTHFEEL (Absence of chalkiness)” of this product?
Dislike Dislike Dislike Dislike Neither Like Like Like Like Like
Extremely Very Much Moderately Slightly Nor Dislike Slightly Moderately Very Much Extremely [ ] [ ] [ ] [ ] [ ] [ ] [ ] [ ] [ ] 1 2 3 4 5 6 7 8 9
9. How would you rate the “AFTER-TASTE” of this product?
Dislike Dislike Dislike Dislike Neither Like Like Like Like Like
Extremely Very Much Moderately Slightly Nor Dislike Slightly Moderately Very Much Extremely [ ] [ ] [ ] [ ] [ ] [ ] [ ] [ ] [ ] 1 2 3 4 5 6 7 8 9
10. Would you be willing to buy this product if available in the marketplace?
Yes [ ] No [ ] Comments (optional) ____________________________________________________________ ______________________________________________________________________________
~~~~~…………….~~~~
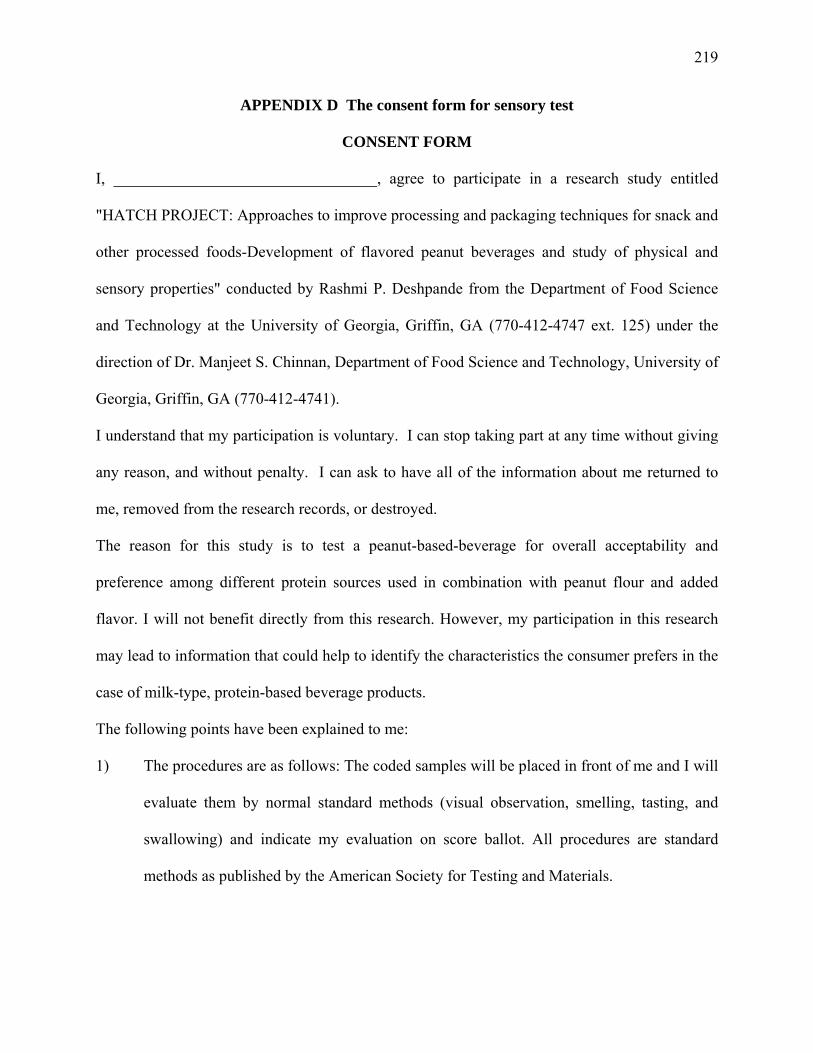
219
APPENDIX D The consent form for sensory test
CONSENT FORM
I, _________________________________, agree to participate in a research study entitled
"HATCH PROJECT: Approaches to improve processing and packaging techniques for snack and
other processed foods-Development of flavored peanut beverages and study of physical and
sensory properties" conducted by Rashmi P. Deshpande from the Department of Food Science
and Technology at the University of Georgia, Griffin, GA (770-412-4747 ext. 125) under the
direction of Dr. Manjeet S. Chinnan, Department of Food Science and Technology, University of
Georgia, Griffin, GA (770-412-4741).
I understand that my participation is voluntary. I can stop taking part at any time without giving
any reason, and without penalty. I can ask to have all of the information about me returned to
me, removed from the research records, or destroyed.
The reason for this study is to test a peanut-based-beverage for overall acceptability and
preference among different protein sources used in combination with peanut flour and added
flavor. I will not benefit directly from this research. However, my participation in this research
may lead to information that could help to identify the characteristics the consumer prefers in the
case of milk-type, protein-based beverage products.
The following points have been explained to me:
1) The procedures are as follows: The coded samples will be placed in front of me and I will
evaluate them by normal standard methods (visual observation, smelling, tasting, and
swallowing) and indicate my evaluation on score ballot. All procedures are standard
methods as published by the American Society for Testing and Materials.
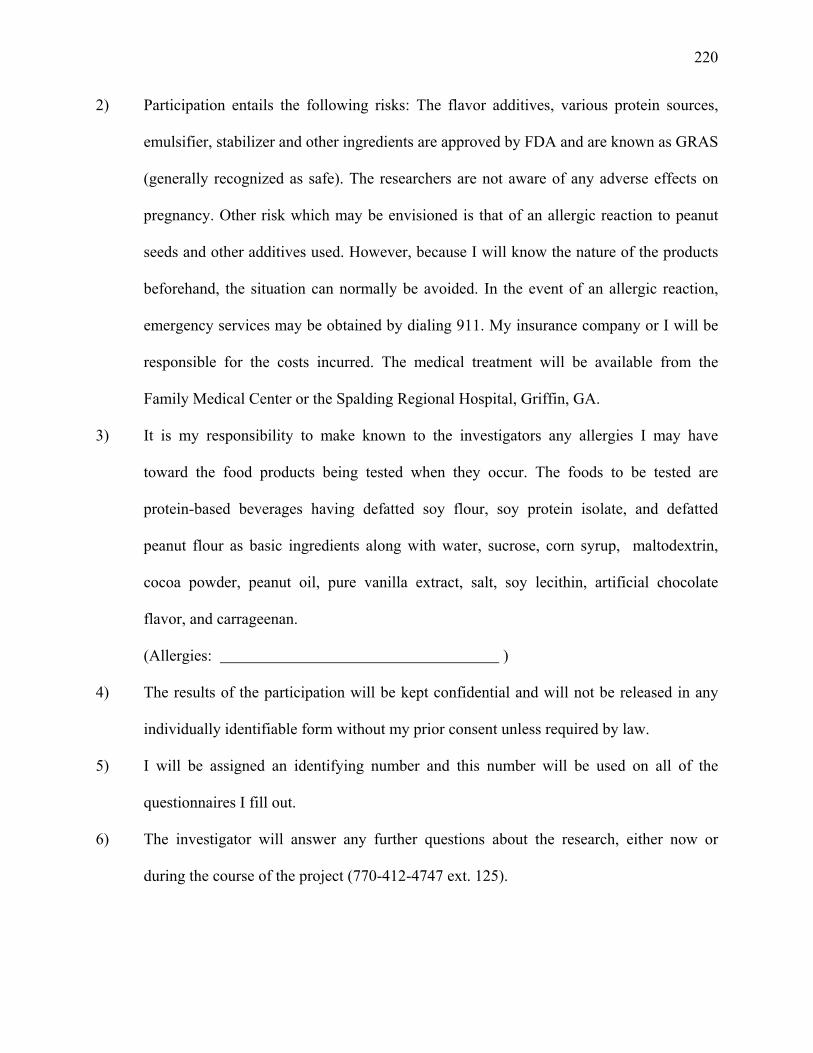
220
2) Participation entails the following risks: The flavor additives, various protein sources,
emulsifier, stabilizer and other ingredients are approved by FDA and are known as GRAS
(generally recognized as safe). The researchers are not aware of any adverse effects on
pregnancy. Other risk which may be envisioned is that of an allergic reaction to peanut
seeds and other additives used. However, because I will know the nature of the products
beforehand, the situation can normally be avoided. In the event of an allergic reaction,
emergency services may be obtained by dialing 911. My insurance company or I will be
responsible for the costs incurred. The medical treatment will be available from the
Family Medical Center or the Spalding Regional Hospital, Griffin, GA.
3) It is my responsibility to make known to the investigators any allergies I may have
toward the food products being tested when they occur. The foods to be tested are
protein-based beverages having defatted soy flour, soy protein isolate, and defatted
peanut flour as basic ingredients along with water, sucrose, corn syrup, maltodextrin,
cocoa powder, peanut oil, pure vanilla extract, salt, soy lecithin, artificial chocolate
flavor, and carrageenan.
(Allergies: )
4) The results of the participation will be kept confidential and will not be released in any
individually identifiable form without my prior consent unless required by law.
5) I will be assigned an identifying number and this number will be used on all of the
questionnaires I fill out.
6) The investigator will answer any further questions about the research, either now or
during the course of the project (770-412-4747 ext. 125).

221
I understand that I am agreeing by my signature on this form to take part in this research project
and understand that I will receive a signed copy of this consent form for my records.
_________________________ _______________________ __________
Name of Researcher Signature Date
Telephone: ________________ Email: ____________________________
_________________________ _______________________ __________
Name of Participant Signature Date
Please sign both copies, keep one and return one to the researcher.
Additional questions or problems regarding your rights as a research participant should be addressed to Chris A. Joseph, Ph.D. Human Subjects Office, University of Georgia, 606A Boyd Graduate Studies Research Center, Athens, Georgia 30602-7411; Telephone (706) 542-3199; E-Mail Address [email protected].
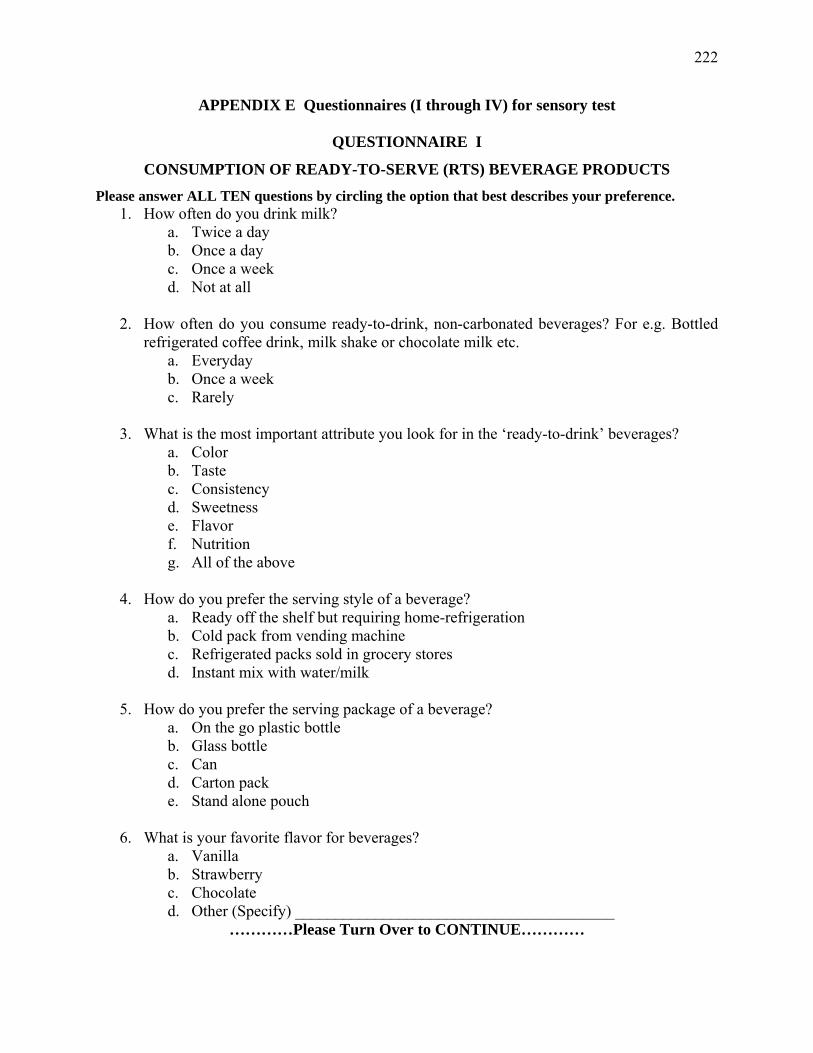
222
APPENDIX E Questionnaires (I through IV) for sensory test
QUESTIONNAIRE I
CONSUMPTION OF READY-TO-SERVE (RTS) BEVERAGE PRODUCTS
Please answer ALL TEN questions by circling the option that best describes your preference. 1. How often do you drink milk?
a. Twice a day b. Once a day c. Once a week d. Not at all
2. How often do you consume ready-to-drink, non-carbonated beverages? For e.g. Bottled refrigerated coffee drink, milk shake or chocolate milk etc.
a. Everyday b. Once a week c. Rarely
3. What is the most important attribute you look for in the ‘ready-to-drink’ beverages? a. Color b. Taste c. Consistency d. Sweetness e. Flavor f. Nutrition g. All of the above
4. How do you prefer the serving style of a beverage? a. Ready off the shelf but requiring home-refrigeration b. Cold pack from vending machine c. Refrigerated packs sold in grocery stores d. Instant mix with water/milk
5. How do you prefer the serving package of a beverage? a. On the go plastic bottle b. Glass bottle c. Can d. Carton pack e. Stand alone pouch
6. What is your favorite flavor for beverages? a. Vanilla b. Strawberry c. Chocolate d. Other (Specify) ________________________________________
…………Please Turn Over to CONTINUE…………
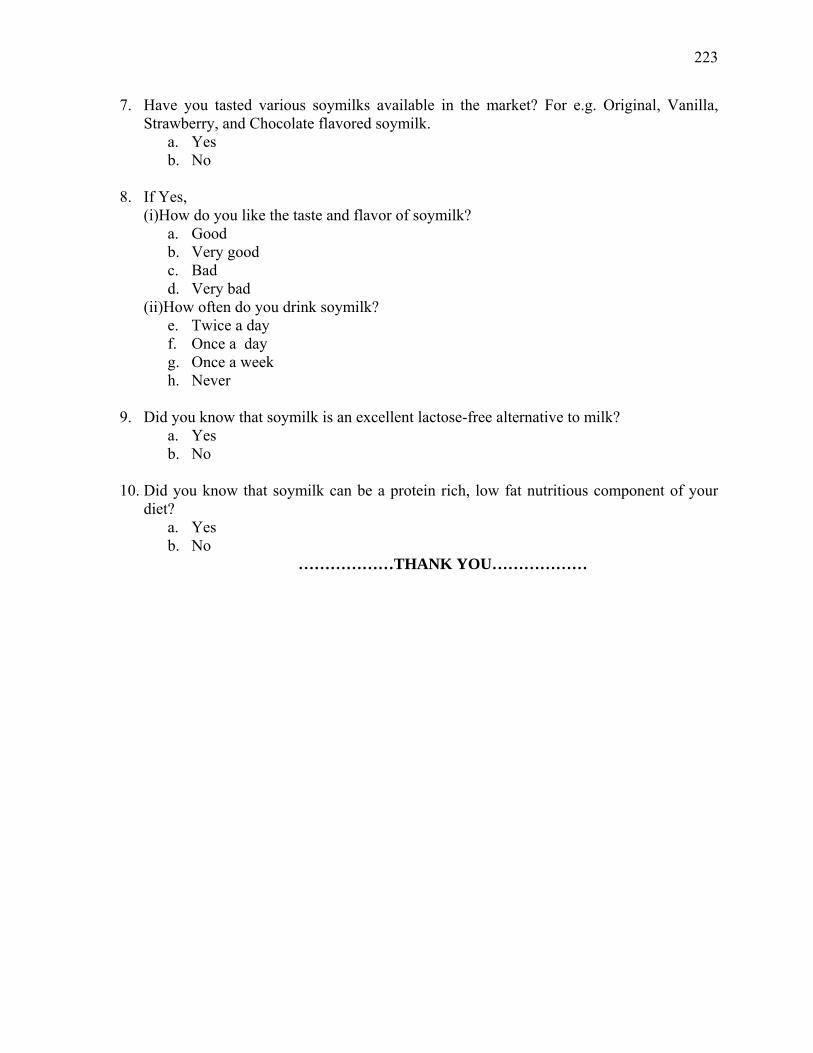
223
7. Have you tasted various soymilks available in the market? For e.g. Original, Vanilla, Strawberry, and Chocolate flavored soymilk.
a. Yes b. No
8. If Yes, (i)How do you like the taste and flavor of soymilk?
a. Good b. Very good c. Bad d. Very bad
(ii)How often do you drink soymilk? e. Twice a day f. Once a day g. Once a week h. Never
9. Did you know that soymilk is an excellent lactose-free alternative to milk? a. Yes b. No
10. Did you know that soymilk can be a protein rich, low fat nutritious component of your
diet? a. Yes b. No
………………THANK YOU………………
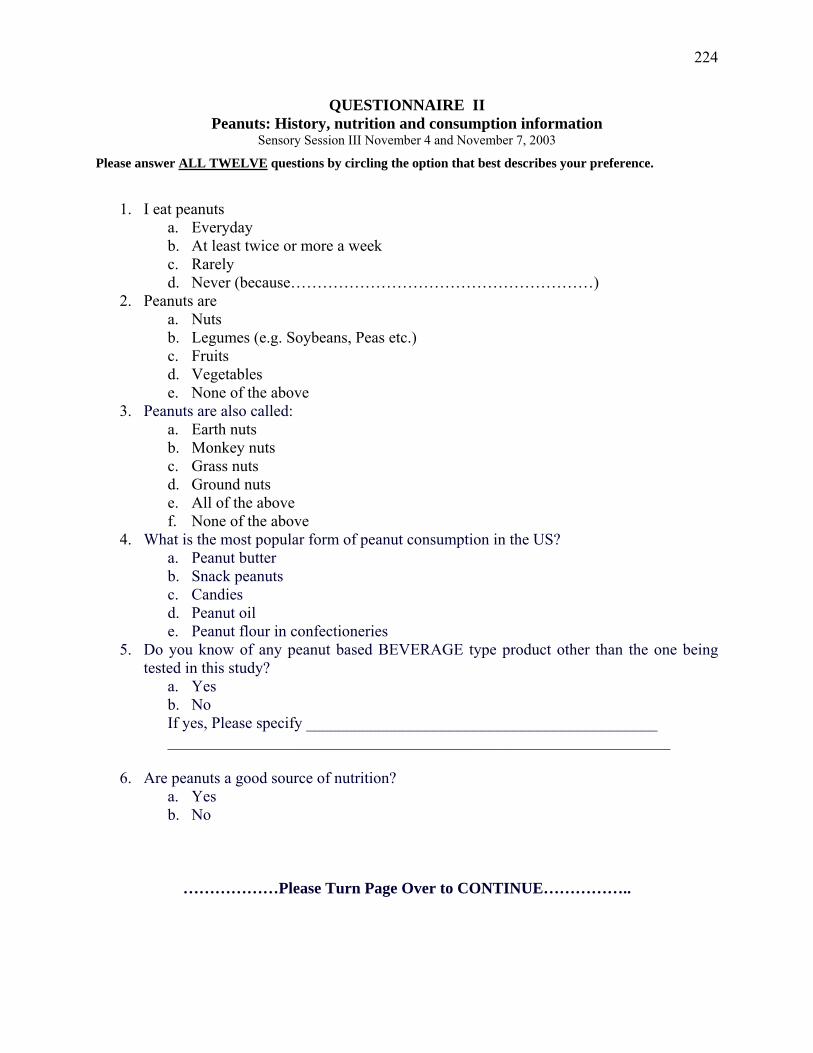
224
QUESTIONNAIRE II Peanuts: History, nutrition and consumption information
Sensory Session III November 4 and November 7, 2003
Please answer ALL TWELVE questions by circling the option that best describes your preference.
1. I eat peanuts
a. Everyday b. At least twice or more a week c. Rarely d. Never (because…………………………………………………)
2. Peanuts are a. Nuts b. Legumes (e.g. Soybeans, Peas etc.) c. Fruits d. Vegetables e. None of the above
3. Peanuts are also called: a. Earth nuts b. Monkey nuts c. Grass nuts d. Ground nuts e. All of the above f. None of the above
4. What is the most popular form of peanut consumption in the US? a. Peanut butter b. Snack peanuts c. Candies d. Peanut oil e. Peanut flour in confectioneries
5. Do you know of any peanut based BEVERAGE type product other than the one being tested in this study?
a. Yes b. No If yes, Please specify ____________________________________________ _______________________________________________________________
6. Are peanuts a good source of nutrition? a. Yes b. No
………………Please Turn Page Over to CONTINUE……………..
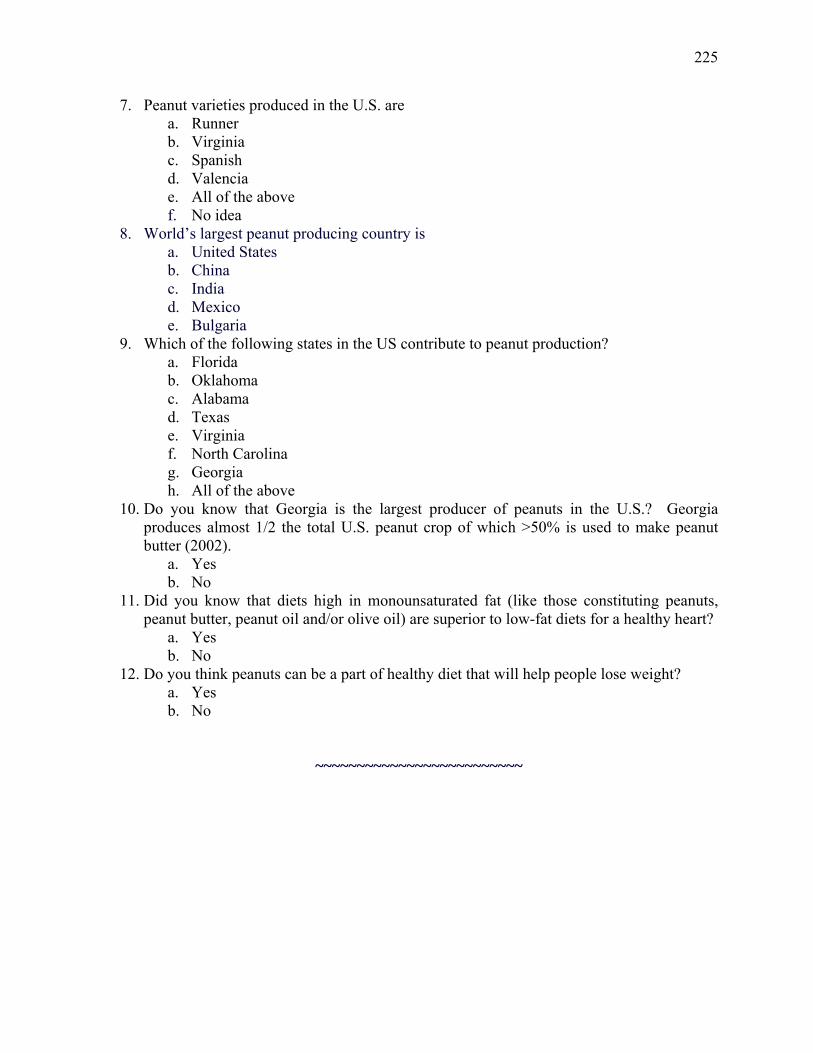
225
7. Peanut varieties produced in the U.S. are a. Runner b. Virginia c. Spanish d. Valencia e. All of the above f. No idea
8. World’s largest peanut producing country is a. United States b. China c. India d. Mexico e. Bulgaria
9. Which of the following states in the US contribute to peanut production? a. Florida b. Oklahoma c. Alabama d. Texas e. Virginia f. North Carolina g. Georgia h. All of the above
10. Do you know that Georgia is the largest producer of peanuts in the U.S.? Georgia produces almost 1/2 the total U.S. peanut crop of which >50% is used to make peanut butter (2002).
a. Yes b. No
11. Did you know that diets high in monounsaturated fat (like those constituting peanuts, peanut butter, peanut oil and/or olive oil) are superior to low-fat diets for a healthy heart?
a. Yes b. No
12. Do you think peanuts can be a part of healthy diet that will help people lose weight? a. Yes b. No
~~~~~~~~~~~~~~~~~~~~~~~~~
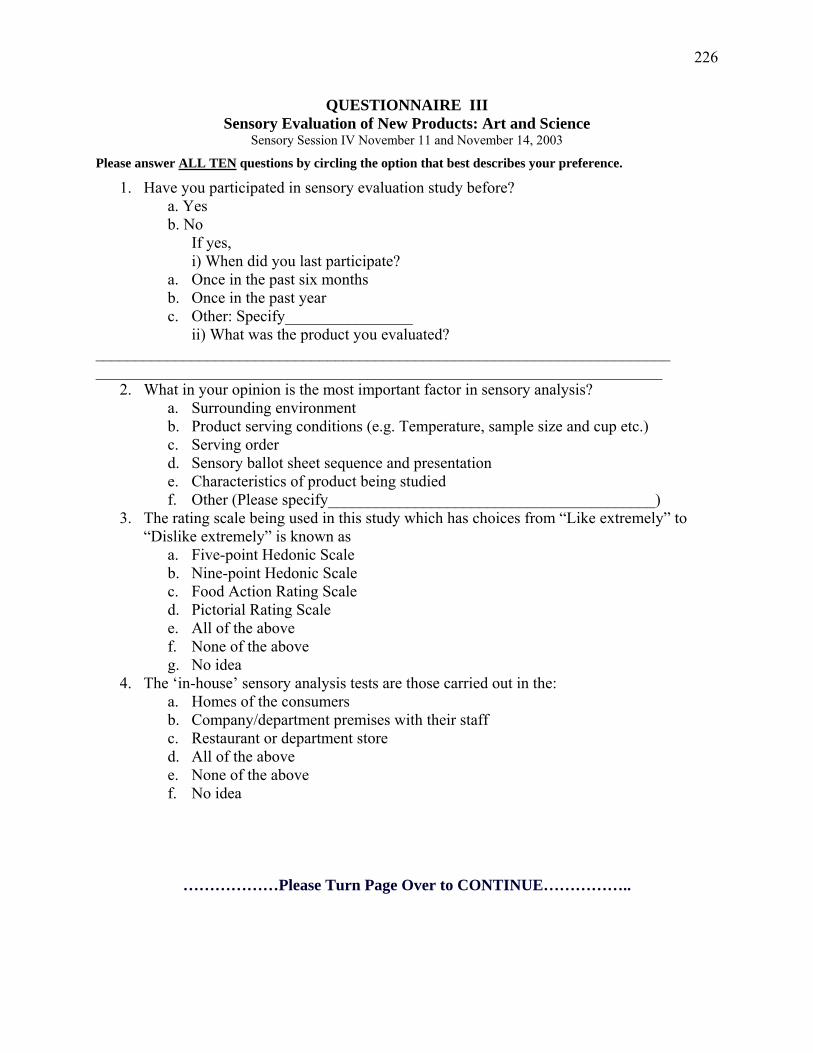
226
QUESTIONNAIRE III Sensory Evaluation of New Products: Art and Science
Sensory Session IV November 11 and November 14, 2003
Please answer ALL TEN questions by circling the option that best describes your preference.
1. Have you participated in sensory evaluation study before? a. Yes b. No
If yes, i) When did you last participate?
a. Once in the past six months b. Once in the past year c. Other: Specify________________
ii) What was the product you evaluated? ________________________________________________________________________ _______________________________________________________________________
2. What in your opinion is the most important factor in sensory analysis? a. Surrounding environment b. Product serving conditions (e.g. Temperature, sample size and cup etc.) c. Serving order d. Sensory ballot sheet sequence and presentation e. Characteristics of product being studied f. Other (Please specify_________________________________________)
3. The rating scale being used in this study which has choices from “Like extremely” to “Dislike extremely” is known as
a. Five-point Hedonic Scale b. Nine-point Hedonic Scale c. Food Action Rating Scale d. Pictorial Rating Scale e. All of the above f. None of the above g. No idea
4. The ‘in-house’ sensory analysis tests are those carried out in the: a. Homes of the consumers b. Company/department premises with their staff c. Restaurant or department store d. All of the above e. None of the above f. No idea
………………Please Turn Page Over to CONTINUE……………..
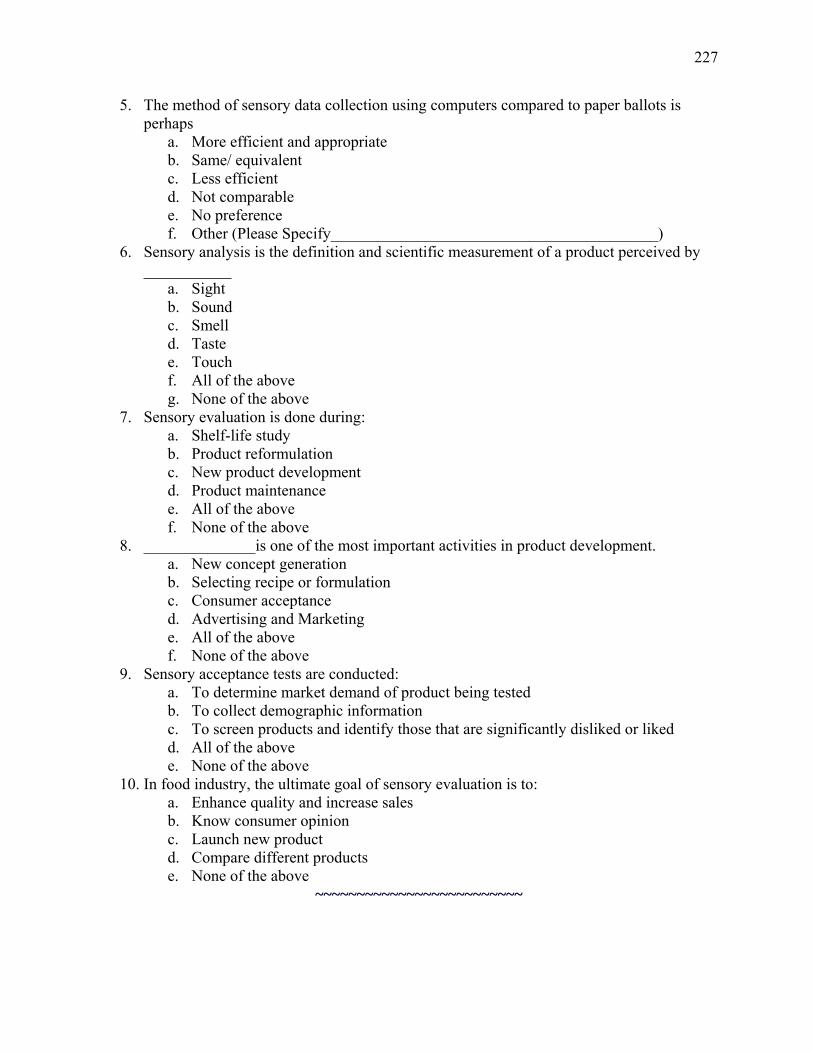
227
5. The method of sensory data collection using computers compared to paper ballots is perhaps
a. More efficient and appropriate b. Same/ equivalent c. Less efficient d. Not comparable e. No preference f. Other (Please Specify_________________________________________)
6. Sensory analysis is the definition and scientific measurement of a product perceived by ___________
a. Sight b. Sound c. Smell d. Taste e. Touch f. All of the above g. None of the above
7. Sensory evaluation is done during: a. Shelf-life study b. Product reformulation c. New product development d. Product maintenance e. All of the above f. None of the above
8. ______________is one of the most important activities in product development. a. New concept generation b. Selecting recipe or formulation c. Consumer acceptance d. Advertising and Marketing e. All of the above f. None of the above
9. Sensory acceptance tests are conducted: a. To determine market demand of product being tested b. To collect demographic information c. To screen products and identify those that are significantly disliked or liked d. All of the above e. None of the above
10. In food industry, the ultimate goal of sensory evaluation is to: a. Enhance quality and increase sales b. Know consumer opinion c. Launch new product d. Compare different products e. None of the above
~~~~~~~~~~~~~~~~~~~~~~~~~
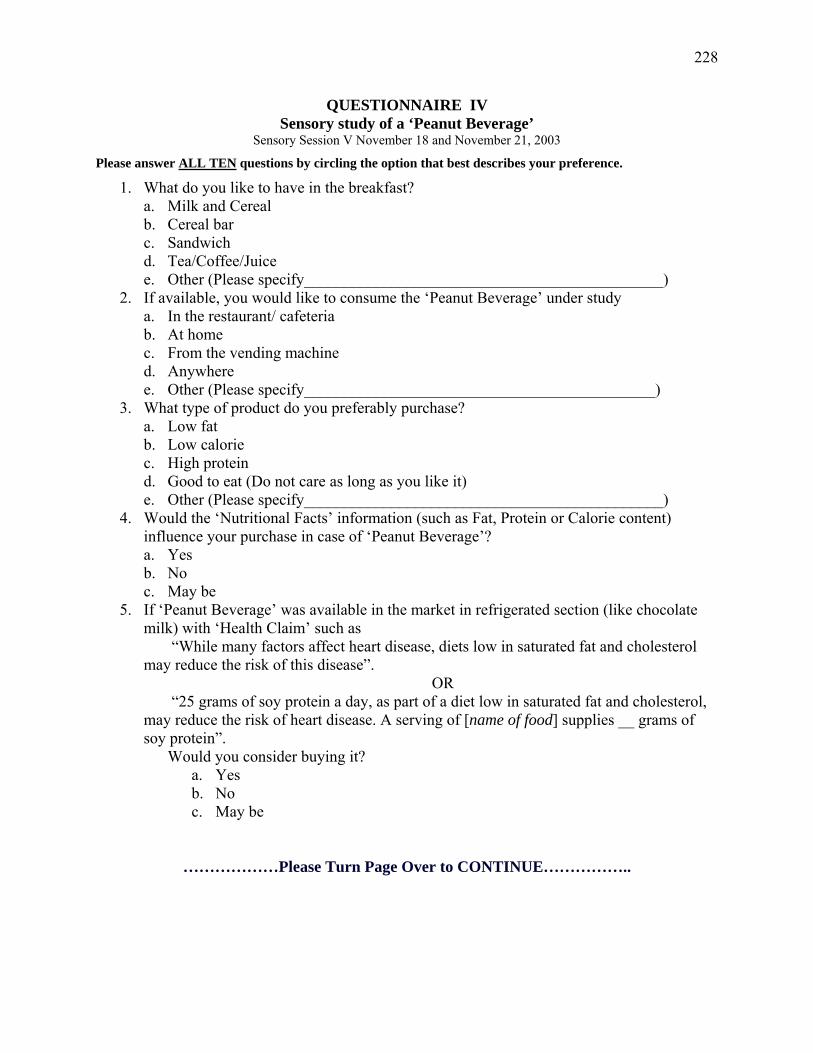
228
QUESTIONNAIRE IV Sensory study of a ‘Peanut Beverage’
Sensory Session V November 18 and November 21, 2003
Please answer ALL TEN questions by circling the option that best describes your preference.
1. What do you like to have in the breakfast? a. Milk and Cereal b. Cereal bar c. Sandwich d. Tea/Coffee/Juice e. Other (Please specify_____________________________________________)
2. If available, you would like to consume the ‘Peanut Beverage’ under study a. In the restaurant/ cafeteria b. At home c. From the vending machine d. Anywhere e. Other (Please specify____________________________________________)
3. What type of product do you preferably purchase? a. Low fat b. Low calorie c. High protein d. Good to eat (Do not care as long as you like it) e. Other (Please specify_____________________________________________)
4. Would the ‘Nutritional Facts’ information (such as Fat, Protein or Calorie content) influence your purchase in case of ‘Peanut Beverage’? a. Yes b. No c. May be
5. If ‘Peanut Beverage’ was available in the market in refrigerated section (like chocolate milk) with ‘Health Claim’ such as
“While many factors affect heart disease, diets low in saturated fat and cholesterol may reduce the risk of this disease”.
OR “25 grams of soy protein a day, as part of a diet low in saturated fat and cholesterol,
may reduce the risk of heart disease. A serving of [name of food] supplies __ grams of soy protein”.
Would you consider buying it? a. Yes b. No c. May be
………………Please Turn Page Over to CONTINUE……………..
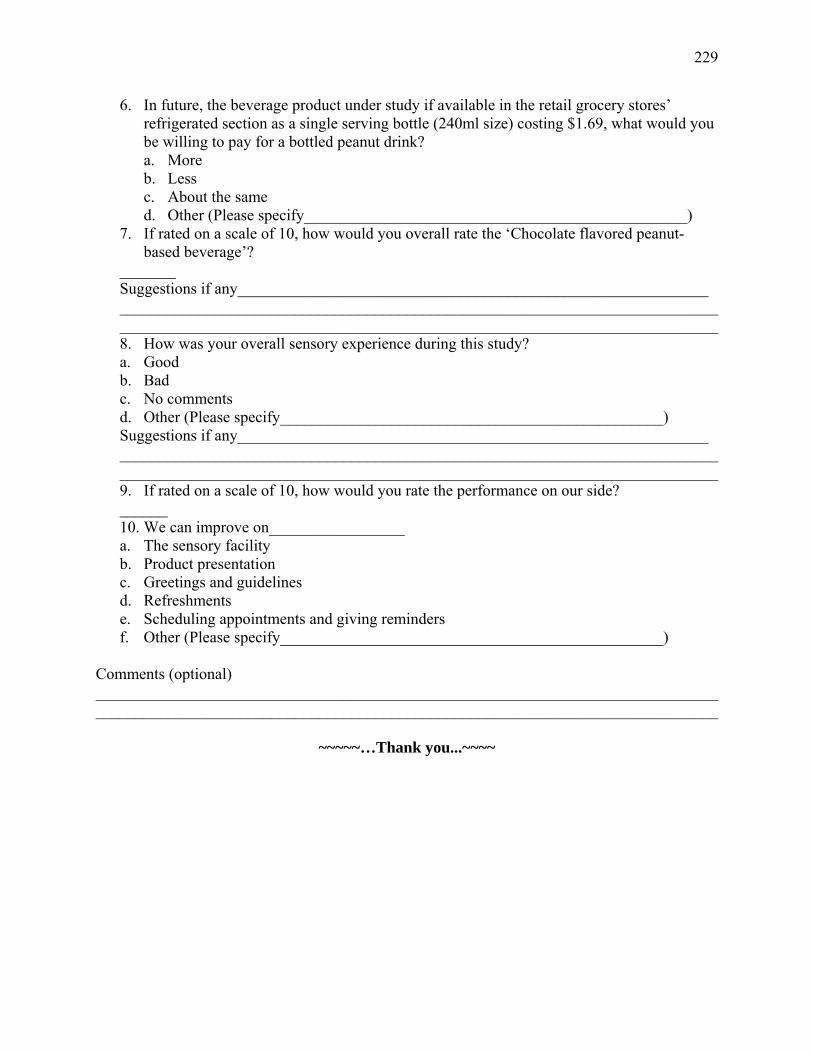
229
6. In future, the beverage product under study if available in the retail grocery stores’ refrigerated section as a single serving bottle (240ml size) costing $1.69, what would you be willing to pay for a bottled peanut drink? a. More b. Less c. About the same d. Other (Please specify________________________________________________)
7. If rated on a scale of 10, how would you overall rate the ‘Chocolate flavored peanut-based beverage’?
_______ Suggestions if any___________________________________________________________ ___________________________________________________________________________ ___________________________________________________________________________ 8. How was your overall sensory experience during this study? a. Good b. Bad c. No comments d. Other (Please specify________________________________________________) Suggestions if any___________________________________________________________ ___________________________________________________________________________ ___________________________________________________________________________ 9. If rated on a scale of 10, how would you rate the performance on our side? ______ 10. We can improve on_________________ a. The sensory facility b. Product presentation c. Greetings and guidelines d. Refreshments e. Scheduling appointments and giving reminders f. Other (Please specify________________________________________________)
Comments (optional) ______________________________________________________________________________ ______________________________________________________________________________
~~~~~…Thank you...~~~~


