A&C Division
February 3, 2010
Development of Warm Mix
Asphalt in North America
The Western Canada Pavement Workshop – 2010 Addition
R.W. Forfylow, P.Eng
Director of Quality – Asphalt , Paving & Construction
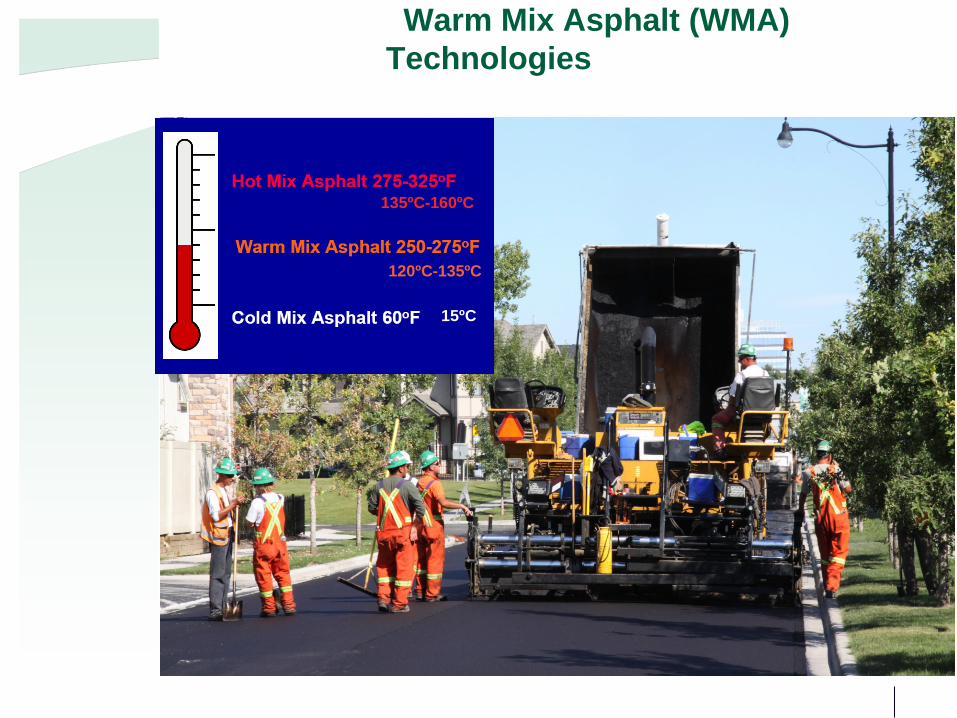
Warm Mix Asphalt (WMA)
Technologies
135ºC-160ºC
120ºC-135ºC
15ºC
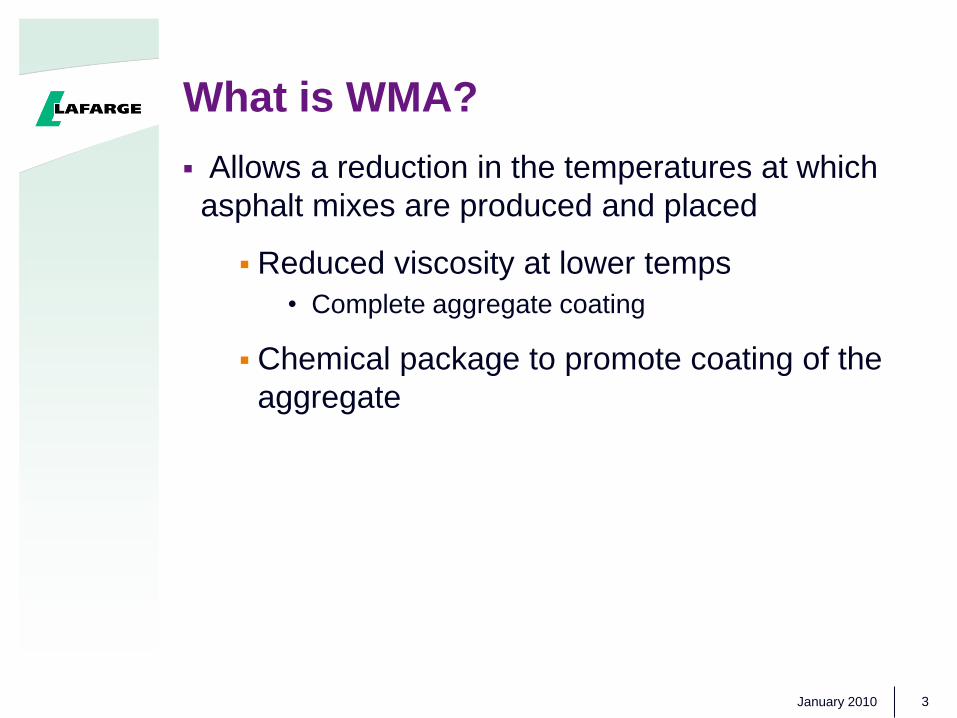
What is WMA?
Allows a reduction in the temperatures at which
asphalt mixes are produced and placed
Reduced viscosity at lower temps
• Complete aggregate coating
Chemical package to promote coating of the
aggregate
January 2010 3
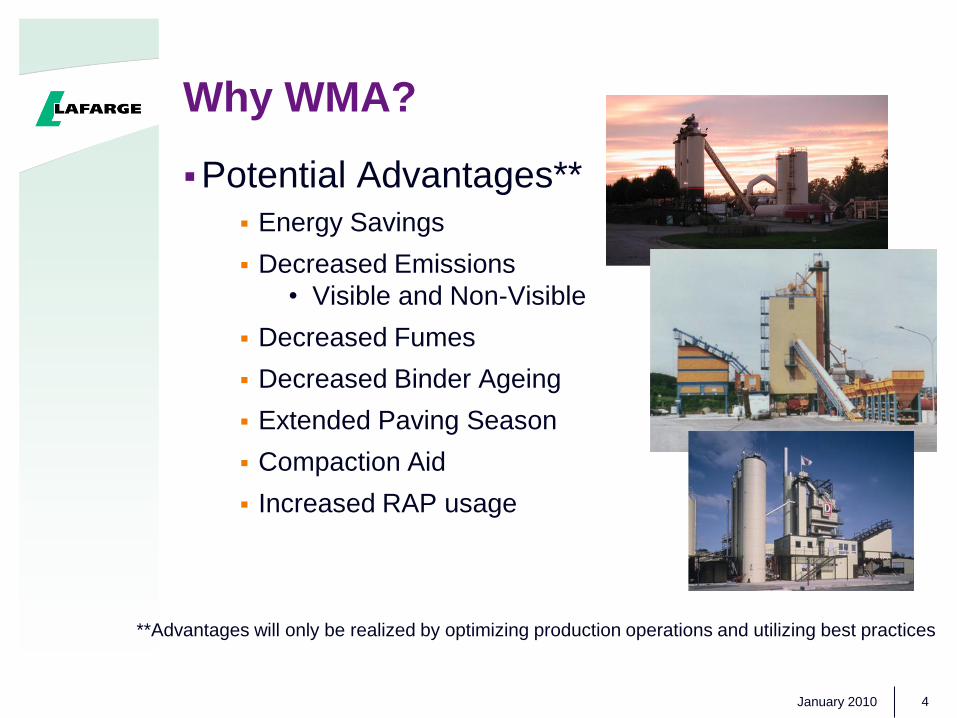
Why WMA?
Potential Advantages**
Energy Savings
Decreased Emissions
• Visible and Non-Visible
Decreased Fumes
Decreased Binder Ageing
Extended Paving Season
Compaction Aid
Increased RAP usage
January 2010 4
**Advantages will only be realized by optimizing production operations and utilizing best practices
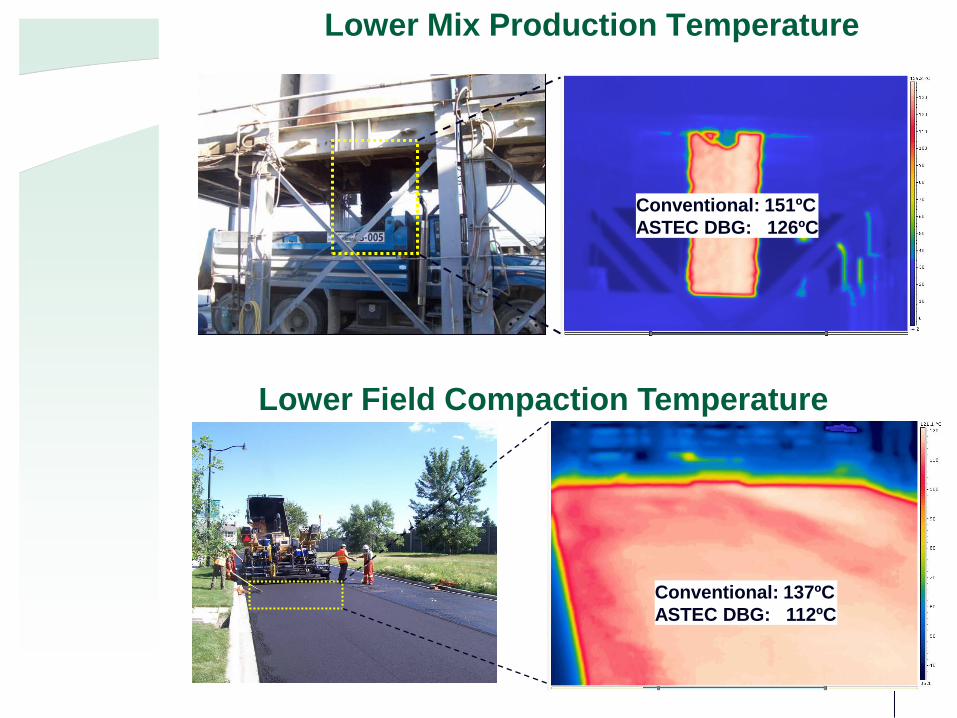
Lower Mix Production Temperature
Conventional: 151ºC
ASTEC DBG: 126ºC
Lower Field Compaction Temperature
Conventional: 137ºC
ASTEC DBG: 112ºC
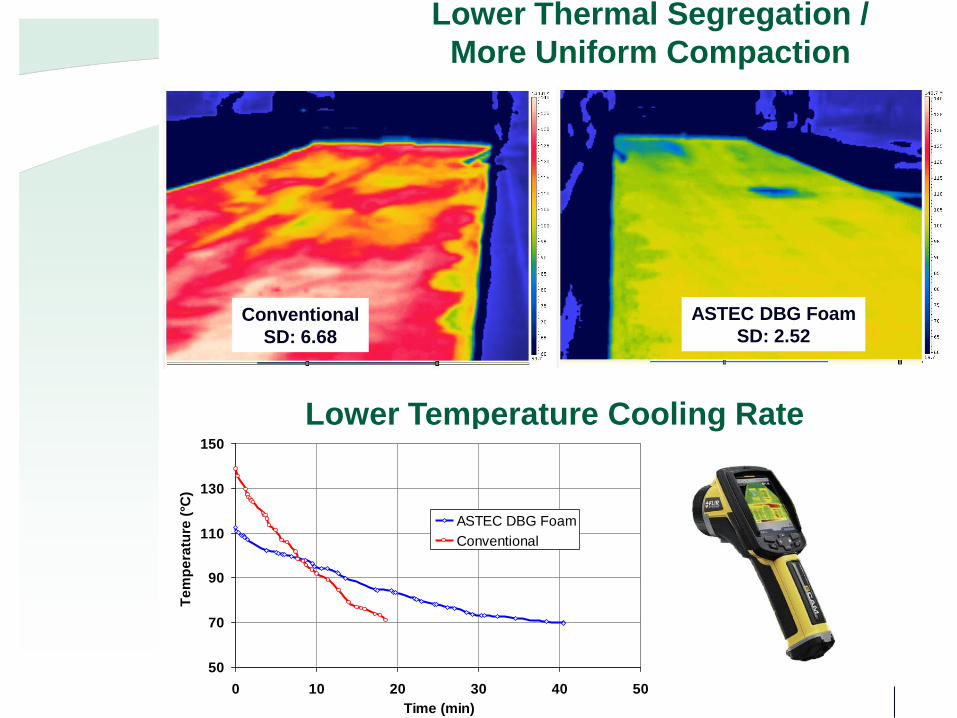
Lower Thermal Segregation /
More Uniform Compaction
Conventional
SD: 6.68
ASTEC DBG Foam
SD: 2.52
Lower Temperature Cooling Rate
50
70
90
110
130
150
0 10 20 30 40 50
Time (min)
Te
mp
era
ture
(°C
)
ASTEC DBG Foam
Conventional
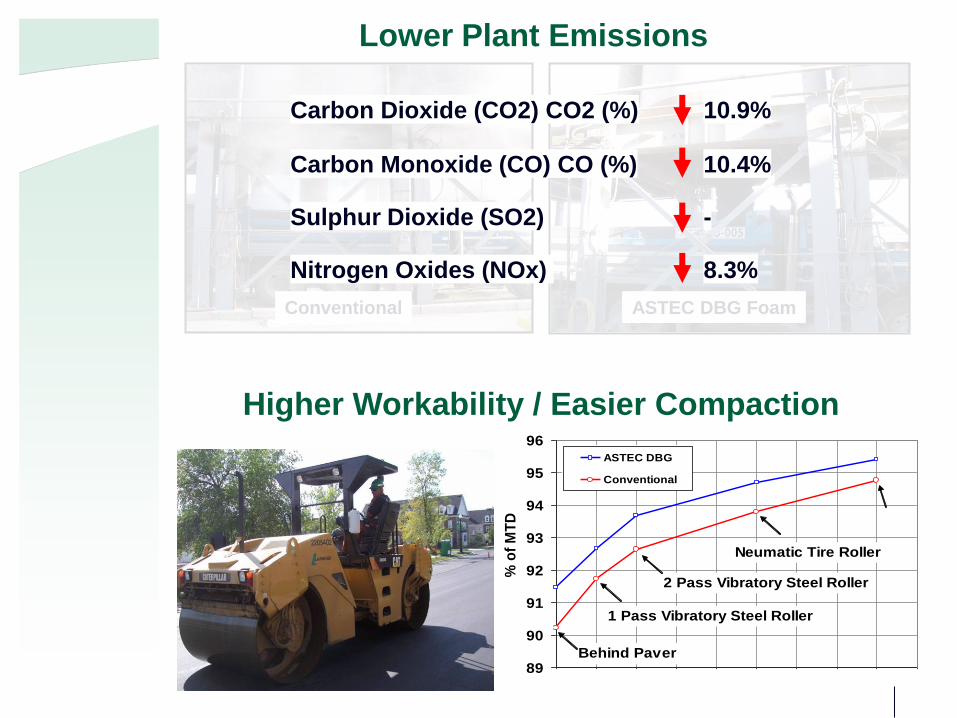
Lower Plant Emissions
Conventional ASTEC DBG Foam
Carbon Dioxide (CO2) CO2 (%)
Carbon Monoxide (CO) CO (%)
Sulphur Dioxide (SO2)
Nitrogen Oxides (NOx)
10.9%
10.4%
-
8.3%
Higher Workability / Easier Compaction
89
90
91
92
93
94
95
96
0 1 2 3 4 5 6 7 8 9
% o
f M
TD
ASTEC DBG
Conventional
1 Pass Vibratory Steel Roller
2 Pass Vibratory Steel Roller
Neumatic Tire Roller
Behind Paver
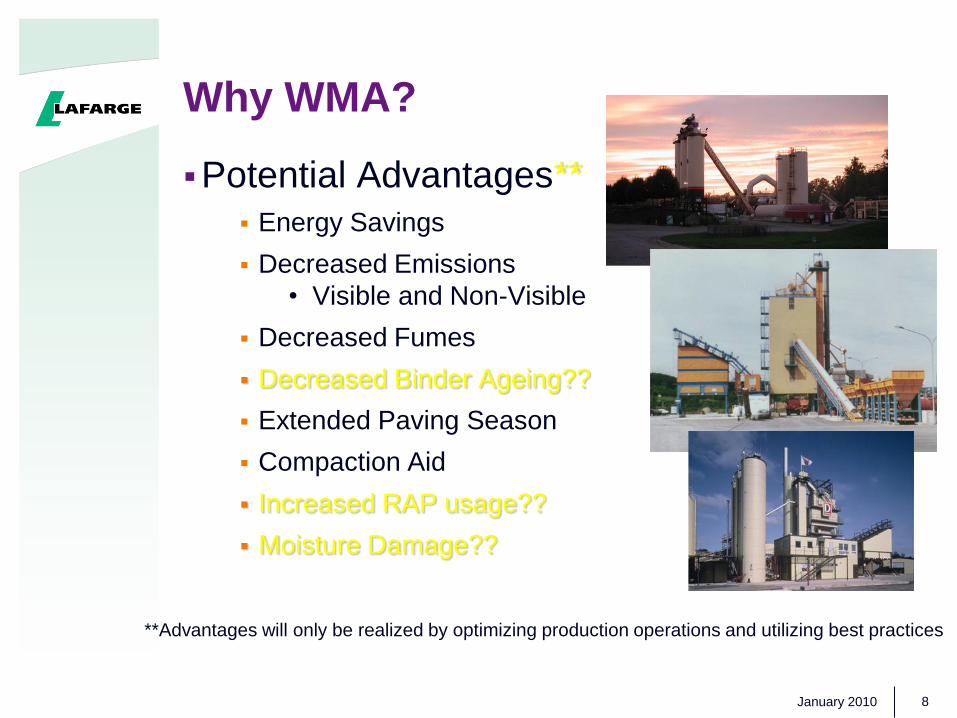
Why WMA?
Potential Advantages**
Energy Savings
Decreased Emissions
• Visible and Non-Visible
Decreased Fumes
Decreased Binder Ageing??
Extended Paving Season
Compaction Aid
Increased RAP usage??
Moisture Damage??
January 2010 8
**Advantages will only be realized by optimizing production operations and utilizing best practices
WMA Investigation and
Implementation Premise
Although there are many factors driving
the development and implementation of
WMA technologies globally, in order for
WMA to succeed, WMA pavements must
have equal or better performance when
compared to traditional HMA pavements
January 2010 9
Brief World History
1995 Preliminary Lab Experiments
1997 German Bitumen Forum
2000 First International Conference of Asphalt Pavements
(Sydney)
2000 Second Euroasphalt and Eurobitume Congress
(Barcelona)
NAPA 2002 European Scan Tour
Germany & Norway
January 2010 10
Brief US History
NAPA Annual Meeting 2003
San Diego
World of Asphalt 2004
Nashville
WMA TWG 2005
FHWA International Scan 2007
International WMA Conference 2008
Nashville
January 2010 11
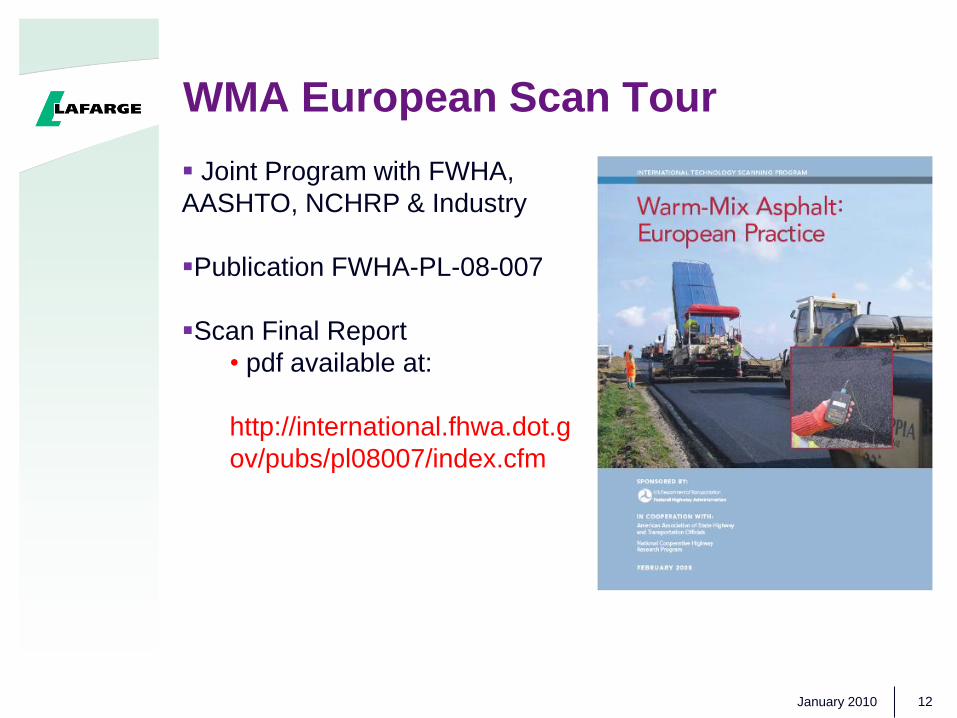
WMA European Scan Tour
12January 2010
Joint Program with FWHA,
AASHTO, NCHRP & Industry
Publication FWHA-PL-08-007
Scan Final Report
• pdf available at:
http://international.fhwa.dot.g
ov/pubs/pl08007/index.cfm
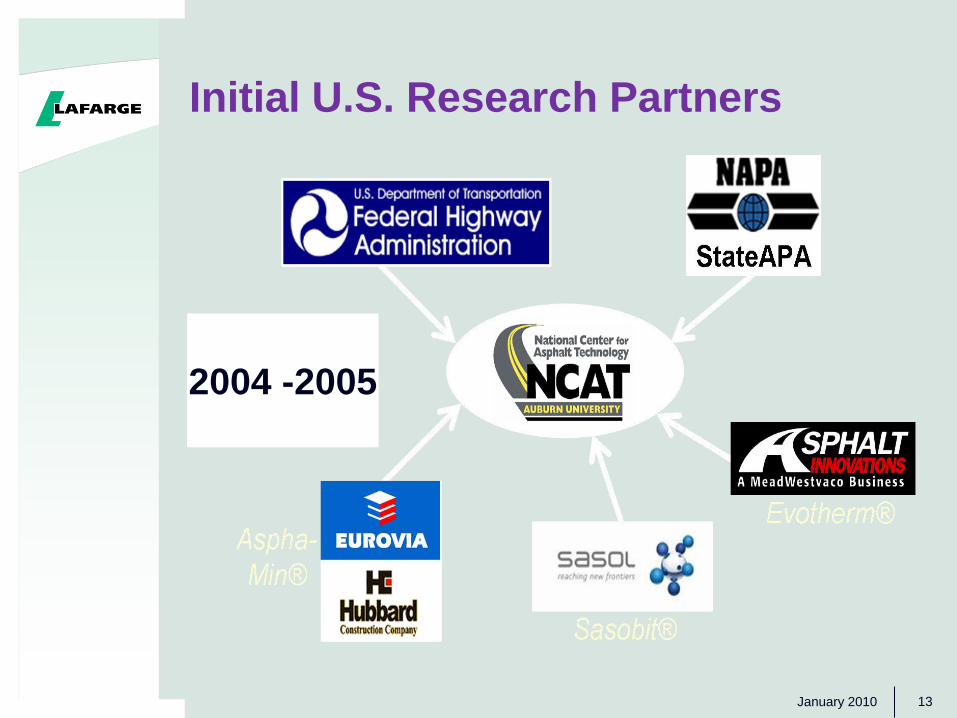
Initial U.S. Research Partners
13January 2010
2004 -2005
14January 2010
How Many WMA Technologies
are available in NA?
15January 2010
How Many WMA Technologies
are available in NA?
Currently Twenty (20)
Technologies Marketed and
available in NA.
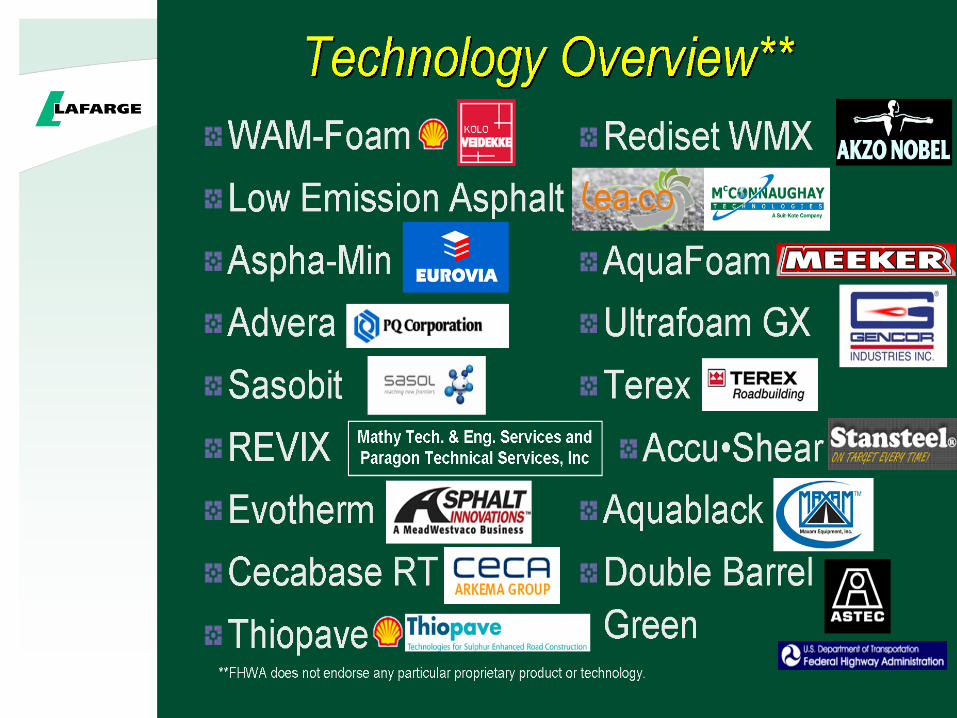
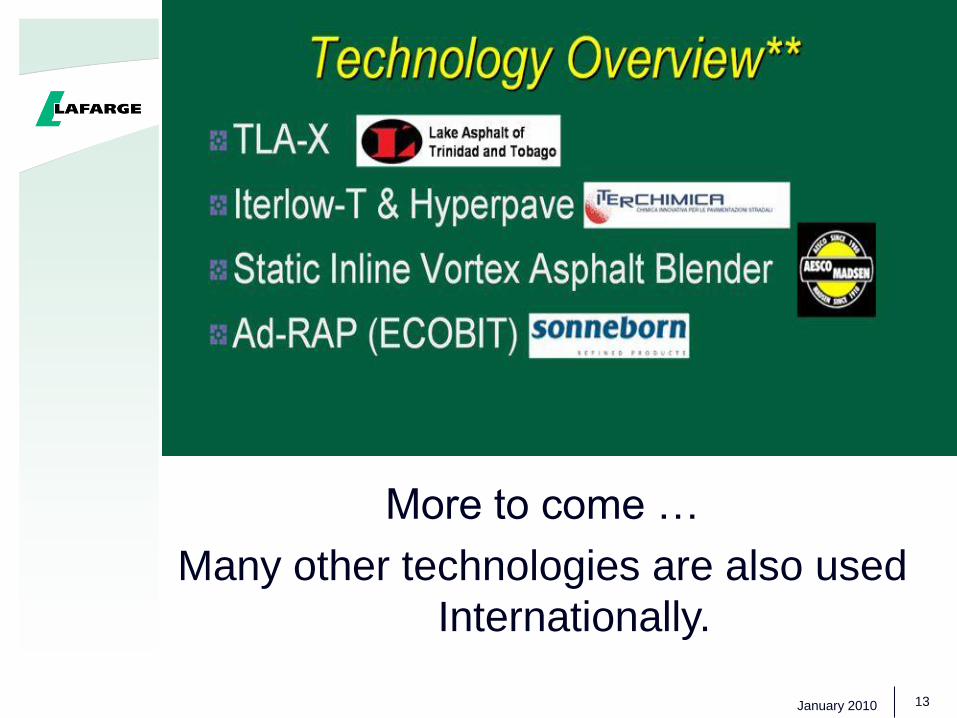
More to come …
Many other technologies are also used
Internationally.
January 2010 13
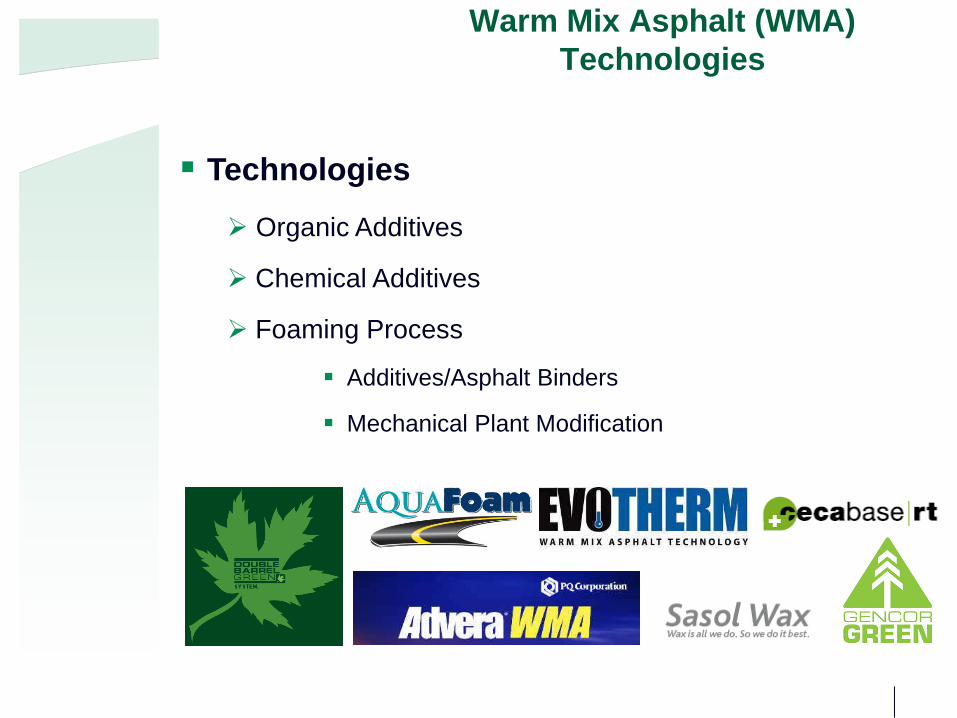
Technologies
Organic Additives
Chemical Additives
Foaming Process
Additives/Asphalt Binders
Mechanical Plant Modification
Warm Mix Asphalt (WMA)
Technologies
WMA Technical Working Group
FHWA/NAPA sponsored
Formed in 2005
Co-Chairs
Matthew Corrigan, FHWA
Ron White, Industry
Represented
State DOT
State APA
NCAT
Hot Mix Asphalt Industry
AASHTO
Labor
NIOSHJanuary 2010 19
WMA TWG Accomplishments
www.warmmixasphalt.com
Material Testing Framework
Emission Testing Framework
WMA Best Practices Document
WMA Guide Spec for Highway Construction
Research Needs Identified
Developed five (5) research statements
Submitted through AASHTO to NCHRP
• All projects highly ranked by SCOR
• Total $2.9 million
January 2010 20
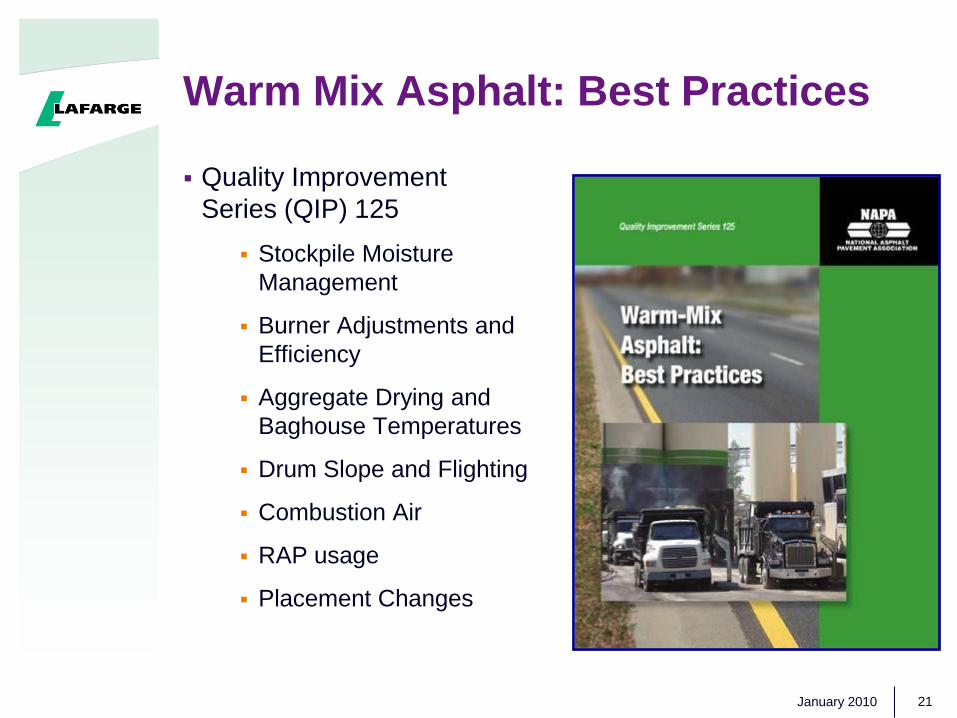
Warm Mix Asphalt: Best Practices
Quality Improvement
Series (QIP) 125
Stockpile Moisture
Management
Burner Adjustments and
Efficiency
Aggregate Drying and
Baghouse Temperatures
Drum Slope and Flighting
Combustion Air
RAP usage
Placement Changes
January 2010 21
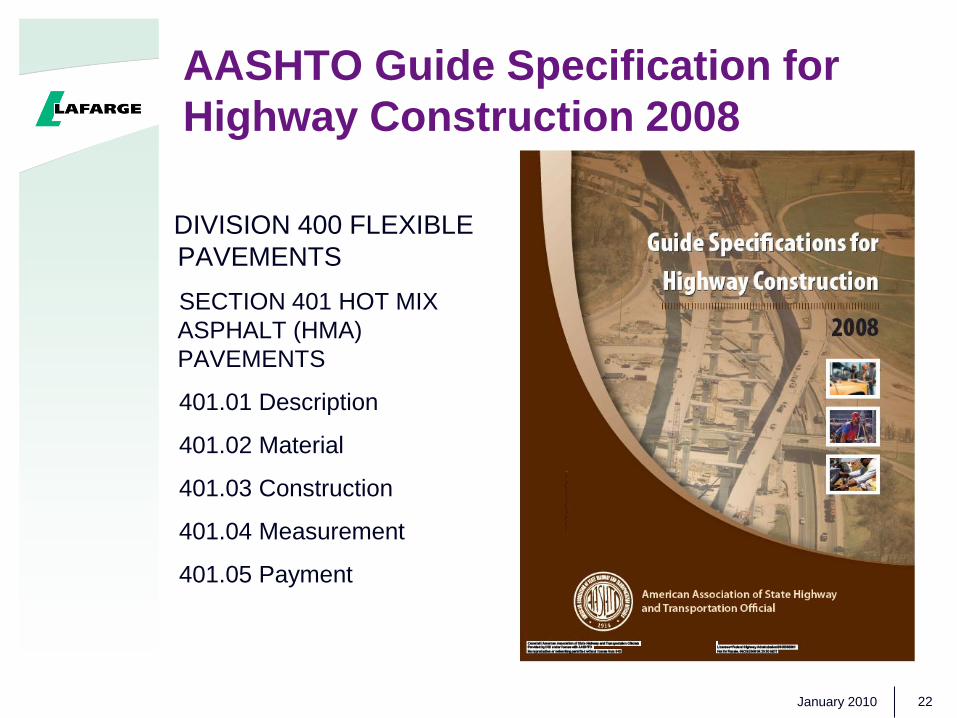
AASHTO Guide Specification for
Highway Construction 2008
DIVISION 400 FLEXIBLE
PAVEMENTS
SECTION 401 HOT MIX
ASPHALT (HMA)
PAVEMENTS
401.01 Description
401.02 Material
401.03 Construction
401.04 Measurement
401.05 Payment
January 2010 22
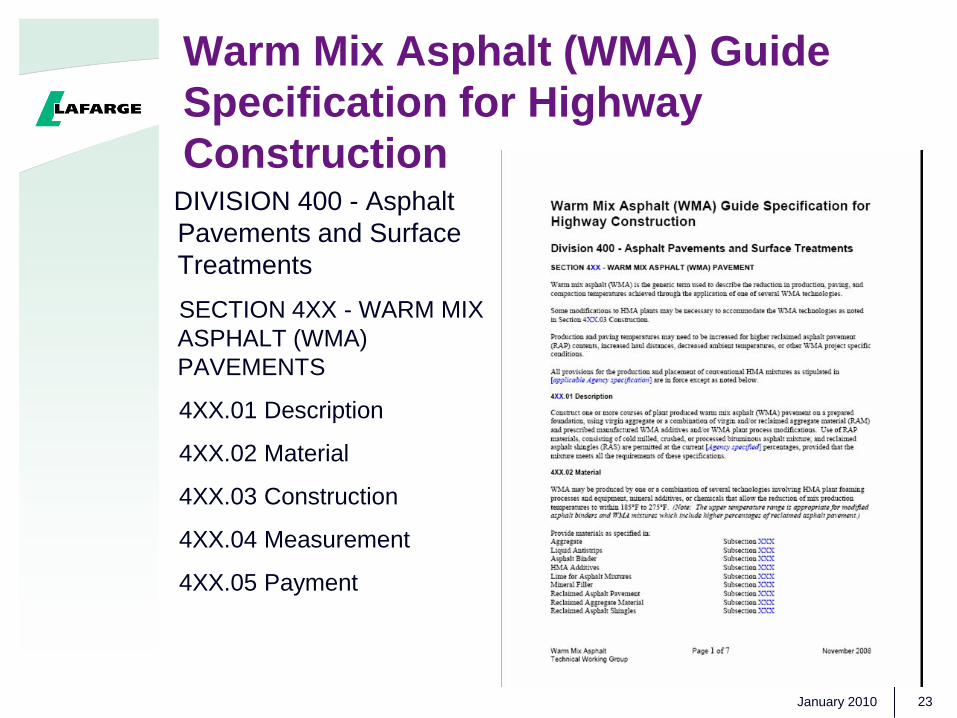
Warm Mix Asphalt (WMA) Guide
Specification for Highway
Construction DIVISION 400 - Asphalt
Pavements and Surface
Treatments
SECTION 4XX - WARM MIX
ASPHALT (WMA)
PAVEMENTS
4XX.01 Description
4XX.02 Material
4XX.03 Construction
4XX.04 Measurement
4XX.05 Payment
January 2010 23
The following references detail specifics related
to plant modifications and operational changes
in order to maximize the benefits of WMA
production:
Quality Improvement Series 125 (QIP 125), “Warm Mix Asphalt:
Best Practices”,
Quality Improvement Series 126 (QIP 126),
“Energy Conservation in Hot Mix Asphalt Production”
Environmental Council 101 (EC-101),
“Best Management Practices to Minimize Emissions During HMA
Construction”
January 2010 24
January 2010 25
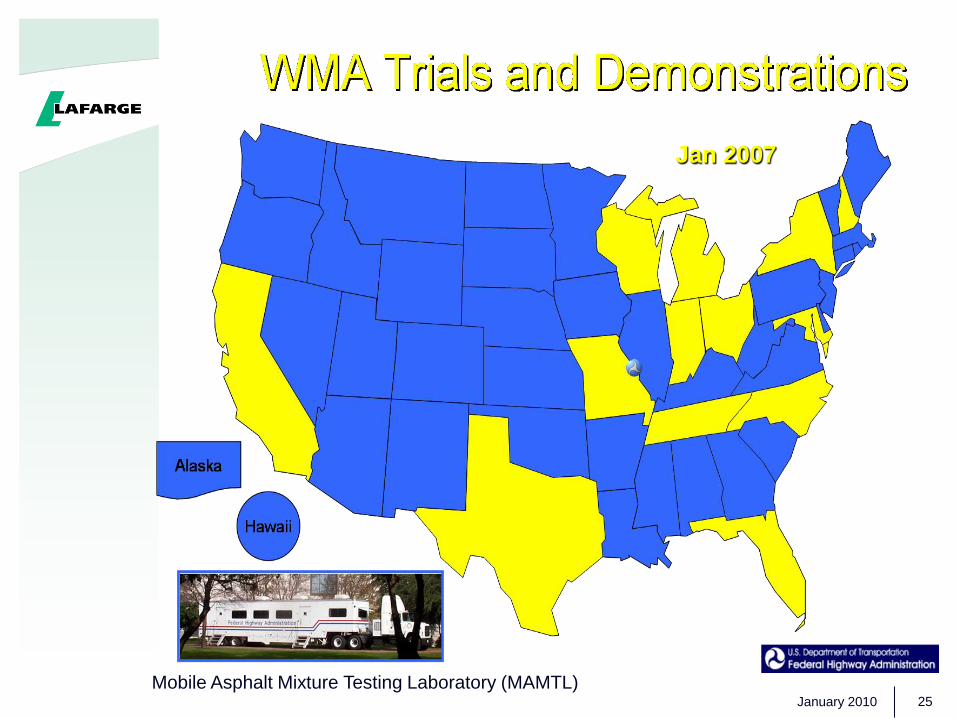
Jan 2007
Mobile Asphalt Mixture Testing Laboratory (MAMTL)
January 2010 26
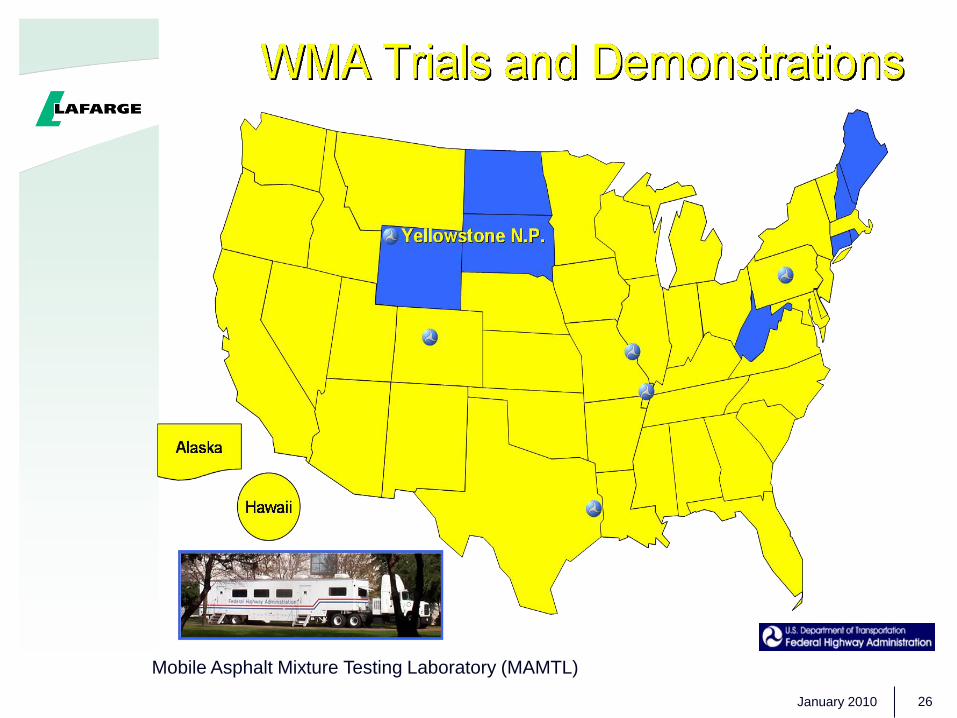
Mobile Asphalt Mixture Testing Laboratory (MAMTL)
January 2010 27
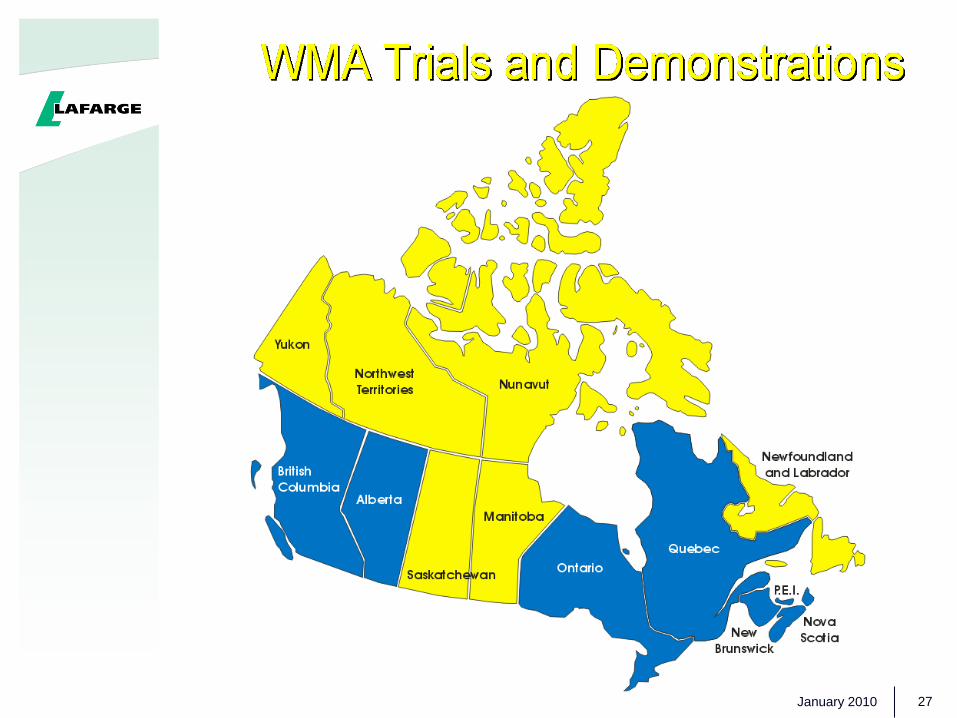
Canadian Experience
Maritime Provinces Sasobit, Advera, Evotherm
Eastern Canada Sasobit, Advera, Evotherm, HyperTherm, DBG System
Western Canada DBG System, HyperTherm, Sasobit, Evotherm, Ultrafoam, WAM, Thiopave
Been placed on residential, collector and
arterial freeways, primary highways,
airports and heavy industrial/commercial
applications
WCAN Canadian Experience
Used primarily in Alberta and BC
Organic / Waxy Additives - Sasobit
Chemical Additives – Evotherm, HyperTherm
Foaming Process
Additives/Asphalt Binders - Advera
Mechanical Plant Modification – Astec DBG, Gencor Ultrafoam,
WAM
Vancouver Island• Evotherm, DBG System and HyperTherm
BC Mainland
Sasobit, Thiopave, DBG System, HyperTherm
Alberta Experience
Sasobit, Advera, Evotherm, DBG System, HyperTherm, Ultrafoam, WAM
Vancouver Experience - Update
Presented at CTAA in Moncton in 2009
DuraClime placed in September, 2007
• North Vancouver Redi-mix entrance road
• Coquitlam Sand & gravel pit access road
Detailed evaluation performed to assess mix performance
after two years in service
• Surface distress evaluation
Edge cracking and raveling identified
No rutting evidenced
• Laboratory testing
Bulk density, TS, RM,TSR, APA
Binder rheology testing DSR small amplitude
oscillations and BBR repeated creep and recovery
Performance properties of mix similar to original
lab mix properties
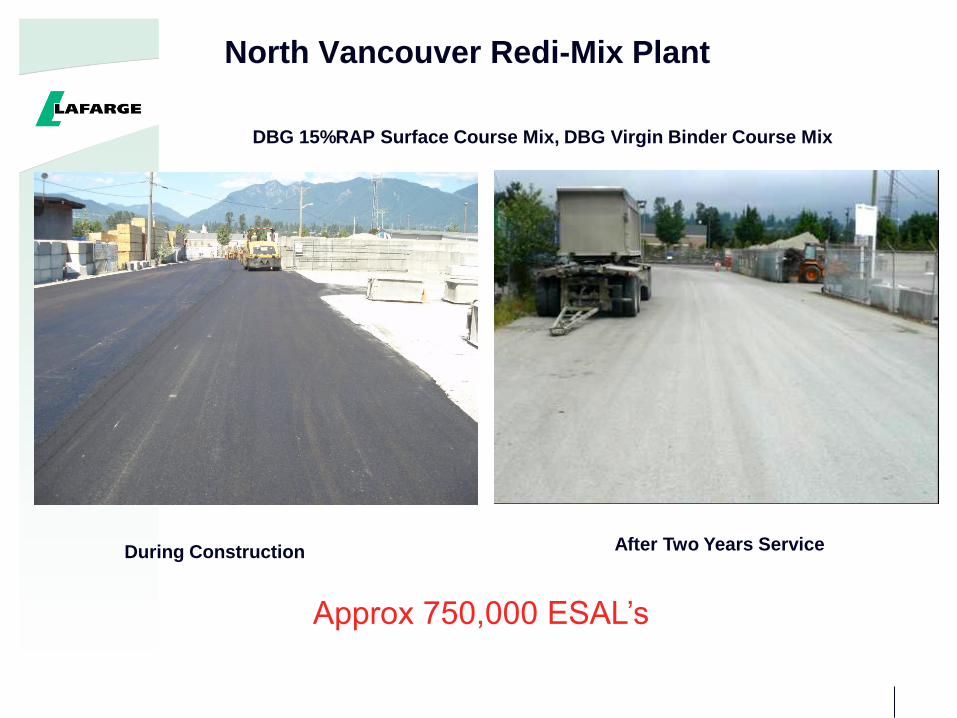
North Vancouver Redi-Mix Plant
DBG 15%RAP Surface Course Mix, DBG Virgin Binder Course Mix
During Construction After Two Years Service
Approx 750,000 ESAL’s
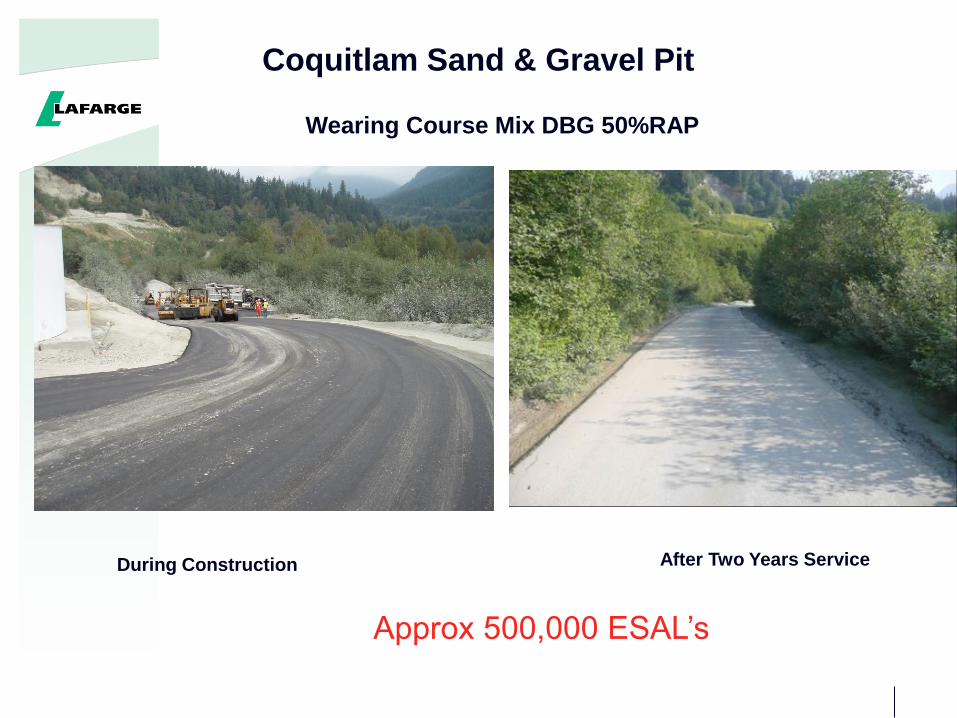
Coquitlam Sand & Gravel Pit
Wearing Course Mix DBG 50%RAP
During Construction After Two Years Service
Approx 500,000 ESAL’s
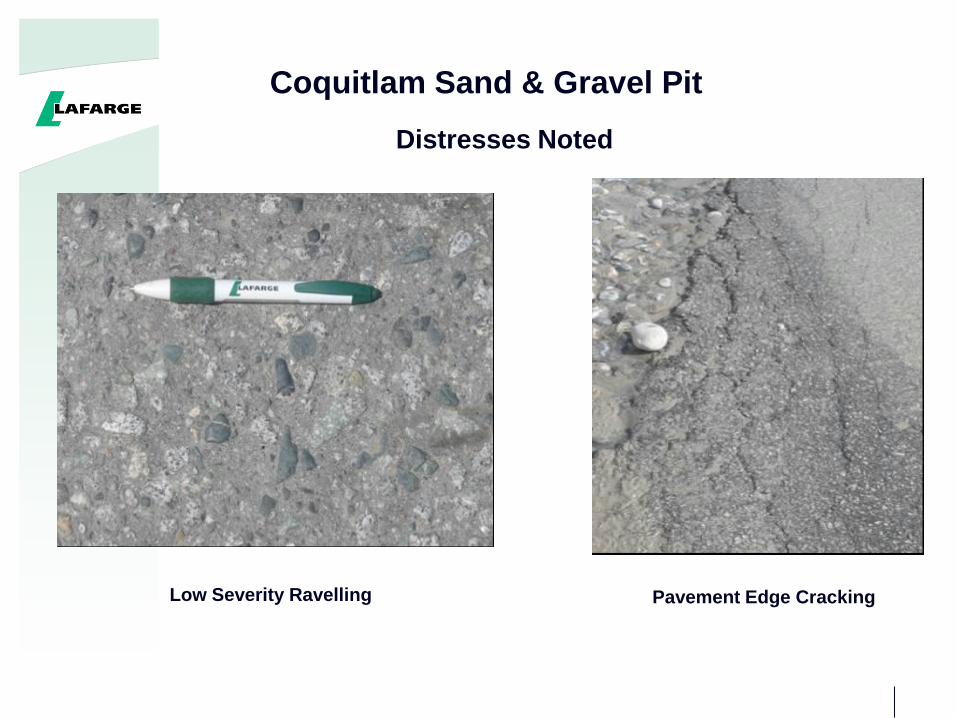
Coquitlam Sand & Gravel Pit
Distresses Noted
Low Severity Ravelling Pavement Edge Cracking
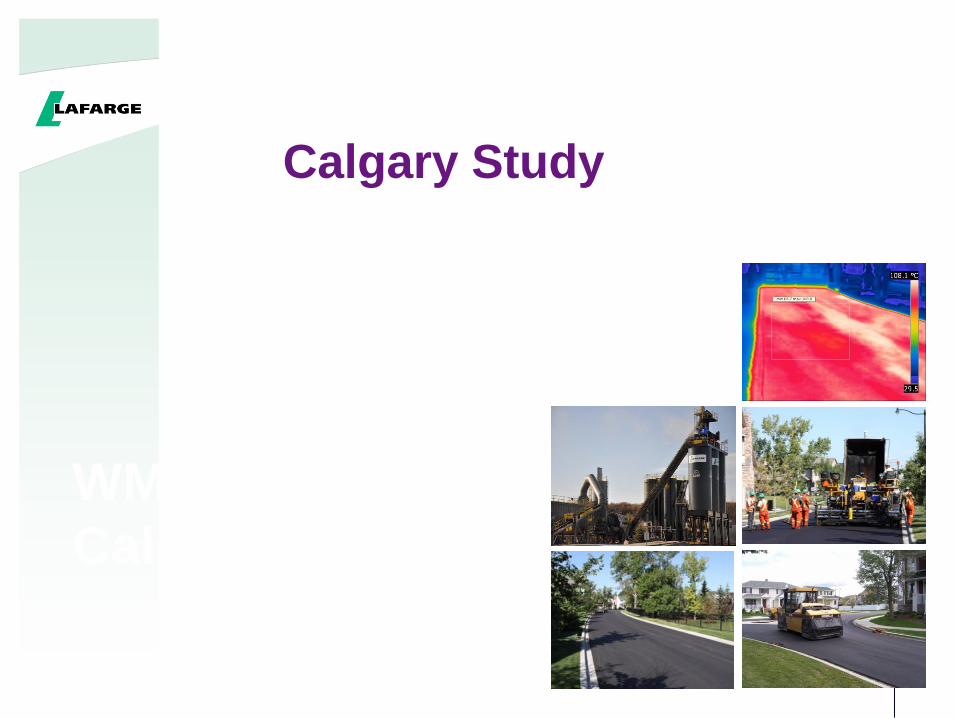
WMA Study -
Calgary
Calgary Study
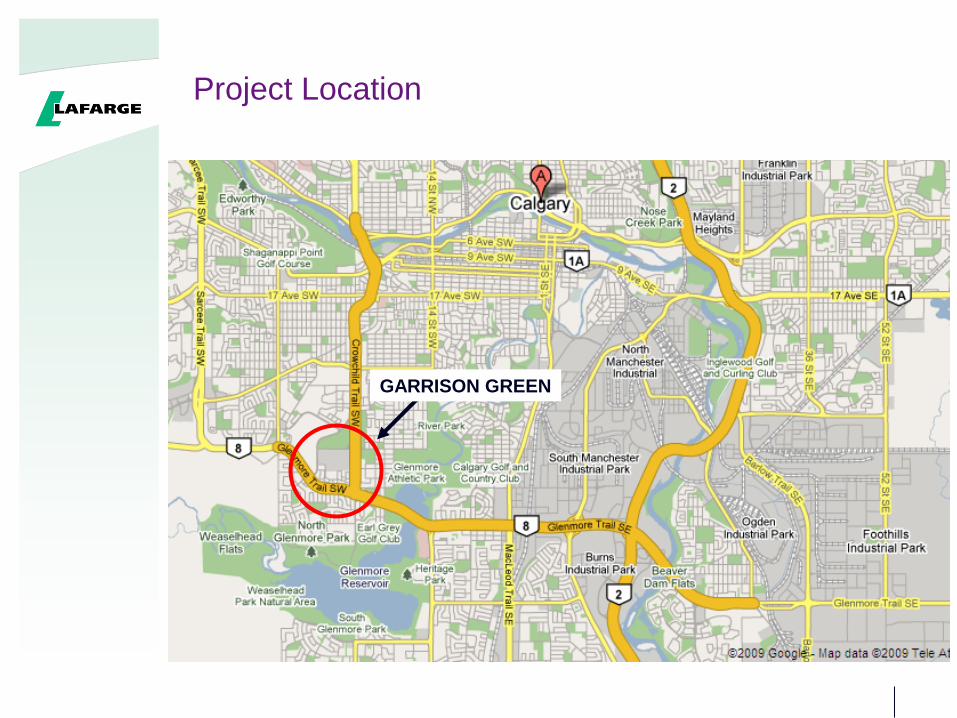
Project Location
GARRISON GREEN
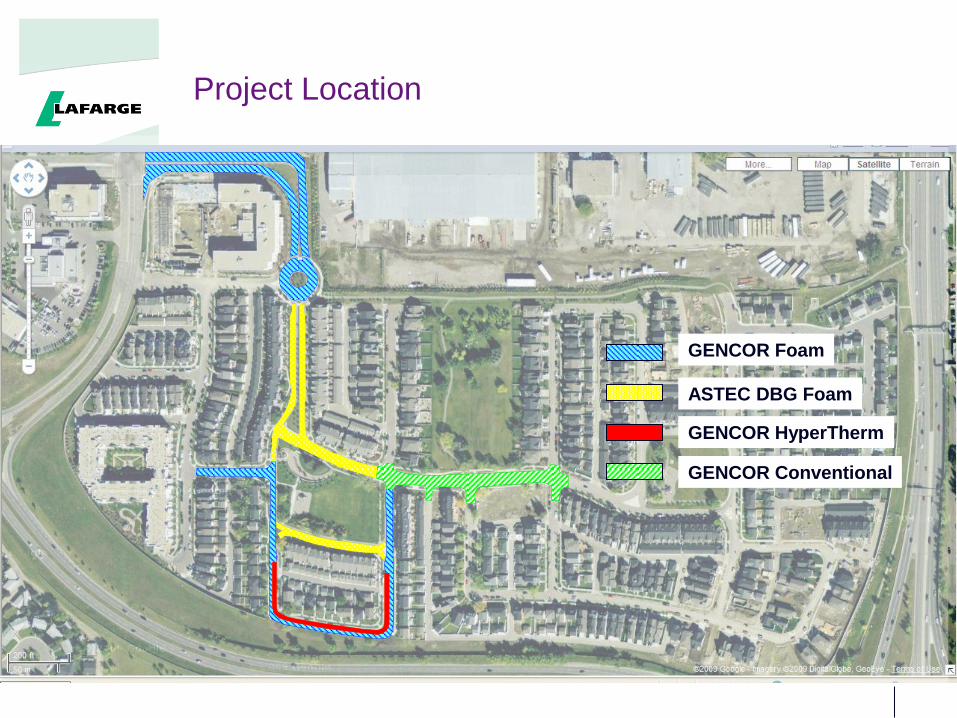
Project Location
GENCOR Foam
ASTEC DBG Foam
GENCOR HyperTherm
GENCOR Conventional
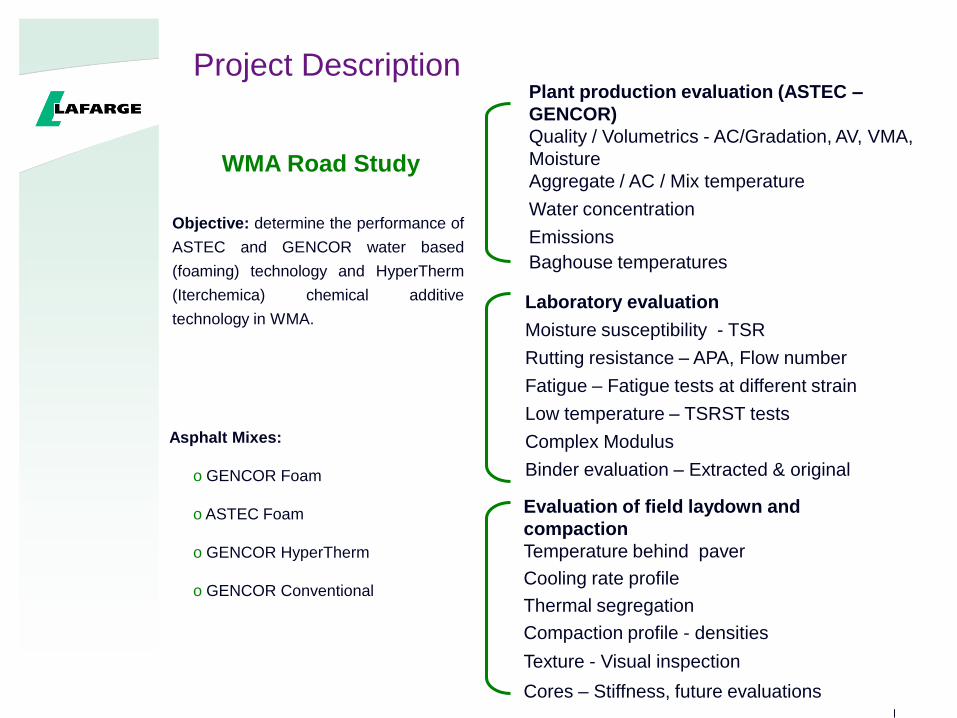
Project Description
Evaluation of field laydown and
compaction
Temperature behind paver
Cooling rate profile
Thermal segregation
Compaction profile - densities
Texture - Visual inspection
Cores – Stiffness, future evaluations
Laboratory evaluation
Moisture susceptibility - TSR
Rutting resistance – APA, Flow number
Fatigue – Fatigue tests at different strain
Low temperature – TSRST tests
Complex Modulus
Binder evaluation – Extracted & original
Plant production evaluation (ASTEC –
GENCOR)
Quality / Volumetrics - AC/Gradation, AV, VMA,
Moisture
Aggregate / AC / Mix temperature
Water concentration
Emissions
Baghouse temperatures
Objective: determine the performance of
ASTEC and GENCOR water based
(foaming) technology and HyperTherm
(Iterchemica) chemical additive
technology in WMA.
WMA Road Study
Asphalt Mixes:
o GENCOR Foam
o ASTEC Foam
o GENCOR HyperTherm
o GENCOR Conventional
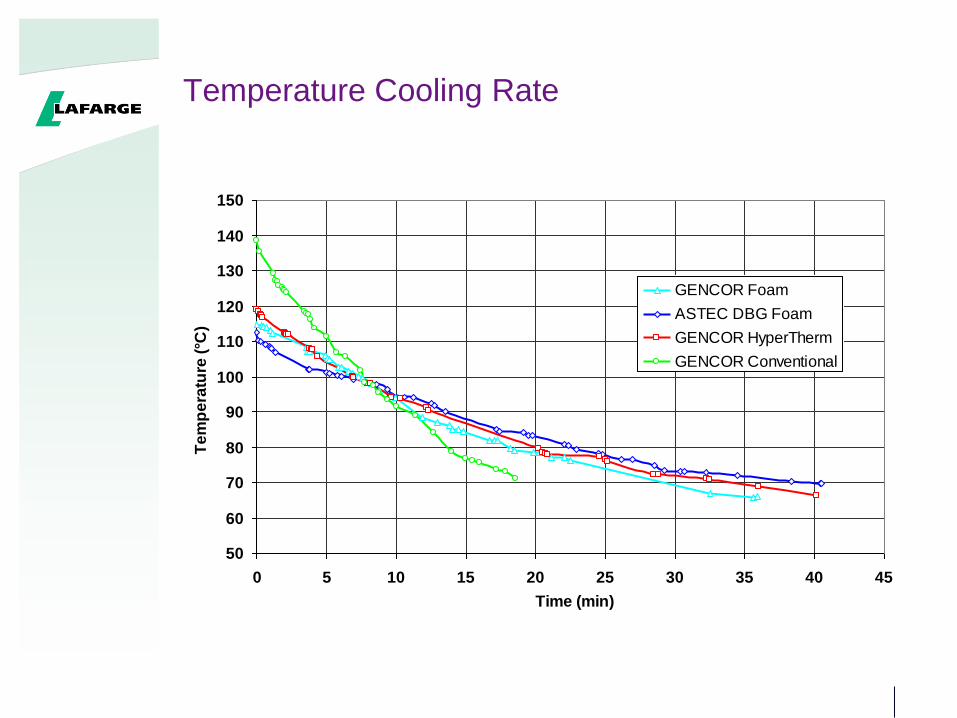
Temperature Cooling Rate
50
60
70
80
90
100
110
120
130
140
150
0 5 10 15 20 25 30 35 40 45
Time (min)
Te
mp
era
ture
(°C
)
GENCOR Foam
ASTEC DBG Foam
GENCOR HyperTherm
GENCOR Conventional
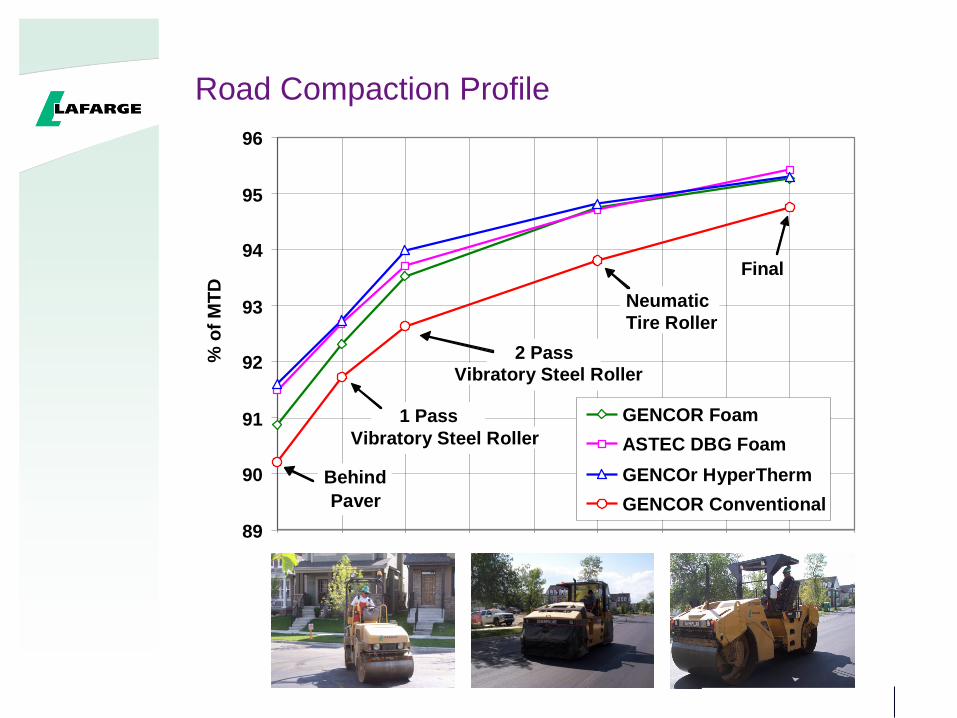
Road Compaction Profile
89
90
91
92
93
94
95
96
0 1 2 3 4 5 6 7 8 9
% o
f M
TD
GENCOR Foam
ASTEC DBG Foam
GENCOr HyperTherm
GENCOR Conventional
1 Pass
Vibratory Steel Roller
2 Pass
Neumatic
Tire Roller
Behind
Paver
Final
Vibratory Steel Roller
89
90
91
92
93
94
95
96
0 1 2 3 4 5 6 7 8 9
% o
f M
TD
GENCOR Foam
ASTEC DBG Foam
GENCOr HyperTherm
GENCOR Conventional
1 Pass
Vibratory Steel Roller
2 Pass
Neumatic
Tire Roller
Behind
Paver
Final
Vibratory Steel Roller
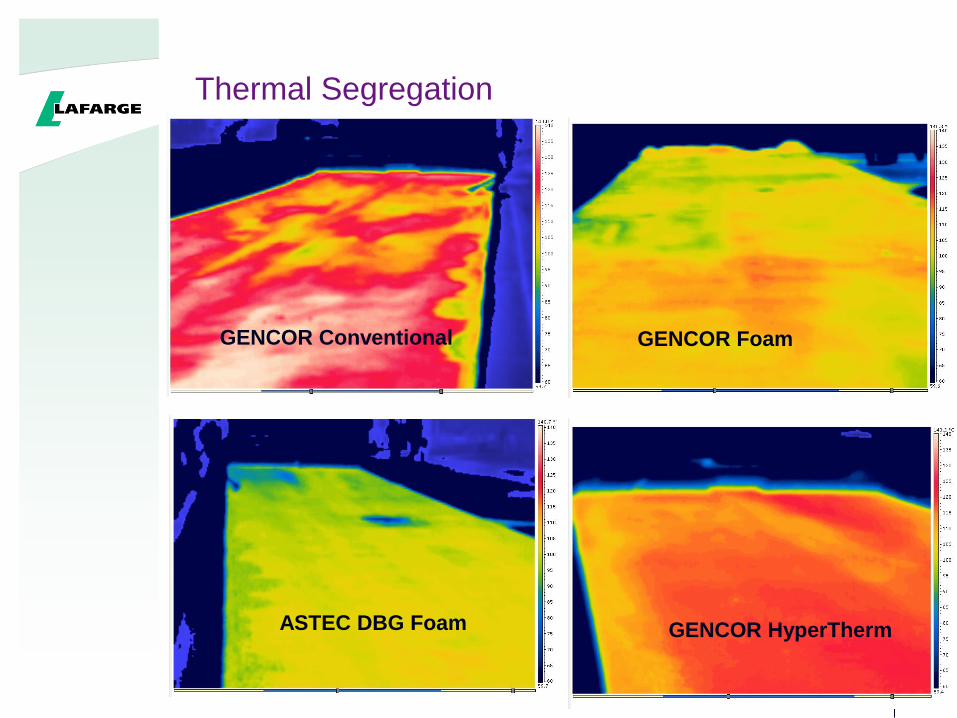
Thermal Segregation
GENCOR Conventional GENCOR Foam
ASTEC DBG Foam GENCOR HyperTherm
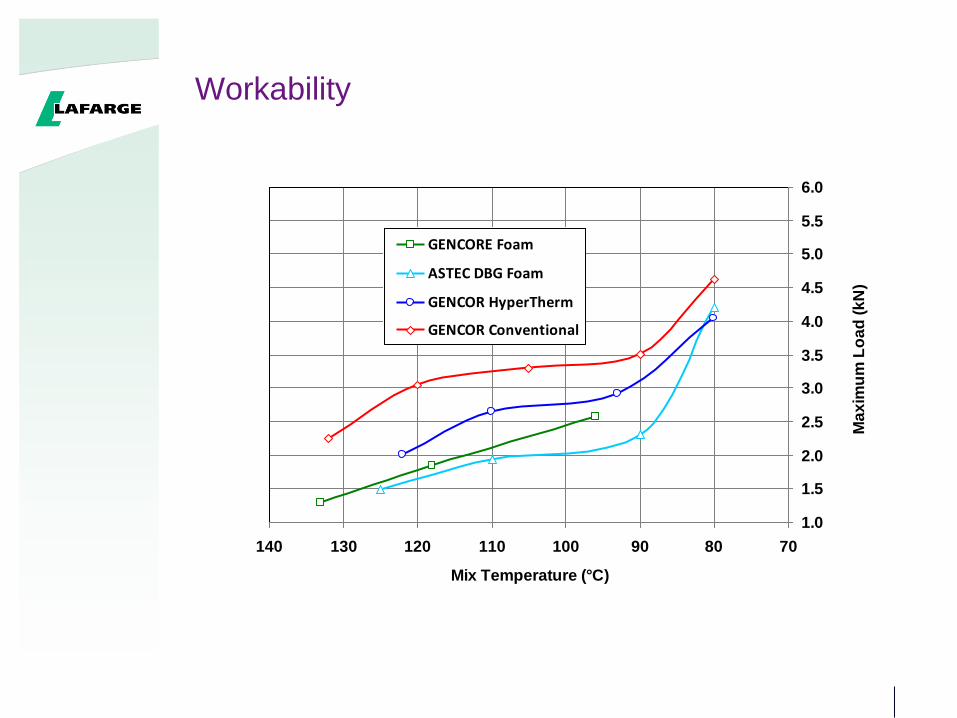
Workability
1.0
1.5
2.0
2.5
3.0
3.5
4.0
4.5
5.0
5.5
6.0
708090100110120130140
Mix Temperature (°C)
Ma
xim
um
Lo
ad
(k
N)
GENCORE Foam
ASTEC DBG Foam
GENCOR HyperTherm
GENCOR Conventional
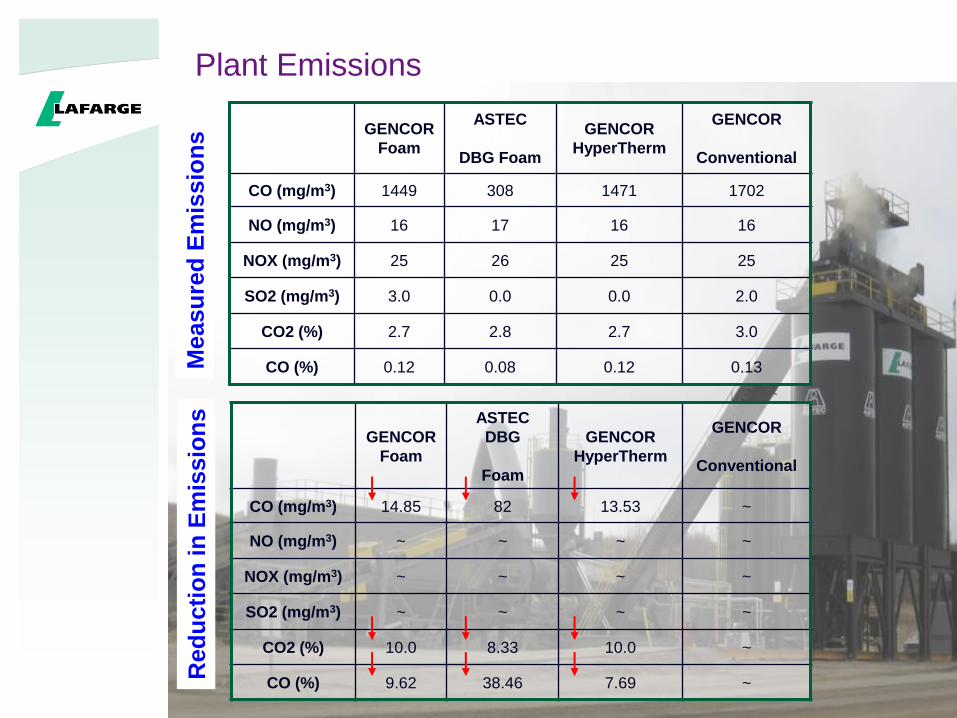
Plant Emissions
GENCOR
Foam
ASTEC
DBG Foam
GENCOR
HyperTherm
GENCOR
Conventional
CO (mg/m3) 1449 308 1471 1702
NO (mg/m3) 16 17 16 16
NOX (mg/m3) 25 26 25 25
SO2 (mg/m3) 3.0 0.0 0.0 2.0
CO2 (%) 2.7 2.8 2.7 3.0
CO (%) 0.12 0.08 0.12 0.13
GENCOR
Foam
ASTEC
DBG
Foam
GENCOR
HyperTherm
GENCOR
Conventional
CO (mg/m3) 14.85 82 13.53 ~
NO (mg/m3) ~ ~ ~ ~
NOX (mg/m3) ~ ~ ~ ~
SO2 (mg/m3) ~ ~ ~ ~
CO2 (%) 10.0 8.33 10.0 ~
CO (%) 9.62 38.46 7.69 ~
Measu
red
Em
issio
ns
Red
ucti
on
in
Em
issio
ns
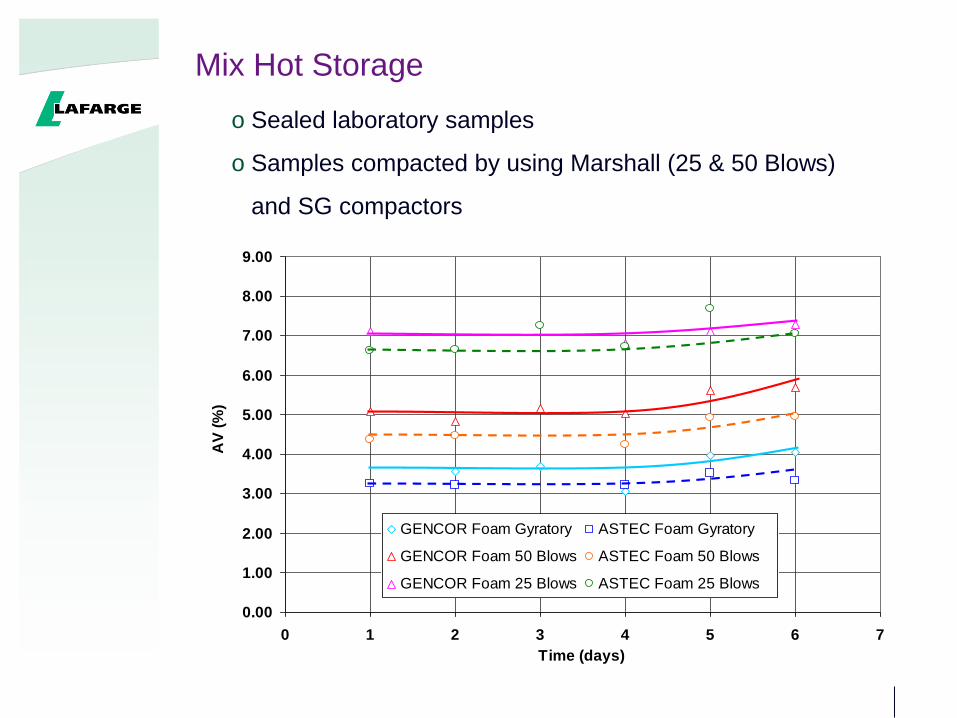
Mix Hot Storage
0.00
1.00
2.00
3.00
4.00
5.00
6.00
7.00
8.00
9.00
0 1 2 3 4 5 6 7
Time (days)
AV
(%
)
GENCOR Foam Gyratory ASTEC Foam Gyratory
GENCOR Foam 50 Blows ASTEC Foam 50 Blows
GENCOR Foam 25 Blows ASTEC Foam 25 Blows
o Sealed laboratory samples
o Samples compacted by using Marshall (25 & 50 Blows)
and SG compactors
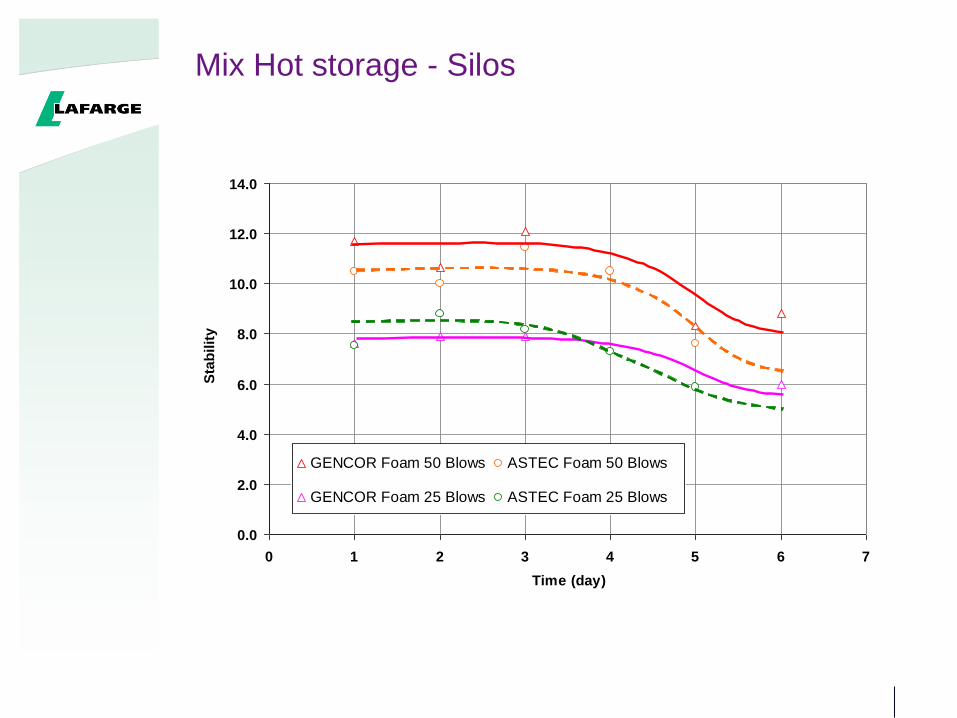
Mix Hot storage - Silos
0.0
2.0
4.0
6.0
8.0
10.0
12.0
14.0
0 1 2 3 4 5 6 7
Time (day)
Sta
bil
ity
GENCOR Foam 50 Blows ASTEC Foam 50 Blows
GENCOR Foam 25 Blows ASTEC Foam 25 Blows
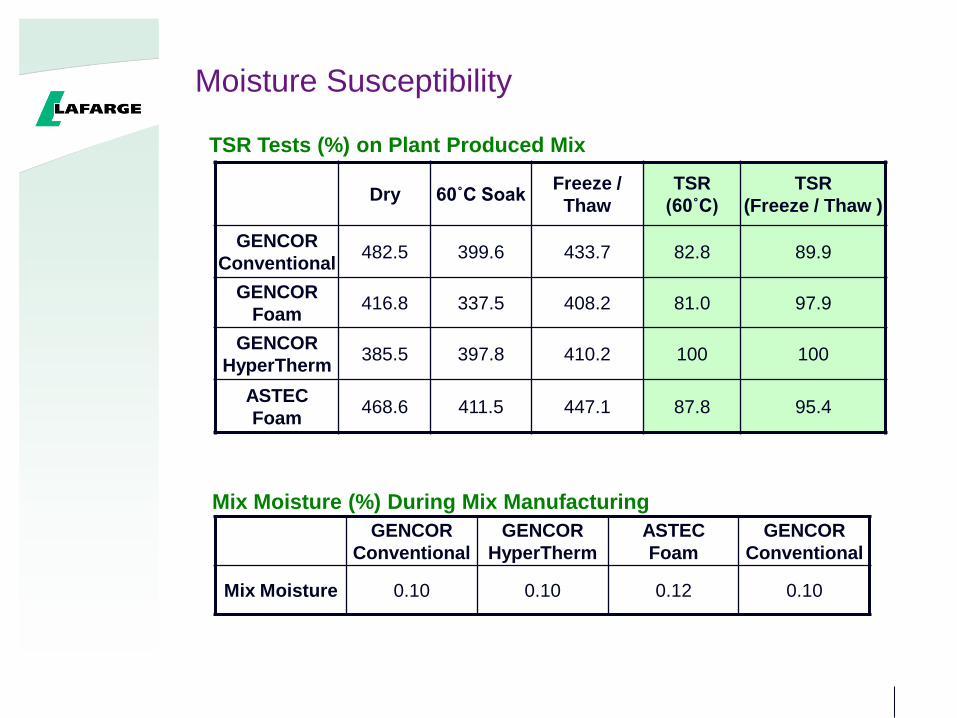
Moisture Susceptibility
Dry 60˚C SoakFreeze /
Thaw
TSR
(60˚C)
TSR
(Freeze / Thaw )
GENCOR
Conventional482.5 399.6 433.7 82.8 89.9
GENCOR
Foam416.8 337.5 408.2 81.0 97.9
GENCOR
HyperTherm385.5 397.8 410.2 100 100
ASTEC
Foam468.6 411.5 447.1 87.8 95.4
GENCOR
Conventional
GENCOR
HyperTherm
ASTEC
Foam
GENCOR
Conventional
Mix Moisture 0.10 0.10 0.12 0.10
TSR Tests (%) on Plant Produced Mix
Mix Moisture (%) During Mix Manufacturing
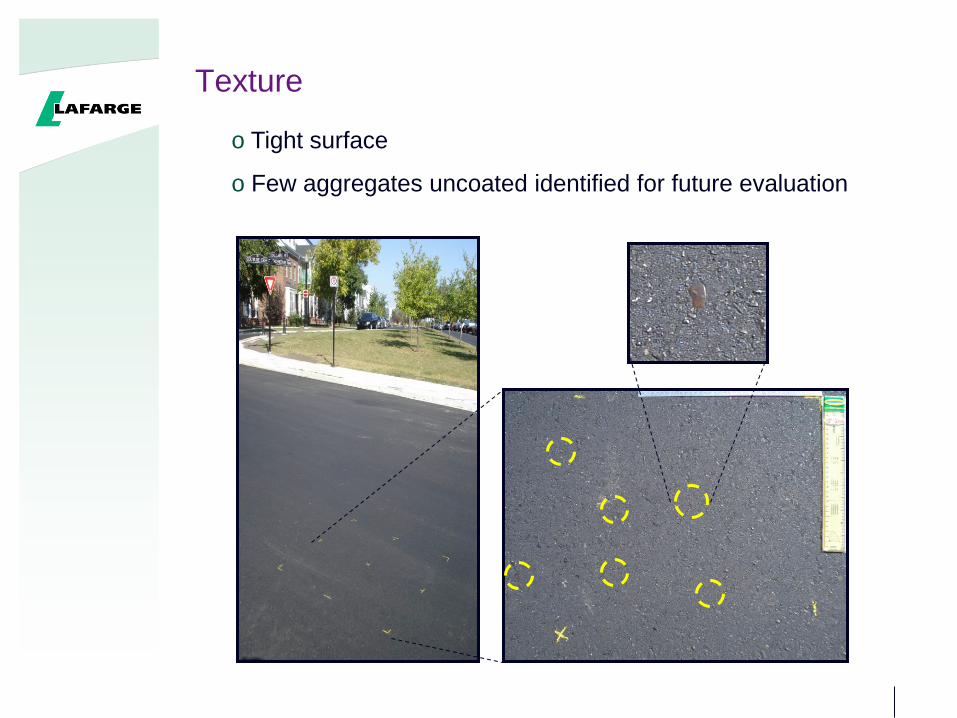
Texture
o Tight surface
o Few aggregates uncoated identified for future evaluation
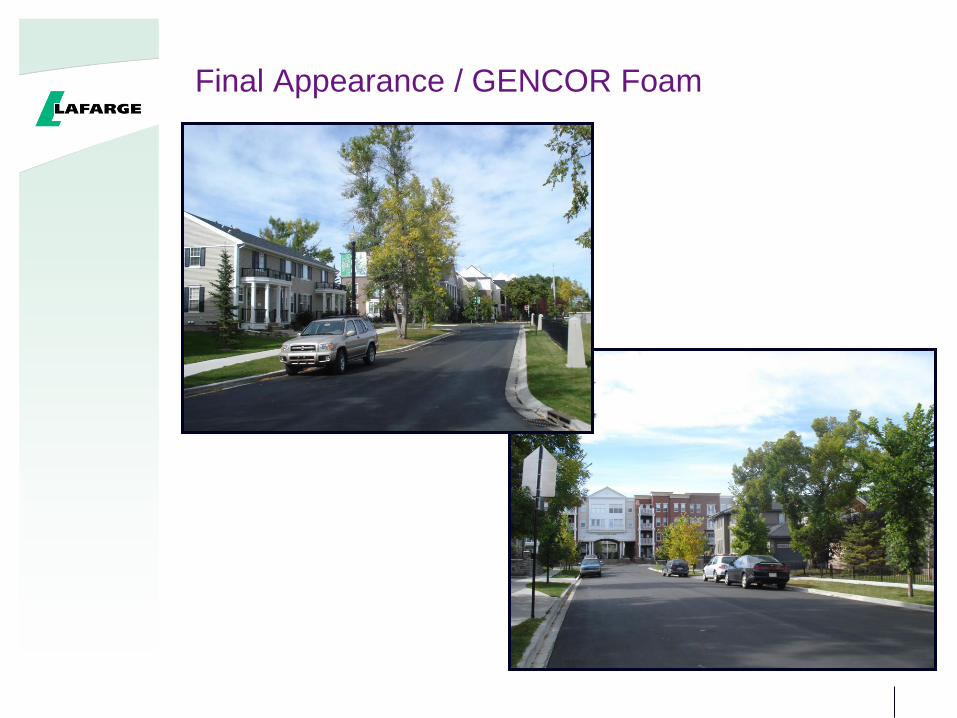
Final Appearance / GENCOR Foam
Ongoing National Research
January 2010 48
NCHRP 9-43 “Mix Design Practices for Warm Mix Asphalt”
$500,000
NCHRP 9-47A “Engineering Properties, Emissions, and
Field Performance” $900,000
NCHRP 9-49 “Long Term Field Performance of Warm Mix
Asphalt Technologies”•Phase I, Moisture Susceptibility
•Phase II, Long-Term Performance
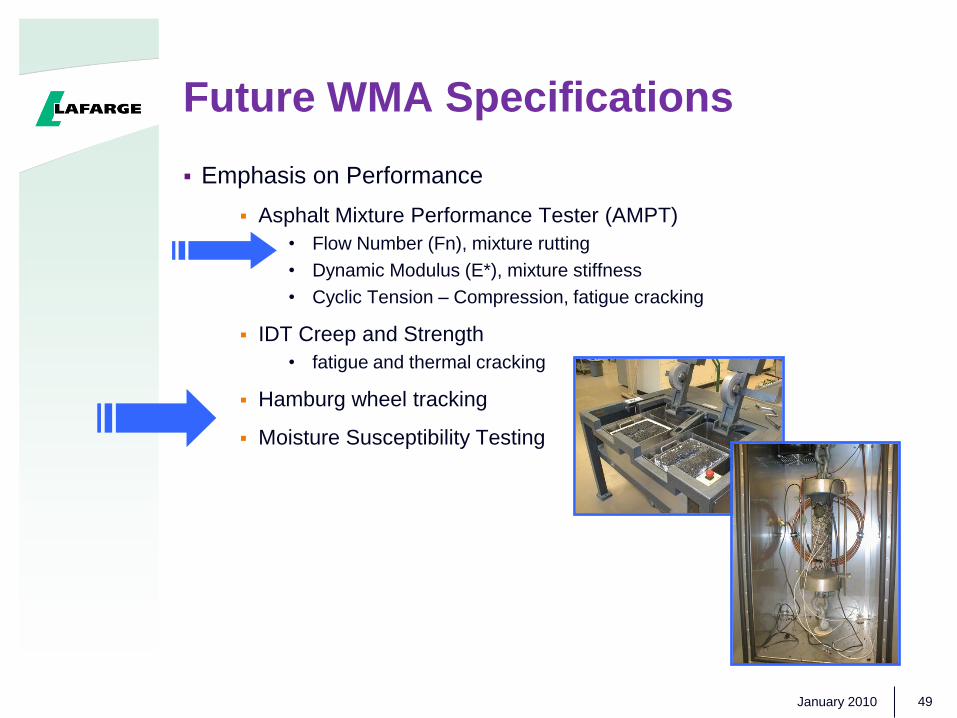
Future WMA Specifications
Emphasis on Performance
Asphalt Mixture Performance Tester (AMPT)
• Flow Number (Fn), mixture rutting
• Dynamic Modulus (E*), mixture stiffness
• Cyclic Tension – Compression, fatigue cracking
IDT Creep and Strength
• fatigue and thermal cracking
Hamburg wheel tracking
Moisture Susceptibility Testing
January 2010 49
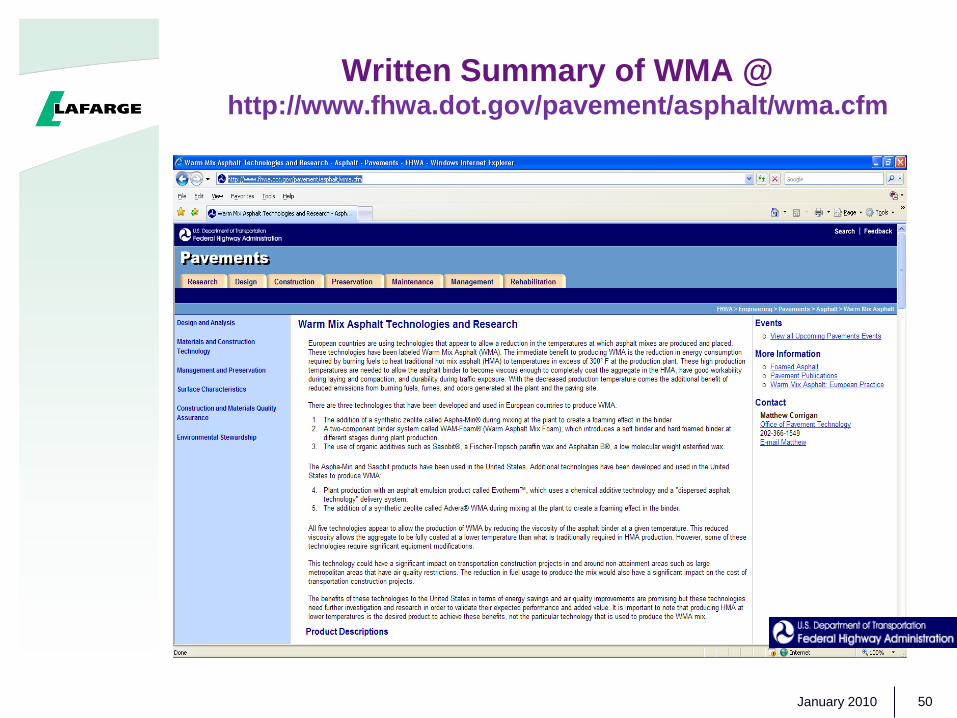
Written Summary of WMA @http://www.fhwa.dot.gov/pavement/asphalt/wma.cfm
January 2010 50