
02/09/2021
1
Developments in electrolytic hydrogen generation
Joint Supergens Net Zero Conference
2/9/2020
Professor Anthony Kucernak
Theme lead Polymer Electrolyte Fuel Cells and Electrolysers
Imperial College London
UK Hydrogen Strategy, August 2021
UK Hydrogen Strategy, August 2021
• 250-460 TWh (7.5-14 Mtonnes) p.a. Hydrogen by 2050• Produced through a range of technologies
1
3

02/09/2021
2
4UK Hydrogen Strategy, August 2021 OSW-H2: SOLVING THE INTEGRATION CHALLENGE. July 2020
Water Electrolysis
5
Increasing
TRL
~100MW (5 MW,
2.1 tonneH2 day-1)
~minutes time scale
Moderate turndown
Low cost
~50 MW (2 MW, 0.9 tonnes day-1)
~s time response
Good turn down ratio (ITM Power, Bramble
Energy). Compact – high intensity
(0.225 MW, 0.14 tonnes day-1)
Moderate-poor turndown and time response
Ceres. Higher efficiency
NEL
ITM Power
Isothermal compression at low energy cost
Sunfire
An
od
e –
oxyge
n e
volu
tion
Ca
tho
de
–
Hyd
rog
en
evo
lutio
n
50-70oC
50-80oC
~800oC
30,000 Nm3/h (65 tonnes/day)
135 MW (hydroelectricity)
Source: nel
KOH solution
H+ conducting polymer
Metal oxide
ceramic
4
5

02/09/2021
3
PEM Water Electrolysis – reducing cost
6
• Hydrogen from SMR or coal (even with CCS) much less expensive at the moment because of electricity costs
PEM Electrolyser
Stack ~50% of Capex costs
(majority is bipolar plate, not catalyst)
OSW-H2: SOLVING THE INTEGRATION CHALLENGE. July 2020
Issues for water electrolysis –increasing efficiency, reducing cost
7
PEM Water Electrolysers Alkaline Electrolysers
Solid Oxide Electrolysers
Cross-cutting issues
Data from: OSW-H2: SOLVING THE INTEGRATION CHALLENGE. July 2020
6
7

02/09/2021
4
Breakdown of water electrolyser loses• Need for better understanding of different loses
• Major inefficiencies in low temperature electrolysers are• Electrocatalysis
• Resistive loses (electrolyte loses)
8
Increasing current density/hydrogen production →
PEM Electrolyser
Increasing current density /hydrogen production →
Alkaline Electrolyser
Resistance loses (mostly ionic)
Oxygen evolution loses
Hydrogen evolution loseson
cathode are small
1 gPt cm-2 needed (1000-
fold less then used today)
Zalitis, C. M.; Kucernak, A. R.; Sharman, J.; Wright, E., Design principles for platinum nanoparticles catalysing electrochemical hydrogen
evolution and oxidation reactions: edges are much more active than facets. Journal of Materials Chemistry A 2017, 5 (44), 23328-23338.
Re
sis
tan
ce
lose
s
Oxyg
en
an
d
hyd
rog
en
lose
s
Testing standards for catalysts• In PEM electrolyser, performance is limited by oxygen evolution electrode • Studied to assess intrinsic performance and deactivation
• “Thrifting” and assessment of new catalysts
• In Alkaline system, look for improved catalysts for anode and cathode
30
µm
Pt or Ir
10gPt cm-2
<1m
9
50 100 150 200 250 300
0%
10%
20%
30%
40%
50%
60%
70%
80%
IrO2
Pro
po
rtio
n o
f su
rfa
ce a
tom
s o
n e
dg
e s
ite
s
Surface area/ m2 g-1
tetrahedron
cube
octahedron
truncatedoctahedron
cubooctahedron
5020 10 5 4 3 2
particle diameter / nm
100%
90%
80%
70%
60%
50%
40%
30%
20% Pro
po
rtion o
f su
rface a
tom
s o
n fa
cet s
ites
b
e
a
50 100 150 200 250 300 3500.0
0.1
0.2
0.3
0.4
0.5
0.6
0.7
0.8
1.6 V
1.65 V
ECSAaverage/ m2 g-1
avera
ge j
sp
ecific/ m
A c
m-2 IrOx_400 °C
IrOx_500 °C
IrOx_600 °C
Premetek
Alfa
R2=0.966
R2=0.987
50 20 10 5 4 3 2
particle diameter / nm
c
+H2O
O
Ir (IV) Ir(IV)OO O
Ir (IV) Ir(IV)OO
OHOHO
Ir (VI) Ir(VI)OO OO O=OO
Ir (IV) Ir(IV)OO
O
Ir (VI) Ir(VI)OO OO
+H2O
O
Ir (VI) Ir(VI)OO OO
OH
Ir (IV)O O O
Ir(VI)O
O
O
+H2OIr Iredge
OHO O
Ir
OO O OH
Ir (III) Ir
O OO=O
Ir(III)
IrIr
O
H(1)
(2)
(3)
Highpotential
1 10 100101
102
103
104
105
106
107
108
109
m
ass a
ctivity /
A g
-1
specific surface area / m2 g-1
e=1
e=2
e=0.66
0
1
2
3
4
5
j osp
ecific / m
A m
-21000 100 10
particle diameter / nm
d
particle size jspecific
particle size jspecific
No size effect on jspecific
Xiao, M.; Jackson, C; Kucernak, A. R.;, Size-dependent performance of IrO2 OER
elecrocatalysts, ACS Catalysis, submitted
0.1 M KOH 0.1 M HClO4
Hyd
roge
n E
volu
tio
n (
HER
)
Oxy
gen
Re
du
ctio
n (
OR
R)
Oxy
gen
Evo
luti
on
(O
ER)
-0.7 -0.6 -0.5 -0.4 -0.3 -0.2 -0.1 0.0
-40
-30
-20
-10
0
EweIRc vs. RHE / V
j geo /
mA
cm
-2
PGC
Ni2P-40
Co2P-40
WP-40
CrP-40
MoP-40
Pt
(a)
-0.4 -0.3 -0.2 -0.1 0.0-20
-15
-10
-5
0
(b)
j ge
o /
mA
cm
-2
EweIRc vs. RHE / V
PGC
Ni2P-40
Co2P-40
WP-40
CrP-40
MoP-40
Pt
0.0 0.2 0.4 0.6 0.8 1.0-6
-5
-4
-3
-2
-1
0
(c)j geo
/ m
A c
m-2
EweIRc vs. RHE / V
PGC
Ni2P-40
Co2P-40
WP-40
CrP-40
MoP-40
Pt
0.0 0.2 0.4 0.6 0.8 1.0-6
-5
-4
-3
-2
-1
0
(d)
j geo /
mA
cm
-2
EweIRc vs. RHE / V
PGC
Ni2P-40
Co2P-40
WP-40
CrP-40
MoP-40
Pt
1.3 1.4 1.5 1.6 1.7-8
-6
-4
-2
0
2
4
6
8
10
12(e)
j geo
/ m
A c
m-2
EweIRc vs. RHE / V
PGC
Ni2P-40
Co2P-40
WP-40
CrP-40
MoP-40
IrO2
1.2 1.3 1.4 1.5 1.6 1.7
0.0
0.5
1.0
1.5
2.0
2.5(f)
j geo
/ m
A c
m-2
EweIRc vs. RHE / V
PGC
Ni2P-40
Co2P-40
WP-40
CrP-40
MoP-40
IrO2
Parra-Puerto, A.; …Kucernak, A., Supported Transition Metal
Phosphides: Activity Survey for HER, ORR, OER, and Corrosion
Resistance in Acid and Alkaline Electrolytes. Acs Catalysis 2019, 9
(12), 11515-11529. doi:10.1021/acscatal.9b03359 (2019).
8
9

02/09/2021
5
Combine best of both low temperature electrolysers
10
J. Am. Chem. Soc. 2012, 134, 22, 9054-9057
J.R. Varcoe, P. Atanassov, D.R. Dekel, A.M. Herring, M.A. Hickner, P.A. Kohl, A.R.
Kucernak, W.E. Mustain, K. Nijmeijer, K. Scott, T. Xu, L. Zhuang, Anion-exchange
membranes in electrochemical energy systems, Energy & Environmental Science,
7 (2014) 3135-3191.
Equivalent performance to liquid
alkaline electrolysers
~5x lower than PEM electrolyers
• Hydroxide conducting ion exchange polymers• Developed for fuel cells but suffer from two problems:
• Temperature stability (T>60oC tend to decompose c.f. “Green Cremation”)
• Reaction with atmospheric CO2
Solid oxide electrolyser
J.H. Myung, D. Neagu, D.N. Miller & J.T.S. Irvine, Nature, 2016. 537, 528-531
Using ex-solvation to grow catalyst
particles on the surface
ElectrolyserFuel Cell
Increasing hydrogen production rate
Inc
rea
sin
g
eff
icie
nc
y
10
11

02/09/2021
6
Economics of electrolytic chemicals production
12
o Oxygen evolution is a poor counter reaction
o Choosing other counter reactions could drastically reduce hydrogen costs
o For some co-produced products hydrogen is a minor cost component
Process Electrochemical reaction Product(s) Mass (Product)
Mass (Hydrogen)
Product price /$ tonne-1
Value (Product)
Value (Hydrogen)
Hydrogen evolution 2H+ + 2e-
H2
2H2O + 2e- H2 +2OH-
H2 1 2450
Combined with one of the reactions below Combined with one of the reactions below
Water electrolysis H2O ½O2 + 2H++ 2e- 2OH- ½O2 + H2O + 2e-
O2 7.9 60 0.2
Chlor Alkali 2Cl- Cl2 + 2e-
Cl2 35.2 350 13.8
NaOH 39.7 540
Hydrogen peroxide 2H2O H2O2 + 2H+ + 2e- H2O2 16.9 450 3.1
Ozone H2O 1/3O3 + 2H+ + 2e- O3 7.9 2500 8.0
Persulphate 2HSO4- S2O8
2- + 2H+ + 2e- X2S2O9 118.1 3300 160.4
Organic oxidation CxHyOz+H2OCxHy+1Oz+1+H++e- CxHy+wOz+w ? ? ?
Work
performed
H2 Mole
fraction
[%]
Limiting
current
[A/cm2]
Recovery
rate
[%]
Energy
demand
[kWh/kg]
Resistance
[mΩ*cm2]
Model, FZJ 50 0.43 74 5.3 625
Model, HyET 50 0.44 100 5.3 300
Mutlicell test, HyET 85 0.86 <42 5.3 417
Cross reference test, DHBW 50 0.45 39 5.3 455
Cross reference test, HyET 50 0.45 27 5.3 540
Simplest case: Electrochemical Hydrogen pump
Single Cell
EHP Stack
• Separation of hydrogen from
• Diluent
• Poisons (improve purity)
• Hydrogen compression
• >1 kbar possible
12
13

02/09/2021
7
Max recovery (90%) requires ~
11-13 kWh/kgFor low energy of 5 kWh/kg,
recovery is ~30%
Conditions
50 % H2 diluted in N2,
35 °C, anode pressure at 6.5
bar and the cathode pressure
50 bar, 0.3136 Nl/min of H2
Jackson, C.; Raymakers, L.; Mulder, M.; Kucernak, A., Poison mitigation strategies
for the use of impure hydrogen in electrochemical hydrogen pumps and fuel cells.
Journal of Power Sources 2020, 472, 1-13.
Purify hydrogen from
dilute/contaminated source
0 2000 4000 6000 8000 10000 12000 140000
20
40
60
80
100
Cu
rre
nt
/ %
Time / s
H2 + 20 ppm CO
H2 + 20 ppm CO + 1.15% O
2 + 0.05% O
3
78.6% H2 + 2.9% CH
4 + 18.5% CO
2 + 20 ppm CO
78.6% H2 + 2.9% CH
4 + 18.5% CO
2 + 20 ppm CO + 1.15% O
2 + 0.05% O
3
H2+20 ppm CO
Reformate
No mitigation
Recovery of hydrogen from dilute stream
Economics of electrolytic chemicals production
15
o Oxygen evolution is a poor counter reaction
o Choosing other counter reactions could drastically reduce hydrogen costs
o For some co-produced products hydrogen is a minor cost component
Process Electrochemical reaction Product(s) Mass (Product)
Mass (Hydrogen)
Product price /$ tonne-1
Value (Product)
Value (Hydrogen)
Hydrogen evolution 2H+ + 2e-
H2
2H2O + 2e- H2 +2OH-
H2 1 2450
Combined with one of the reactions below Combined with one of the reactions below
Water electrolysis H2O ½O2 + 2H++ 2e- 2OH- ½O2 + H2O + 2e-
O2 7.9 60 0.2
Chlor Alkali 2Cl- Cl2 + 2e-
Cl2 35.2 350 13.8
NaOH 39.7 540
Hydrogen peroxide 2H2O H2O2 + 2H+ + 2e- H2O2 16.9 450 3.1
Ozone H2O 1/3O3 + 2H+ + 2e- O3 7.9 2500 8.0
Persulphate 2HSO4- S2O8
2- + 2H+ + 2e- X2S2O9 118.1 3300 160.4
Organic oxidation CxHyOz+H2OCxHy+1Oz+1+H++e- CxHy+wOz+w ? ? ?
14
15
02/09/2021
8
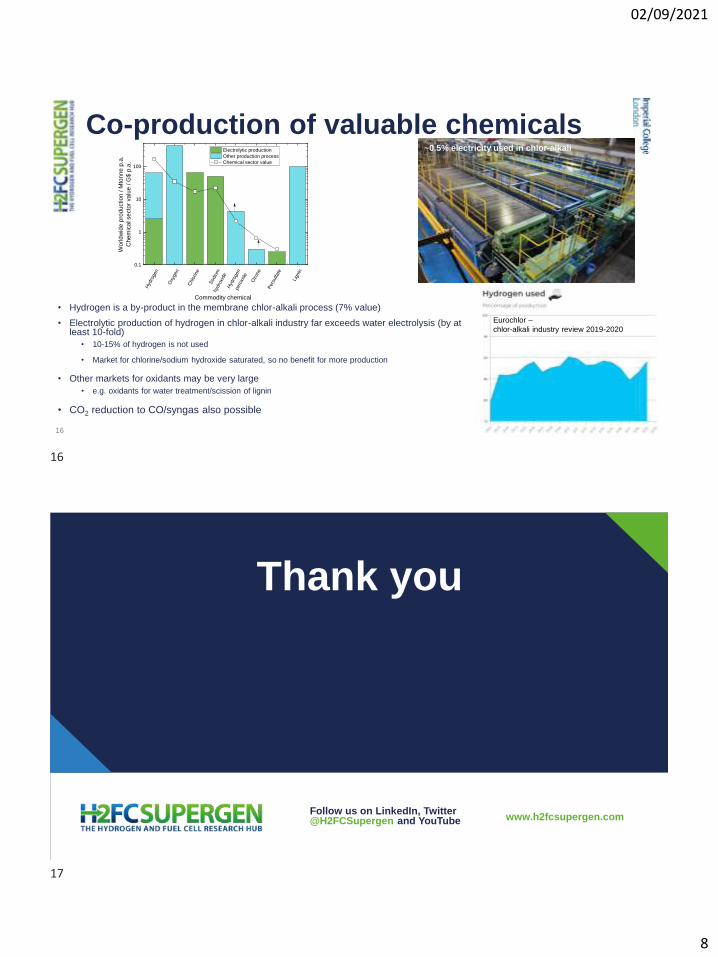
Co-production of valuable chemicals
• Hydrogen is a by-product in the membrane chlor-alkali process (7% value)
• Electrolytic production of hydrogen in chlor-alkali industry far exceeds water electrolysis (by at least 10-fold)
• 10-15% of hydrogen is not used
• Market for chlorine/sodium hydroxide saturated, so no benefit for more production
• Other markets for oxidants may be very large
• e.g. oxidants for water treatment/scission of lignin
• CO2 reduction to CO/syngas also possible
16
Eurochlor –
chlor-alkali industry review 2019-2020
Hyd
rogen
Oxy
gen
Chlo
rine
Sodiu
mhyd
roxi
de
Hyd
rogen
pero
xide
Ozo
ne
Pers
ulfa
te
Lig
nin
0.1
1
10
100
Electrolytic production
Other production process
Chemical sector value
Wo
rldw
ide
pro
duction
/ M
tonn
e p
.a.
Ch
em
ica
l se
cto
r va
lue
/ G
$ p
.a.
Commodity chemical
~0.5% electricity used in chlor-alkali
Thank you
Follow us on LinkedIn, Twitter @H2FCSupergen and YouTube www.h2fcsupergen.com
16
17


