Download - DFID CSAZ ADOPTION SURVEY REPORT

DFID CSAZ ADOPTION SURVEY REPORT
2016/2017
By the CFU RM, M&E Team
This report presents key adoption survey findings for
Year 1 upon the implementation of the CSAZ
Programme by the Conservation Farming Unit under
DFID in June 2016. This report covers the 2016/2017
CFU training period and farming season.
i
ACRONYMS
ADP Animal Draught Power
CA Conservation Agriculture
CAPI Computer Assisted Personal Interview
CF Conservation Farming
CFU Conservation Farming Unit
CSA Climate Smart Agriculture
CSAZ Climate Smart Agriculture Zambia
CSPro Census and Survey Processing System
CT Conservation Tillage
DFID Department for International Development
FC Farmer Coordinator
FGD Focus Group Discussion
FISP Farmer Input Support Programme
FO Field Officer
HH Household
MRM Monitoring and Results Measurement
MS Microsoft
MT Minimum Tillage
SFO Senior Field Officer
SPSS Statistical Package for the Social Sciences
ToC Theory of Change
TSP Tillage Service Provider

ii
TABLE OF CONTENTS
ACRONYMS ........................................................................................................................................................... i
TABLE OF CONTENTS ....................................................................................................................................... ii
EXECUTIVE SUMMARY ................................................................................................................................... iv
1.0 INTRODUCTION ............................................................................................................................................ 1
1.1 BACKGROUND OF THE CSAZ AND CFU ............................................................................................ 1
1.2 CSAZ THEORY OF CHANGE .................................................................................................................. 2
1.3 STUDY OBJECTIVES ................................................................................................................................ 4
1.4 DELIMITATIONS ....................................................................................................................................... 4
1.5 CHALLENGES ............................................................................................................................................ 4
2.0 STUDY METHODS ......................................................................................................................................... 6
2.1 STUDY TOOLS ............................................................................................................................................ 6
2.1.1 Structured Computer Based Questionnaire ....................................................................................... 6
2.1.2 Focus Group Discussions and Open-Ended Discussions.................................................................... 7
2.1.3 Field Observations ................................................................................................................................. 7
2.2 SAMPLING .................................................................................................................................................. 7
2.2.1 Geographical Sampling ......................................................................................................................... 7
2.2.2 Field Officer Level and Farmer Coordinators.................................................................................... 9
2.3 DATA MANAGEMENT ........................................................................................................................... 10
3.0 SURVEY FINDINGS ..................................................................................................................................... 11
3.1 Demographics ............................................................................................................................................. 12
3.1.1 Sex of Household Head. ...................................................................................................................... 12
3.2.2 Household Labour Size ....................................................................................................................... 12
3.2.3 Multiple Trainees within the Household ........................................................................................... 13
3.2.4 Age of trained farmers ........................................................................................................................ 14
3.2.5 Potential Draft Power in Households ................................................................................................ 15
3.2.6 Field Days Attendance ........................................................................................................................ 16
3.2.7 Does Sex of the trainer Matter ........................................................................................................... 16
3.3 ADOPTION ................................................................................................................................................ 17
3.3.1 Plots owned by Households................................................................................................................. 18
3.3.2 Adopters of a CSA technology............................................................................................................ 18
3.3.3 Tillage Methods Used by Adopters. ................................................................................................... 23
3.3.4 Reasons for Non-adoption. ................................................................................................................. 24

iii
3.4 Investigating Adoption ............................................................................................................................... 24
3.4.1 Sex of HH head. ................................................................................................................................... 25
3.4.2 HH Labour Size. .................................................................................................................................. 26
3.4.3 HH Ownership of Potential Animals for Draft Power. .................................................................... 26
3.5 Other Adoption Considerations ................................................................................................................ 26
3.5.1 Timeliness in Accessing Inputs ........................................................................................................... 27
3.5.2 Sources of Inputs ................................................................................................................................. 27
3.5.3 Timeliness in Planting ......................................................................................................................... 28
3.5.4 Weed Management and Herbicide Usage. ........................................................................................ 29
4.0 Conclusions, Lessons Learnt, and Recommendations. ............................................................................... 32
4.1 Conclusions ................................................................................................................................................. 32
4.2 Lessons Learnt ............................................................................................................................................ 33
4.3 Recommendations ...................................................................................................................................... 34

iv
EXECUTIVE SUMMARY
The Conservation Farming Unit (CFU), under the sponsorship of the British Government’s Department for
International Development (DFID), launched a 5-year Climate Smart Agriculture Zambia (CSAZ) in July 2016.
The programmes seeks to improve food security to over a million people by providing trainings to an outreach of
over 200,000 farmers annually across four the CFU’s areas of operations; Central, Eastern, Western and Southern
regions. The project is guided by at least three theories of change. The first is that if farmers are well trained in
Climate Smart Agriculture (CSA) technologies, then they will adopt the technologies. The second is that if the
private sector (agro-dealers and tractor owners and suppliers) are well mobilised, CSA technology adopters will
realise even smooth and increased benefits of adoption. The third (not covered by this study) is that if farmers
adopt CSA technologies, then they will achieve improved livelihoods and food security.
An internal survey was conducted by the CFU’s M&E department. The study used a survey methodology to
establish the proportion of farmers who, after the 2016 trainings, adopted the content of the CSA technology
trainings. The survey was carried out across 11 out of the 31 districts and in all the four areas of CFU operations
in Zambia. The sample size was 446 trained farmers each representing a unique household whose member was
trained in 2016. The survey established of those that took up a CSA minimum tillage technology in the 2016/17
season, 21.9% of the trained farmers who adopted CSA had not used the technology before the 2016/17 season
while 78.1% where continuing adopters who had used a CSA technology prior to the 2016/17 season. All in all,
(both new and old adopters), the survey showed that 66% of the trained farmers adopted minimum tillage during
the 2016/17 cropping season. In summary, the survey established the following:
20,305 is the number of new farmers who have adopted CF MT CSA during year against a target of
20,000 farmers.
10,405 is the total hectarage put under CF but computed from Mechanised tillage only. This is against a
year one target of 8,940 hectares.
11,383 is the number of new adopters using ADP and mechanised tillage services in the 2016/17 season
against a target of 8,500 farmers.
7,391 is the number of new adopters who used herbicides for weed control purposes against a year 1
target of 13,390 farmers
125 is the total number of service providers offering mechanized tillage services and ADP tillage services
in Year 1 against a set target of target 400 TSPs.
Contrary to the M&E department thinking that adoption could be influenced by factors such as the sex of the head
of household, findings were that there is no evidence to suggest that adoption is dependent on gender of HH head,
household’s labour size, nor the presence of animal draft power in a household.
Key recommendations that should be seriously considered by the CFU as we prepare for the second year are as
follows:
There is need for deliberate efforts to increase the number of ripper suppliers and bring them as close as
possible to the farmers.
While mechanized tillage should continue to be encouraged, emphasis must also be placed on ADP
because most CSAZ trained farmers are small scale and although some can hire tractors for ripping, many
of them do not have sufficient financial resources to meet the demands of mechanised TSP
It is imperative that In-Community Agro-dealers should be encouraged to increase presence through
private sector partnerships.
1
1.0 INTRODUCTION
This section gives a background to the Conservation Farming Unit (CFU) and the Department for
International Development (DFID)’s sponsored Climate Smart Agriculture Zambia Programme (CSAZ). It
details the Theory of Change (ToC) specific to adoption and gives the study objectives. The last part briefly
touches on study delimitation as well as challenges.
1.1 BACKGROUND OF THE CSAZ AND CFU
The Conservation Farming Unit (CFU), a not-for-profit organization being sponsored by the British
Government’s Department for International Development (DFID), under its Climate Smart Agriculture
Zambia (CSAZ), provides trainings to an outreach of over 200,000 farmers annually across four (4) CFU
operation regions namely; Central, Eastern, Western and Southern. This covers a total of 31 Zambian districts.
The project has 81 Field Officers (FOs) and 11 Senior Field Officers (SFOs) across the four regions. Each
FO trains and/or oversees training of about 2,700 farmers three times annually. While these farmers are
expected to be unique individuals, there has not been a deliberate policy stopping farmers from repeating
trainings as it was felt that they would always have a genuine reason for being present in the same session as
they one they attended before. The majority of trainees of CFU are small-scale farmers in the rural areas of
Zambia. These trained farmers are in turn expected to practice one form or another of minimum tillage as
they have been trained. The previous of such types of trainings were conducted during the 2016 round of
trainings in preparations for the 2016/2017 season namely:
Period 1-Land Preparation (with three sessions similar in content, to cater for more than the 30
farmers expected in one training session),
Period 2-Nutrient application and seeding (three sessions as above),
Period 3-Weed management (again with three sessions).
The core purpose of these trainings was to ensure that the farmer would move on to adopt the CF technology.
Ideally a farmer needs to attend all three periods in order for them to gain the complete set of skills needed
for full adoption. However, a farmer who goes on to attend at least period one and two and then practices (for
year 1) minimum tillage would qualify to be called an adopter. The survey sought to find out if and how many
of those trained farmers had adopted the CF technology and if not, why not.

2
1.2 CSAZ THEORY OF CHANGE
The CFU’s CSAZ Theory of Change (ToC) below outlines how training farmers leads to adoption and other
higher indicators like yield increase. The highlighted sections of the ToC were the subject matter for this
Adoption Survey. The ToC breaks down the different categories of adopters and how these categories interact
with each other. It follows from the ToC that trained farmers adopt the different levels of the technology
(Minimum Tillage, Conservation Tillage and Conservation Farming) and over time adopt further by
progressively moving from MT to CT or from CT to CF. In the survey, questions were raised in such a way
as to bring out those differences and see which category is ‘housing’ most of the adopters under the
programme. The survey also tried to establish to some extent whether farmers have progressed from
Minimum Tillage (MT) to Conservation Tillage (CT) and to Conservation Farming (CF) by asking what
tillage method they employed on the same field in question during the previous season and what type of crops
were grown (to check for crop rotation).

3
Figure 1: CSAZ Theory of Change
Adoption Study Focus Area

4
1.3 STUDY OBJECTIVES
The main objective of this survey was to ‘Establish the proportion of 2016 trained farmers that adopted the
technology of Conservation Farming (CF).’
The specific objectives were as follows:
Establish the composition of the households from which these farmers come
Establish number of CFU trained farmers who have adopted climate smart agriculture at its
different levels as defined by the CFU
Establish the intra-household ownership of plots by both gender and disability (i.e. fields
cultivated other than those of the whole household and the types of tillage they are under).
Determine the type of crops planted by farmers under each tillage method
For fields prepared with tractors (mechanized) or animal draught power (ADP), establish
whether tractors and/or oxen were owned or hired by farmers
Determine when farmers accessed seed and when farmers planted crops with regard to the time
frame recommended for conservation agricultural practices in Zambia.
Determine frequency of weeding throughout the season of focus.
Determine herbicide usage among trained farmers.
1.4 DELIMITATIONS
The targeted respondents for this survey were the 2016/2017 CSAZ trained farmers across all the four (4)
regions of the CSAZ programme as named above. In these 4 regions and out of a total of 31 districts, the
survey was carried out only eleven (11) randomly selected districts - Luano, Chisamba, Rufunsa, Petauke,
Lundazi, Vubwi, Pemba, Namwala, Choma, Shibuyunji and Mumbwa. In addition, only Field Officers (FOs),
Farmer Coordinators (FCs) and farmers from the sampled districts were eligible for being part of the survey.
1.5 CHALLENGES
As will be expected for any study, the Adoption Study faced several challenges. It however suffices to note that
none of the challenges encountered had any significant impact on the results of the survey. The first challenge
faced was that of accessibility of individual farmers due to rough terrain. This was a household survey and hence
it was planned in such a way that interviews would take place within the homestead of the respondents. In some
cases, enumerators had to walk over a kilometer to get to the homestead of the farmer as there was no access road.
Fortunately, the enumerators had been forewarned and hence they expected this. The second challenge emanated
from the first one as walking great distances impacted on the time allocated to each village/district had not
anticipated such walking distances. However, the walking distances were not the same in all areas and there were
areas were in fact the distance from one sampled household to the next was less than 100m and this evened out
the time allocated to the entire survey. The third challenge was establishing land size. Farmers just did not know
how big their plots are and the plots were not always close to homesteads. It was therefore resolved that the survey

5
would proceed without exact plot sizes and further exercises would ensure a system will be put in place to establish
plot sizes long before adoption surveys. The final challenge was that randomly sampled farmers were sometimes
from the same household (since the training registers were not taking into account household membership of
trainees). The survey was a household based survey and hence that meant replacing such members from the same
households since the information from such respondents would have ended up being the same and therefore biasing
the results. This was a strain on the tight timeline but had to be done, such sampled persons were replaced by
someone else from the pool of replacement respondents that had fortunately been created before starting data
collection.

6
2.0 STUDY METHODS
This survey was conducted in all four (4) regions of the CSAZ project (namely Central, Eastern, Western and
Southern) in specific randomly sampled districts within these regions. The overarching methodological framework
was sample survey and the data collection tool was a structured questionnaire in Computer Tablets using CSPro
software. Qualitative methodologies such as Focus Group Discussions (FGD) and open ended discussions with
Farmer Coordinators (FCs), as well as field observations of the crop status at the time of the survey were done.
Qualitative methods were conducted by the MRM team. The survey findings were analysed using the Statistical
Package for Social Sciences (SPSS) before exporting data to MS Excel for graphing and tables.
2.1 STUDY TOOLS
The tools used in this study were:
Structured computer based questionnaire
Focus Group Discussions and Open-Ended Discussions
Field observations
2.1.1 Structured Computer Based Questionnaire
The structured questionnaire, administered by the enumerators, was a systematic compilation of questions whose
specific purpose was to determine the actual practices/ adoption taken up by farmers after-training in the 2016/2017
farming season. The fact that the sample was generated from a database of farmers who were trained by the CFU
under CSAZ in the 2016/2017 season meant that the resultant adoption pattern can be attributed to the training.
Furthermore, the questionnaire incorporated aspects of gender in households (HHs) in order to establish the extent
to which women within the household own land and make decisions regarding the land they own in cases where
they do. Such decisions would include (but not limited to) what tillage method to use, what crops to grow and who
they sell produce to in order to obtain an income. Another aspect of gender was with regard to the sex of the trainer
and opinions on whether this would have had a different impact on the training or on the farmers had the trainer
been of the opposite sex. Assets owned and inputs accessed were also areas of interest covered by the
questionnaire. The questionnaire is attached as Annex 1.

7
2.1.2 Focus Group Discussions and Open-Ended Discussions
The FGDs were administered to a group of Farmer coordinators (FCs) following a prepared guide in order to
capture perceptions regarding various topics in line with the implementation of CSAZ. These discussions sought
to bring out perceptions such as how much of what was trained by FCs during the 2016/2017 season was actually
put into practice by the farmers, the addition (in value and livelihoods) that CF has brought about, the impact of
climate smart agriculture (CSA) on women and people with disabilities as well as challenges to their uptake of
CSA and, finally a look into the future of CSA and its uptake. FCs were also engaged in open-ended discussions
in order to establish and have a feel of issues surrounding adoption.
2.1.3 Field Observations
Actual observations of the crops in farmers’ fields at the time of the survey were made where the farmer had not
yet harvested the respective crop that was under CF. Enumerators were trained to make a judgement of whether
the crop would be categorised as a “write off”, “Fair” or “Good”.
2.2 SAMPLING
All the CFU regions were taken as part of the sources of data. Sampling was three-tiered: Random sampling of 11
out of the 31 districts within these regions was done in order for the survey to have an unbiased spread of
information. From each sampled district, a random sample of Field Officers (FOs) and Farmer Coordinators (FCs)
was first done before finally carrying out a further random sampling of farmers under each sampled FC. . The
sampled farmers all came from the register of unique farmers trained by the CFU in 2016 and were proportionately
spread across all sampled areas taking into consideration the size of the areas and the number of trained unique
farmers. There was no need to sample untrained farmers as this survey was establishing adoption levels rather than
answering the question “Does CF work”?
2.2.1 Geographical Sampling
As earlier mentioned, sampling was done randomly at all levels in the different areas. It was decided that the study
would take place in all the four CSAZ areas (CFU Regions) so as to assure representatives by capturing any
variations introduced by ecological and human resource factors.
8
Region and District Level Sampling
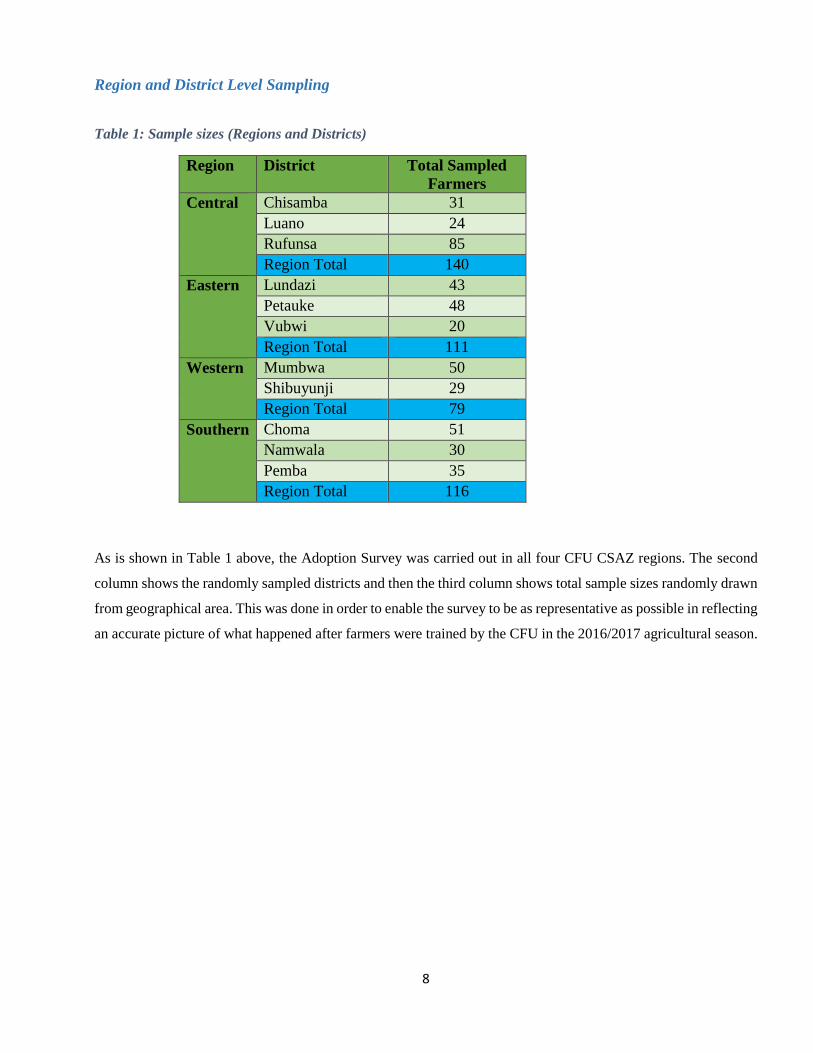
Table 1: Sample sizes (Regions and Districts)
Region District Total Sampled
Farmers
Central Chisamba 31
Luano 24
Rufunsa 85
Region Total 140
Eastern Lundazi 43
Petauke 48
Vubwi 20
Region Total 111
Western Mumbwa 50
Shibuyunji 29
Region Total 79
Southern Choma 51
Namwala 30
Pemba 35
Region Total 116
As is shown in Table 1 above, the Adoption Survey was carried out in all four CFU CSAZ regions. The second
column shows the randomly sampled districts and then the third column shows total sample sizes randomly drawn
from geographical area. This was done in order to enable the survey to be as representative as possible in reflecting
an accurate picture of what happened after farmers were trained by the CFU in the 2016/2017 agricultural season.

9
2.2.2 Field Officer Level and Farmer Coordinators.
From each district, it was also essential that we randomly sample field officers and the respective farmer
coordinators (FCs) under them (for the same reason as given above when sampling districts).
Table 2: Sample Sizes (Field Officers)
Region Field Officer Number of Farmers sampled
Central
Bruce Phiri 46
Jellan Zimba 41
Benjamin Ngoma 23
Harrison Syamujaye 20
George Luvila 10
Total 140
Eastern
Kachaye Phiri 26
Joseph Musosa 20
Masauso Nkhoma 20
Alick Angel Nyirenda 17
Chanda Kasanda 16
Esnart Mwale 12
Total 111
Western
Sam Chinyemba 21
Timothy Mpandala 16
Chombe Musowe 13
Nawa Mubita 11
Marvel Mwiinga 10
Joshua Mateka 8
Total 79
Southern
Osia Njobvu 35
Passmore Handongwe 33
Derick Chizinga 24
Eric Kantolo 24
Total 116
Table 2 above shows how the sampled farmers were distributed among the different randomly sampled Field
Officers (FOs) in the various randomly sampled districts of the regions. Each FO area, having different spread
within the districts saw the survey sampling out at least 4, and not more than 6 field officers per region. Once the
FOs chosen, a list of Farmer Coordinators (FCs) under them was drawn and then also randomly sampled. The list
is long and for ease of reading, it is included in this report as Annex 3.
10
2.3 DATA MANAGEMENT
Data was collected by 12 enumerators who were engaged for the purpose. Before actual data collection, the
enumerators underwent an intensive three-day training workshop which included field trial runs and testing of the
survey tool to be administered. Trial runs were carried out in Chongwe area of Central Region. All enumerators
recruited were computer literate, possessing beyond a Grade 12 certificate and have previous knowledge of the
CSPro application from data entry exercises carried out by the CFU.
The actual data collection was done using Computer Assisted Personal Interviewing (CAPI) software on Lenovo
Tablets and therefore all information obtained was electronic. The interviews were designed using CSPro 6.3
Software which ensured that data obtained was of the highest possible quality at that level. Quality assurance rules
were built within the CAPI software and this included skipping to the next section if question is non-applicable to
the respondent, ensuring that the number of individual HH groupings (such as Under-5s, above 60s, etc.) reported
does not exceed the total number of people in a household, districts that are within the correct region etc.
The analysis tool used, SPSS, allowed for robust data management and analysis as it makes use of syntaxes in
order to scrutinize the datasets obtained. SPSS enables us to generate different variables and perspectives from
which to approach data analysis. Microsoft Excel was also incorporated into the data analysis for enhanced visuals
and graphic presentation of survey findings.

11
3.0 SURVEY FINDINGS
This section focuses on the actual results obtained from the survey. It highlights the composition of the households
(HH) from the farmers trained in the year during the 2016/2017 season, the sex of the household head (HH head),
as well as the sex of the trained person, and any disabled persons within those households. The section also
focusses on household labour size, the number of HH members receiving the same training, and the ages of trained
farmers. The size of plots cultivated by farmers practicing CF was, as already noted above, difficult to determine,
so this report will present the number of plots that a household has converted to CF. Asset ownership focused on
the availability of animal draft power from oxen and donkeys as well as the farm implements that are appropriate
to the CF practices. It will be determined if some oxen owners also provided ADP tillage services to farmers.
The section will also discuss issues related to the timely delivery of and access to inputs. The report will also
discuss whether farmers planted with the first available planting rains when those occurred for their respective
areas. We also examine the uptake of herbicides to control weeds on the part of those farmers who attended
training. The frequency of weeding is also explained in this section. Field day attendance by farmers was also
analysed.
First however, focus will be put on secondary data on the CSAZ outputs to date so as to give readers an insight
into the training of farmers during the 2016 (Year 1 of the project) training period.
12
3.1 Demographics
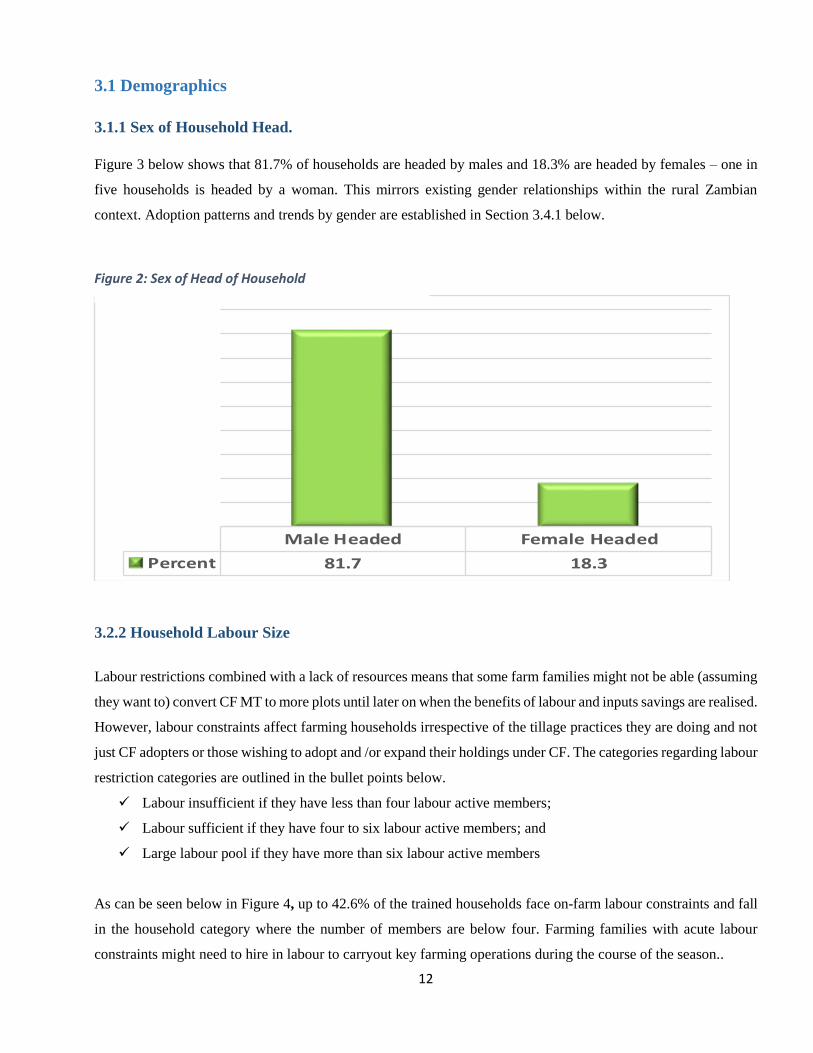
3.1.1 Sex of Household Head.
Figure 3 below shows that 81.7% of households are headed by males and 18.3% are headed by females – one in
five households is headed by a woman. This mirrors existing gender relationships within the rural Zambian
context. Adoption patterns and trends by gender are established in Section 3.4.1 below.
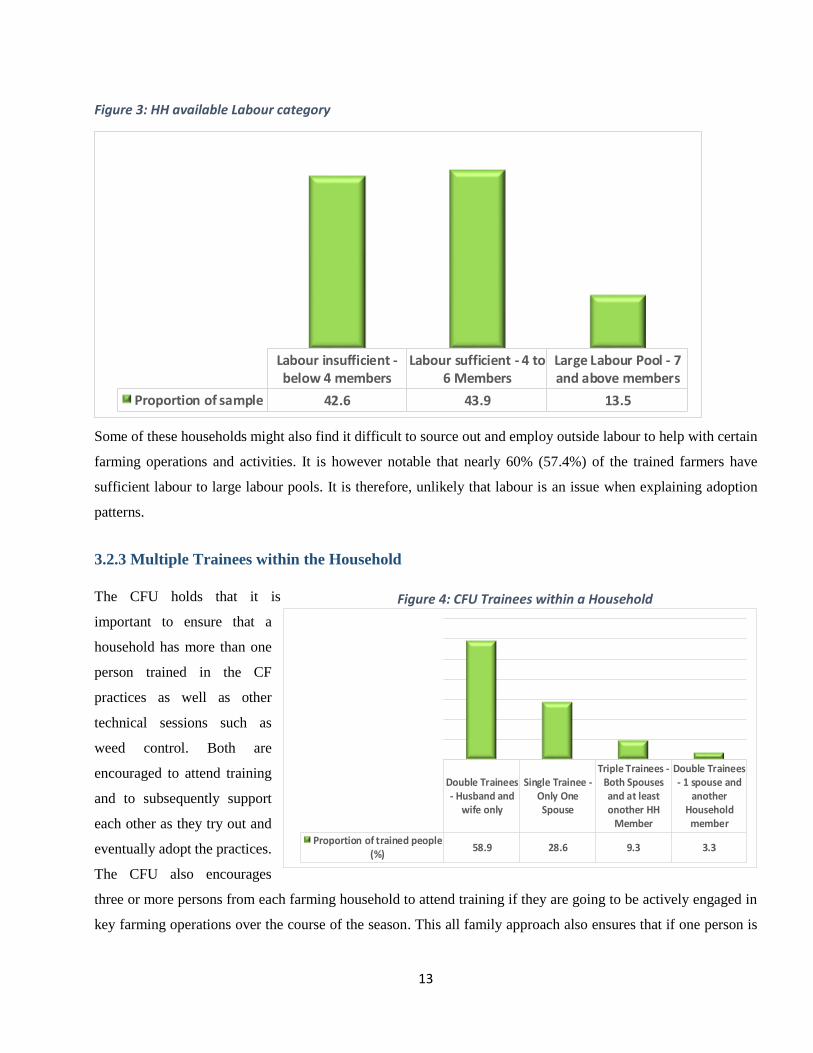
3.2.2 Household Labour Size
Labour restrictions combined with a lack of resources means that some farm families might not be able (assuming
they want to) convert CF MT to more plots until later on when the benefits of labour and inputs savings are realised.
However, labour constraints affect farming households irrespective of the tillage practices they are doing and not
just CF adopters or those wishing to adopt and /or expand their holdings under CF. The categories regarding labour
restriction categories are outlined in the bullet points below.
Labour insufficient if they have less than four labour active members;
Labour sufficient if they have four to six labour active members; and
Large labour pool if they have more than six labour active members
As can be seen below in Figure 4, up to 42.6% of the trained households face on-farm labour constraints and fall
in the household category where the number of members are below four. Farming families with acute labour
constraints might need to hire in labour to carryout key farming operations during the course of the season..
Male Headed Female Headed
Percent 81.7 18.3
Figure 2: Sex of Head of Household
13
Figure 3: HH available Labour category
Some of these households might also find it difficult to source out and employ outside labour to help with certain
farming operations and activities. It is however notable that nearly 60% (57.4%) of the trained farmers have
sufficient labour to large labour pools. It is therefore, unlikely that labour is an issue when explaining adoption
patterns.
3.2.3 Multiple Trainees within the Household
The CFU holds that it is
important to ensure that a
household has more than one
person trained in the CF
practices as well as other
technical sessions such as
weed control. Both are
encouraged to attend training
and to subsequently support
each other as they try out and
eventually adopt the practices.
The CFU also encourages
three or more persons from each farming household to attend training if they are going to be actively engaged in
key farming operations over the course of the season. This all family approach also ensures that if one person is
Labour insufficient -below 4 members
Labour sufficient - 4 to6 Members
Large Labour Pool - 7and above members
Proportion of sample 42.6 43.9 13.5
Double Trainees- Husband and
wife only
Single Trainee -Only OneSpouse
Triple Trainees -Both Spousesand at leastonother HH
Member
Double Trainees- 1 spouse and
anotherHousehold
member
Proportion of trained people(%)
58.9 28.6 9.3 3.3
Figure 4: CFU Trainees within a Household

14
not present for whatever reason(s) during the season, then there is at least one other person capable of managing
that operation.
An analysis done on the number of trainees in the household brought to light the occurrence of training of more
than one person within the household – usually the respondent and an additional person or persons. Figure 5 above
shows the results of the survey. It was discovered over the course of the survey that 58.9% of the households
surveyed indicated double trainees comprising spouses only.
3.2.4 Age of trained farmers
Ideally, CF practices technologies are passed from one generation to the next. In general, it is young to middle
aged adults who attend training. Figure 6 therefore looks at the age categories of farmers trained by the CFU.
Figure 5: Age of Respondents
The training appears to be attracting the right population as shown above in Figure 6, where 76.5% of the trained
people are within the age group of 26-60 years-old which is made up of the prime age of 26 – 45 representing
46.3% and 30.2% within which the still energetic but post prime age of 46 – 60 year olds fall. This is deemed as
the right population to lay the ground work for a generational crossing of farmers who will continue to carry out
and expand the CF MT practices. This also appears to be supported by older and more experienced farming
members within the communities who have been farming for a relatively longer time. Only 14.4% represented
elderly people who are aged 60 and above.
Prime Age(26 to 45
years)
Post-PrimeAge 46 to 60
years
Elderly -beyond 60
years
Under 26years
Proporstion ofrespondents (%)
46.3 30.2 14.4 9.0

15
3.2.5 Potential Draft Power in Households
It is a commonly and endlessly echoed assumption that digging CF Hoe basins is more labour and time consuming;
however, this comparison is almost always made against animal draft power; making it an unfair comparison for
what are obvious reasons. Farmers who own animals are therefore more likely to adopt CF ADP MT for what are
also obvious reasons. Farmers who have lost their animals and do not have access to other draft animals might or
might not turn to hoe tillage whilst they build up their animal asset base. We therefore felt it important to try and
ascertain the level of animal ownership during the survey.
Figure 6: Potential Animals for Draft Power in Households
As shown in Figure 7, the survey reveals that 48.2% of the respondents are more likely not to have animals that
could be used for draft power. Figure 7 also shows regional difference in ownership of animals. Thus for example,
households in the Southern Region are more likely to have animals than those in the Eastern Region. In the absence
of a viable household labour force and absence of resources to outsource animal draft power (ADP) and/or
mechanised tillage (MT), it would appear that household will have no option but to resort to basins if they wish to
adopt the practices. This is not a negative outcome however; as their yields and incomes rise from the adoption of
the CF Hoe Mt basins, they can then (as many have done) invest in ADP or mechanised tillage services.
The survey discovered that some of the farmers who previously owned animals have lost them due to various
factors including corridor disease and have not been able to replace them in subsequent years. Approximately
22.9% are in a fair position with at least two cattle or donkeys (one span) while around 28.9% are considered good
with the potential to own more than a span of animal draft. Farmers who have sufficient working animals at their
disposal are more likely to have larger areas of their holdings under CF ADP MT.
Central Eastern Western Southern All Regions
NIL- No animal 77.1% 45.0% 38.0% 23.3% 48.2%
FAIR - Potentially one Span 11.4% 30.6% 29.1% 25.0% 22.9%
GOOD - Potentially more than aSpan
11.4% 24.3% 32.9% 51.7% 28.9%
16
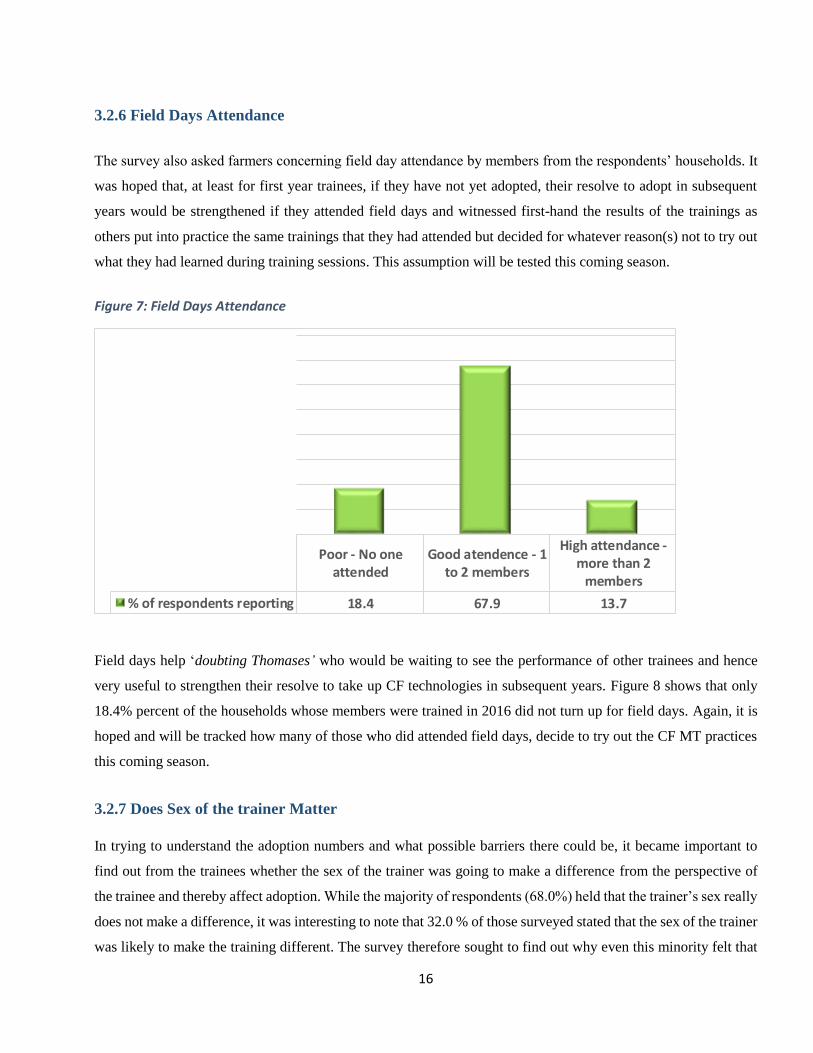
3.2.6 Field Days Attendance
The survey also asked farmers concerning field day attendance by members from the respondents’ households. It
was hoped that, at least for first year trainees, if they have not yet adopted, their resolve to adopt in subsequent
years would be strengthened if they attended field days and witnessed first-hand the results of the trainings as
others put into practice the same trainings that they had attended but decided for whatever reason(s) not to try out
what they had learned during training sessions. This assumption will be tested this coming season.
Figure 7: Field Days Attendance
Field days help ‘doubting Thomases’ who would be waiting to see the performance of other trainees and hence
very useful to strengthen their resolve to take up CF technologies in subsequent years. Figure 8 shows that only
18.4% percent of the households whose members were trained in 2016 did not turn up for field days. Again, it is
hoped and will be tracked how many of those who did attended field days, decide to try out the CF MT practices
this coming season.
3.2.7 Does Sex of the trainer Matter
In trying to understand the adoption numbers and what possible barriers there could be, it became important to
find out from the trainees whether the sex of the trainer was going to make a difference from the perspective of
the trainee and thereby affect adoption. While the majority of respondents (68.0%) held that the trainer’s sex really
does not make a difference, it was interesting to note that 32.0 % of those surveyed stated that the sex of the trainer
was likely to make the training different. The survey therefore sought to find out why even this minority felt that
Poor - No oneattended
Good atendence - 1to 2 members
High attendance -more than 2
members
% of respondents reporting 18.4 67.9 13.7

17
way. Table 6 shows an analysis of the opinions of respondents. Out of those who said that the sex of the trainer
was an important aspect, 69.1 % felt that men were better trainers than women while 16.9 % thought women were
in fact better trainers than men. This comes out as mere prejudices as no substantiation of “better in which ways”
was put forward. Of more importance, perhaps, were the 8.1 % who held that the training would have been different
because they felt freer to interact and ask questions if the trainer were the same sex as them while about 3.7 %
gave “gender balance” as the reason why they thought it mattered who trained them (“just so that both sexes were
given equal opportunities”).
Table 3: Sex of trainer impact on trainees
Response Reason %
Yes
(32.0%)
Men are better 69.1
Women are better 16.9
Freer to interact with same sex 8.1
For gender balance 3.7
Reason not clear 2.2
No
(68.0%)
Sex not a factor/same knowledge level 94.5
Cannot tell/No response 5.5
Overall, most of the respondents said it did not matter who trained them. This is important because while pushing
for adoption, it is important to make sure all possible barriers to adoption are addressed otherwise the CSAZ
program will continue to spend with lower adoption results. Gender balance is also an important aspect for the
program’s donors, DFID and as such, needs to be treated with the importance that we also feel it deserves. This
information helps us know the likelihood that adoption will not take place because a trainer if female (or male) is
minimal. And although some respondents said that the gender of the trainer mattered, it is highly probable that this
is not a factor related to whether a farmer or household decides to adopt.
3.3 ADOPTION
Adoption of the CSA technology is defined by the tillage practices used to carry out land preparation and not
by some other variable such as crop rotation or mulching. After all, farmers since the Roman times have been
rotating crops, and it is believed that farmers have for perhaps the past 3,000 years been using mulch or maintaining
crop residues for the reasons we and others also recommend. The Conservation Farming Minimum Tillage
practice is what defines and separates an adopter from all conventional farmers and conventional farming practices.

18
In future seasons we will also track CT, CF and CA adopters, but adoption starts with and is maintained through
minimal to zero soil disturbance.
This section will prioritize the tillage practices used to determine whether a farmer adopted or not. Reasons for
non-adoption will then be immediately tabled. Data from FGDs and FC interviews will throw light into reason for
non-adoption. The section would then proceed to profile the adopters by considering pertinent factors such as
gender of HH head, HH labour size, HH ownership of draft power, etc. Other factors such as timeliness in
accessing inputs, source of inputs, timeliness in planting, weed management and herbicide usage will also be
considered.
3.3.1 Plots owned by Households.
First, the study focussed on the number of plots under the ownership (owned) or stewardship (rented) of the
household. The reason was to then later on compare how may plots the household put under a CSA technology as
this would show the strength of the HH’s belief and trust in the practices. These are plots owned and or rented and
that are cultivated by the HH regardless of the tillage method. Table 4 shows survey findings.
Table 4: Number of Plots owned/rented by HHs
Total HH Plots % of respondents
One to two plots 44.6
Three or more plots 55.4
The majority of HHs (55%) are more likely to have more than two plots cultivated. This bodes well for the
programme in areas where farmers have access to more plots or holdings as they are in a better position to try out
the practices than farming households with less than two plots. At this point, it is not yet clear whether these plot
owners have adopted or not until we get to plots under CF but this gives us an idea that these trainees own land
and we can expect some possible adoption. Plot ownership is sometimes determined by what other activities this
individual farmer undertakes, in other words, is s/he a ‘full-time’ farmer or a ‘part-time’ farmer. The survey did
not go into the details of what was the respondent’s HH’s main source of income but it would suffice to say that
can help in understanding the question around adoption.
3.3.2 Adopters of a CSA technology.
The discussion now turns to the much awaited focus on adoption. What proportion of households took up a CSA
promoted technology in the current year 1 season? Figure 9 below presents a surface and rather generalised picture
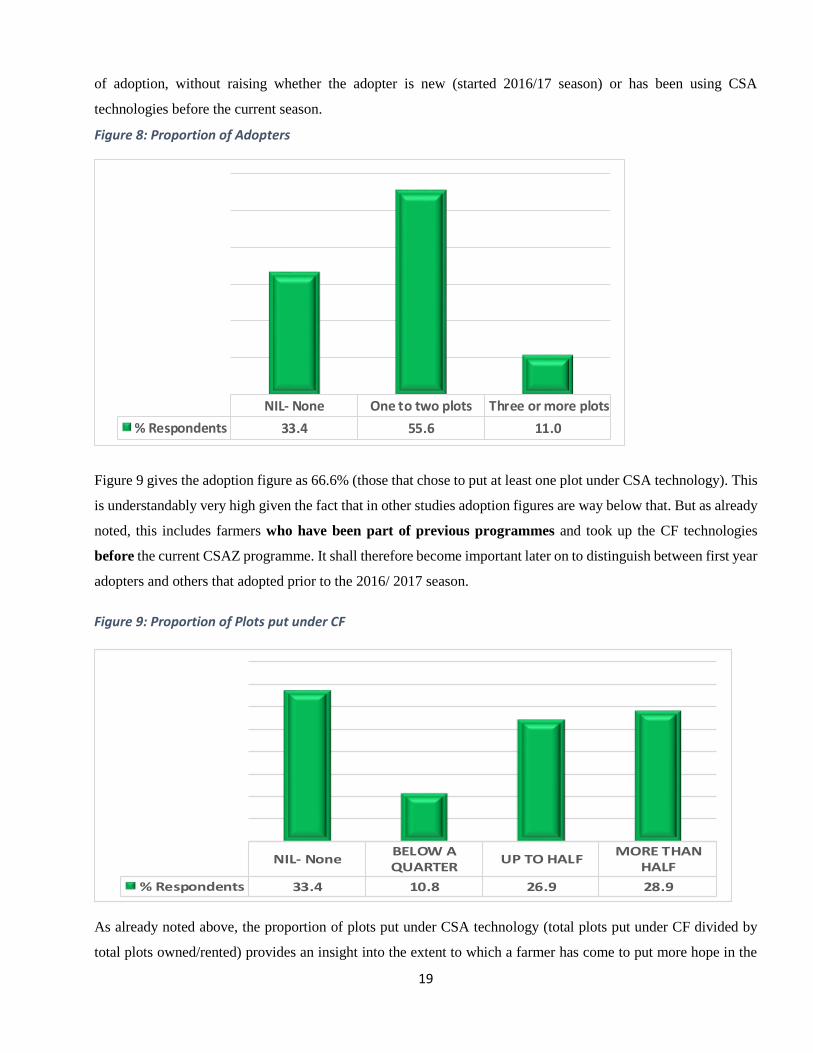
19
of adoption, without raising whether the adopter is new (started 2016/17 season) or has been using CSA
technologies before the current season.
Figure 8: Proportion of Adopters
Figure 9 gives the adoption figure as 66.6% (those that chose to put at least one plot under CSA technology). This
is understandably very high given the fact that in other studies adoption figures are way below that. But as already
noted, this includes farmers who have been part of previous programmes and took up the CF technologies
before the current CSAZ programme. It shall therefore become important later on to distinguish between first year
adopters and others that adopted prior to the 2016/ 2017 season.
As already noted above, the proportion of plots put under CSA technology (total plots put under CF divided by
total plots owned/rented) provides an insight into the extent to which a farmer has come to put more hope in the
NIL- None One to two plots Three or more plots
% Respondents 33.4 55.6 11.0
NIL- NoneBELOW AQUARTER
UP TO HALFMORE THAN
HALF
% Respondents 33.4 10.8 26.9 28.9
Figure 9: Proportion of Plots put under CF

20
new technology even as the only available option for the farmer. It is not enough to know that some farmers are
actually placing CF on some of their plots but going further to establish which methods occupied most of their
land. In the absence of an actual measurement of fields, the respondents were asked to give the number of plots
under a CSA technology and this is now being compared to total plots owned/rented by the HH. This does not
give exact figures in hectares but rather an indication of which tillage practice the farmer prefers to the other.
In Figure 10, demonstrates that 10.8% of the HHs have less than a quarter of their plots under CF MT, while
another 26.9% up to half of their total cultivated HH plots have been converted to CF MT and 28.9% have decided
to convert more than half their total plots to the CF MT CSA technologies. Normally, most farmers (and indeed
most people in any given endeavour) would not make a first year allocation of his holdings to a technology or
practices that was unproven by them. This is especially the case with any sort of agricultural endeavour where
resources, time, and effort must be expended. If the practice does not deliver, then there are real and potentially
negative consequences on that farming household’s food and income security. This shows how these farmers
perceive CF and the likelihood to influence and encourage other farmers who are still doubting.
It becomes very important to profile these farmers, to look into previous season’s tillage method and try and answer
the question of whether those who did not use a CSA technology in the past season were more likely to try and
adopt in this current season or not. These then become our new adopters since the ones who were already using
CSA technologies are simply continuing their adoption. Old adopters are important as a measure of sustainability
rather than as a measure of progress with the programme’s Log Frame indicators.
Figure 10: Adopters' tillage method used last season
Figure 11 throws light into adoption patterns among farmers. It appears that there is a high probability that once a
farmer adopts the CF MT CSA technology they will continue with the practice and not abandon it. This high
prevalence of continuing with the adoption is true irrespective of the number of plots put under CF MT. Corollary,
76.2%
23.8%
85.7%
14.3%
CSA Technology Conventional Method CSA Technology Conventional Method
Previous Season TillageMethod
Previous Season TillageMethod
One to two plots One to two plots Three or more plots Three or more plots

21
the probability of taking up a CSA technology if one had NOT used it in the previous period has been low this
season and those with more than two HH plots are even less likely to want to experiment with the new technology.
But this is not surprising in the case of those who have been exposed to training for the first time. It is not really
anticipated that first year adopters would be phenomenally high. The table below shows this historical precedent
across five countries, including Zambia that the CFU has been promoting CF MT CSA technologies.
As figure 11 shows, demonstrates, the majority of first year adopters were CF Hoe MT practitioners. The reasons
for this are varied and consistent with CFU’s historical experience in Zambia and elsewhere:
a. The hoe practice is perhaps more straightforward – no real capital investment is required. One doesn’t
even need a Chaka hoe or a Teran Rope to do it, though obviously those tools render the work easier,
more accurate, and hence more beneficial. One can just allocate a small plot to test it all out and
establish the basins – risk is lower in that sense;
b. There might not be a TSP (either ADP or Mechanised) in the area, or they might not be available
when they are required; and
c. One has more control over when one starts and stops the whole basin establishment exercise.
CF Mechanised MT represented the smallest number of adoption practice recorded during the survey. CFU expects
this number to rise as more and more TSPs, including ADP TSPs enter into the tillage service provision sector
Table 5: Adopters increasing only after first year of training (data from other countries)
In-Country Partner PY1 Year PY1 Adopters December 2015
Adopters
Kenya PAFID 2011-2012 154 24 249
Malawi TLC 2011-2012 614 22 890
REDS Ltd Uganda 2011-2012 2 078 41 376
HRNS TZ 2013-2014 345 5 016
TGT TZ 2013-2014 1 684 11 958
Zambian CFU 1995-1996 0 215 000
Totals 3 339 320 489
Human behavior change is a difficult undertaking under ideal circumstances. It is far more time consuming and
arduous when trying to change the attitudes and outlook of a segment of the population who are by nature very
risk averse, and whose overall experience with the majority of development projects is generally negative.
This then takes us into the last step in determining the proportion of new adopters. This answers to the first output
indicator (Indicator 1.1) in the CSAZ Lofgrame; Number of farmers sustainably adopting CSA practices following
attendance at CFU training courses and Lead Farmer led field days (disaggregated.). Figure 12 below shows that
proportion.
22
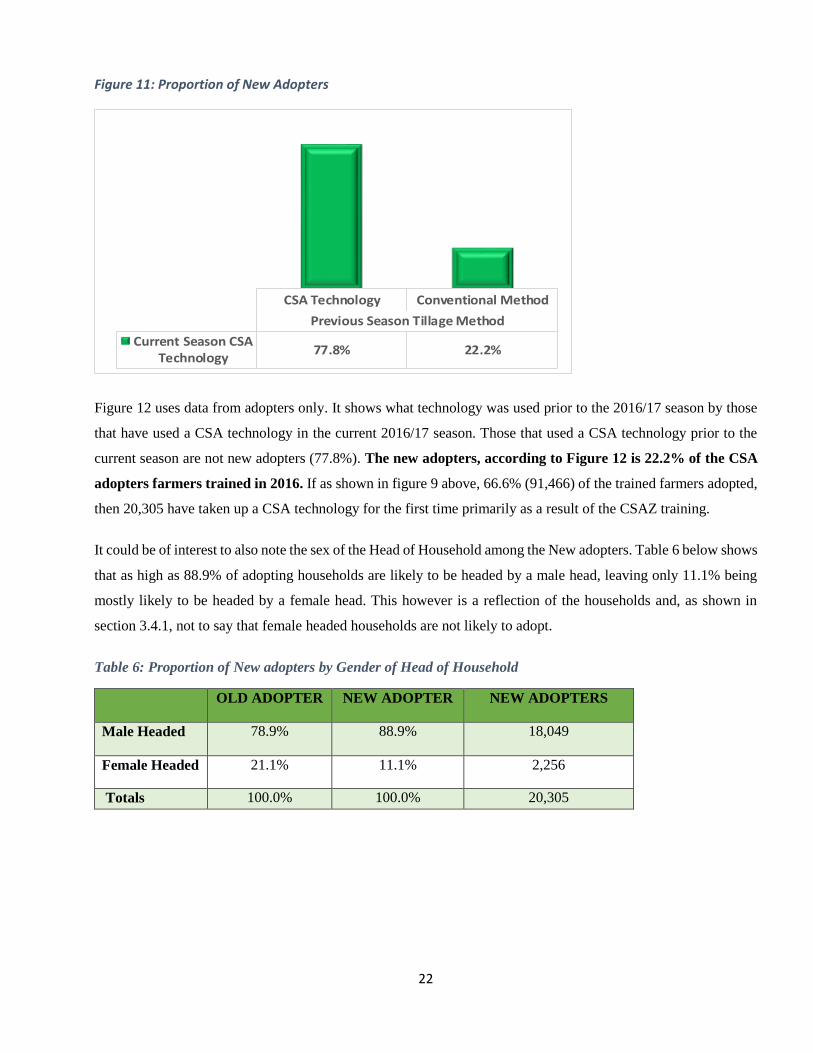
Figure 11: Proportion of New Adopters
Figure 12 uses data from adopters only. It shows what technology was used prior to the 2016/17 season by those
that have used a CSA technology in the current 2016/17 season. Those that used a CSA technology prior to the
current season are not new adopters (77.8%). The new adopters, according to Figure 12 is 22.2% of the CSA
adopters farmers trained in 2016. If as shown in figure 9 above, 66.6% (91,466) of the trained farmers adopted,
then 20,305 have taken up a CSA technology for the first time primarily as a result of the CSAZ training.
It could be of interest to also note the sex of the Head of Household among the New adopters. Table 6 below shows
that as high as 88.9% of adopting households are likely to be headed by a male head, leaving only 11.1% being
mostly likely to be headed by a female head. This however is a reflection of the households and, as shown in
section 3.4.1, not to say that female headed households are not likely to adopt.
Table 6: Proportion of New adopters by Gender of Head of Household
OLD ADOPTER NEW ADOPTER NEW ADOPTERS
Male Headed 78.9% 88.9% 18,049
Female Headed 21.1% 11.1% 2,256
Totals 100.0% 100.0% 20,305
CSA Technology Conventional Method
Previous Season Tillage Method
Current Season CSATechnology
77.8% 22.2%

23
3.3.3 Tillage Methods Used by Adopters.
Figure 13 shows the type of tillage used by the adopters. Animal ripping (summing own and hired animals) is the
most popular (52.5% of adopters) among farmers adopting the CF MT promoted technologies, followed by Basins
(45.5%). More needs to be done to promote CF mechanised MT (both hired tractor and own tractor) which still
stands at a combined total of only 2. 0% of adopters. The fact however, is that Mechanised tillage is a resource
(financial) hungry practice and simple rural farmers are still a long way in affording this tillage method.
As done in section 3.3.3 above, we also looked at the gender of the household head and tillage method used. Table
7 shows that among the 20,305 new adopters, 52.4% were most likely to be male headed households and adopted
using ADP or mechanised minimum tillage. Again, investigations into whether the sex of the household head
affects the choice of tillage methods revealed that there is no evidence to suggest that tillage type is dependent on
gender of HH head. This is an issue dealt with in section 3.4.1 beolw.
Table 7: Gender of Head of Household and tillage method used.
ADP/Mechanised Basins
Male Headed 10,637 52.40% 7,414 36.50%
Female Headed 746 3.70% 1,508 7.40%
Total 11,383 56.10% 8,922 43.90%
BasinsADP Ripping
- Ownanimals
ADP Ripping- Hiredanimals
TractorRipping -
Own Tractor
TractorRipping -
Hired Tractor
OLD ADOPTER 45.9% 41.1% 10.8% .4% 1.7%
NEW ADOPTER 43.9% 34.8% 19.7% 0.0% 1.5%
ALL ADOPTERS 45.5% 39.7% 12.8% .3% 1.7%
Figure 12: Tillage Methods employed by Adopters

24
3.3.4 Reasons for Non-adoption.
Focus Group discussions as well as interviews with Farmer Coordinators helped in shedding light on the reasons
behind lack of adoption. In the first place, the 2016/17 season was a very unique season. Rainfall was heavy and
non-stop at times. This lead to rapid weed encroachment and CF MT technologies just became difficult for first
year adopters. Land preparation may have been done using a CF hoe or ADP MT practices (as in Kalukwembe,
Vubwi, Eastern Region) but a combination of delayed access to inputs, too much rains and poor access to
herbicides just led farmers to give up and turn over their whole CF plots with ridgers.
A second major reasons for non-adoption concerns “myths” about CF adoption. There are myths to the effect that:
CF increases weed pressure.
Good soil lies under the surface and have to be “brought up” and made accessible to plants by turning the
soil over with a plough. Hence would not feel they had cultivated their land if they did not plough.
Plants will not do well if a ridger or cultivator are not used, hence you may rip but you have to later on
ridge up.
Yet another reason lies in the CFU’s perceived over emphasis on mechanized tillage. Some FCs feel that the CFU
should not be placing too much emphasis on mechanized tillage at the expense of ADP. There could in fact be a
gain in number of adopters if more efforts are put in the more available animal ripping by ensuring there are rippers
available for purchase. As it stands, there has not been a very elaborate effort by the project to avail rippers. In
Chisamba (Mpika and Bulemu villages) there are large areas with only two Magoye rippers and where farmers
have animals for draft power, they would not easily take up to basins when rippers could have done a more
acceptable job.
Basin tillage method seems to be a last resort for new adopters, mostly the marginally resourced households. Some
find the Chaka hoe too heavy, while some are discouraged by seemingly successful local conventional farming
“models” who tell them that on the contrary the secret behind successful farming is not the “poor person’s” basin
but sufficient resources. New basin-would-be-adopters soon have weeds to contend with and are easily convinced
that the “basin experiment” is an exercise in futility.
3.4 Investigating Adoption
There is now need to focus on some possible variables that we could expect to be associated with adoption status.
In this study, we focus on Sex of HH head, HH labour Size, and ownership of draft power. For the benefit of
readers with not much background in statistics, more emphasis will be put on the first association, Sex of HH head.
25
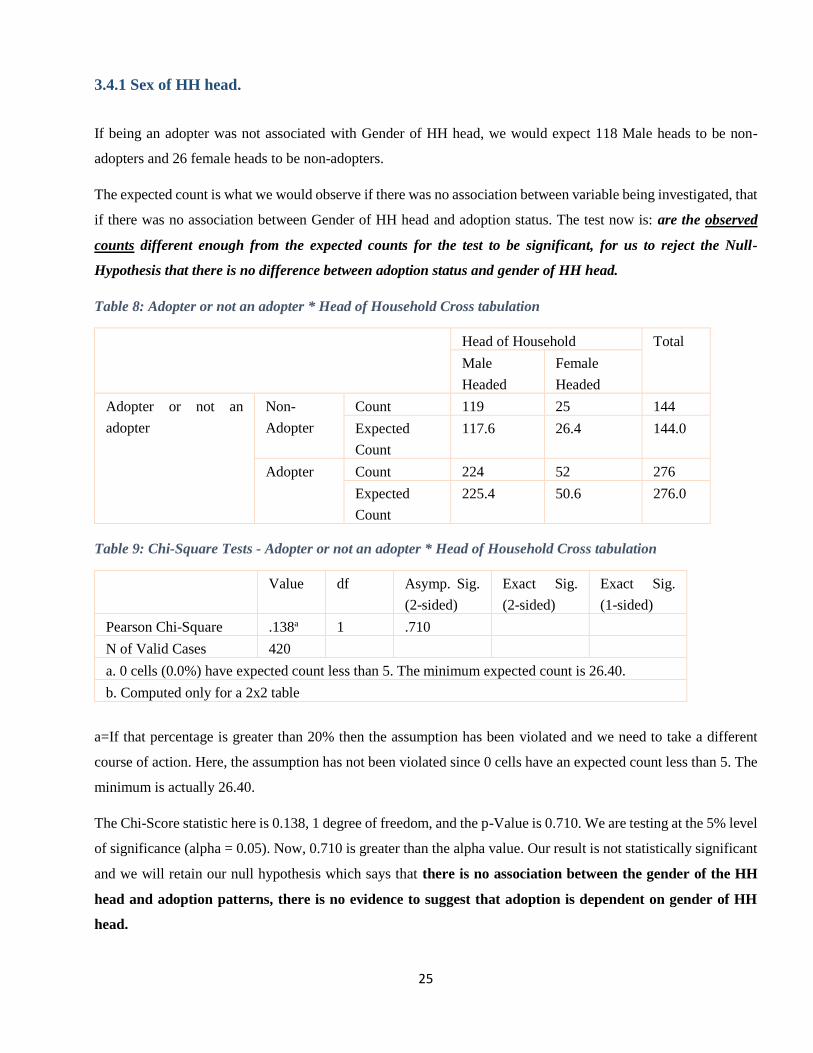
3.4.1 Sex of HH head.
If being an adopter was not associated with Gender of HH head, we would expect 118 Male heads to be non-
adopters and 26 female heads to be non-adopters.
The expected count is what we would observe if there was no association between variable being investigated, that
if there was no association between Gender of HH head and adoption status. The test now is: are the observed
counts different enough from the expected counts for the test to be significant, for us to reject the Null-
Hypothesis that there is no difference between adoption status and gender of HH head.
Table 8: Adopter or not an adopter * Head of Household Cross tabulation
Head of Household Total
Male
Headed
Female
Headed
Adopter or not an
adopter
Non-
Adopter
Count 119 25 144
Expected
Count
117.6 26.4 144.0
Adopter Count 224 52 276
Expected
Count
225.4 50.6 276.0
Table 9: Chi-Square Tests - Adopter or not an adopter * Head of Household Cross tabulation
Value df Asymp. Sig.
(2-sided)
Exact Sig.
(2-sided)
Exact Sig.
(1-sided)
Pearson Chi-Square .138a 1 .710
N of Valid Cases 420
a. 0 cells (0.0%) have expected count less than 5. The minimum expected count is 26.40.
b. Computed only for a 2x2 table
a=If that percentage is greater than 20% then the assumption has been violated and we need to take a different
course of action. Here, the assumption has not been violated since 0 cells have an expected count less than 5. The
minimum is actually 26.40.
The Chi-Score statistic here is 0.138, 1 degree of freedom, and the p-Value is 0.710. We are testing at the 5% level
of significance (alpha = 0.05). Now, 0.710 is greater than the alpha value. Our result is not statistically significant
and we will retain our null hypothesis which says that there is no association between the gender of the HH
head and adoption patterns, there is no evidence to suggest that adoption is dependent on gender of HH
head.

26
3.4.2 HH Labour Size.
Here we raise the question whether or not a household’s labour size affects adoption status. The Chi-Square
table is presented in Table 9 below.
Table 10: Chi-Square Tests - HH Labour Size.
Value df Asymp. Sig.
(2-sided)
Pearson Chi-Square .374a 2 .829
N of Valid Cases 446
Once more, HH labour size was not associated with a household’s adoption or lack of it. The Chi-Square statistic
is 0.374. The p-value is 0.829. Hence the result is not significant and we will retain our null hypothesis which says
that there is no association between the household’s labour size and adoption patterns, there is no evidence
to suggest that adoption is dependent on household’s labour size.
3.4.3 HH Ownership of Potential Animals for Draft Power.
Finally, we investigate the possible relationship between availability of draft power within the HH and its
subsequent adoption status. The Chi-Square table is presented in Table 10 below.
Table 11: Chi-Square Tests - HH Ownership Draft Power.
Value df Asymp. Sig.
(2-sided)
Pearson Chi-Square 2.048a 2 .359
N of Valid Cases 446
Again, presence of animal draft power in a household was not associated with a household’s adoption or lack of
it. The Chi-Square statistic is 2.048. The p-value is 0.359. Hence the result is not significant and we will retain our
null hypothesis which says that there is no association between the presence of animal draft power in a
household and adoption patterns, there is no evidence to suggest that adoption is dependent presence of
animal draft power in a household.
3.5 Other Adoption Considerations
The discussion on adoption will now be wrapped up by focusing on other key issues that are of interest to
adoption of CSAZ technologies. These are timeliness in accessing inputs, sources of inputs, timeliness in
planting, weed management and herbicide usage.

27
3.5.1 Timeliness in Accessing Inputs
In order for farmers to optimize their fertilizer it means they needed to have acquired fertilizer prior to the first
planting rains. The survey sought to find out when these farmers accessed their inputs from whichever source and
tried to determine if they were sticking to what CFU teaches to help them adopt CF and have good results viz
yields.
Figure 13: Timeliness in Accessing Inputs
It is therefore encouraging to see from Figure 14 that 59.1% of the new adopters adhered to the CF teaching by
accessing their inputs early (between June 2016 and November 2016). Another 25.8% accessed inputs within a
reasonably acceptable time period of early December but this could be considered as heading towards being late.
3.5.2 Sources of Inputs
One of the requirements on the log-frame is to report on in-community agents and although this report does not
touch on how many they are out there, it helps us see that they exist and how much farmers are relying on them.
The list of inputs that farmers purchased and reported was quite varied but for the sake of this study, 4 inputs have
been reported on. The item of interest here is the in-community agents and probably recycled seed and the next
section focuses on those two.
Timely Access
Use of Seedfrom Harvest
Notrecommended
Acceptable -Towards being
late
Not Acceptable -very late
Long before -Risk degradation
OLD ADOPTER 67.1% 16.4% 9.3% 6.7% .4%
NEW ADOPTER 59.1% 25.8% 10.6% 4.5% 0.0%
TOTAL 65.3% 18.6% 9.6% 6.2% .3%
28
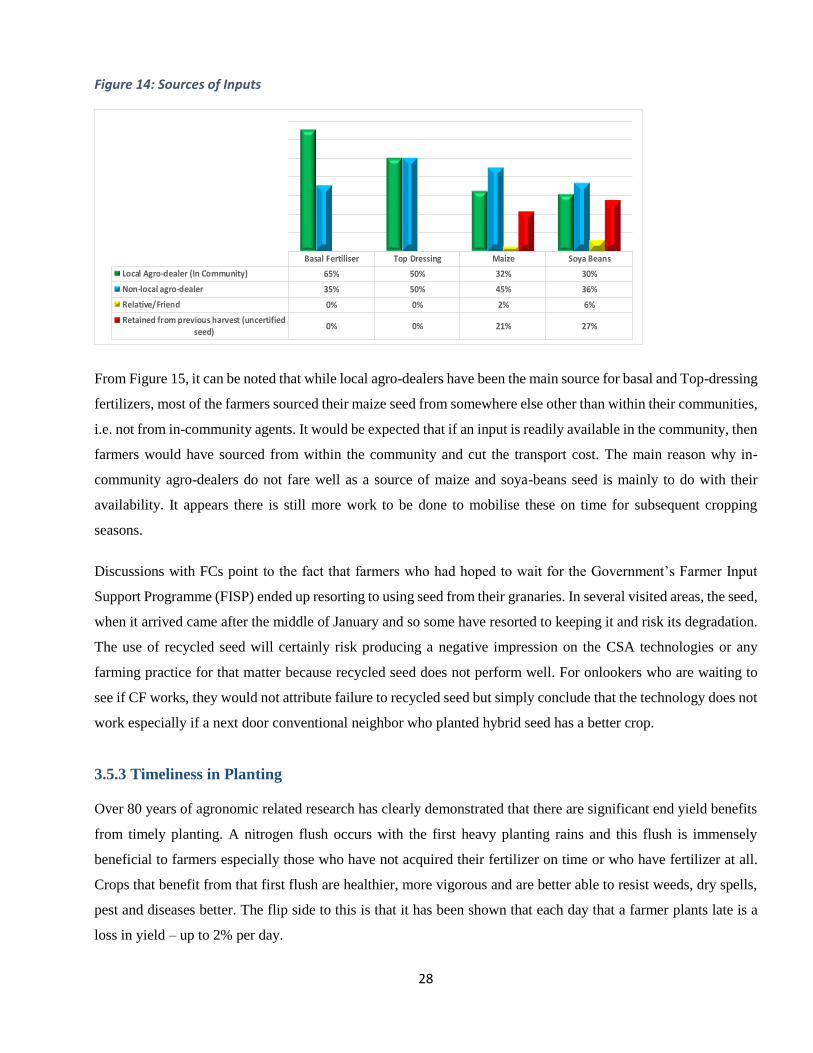
Figure 14: Sources of Inputs
From Figure 15, it can be noted that while local agro-dealers have been the main source for basal and Top-dressing
fertilizers, most of the farmers sourced their maize seed from somewhere else other than within their communities,
i.e. not from in-community agents. It would be expected that if an input is readily available in the community, then
farmers would have sourced from within the community and cut the transport cost. The main reason why in-
community agro-dealers do not fare well as a source of maize and soya-beans seed is mainly to do with their
availability. It appears there is still more work to be done to mobilise these on time for subsequent cropping
seasons.
Discussions with FCs point to the fact that farmers who had hoped to wait for the Government’s Farmer Input
Support Programme (FISP) ended up resorting to using seed from their granaries. In several visited areas, the seed,
when it arrived came after the middle of January and so some have resorted to keeping it and risk its degradation.
The use of recycled seed will certainly risk producing a negative impression on the CSA technologies or any
farming practice for that matter because recycled seed does not perform well. For onlookers who are waiting to
see if CF works, they would not attribute failure to recycled seed but simply conclude that the technology does not
work especially if a next door conventional neighbor who planted hybrid seed has a better crop.
3.5.3 Timeliness in Planting
Over 80 years of agronomic related research has clearly demonstrated that there are significant end yield benefits
from timely planting. A nitrogen flush occurs with the first heavy planting rains and this flush is immensely
beneficial to farmers especially those who have not acquired their fertilizer on time or who have fertilizer at all.
Crops that benefit from that first flush are healthier, more vigorous and are better able to resist weeds, dry spells,
pest and diseases better. The flip side to this is that it has been shown that each day that a farmer plants late is a
loss in yield – up to 2% per day.
Basal Fertiliser Top Dressing Maize Soya Beans
Local Agro-dealer (In Community) 65% 50% 32% 30%
Non-local agro-dealer 35% 50% 45% 36%
Relative/Friend 0% 0% 2% 6%
Retained from previous harvest (uncertifiedseed)
0% 0% 21% 27%

29
Figure 15: Timeliness in Planting
Again, it is inspiring to see that 72.3% of the new adopters have observed the CFU’s teaching by planting with the
first planting rains in their respective areas. This is not very different from the old adopters even though more new
adopters (23.1%) than old adopters are more likely to plant after the second week of December and hence towards
being really late. The main concern remains with the 1.7% old adopters and the 4.6% new adopters who planted
from January 2017 onwards. Some of these were waiting for Government inputs but some simply were simply
enticed by rains that kept falling and thought they could still grow more crops.
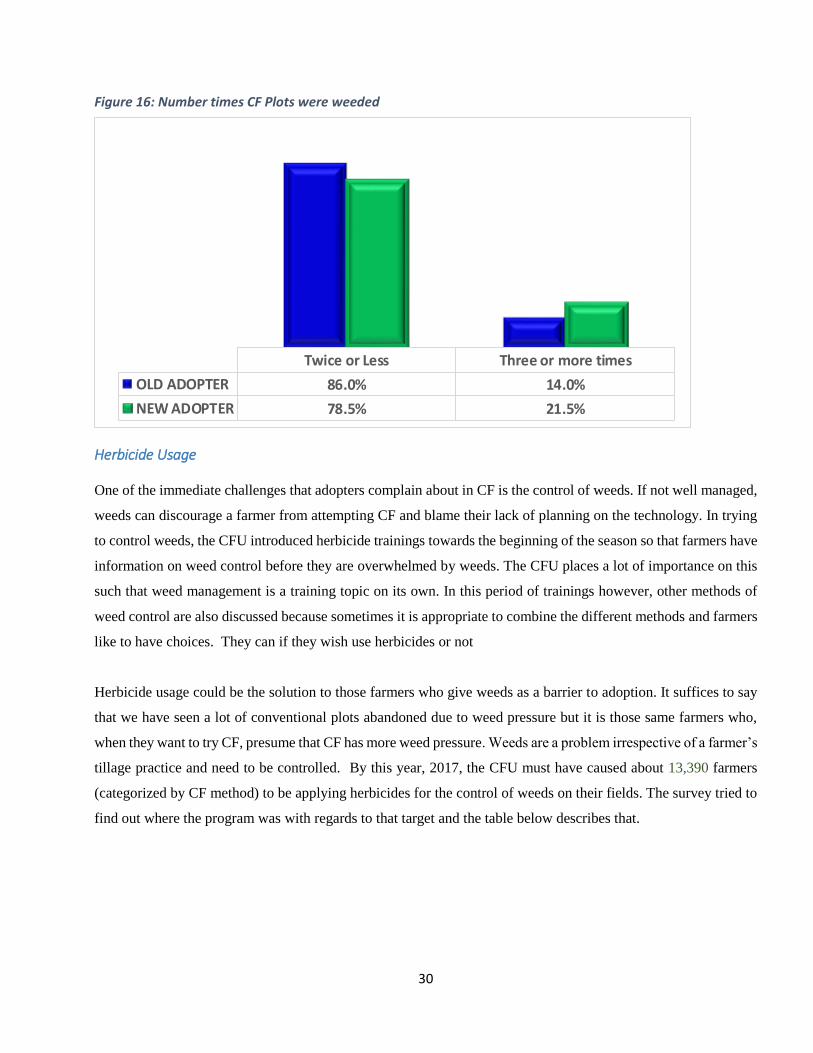
3.5.4 Weed Management and Herbicide Usage.
Number of Times Weeded Plots
Most farmers who have been trained but did not adopt have cited weed pressure as the number one reason for not
adopting. They agree that the technology works if only they can get rid of the weeds. A lot of fields have been
neglected or ploughed over because of failure to control weeds. Weed control is critical in any crop field regardless
of tillage type because it greatly affects yield. All these factors pose a risk to CF seemingly not being effective.
In the FGD mentioned above, the fear for weeds is cited as one of the reasons for not adopting the technology.
Weeding frequency was therefore an important question for the respondents in trying to understand how big a
problem weed management is. The question was how many times CF household plots had been weeded during the
last season in trying to establish if trained farmers were giving this important topic the attention it deserved. Figure
17 shows the results. It is not very clear why farmers weeded their crops on such a few number of times, only
21.5% new adopters are more likely to have weeded three or more times.
Timely PlantingAcceptable - But
towards being lateNot Acceptable - very
late
OLD ADOPTER 77.9% 20.3% 1.7%
NEW ADOPTER 72.3% 23.1% 4.6%
30
Herbicide Usage
One of the immediate challenges that adopters complain about in CF is the control of weeds. If not well managed,
weeds can discourage a farmer from attempting CF and blame their lack of planning on the technology. In trying
to control weeds, the CFU introduced herbicide trainings towards the beginning of the season so that farmers have
information on weed control before they are overwhelmed by weeds. The CFU places a lot of importance on this
such that weed management is a training topic on its own. In this period of trainings however, other methods of
weed control are also discussed because sometimes it is appropriate to combine the different methods and farmers
like to have choices. They can if they wish use herbicides or not
Herbicide usage could be the solution to those farmers who give weeds as a barrier to adoption. It suffices to say
that we have seen a lot of conventional plots abandoned due to weed pressure but it is those same farmers who,
when they want to try CF, presume that CF has more weed pressure. Weeds are a problem irrespective of a farmer’s
tillage practice and need to be controlled. By this year, 2017, the CFU must have caused about 13,390 farmers
(categorized by CF method) to be applying herbicides for the control of weeds on their fields. The survey tried to
find out where the program was with regards to that target and the table below describes that.
Figure 16: Number times CF Plots were weeded
Twice or Less Three or more times
OLD ADOPTER 86.0% 14.0%
NEW ADOPTER 78.5% 21.5%

31
Figure 17: Proportion of farmers using Herbicides
Figure 18 shows that almost 39% (38.5%) of the old adopters used herbicides on their CF plots while only 36.4%
(7,391) among the new adopters are likely to have used herbicides. This shows that although some of our adopters
are using herbicides, there is still room for improvement. Since the 2017 milestone was 13,390 against an
achievement of only 7,391 new adopters. The low percentage (36.4%) of herbicide users could be attributed to
several factors. In the first place, the private sector/ agro-dealers have not really moved in sync with the trainings
and hence in several places respondents reported that herbicides were not available locally. Secondly, new and
small holder farmers are yet to be convinced that it is cheaper to use herbicides than weed mechanically. The
survey also discovered a myth around herbicide usage, that herbicides are harmful/poisonous to soil nutrients and
would eventually affect crop productivity. This implies that there are still doubts around herbicide usage and hence
the teachings have not been well appreciated.
OLD ADOPTER NEW ADOPTER
Yes 38.5% 36.4%
No 61.5% 63.6%
32
4.0 Conclusions, Lessons Learnt, and Recommendations.
4.1 Conclusions
This subsection focusses on drawing out conclusions that can furnish us with values for indicators to with adoption.
With reference to the output indicators in the CSAZ Lofgrame, from survey findings we can conclude that:
Output indicator 1.1: Since 22.2% of the trained adopters were new adopters, the number of farmers
who have adopted climate smart agricultural practices for the first time stands at 20,305 farmers (22.2%
of the 91,466 adopters.)1 This is 102% of the target for Year 1. Farmers have adopted CF MT CSA on at
least one of their farm plots. Adoption for year one under the CSA is defined as sustained minimum tillage.
Output indicator 1.2: From the TSP survey, the recorded number active TSPs in the 2016/17 season was
125 and the average Hectarage per TSP mechanised was 83.24ha. Hence the hectares under MT, CT and
CF 10,405 hectares. This has been computed from Mechanised tillage only since in year 1 there has not
been efforts to have non-Mechanised tillage plot size measured from the inherited M&E Systems.
Output indicator 1.3: The number of farmers using ADP and mechanised tillage service. For year one,
this will have to be extrapolated from survey findings. Around 54.5% of all adopting farmers pointed out
that they used either ADP or Mechanised tillage. This translates to 16,352 farmers against a target of 8,500
farmers. If we, however, focus only on NEW adopters, the dataset shows that up to 56.1% of the new
adopters used either ADP or mechanised tillage. This translates to 11,383 new adopters (134% of the
targeted 8,500 farmers).
Output indicator 1.4: Approximately 38.0% of adopters (or 34,757 farmers) used herbicides for weed
control purposes. These farmers fall in different categories of climate smart tillage practices and use
herbicides at different levels as required and as resources allow them to do so. If, however we focus only
on NEW adopters, the figure drops to 36.4% of the new adopters (or 7,391 farmers). In comparison with
the Year 1 target of 13,390 the target was achieved by 55.2%.
Output indicator 3.1: The total number of service providers offering mechanized tillage services and
ADP tillage services in Year 1 is 125 and this is around 31.3% of the set target of 400 TSPs. Note that this
figure is only for Mechanised TSPs as ADP service providers have not been deliberately quantified (an
exercise that should be considered for Year 2).
1 Adopters were 66.6% of the 137,336 trained farmers. This is equal to 91,466 farmers.

33
4.2 Lessons Learnt
Two major lessons clearly emerge from what has been observed among adopters. These are:
Training of farmers is not the panacea to adoption. There is need to create enabling linkages with other
critical stakeholders in order to facilitate access to other essentials without which the full potential of
technologies in the CSA production chain cannot be unlocked. Such stakeholders include suppliers of
rippers, herbicides (and agro-dealers in general), as well as mechanised tillage.
To each and every fledgling CSA adopter is stronger and persuasive (and albeit seemingly successful)
conventional farmer. There is need to drum up constant presence and moral support to would-be
adopters as the initial period of adoption can present them with constant threat of failure as they may not
have much to show apart from fields overgrown with weeds while the conventional farmer near them
boasts of an apparently good crops.
Correct identification of intrinsically motivated and capable Farmer Coordinators (Lead farmers) is the
key to assuring the constant support observed in lesson two above.
Effecting long systemic change and to scale required an approach that attacked the problem across a broad
front, using multiple long term strategies - a long term (2-4 years) and intense field based continuum of
training, follow up, in-field coaching and feedback, replicated across training periods. Extending CF is an
intensive, dirty hands-on, demonstrate, methodical process.
The only way new and some old field staff were going to improve their training delivery skills and the
way they managed other key field activities such as field days was through constant in-field coaching and
follow ups by senior field managers and the CSAZ Programme Manager.
34
4.3 Recommendations
The survey findings led us to the following recommendations:
1. CFU needs to take necessary steps and increase the number of ripper suppliers and also bring them as
close as possible to the farmers. It is not effective programming to have farmers that are willing to adopt
and even purchase rippers, but fail to do so because there are not enough rippers suppliers within their
proximity.
2. Much as mechanized tillage should continue to be encouraged, emphasis must also be placed on ADP
because most CSAZ trained farmers are small scale and although some can hire tractors for ripping, many
of them do not have sufficient financial resources to meet the demands of mechanised TSP, and would
resort to ADP. The other reason is that there are few Mechanised TSPs but animal draught is more readily
available in many areas and in larger numbers.
3. The In-Community Agro-dealers need to be encouraged to have the required inputs (stocks) readily
available and in the right amounts way before the season commences. Encourage more spread of the In-
Community Agro-dealers through private sector partnerships.
4. A survey similar to the one that was conducted for TSPs can be conducted to check the number of In-
Community sales agents (Log-frame target of 160) and find ways of pushing the number up.
5. Plot sizes (Hectarage) need to be established as part of the on-going FC support to farmers and records
kept for both plot sizes and quantities of agriculture inputs planted on respective plots. Without this, future
computation of yields will remain a thumb-sucking exercise.


![assets.unilogcorp.com...2] 3] [37 8] [33 0 0] 3 [25. WIRE CATALOG CSBI csal csal 15GY CSB 1 sw csal csal 1 sow csai csal csaa 15 CSB21S1 csaz SCY csamsw csaa csaa 1 sow csaz 1 SAL](https://cdn.vdocuments.net/doc/165x107/609354a1419b211f1f7e02a0/-2-3-37-8-33-0-0-3-25-wire-catalog-csbi-csal-csal-15gy-csb-1-sw-csal.jpg)
