
Diabetic Retinopathy Predicts All-CauseMortality and Cardiovascular Events inBoth Type 1 and 2 DiabetesMeta-analysis of observational studies
CAROLINE K. KRAMER, MD, PHD
TICIANA C. RODRIGUES, MD, PHD
LUIS H. CANANI, MD, PHD
JORGE L. GROSS, MD, PHD
MIRELA J. AZEVEDO, MD, PHD
OBJECTIVE—The prognostic significance of diabetic retinopathy (DR) for death and cardio-vascular (CV) outcomes is debated. We investigated the association of DR with all-cause mor-tality and CV events in patients with diabetes by a systematic review and meta-analysis.
RESEARCHDESIGNANDMETHODS—The electronic databases Medline and Embasewere searched for cohort studies that evaluated DR in type 2 or type 1 diabetic patients andreported total mortality and/or fatal and nonfatal CV events, including myocardial infarction,angina pectoris, coronary artery bypass graft, ischemic changes on a conventional 12-lead elec-trocardiogram, transient ischemic attack, nonfatal stroke, or lower leg amputation. Data extrac-tion was performed by two reviewers independently. Pooled effect estimates were obtained byusing random-effects meta-analysis.
RESULTS—The analysis included 20 studies that fulfilled the inclusion criteria, providing datafrom 19,234 patients. In patients with type 2 diabetes (n = 14,896), the presence of any degree ofDR increased the chance for all-cause mortality and/or CV events by 2.34 (95% CI 1.96–2.80)compared with patients without DR. In patients with type 1 diabetes (n = 4,438), the corre-sponding odds ratio was 4.10 (1.50–11.18). These associations remained after adjusting fortraditional CV risk factors. DR was also predictive of all-cause mortality in type 2 diabetes (oddsratio 2.41 [1.87–3.10]) and type 1 diabetes (3.65 [1.05–12.66]).
CONCLUSIONS—The presence of DR was associated with an increased risk of all-causemortality and CV events in both type 2 and type 1 diabetic patients.
Diabetes Care 34:1238–1244, 2011
D iabetic retinopathy (DR) is a com-mon chronic microvascular diabe-tes complication. Approximately
29% of U.S. adults with type 2 diabeteshave DR (1), whereas DR will develop in95% of type 1 diabetic individuals duringtheir lifetime (2). DR has been associatedwith increased all-cause and cardiovascu-lar (CV) mortality risk in both type 2 andtype 1 diabetes (3–7). Associations withDR have been more extensively evaluatedin type 2 diabetes, whereas studies intype 1 diabetes are scarce.
Considering these data, identificationof DR could possibly add to the diabeticpatient’s CV risk stratification. Further-more, the fundus examination is inex-pensive and is routinely performed forthe screening of chronic diabetes compli-cations. Therefore, it is worthwhile tocomprehensively review data on the pre-dictive role of DR. The aim of the currentstudy was to investigate the associationof DR with all-cause mortality and CVevents (fatal and nonfatal) in type 2 andtype 1 diabetic patients by a systematic
review and meta-analysis of cohortstudies.
RESEARCH DESIGN ANDMETHODS
Data sources and searchesThe electronic databases (beginning in1950 until July 2010) Medline andEmbase were searched for the medicalsubject headings (MeSH) “Diabetic Reti-nopathy” and “mortality” or “cardiovascu-lar disease” to identify observationalstudies that report the incidence of all-cause mortality, and fatal and nonfatalCV events in diabetic patients whose DRwas evaluated (regardless of the language).
Study selectionStudies were considered eligible for in-clusion if they fulfilled the following in-clusion criteria:
1. presented original data of prospective,observational studies;
2. evaluated the presence of DR, definedas any degree and/or severity accord-ing to well-validated scales, such as theEarly Treatment Diabetic RetinopathyStudy severity scale (8), in type 2 ortype 1 diabetic patients; and
3. reported all-cause mortality and/orfatal or nonfatal CV events.
When studies reported more thanone outcome separately, only all-causemortality data were included. Fatal andnonfatal CV events were defined as apositive medical history of a CV event,including death due to CV disease and/orany of the following: myocardial infarc-tion, angina pectoris, coronary arterybypass graft, ischemic changes on a con-ventional 12-lead electrocardiogram,transient ischemic attack, nonfatal stroke,or lower leg amputation.
Data extraction and qualityassessmentData were extracted independently bytwo investigators with an agreement value
c c c c c c c c c c c c c c c c c c c c c c c c c c c c c c c c c c c c c c c c c c c c c c c c c
From theDivision of Endocrinology,Hospital de Clínicas de Porto Alegre, Universidade Federal do RioGrandedo Sul, Porto Alegre, Rio Grande do Sul, Brazil.
Corresponding author: Caroline K. Kramer, [email protected] 13 January 2011 and accepted 19 February 2011.DOI: 10.2337/dc11-0079This article contains Supplementary Data online at http://care.diabetesjournals.org/lookup/suppl/doi:10.
2337/dc11-0079/-/DC1.© 2011 by the American Diabetes Association. Readers may use this article as long as the work is properly
cited, the use is educational and not for profit, and thework is not altered. See http://creativecommons.org/licenses/by-nc-nd/3.0/ for details.
1238 DIABETES CARE, VOLUME 34, MAY 2011 care.diabetesjournals.org
R e v i e w s / C o m m e n t a r i e s / A D A S t a t e m e n t sM E T A - A N A L Y S I S

of k = 96%. Disagreements were resolvedby a third author.
Extracted data included the clinicalcharacteristics of participants, study de-sign, and follow-up, assessment of DR,and the number of participants who hadthe outcome according to DR status.Numeric data reported in the articleswere used. In the few studies not report-ing these data, risk estimates were calcu-lated from the survival curves.
The Newcastle-Ottawa Scale for as-sessing quality of nonrandomized studiesin meta-analysis was used (9).
Data synthesis and analysisAn overall odds ratio (OR) was calculatedto assess the predictive value of DR forall-cause mortality and/or CV events (com-posite outcome). DR was evaluated eitheras “any degree” or “advanced DR” com-pared with the group without DR in anal-yses stratified by type of diabetes (type 1and type 2). Advanced DR was defined asthe most severe category of DR described:proliferative DR, severe nonproliferativeDR, sight-threatening DR, or any combina-tion of these categories.
The Cochran x2 and the I2 tests wereused to evaluate heterogeneity amongstudies and a threshold value of P = 0.10was considered significant (10). The riskestimates were obtained with random-effects meta-analysis because a significantheterogeneity was found among studiesin preliminary models.
Meta-regression analyses were usedto investigate potential sources of hetero-geneity. The factors investigated were age,male sex, proportion of smokers, A1C test,and follow-up period (previously chosenbased on their biologic relevance). In ameta-regression analysis of type 1 diabetes,only follow-up and A1C tests were in-cluded because the number of studieslimited a broader evaluation of potentialconfounders. A sensitivity analysis includ-ing only all-causemortality as an end pointwas performed to minimize the influenceof CV risk factors as potential confounders.
Receiver operating characteristic(ROC) curves were constructed to obtainthe pooled estimates of sensitivity andspecificity of DR for the development ofoutcomes. The average likelihood ratio ofthe positive and negative test result wascalculated. For practical clinical purposes,the post-test probability of the outcomewas estimated using the Bayes normo-gram, considering the pretest probabilityas the mean proportion of the event in theincluded population (11).
The possibility of publication biaswas evaluated using a funnel plot of atrial’s effect size against the SE. Funnelplot asymmetry was evaluated by theBegg and Egger tests. The trim-and-fillcomputation was used to estimate the ef-fect of publication bias (12).
All statistical analyses were performedusing Stata 11.0 software (StataCorp,College Station, TX).
RESULTS
Literature search results and studycharacteristicsWe identified 3,180 studies in the data-base searches (Fig. 1). Among these stud-ies, 3,149 were excluded based on titleand abstract, leaving 31 studies for fur-ther evaluation. Of these, 11 studieswere excluded after full-text evaluation(Supplementary Table 1). A total of 20studies, comprising 19,234 patients, ful-filled our inclusion criteria and were in-cluded.
Table 1 summarizes the characteris-tics of the included studies. A total of 17studies with a mean follow-up of 8.95years evaluated type 2 diabetic patients(n = 14,896; mean age, 58.4 years) andfour studies with a mean follow-up of
12.37 years evaluated type 1 diabetic pa-tients (n = 4,438; mean age, 32.7 years).
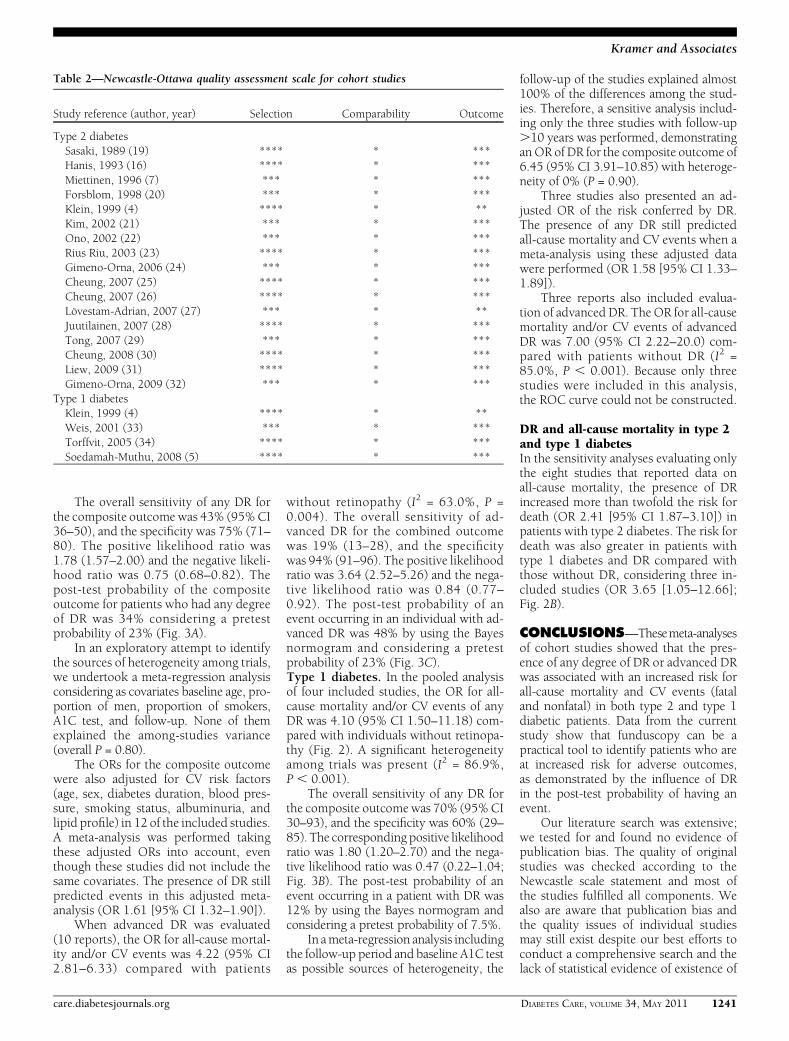
In accordance with the Newcastle-Ottawa quality assessment scale for co-hort studies, all studies achieved at leastsix stars, indicating an overall good qual-ity (Table 2). Funnel plots and the Eggerregression test suggested a borderlinesignificant asymmetry in the analysis oftype 2 diabetes (P = 0.10). However, thetrim-and-fill computation revealed thatthere were no missing trials, indicatingthat the publication bias did not interferewith the interpretation of the results.There were no publication biases in anal-ysis of type 1 diabetes in both tests (P =0.21).
DR and all-cause mortalityand/or CV eventsType 2 diabetes. In the pooled analysisof the 17 included studies, the OR for all-cause mortality and/or CV events of thepresence of DR was 2.34 (95% CI 1.96–2.80) compared with patients withoutDR (Fig. 2A). All but three studies reportedan increased risk for events. However, asignificant heterogeneity among the indi-vidual estimates was evident when themagnitude of the association was evalu-ated (I2 = 62.7%, P , 0.001).
Figure 1—Flow diagram shows the literature search to identify cohort studies that evaluated DRand all-cause mortality and/or CV events (fatal and nonfatal) of diabetic patients.
care.diabetesjournals.org DIABETES CARE, VOLUME 34, MAY 2011 1239
Kramer and Associates

Table
1—Su
mmaryof
cohort
stud
iesevalua
ting
theassociationbetweenDRan
dall-causemortalityan
d/or
CVevents
(nonfatalan
dfatal)in
patients
withtype
2an
dtype
1diab
etes
Author,year
Follo
w-up
(years)
Population*
(N)
DRevaluation
Age
(years)Men
(%)
A1C
test
(%)
Smok
ing
(%)
TC
(mg/dL)
SBP
(mmHg)
DBP
(mmHg)
Outcom
e(s)(n
events)
Typ
e2diabetes
Sasaki,1
989(19)
9.4
1,93
9Japanese
NA
53.0
62NA
NA
NA
NA
NA
All-cause
mortality(503
)Hanis,1
993(16)
8.0
321Mexican
Americans
Directandindirectop
hthalmoscopy
andfund
usph
otography
55.0
3710
.820
.320
814
380
All-cause
mortality(67)
Miettinen,1
996(7)
7.0
1,05
9Finnish
Ophthalmoscopy
aftermyd
riasis
58.0
549.7
18.0
258
NA
NA
CVDdeathor
nonfatal
myocardialinfarction
(255
)Fo
rsblom
,199
8(20)
9.0
131Europ
eans
Directop
hthalmoscopy
and
angiography
57.5
519.9
23.5
243
154
86All-cause
mortality(38)
Klein,1
999(4)
16.0
1,37
0AmericansIndirectop
hthalmoscopy
andfund
usph
otography
66.6
46.4
9.6
14.2
NA
147
79All-cause
mortality(1,052
)
Kim
,200
2(21)
2.3
365Koreans
afterPC
IDirectandindirectop
hthalmoscopy
60.5
64NA
34.0
NA
NA
NA
CVDdeath(5)
Ono,
2002
(22)
11.6
223Japanese
afterCABG
Indirectop
hthalmoscopy
,fund
us
photography,andangiograph
y60
.475
NA
50.0
192
NA
NA
All-cause
mortality(75)
RiusRiu,2
003(23)
6.3
176Sp
anish
NA
54.0
36.4
7.2
21.9
226
144
77Fatalandno
nfatalC
VD(28)
Gim
eno-Orna,
2006
(24)
8.0
458Sp
anish
Directandindirectop
hthalmoscopy
65.0
407.8
11.7
217
145
79All-cause
mortality(93)
Cheun
g,20
07(25)
7.8
1,61
7AmericansFu
ndu
sph
otography
60.0
47NA
16.0
207
NA
NA
Stroke
(75)
Cheun
g,20
07(26)
7.8
1,52
4AmericansFu
ndu
sph
otography
60.0
48NA
17.0
210
NA
NA
Fatalandno
nfatalC
VD(209
)Lö
vestam
-Adrian,
2007
(27)
10.0
363Sw
edish
Fundu
sph
otography
andindirect
ophthalm
oscopy
54.0
648.1
NA
NA
146
85All-cause
mortality(99)
Juutilainen,
2007
(28)
18.0
824Finnish
Indirectop
hthalmoscopy
58.0
4810
.016
.025
315
186
CVDdeath(558
)Ton
g,20
07(29)
3.4
4,41
6Chinese
Directandindirectop
hthalmoscopy
57.6
42.5
7.7
13.0
208
134
77All-cause
mortality(110
)Cheun
g,20
08(30)
9.0
1,02
1AmericansFu
ndu
sph
otography
60.0
476.6
44.0
208
NA
NA
Heartfailu
re(106
)Liew
,200
9(31)
12.0
199Australians
Fundu
sph
otography
.49
NA
NA
NA
NA
NA
NA
CVDdeaths(32)
Gim
eno-Orna,
2009
(32)
6.7
458Sp
anish
Directandindirectop
hthalmoscopy
65.0
407.8
NA
220
145
79Fatalandno
nfatalC
VD(176
)Typ
e1diabetes
Klein,1
999(4)
16.0
966Americans
Indirectop
hthalmoscopy
andfund
us
photography
29.3
51.4
10.8
24.6
NA
125
79All-cause
mortality(136
)
Weis,20
01(33)
14.0
147Australians
Directandindirectop
hthalmoscopy
32.3
5610
.819
.020
512
8.3
77All-cause
mortality(28)
Torffvit,20
05(34)
12.0
462Sw
edish
Fundu
sph
otography
and
ophthalm
oscopy
37.0
56.7
8.5
NA
NA
141
80Non
fatalC
VD(70)
Soedam
ah-M
uthu,
2008
(5)
7.0
2,78
7Europ
eansFu
ndu
sph
otography
32.16
508.4
NA
200
122
76All-cause
mortality(102
)CABG
,coron
aryartery
bypassgraftin
g;CVD,C
Vdisease;DBP
,diastolicbloo
dpressure;SBP
,systolic
bloo
dpressure;N
A,n
otavailable;PC
I,percutaneous
coronary
intervention
;TC,totalcholesterol.*Includ
edall
patientswho
completedthefollo
w-up.
1240 DIABETES CARE, VOLUME 34, MAY 2011 care.diabetesjournals.org
Diabetic retinopathy and mortality
The overall sensitivity of any DR forthe composite outcome was 43% (95%CI36–50), and the specificity was 75% (71–80). The positive likelihood ratio was1.78 (1.57–2.00) and the negative likeli-hood ratio was 0.75 (0.68–0.82). Thepost-test probability of the compositeoutcome for patients who had any degreeof DR was 34% considering a pretestprobability of 23% (Fig. 3A).
In an exploratory attempt to identifythe sources of heterogeneity among trials,we undertook a meta-regression analysisconsidering as covariates baseline age, pro-portion of men, proportion of smokers,A1C test, and follow-up. None of themexplained the among-studies variance(overall P = 0.80).
The ORs for the composite outcomewere also adjusted for CV risk factors(age, sex, diabetes duration, blood pres-sure, smoking status, albuminuria, andlipid profile) in 12 of the included studies.A meta-analysis was performed takingthese adjusted ORs into account, eventhough these studies did not include thesame covariates. The presence of DR stillpredicted events in this adjusted meta-analysis (OR 1.61 [95% CI 1.32–1.90]).
When advanced DR was evaluated(10 reports), the OR for all-cause mortal-ity and/or CV events was 4.22 (95% CI2.81–6.33) compared with patients
without retinopathy (I2 = 63.0%, P =0.004). The overall sensitivity of ad-vanced DR for the combined outcomewas 19% (13–28), and the specificitywas 94% (91–96). The positive likelihoodratio was 3.64 (2.52–5.26) and the nega-tive likelihood ratio was 0.84 (0.77–0.92). The post-test probability of anevent occurring in an individual with ad-vanced DR was 48% by using the Bayesnormogram and considering a pretestprobability of 23% (Fig. 3C).Type 1 diabetes. In the pooled analysisof four included studies, the OR for all-cause mortality and/or CV events of anyDR was 4.10 (95% CI 1.50–11.18) com-pared with individuals without retinopa-thy (Fig. 2). A significant heterogeneityamong trials was present (I2 = 86.9%,P , 0.001).
The overall sensitivity of any DR forthe composite outcomewas 70% (95%CI30–93), and the specificity was 60% (29–85). The corresponding positive likelihoodratio was 1.80 (1.20–2.70) and the nega-tive likelihood ratio was 0.47 (0.22–1.04;Fig. 3B). The post-test probability of anevent occurring in a patient with DR was12% by using the Bayes normogram andconsidering a pretest probability of 7.5%.
In ameta-regression analysis includingthe follow-up period and baseline A1C testas possible sources of heterogeneity, the
follow-up of the studies explained almost100% of the differences among the stud-ies. Therefore, a sensitive analysis includ-ing only the three studies with follow-up.10 years was performed, demonstratinganOR of DR for the composite outcome of6.45 (95% CI 3.91–10.85) with heteroge-neity of 0% (P = 0.90).
Three studies also presented an ad-justed OR of the risk conferred by DR.The presence of any DR still predictedall-cause mortality and CV events when ameta-analysis using these adjusted datawere performed (OR 1.58 [95% CI 1.33–1.89]).
Three reports also included evalua-tion of advanced DR. The OR for all-causemortality and/or CV events of advancedDR was 7.00 (95% CI 2.22–20.0) com-pared with patients without DR (I2 =85.0%, P , 0.001). Because only threestudies were included in this analysis,the ROC curve could not be constructed.
DR and all-cause mortality in type 2and type 1 diabetesIn the sensitivity analyses evaluating onlythe eight studies that reported data onall-cause mortality, the presence of DRincreased more than twofold the risk fordeath (OR 2.41 [95% CI 1.87–3.10]) inpatients with type 2 diabetes. The risk fordeath was also greater in patients withtype 1 diabetes and DR compared withthose without DR, considering three in-cluded studies (OR 3.65 [1.05–12.66];Fig. 2B).
CONCLUSIONS—Thesemeta-analysesof cohort studies showed that the pres-ence of any degree of DR or advanced DRwas associated with an increased risk forall-cause mortality and CV events (fataland nonfatal) in both type 2 and type 1diabetic patients. Data from the currentstudy show that funduscopy can be apractical tool to identify patients who areat increased risk for adverse outcomes,as demonstrated by the influence of DRin the post-test probability of having anevent.
Our literature search was extensive;we tested for and found no evidence ofpublication bias. The quality of originalstudies was checked according to theNewcastle scale statement and most ofthe studies fulfilled all components. Wealso are aware that publication bias andthe quality issues of individual studiesmay still exist despite our best efforts toconduct a comprehensive search and thelack of statistical evidence of existence of
Table 2—Newcastle-Ottawa quality assessment scale for cohort studies
Study reference (author, year) Selection Comparability Outcome
Type 2 diabetesSasaki, 1989 (19) **** * ***Hanis, 1993 (16) **** * ***Miettinen, 1996 (7) *** * ***Forsblom, 1998 (20) *** * ***Klein, 1999 (4) **** * **Kim, 2002 (21) *** * ***Ono, 2002 (22) *** * ***Rius Riu, 2003 (23) **** * ***Gimeno-Orna, 2006 (24) *** * ***Cheung, 2007 (25) **** * ***Cheung, 2007 (26) **** * ***Lövestam-Adrian, 2007 (27) *** * **Juutilainen, 2007 (28) **** * ***Tong, 2007 (29) *** * ***Cheung, 2008 (30) **** * ***Liew, 2009 (31) **** * ***Gimeno-Orna, 2009 (32) *** * ***
Type 1 diabetesKlein, 1999 (4) **** * **Weis, 2001 (33) *** * ***Torffvit, 2005 (34) **** * ***Soedamah-Muthu, 2008 (5) **** * ***
care.diabetesjournals.org DIABETES CARE, VOLUME 34, MAY 2011 1241
Kramer and Associates

bias. Another possible limitation is thatour adjusted meta-analyses undertakenwere not ideal because the authors of theoriginal studies used different statisticalmodels. However, we must take into ac-count that the potential confounders(covariates) were chosen in each originalstudy according to sample characteristics.
The development of DR has beenassociated with known risk factors forCV disease such as hypertension, hyper-glycemia, and albuminuria (2). Therefore,the association of DR with CV eventswould be expected, and one might thinkthat DR is just a marker of a worse clinical
status. However, in the meta-regressionanalyses, CV confounders did not explainthe between-studies variance, suggestingthat these risk factors do not fully accountfor the observed association. In parallel tothat, our results did not change when ad-ditional meta-analyses were performed,including only the studies where the riskdetermined by DR was adjusted for possi-ble confounders in both type 2 and type 1diabetes.
An important aspect that should beconsidered is that the therapeutic goalsin diabetes care have changed over time.The intensification of glycemic control in
patients with type 1 diabetes becamewidespread after the publication of theDiabetes Control and Complications Trialstudy in 1993 (13). In patients with type 2diabetes, a significant reduction in LDLcholesterol levels and blood pressurewere observed since 1990 (14). These is-sues might have influenced mortalityrates as well as the effects of risk factorsin our meta-analysis because the timelineof included studies ranged from the1960s to 2008. However, despite changesin goals to be achieved in patients withdiabetes, the mortality rate was compara-ble during the periods of 1971 through1986 and 1988 through 2000 (15). Inparallel to that, the timelines of includedstudies all overlapped.
Highlighting the importance of DRas a possible novel marker for events inpatients with diabetes is that DR wasstrongly associated with all-cause mortal-ity, beyond its association with CV events.In fact, CV disease was the cause of deathin less than 35% of individuals in most ofthe included studies (4,16), suggestingan additional mechanism by which thepresence of DR increases death. In thissense, the presence of autonomic neurop-athy could be a possible link between DRand CV events. Indeed, it was recentlydemonstrated that autonomous deregula-tion could lead to alterations in bloodpressure and cardiac rhythm, whichwere associated with DR (17,18).
In conclusion, the presence of DRwas associated with an increased riskfor all-cause mortality and CV events inboth type 2 and type 1 diabetes. Furtherstudies are needed to understand the roleof the inclusion of DR in mortality pre-diction scores as well as to understand thelink between death/CV events and DR,especially the all-cause mortality DR as-sociation.
Acknowledgments—This study was sup-ported in part by Conselho Nacional de De-senvolvimento Científico e Tecnológico grant576627/2008-9, Coordenação de Aperfeiçoa-mento de Pessoal de Nível Superior PNPD03021/09-2, andFundo de Incentivo a Pesquisa–Hospital de Clínicas de Porto Alegre, Brazil.No potential conflicts of interest relevant to
this article were reported.C.K.K. originated and designed the study,
acquired data, analyzed statistics, analyzedand interpreted data, drafted the manuscript,and critically revised the manuscript for im-portant intellectual content. T.C.R. acquireddata, analyzed and interpreted data, and crit-ically revised the manuscript for important
Figure 2—Meta-analyses of the association between presence of DR and (A) all-cause mortalityand/or CV events (fatal and nonfatal) and (B) all-cause mortality in both type 2 and type 1 di-abetic patients. (A high-quality color representation of this figure is available in the online issue.)
1242 DIABETES CARE, VOLUME 34, MAY 2011 care.diabetesjournals.org
Diabetic retinopathy and mortality

intellectual content. L.H.C. and J.L.G. ana-lyzed and interpreted data and critically re-vised themanuscript for important intellectualcontent. M.J.A. originated and designed thestudy, analyzed and interpreted data, andcritically revised the manuscript for importantintellectual content.
References1. Zhang X, Saaddine JB, Chou CF, et al.
Prevalence of diabetic retinopathy in theUnited States, 2005–2008. JAMA 2010;304:649–656
2. Fong DS, Aiello LP, Ferris FL 3rd, Klein R.Diabetic retinopathy. Diabetes Care 2004;27:2540–2553
3. Dinneen SF, Gerstein HC. The associationof microalbuminuria and mortality innon-insulin-dependent diabetes mellitus.A systematic overview of the literature.Arch Intern Med 1997;157:1413–1418
4. Klein R, Klein BE, Moss SE, CruickshanksKJ. Association of ocular disease and
mortality in a diabetic population. ArchOphthalmol 1999;117:1487–1495
5. Soedamah-Muthu SS, Chaturvedi N,Witte DR, Stevens LK, Porta M, FullerJH; EURODIAB Prospective Complica-tions Study Group. Relationship betweenrisk factors and mortality in type 1 diabeticpatients in Europe: the EURODIAB Pro-spective Complications Study (PCS). Di-abetes Care 2008;31:1360–1366
6. van Hecke MV, Dekker JM, StehouwerCD, et al.; EURODIAB prospective com-plications study. Diabetic retinopathy isassociated with mortality and cardiovas-cular disease incidence: the EURODIABprospective complications study. DiabetesCare 2005;28:1383–1389
7. Miettinen H, Haffner SM, Lehto S,Rönnemaa T, Pyörälà K, Laakso M. Reti-nopathy predicts coronary heart diseaseevents in NIDDM patients. Diabetes Care1996;19:1445–1448
8. Wilkinson CP, Ferris FL 3rd, Klein RE,et al.; Global Diabetic Retinopathy Project
Group. Proposed international clinicaldiabetic retinopathy and diabetic macularedema disease severity scales. Ophthal-mology 2003;110:1677–1682
9. Wells G, Shea B, O’Connell D, et al. TheNewcastle-Ottawa Scale (NOS) for assess-ing the quality of nonrandomised studiesin meta-analyses [Internet]. Ottawa Hos-pital Research Institute. Available fromhttp://www.ohri.ca/programs/clinical_epidemiology/oxford.asp. Accessed 2August 2010
10. Higgins JP, Thompson SG. Quantifyingheterogeneity in a meta-analysis. Stat Med2002;21:1539–1558
11. Fagan TJ. Letter: Nomogram for Bayestheorem. N Engl J Med 1975;293:257
12. Duval S, Tweedie R. Trim and fill: Asimple funnel-plot-based method of test-ing and adjusting for publication bias inmeta-analysis. Biometrics 2000;56:455–463
13. The Diabetes Control and Complica-tions Trial Research Group. The effect of
Figure 3—Bayes normogram for DR shows post-test probability of all-cause mortality and/or CV event in type 2 (A) and in type 1 (B) diabeticpatients with DR (upper line) and without DR (lower line). C: Nomogram is shown for advanced DR in type 2 diabetic patients.
care.diabetesjournals.org DIABETES CARE, VOLUME 34, MAY 2011 1243
Kramer and Associates
intensive treatment of diabetes on thedevelopment and progression of long-term complications in insulin-dependentdiabetes mellitus. N Engl J Med 1993;329:977–986
14. Preis SR, Pencina MJ, Hwang SJ, et al.Trends in cardiovascular disease risk fac-tors in individuals with and without di-abetes mellitus in the Framingham HeartStudy. Circulation 2009;120:212–220
15. Gregg EW, Gu Q, Cheng YJ, Narayan KM,Cowie CC. Mortality trends in men andwomen with diabetes, 1971 to 2000. AnnIntern Med 2007;147:149–155
16. Hanis CL, Chu HH, Lawson K, et al. Mor-tality of Mexican Americans with NIDDM.Retinopathy and other predictors in StarrCounty, Texas. Diabetes Care 1993;16:82–89
17. Ayad F, Belhadj M, Pariés J, Attali JR,Valensi P. Association between cardiacautonomic neuropathy and hypertensionand its potential influence on diabeticcomplications. Diabet Med 2010;27:804–811
18. Kramer CK, Leitão CB, Canani LH, et al.Late afternoon blood pressure increaseis associated with diabetic retinopathyin normotensive type 2 diabetes mellituspatients. Diabetes Res Clin Pract 2009;84:e12–e14
19. Sasaki A, Horiuchi N, Hasegawa K, UeharaM. Mortality and causes of death in type 2diabetic patients. A long-term follow-upstudy in Osaka District, Japan. Diabetes ResClin Pract 1989;7:33–40
20. Forsblom CM, Sane T, Groop PH, et al.Risk factors for mortality in type II (non-insulin-dependent) diabetes: evidence of
a role for neuropathy and a protective ef-fect of HLA-DR4. Diabetologia 1998;41:1253–1262
21. Kim YH, Hong MK, Song JM, et al. Di-abetic retinopathy as a predictor of lateclinical events following percutaneous cor-onary intervention. J InvasiveCardiol 2002;14:599–602
22. Ono T, Kobayashi J, Sasako Y, et al. Theimpact of diabetic retinopathy on long-term outcome following coronary arterybypass graft surgery. J Am Coll Cardiol2002;40:428–436
23. Rius Riu F, Salinas Vert I, Lucas Martín A,Romero González R, Sanmartí Sala A. Aprospective study of cardiovascular dis-ease in patients with type 2 diabetes: 6.3years of follow-up. J Diabetes Complica-tions 2003;17:235–242
24. Gimeno Orna JA, Castro Alonso FJ,Sánchez Vañó R, Latre Rebled B, LouArnal LM, Molinero Herguedas E. Di-abetic retinopathy and mortality in type 2diabetic patients. Med Clin (Barc) 2006;126:686–689 [in Spanish]
25. Cheung N, Rogers S, Couper DJ, Klein R,Sharrett AR, Wong TY. Is diabetic reti-nopathy an independent risk factor forischemic stroke? Stroke 2007;38:398–401
26. Cheung N, Wang JJ, Klein R, Couper DJ,Sharrett AR, Wong TY. Diabetic reti-nopathy and the risk of coronary heartdisease: the Atherosclerosis Risk in Com-munities Study. Diabetes Care 2007;30:1742–1746
27. Lövestam-AdrianM, Hansson-Lundblad C,Torffvit O. Sight-threatening retinopathy isassociated with lower mortality in type 2
diabetic subjects: a 10-year observationstudy. Diabetes Res Clin Pract 2007;77:141–147
28. Juutilainen A, Lehto S, Rönnemaa T,Pyörälä K, Laakso M. Retinopathy pre-dicts cardiovascular mortality in type 2diabetic men and women. Diabetes Care2007;30:292–299
29. Tong PC, Kong AP, SoWY, et al. Interactiveeffect of retinopathy and macroalbuminuriaon all-cause mortality, cardiovascular andrenal end points in Chinese patients withtype 2 diabetes mellitus. Diabet Med 2007;24:741–746
30. Cheung N, Wang JJ, Rogers SL, et al.;ARIC (Atherosclerosis Risk In Commu-nities) Study Investigators. Diabetic reti-nopathy and risk of heart failure. J AmColl Cardiol 2008;51:1573–1578
31. Liew G, Wong TY, Mitchell P, Cheung N,Wang JJ. Retinopathy predicts coronaryheart disease mortality. Heart 2009;95:391–394
32. Gimeno-Orna JA, Faure-Nogueras E,Castro-Alonso FJ, Boned-Juliani B. Abilityof retinopathy to predict cardiovasculardisease in patients with type 2 diabetesmellitus. Am J Cardiol 2009;103:1364–1367
33. Weis U, Turner B, Gibney J, et al. Long-term predictors of coronary artery diseaseand mortality in type 1 diabetes. QJM2001;94:623–630
34. Torffvit O, Lövestam-AdrianM, Agardh E,Agardh CD. Nephropathy, but not reti-nopathy, is associated with the develop-ment of heart disease in type 1 diabetes:a 12-year observation study of 462 pa-tients. Diabet Med 2005;22:723–729
1244 DIABETES CARE, VOLUME 34, MAY 2011 care.diabetesjournals.org
Diabetic retinopathy and mortality


