
microorganisms
Article
Diagnostic Value of Endotracheal AspiratesSonication on Ventilator-Associated PneumoniaMicrobiologic Diagnosis
Laia Fernández-Barat 1,2,*,† ID , Ana Motos 1,2,†, Otavio T. Ranzani 1 ID , Gianluigi Li Bassi 1,2,3,Elisabet Aguilera Xiol 1,2, Tarek Senussi 4, Chiara Travierso 5, Chiara Chiurazzi 6,Francesco Idone 7, Laura Muñoz 8, Jordi Vila 8,9, Miquel Ferrer 1,2,3, Paolo Pelosi 4,Francesco Blasi 10,11 ID , Massimo Antonelli 7 ID and Antoni Torres 1,2,3,*
1 Centro de Investigación Biomedica En Red-Enfermedades Respiratorias (CibeRes, CB06/06/0028),Institut d’Investigacions Biomèdiques Agust Pi i Sunyer (IDIBAPS), 08036 Barcelona, Spain;[email protected] (A.M.); [email protected] (O.T.R.); [email protected] (G.L.B);[email protected] (E.A.X.); [email protected] (M.F.)
2 Department of Medicine, School of Medicine, University of Barcelona, 08036 Barcelona, Spain3 Pulmonary and Critical Care Unit, Respiratory Institute, Hospital Clinic, 08036 Barcelona, Spain4 Dipartimento Scienze Chirurgiche e Diagnostiche Integrate (DISC), Università degli Studi di Genova,
16132 Genova, Italy; [email protected] (T.S.); [email protected] (P.P.)5 Respiratory Unit, Ospedale Garbagnate Salvini, Azienda Socio Sanitaria Territoriale Rhodense,
20024 Garbagnate Milanese, Italy; [email protected] Department of Anesthesiology and Intensive Care Medicine, Humanitas Clinical and Research Center,
Via Manzoni 56, 20089 Rozzano, Milano, Italy; [email protected] Department of Anesthesiology and Intensive Care Medicine, Università Cattolica del Sacro Cuore,
Fondazione Policlinico Universitario Agostino Gemelli, 00135 Rome, Italy; [email protected] (F.I.);[email protected] (M.A.)
8 Barcelona Institute for Global Health (ISGlobal) Hospital Clínic, 08036 Barcelona, Spain;[email protected] (L.M.); [email protected] (J.V.)
9 Department of Basic Clinical Practice, School of Medicine, University of Barcelona, 08036 Barcelona, Spain10 Department of Pathophysiology and Transplantation, Università degli Studi di Milano, 20122 Milan, Italy;
[email protected] Department of Internal Medicine, Respiratory Unit and Cystic Fibrosis Adult Center,
Fondazione IRCCS Cá Granda, Ospedale Maggiore Policlinico, 20122 Milan, Italy* Correspondence: [email protected] (L.F.-B.); [email protected] (A.T.);
Tel.: +34-93-227-54-00 (ext. 4812) (L.F.-B.); +34-93-227-5779 (A.T.);Fax: +34-93-227-98-13 (L.F.-B.); +34-93-227-9813 (A.T.)
† These authors contributed equally to this work.
Received: 10 August 2017; Accepted: 17 September 2017; Published: 20 September 2017
Abstract: Microorganisms are able to form biofilms within respiratory secretions. Methodsto disaggregate such biofilms before utilizing standard, rapid, or high throughput diagnostictechnologies may aid in pathogen detection during ventilator associated pneumonia (VAP) diagnosis.Our aim was to determine if sonication of endotracheal aspirates (ETA) would increase the sensitivityof qualitative, semi-quantitative, and quantitative bacterial cultures in an animal model of pneumoniacaused by Pseudomonas aeruginosa or by methicillin resistant Staphylococcus aureus (MRSA). Materialand methods: P. aeruginosa or MRSA was instilled into the lungs or the oropharynx of pigs in orderto induce severe VAP. Time point assessments for qualitative and quantitative bacterial cultures ofETA and bronchoalveolar lavage (BAL) samples were performed at 24, 48, and 72 h after bacterialinstillation. In addition, at 72 h (autopsy), lung tissue was harvested to perform quantitative bacterialcultures. Each ETA sample was microbiologically processed with and without applying sonicationfor 5 min at 40 KHz before bacterial cultures. Sensitivity and specificity were determined using BALas a gold-standard. Correlation with BAL and lung bacterial burden was also determined before
Microorganisms 2017, 5, 62; doi:10.3390/microorganisms5030062 www.mdpi.com/journal/microorganisms

Microorganisms 2017, 5, 62 2 of 13
and after sonication. Assessment of biofilm clusters and planktonic bacteria was performed throughboth optical microscopy utilizing Gram staining and Confocal Laser Scanning Microscopy utilizingthe LIVE/DEAD®BacLight kit. Results: 33 pigs were included, 27 and 6 from P. aeruginosa andMRSA pneumonia models, respectively. Overall, we obtained 85 ETA, 69 (81.2%) from P. aeruginosaand 16 (18.8%) from MRSA challenged pigs. Qualitative cultures did not significantly changeafter sonication, whereas quantitative ETA cultures did significantly increase bacterial counting.Indeed, sonication consistently increased bacterial burden in ETAs at 24, 48, and 72 h after bacterialchallenge. Sonication also improved sensitivity of ETA quantitative cultures and maintainedspecificity at levels previously reported and accepted for VAP diagnosis. Conclusion: The useof sonication in ETA respiratory samples needs to be clinically validated since sonication couldpotentially improve pathogen detection before standard, rapid, or high throughput diagnosticmethods used in routine microbial diagnostics.
Keywords: biofilm; endotracheal aspirate; sonication; ventilator associated pneumonia; animal model;Pseudomonas aeruginosa; Staphylococcus aureus
1. Introduction
Ventilator associated pneumonia (VAP) may occur after 48 h of oro-tracheal intubation witha pooled mean incidence of 10 episodes for 1000 ventilator-days, becoming one of the principalIntensive Care Unit (ICU)-acquired infections worldwide [1–3]. Accurate and rapid diagnostic methodsare key to initiate appropriate antimicrobial treatment and to reduce VAP relapse, healthcare costs,mortality, and an indirect effect on the emergence of bacterial resistance [4–6]. A wide new panel ofrapid diagnostic technologies offers promising possibilities for the optimization of antibiotics usage [7].However, adequate implementation of these novel technologies is an important consideration as theyalso present limitations. A notable limitation of these technologies is that they provide an importantamount of raw data that requires qualified interpretation before clinical decision making. Furthermore,new unexpected limitations may emerge as these new technologies become routinely implemented.
Current strategies for microbiological diagnosis of VAP include the microbiological culture ofone of the following respiratory samples: endotracheal aspirate (ETA), bronchoalveolar aspirate(BAS), bronchoalveolar lavage (BAL), and protected specimen brush (PSB). The cut-off for bacterialgrowth to differentiate between colonization and infection are 5 or 6 log CFU/mL for ETA and BAS,4 log CFU/mL for BAL, and 3 log CFU/mL for PSB [7–9]. BAL is probably the most representativerespiratory sample for diagnosing VAP. The reason for this is not only the extensive area of alveoliexplored, but also the quality of the samples obtained. This allows the detection of intracellularorganisms, rapid molecular techniques, rapid stains, and qualitative or quantitative cultures [10].The use of ETA instead of BAL has been associated with VAP over-diagnosis, without any impacton VAP clinical outcomes [9,11–13]. ETA and BAL cultures offer good positive and negativepredictive values for VAP diagnosis when utilized before antibiotics administration or change oftreatment. Nevertheless, differentiation between colonization and infection remains a limitation of bothsemi-quantitative cultures and rapid diagnostic tools. An integrated approach that balances clinicaljudgment and microbiological results is likely the best approach for VAP diagnosis and treatment [14].
There is consistent evidence that microorganisms can grow in biofilms within respiratorysecretions, because mucus stimulates biofilm production [15–17]. Biofilm associated infections (BAI)are of great clinical concern because the biofilm’s mode of growth is responsible for culture negativeresults, recalcitrance to antimicrobial treatment, and emergence of antimicrobial resistance [18,19].Therefore, it is challenging to implement diagnostic tools without misleading diagnostics of BAI.In a landmark study, Trampuz et al. (2007) demonstrated that sonication of the sample significantlyincreased the sensitivity and specificity of bacterial cultures for diagnosis of biofilm-associated

Microorganisms 2017, 5, 62 3 of 13
prosthetic joint infections [20]. Sonication of fluids containing the sample was recommended inthe latest clinical guidelines for the treatment and management of BAI, especially for catheter andprosthetic related infections [21]. However, studies are lacking on the utility of sonication of respiratorysamples to improve VAP diagnosis.
Recent investigations have demonstrated the presence of biofilm aggregates in BAL samplesfrom children with non-cystic fibrosis bronchiectasis by confocal laser scanning microscopy(CLSM) [22]. We previously demonstrated the presence of biofilm aggregates growing directlyattached to the internal surface of endotracheal tubes (ETT) and/or associated within host respiratorysecretions in an animal model of either methicillin resistant Staphylococcus aureus (MRSA) orPseudomonas aeruginosa [23,24].
We hypothesized that sonication of the ETA would increase bacterial release from biofilmaggregates, thus improving the sensitivity and specificity of VAP microbiological diagnosis. In thisstudy, we compared bacterial qualitative, semi-quantitative, and quantitative cultures before and afterETA sonication in an animal model of pneumonia, to determine sonication’s effect on the sensitivityand specificity of bacterial cultures and any improvement between ETA and lung bacterial growthcorrelation after ETA sonication.
2. Material and Methods
2.1. Population
All endotracheal aspirates from several ongoing porcine studies of VAP and severe pneumoniacaused by either Pseudomonas aeruginosa or MRSA were included.
P. aeruginosa or MRSA cultures were instilled into the lungs or the oropharynx to inducesevere or ventilator-associated pneumonia in anesthetized, orotracheally intubated, and mechanicallyventilated pigs, respectively [25,26]. Both models have been previously validated by our group andthe primary difference is that the bronchial challenge rapidly develops severe pneumonia whilstthe oropharynx instillation closely mimics the pathophysiology of VAP [25–27]. Briefly, in thefirst model, 75 mL of 7 log CFU/mL of a log-phase culture (Luria Broth (LB), OD600nm = 0.1–0.2)was instilled into the lungs, whereas in the second model, 5 mL of 7 log CFU/mL of a log-phaseculture was instilled twice into the oropharynx. Animals were kept mechanically ventilated and wereeuthanized seventy-two hours after bacterial challenge. The institutional review board and animalethics committee approved all included studies. The project license number that covered the animalexperiments was the following: 06/17. 9322 (start date 14/12/16 and the expiration date 28/03/19).Animals were managed according to the National Institutes of Health guidelines for the Use andCare of Animals. Additional details on animal handling and methods are reported in previouspublications [26].
2.2. Collection of Samples
Paired ETA and BAL were obtained sequentially at 24, 48, and 72 h after bacterial instillation toperform qualitative, semi-quantitative, and quantitative bacterial cultures in each animal. Trachealsuctioning was performed using a 12-Fr standard CSS (KIMVENT* Closed Suction Systems,Kimberly Clark, Irving, TX, USA), as clinically recommended [28]. BAL was performed usinga bronchoscope (Pentax SAFE-3000; Ricoh Imaging Deutschland GmbH, Hamburg, Germany) inthe right medium lobe with two 10-mL aliquots of sterile saline solution. The first aliquot wasdiscarded, while the second one was used for quantitative microbiology studies. Pigs were euthanizedafter 72 h of bacterial challenge and lung tissue samples were harvested to assess quantitative cultures.
2.3. Microbiological Analysis
ETA and BAL were liquified in sterile 0.9% saline solution (NaCl), homogenized with a vortexmixer and then serially diluted by aseptic transfer of 0.1 mL samples into 0.9 mL of sterile 0.9% NaCl

Microorganisms 2017, 5, 62 4 of 13
solution to yield dilutions of 10−1 to 10−3-fold on blood and MacConkey agar and incubated at37 ◦C over-night.
Two-hundred µL of each ETA sample were needed to perform standard cultures, whilst theremaining volume of sample (minimum 200 µL) was sonicated in ultrasonic cleaning equipment(Branson 3510 E-MT; Bransonic, Danbury, CT, USA) for 5 min at 40 KHz to disaggregate biofilms,before undergoing serial dilutions and plating as aforementioned. Bacterial growth was quantified andreported as log10 colony-forming units per milliliter (log CFU/mL). Microorganisms were identifiedby mass spectrometry through a Microflex LT (Bruker Daltonik GmbH, Bremen, Germany) benchtopinstrument controlled by the FLEXCONTROL software (version 3.0; Bruker Daltonics). Spectra wereanalysed with the MALDI BioTyper software (version 3.1; Bruker Daltonics) using the pre-processingand Bio- Typer main spectrum (MSP) identification standard methods (mass range 2000–20,000 m/z)against the default Bruker database. Accuracy of the identification was determined by a loga-rithmicscore value resulting from the alignment of peaks to the best matching reference spectrum. All bacterialquantitative cultures were performed in duplicates.
Five tissue samples (80–120 mg each) from the five lobes of the lungs were excised and placed onsterile vials. Lung biopsies were aseptically homogenized by using a glass tissue mortar, in a volumeof 0.9% NaCl solution to yield a 1:5 (w/v) suspension of ground tissue.
2.4. Microscopy Images Acquisition
To qualitatively assess biofilm clusters and planktonic bacteria, standard Gram staining andconfocal laser scanning microscopy (CLSM) were performed for both non-sonicated and sonicatedETA samples. For Gram staining, the conventional timing and dies were used. Gram-stained slideswere inspected using a 100× oil objective on a DMRB microscope with equipped with a color camera.
ETA samples were immediately stained after extraction with the LIVE/DEAD®BacLight kit™(BacLight kit™, Invitrogen, Barcelona, Spain), adding 1.5 µL SYTO9 and 1.5 µL popidium iodide(PI) dyes in 1 mL PBS 1× during 15 min in the dark. Then, a very thin layer was smearedonto the slide. Images were obtained with a Leica TCS SP5 laser scanning confocal system(Leica Microsystems Heidelberg GmbH, Manheim, Germany) equipped with a DMI6000 invertedmicroscope, and a 63× PL APO numerical aperture 0.7 oil immersion objective was used. SYTO® 9(Invitrogen, Barcelona, Spain) and PI images were acquired sequentially using 488, 561 nm laser lines,AOBS as beam splitter, and emission detection ranges 500–550, 570–620 nm, respectively. The confocalpinhole was set at 1 Airy unit and pixel size was 160 nm.
2.5. Statistical Analysis
Categorical variables are reported in percentage (%) and continuous variables as mean ± SD ifnormally distributed. Paired samples were compared using the paired t-test. Spearman correlationcoefficient analyses were performed to determine associations between quantitative variables. For thecorrelation between ETA and lung tissue burden, we selected samples from animals that did notreceive nebulized antibiotics, because of the extreme high antimicrobial activity in the ETA samples.The sensitivity, specificity, and positive and negative predictive value of microbiologic cut-offs werecalculated with two-by-two contingency tables using standard formulae, when paired ETA and BALsamples were available. All statistical analyses were performed using IBM SPSS Statistics version 22.0(Armonk, NY, USA). Two-tailed testing was used and p < 0.05 was considered statistically significant.
3. Results
3.1. Population
We analyzed thirty-three pigs, 27 and 6 belonged to P. aeruginosa and MRSA pneumonia models,respectively. Twenty-four pigs were intrabronchially challenged with either P. aeruginosa or MRSA

Microorganisms 2017, 5, 62 5 of 13
and included in studies to test pneumonia treatments. In contrast, nine pigs were challenged with thebacterial suspension instilled into the oropharynx for VAP preventive studies (Table 1).
Table 1. Number of animals, microorganism, instillation model, and treatment of the different studies.
Study Pigs (n) InoculatedMicroorganism
BacterialInstillation ETA (n) BAL (n) Treatment
Study 1 15 P. aeruginosa Lungs 39 23 Untreated controls vs. Nebulizedaminoglycoside vs. IV carbapenem
Study 2 4 MRSA Oropharynx 10 0 Untreated controls vs. Monoclonal antibodyStudy 3 7 P. aeruginosa Lungs 16 14 Untreated controls vs. IV cephalosporinStudy 4 5 P. aeruginosa Oropharynx 14 12 Untreated controls vs. Monoclonal antibodyStudy 5 2 MRSA Lungs 6 6 Untreated controls vs. IV lipoglycopeptide
IV: Intravenous; Dosages: aminoglycoside (300 mg/kg every 6 h), carbapenem (25 mg/kg every 8 h), cephalosporin(50 mg/kg every 8 h), Monoclonal antibody against P. aeruginosa (15 mg/Kg single dose), lipoglycopeptide(25 mg/kg every 24 h). Study 2 only comprised untreated pigs.
3.2. Samples Collected
Overall we obtained 55 BAL and 85 ETA, 69 (81%) from P. aeruginosa versus 16 (19%) from MRSAchallenged pigs, 61 (72%) belonged to pigs intrabronchially challenged versus 24 (28%) obtained fromthe oropharynx instilled model. Among the 85 ETA samples: 33, 25, and 27 were obtained at 24, 48,or 72 h (autopsy) after bacterial challenge, respectively. A total of 36 versus 49 ETA samples wereobtained from untreated versus treated pigs, respectively (Table 1).
3.3. Standard Versus Sonicated Cultures
No differences were found on the qualitative or semi-quantitative VAP microbial diagnosis whencomparing sonicated versus non-sonicated ETA samples, independent of whether the cut-off used was5 or 6 log CFU/mL. In contrast, in 81 ETA quantitative bacterial cultures (4 were uncountable) wefound that bacterial burden (log CFU/mL) was significantly higher in sonicated versus non-sonicatedETA cultures (4.42 ± 2.58 vs. 4.18 ± 2.5 respectively; p < 0.001) (Figure 1).
Microorganisms 2017, 5, 62 5 of 13
3.2. Samples Collected
Overall we obtained 55 BAL and 85 ETA, 69 (81%) from P. aeruginosa versus 16 (19%) from MRSA challenged pigs, 61 (72%) belonged to pigs intrabronchially challenged versus 24 (28%) obtained from the oropharynx instilled model. Among the 85 ETA samples: 33, 25, and 27 were obtained at 24, 48, or 72 h (autopsy) after bacterial challenge, respectively. A total of 36 versus 49 ETA samples were obtained from untreated versus treated pigs, respectively (Table 1).
Table 1. Number of animals, microorganism, instillation model, and treatment of the different studies.
Study Pigs (n) Inoculated
Microorganism Bacterial
Instillation ETA (n) BAL (n) Treatment
Study 1 15 P. aeruginosa Lungs 39 23 Untreated controls vs. Nebulized
aminoglycoside vs. IV carbapenem Study 2 4 MRSA Oropharynx 10 0 Untreated controls vs. Monoclonal antibody Study 3 7 P. aeruginosa Lungs 16 14 Untreated controls vs. IV cephalosporin Study 4 5 P. aeruginosa Oropharynx 14 12 Untreated controls vs. Monoclonal antibody Study 5 2 MRSA Lungs 6 6 Untreated controls vs. IV lipoglycopeptide
IV: Intravenous; Dosages: aminoglycoside (300 mg/kg every 6 h), carbapenem (25 mg/kg every 8 h), cephalosporin (50 mg/kg every 8 h), Monoclonal antibody against P. aeruginosa (15 mg/Kg single dose), lipoglycopeptide (25 mg/kg every 24 h). Study 2 only comprised untreated pigs.
3.3. Standard Versus Sonicated Cultures
No differences were found on the qualitative or semi-quantitative VAP microbial diagnosis when comparing sonicated versus non-sonicated ETA samples, independent of whether the cut-off used was 5 or 6 log CFU/mL. In contrast, in 81 ETA quantitative bacterial cultures (4 were uncountable) we found that bacterial burden (log CFU/mL) was significantly higher in sonicated versus non-sonicated ETA cultures (4.42 ± 2.58 vs. 4.18 ± 2.5 respectively; p < 0.001) (Figure 1).
Figure 1. Bland–Altman plot showing the differences between sonicated and non-sonicated endotracheal aspirate (ETA) paired samples (Mean ± SD). Eighty-one quantitative ETA cultures were performed twice: before and after sonication. Each single dot represents the difference between bacterial burden of sonicated minus non-sonicated ETA, using non-sonicated values in the X axis. Of notice, 52 out of 81 (64%) dots were allocated above zero, 21 out of 81 (26%) at zero, and 8 out of 81 (10%) below zero. Mean difference ± SD was 0.2 ± 0.3 log CFU/mL (p < 0.001).
In particular, we analyzed 69 vs. 16 ETA samples obtained from P. aeruginosa vs. MRSA models, respectively. Sonicated ETA samples presented higher P. aeruginosa burden versus non-sonicated ones. However, the increase in MRSA burden after sonication did not reach statistical significance (Table 2).
Along time assessments, sonicated vs. non-sonicated ETA consistently presented higher bacterial burden at 24, 48, and at 72 h after bacterial challenge (Table 2).
Figure 1. Bland–Altman plot showing the differences between sonicated and non-sonicatedendotracheal aspirate (ETA) paired samples (Mean ± SD). Eighty-one quantitative ETA cultureswere performed twice: before and after sonication. Each single dot represents the difference betweenbacterial burden of sonicated minus non-sonicated ETA, using non-sonicated values in the X axis.Of notice, 52 out of 81 (64%) dots were allocated above zero, 21 out of 81 (26%) at zero, and 8 out of81 (10%) below zero. Mean difference ± SD was 0.2 ± 0.3 log CFU/mL (p < 0.001).
In particular, we analyzed 69 vs. 16 ETA samples obtained from P. aeruginosa vs. MRSA models,respectively. Sonicated ETA samples presented higher P. aeruginosa burden versus non-sonicated ones.However, the increase in MRSA burden after sonication did not reach statistical significance (Table 2).

Microorganisms 2017, 5, 62 6 of 13
Along time assessments, sonicated vs. non-sonicated ETA consistently presented higher bacterialburden at 24, 48, and at 72 h after bacterial challenge (Table 2).
Table 2. Comparison of non-sonicated versus sonicated ETA bacterial load by microorganism,instillation model and time of assessment.
Non-SonicatedETA (log CFU/mL)
Sonicated ETA(log CFU/mL) p-Value
Inoculated microorganism P. aeruginosa (n = 69) 4.03 ± 2.58 4.25 ± 2.79 p < 0.001MRSA (n = 16) 4.82 ± 2.04 5.17 ± 1.52 0.159
Bacterial instillationLungs (n = 61) 4.10 ± 2.50 4.35 ± 2.65 p < 0.001
Oropharynx (n = 24) 4.37 ± 2.53 4.61 ± 2.42 0.156
Time of assessment(hours after bacterial challenge)
24 h (n = 33) 5.24 ± 1.65 5.45 ± 1.71 p < 0.00148 h (n = 25) 3.67 ± 2.69 3.79 ± 2.82 0.01972 h (n = 27) 3.30 ± 2.84 3.62 ± 2.89 0.052
Sonication also increased ETA bacterial burden when the bacterial challenge was intrabronchial.In contrast, no difference in bacterial burden was found between sonicated and non-sonicatedquantitative cultures for the 9 pigs that received bacterial instillation of the oropharynx (Table 2).
3.4. Sensitivity and Specificity
The sensitivity (Se) and the specificity (Sp) of sonicated and non-sonicated quantitative cultures ofETAs used for the diagnosis of pneumonia were determined using BAL ≥ 4 log CFU/mL as a goldstandard. The Se/Sp analysis were performed for both ETA cut-off points: ≥5 log CFU/mL and≥6log CFU/mL. No improvement in Se/Sp was detected after ETA sonication when the ETA cut-off was≥5 log CFU/mL. In contrast, Se improved from 75%, in non-sonicated samples, to 87.5% after sonication.Additionally, Sp decreased from 83 to 70.2% when the ETA cut-off was ≥6 log CFU/mL (Table 3).
Table 3. Effect of ETA sonication on the diagnosis of pneumonia using BAL ≥ 4 log CFU/mL asgold standard.
ETA cut-off Se Sp PPV NPV PLR NLR(95%CI) (95%CI) (95%CI) (95%CI) (95%CI) (95%CI)
Non-sonicated ETA
≥5 log CFU/mL 100 46.8 24.2 100 1.88 Undefined(100–100) (32.5–61.1) (9.6–38.9) (100–100) (1.44–2.46)
≥6 log CFU/mL 75.0 83.0 42.9 95.1 4.41 0.30(65.6–100) (72.2–93.7) (16.9–68.8) (88.5–100) (2.09–9.3) (0.09–1.01)
Sonicated ETA
≥5 log CFU/mL 100 40.4 22.2 100 1.68 Undefined(100–100) (26.4–54.5) (8.6–35.8) (100–100) (1.33–2.12)
≥6 log CFU/mL 87.5 70.2 33.3 97.1 2.94 0.18(64.6–100) (57.1–83.3) (13.2–53.5) (91.4–100) (1.76–4.90) (0.03–1.12)
Se: sensitivity; Sp: Specificity; PPV: positive predictive value; NPV: negative predictive value; PLR: positivelikelihood ratio; NLR: negative likelihood ratio; CFU: Colony-forming units; ETA: endotracheal aspirate.A likelihood ratio is a probability that a subject with a positive (or negative) test has the disease in question.If the PLR is over 5 and the NLR is under 0.10, it may be concluded that it is essential for a diagnosis and of highvalidity for use in routine clinical practice. A likelihood ratio of 2.0 corresponds to an approximately +15% increasein probability, which is considered a slight increase. A likelihood ratio of 5.0 corresponds to an approximately +30%increase in probability, which is considered a moderate increase.
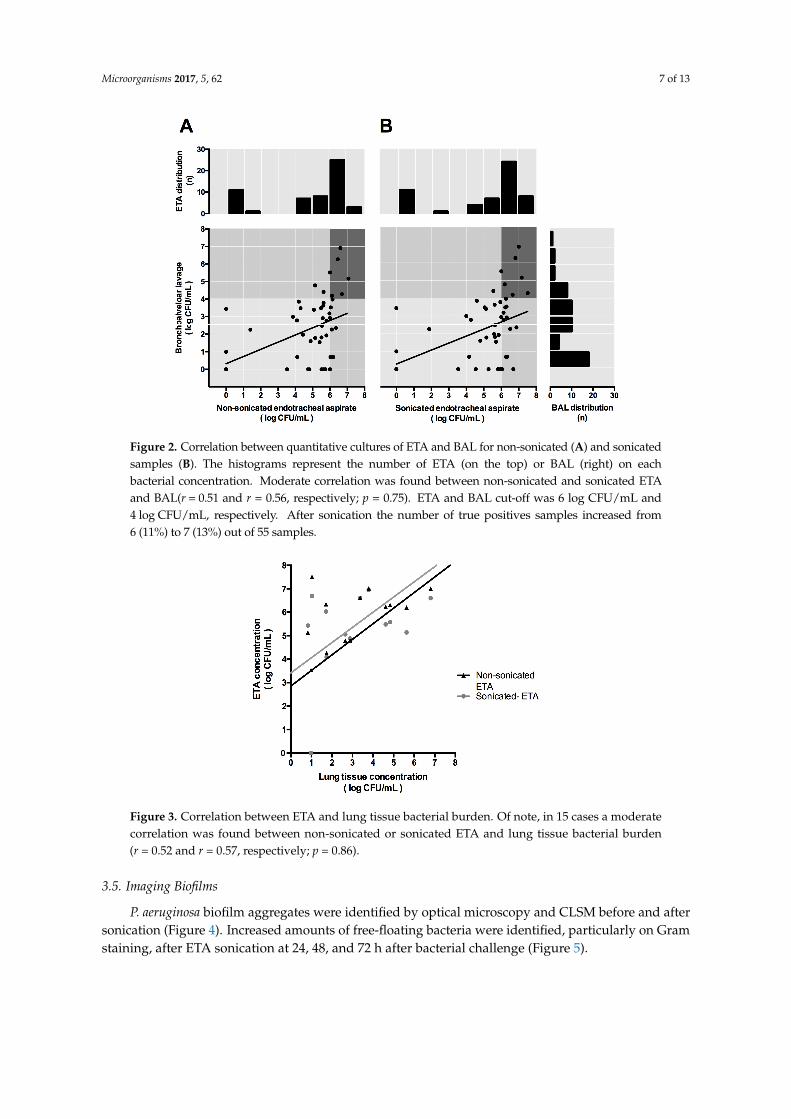
In 55 cases, a moderate correlation was found to exist between non-sonicated and sonicatedETA and BAL bacterial loads. However, the non-sonicated vs. sonicated ETA-BAL correlation didnot significantly improve after sonication (r = 0.51 and r = 0.56, respectively; p = 0.75) (Figure 2).The correlation between non-sonicated vs. sonicated ETA and lung tissue bacterial load did notsignificantly improve after sonication either (r = 0.52 and r = 0.57, respectively; p = 0.86), although thislast analysis included only 15 cases (Figure 3).
Microorganisms 2017, 5, 62 7 of 13Microorganisms 2017, 5, 62 7 of 13
Figure 2. Correlation between quantitative cultures of ETA and BAL for non-sonicated (A) and sonicated samples (B). The histograms represent the number of ETA (on the top) or BAL (right) on each bacterial concentration. Moderate correlation was found between non-sonicated and sonicated ETA and BAL(r = 0.51 and r = 0.56, respectively; p = 0.75). ETA and BAL cut-off was 6 log CFU/mL and 4 log CFU/mL, respectively. After sonication the number of true positives samples increased from 6 (11%) to 7 (13%) out of 55 samples.
Figure 3. Correlation between ETA and lung tissue bacterial burden. Of note, in 15 cases a moderate correlation was found between non-sonicated or sonicated ETA and lung tissue bacterial burden (r = 0.52 and r = 0.57, respectively; p = 0.86).
3.5. Imaging Biofilms
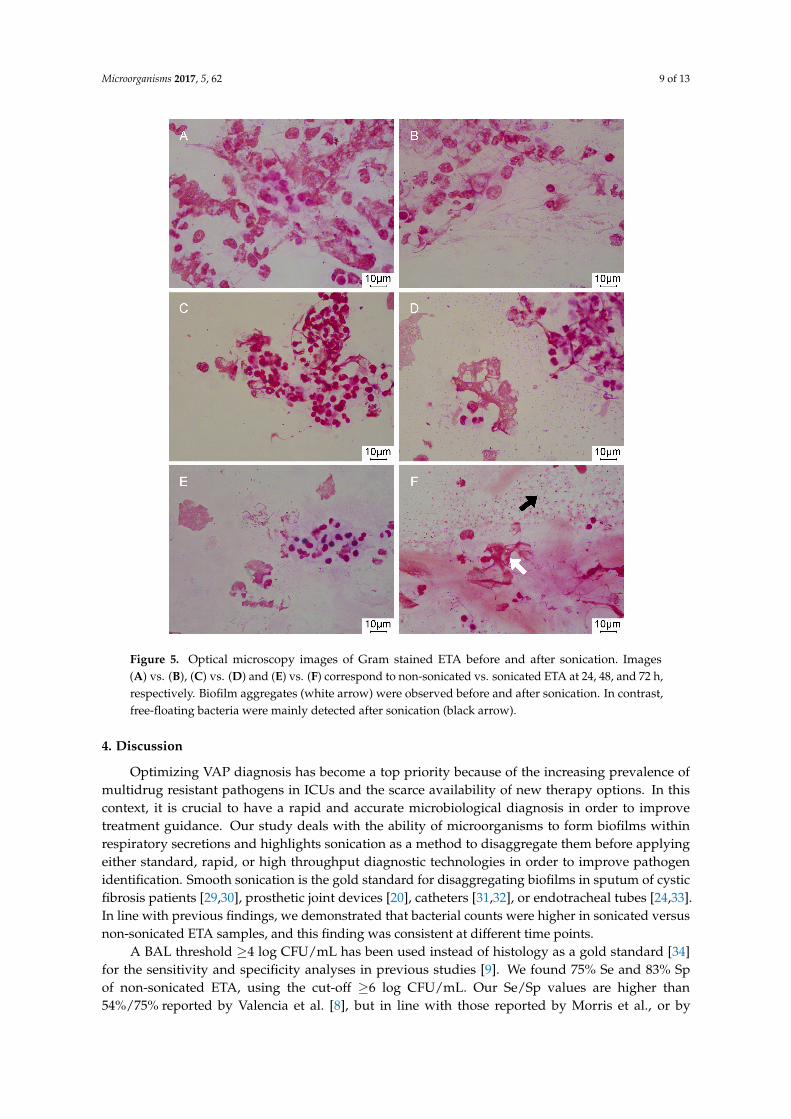
P. aeruginosa biofilm aggregates were identified by optical microscopy and CLSM before and after sonication (Figure 4). Increased amounts of free-floating bacteria were identified, particularly on Gram staining, after ETA sonication at 24, 48, and 72 h after bacterial challenge (Figure 5).
Figure 2. Correlation between quantitative cultures of ETA and BAL for non-sonicated (A) and sonicatedsamples (B). The histograms represent the number of ETA (on the top) or BAL (right) on eachbacterial concentration. Moderate correlation was found between non-sonicated and sonicated ETAand BAL(r = 0.51 and r = 0.56, respectively; p = 0.75). ETA and BAL cut-off was 6 log CFU/mL and4 log CFU/mL, respectively. After sonication the number of true positives samples increased from6 (11%) to 7 (13%) out of 55 samples.
Microorganisms 2017, 5, 62 7 of 13
Figure 2. Correlation between quantitative cultures of ETA and BAL for non-sonicated (A) and sonicated samples (B). The histograms represent the number of ETA (on the top) or BAL (right) on each bacterial concentration. Moderate correlation was found between non-sonicated and sonicated ETA and BAL(r = 0.51 and r = 0.56, respectively; p = 0.75). ETA and BAL cut-off was 6 log CFU/mL and 4 log CFU/mL, respectively. After sonication the number of true positives samples increased from 6 (11%) to 7 (13%) out of 55 samples.
Figure 3. Correlation between ETA and lung tissue bacterial burden. Of note, in 15 cases a moderate correlation was found between non-sonicated or sonicated ETA and lung tissue bacterial burden (r = 0.52 and r = 0.57, respectively; p = 0.86).
3.5. Imaging Biofilms
P. aeruginosa biofilm aggregates were identified by optical microscopy and CLSM before and after sonication (Figure 4). Increased amounts of free-floating bacteria were identified, particularly on Gram staining, after ETA sonication at 24, 48, and 72 h after bacterial challenge (Figure 5).
Figure 3. Correlation between ETA and lung tissue bacterial burden. Of note, in 15 cases a moderatecorrelation was found between non-sonicated or sonicated ETA and lung tissue bacterial burden(r = 0.52 and r = 0.57, respectively; p = 0.86).
3.5. Imaging Biofilms
P. aeruginosa biofilm aggregates were identified by optical microscopy and CLSM before and aftersonication (Figure 4). Increased amounts of free-floating bacteria were identified, particularly on Gramstaining, after ETA sonication at 24, 48, and 72 h after bacterial challenge (Figure 5).

Microorganisms 2017, 5, 62 8 of 13
Microorganisms 2017, 5, 62 8 of 13
Figure 4. Confocal Laser Scanning Microscopy (CLSM) image of ETA samples before and after sonication in P. aeruginosa and MRSA infection models. Of note, viable bacteria (in green) stained with the SYTO 9, a green Fluorescent Nucleic Acid Stain, were visible. Dead bacteria (in red) stained with the propidium iodide (PI) were barely detected. The nucleus and cytoplasm of eukaryotic cells from the pig were also stained nonspecifically with the PI and SYTO 9 (large red and green blotches). (A) vs. (B) correspond to non-sonicated vs. sonicated ETA (5.14 vs. 6.20 log CFU/mL) after 72 h of P. aeruginosa instillation with biofilm clusters visible (white arrow). Similarly, (C) vs. (D) correspond to non-sonicated vs. sonicated ETA (1.38 vs. 1.88 log CFU/mL) after 72 h of MRSA instillation with biofilm clusters and free-floating cocci (white arrows), respectively. (A,B) images belong to a pig treated with IV cephalosporin and (C,D) to a pig treated with IV lipoglycopeptide. (E) 3D reconstruction of a Gram-negative bacilli biofilm cluster (Imaris, Bitplane, Oxford instruments Company, Abingdon, UK).
Figure 4. Confocal Laser Scanning Microscopy (CLSM) image of ETA samples before and aftersonication in P. aeruginosa and MRSA infection models. Of note, viable bacteria (in green) stainedwith the SYTO 9, a green Fluorescent Nucleic Acid Stain, were visible. Dead bacteria (in red) stainedwith the propidium iodide (PI) were barely detected. The nucleus and cytoplasm of eukaryotic cellsfrom the pig were also stained nonspecifically with the PI and SYTO 9 (large red and green blotches).(A) vs. (B) correspond to non-sonicated vs. sonicated ETA (5.14 vs. 6.20 log CFU/mL) after 72 h ofP. aeruginosa instillation with biofilm clusters visible (white arrow). Similarly, (C) vs. (D) correspondto non-sonicated vs. sonicated ETA (1.38 vs. 1.88 log CFU/mL) after 72 h of MRSA instillation withbiofilm clusters and free-floating cocci (white arrows), respectively. (A,B) images belong to a pig treatedwith IV cephalosporin and (C,D) to a pig treated with IV lipoglycopeptide. (E) 3D reconstruction ofa Gram-negative bacilli biofilm cluster (Imaris, Bitplane, Oxford instruments Company, Abingdon, UK).
Microorganisms 2017, 5, 62 9 of 13Microorganisms 2017, 5, 62 9 of 13
Figure 5. Optical microscopy images of Gram stained ETA before and after sonication. Images (A) vs. (B), (C) vs. (D) and (E) vs. (F) correspond to non-sonicated vs. sonicated ETA at 24, 48, and 72 h, respectively. Biofilm aggregates (white arrow) were observed before and after sonication. In contrast, free-floating bacteria were mainly detected after sonication (black arrow).
4. Discussion
Optimizing VAP diagnosis has become a top priority because of the increasing prevalence of multidrug resistant pathogens in ICUs and the scarce availability of new therapy options. In this context, it is crucial to have a rapid and accurate microbiological diagnosis in order to improve treatment guidance. Our study deals with the ability of microorganisms to form biofilms within respiratory secretions and highlights sonication as a method to disaggregate them before applying either standard, rapid, or high throughput diagnostic technologies in order to improve pathogen identification. Smooth sonication is the gold standard for disaggregating biofilms in sputum of cystic fibrosis patients [29,30], prosthetic joint devices [20], catheters [31,32], or endotracheal tubes [24,33]. In line with previous findings, we demonstrated that bacterial counts were higher in sonicated versus non-sonicated ETA samples, and this finding was consistent at different time points.
A BAL threshold 4 log CFU/mL has been used instead of histology as a gold standard [34] for the sensitivity and specificity analyses in previous studies [9]. We found 75% Se and 83% Sp of non-sonicated ETA, using the cut-off 6 log CFU/mL. Our Se/Sp values are higher than 54%/75% reported by Valencia et al. [8], but in line with those reported by Morris et al., or by Jourdain et al. using BAL samples [35]. Differences between studies could be influenced by the gold standard used or by sample size, which was superior in the Valencia et al study [8]. Interestingly, in our study, sensitivity was notably increased after sonication (87.5%) and specificity (70%) was similar [8] or
Figure 5. Optical microscopy images of Gram stained ETA before and after sonication. Images(A) vs. (B), (C) vs. (D) and (E) vs. (F) correspond to non-sonicated vs. sonicated ETA at 24, 48, and 72 h,respectively. Biofilm aggregates (white arrow) were observed before and after sonication. In contrast,free-floating bacteria were mainly detected after sonication (black arrow).
4. Discussion
Optimizing VAP diagnosis has become a top priority because of the increasing prevalence ofmultidrug resistant pathogens in ICUs and the scarce availability of new therapy options. In thiscontext, it is crucial to have a rapid and accurate microbiological diagnosis in order to improvetreatment guidance. Our study deals with the ability of microorganisms to form biofilms withinrespiratory secretions and highlights sonication as a method to disaggregate them before applyingeither standard, rapid, or high throughput diagnostic technologies in order to improve pathogenidentification. Smooth sonication is the gold standard for disaggregating biofilms in sputum of cysticfibrosis patients [29,30], prosthetic joint devices [20], catheters [31,32], or endotracheal tubes [24,33].In line with previous findings, we demonstrated that bacterial counts were higher in sonicated versusnon-sonicated ETA samples, and this finding was consistent at different time points.
A BAL threshold ≥4 log CFU/mL has been used instead of histology as a gold standard [34]for the sensitivity and specificity analyses in previous studies [9]. We found 75% Se and 83% Spof non-sonicated ETA, using the cut-off ≥6 log CFU/mL. Our Se/Sp values are higher than54%/75% reported by Valencia et al. [8], but in line with those reported by Morris et al., or by

Microorganisms 2017, 5, 62 10 of 13
Jourdain et al. using BAL samples [35]. Differences between studies could be influenced by thegold standard used or by sample size, which was superior in the Valencia et al study [8]. Interestingly,in our study, sensitivity was notably increased after sonication (87.5%) and specificity (70%) wassimilar [8] or even superior to other previous studies [9]. This increase in sensitivity was only apparentwhen the cut-off of ETA burden was ≥6 log CFU/mL. This stirs the debate about the most appropriateETA cut-off. Those defending a lower cut-off point opt for greater sensitivity at the expense of losingspecificity, and vice versa. Our results suggest that with a cut-off ≥6 log CFU/mL, ETA sonicationgrants higher sensitivity whilst maintaining high specificity. Subsequently, further investigationsshould prospectively investigate the utility of sonication in routine clinical diagnostics.
Further study is required to determine whether sonication is an effective adjunct for bothP. aeruginosa and MRSA ETA cultures. Our previous results indicated that both P. aeruginosa andMRSA formed biofilms in ETTs and also in respiratory secretions accumulated within the ETT [23,24].Interestingly, Hola V. and coauthors investigated the microbial composition in urinary catheters byapplying sonication and found that it improved diagnosis of urinary tract infections, especially whenstrong biofilm producers were present [31]. We found that ETA sonication increased bacterial countingof P. aeruginosa but did not reach a statistically significant increase for MRSA growth. The reasonfor this could be either attributed to a better biofilm formation capability of P. aeruginosa, to a lowernumber of animals challenged with MRSA, or to a combination of both.
The latest clinical guidelines for the diagnosis and treatment of BAI strongly recommend the useof imaging techniques [21]. Recent investigations have evidenced the presence of biofilms by CLSM inBAL samples of children with non-cystic fibrosis bronchiectasis [22]. In the present study we confirmedthat P. aeruginosa biofilms are also found in ETA samples from a pig model of pneumonia. Importantly,biofilms were identified by two independent microscopy techniques (Optical microscopy-Gram stainor CLSM-Live/Dead Kit) even after sonication. Our findings are relevant as they imply that we maybe sub-optimally utilizing existing diagnostic technology if we do not disaggregate bacteria from theirbiofilms before ETA culture. Considering the latest advancements in point-of-care diagnosis [36] andthat biofilm forming species of the respiratory microbiome can trigger pathogen growth [22,37,38],this seems the appropriate time to reconsider the diagnosis of biofilms in respiratory samples fromintubated ICU patients with suspicion of VAP.
Several limitations should be addressed within our study. First, interestingly, the study compriseddifferent pneumonia models that differed by the microorganism, the type of bacterial challenge, and thetreatment administered. This was especially a limitation for sub-analyses as it decreased the samplesize in specific cases. Second, BAL missing samples or the exclusion of lung tissue samples frompigs treated with nebulized antibiotics limited the Se/Sp and the power of the correlation analyses.Ultimately, the beneficial effects of sonication was only detectable in quantitative cultures, which arenot the routine technique used for microbial diagnosis [39]. Nevertheless, our results provide enoughevidence that P. aeruginosa biofilms are present in ETA samples, even after sonication, and this caninfluence the sensitivity of not only conventional, but also high throughput and rapid diagnostics.
5. Conclusions
Sonication of ETA improves the detection of P. aeruginosa within biofilms, improving sensitivityand maintaining specificity for VAP microbiological diagnosis in a pig model of pneumonia.Its utility in routine clinical laboratory or before rapid or high throughput technologies needs tobe prospectively investigated.
Acknowledgments: We thank the following for their valuable contribution to animal experimentation division:Rosanel Amaro, Francesco Pagliara, Joaquim Bobí, Montserrat Rigol, Hua Yang, Min Lan Yang, and Alicia San José.Thanks to Maria Calvo, Anna Bosch and Elisenda Coll from the Confocal microscopy Unit at the Scientific andtechnical services of the University of Barcelona for their valuable support in image acquisition and analysis.Supported by: Centro de Investigación Biomedica En Red-Enfermedades Respiratorias (CibeRes, CB06/06/0028)an initiative of Instituto Carlos III (ISCIII), also ISCIII for the grants: PI15/00506, INT16/00232, CM16/00130,Institut d'Investigacions Biomèdiques August Pi i Sunyer (IDIBAPS), SGR 911, Spanish Society of Pneumology and

Microorganisms 2017, 5, 62 11 of 13
Thoracic Surgery (SEPAR), European Respiratory Society (ERS), ICREA Academy award to Prof. Torres 2014–2018,Ministry of competitiveness and economy (MINECO) for the grant: JCI-2012-14801, ERS/AIMAR fellowshipSTRTF 2014-7190 to Chiara Travierso.
Author Contributions: L.F.-B. and A.M. had full access to all of the data in the study and take responsibilityfor the integrity of the data and the accuracy of the data analysis, study concept, and design: L.F.-B. and A.T.;acquisition of data: L.F.-B., A.M., O.T.R., G.L.B., E.A.X., T.S., C.T., C.C., F.I., L.M.; image acquisition: L.F.-B., A.M.;analysis and interpretation of data: L.F.-B., A.M., and O.T.R.; statistical analysis: A.M.; drafting of the manuscript:L.F.-B.; critical revision of the manuscript for important intellectual content: O.T.R., M.F., J.V., P.P., F.B., M.A.,and A.T. All authors read and approved the manuscript.
Conflicts of Interest: The authors declare no conflict of interest.
References
1. Chastre, J.; Fagon, J.Y. Ventilator-associated pneumonia. Am. J. Respir. Crit. Care Med. 2002, 165, 867–903.[CrossRef] [PubMed]
2. Vincent, J.L.; Rello, J.; Marshall, J.; Silva, E.; Anzueto, A.; Martin, C.D.; Moreno, R.; Lipman, J.; Gomersall, C.;Sakr, Y.; et al. International study of the prevalence and outcomes of infection in intensive care units. JAMA2009, 302, 2323–2329. [CrossRef] [PubMed]
3. Reporting on 2011 Surveillance Data and 2012 Epidemic Intelligence Data. Annual Epidemiological Report 2013.Stockholm: European Centre for Disease Prevention and Control (ECDC), 2013. Available online: https://ecdc.europa.eu/sites/portal/files/media/en/publications/Publications/annual-epidemiological-report-2013.pdf(accessed on 18 September 2017).
4. Planquette, B.; Timsit, J.F.; Misset, B.Y.; Schwebel, C.; Azoulay, E.; Adrie, C.; Vesin, A.; Jamali, S.; Zahar, J.R.;Allaouchiche, B.; et al. Pseudomonas aeruginosa ventilator-associated pneumonia. predictive factors oftreatment failure. Am. J. Respir. Crit. Care Med. 2013, 188, 69–76. [CrossRef] [PubMed]
5. Kollef, M.H.; Hamilton, C.W.; Ernst, F.R. Economic impact of ventilator-associated pneumonia in a largematched cohort. Infect. Control Hosp. Epidemiol. 2012, 33, 250–256. [CrossRef] [PubMed]
6. Warren, D.K.; Shukla, S.J.; Olsen, M.A.; Kollef, M.H.; Hollenbeak, C.S.; Cox, M.J.; Cohen, M.M.; Fraser, V.J.Outcome and attributable cost of ventilator-associated pneumonia among intensive care unit patients ina suburban medical center. Crit. Care Med. 2003, 31, 1312–1317. [CrossRef] [PubMed]
7. Kollef, M.H.; Burnham, C.D. Ventilator-Associated Pneumonia: The Role of Emerging Diagnostic Technologies.Semin. Respir. Crit. Care Med. 2017, 38, 253–263.
8. Valencia, A.M.; Torres, M.A.; Insausti, O.J.; Alvarez, L.F.; Carrasco, J.N.; Herranz, C.M.; Tirapu Leon, J.P.Diagnostic value of quantitative cultures of endotracheal aspirate in ventilator-associated pneumonia:A Multicenter Study. Arch. Bronconeumol. 2003, 39, 394–399.
9. Morris, A.C.; Kefala, K.; Simpson, A.J.; Wilkinson, T.S.; Everingham, K.; Kerslake, D.; Raby, S.; Laurenson, I.F.;Swann, D.G.; Walsh, T.S. Evaluation of the effect of diagnostic methodology on the reported incidence ofventilator-associated pneumonia. Thorax 2009, 64, 516–522. [CrossRef] [PubMed]
10. Torres, A.; Fernandez-Barat, L. New developments in the diagnosis of VAP make bronchoalveolar lavageless useful: Some considerations. Intensive Care Med. 2014, 40, 1778–1779. [PubMed]
11. Correa, R.A.; Luna, C.M.; Anjos, J.C.; Barbosa, E.A.; Rezende, C.J.; Rezende, A.P.; Pereira, F.H.; Rocha, M.O.Quantitative culture of endotracheal aspirate and BAL fluid samples in the management of patients withventilator-associated pneumonia: A randomized clinical trial. J. Bras. Pneumol. 2014, 40, 643–651. [CrossRef][PubMed]
12. Ruiz, M. A randomized trial of diagnostic techniques for ventilator-associated pneumonia. N. Engl. J. Med.2006, 355, 2619–2630.
13. Ruiz, M.; Torres, A.; Ewig, S.; Marcos, M.A.; Alcón, A.; Lledó, R.; Asenjo, M.A.; Maldonado, A. Noninvasiveversus invasive microbial investigation in ventilator-associated pneumonia: Evaluation of Outcome.Am. J. Respir. Crit. Care Med. 2000, 162, 119–125. [CrossRef] [PubMed]
14. Rea-Neto, A.; Youssef, N.C.; Tuche, F.; Brunkhorst, F.; Ranieri, V.M.; Reinhart, K.; Sakr, Y. Diagnosis ofventilator-associated pneumonia: A Systematic Review of the Literature. Crit. Care 2008, 12, R56. [CrossRef][PubMed]
15. Landry, R.M.; An, D.; Hupp, J.T.; Singh, P.K.; Parsek, M.R. Mucin-Pseudomonas aeruginosa interactionspromote biofilm formation and antibiotic resistance. Mol. Microbiol. 2006, 59, 142–151. [CrossRef] [PubMed]

Microorganisms 2017, 5, 62 12 of 13
16. Worlitzsch, D.; Tarran, R.; Ulrich, M.; Schwab, U.; Cekici, A.; Meyer, K.C.; Birrer, P.; Bellon, G.; Berger, J.;Weiss, T.; et al. Effects of reduced mucus oxygen concentration in airway Pseudomonas infections of cysticfibrosis patients. J. Clin. Investig. 2002, 109, 317–325. [CrossRef] [PubMed]
17. Gries, D.M.; Pultz, N.J.; Donskey, C.J. Growth in cecal mucus facilitates colonization of the mouse intestinaltract by methicillin-resistant Staphylococcus aureus. J. Infect. Dis. 2005, 192, 1621–1627. [CrossRef] [PubMed]
18. Hall-Stoodley, L.; Stoodley, P. Evolving concepts in biofilm infections. Cell Microbiol. 2009, 11, 1034–1043.[CrossRef] [PubMed]
19. Costerton, J.W.; Stewart, P.S.; Greenberg, E.P. Bacterial biofilms: A Common Cause of Persistent Infections.Science 1999, 21, 1318–1322. [CrossRef]
20. Trampuz, A.; Piper, K.E.; Jacobson, M.J.; Hanssen, A.D.; Unni, K.K.; Osmon, D.R.; Mandrekar, J.N.;Cockerill, F.R.; Steckelberg, J.M.; Greenleaf, J.F.; et al. Sonication of removed hip and knee prosthesesfor diagnosis of infection. N. Engl. J. Med. 2007, 357, 654–663. [CrossRef] [PubMed]
21. Hoiby, N.; Bjarnsholt, T.; Moser, C.; Bassi, G.L.; Coenye, T.; Donelli, G.; Hall-Stoodley, L.; Hola, V.;Imbert, C.; Kirketerp-Moller, K.; et al. ESCMID guideline for the diagnosis and treatment of biofilm infections.Clin. Microbiol. Infect. 2015, 21, S1–S25. [CrossRef] [PubMed]
22. Marsh, R.L.; Thornton, R.B.; Smith-Vaughan, H.C.; Richmond, P.; Pizzutto, S.J.; Chang, A.B. Detection ofbiofilm in bronchoalveolar lavage from children with non-cystic fibrosis bronchiectasis. Pediatr. Pulmonol.2015, 50, 284–292. [CrossRef] [PubMed]
23. Fernandez-Barat, L.; Li, B.G.; Ferrer, M.; Bosch, A.; Calvo, M.; Vila, J.; Gabarrus, A.; Martinez-Olondris, P.;Rigol, M.; Esperatti, M.; et al. Direct analysis of bacterial viability in endotracheal tube biofilm froma pig model of methicillin-resistant Staphylococcus aureus pneumonia following antimicrobial therapy.FEMS Immunol. Med. Microbiol. 2012, 65, 309–317. [CrossRef] [PubMed]
24. Li, B.G.; Fernandez-Barat, L.; Saucedo, L.; Giunta, V.; Marti, J.D.; Tavares, R.O.; Aguilera, X.E.; Rigol, M.;Roca, I.; Munoz, L.; et al. Endotracheal tube biofilm translocation in the lateral Trendelenburg position.Crit. Care 2015, 19, 59.
25. Martinez-Olondris, P.; Sibila, O.; Agusti, C.; Rigol, M.; Soy, D.; Esquinas, C.; Piner, R.; Luque, N.;Guerrero, L.; Quera, M.A.; et al. An experimental model of pneumonia induced by methicillin-resistentStaphylococcus aureus in ventilated piglets. Eur. Respir. J. 2010, 36, 901–906. [CrossRef] [PubMed]
26. Li, B.G.; Rigol, M.; Marti, J.D.; Saucedo, L.; Ranzani, O.T.; Roca, I.; Cabanas, M.; Munoz, L.; Giunta, V.;Luque, N.; et al. A novel porcine model of ventilator-associated pneumonia caused by oropharyngealchallenge with Pseudomonas aeruginosa. Anesthesiology 2014, 120, 1205–1215.
27. Sibila, O.; Agusti, C.; Torres, A.; Baquero, S.; Gando, S.; Patron, J.R.; Morato, J.G.; Goffredo, D.H.; Bassi, N.;Luna, C.M. Experimental Pseudomonas aeruginosa pneumonia: Evaluation of the associated inflammatoryresponse. Eur. Respir. J. 2007, 30, 1167–1172. [CrossRef] [PubMed]
28. American Association for Respiratory Care. Endotracheal suctioning of mechanically ventilated patientswith artificial airways. Respir. Care 2010, 55, 758–764.
29. Fernandez-Barat, L.; Ciofu, O.; Kragh, K.N.; Pressler, T.; Johansen, U.; Motos, A.; Torres, A.; Hoiby, N. Phenotypicshift in Pseudomonas aeruginosa populations from cystic fibrosis lungs after 2-week antipseudomonaltreatment. J. Cyst. Fibros. 2017, 16, 222–229. [CrossRef] [PubMed]
30. Ciofu, O.; Fussing, V.; Bagge, N.; Koch, C.; Hoiby, N. Characterization of paired mucoid/non-mucoidPseudomonas aeruginosa isolates from Danish cystic fibrosis patients: Antibiotic resistance, beta-lactamaseactivity and RiboPrinting. J. Antimicrob. Chemother. 2001, 48, 391–396. [CrossRef] [PubMed]
31. Hola, V.; Ruzicka, F.; Horka, M. Microbial diversity in biofilm infections of the urinary tract with the use ofsonication techniques. FEMS Immunol. Med. Microbiol. 2010, 59, 525–528. [CrossRef] [PubMed]
32. Stickler, D.J. Bacterial biofilms in patients with indwelling urinary catheters. Nat. Clin. Pract. Urol. 2008, 5,598–608. [CrossRef] [PubMed]
33. Fernandez-Barat, L.; Ferrer, M.; Sierra, J.M.; Soy, D.; Guerrero, L.; Vila, J.; Li, B.G.; Cortadellas, N.;Martinez-Olondris, P.; Rigol, M.; et al. Linezolid limits burden of methicillin-resistant Staphylococcus aureusin biofilm of tracheal tubes. Crit. Care Med. 2012, 40, 2385–2389. [CrossRef] [PubMed]
34. Marquette, C.H.; Copin, M.C.; Wallet, F.; Neviere, R.; Saulnier, F.; Mathieu, D.; Duroche, A.; Ramon, P.;Tonnel, A.B. Diagnostic tests for pneumonia in ventilated patients: Prospective evaluation of diagnosticaccuracy using histology as a diagnostic gold standard. Am. J. Respir. Crit. Care Med. 1995, 151, 1878–1888.[CrossRef] [PubMed]

Microorganisms 2017, 5, 62 13 of 13
35. Jourdain, B.; Joly-Guillou, M.L.; Dombret, M.C.; Calvat, S.; Trouillet, J.L.; Gibert, C.; Chastre, J. Usefulness ofquantitative cultures of BAL fluid for diagnosing nosocomial pneumonia in ventilated patients. Chest 1997,111, 411–418. [CrossRef] [PubMed]
36. Burillo, A.; Marin, M.; Cercenado, E.; Ruiz-Carrascoso, G.; Perez-Granda, M.J.; Oteo, J.; Bouza, E. Evaluationof the Xpert Carba-R (Cepheid) Assay Using Contrived Bronchial Specimens from Patients with Suspicion ofVentilator-Associated Pneumonia for the Detection of Prevalent Carbapenemases. PLoS ONE 2016, 11, e0168473.[CrossRef] [PubMed]
37. Souza, L.C.D.; Mota, V.B.R.D.; Carvalho, A.V.D.S.; Correa, R.D.G.C.; Liberio, S.A.; Lopes, F.F. Association betweenpathogens from tracheal aspirate and oral biofilm of patients on mechanical ventilation. Braz. Oral Res. 2017,31, e38. [CrossRef] [PubMed]
38. Garcia-Nunez, M.; Marti, S.; Puig, C.; Perez-Brocal, V.; Millares, L.; Santos, S.; Ardanuy, C.; Moya, A.;Linares, J.; Monso, E. Bronchial microbiome, PA biofilm-forming capacity and exacerbation in severe COPDpatients colonized by P. aeruginosa. Future Microbiol. 2017, 12, 379–392. [CrossRef] [PubMed]
39. Kalil, A.C.; Metersky, M.L.; Klompas, M.; Muscedere, J.; Sweeney, D.A.; Palmer, L.B.; Napolitano, L.M.;O’Grady, N.P.; Bartlett, J.G.; Carratala, J.; et al. Management of Adults With Hospital-Acquired andVentilator-Associated Pneumonia: Clinical Practice Guidelines by the Infectious Diseases Society of Americaand the American Thoracic Society. Clin. Infect. Dis. 2016, 63, e61–e111. [CrossRef] [PubMed]
© 2017 by the authors. Licensee MDPI, Basel, Switzerland. This article is an open accessarticle distributed under the terms and conditions of the Creative Commons Attribution(CC BY) license (http://creativecommons.org/licenses/by/4.0/).


