
Page 1 of 20
Product Catalogue
for gke Steri-Record®
Biological Indicators, Process Challenge Devices and Accessories
Spore Strips,
Ampoules, Suspensions,
Self-contained Mini-Bio-Plus Indicators
to monitor steam, formaldehyde, hydorgen peroxide,
ethylene oxide and dry heat sterilization processes

Page 1 of 20
Content
General Information about biological indicators ................................................................. 4
Self-contained biological indicators ..................................................................................... 4
For steam sterilization processes ............................................................................................. 4
For formaldehyde sterilization processes ................................................................................. 5
For hydrogen peroxide sterilization processes .......................................................................... 5
For ethylene oxide sterilization processes ................................................................................ 5
Bio-Compact-PCDs and replacement parts .............................................................................. 6
Cruher for Mini-Bio-Plus indicators ........................................................................................... 6
Stearo-Ampoules .................................................................................................................... 7
Incubator and accessories .................................................................................................... 7
Suspensions ........................................................................................................................... 8
Geob. stearothermophilus ........................................................................................................ 8
B. atrophaeus ........................................................................................................................... 8
Direct inoculation kit ................................................................................................................. 8
Bio-Indicator spore strips ...................................................................................................... 9
For steam and formaldehyde sterilization processes ................................................................ 9
For hydrogen peroxide sterilization processes .......................................................................... 9
For ethylene oxide and dry heat sterilization processes ........................................................... 9
Growth media ....................................................................................................................... 10
Basic principles in kill kinetics .......................................................................................... 11

Page 2 of 20
General Information about biological indicators Sterilization procedures in hospitals have reached a high standard of quality. Necessary monitoring pro-
cedures are costly, however important, to ensure long-term asepsis in all fields of surgical operations.
International and local standards and directives like the European Medical Device Directive (MDD) re-
quire validation, batch monitoring and documentation of sterilization processes.
Besides industry, healthcare facilities must follow the same validation, monitoring and documentation
procedures. Validation and monitoring of sterilization processes is carried out by parametric, chemical
and/or biological tests. The validation using biological indicators is necessary if:
the structure of the goods to be sterilized is such that physical sensors cannot be applied (e.g.: small
holes, gaps, sealed areas, coatings with oils etc.)
lumens of hollow devices are so tiny that the temperature difference between non-condensable
gases (inside) and steam (outside) is not detectable. Gases in such small lumens of several 100 µl
heat up very quickly to the steam-temperature-level.
the presence of water condensate cannot be detected by physical means (e.g.: If the temperature
gradient in the process is so slow that encapsulated non-condensable gases have time to heat up
and do not show a detectable temperature difference.)
the surface structure of the medical devices requires specific testing (e.g.: porous rubber stoppers)
the sterilizing agent, the goods to be sterilized and/ or packaging contain salts. The salts may get
dissolved in the condensate film and cause big changes of the resistance characteristics.
the condensate contains substances changing the pH-value (e.g.: corrosion-inhibitors) or the material
of medical instruments (e.g.: aluminum surfaces) may react with water creating basic hydroxides.
In above cases all surfaces or liquids have to be inoculated with biological indicator suspensions. After a
validated population determination, reduced process cycles have to be carried out to achieve survivor
curves to determine the kill kinetics on/ in those critical areas. For porous loads and hollow process chal-
lenge devices (PCDs) biological indicators may be used to monitor the process conditions in such critical
internal areas.
Biological indicators are defined in the European and International Standards EN ISO 11138 parts 1-5.
For most of the commonly used sterilization processes special reference biological germs have been
selected, such as Geobacillus stearothermophilus for steam, formaldehyde and hydrogen peroxide ster-
ilisation processes, Bacillus atrophaeus for ethylene oxide and dry heat sterilisation processes and Bacil-
lus pumilus for radiation sterilisation processes.
Depending on the type of sterilization process, a special resistance characteristic of biological indicators
is required, to prove the success of a defined sterilization process. During such a sterilization process the
spore population always decreases due to the exponential kill characteristic called reaction kinetics first
order. The population however, will never reach an absolute 0-value. Therefore modern definitions of
goods declared “sterile” do not specify the absolute absence of biological activity, but determine aseptic
conditions with the certain probability, called Sterility Assurance Level (SAL).
According to the European Standard EN 556 the minimum SAL has to be 10-6 CFU/per part or better.
This means that out of 1 million units, no more than 1 unit may show growth.

Page 3 of 20
Both the kill kinetics and the penetration characteristics of a sterilization process have to be monitored.
The kill kinetics is monitored by the right type of bacteria with the total resistance of a biological indicator.
The total resistance of a biological indicator depends on the population and resistance of each individual
germ. The resistance of each individual germ is defined by the decimal reduction value which is the time
needed to reduce the population of a biological indicator to one tenth of the original population. The total
resistance of a biological indicator is expressed by the FBIO value:
FBIO = D121°C value x log (population)
This fact may be demonstrated by the 2 examples below in the table.
Example Population
[CFU/unit]
D121 value
[min]
FBio value
[min]
1 106 1,5 9
2 105 2 10
As seen above, the D-value of a given strain is never constant and depends on growth and process con-
dition. Therefore, for each batch of biological indicators certificates must be associated to the product
indicating the population, individual resistance and the total resistance of a biological indicator.
gke offers its Steri-Record biological indicators according to EN ISO 11138 series. All packs contain
a certificate with all necessary information mentioned above. More information is available from our tech-
nical data sheet. Each individual package contains a direction for use.
After the biological indicator has passed the sterilization process, all treated spore strips have to remain
in the glassine envelopes. They should be sent with one marked untreated spore strip to a microbiologi-
cal lab. All strips should be aseptically transferred into Tryptic Soja broth (TSB) and developed for at least
7 days. If there is any doubt about the spore type, 1 ml of solution may be developed on TS agar plates
(TSA) to determine the spore type. TSA vials without a spore strip should not show any growth, the un-
treated spore strip should show vital growth. Growth of treated spore strips have to be determined indi-
vidually (see our technical information). gke offers growth medium test tubes with pH-indicator for faster
evaluation.
Self-contained biological indicators contain growth media in a separate vial and may be developed di-
rectly at the user’s site. They must not be used in dry heat or formaldehyde sterilization processes. For
information in more detail, please see our enclosed data sheet “self-contained biological indicators”.
The penetration characteristics are monitored using Process Challenge Devices (PCDs) representing the
“worst-case” penetration characteristics of a load. PCDs as described in EN 867-5 “Hollow Load Test”
and in DIN 58921 may be used. Biological indicators are used inside to check the penetration of the ster-
ilization agent.

Page 4 of 20
1. gke Steri-Record® Self-contained biological indicators
Mini-Bio-Plus self-contained biological indicators (SCBI) uses a plastic vial containing a spore
plate and glass ampoule with a growth medium and pH-indicator inside. It is used for validation
and routine monitoring of most sterilization processes without using a microbiological laboratory.
For a better differentiation of the SCBI versions all have different coloured caps. They can also
be used inside gke process challenge devices (Bio-C-PCDs), see 1.5. All SCBI fulfill the re-
quirements according to EN ISO 11138-1.
1.1. for steam sterilization processes according to EN ISO 11138-3 G. Stearthermophilus, available with population of 105 and 106, paper carrier
Two versions are available:
1. Standard version with incubation time of 24 hours 2. Instant version for immediate release
The Instant-Mini-Bio-Plus SCBI contains a class 5 chemical indicator allowing that the result
of steam sterilization processes can be instantly evaluated at the end of the sterilization
process. Therefore, is is not necessary to wait for the result of the SCBI incubation since the
class 5 indicator provides equivalent or better information about the result of the sterilization
process according to EN ISO 11140-1.
Art-No. Product Code Colour of cap Population Quantity
Standard version (incubation time 24 h)
324-501
B-S-MBP-10-5 Light blue 105
10
324-505 50
324-510 100
324-601
B-S-MBP-10-6 Dark blue 106
10
324-605 50
324-610 100
Art-No. Product Code Colour of cap Population Quantity
Instant version for immediate release
324-551
B-S-MBP-I-10-5 Light orange 105
10
324-555 50
324-550 100
324-651
B-S-MBP-I-10-6 Dark orange 106
10
324-655 50
324-650 100
STEAM

Page 5 of 20
1.2. for formaldehyde (LTSF) sterilization processes according to EN ISO 11138-5 G. stearothermophilus available with population of 106, paper carrier
The growth medium also contains a neutralization agent for remaining formaldehyde, so that the
pretreatment with Na2SO3 is not required as described in EN ISO 11138-5.
1.3. for all hydrogen peroxide / plasma sterilization processes G. stearothermophilus, available with population of 106, free of cellulose carrier
1.4. for ethylene oxide sterilization processes according to EN ISO 11138-2 B. atrophaeus, available with population of 106, paper carrier
Art-No. Product Code Colour of cap Population Quantity
325-601 B-F-MBP-10-6 Yellow 106
10
325-605 50
Art-No. Product Code Colour of cap Population Quantity
327-601 B-V-MPB-10-6 White 106
10
327-605 50
Art-No. Product Code Colour of cap Population Quantity
326-605 B-E-MBP-10-6 Red 106
50
326-610 100
VH2O2
EO
FORM

Page 6 of 20
1.5. Process Challenge Device for self-contained biological indicators Bio-C-PCDs, colour: green, to be used with all Mini-Bio-Plus SCBIs decribed before,
for validation and routine monitoring of steam, ethylene oxide, formaldehyde and hy-
drogen peroxide sterilization processes.
It is recommended to use the round versions in large and the oval versions in small
sterilizers. A PCD with SCBI placed inside is called a class 2 indicator according to
EN ISO 11140-1.
Each PCD contains 10 seal rings in addition for replacement in the screw cap.
1.6 Accessories 1.6.1 Replacement parts for PCD
1.6.2 Crusher for SCBIs to activate all gke SCBIs. The gke incubator already includes a crusher.
Art-No. Product code PCD
version Penetration
characteristics
300-011 B-PM-OCPCD-1 oval Minimal requirements
for air removal 300-016 B-PM-RCPCD-1 round
300-012 B-PM-OCPCD-2 oval Low requirements
for air removal 300-017 B-PM-RCPCD-2 round
300-013 B-PM-OCPCD-3 oval Air removal less difficult than
Hollow Load Test
according to EN 867-5
(Draft EN ISO 11140-6) 300-018 B-PM-RCPCD-3 round
300-014 B-PM-OCPCD-4 oval Air removal equal to
Hollow Load Test
according to EN 867-5
(Draft EN ISO 11140-6) 300-019 B-PM-RCPCD-4
round 300-015 B-PM-RCPCD-5
Air removal more difficult than
Hollow Load Test
according to EN 867-5
(Draft EN ISO 11140-6)
Art-No. Product code Quantity
300-005 Replacement screw cap
(with M14x1 thread) 5
300-006 Replacement seal kit
for all Bio-C-PCDs 10
Art-No. Product code Quantity
224-002 I-C 1
STEAM
VH2O2
FORM
EO

Page 7 of 20
2. gke Steri-Record® Stearo-Ampoules with G. stearothermophilus
suspension and growth medium according to EN ISO 11138-1 + 3
to monitor extreme wet steam or liquid sterilization processes. The ampoule contains a 1.5 ml
Geob. Stearothermophilus suspension with growth medium and pH-indicator, available with popu-
lations of 105 and 106.
3. gke Steri-Record® Incubator and accessories
3.1. Incubator and corresponding aluminium blocks The incubator is available in four versions with different temperatures. The incubation temperature is
visible in the display. The incubator will be delivered without aluminium block. It can be ordered
separately and is avaible for different applications. The plug contains a CE conformity for the low
voltage directive.
Art-No. Product code Population Quantity
225-550 B-S-AMP-10-5 105 50
225-650 B-S-AMP-10-6 106
Art-No. Product code Content Temperature
[°C]
610-109 I-37 Incubator
37
610-110 I-57 57
610-111 I-V Incubator with variable
temperature selection
30-60
610-112 I-V-T
Incubator with variable tempera-
ture selection and programming
of the incubation time
610-113 I-AB-MBP Aluminium block for all gke
Steri-Record® SCBIs,
containing cruher for SCBIs -
610-114 I-AB-AMP Aluminium block for all gke
Steri-Record® stearo-ampuoles +
test tubes with growth medium
STEAM
Page 8 of 20
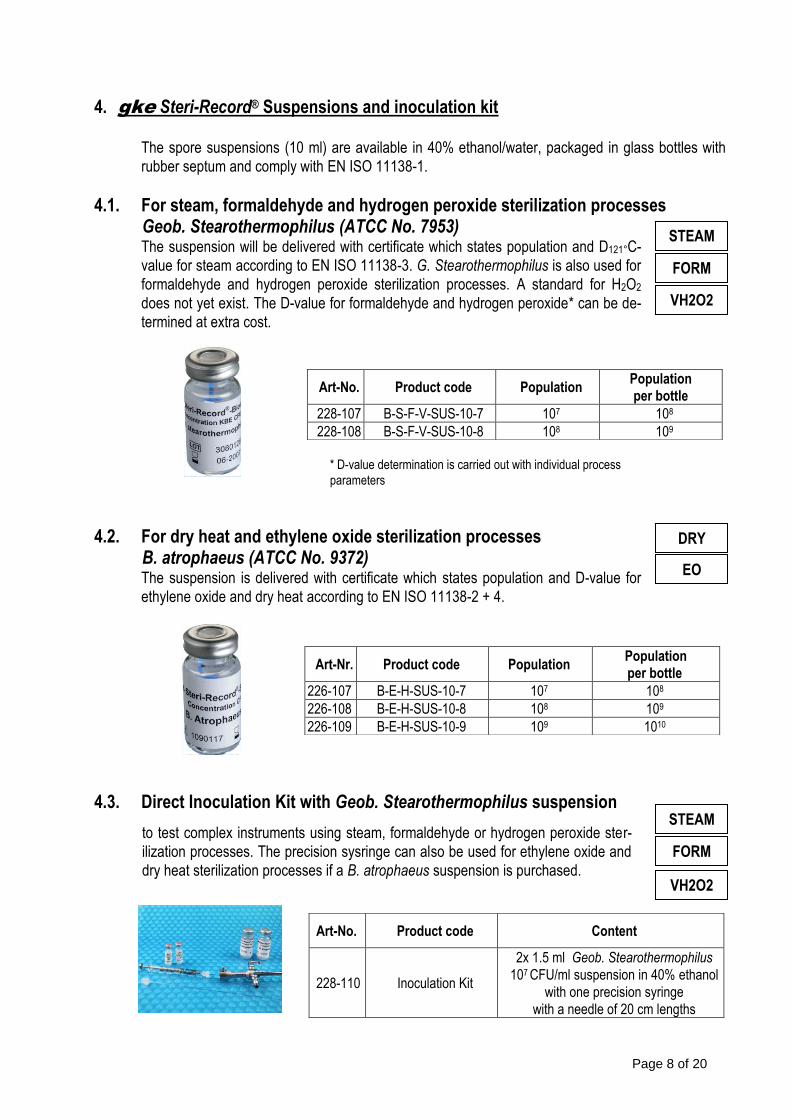
4. gke Steri-Record® Suspensions and inoculation kit
The spore suspensions (10 ml) are available in 40% ethanol/water, packaged in glass bottles with
rubber septum and comply with EN ISO 11138-1.
4.1. For steam, formaldehyde and hydrogen peroxide sterilization processes Geob. Stearothermophilus (ATCC No. 7953) The suspension will be delivered with certificate which states population and D121°C-
value for steam according to EN ISO 11138-3. G. Stearothermophilus is also used for
formaldehyde and hydrogen peroxide sterilization processes. A standard for H2O2
does not yet exist. The D-value for formaldehyde and hydrogen peroxide* can be de-
termined at extra cost.
* D-value determination is carried out with individual process
parameters
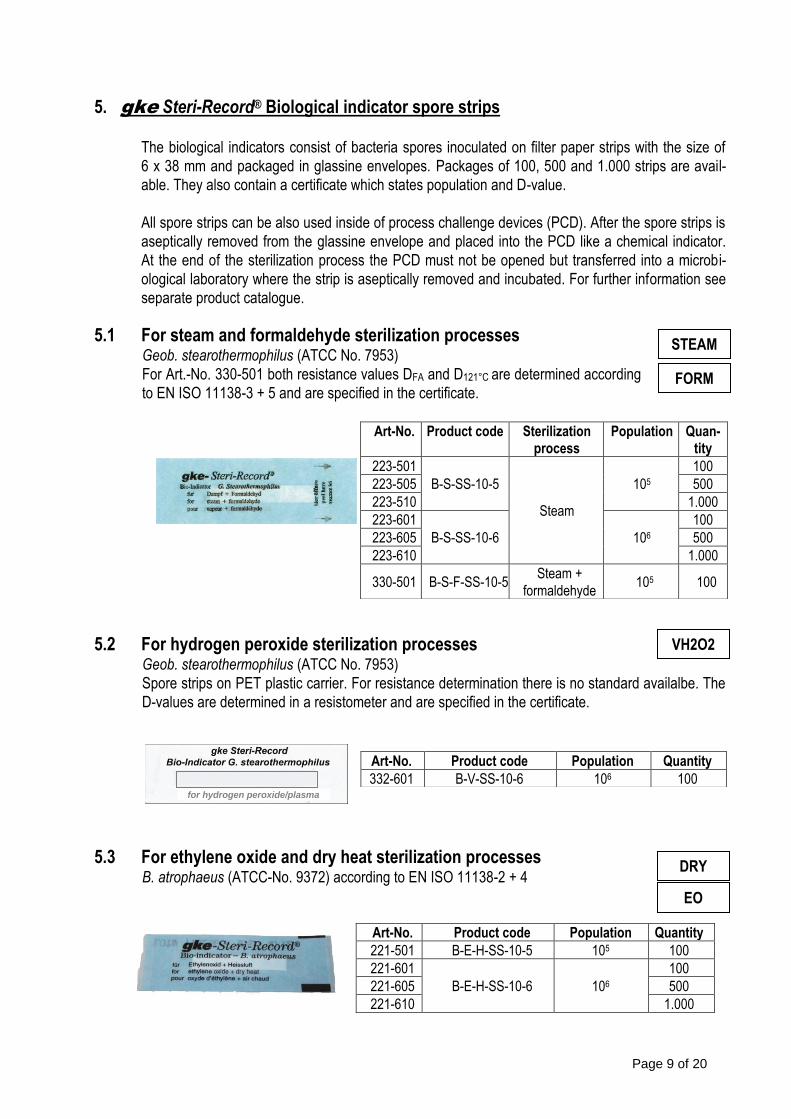
4.2. For dry heat and ethylene oxide sterilization processes B. atrophaeus (ATCC No. 9372) The suspension is delivered with certificate which states population and D-value for
ethylene oxide and dry heat according to EN ISO 11138-2 + 4.
4.3. Direct Inoculation Kit with Geob. Stearothermophilus suspension
to test complex instruments using steam, formaldehyde or hydrogen peroxide ster-
ilization processes. The precision sysringe can also be used for ethylene oxide and
dry heat sterilization processes if a B. atrophaeus suspension is purchased.
Art-No. Product code Population Population per bottle
228-107 B-S-F-V-SUS-10-7 107 108
228-108 B-S-F-V-SUS-10-8 108 109
Art-Nr. Product code Population Population per bottle
226-107 B-E-H-SUS-10-7 107 108
226-108 B-E-H-SUS-10-8 108 109
226-109 B-E-H-SUS-10-9 109 1010
Art-No. Product code Content
228-110 Inoculation Kit
2x 1.5 ml Geob. Stearothermophilus
107 CFU/ml suspension in 40% ethanol
with one precision syringe
with a needle of 20 cm lengths
VH2O2
STEAM
FORM
EO
STEAM
VH2O2
DRY
FORM
Page 9 of 20
5. gke Steri-Record® Biological indicator spore strips
The biological indicators consist of bacteria spores inoculated on filter paper strips with the size of
6 x 38 mm and packaged in glassine envelopes. Packages of 100, 500 and 1.000 strips are avail-
able. They also contain a certificate which states population and D-value.
All spore strips can be also used inside of process challenge devices (PCD). After the spore strips is
aseptically removed from the glassine envelope and placed into the PCD like a chemical indicator.
At the end of the sterilization process the PCD must not be opened but transferred into a microbi-
ological laboratory where the strip is aseptically removed and incubated. For further information see
separate product catalogue.
5.1 For steam and formaldehyde sterilization processes Geob. stearothermophilus (ATCC No. 7953)
For Art.-No. 330-501 both resistance values DFA and D121°C are determined according
to EN ISO 11138-3 + 5 and are specified in the certificate.
5.2 For hydrogen peroxide sterilization processes
Geob. stearothermophilus (ATCC No. 7953)
Spore strips on PET plastic carrier. For resistance determination there is no standard availalbe. The
D-values are determined in a resistometer and are specified in the certificate.
5.3 For ethylene oxide and dry heat sterilization processes B. atrophaeus (ATCC-No. 9372) according to EN ISO 11138-2 + 4
Art-No. Product code Sterilization process
Population Quan-tity
223-501
B-S-SS-10-5
Steam
105
100
223-505 500
223-510 1.000
223-601
B-S-SS-10-6 106
100
223-605 500
223-610 1.000
330-501 B-S-F-SS-10-5 Steam +
formaldehyde 105 100
Art-No. Product code Population Quantity
332-601 B-V-SS-10-6 106 100
Art-No. Product code Population Quantity
221-501 B-E-H-SS-10-5 105 100
221-601
B-E-H-SS-10-6 106
100
221-605 500
221-610 1.000
EO
FORM
VH2O2
STEAM
DRY
for hydrogen peroxide/plasma

Page 10 of 20
6. Growth media in test tubes
Test tubes with CASO-Boullion (TSB) with pH-indicator and plastic screw cap.
The test tubes have optimized dimensions and volume to fit all kind of spore strips. If germs are
growing the pH-indicator changes its colour and allows a quick evaluation of the result.
6.1 For steam and hydrogen peroxide sterilization processes G. stearothermophilus
6.2 For formaldehyde sterilization processes G. stearothermophilus
The growth medium contains a neutralization agent for remaining formaldehyde, so that the pre-
treatment with Na2SO3 is not required as described in EN ISO 11138-5.
6.3 For ethylene oxide and dry heat sterilization processes B. atrophaeus
Art-No. Product code Quantity
223-010 B-S-V-CM
10
223-100 100
Art-No. Product code Quantity
330-010 B-F-CM
10
330-100 100
Art-No. Product code Quantity
221-010 B-E-H-CM
10
221-100 100
STEAM
VH2O2
FORM
DRY
EO
Page 11 of 20
Basic Principles in Kill Kinetics and Design of Sterilization Processes
Author: Dr. Ulrich Kaiser, gke GmbH
Content: 1. Kill kinetics in sterilization processes 1.1. Definition of reaction kinetics first order 1.2. Inactivation factor 1.3. Decimal reduction factor (D-value) 1.4. Experimental determination of the D-value 1.4.1. MPN-Method (most probable number) 1.4.2. Determination using the survivor curve 2. Definition of the sterility assurance level 2.1. Definition of a sterile product according to the European standard EN 556-1 3. Temperature dependence of sterilization processes 3.1. Arrhenius equitation 3.2. Definition of the set value 4. Sterilization equivalence value (F(T,z)-value) 4.1. Definition of F0-value 4.2. Other F(T,z)-values 5. Definition of sterilization processes 5.1. Process definition with known bioburden values 5.2. Process definition with unknown bioburden values 6. Requirements and selection of biological indicators for validation and routine monitoring 6.1. Selection of strain 6.2. Resistance of biological indicators 6.3. Selection of biological indicators for routine monitoring 6.4. Positioning of biological indicators 7. Glossary of symbols used within the text

Page 12 of 20
1. Kill kinetics in sterilization processes
The mathematical laws for the inactivation of microorganisms are very similar in most sterili-zation processes under the condition that the physical and/or chemical parameters remain constant during the sterilization procedure. Even if the sterilization conditions are constant, the resistance of the same strain may be quite different depending on the vegetative growth and sporulation conditions. Even spores of identical strain with the same reference num-ber (i.e. G. Stearothermophilus ATCC 7953) may be quite different and may vary by a factor up to 10. Under the condition using identical germs and sterilization processes the velocity of kill is only dependent on the existing amount of live germs measured in colony forming unit (CFU). The kill kinetics equitation has been proven valid for dry heat, steam, formaldehyde, eth-ylene oxide and hydrogen peroxide sterilization processes.
0
100000
200000
300000
400000
500000
600000
700000
800000
900000
1000000
1100000
0 2 4 6 8 10 12 14 16
time [min]
co
lon
y f
orm
ing
un
its
[C
FU
/pa
rt]
110 °C
121 °C
134 °C
Diagram 1: Survival curve for steam sterilization at different temperatures
1.1 Definition of reaction kinetics first order
The kill velocity in sterilization processes is described by equitation 1 and describes the reduction of the germ amount N over the time t and is called reaction velocity.
Nkdt
dN ' = Reation velocity (1)
t = Sterilization time [min] N = Nominal population on a medical de-vice [CFU] k’ = Reaction kinetics constant using the natural logarithm [min
-1]
The reaction velocity [dN/dt] is always propor-tional to the current existing amount of alive germs in the process. The proportional con-stant k’ is called reaction kinetics constant. k’
describes the kind of sterilization process. The constant is dependant in thermal processes on temperature, in chemical processes also on the gas concentration. If equitation 1 is integrated and the natural logarithm is exchanged against the decade logarithm the new reaction kinetics constant k is defined:
0lgF
Nk t
N (2)
t = Sterilization time [min] N0 = Number of germs when starting the
process [CFU] NF = Number of germs after sterilization
[CFU] IF = Inactivation Factor [number] k = reaction kinetics constant [min
-1] (valid
for the decade logarithm)
1.2 Inactivation factor In diagram 1 the colony forming units [CFU] are plotted on a linear scale showing e-function curves. If the same diagram is plotted on a half logarithmic scale, the curves become a straight line for the same type of germs if steam, ethyl-ene oxide, dry heat and LTSF sterilization processes are used. If the line is not straight, the same population may contain germs of the same strain but with different resistance. Due to their complex chemical process hydrogen peroxide sterilization processes do not form a straight line. Equitation 2 can be changed to:
IFtkNN F lglg 0 (3)
The term inactivation factor (IF) describes the efficacy of a sterilization process. If a steriliza-tion starts with 10
6 [CFU] and finishes with 10
2
[CFU], there is a population reduction of the power of 4 or has an inactivation factor IF = 4.
1.3 Decimal reduction factor (D-value) The decimal reduction factor, quite often called D-value, represents the resistance characteris-tic of an individual germ for a defined steriliza-tion process. The D-value determines how long a germ must be inside of a sterilization process to reduce the starting population by 90% of the starting bioburden. In steam, ethylene oxide, formaldehyde, dry heat and hydrogen peroxide sterilization processes the D-value is ex-pressed in a time scale [min.]. If a radiation

Page 13 of 20
sterilization process is used, it is expressed in the radiation dose [in Mrad]. The D-value may be experimentally determined by plotting the logarithm of the still remaining population in the sterilization process against the time, the recip-rocal slope of the straight line is the definition of the D-value. The D-value is only valid for a defined sterilization process and a defined germ. In a steam sterilization process the D-value contains in the index the sterilization temperature. The certificate of a biological indicator must always specify under which conditions the D-value is tested. The D-value is very temperature dependent as shown in dia-gram 2.
kDT
1 (4)
DT = Decimal Reduction Factor [min] or
[Mrad] at a tested temperature [t] k = Reaction kinetics constant of the deci-
mal logarithm [min-1
] Diagram 2: Definition of the D-value at different tem-peratures
If equitation 4 is put into equitation 3, the result is:
IFD
tNN
T
F lglg 0
(5)
N0 = Starting bioburden [CFU] NF = Number of germs after sterilization [CFU] DT = Decimal reduction factor [min] or [Mrad] (DT-value) t = Sterilization time [min] IF = Inactivation factor [number]
(Decimal reduction level) The coefficient of sterilization time divided by the D-value provides also the inactivation factor equivalent to the number of decimal reduction steps. A D-value time equivalent reduces the popula-tion by 90% or one decimal reduction step.
If the D-value is known, it is possible to calcu-late the sterilization time to reduce the popula-tion by defined amount of decimal reduction steps independent from the starting population. If the starting population N0 is changed, the final population is changing accordingly, if the same sterilization process is used. Therefore the starting population, also called bioburden, determines the result of the final number of germs NF. To get the necessary sterilization time, equitation 5 can be changed accordingly:
TTF DIFDNNt )lg(lg 0 (6)
1.4 Experimental determination of the re-
sistance (DT) of a biological indicator
The resistance (D-value) may be determined with two methods according to EN ISO 11138-1 (see Annex C and D) or with the determination of the survival kill window (see Annex E of the standard).
1.4.1 D-Value Determination using the
MPN-Method
(most probable number)
Biological indicators with a defined population are put in several steam sterilization processes with modified sterilization times where all other process variables remain constant except the time. For each sterilization time a minimum of 20 biological indicators are required. After ster-ilization the biological indicators are checked for growth. A minimum of 7 different steriliza-tion time are to be tested.
a) minimum 1 sterilization time where all biological indicators are growing
b) minimum 4 sterilization times where at least some biological indicators are growing
c) minimum 2 sterilization times where no growth of biological indictors is de-tected.
Using the above results the D-value will be calculated using the equitations below.
Sterilization
time
Number of
trials
Number of
trials with-
out growth
[ti] [ni] [ri]
t1 n1 r1 = 0
t2 n2 r2
t3 n3 r3
t4 n4 r4
t5 n5 r5
t6 n6 r6
t7 n7 r7

Page 14 of 20
t1 is the shortest sterilization time where all BIs should grow. The sterilization times t1 – t7 are increasing sterilization times using the result of t6 and t7should not show alive BIs. Using these data the factors x and y are calcu-lated for the sterilization times t1 – t7.
2
)1(
ii
i
ttx (7)
i
i
i
i
in
r
n
ry
)1(
)1( (8)
For t1 where all samples show growth r1 = 0. In this case yi is determined by:
)1(
)1(
i
i
in
ry (9)
Using the calculated values of xi and yi the sterilization time µi may be calculated:
iii yx [min] (10)
The mean sterilization time which does not
show growth may be calculated summarizing all µi:
6
0
i
i
i [min] (11)
If the interval d between the sterilization times is constant, and the same number of tests for each sterilization time is used, the mean value
for no growth may be calculated using the
following equitation:
6
1
62
i
i
irn
ddt [min] (12)
The mean D-value will be calculated using the equitation:
0lg2507,0 ND
[min] (13)
where N0 is the starting population CFU/test.
1.4.2 D-Value Determination using the
survivor curve
Biological indicators have to be sterilized with different sterilization times where all process variables have to remain constant except the time. 5 different sterilization times should be used:
a) One exposure in which the sample is not subjected to the sterilant (e.g. 0 time exposure)
b) At least one exposure in which the vi-able population is reduced to 0,01 % of the original inoculums (4 log10 reduc-tion)
c) A minimum of three exposures cover-ing the intervals between exposure a) und exposure b) above.
Not less than four test samples shall be used for each exposure in each determination. The same number of replicates shall be used for each exposure. A minimum of 2 consecutive tests shall be carried out. For each test a minimum of 4 bio-logical indicators shall be used. After steriliza-tion the population of the biological indicator is determined using the method provided by the manufacturer. The logarithm of the remaining germ population is plotted against the steriliza-tion time. The reciprocal slope provides the D-value in minutes.
1.4.3 Survival/kill window
The survivor/kill window is defined with the guaranteed survival of a biological indicator. A biological indicator shall contain a minimum of 100 germs, if it has been inside of a steriliza-tion process with the initial population N0 for the following sterilization time: Survival time = (log N0 - 2) x D [min] The guaranteed kill of a biological indicator occurs after the following sterilization time at 121°C: Kill time = (log N0 + 4) x D [min] This sterilization time determines a sterility assurance level of SAL = 10
-4 (every 10.000th
germ may remain alive).
Page 15 of 20
0,000001
0,00001
0,0001
0,001
0,01
0,1
1
10
100
1000
10000
100000
1000000
10000000
0 2 4 6 8 10 12 14 16 18 20 22 24 26 28 30
Time [min]
107
106
105
104
103
102
101
100
10-1
10-3
10-4
10-5
10-6 = SAL
(according EN 556)
Survival –
Kill-Window
― Bio-Burden = Various germs with different population
and resistance
― Biological indicators (BI) = Germs with defined
population and resistance
FBio-Value FO-Value
Sterility Assurance
Level (SAL)
Dxx-Value
Number of micro-biological
Survivors [CFU/part]
0,000001
0,00001
0,0001
0,001
0,01
0,1
1
10
100
1000
10000
100000
1000000
10000000
0 2 4 6 8 10 12 14 16 18 20 22 24 26 28 30
Time [min]
107
106
105
104
103
102
101
100
10-1
10-3
10-4
10-5
10-6 = SAL
(according EN 556)
Survival –
Kill-Window
― Bio-Burden = Various germs with different population
and resistance
― Biological indicators (BI) = Germs with defined
population and resistance
FBio-Value FO-Value
Sterility Assurance
Level (SAL)
Dxx-Value
Number of micro-biological
Survivors [CFU/part]107
106
105
104
103
102
101
100
10-1
10-3
10-4
10-5
10-6 = SAL
(according EN 556)
Survival –
Kill-Window
― Bio-Burden = Various germs with different population
and resistance
― Biological indicators (BI) = Germs with defined
population and resistance
FBio-Value FO-Value
Sterility Assurance
Level (SAL)
Dxx-Value
Number of micro-biological
Survivors [CFU/part]
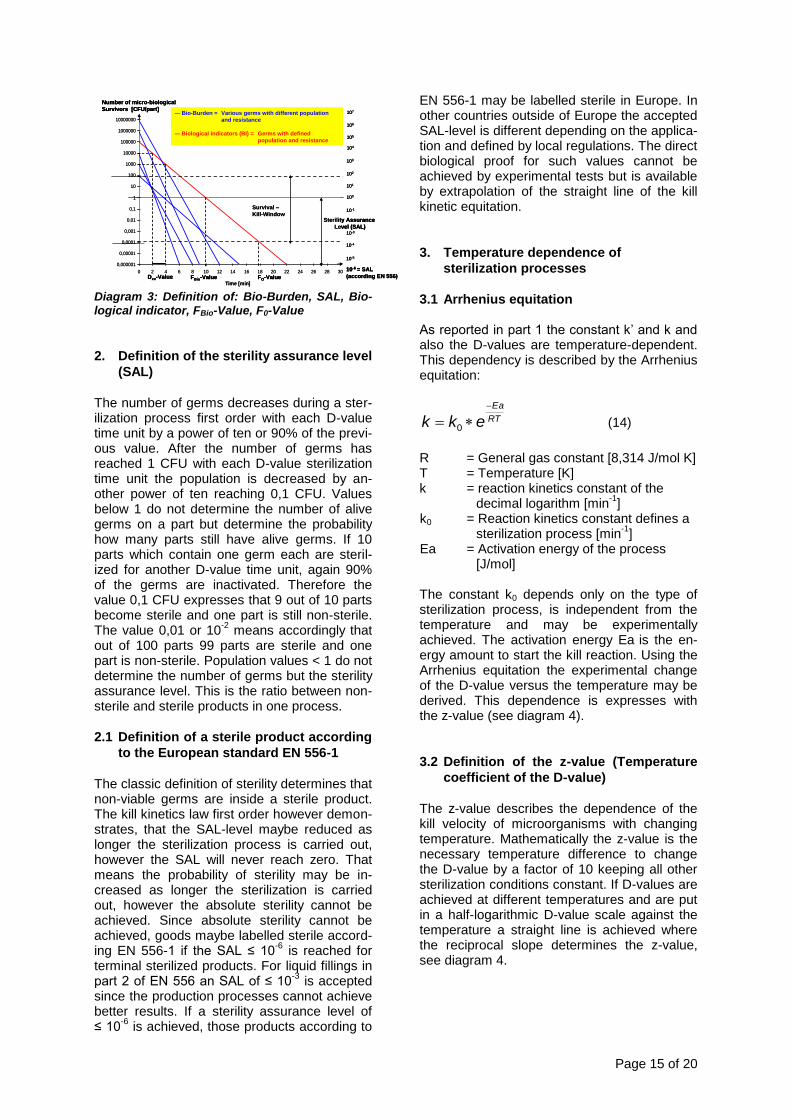
Diagram 3: Definition of: Bio-Burden, SAL, Bio-logical indicator, FBio-Value, F0-Value
2. Definition of the sterility assurance level
(SAL)
The number of germs decreases during a ster-ilization process first order with each D-value time unit by a power of ten or 90% of the previ-ous value. After the number of germs has reached 1 CFU with each D-value sterilization time unit the population is decreased by an-other power of ten reaching 0,1 CFU. Values below 1 do not determine the number of alive germs on a part but determine the probability how many parts still have alive germs. If 10 parts which contain one germ each are steril-ized for another D-value time unit, again 90% of the germs are inactivated. Therefore the value 0,1 CFU expresses that 9 out of 10 parts become sterile and one part is still non-sterile. The value 0,01 or 10
-2 means accordingly that
out of 100 parts 99 parts are sterile and one part is non-sterile. Population values < 1 do not determine the number of germs but the sterility assurance level. This is the ratio between non-sterile and sterile products in one process.
2.1 Definition of a sterile product according
to the European standard EN 556-1
The classic definition of sterility determines that non-viable germs are inside a sterile product. The kill kinetics law first order however demon-strates, that the SAL-level maybe reduced as longer the sterilization process is carried out, however the SAL will never reach zero. That means the probability of sterility may be in-creased as longer the sterilization is carried out, however the absolute sterility cannot be achieved. Since absolute sterility cannot be achieved, goods maybe labelled sterile accord-ing EN 556-1 if the SAL ≤ 10
-6 is reached for
terminal sterilized products. For liquid fillings in part 2 of EN 556 an SAL of ≤ 10
-3 is accepted
since the production processes cannot achieve better results. If a sterility assurance level of ≤ 10
-6 is achieved, those products according to
EN 556-1 may be labelled sterile in Europe. In other countries outside of Europe the accepted SAL-level is different depending on the applica-tion and defined by local regulations. The direct biological proof for such values cannot be achieved by experimental tests but is available by extrapolation of the straight line of the kill kinetic equitation.
3. Temperature dependence of
sterilization processes
3.1 Arrhenius equitation As reported in part 1 the constant k’ and k and also the D-values are temperature-dependent. This dependency is described by the Arrhenius equitation:
RT
Ea
ekk
0 (14)
R = General gas constant [8,314 J/mol K] T = Temperature [K] k = reaction kinetics constant of the decimal logarithm [min
-1]
k0 = Reaction kinetics constant defines a sterilization process [min
-1]
Ea = Activation energy of the process [J/mol] The constant k0 depends only on the type of sterilization process, is independent from the temperature and may be experimentally achieved. The activation energy Ea is the en-ergy amount to start the kill reaction. Using the Arrhenius equitation the experimental change of the D-value versus the temperature may be derived. This dependence is expresses with the z-value (see diagram 4).
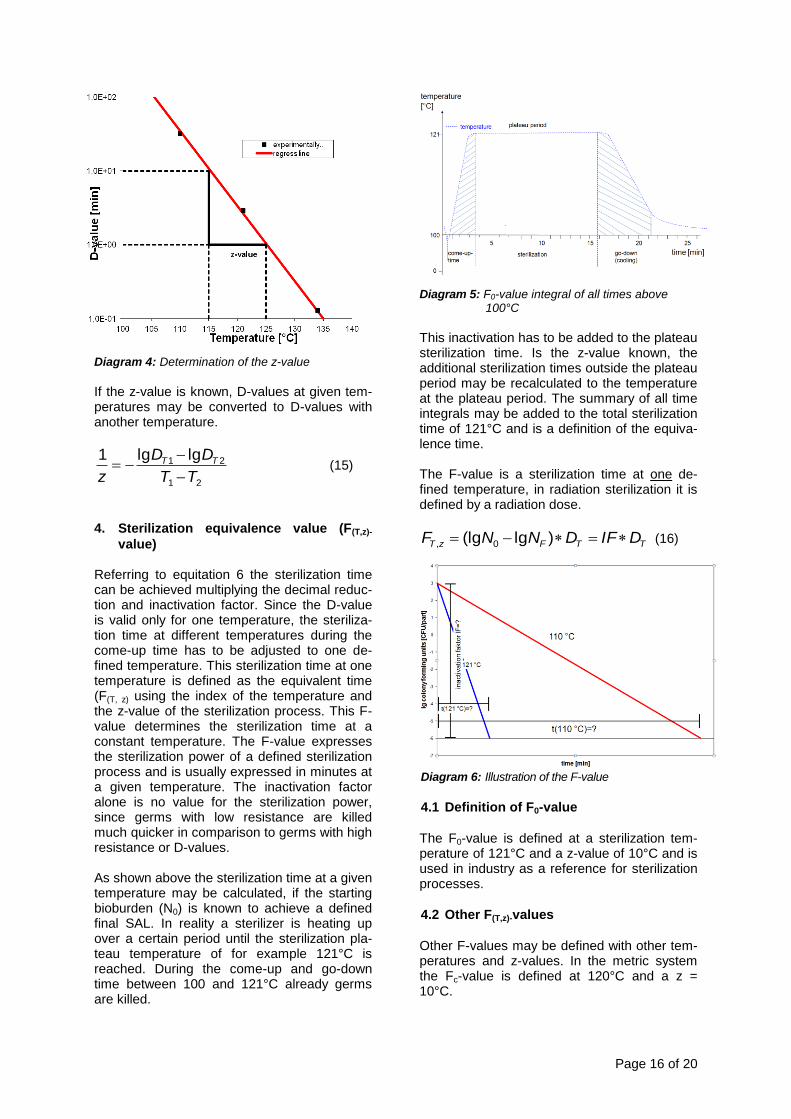
3.2 Definition of the z-value (Temperature
coefficient of the D-value)
The z-value describes the dependence of the kill velocity of microorganisms with changing temperature. Mathematically the z-value is the necessary temperature difference to change the D-value by a factor of 10 keeping all other sterilization conditions constant. If D-values are achieved at different temperatures and are put in a half-logarithmic D-value scale against the temperature a straight line is achieved where the reciprocal slope determines the z-value, see diagram 4.
Page 16 of 20
Diagram 4: Determination of the z-value
If the z-value is known, D-values at given tem-peratures may be converted to D-values with another temperature.
21
21 lglg1
TT
DD
zTT
(15)
4. Sterilization equivalence value (F(T,z)-
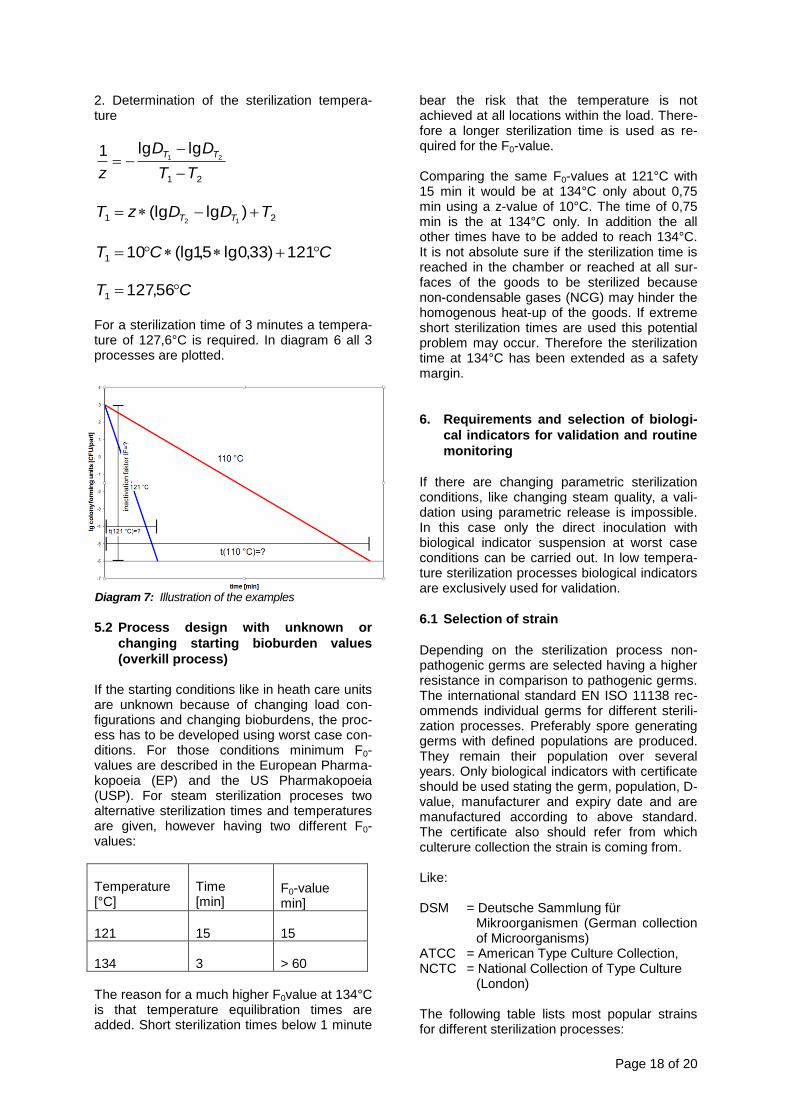
value) Referring to equitation 6 the sterilization time can be achieved multiplying the decimal reduc-tion and inactivation factor. Since the D-value is valid only for one temperature, the steriliza-tion time at different temperatures during the come-up time has to be adjusted to one de-fined temperature. This sterilization time at one temperature is defined as the equivalent time (F(T, z) using the index of the temperature and the z-value of the sterilization process. This F-value determines the sterilization time at a constant temperature. The F-value expresses the sterilization power of a defined sterilization process and is usually expressed in minutes at a given temperature. The inactivation factor alone is no value for the sterilization power, since germs with low resistance are killed much quicker in comparison to germs with high resistance or D-values. As shown above the sterilization time at a given temperature may be calculated, if the starting bioburden (N0) is known to achieve a defined final SAL. In reality a sterilizer is heating up over a certain period until the sterilization pla-teau temperature of for example 121°C is reached. During the come-up and go-down time between 100 and 121°C already germs are killed.
Diagram 5: F0-value integral of all times above 100°C
This inactivation has to be added to the plateau sterilization time. Is the z-value known, the additional sterilization times outside the plateau period may be recalculated to the temperature at the plateau period. The summary of all time integrals may be added to the total sterilization time of 121°C and is a definition of the equiva-lence time. The F-value is a sterilization time at one de-fined temperature, in radiation sterilization it is defined by a radiation dose.
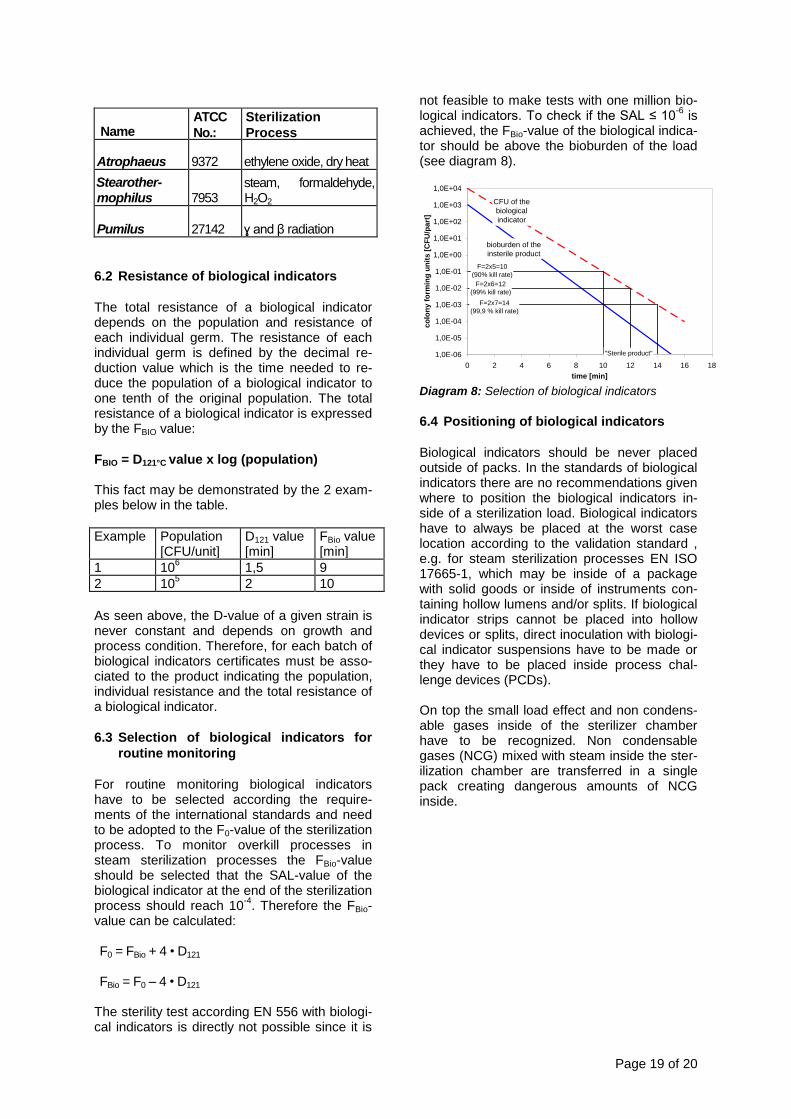
TTFzT DIFDNNF )lg(lg 0, (16)
Diagram 6: Illustration of the F-value
4.1 Definition of F0-value
The F0-value is defined at a sterilization tem-perature of 121°C and a z-value of 10°C and is used in industry as a reference for sterilization processes.
4.2 Other F(T,z)-values
Other F-values may be defined with other tem-peratures and z-values. In the metric system the Fc-value is defined at 120°C and a z = 10°C.

Page 17 of 20
5. Design of sterilization processes
Before the validation of a sterilization process can be carried out, the sterilization starting conditions have to be known (sterilization type, goods to be sterilized, packaging, etc.). Hydro- and thermo-stable products may be sterilized in steam sterilization processes. Non temperature stable products are sterilized in low tempera-ture sterilization processes in industry with EO or radiation sterilization processes, in health care with Formaldehyde sterilization proc-esses. After the sterilization process is defined, the sterilization process parameters have to be defined that the SAL-value ≤ 10
6 has to be
achieved at the end. If the starting bioburden including other constant starting conditions which are available in industry sterilizing new products, the F0-values can be determined using the starting bioburden and the SAL value which has to be achieved. If constant starting conditions cannot be guaranteed like in health care units, a so-called overkill-process is used. To take care of the sterilized goods and to minimize sterilization times the sterilization time and temperature should be adapted to the necessary kill values only. To achieve this goal not only the necessary process parameters need to be calculated but also it is necessary that all process parameters are kept constant during sterilization.
5.1 Process design with known starting
bioburden values
If the starting bioburden of the products to be sterilized is known (types, population and resis-tance of all germs), the most resistant germs including the z-values have to be determined. If these data are available, the sterilization pa-rameters may be calculated as demonstrated at the following example:
Starting conditions for exercises 1-4: Starting germ number: N0 = 10
3 CFU
Expected SAL: NF = 10
-6 CFU = SAL = 10
-6
D121-value = 1,5 min z-value = 10°C
Exercise 1: Calculate the inactivation factor necessary: IF= lg N0 – lg NF IF = lg 10
3 – lg 10
-6 = 3 – (-6)=9
The inactivation factor has a value of 9 decimal reduction steps to reach the sterility assurance level SAL = 10
-6.
Exercise 2: Which sterilization time at 121°C is required: F0 = (lg N0 – lg NF) • DT F0 = (3+6) • 1,5 min = 13,5 min The necessary equivalence sterilization time for this process at 121°C is 13,5 min.
Exercise 3: Since the sterilization goods are not stable at 121°C a sterilization temperature of 110°C should be used. How long is the required ster-ilization time F110°C, z = 10 K?
1. Calculation of the D-value at 110°C using equitation 16:
21
21 lglg1
TT
DD
zTT
2112 )lg(lg TTDDz TT
z
TTDD TT
)(lglg 21
12
z
CDD CC
11lglg 121110
276,11,15,1lglg 110 CD
8,1810 276,1
110 CD [min]
2. Calculation of the sterilization time using equitation 6: F110°C,10 = (lg N0 – lg NF) • DT F110°C,10 = (3+6) • 18,8 min = 170 min The sterilization time at 110°C is 2 h, 50 min-utes.
Exercise 4: Which temperature has to be used that the sterilization time should not be longer than 3 minutes? The temperature may be above 121°C. 1. Determination of the D-value:
F
TNN
tD
lglg 0
min33,063
min3
TD
Page 18 of 20
2. Determination of the sterilization tempera-ture
21
21lglg1
TT
DD
z
TT
21 )lg(lg12
TDDzT TT
CCT 121)33,0lg5,1(lg101
CT 56,1271
For a sterilization time of 3 minutes a tempera-ture of 127,6°C is required. In diagram 6 all 3 processes are plotted. Diagram 7: Illustration of the examples
5.2 Process design with unknown or
changing starting bioburden values
(overkill process) If the starting conditions like in heath care units are unknown because of changing load con-figurations and changing bioburdens, the proc-ess has to be developed using worst case con-ditions. For those conditions minimum F0-values are described in the European Pharma-kopoeia (EP) and the US Pharmakopoeia (USP). For steam sterilization proceses two alternative sterilization times and temperatures are given, however having two different F0-values:
Temperature [°C]
Time [min]
F0-value min]
121 15 15
134 3 > 60
The reason for a much higher F0value at 134°C is that temperature equilibration times are added. Short sterilization times below 1 minute
bear the risk that the temperature is not achieved at all locations within the load. There-fore a longer sterilization time is used as re-quired for the F0-value. Comparing the same F0-values at 121°C with 15 min it would be at 134°C only about 0,75 min using a z-value of 10°C. The time of 0,75 min is the at 134°C only. In addition the all other times have to be added to reach 134°C. It is not absolute sure if the sterilization time is reached in the chamber or reached at all sur-faces of the goods to be sterilized because non-condensable gases (NCG) may hinder the homogenous heat-up of the goods. If extreme short sterilization times are used this potential problem may occur. Therefore the sterilization time at 134°C has been extended as a safety margin.
6. Requirements and selection of biologi-
cal indicators for validation and routine
monitoring
If there are changing parametric sterilization conditions, like changing steam quality, a vali-dation using parametric release is impossible. In this case only the direct inoculation with biological indicator suspension at worst case conditions can be carried out. In low tempera-ture sterilization processes biological indicators are exclusively used for validation.
6.1 Selection of strain
Depending on the sterilization process non-pathogenic germs are selected having a higher resistance in comparison to pathogenic germs. The international standard EN ISO 11138 rec-ommends individual germs for different sterili-zation processes. Preferably spore generating germs with defined populations are produced. They remain their population over several years. Only biological indicators with certificate should be used stating the germ, population, D-value, manufacturer and expiry date and are manufactured according to above standard. The certificate also should refer from which culterure collection the strain is coming from. Like: DSM = Deutsche Sammlung für
Mikroorganismen (German collection of Microorganisms)
ATCC = American Type Culture Collection, NCTC = National Collection of Type Culture (London) The following table lists most popular strains for different sterilization processes:
Page 19 of 20
Name ATCC
No.:
Sterilization
Process
Atrophaeus 9372 ethylene oxide, dry heat
Stearother-mophilus 7953
steam, formaldehyde, H2O2
Pumilus 27142 ɣ and β radiation
6.2 Resistance of biological indicators
The total resistance of a biological indicator depends on the population and resistance of each individual germ. The resistance of each individual germ is defined by the decimal re-duction value which is the time needed to re-duce the population of a biological indicator to one tenth of the original population. The total resistance of a biological indicator is expressed by the FBIO value:
FBIO = D121°C value x log (population) This fact may be demonstrated by the 2 exam-ples below in the table.
Example Population [CFU/unit]
D121 value [min]
FBio value [min]
1 106
1,5 9
2 105
2 10
As seen above, the D-value of a given strain is never constant and depends on growth and process condition. Therefore, for each batch of biological indicators certificates must be asso-ciated to the product indicating the population, individual resistance and the total resistance of a biological indicator.
6.3 Selection of biological indicators for
routine monitoring
For routine monitoring biological indicators have to be selected according the require-ments of the international standards and need to be adopted to the F0-value of the sterilization process. To monitor overkill processes in steam sterilization processes the FBio-value should be selected that the SAL-value of the biological indicator at the end of the sterilization process should reach 10
-4. Therefore the FBio-
value can be calculated: F0 = FBio + 4 • D121 FBio = F0 – 4 • D121
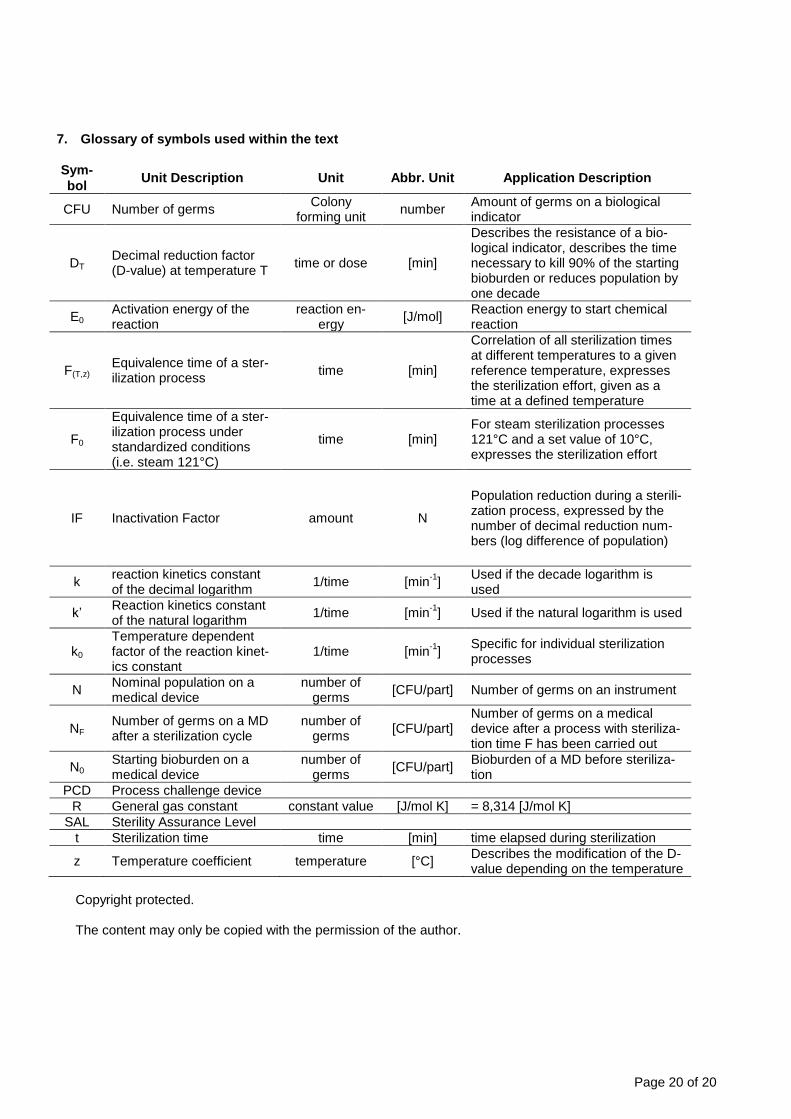
The sterility test according EN 556 with biologi-cal indicators is directly not possible since it is
not feasible to make tests with one million bio-logical indicators. To check if the SAL ≤ 10
-6 is
achieved, the FBio-value of the biological indica-tor should be above the bioburden of the load (see diagram 8).
bioburden of the
insterile product
CFU of the
biological
indicator
F=2x5=10
(90% kill rate)
"Sterile product"
F=2x6=12
(99% kill rate)
F=2x7=14
(99,9 % kill rate)
1,0E-06
1,0E-05
1,0E-04
1,0E-03
1,0E-02
1,0E-01
1,0E+00
1,0E+01
1,0E+02
1,0E+03
1,0E+04
0 2 4 6 8 10 12 14 16 18
time [min]
co
lon
y f
orm
ing
un
its [
CF
U/p
art
]
Diagram 8: Selection of biological indicators
6.4 Positioning of biological indicators
Biological indicators should be never placed outside of packs. In the standards of biological indicators there are no recommendations given where to position the biological indicators in-side of a sterilization load. Biological indicators have to always be placed at the worst case location according to the validation standard , e.g. for steam sterilization processes EN ISO 17665-1, which may be inside of a package with solid goods or inside of instruments con-taining hollow lumens and/or splits. If biological indicator strips cannot be placed into hollow devices or splits, direct inoculation with biologi-cal indicator suspensions have to be made or they have to be placed inside process chal-lenge devices (PCDs). On top the small load effect and non condens-able gases inside of the sterilizer chamber have to be recognized. Non condensable gases (NCG) mixed with steam inside the ster-ilization chamber are transferred in a single pack creating dangerous amounts of NCG inside.
Page 20 of 20
7. Glossary of symbols used within the text
Sym-
bol Unit Description Unit Abbr. Unit Application Description
CFU Number of germs Colony
forming unit number
Amount of germs on a biological indicator
DT Decimal reduction factor (D-value) at temperature T
time or dose [min]
Describes the resistance of a bio-logical indicator, describes the time necessary to kill 90% of the starting bioburden or reduces population by one decade
E0 Activation energy of the reaction
reaction en-ergy
[J/mol] Reaction energy to start chemical reaction
F(T,z) Equivalence time of a ster-ilization process
time [min]
Correlation of all sterilization times at different temperatures to a given reference temperature, expresses the sterilization effort, given as a time at a defined temperature
F0
Equivalence time of a ster-ilization process under standardized conditions (i.e. steam 121°C)
time [min] For steam sterilization processes 121°C and a set value of 10°C, expresses the sterilization effort
IF Inactivation Factor amount N
Population reduction during a sterili-zation process, expressed by the number of decimal reduction num-bers (log difference of population)
k reaction kinetics constant of the decimal logarithm
1/time [min-1
] Used if the decade logarithm is
used
k’ Reaction kinetics constant of the natural logarithm
1/time [min-1
] Used if the natural logarithm is used
k0
Temperature dependent factor of the reaction kinet-ics constant
1/time [min-1
] Specific for individual sterilization processes
N Nominal population on a medical device
number of germs
[CFU/part] Number of germs on an instrument
NF Number of germs on a MD after a sterilization cycle
number of germs
[CFU/part] Number of germs on a medical device after a process with steriliza-tion time F has been carried out
N0 Starting bioburden on a medical device
number of germs
[CFU/part] Bioburden of a MD before steriliza-tion
PCD Process challenge device
R General gas constant constant value [J/mol K] = 8,314 [J/mol K]
SAL Sterility Assurance Level
t Sterilization time time [min] time elapsed during sterilization
z Temperature coefficient temperature [°C] Describes the modification of the D-value depending on the temperature
Copyright protected. The content may only be copied with the permission of the author.

Page 22 of 20
gke GmbH
Auf der Lind 10 D-65529 Waldems Germany +49 61 26 94 32 - 0 +49 61 26 94 32 - 10 [email protected] www.gke.eu
710-006 EN V02 11-2012


