
Vol. 13(29), pp. 2930-2934, 16 July, 2014 DOI: 10.5897/AJB2013.13158 Article Number: A3B815246090 ISSN 1684-5315 Copyright © 2014 Author(s) retain the copyright of this article http://www.academicjournals.org/AJB
African Journal of Biotechnology
Full Length Research Paper
Discrimination of oats (Avena sativa L.) cultivars using isozyme markers
S. Sumathi* and P. Balamurugan
Department of Seed Science and Technology, Tamil Nadu Agricultural University, Coimbatore-641 003, India.
Received 14 August, 2013; Accepted 20 June, 2014
The present investigation was carried out to discriminate the oat cultivars based on isozymic banding patterns. The pattern of isozymes such as peroxidase, polyphenol oxidase, esterase and amylase in the selected 11 oats cultivars were studied. The enzyme extracts prepared from seven days aged seedlings of each cultivars were analyzed through polyacrylamide gel electrophoresis (PAGE) and the cultivars were differentiated based on the presence or absence of bands and intensity of bands in each isozymes. In peroxidase, totally four bands were recorded, and among these, three bands were common for all cultivars; the band at Rf value 0.944 showed polymorphism. In polyphenol oxidase, totally three bands were recorded; the absence of band at Rf value 0.797 in OS 7, HJ 8 and OL 9 are used for differentiation. In esterase, totally six bands were noticed, the presence of band at Rf value 0.857 in OS 7 and HJ 8 are used for discrimination and in amylase, totally seven bands were recorded. Among the cultivars, variations in band intensity helped for cultivar identification. Key words: Oats, polyacrylamide gel electrophoresis (PAGE), isozymes, cultivar identification
INTRODUCTION Oats is an important cereal cum forage crop. It has rich medicinal and nutritional value and is being used as food by the diabetic patients, since the grains are filled with cholesterol fighting soluble fibre (Singh et al., 2003). The increased economic importance of the crop has stimulated the development of new cultivars. At present, large numbers of cultivars are available for commercial cultivation. Therefore, identification of cultivars became very important in seed certification and crop breeding programmes. In traditional method of cultivar identify-cation, morphological features are commonly used for identification. For morphological characterization, the plant must be grown to flowering or fruiting stage, which
is a laborious and tedious process (Gottschalk, 1985). Moreover, plant and seed morphology has been unreliable since morphological characters can be greatly influenced by environment conditions (Geeta and Kanwar, 2006). With increase in the number of varieties of each crop, it is very difficult to distinguish the varieties on the basis of morphological characters alone. This has led to the development of the new stable parameters such as use of their genetic material as a tool for cultivar identification. Electrophoresis is a process of separation of different biomolecules (protein and isozymes) under the influence of electric field and has been successfully applied for the identification of cultivars (Vishwanath et
*Corresponding author. E-mail: [email protected]. Author(s) agree that this article remain permanently open access under the terms of the Creative Commons Attribution License 4.0 International License

al., 2011).
The most widely used biochemical markers in plant breeding and applied genetics are isozymes. It is polymorphic and more stable than morphological traits across environments, therefore these accurate and inexpensive biochemical markers has been used extensively to characterize the cultivars (DiRenzo et al., 2001). The isozyme banding patterns are not so complex, when compared to bands of proteins. The adequate allozymeric variability of cultivars helps in differentiation of very closely related species. Hence, the studies were formulated to discriminate 11 oats cultivars using polyacrylamide gel electrophoresis. MATERIALS AND METHODS Seed materials The genetically pure 11 oats cultivars viz., Sabzar, Kent, HFO 114, OS 6, UPO 212, OS 7, HJ 8, UPO 94, OL 9, JHO 822 and OL 88 obtained from Pant University of Agriculture and Technology, Uttar Pradesh were used for characterization based on profile of isozymes such as peroxidase, polyphenol oxidase, esterase and amylase. Preparation of sample Five hundred milligram of plant tissues, which includes root and shoot was taken from seven days old seedlings and macerated with pestle and mortar using 750 l of ice cold 0.1 M phosphate buffer (pH 7) for peroxidase, 0.01 M phosphate buffer (pH 7) containing 1% non-ionic detergent (Tween 80) for polyphenol oxidase, 10 mM sodium phosphate buffer (pH 6.9) for esterase and 50 mM Tris HCl buffer (pH 7) for amylase. The slurry obtained was centrifuged at 4°C at 12,000 rpm for 20 min. The supernatant was transferred into a fresh eppendorf tube. This formed the crude extract for enzymes analysis. Electrophoresis The extracted isozymes were separated using PAGE in a discontinuous buffer system at a monomer concentration of 30% acrylamide stock gel solution using 7.5% separating gel containing 1.5 M Tris HCl (pH 8.8) and 4% stacking gel containing 0.5 M Tris HCl (pH 6.8) as prescribed by Dadlani and Varier (1993) for peroxidase and polyphenol oxidase, Smith et al. (1970) for esterase and Lin et al. (1988) for amylase with slight modifications. Sample of 30 and 20 l of sample buffer (5X concentration) containing bromophenol blue (tracking dye) was loaded in each well. Electrode buffer was filled in buffer tank and the space between the two glass plates. The electrophoresis unit was kept in a refrigerator to dissipate the heat produced during electrophoresis. The voltage was set at 125 V and ran till the tracking dye reach the end of the gel. Then the gel was transferred into the corresponding staining solutions. Staining and fixing Peroxidase One hundred milligram of benzidine dissolved in 1 ml of acetic acid
Sumathi and Balamurugan 2931 and made to 100 ml with acetate buffer (0.1 M) was added to the gel and incubated for 30 min at 35°C in dark with constant shaking. After 30 min, 1 to 2 ml of hydrogen peroxide was added drop by drop till the blue colour bands appeared and then the reaction was stopped by transferring the gel to 7% acetic acid solution. Polyphenol oxidase One hundred milligram of p-phenylene diamine (0.1%) and 0.1 g of Catechol (10 mM) were mixed in 100 ml of 0.1 M potassium phosphate buffer (pH 7.0) and the gel was equilibrated for 30 min in the solution. After the appearance of brown coloured bands, the reaction was stopped by transferring the gel into 7% acetic acid solution. Esterase The gel was incubated in the solution containing 2.8 g of sodium dihydrogen phosphate, 1.1 g of disodium hydrogen phosphate, 0.2 g of Fast blue RR salt and 0.03 g of Alpha-naphthyl acetate dissolved in 200 ml of distilled water for 30 min preferably in the dark at 37°C. After appearance of brown coloured bands, reaction was ceased by immersing the gel in a solution mixture of methanol: water: acetic acid: ethyl alcohol in the ratio 10:10:2:1. Amylase The gel was incubated in 1% starch solution buffered to pH 5.0 using 0.1 M acetate buffer at 37°C for 30 to 40 min. After incubation, the gel was soaked in potassium iodide - iodine solution (43.3 mM potassium iodide and 5.7 mM Iodine). After the appearance of translucent bands in dark blue background, the gel was photographed. Evaluation and documentation The distance moved by the tracking dye from the point of loading was measured on the gel. Then the distance traveled by each band was also measured. The complete gel imprints were made on the transparency sheets to determine their intensity. Relative front (Rf) of each band was calculated as follows: Distance travelled by the band Rf = Distance travelled by the tracking dye
Bands were numbered in the order of increasing Rf values. Apart from this, recording presence or absence of a band and the intensity of the band in each cultivar was critically observed for discriminating the cultivars. RESULTS AND DISCUSSION
Isozyme markers are invaluable tool for cultivar identification, their expression is almost exclusively of the genetic makeup of the plant, and therefore rarely affected by environmental conditions; their patterns are highly reproducible. Therefore, it is feasible to use variation in isozymes banding pattern for varietal characterization (Bretting and Widrlechner, 1995). In the present study, the enzymes were extracted from eleven oats cultivars to

2932 Afr. J. Biotechnol.
Table 1. Intensity and relative front of peroxidase in seedlings of oats cultivars.
Band Number
Rf value Cultivars
Sabzar Kent HFO 114 OS 6 UPO 212 OS 7 HJ 8 UPO 94 OL 9 JHO 822 OL 88
1 0.766 ++ ++ ++ ++ ++ +++ ++ ++ ++ ++ + 2 0.802 ++ ++ ++ ++ ++ +++ ++ +++ ++ ++ + 3 0.851 +++ +++ +++ ++ ++ +++ ++ +++ +++ +++ ++ 4 0.944 +++ +++ +++ ++ ++ - - +++ - - ++
Figure 1. Peroxidase isozyme profile of oats cultivars. V1, Sabzar; V2, Kent; V3, HFO 114; V4, OS 6; V5, UPO 212 ; V6, OS 7; V7, HJ 8; V8, UPO 94; V9, OL 9; V10, JHO 822; V11, OL 88.
Figure 2. Polyphenol oxidase isozyme profile of oats cultivars. V1, Sabzar; V2, Kent; V3, HFO 114; V4, OS 6; V5, UPO 212 ; V6, OS 7; V7, HJ 8; V8, UPO 94; V9, OL 9; V10, JHO 822; V11, OL 88.
analyze the peroxidase, polyphenol oxidase, esterase and amylase through PAGE method. The electrophoretic analyses of peroxidase revealed that totally, four bands were observed, at Rf value ranging from 0.766 to 0.944. The presence or absence of bands and their intensity variation was taken as the main criteria for cultivar identification. All four bands were observed in cv. Sabzar, Kent, HFO 114, OS 6, UPO 212, UPO94 and OL 88 with different intensity. The remaining cultivars recorded three numbers of bands. The absence of band at Rf value 0.944 in OS 7, HJ 8, OL 9 and JHO 822 was used for discrimination of these cultivars from others (Plate 1 and Table 1). Many workers have reported the successful use of seedling peroxidase as in the case of the present study. Santhy et al. (1998) in rice, Nagaraja et al. (2000) in sorghum, Roy et al. (2001) in grass peas, Manonmani et al. (2004) in Indica rice and Praveena (2005) in muskmelon reported the usefulness of seedling peroxidase in varietal discrimination.
The electrophoretic analysis of polyphenol oxidase isozyme expressed totally three numbers of bands. The detailed electrophoregram and results of these is presented in Figure 2 and Table 2. The expression of bands at Rf value range from 0.681 to 0.797. All the three bands were observed in cultivars Sabzar, Kent, HFO114, OS6, UPO 212, UPO94, JHO822 and OL 88. Cultivars OS 7 and HJ 8 expressed two numbers of bands. Only one band was recorded in OL9 and remaining two bands were absent, this helps for identification. Thangavel (2003) in sorghum and Eevera (2003) in rice differentiated the cultivars based on polyphenol oxidase banding pattern. The banding pattern and Rf values of esterase isozyme is presented in Figure 3 and Table 3. Totally, six bands at Rf value ranging from 0.426 to 0.857 were expressed. The maximum of five bands were observed in UPO 94. The minimum two bands were observed in HJ8 and OL 88. Unlike peroxidase and polyphenol oxidase, there was no common band in esterace. Varier et al. (1995), Prasada Rao et al. (2001) in pearl millet, Choer et al. (1999) in beans, Dvoracek et al. (2001) in spelt wheat, Arunkumar et al. (2007) in pearl millet and Rakshit et al. (2011) in maize reported that esterase is considered to be one of the most suitable enzyme systems for differentiating the cultivars. The
Sumathi and Balamurugan 2933
Table 2. Intensity and relative front of polyphenol oxidase in seedlings of oats cultivars.
Band number Rf value Cultivar
Sabzar Kent HFO 114 OS 6 UPO 212 OS 7 HJ 8 UPO 94 OL 9 JHO 822 OL 88
1 0.681 ++ ++ + + + + +++ +++ - + + 2 0.730 ++ ++ ++ ++ ++ ++ +++ +++ ++ ++ + 3 0.797 ++ ++ ++ ++ ++ - - +++ - ++ +
Table 3. Intensity and relative front of esterase in seedlings of oats cultivars.
Band number Rf value Cultivars
Sabzar Kent HFO 114 OS 6 UPO 212 OS 7 HJ 8 UPO 94 OL 9 JHO 822 OL 88
1 0.426 ++ +++ + ++ +++ +++ ++ +++ ++ +++ - 2 0.662 + + + - + - - + - - - 3 0.769 - - - + - - - + - - - 4 0.772 + + + + + - - + + + + 5 0.836 + + + - + + - + + + + 6 0.857 - - - - - + + - - - -
Figure 3. Esterase isozyme profile of oats cultivars. V1, Sabzar; V2, Kent; V3, HFO 114; V4, OS 6; V5, UPO 212 ; V6, OS 7; V7, HJ 8; V8, UPO 94; V9, OL 9; V10, JHO 822; V11, OL 88.
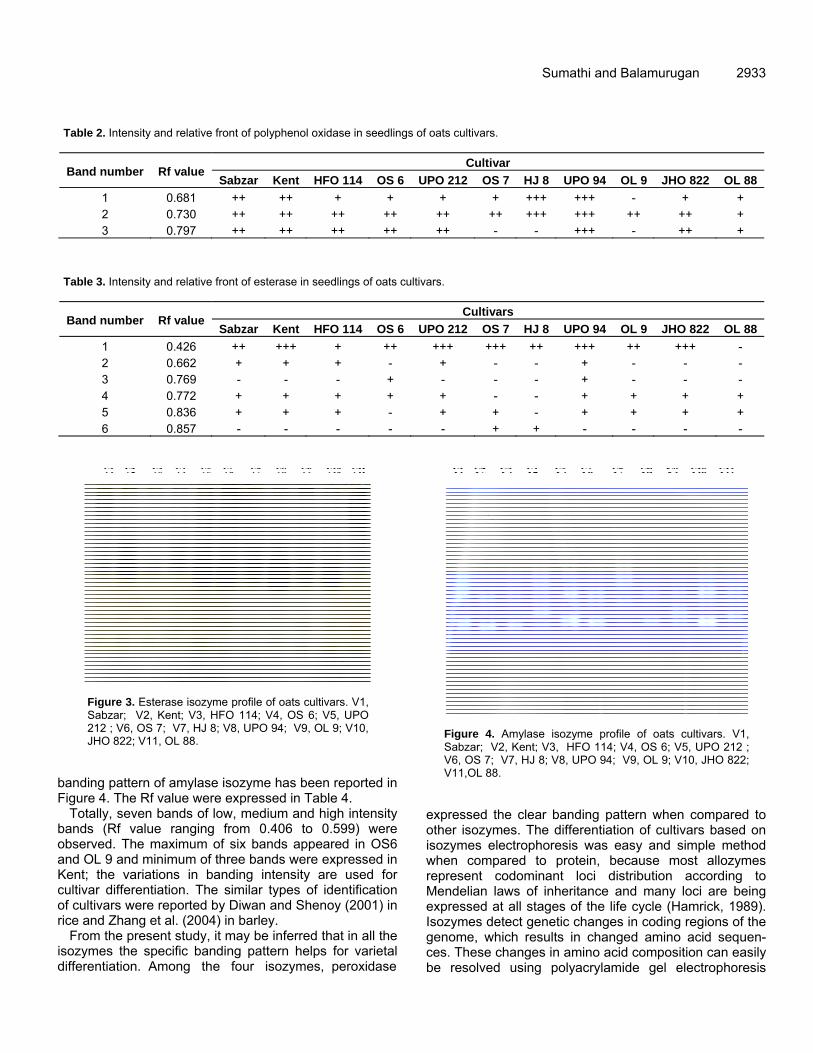
banding pattern of amylase isozyme has been reported in Figure 4. The Rf value were expressed in Table 4.
Totally, seven bands of low, medium and high intensity bands (Rf value ranging from 0.406 to 0.599) were observed. The maximum of six bands appeared in OS6 and OL 9 and minimum of three bands were expressed in Kent; the variations in banding intensity are used for cultivar differentiation. The similar types of identification of cultivars were reported by Diwan and Shenoy (2001) in rice and Zhang et al. (2004) in barley.
From the present study, it may be inferred that in all the isozymes the specific banding pattern helps for varietal differentiation. Among the four isozymes, peroxidase
Figure 4. Amylase isozyme profile of oats cultivars. V1, Sabzar; V2, Kent; V3, HFO 114; V4, OS 6; V5, UPO 212 ; V6, OS 7; V7, HJ 8; V8, UPO 94; V9, OL 9; V10, JHO 822; V11,OL 88.
expressed the clear banding pattern when compared to other isozymes. The differentiation of cultivars based on isozymes electrophoresis was easy and simple method when compared to protein, because most allozymes represent codominant loci distribution according to Mendelian laws of inheritance and many loci are being expressed at all stages of the life cycle (Hamrick, 1989). Isozymes detect genetic changes in coding regions of the genome, which results in changed amino acid sequen-ces. These changes in amino acid composition can easily be resolved using polyacrylamide gel electrophoresis

2934 Afr. J. Biotechnol. Table 4. Intensity and relative front of amylase in seedlings of oats cultivars.
Band number Rf value Cultivars
Sabzar Kent HFO 114 OS 6 UPO 212 OS 7 HJ 8 UPO 94 OL 9 JHO 822 OL 88
1 0.406 - - + ++ - - ++ - + ++ + 2 0.445 - - + ++ - + ++ + + ++ + 3 0.469 +++ ++ ++ ++ +++ ++ - ++ ++ +++ ++ 4 0.495 + + - + - ++ ++ + - + - 5 0.553 - - - +++ + - - - ++ - - 6 0.577 ++ - - - +++ - - - ++ - ++ 7 0.599 ++ +++ +++ ++ +++ +++ + ++ ++ +++ +
+ = Low intensity; ++ = medium intensity; +++ = high intensity.
(Melchinger, 1990). The advantage of use of isozymes as genetic markers are the alleles of most isozyme markers interact in co dominant fashion and facilitate the identification of heterozygotes from homozygotes and nonepisatic expressions of isozymes permit to analyze an infinite number of isozyme markers simultaneously (Tanksley and Rick, 1990).
Conflict of Interests
The author(s) have not declared any conflict of interests. REFERENCES Arunkumar MB, Sherry RJ, Varier A, Dadlani M (2007). Suitability of
seed esterases for establishing distinctness, uniformity and stability of pearl millet genotypes. Curr. Sci. 93:951-956.
Bretting PK, Widrlechner MP (1995). Genetic markers and horticultural germplasm management. Hort. Sci. 30:1349-1356.
Choer E, Augustin E, Antunes IF, Da JB, Silva, Peters JA (1999). Cultivar identification and genetic purity analysis of beans (Phaseolus vulgaris L.) through isoenzymatic patterns. Seed Sci. Tech. 27:517-523.
Dadlani M, Varier A (1993). Electrophoresis for variety identification. Technical bulletin, IARI, New Delhi. pp. 18.
DiRenzo M, Bonamico N, Gesumaria J (2001). Characterization of amaranthus accession by isozymic patterns. Seed Sci. Tech. 29:227-238.
Diwan JR, Shenoy VS (2001). Inheritance and α-amylase isozyme patterns and their association with early vigour-related traits in rainfed upland rice. Curr. Sci. 80:284-286.
Dvoracek V, Curn V (2003). Evaluation of protein fractions as biochemical markers for identification of spelt wheat cultivars (Triticum spelta L.). Pl. Soil Environ. 49:99-105.
Eevera T (2003). Morphological, biochemical and molecular characterization of rice varieties and hybrids, Ph.D. thesis, Tamil Nadu Agricultural University, Coimbatore, Tamil Nadu.
Geeta B, Kanwar JS (2006). Isozyme polymorphism for genetic purity testing in Muskmelon (Cucumis melo) hybrid. Seed Res. 34:53-55.
Gottschalk W (1985). Phytotron experiments in pisum. Influence of temperature on the flowering behavior of different genotypes. Appl. Genet. 70:207-212.
Hamrick JL (1989). Isozyme and the analysis of genetic structure in plant population. In: Soltis DE, Soltis PS (eds) Isozymes in plant biology, Dioscorides Press, Portland, Oregon. pp. 87-105.
Lin TP, Spilatro SR, Preiss J (1988). Subcellular localization and characterization of amylases in Arabidiopsis leaf. Pl. Physiol. 86:251-259.
Manonmani S, Senthilvel S, Fazlullah Khan AK, Maheswaran M (2004). RAPD and Isozyme markers for genetic diversity and their correlation with heterosis in Rice (Oryza sativa L) New directions for a diverse planet. In: Proceedings of the 4th International Crop Science Congress Brisbane, Australia.
Melchinger AE (1990). Use of molecular markers in breeding for oligogenic disease resistance. Pl. Breed. 104:1-19.
Nagaraja GS, Anuradha Varier, Upendra Singh, Sharma SP (2000). Characterization of inbreds and hybrids of sorghum by seed and seedling morphology and electrophoresis of seed proteins and isoenzymes. Pl. Var. Seeds 13:17-29.
Prasada Rao KSSV, Varier A, Mohapatra T, Aruna Kumari K, Sharma SP (2001). Electrophoresis of seed esterases and RAPD analysis for identification of hybrids and parental lines of pearlmillet (Pennisetum glaucum (L.) R. Br). Pl. Var. Seeds 14:41-52.
Praveena G (2005). Discrimination and identification of muskmelon (Cucurmis melo L.) hybrid (Punjab Hybrid) and its parental lines using finger prints of proteins and isozyme markers. M.Sc.(Ag.) thesis, Tamil Nadu Agricultural University, Coimbatore, Tamil Nadu.
Rakshit A, Sarvari P, Rakshit S, Dadlani M (2011). Characterization of hybrids and parental lines of maize using isozyme markers for DUS testing. Seed Res. 39:156-160.
Roy M, Mandal N, Das PK (2001). Seed protein characterization and isozyme diversity for cultivar identification in grass pea (Lathyrus sativus L.). Ind. J. Gen. Pl. Breed. 61:246-249.
Santhy V, Nital V, Dadlani M (1998). Biochemical markers for characterizing rice genotypes. Int. Rice Res. Nesl. 23:20.
Singh C, Prem Singh, Rajbir Singh (2003). Modern Techniques of raising field crops, Second Edition, Oxford and IBH Publishing Co. Pvt. Ltd., New Delhi, pp. 429-436.
Smith H, Hamill D, Weaver E, Thompson K (1970). Multiple molecular forms of peroxidase and esterases among Nicotiana species and amphiploids. J. Hered. 61:203-212.
Tanksley SD, Rick CM (1990). Isozyme linkage map of the tomato. Applications in genetics and breeding. Theor. Appl. Genet. 57:61-170.
Thangavel P (2003). Characterisation of sorghum (Sorghum bicolor L. Moench) cultivars by traditional and modern approaches. M.Sc.(Ag.) thesis, Tamil Nadu Agricultural University, Coimbatore, Tamil Nadu.
Varier A, Dadlani M, Sharma SP (1995). Phenol test and electrophoresis of seed esterases for testing genetic purity in seed lots of pearl millet (Pennisetum glaucum) in breeds. Indian J. Agric. Sci. 65:789-792.
Vishwanath K, Prasanna KPR, Pallvi HM, Rajendra Prasad S, Ramegowda, Devaraju PJ, Ananthanarayanan TV (2011). Identification of tomato (Lycopersicon esculentum) varieties through total soluble seed proteins. Res. J. Agric. Sci. 2:08-12.
Zhang W, Takafumi K, Kazuyoshi T (2004). β- amylase variation in wild barley accessions. Breed. Sci. 54:41-49.


