District Court Stringency and Firm Restatement Policy †
C.S. Agnes Cheng
School of Accounting & Finance
The Hong Kong Polytechnic University
Kowloon, Hong Kong
Tel: (852) 2766-7772, E-mail: [email protected]
Henry He Huang
SySyms School of Business
Yeshiva University
New York, NY 10033
Tel: (832) 276-3834, E-mail: [email protected]
Zhen Lei
School of Accounting & Finance
The Hong Kong Polytechnic University
Kowloon, Hong Kong
Tel: (852) 3400-3641, E-mail: [email protected]
Haitian Lu*
School of Accounting & Finance
The Hong Kong Polytechnic University
Kowloon, Hong Kong
Tel: (852) 2766-7065, E-mail: [email protected]
This version: May, 2017
† Agnes Cheng thanks Hong Kong Government Research Grant Council - General Research Fund (#590213), and
Haitian Lu thanks the National Natural Science Foundation of China (#71503225) for the support of this project. * Corresponding author. Tel.: +852 2766 7065; Fax: +852 2356 9845. E-mail address: [email protected]
(Haitian Lu).
District Court Stringency and Firm Restatement Policy
Abstract
Firms’ litigation risk heightens when prior misstatement came to knowledge of the management.
This study examines how district court stringency in dismissing 10b-5 securities lawsuits affects
misreporting firms’ restatement policy. We find misreporting firms headquartered in more
stringent courts are more likely to make accounting irregularity restatement, before they are sued.
Using supreme court’s Tellabs decision as a shock to pleading standard in some, but not all, courts,
we find evidence consistent with preemptive disclosure hypothesis. Event study shows that upfront
restatements mitigate value losses upon lawsuit when firms’ home court is stringent. This paper
uncovers significant role of court stringency in the litigation-disclosure nexus.
Key words: Court stringency, Accounting misreporting, Securities lawsuit, Restatement
JEL Classification Code: M41; K22; G39
1. Introduction
Quality of financial reporting is vital to securities market. Numerous evidence has shown
the high frequency and severe adverse consequence of accounting misreporting. When managers
discover the accounting mistake, the federal securities law and accounting rules require firms to
issue a restatement correcting prior misreporting.1 In the real world, however, some firms are up
front with restatements, others opportunistically choose not to restate. The systematic under-
correction of misstatements can lower investors’ confidence in the market. Enforcing restatements
by the misreporting firms is thus important to protect investors, especially when external
monitoring is weak.
As public enforcement by the SEC is resource constrained, the private securities lawsuit
pursuant to the SEC 10b-5 anti-fraud provision plays unique roles in compensating victims, and
deterring frauds (See Habib et al. 2014 for a review). However, whether this mechanism is
effective in enforcing restatements by misreporting firms is unexplored. We answer this question
using novel, court-level data.
Firms’ litigation risk heightens when managers became aware of accounting mistakes. Since
securities litigation poses large costs to firms, economic theories predict that firms’ restatement
policy can be pre-emptive or defensive, depending on the net benefits of disclosure. The
preemptive disclosure hypothesis (Skinner, 1994, 1997) posits that the deterrence effect of
litigation motivates managers to make timelier restatements, for it helps to weaken the claim that
1 The SEC has ruled that “there is a duty to correct statements made in any filing…if the statements either have become
inaccurate by virtue of subsequent events or are later discovered to have been false or misleading from the outset,
and the issuer knows or should know that persons are continuing to rely on all or any material portion of the statements”
(Sec. Act. Rel. 6084, 17 SEC Dock. 1048, 1054 (1979)). The FASB (2005) ASC Topic 250, Accounting Changes and
Error Corrections, states, ‘‘Any error in the financial statements of a prior period discovered after the financial
statements are issued shall be reported as an error correction, by restating the prior-period financial statements.’’
See also Accounting Principles Board Opinion 20; Statement of Financial Accounting Standards (SFAS) No. 16; and
SFAS No. 154 (issued in May, 2005), among others.
managers withheld private information to keep price distorted, and reduce potential damages by
shortening the class period. Alternatively, the defensive disclosure hypothesis (Kothari, Shu, and
Wysocki, 2009; Rogers and Buskirk, 2009) predicts that due to catastrophic consequences of
restatement including lawsuits 2 , managers tend to avoid difficult decisions, gambling that
subsequent corporate events would allow them to bury the accounting mistakes. Using different
measures of litigation risk, prior empirical work generates mixed results. 3 Whether higher
litigation risk prompts misreporting firms to “admit their mistakes” is an empirical question.
To shed light on this debate, this paper exploits plausibly exogenous variation of the federal
district court stringency where firms are headquartered. In the United States, the private
enforcement on financial frauds pursuant to the Securities and Exchange Act of 1934 and the
Private Securities Litigation Reform Act (PSLRA) of 1995 is achieved primarily through the
country’s 94 federal district courts4 under supervision by circuit (appellate) courts and the supreme
court. Though technically securities lawsuits can be filed in any of the district courts where the
defendant firm has a place of business5, multiple filings need to be consolidated in one case
typically heard by the district court where the defendant firm is headquartered6. This assumption
2 These consequences include, for example, negative market responses (Palmrose, Richardson, and Scholz, 2004),
increased cost of capital (Hribar and Jenkins, 2004), management turnover (Collins et al. 2009) and the resultant
securities lawsuits (Francis, Philbrick and Schipper, 1994). 3 For example, Baginski, Hassell and Kimbrough (2002) argue that American and Canadian firms are under “similar
business environment but different litigation environments”. They find Canadian firms make more frequent and
precise management forecasts than U.S. firms. Srinivasan, Wahid and Yu (2015) find U.S. listed firms headquartered
in weak rule-of-law countries are less likely to restate than are firms from strong rule-of-law countries, supporting the
preemptive disclosure hypothesis. 4 The five federal district courts located outside the 50 states are excluded from this study. They include those existed
in Puerto Rico, the Virgin Island, the District of Columbia, Guam, and the Northern Mariana Islands. 5 Securities and Exchange Act of 1934, ch.404, sec.27, 48 Stat. 881, 902-03 (codified as amended at 15 U.S.C § 78aa
(2006)). 6 The legal and empirical basis for this assumption is discussed in detail in Section 3.2.
is validated by data. Over our sample period (2001-2014) over two-thirds of the 10b-5 lawsuits
were heard by the district courts where defendant firms are headquartered.
Unlike prior work which estimates litigation risk at either country (Baginski, Hassell and
Kimbrough, 2002; Srinivasan, Wahid, and Yu, 2015), industry (Francis, Philbrick, and Schipper,
1994), or firm-level (Kim and Skinner, 2012), this paper measures litigation risk at court-level,
and investigates whether misreporting firms headquartered in more stringent district court
jurisdictions are more likely to restate. Specifically, we estimate the dismissal rate of a district
court on securities lawsuits within five years prior to a headquartering firm’s fiscal year end.
Higher dismissal rate means a district court is less shareholder-friendly, thus inversely related to
litigation risk for firms under its jurisdiction.7
To appreciate this independent variable, we note the following: First, court dismissal rate
reflects the average outcomes of past securities lawsuits heard by almost randomly assigned district
judges, and therefore exogenous to individual firm characters or individual case merits. Second, it
is unlikely that firms choose or move their headquartering place based on stringency of a district
court. Third, this variable captures the within-country, securities law enforcement by the courts,
with variations both across districts and over the time, enabling more powerful tests.
Note the district court stringency can affect both headquartering firms’ incentive to misreport
and their propensity to restate upon discovery. This paper focuses on the latter, which includes
only misreporting firms. Among the misreporting firms, we distinguish those making preemptive
restatements with those keeping strategic silence. We then ask whether more stringent courts
7 To illustrate with example, suppose the district court of North Carolina have dismissed 90% of filed securities
lawsuits in a given period, whilst the district court of South Carolina dismissed only 10% in the same period. It sends
signal to headquartering firms in North Carolina district court that even if sued, the probability of receiving legal
penalties is low.

prompt misreporting firms to be upfront with restatements. It follows, crucial to our identification
strategy is to pick firms known to make accounting mistakes.
We use three methods to identify misreporting firms. Our first sample comprises all 10b-5
defendant firms with alleged GAAP violations from 2000 to 2014 (hereafter “Sample 1”). In the
post-PSLRA period with heightened pleading standards, securities lawsuits in the 2000s typically
point to hard evidence of fraud such as GAAP related accounting misrepresentations (Choi, Nelson,
and Pritchard, 2009). Among these defendant firms, some made corresponding restatement before
the lawsuit whilst others did not. We then ask whether more stringent court prompts defendant
firms to make preceding restatement.
Allegations of GAAP violation in 10b-5 lawsuits can be meritorious or frivolous, to refine
our sample of misreporting firms we include defendant firms that made corresponding restatement
before and after the lawsuits (hereafter “Sample 2”). This sample has the best counterfactual group
since firms’ own and eventual restatements are prima facie evidence of their accounting mistakes.
In constructing our Sample 2, firms’ restatement period must match the class period in the 10b-5
lawsuit with alleged GAAP violation. We then ask whether more stringent court prompts these
misreporting firms to make restatement before the lawsuit.
We note that not all misreporting firms were detected by securities lawsuits. To mitigate our
reliance on lawsuits to identify misreporting firms, we construct a larger sample that exploits firms’
earnings management levels (hereafter “Sample 3”). Specifically, for each industry and year, we
first estimate the discretionary accruals of each restating firms. The counterfactual group of non-
restating misreporting firms is then identified as those in the same industry and year, whose
discretionary accrual is either higher than the 90th percentile or lower than the 10th percentile that

of the restating firms. Built on this sample, we ask whether firms in more stringent courts are more
likely to make restatements.
In all three samples, we find firms headquartered in the jurisdiction of low-dismissal rate
(more stringent) district courts are more likely to make accounting irregularity-based (as opposed
to error-based) restatements.8 Remarkably, court dismissal rate is the only variable that exhibits
both statistical significance and large economic magnitude: Ceteris paribus, one standard
deviation increase in court dismissal rate leads to 4.89%, 6.87% and 1.53% reduction in
restatement propensity compared to an average restating rate of 28.2%, 55.6% and 30.4% in our
1st, 2nd, and 3rd sample. To appreciate, an one standard deviation increase in dismissal rate amounts
to increase that from the level of Illinois (Northern) to that of California (Northern) district court.
To provide causal evidence that misreporting firms are more upfront with restatements when
their home court becomes more stringent, we exploit the supreme court’s rulings in Tellabs v.
Makor (hereafter “Tellabs”) in 2007 that alter the pleading standard in some, but not all underling
courts. Tellabs is the landmark case and one of the supreme court’s first efforts to clarify the strong
inference standard of Scienter, a key legal element to plead 10b-5 claims. We find following
Tellabs, which raised the pleading standard to bring cases against a defendant in courts that had
previously exercised low standards, there is increase in restatement propensity for firms
headquartered in such districts.
8 We separately considered the effect of court dismissal rate on error-based restatements and do not find significant
results. To the extent that 10b-5 lawsuits is only relevant when the misstatement was due to fraud (accounting
irregularities) rather than errors, the non-result on error-based restatements lends additional support to our claim that
managers actively consider their home court stringency when deciding whether to restate. However, this non-result
on error-based accounting restatement must be interpreted with caution due to sample size and the way we construct
counterfactual groups. See Section 5.2 in the robustness test for details.

Why misreporting firms make pre-emptive restatement in the presence of litigation risk? To
shed light on this query we study the shareholder wealth effect of pre-emptive restatements across
district court jurisdictions. By focusing on the market reactions around two event dates, the “class
end” date and “case filing” date, we find that overall, the market anticipate higher legal cost for
firms headquartered in more stringent district courts. However, the CAR differences between
restating and non-restating misreporting firms is only significant when we allow the effect of
restatement on CAR to depend on defendant firm’s home court dismissal rate. Interestingly, for
misreporting firms in more stringent courts, making preemptive restatement saves shareholder
value. However, for misreporting firms in less stringent courts, preemptive restatement harms
shareholder value. We rationalize this result following the Akerlof (1970) adverse selection model,
which predicts the value of being honest (through preemptive restatement) increases when
investors perceive the court enforcement available to them is high.
In robustness tests, we first use simple model to show that the external validity of our results
should not be affected by unobservable misreporting firms. We next present evidence of a placebo
test which shows court dismissal rate only affects irregularity-based restatement but not error-
based accounting restatements. Finally, we show our results are robust to alternative court
stringency estimations.
This paper first contributes to the study on the role of courts in making laws credible. Prior
accounting and finance research tends to assume that laws are enforced with full strength and
therefore the cross-country (state) difference is whether having particular laws “on paper”. For
example, many work use staggered adoption of anti-takeover (Business Combination) laws by U.S.
states as shocks to corporate governance (Garvey and Hanka, 1999; Bertrand and Mullainathan,
2003; Wald and Long, 2007; Atanassov, 2013). Unlike these studies, we emphasize on the role of
courts as law enforcers, and the resultant variation in litigation risk across firms. In law and
economics literature, court and judge tendencies are used to predict, for example, the effect of
incarceration on individual’s earnings prospect (Kling, 2006), patent rights protection on corporate
innovation (Galasso and Schankerman, 2015), and bankruptcy laws on personal lending behaviors
(Dobbie, Goldsmith-Pinkham, and Yang, 2016), etc. We extend this approach to examine the
effect of court stringency on firms’ restatement policy.
We also contribute to the debate on litigation-disclosure nexus, using novel, court-based
evidence. The important question “why firms voluntarily disclose bad news?” was asked in earlier
important work including Skinner (1994, 1997), Kothari, Shu, and Wysocki (2009), Rogers and
Buskirk (2009), Donelson et al. (2012), etc. The consensus is that securities litigation risk is a key
determinant of such disclosure. However, due to the endogenous relationship between litigation
and disclosure, the empirical evidence is mixed. For example, Field, Lowry and Shu (2005)
employ a simultaneous equation methodology and find no evidence that earnings warnings trigger
litigation. Baginski, Hassell and Kimbrough (2002) compare U.S. and Canadian firms which they
argue are under “similar business environment but different litigation environments”. Their finding
that Canadian firms make more management forecasts than U.S. firms appear to support the
defensive disclosure hypotheses. On the contrary, Srinivasan, Wahid, and Yu (2015) find U.S.
listed firms headquartered in weak rule-of-law countries are less likely to restate than firms from
strong rule-of-law countries despite higher earnings management levels, and their interpretation is
that home country enforcement affects firms’ likelihood of admitting accounting mistakes. Our
result supports the preemptive disclosure hypothesis (Skinner 1994, 1997) and findings of
Srinivasan, Wahid, and Yu (2015), however our design based on variations of the within-country

court enforcement of 10b-5 lawsuits across districts and over the time is novel, and enables more
powerful tests.
Finally, we contribute to the restatement literature by providing much needed evidence on
misreporting firms’ restatement policy. Prior works in accounting use restatements to infer the
magnitude of financial misreporting, because they are readily observable. However, we show there
are many misreporting firms opportunistically choose not to restate. The systematic under-
correction of misreporting lowers investors’ confidence in the market. One novelty of this paper
is our employment of different methods (using ex post evidence) to identify the counterfactual
firms. More importantly, we show evidence that in more stringent courts misreporting firms tend
to make more restatements, and firms increases their restatement propensity following exogenous
increase in court stringency. The policy implication of this finding is that courts can ex ante enforce
misreporting firms to admit their mistakes by tightening their stringency in securities lawsuits.
The rest of this paper proceeds as follows: Section 2 describes the institutional setup relevant
to our analysis. Section 3 presents sample selection, data and descriptive statistics. Section 4
presents empirical results. Section 5 presents robustness tests. Section 6 concludes.
2. Securities Lawsuits and U.S. Federal Courts
2.1. The Evolution of Securities Class Action Lawsuits
In the U.S. securities law, the SEC Rule 10b-5 is one of the most important rules targeting
securities fraud. The rule prohibits any fraud or deceit in connection with the purchase or sale of
any security. The plaintiff under this rule are typically shareholders, and the defendants include
the firm and any person involved in the fraudulent activity. The shareholder class action concept,
which emerged in 1960s, was made applicable to securities cases by the “fraud-on-the-market”

presumption of reliance.9 The lighter requirement causes both meritorious and frivolous securities
litigations brought on behalf of thousands of investors. To regulate private enforcements the U.S.
Congress enacted the Private Securities Litigation Reform Act (PSLRA) in 1995.
Prior to the PSLRA, plaintiffs could proceed with minimal evidence of fraud and then use
pretrial discovery to seek further proof. Defending against these suits could prove extremely costly,
and defendant firms often found it cheaper to settle than fight to win the case, inducing more
frivolous lawsuits. The PSLRA heightened the pleading standards in three important ways: First,
it requires plaintiff to identify with specificity each misleading statement and why it is
misleading.10 Second, it requires a plaintiff to prove that the defendant acted with the “required
state of mind” (“Scienter”), which typically include fraudulent intent, actual knowledge or
recklessness.11 This evidence is hard to obtain, especially because the Exchange Act 21D(b)(3)(B)
prevents plaintiffs to obtain ‘discovery’ from the defendant unless and until the defendant’s motion
to dismiss is denied by the court. Finally, the PSLRA provides a “safe harbor rule” that frees
companies’ forward-looking disclosures from lawsuits so long as the disclosure is accompanied
by cautionary language or made without actual knowledge of falsity.
Because of these heightened pleading standard, securities class actions in the late 1990s and
2000s shift to hard evidence of fraud such as GAAP related accounting misstatements (Choi,
9 In the U.S. Supreme Court decision in Basic v. Levinson (1988), it was held: “It has been noted that ‘it is hard to
imagine that there ever is a buyer or seller who does not rely on market integrity. Who would knowingly roll the dice
in a crooked crap game?’…An investor who buys or sells stock at the price set by the market does so in reliance on
the integrity of that price. […] Because most publicly available information is reflected in market price, an investor’s
reliance on any public material misrepresentations, therefore, may be presumed for purposes of a rule 10b-5 action”.
See Basic, Inc. v. Levinson 485 U.S. 224 (1988). 10 In alleging misleading statement under the PSLRA, the plaintiff must state “each statement alleged to have been
misleading, reasons why the statement is misleading, and if an allegation regarding the statement or omission is made
on information and belief, the complaint shall state with particularity all facts on which that belief is formed” See, 15
U.S.C. § 78u-4(b)(1). 11 In alleging scienter under the PSLRA, the plaintiff must, “with respect to each act or omission alleged to violate
this chapter, state with particularity facts giving rise to a strong inference that the defendant acted with the required
state of mind.” (15 U.S.C. § 78u-4(b)(2)). See also the decision in Ernst & Ernst v. Hochfelder (1976) and Tellabs Inc.
v. Makor Issues & Rights Ltd. (2007).

Nelson and Pritchard, 2009). In this paper we use 10b-5 lawsuits from 2000 to 2014 which covers
the post-PSLRA period.
2.2. The Securities Class Action Procedures
A typical securities class action involves four stages. In the first stage, a plaintiff files a lawsuit
and asks to be the lead plaintiff. A 60-day clock for any individual or entity to file paperwork with
the court asking to be the lead plaintiff is triggered when the first securities lawsuit is announced.
After the deadline, the court reviews all pleadings and appoint the lead plaintiff and lead counsel.
In the second stage, plaintiffs’ counsel files their amended consolidated complaint, and the
defendants then have a deadline to file their motion to dismiss. A motion to dismiss is essentially
an argument by the defendants that, even if all facts alleged in the complaint were true, they are
insufficient to give rise to liability under SEC Rule 10b-5. The court then decides, based on both
plaintiff’s complaints and defendant’s motions, whether to uphold plaintiff’s Rule 10b-5 claim. If
yes, the court enters an order denying defendant’s motion to dismiss, which then gives class
plaintiffs the right to obtain “discovery” from the defendant. This is the pivotal stage in securities
lawsuits, for the costs of litigation increases substantially if the plaintiffs claim is not dismissed by
court. Because almost all cases end up either dismissed or settled, prior work uses “passing the
motion to dismiss” as proxy for “plaintiff win” (Choi, 2007; Choi, Nelson, and Pritchard, 2009;
Dyck, Morse, and Zingales, 2010).
If plaintiff survives the motion to dismiss then it enters the third stage of discovery. Discovery
typically involves requests for document production, admissions, and depositions of officers,
employees, experts and third parties. Once completed, plaintiff must seek class certification under
Rule 23 of the Federal Rules of Civil Procedure. If granted by court, the case officially becomes a
securities class action. At this point, defendants can face great liability if the case goes to trial and
the often likely outcome is a settlement.
In the final stage, the plaintiff and defendant’s attorney often negotiate a settlement. The
settlement must seek court’s preliminary and final approval. Once approved, the claims
administrator takes over to receive the settlement fund, sends out court approved notices to the
investor class, receive and process the claims and distributes the settlement funds. The whole
process takes a typical 3-4 years to complete.
2.3. Federal Courts and Splits in Pleading Standards
In the U.S., federal courts are given exclusive jurisdiction to hear 10b-5 related securities
lawsuits.12 There are 94 district courts (5 outside the main territory), 13 circuit (appellate) courts,
and one supreme court throughout the country. Each district court has geographical jurisdiction
over a number of counties.13 All federal judges are appointed by the President and approved by
the Senate to have lifetime tenure. Each district court has at least one judge, with some busy
districts such as Southern District of New York and Central District of California each has 28
judges.
The assignment of cases to federal judges is made on a rotational or, more often, random basis
(Bird, 1975; Galasso and Schankerman, 2015).14 Appeals against district court rulings are brought
to its upper circuit court. There are twelve circuit courts dividing the country into different
12 See Section 27 of the 1934 Securities Exchange Act. 13 For geographical jurisdiction of federal district courts, see PACER: https://www.pacer.gov/psco/cgi-bin/county.pl. 14 Though there might be a need to assign more specialized and complex cases to more experienced judge, “to
implement a program that would attempt to assign cases according to the relative abilities of the judges in a district is
understandably unpopular” (Bird, 1975, pp. 483). Moreover, many courts see a danger in fostering judge specialization,
because if certain judges in a district become experts to whom cases in particular areas of the law always would be
assigned, it deprives other judges of the opportunity, provided by random selection, to gain expertise in that legal area.
See Bird (1975).

regions15. The California-based 9th circuit court, for example, has 29 appellate judges, overseeing
13 district courts, and covers 20% of American population. Circuit courts in the U.S. are influential
law-makers for their ability to set legal precedent in their jurisdiction with minimal supervision by
the supreme court. This is particularly the case for securities lawsuits: On average, securities cases
make up less than 1% of Supreme Court’s docket, or about 1.5 cases per year, making circuit courts
the de facto final arbiter (Pritchard, 2011). Appendix B visualizes the geographical jurisdiction of
federal district courts and their corresponding circuit courts. Colors and numbers show their
average dismissal rate and standard deviation over our sample period.
Attorneys, commentators and scholars have long recognized the split in stringency among
circuit courts in securities lawsuits. The split centers on the pleading standard of Scienter, a core
legal element to plead a 10b-5 claim.16 The element of Scienter requires plaintiffs to “state with
particularity facts giving rise to a strong inference that the defendant acted with the required state
of mind.” 17 It is well known that hard evidence of Scienter is difficult to obtain prior to discovery,
and in practice whether plaintiff’s evidence can satisfy Scienter depends largely on the “strong
inference” standard of the relevant court.
On the split in strong inference standard, Choi and Pritchard (2012) divide circuit courts into
three groups (explained next when we discuss Tellabs case): The 1st, 4th, 6th, and 9th circuits
adopted a “preponderance” standard which is pro-defendant firms (of which the 9th Circuit is
probably an extreme); the 2nd, 8th, 10th and 11th circuits adopted an “equal inference” standard
positioned in the middle; the 3rd and 7th circuits adopted a “reasonable person’s” standard which is
15 The thirteenth court of appeals is the United States Court of Appeals for the Federal Circuit, which has nationwide
jurisdiction over certain appeals based on their subject matter. 16 Legal elements to plead a 10b-5 action include evidences supporting plaintiffs’ claims for: (1) materiality; (2)
misrepresentation or omission; (3) scienter; (4) reliance; (5) causation; and (6) damages. See relevant statutory sections,
case law and analysis in Choi and Pritchard (2015). 17 See Exchange Act § 21D(b)(2), 15 U.S.C. 78u-4(b)(2).

pro-plaintiffs.18 To the extent that district court judges make decisions under the prospect of
appellate court scrutiny, the pleading standards adopted by each circuit court exhibit substantial
influence over its underling district courts.
3. Sample and Data
3.1. Data and Sample Distribution
We purchased the Securities Class Action Services (SCAS) database from RiskMetrics’
Institutional Shareholder Services (ISS) to identify all securities lawsuits filed in federal courts.
The SCAS offers detailed portfolio views of securities lawsuits including plaintiffs, defendants,
court, allegations, class periods, claim deadline dates, claims administrator details and pertinent
related data since 1982. This database is known for precision19 and used by Cheng et al. (2010)
and Donelson et al. (2012). Owing to the need to construct court dismissal rate in the post-PSLRA
period, we include lawsuits filed against public companies in NYSE, ASE, or NASDAQ with
alleged Rule 10b-5 violation from 2001 to 2014. The restatement data come from Audit Analytics
(AA). For restatement identification, we exclude firms labelled in AA as “Res Clerical Errors”
since we are interested in restatements that involve (intentional) accounting irregularities. All
financial statement variables are from Compustat, and the stock trading data come from CRSP.
Our objective is to identify a group of firms that made accounting mistakes, some are upfront
with restatements and others keep strategic silence. In practice, whether or not a firm has
18 See Choi and Pritchard (2012, pp. 853-854), citing representative Circuit Court decisions. These standards are
illustrated further in section 4.3 the discussion of Tellabs case. 19 One other (free) database popular for securities class action lawsuit study is the Stanford Law School Securities
Class Action Clearinghouse (SCAC) database. However, as Karpoff et al. (2017) observe, the filing date on the SCAC
database postdates the time at which investors first learn of the purported misconduct that triggers the litigation by an
average of 150 calendar days. For accuracy we purchase the commercial database whose primary purpose is to assist
institutional investors that have a claim in securities lawsuits.
misreported earnings can only be identified through evidences ex post such as firms’ own
restatements, the SEC sanctions, or court trial outcomes. As the SEC is resource constrained, and
most securities litigations end up with settlements rather than trial, this paper employs the
following methods to identify misreporting firms.
Sample 1: 10b-5 defendant firms with alleged GAAP violations
The first sample of misreporting firms (hereafter “sample 1”) is identified using ex post
evidence from securities lawsuits. These firms are caught by shareholders in securities lawsuits,
sued for fraud under SEC rule 10b-5, and in particular, they are alleged of GAAP violations in
plaintiff’s claims. Some of these defendant firms made restatement before the lawsuit, others did
not. Table 1 summarizes our screening process, and below is a step-by-step illustration.
We start with 3,375 securities class action lawsuits with federal filing date between December
31, 2000 to December 31, 2013 in the SCAS database. Merging the lawsuit cases with Compustat
data by ticker or company name, we obtain 1,953 consolidated lawsuits.
In practice, plaintiffs’ counsel can raise multiple allegations under 10b-5 antifraud liability
such as GAAP violations, misrepresentations regarding the business, failure to warn, and
misleading forward-looking statements. Given our focus on GAAP-based financial misstatements,
we exclude cases with only non-accounting allegations, leaving the sample to 1,298.
We next eliminate observations without valid control variables in our tests, and obtain a final
sample comprising 649 lawsuits from 2000 to 2013, among which in 183 cases the defendant firms
made pre-lawsuit restatements, and in 466 cases the defendant firms did not make restatement
before lawsuits. Table 4, Panel A divides our sample 1 lawsuits by their headquartering district
courts, and Panel D reports their yearly distribution.

Sample 2: 10b-5 defendant firms with restatements
The second sample of misreporting firms (hereafter “sample 2”) relies on firms’ own
restatement before and after the lawsuit. Unlike sample 1, in sample 2, counterfactual firms are the
10b-5 defendant firms that made corresponding restatement within the five years after case filing
date. Firms’ own and eventual restatements offers direct evidence that they should have, but did
not make restatement before the lawsuits.
We start with sample 1 and take out the 466 counterfactual firms. Then, we restrict the
counterfactual firms to be the ones that make a restatement within five years after case filing date.
We carefully check to make sure each eventual restatement matches the class period in the 10b-5
lawsuit with alleged GAAP violation. This exercise eliminates the counterfactual firms to 99
observations. Finally, to best match the counterfactual firms with restating firms in the same class-
end year and industry, we select restating firms from sample 1 with the 99 counterfactual firms by
year and industry, which eliminates 59 restating firms. Our final sample 2 consists of 124 restating
firms and 99 counterfactual firms. Table 2 summarizes the screening process for sample 2. Table
4, Panel B displays the distribution of sample 2 by district courts, and Panel D reports their yearly
distribution.
Sample 3: High Earnings Management Firms
Solely relying on securities lawsuits to identify misreporting firms can be problematic, for
not all misreporting were detected by shareholders. Therefore, our third sample of misreporting
firms (hereafter “sample 3”) is identified using the discretionary accrual level of restating and non-
restating firms.

First, we restrict our sample to 101,029 Compustat firm-years with valid discretionary
accruals calculated from Modified Jones Model (Dechow, Sloan, and Sweeney, 1995) with fiscal
year end from January 1, 2001 to December 31, 2014. Among these observations, 7,842 are firms
that restated their financials in the following year. We then obtain the 90th percentile and 10th
percentile discretionary accruals of the restating firms categorized by year and SIC 2-digit industry
code, and match the restating firms with non-restating firms that have discretionary accrual either
higher than the 90th percentile, or lower than the 10th percentile discretionary accruals of the
restating firms in the same industry and year. This selects 25,871 non-restating misreporting firm-
years. Finally, we match the restating and non-restating misreporting firms with SCAS, CRSP and
Compustat variables in later tests, and obtain a sample of 6,930 observations from January 1, 2001
to December 31, 2014, with 2,106 restating firm-years and 4,824 non-restating firm-years. Table
3 summarizes the sampling process for sample 3. Table 4, Panel C reports the distribution of
sample 3 by district courts, and Panel D reports yearly distribution.
Several notes on the rationale behind each sample are in order: Among the three samples,
sample 2 based on defendant firm’s own restatements has the most accurate counterfactual group.
However, the size of sample 2 is small so that we may sacrifice external validity for internal
validity. Sample 1 based 10b-5 defendant firms with alleged GAAP violation has the “second best”
counterfactual group, and it has larger sample size. Sample 1 thus draws a reasonable balance
between internal and external validity. Sample 3 based on firms’ earnings management level has
the largest sample size yet the least accurate counterfactual group, for high earnings management
level can be correlated with, but not hard evidence of misreporting. In this paper, we report results
using each constructed sample of misreporting firms, with an objective to provide validation of
evidence that achieve both internal and external validity.

3.2. Explanatory Variables and Descriptive Statistics
Our key explanatory variable is court dismissal rate, defined by the number of securities cases
dismissed within five years prior to a firm’s fiscal year end in the federal district court where the
firm is headquartered, divided by total such cases filed in the same period in the same court:
𝑑𝑖𝑠𝑚𝑖𝑠𝑠𝑎𝑙𝑖,𝑡 =𝑛𝑜_𝑑𝑖𝑠𝑚𝑖𝑠𝑠𝑎𝑙𝑖,𝑡
𝑛𝑜_𝑓𝑖𝑙𝑖𝑛𝑔𝑠𝑖,𝑡
(1)
where, 𝑛𝑜_𝑑𝑖𝑠𝑚𝑖𝑠𝑠𝑎𝑙𝑖,𝑡 is the number of cases dismissed within the five years prior to the end of
fiscal year 𝑡 of firm 𝑖 handled by the district court where firm 𝑖 is headquartered; and
𝑛𝑜_𝑓𝑖𝑙𝑖𝑛𝑔𝑠𝑖,𝑡 is the number of cases filed within the five years prior to the end of fiscal year 𝑡 of
firm 𝑖 handled by the district court where firm 𝑖 is headquartering.
Note that it may take several years for a case to have any sort of resolution, while other cases
may be dismissed much faster. Therefore, cases dismissed within five years may not exactly
correspond to cases filed during the same period. However, to account for the fact that different
district courts have very different number of firms and lawsuit filings, we believe this scaling
method is reasonable. In the robustness tests, we provide results using alternative estimation of
court dismissal rate which takes into account the lag between case filing and dismissal dates.
One key assumption, that the 10b-5 securities lawsuits are typically heard by the district court
that the defendant firm is headquartered, requires elaboration and validation. In the U.S., though
technically a securities lawsuit can be filed in the court of any federal district where the defendant
firm has place of business, multiple filings need to be consolidated in one case typically heard by
the district court where the defendant firm is headquartered. Two statutory provisions: 28 U.S.C.
§ 1404(a) and 1406(a) provided legal basis for this claim. Section 1404(a) protects parties and
witnesses from an undue expenditure of time and money. Because of the nature of claims in private
securities lawsuits, substantially all of the witnesses and sources of proof are likely to be located
at the firm’s headquarters. Section 1406(a) allows for transfer of a case that has been brought in
an improper forum. Plaintiffs who file suit outside of the federal district of the firm’s headquarter
are highly vulnerable to either dismissal based on the well-established doctrine of forum non
conveniences or transfer to the district court of the defendant firm’s headquarter. Cox, Thomas,
and Bai (2009) report their interview with well-known plaintiffs’ counsels who consistently
reflected that it is impractical for them to engage in forum shopping due to the strong likelihood
that their choice of a venue other than the defendant firm’s principal place of business will be
immediately followed by a successful defendant’s motion to relocate the suit. Hence, rather than
engaging in in futile act, they file suit initially in the defendant company’s home district court.
We verify this assumption using lawsuit and court data between December 31, 2000 to
December 31, 2013. Within the 1,836 cases that have valid federal court filing from SCAS and
headquarter address from Compustat, 67.3%, or over two thirds, are consolidated at and heard by
the defendant firms’ headquartering district court, providing validity to our assumptions.
Our controls of firm characteristics follow the litigation risk and restatement literature. We
first include the natural logarithm of total assets, leverage ratio, and book-to-market ratio.
Following work on restatements (Files, Swanson, and Tse, 2009; Srinivasan, Wahid, and Yu, 2015)
we take ROA, sales growth and last year stock return as control variables for firm performance.
We further control the stock trading activities by including previous-year stock return volatility,
market risk factor loading (beta), stock turnover, and stock return skewness (Kim and Skinner,
2012). Finally, to control for the strength of governance and monitoring system we include whether
a firm’s auditor is a Big 4 auditor (Srinivasan, Wahid, and Yu, 2015). All variables are defined in
Appendix A, and winsorized at 1% level except for restating dummy and court dismissal rate.
Table 5, Panel A, B and C summarizes the descriptive statistics of variables in our sample 1,
2 and 3, respectively, and compares characters of restated and non-restated firms in each sample.
For sample 1, the average court dismissal rate is 31.5%. Mean log total assets (firm size) is
6.66, leverage 22.1% of total assets, and book-to-market ratio at 0.345. The average ROA is -9.4%
of total assets, and sales growth rate at 38.6%. Average daily return volatility is 3.9%, skewness
0.288, and annual turnover at 4.22 million. 85.0% of the firms are audited by the Big 4 auditor
firms. Comparing the restated firms with non-restated firms in sample 1, we find that restated firms
have significantly lower court dismissal rate, smaller firm size and marginally lower sales growth,
and other characteristics are almost similar. This lends us confidence that our non-restated firms
are a good match for restated firms.
For sample 2, the average dismissal rate is 33.5%. Mean log total assets (firm size) is 6.74,
leverage 23.5% of total assets, and book-to-market ratio at 0.55. The average ROA is -8.8% of
total assets, and sales growth rate at 22.7%. Average daily return volatility is 3.7%, skewness 0.351,
and annual turnover at 4.18 million. 87.0% of the firms are audited by the Big 4 auditor firms.
Compared with firms in sample 1, firms in sample 2 have higher accounting returns but lower
growth. Comparing the restated firms and non-restated firms in sample 2, we find that restated
firms have lower court dismissal rate, smaller firm size, lower leverage, higher beta and marginally
lower sales growth.
For sample 3, the average dismissal rate is 38.8%. Mean log total assets (firm size) is 5.98,
leverage 23.0% of total assets, and book-to-market ratio at 0.73. The average ROA is -5.8% of
total assets, and sales growth rate at 13.4%. Average daily return volatility is 3.7%, skewness 0.456,

and annual turnover at 2.10 million. 80.5% of the firms are audited by the Big 4 auditor firms.
Compared with firms in sample 1 and sample 2, firms in sample 3 have even higher accounting
returns but lower growth, smaller size and lower stock turnover. Comparing the restated firms and
non-restated firms in sample 3, we find that restated firms have larger firm size, higher leverage,
lower ROA, lower sales growth, higher last-year stock return, higher beta, lower return volatility
and higher likelihood to be audited by Big 4. As expected, the difference between restated firms
and non-restated firms in sample 3 is distinct from sample 1 and sample 2, due to the difference in
sampling method and a weaker internal validity.
From the univariate analysis of sample 1, 2 and 3, we could find that beta is the most
significant characteristic that distinguish between the restated firms and counterfactual firms, and
court dismissal rate and size may also distinguish these two types of firms.
4. Empirical Results
4.1. Baseline Model
To test the predictive power of prior court dismissal rate on misreporting firms’ propensity to
make restatement in the following year, we propose the following probit model:
𝑅𝑒𝑠𝑡𝑎𝑡𝑖𝑛𝑔𝑖,𝑡+1
= 𝛽0 + 𝛽1𝑑𝑖𝑠𝑚𝑖𝑠𝑠𝑎𝑙𝑖,𝑡 + 𝛽2𝑙𝑒𝑣𝑖,𝑡 + 𝛽3𝑙𝑛𝑎𝑡𝑖,𝑡 + 𝛽4𝑟𝑒𝑡𝑢𝑟𝑛𝑖,𝑡
+ 𝛽5𝑅𝑂𝐴𝑖,𝑡 + 𝛽6𝑠𝑎𝑙𝑒𝑠𝑔𝑟𝑡ℎ𝑖,𝑡 + 𝛽7𝑠𝑡𝑑𝑖,𝑡 + 𝛽8𝑡𝑢𝑟𝑛𝑜𝑣𝑒𝑟𝑖,𝑡
+ 𝛽9𝑠𝑘𝑒𝑤𝑛𝑒𝑠𝑠𝑖,𝑡 + 𝛽10𝐵𝑖𝑔4𝑖,𝑡 + 𝛽11𝑏𝑡𝑚𝑖,𝑡 + 𝛽12𝑏𝑒𝑡𝑎𝑖,𝑡 + 𝜀𝑖,𝑡
(2)

where, 𝑅𝑒𝑠𝑡𝑎𝑡𝑖𝑛𝑔𝑡+1 is an indicator variable that takes 1 if the firm restates in fiscal year t+120;
𝑑𝑖𝑠𝑚𝑖𝑠𝑠𝑎𝑙𝑡 is the court dismissal rate for the headquartering firm; 𝑙𝑒𝑣𝑡 is the book leverage at the
end of fiscal year t; 𝑙𝑛𝑎𝑡𝑡 is the natural logarithm of total assets at the end of fiscal year t; 𝑟𝑒𝑡𝑢𝑟𝑛𝑡
is the annual total return over fiscal year t; 𝑅𝑂𝐴𝑡 is the return on total assets in the fiscal year t;
𝑠𝑎𝑙𝑒𝑠𝑔𝑟𝑡ℎ𝑡 is sales growth from fiscal year t-1 to t; 𝑠𝑡𝑑𝑡 is the daily return volatility over fiscal
year t; 𝑡𝑢𝑟𝑛𝑜𝑣𝑒𝑟𝑡 is the turnover over fiscal year t; 𝑠𝑘𝑒𝑤𝑛𝑒𝑠𝑠𝑡 is the return skewness over fiscal
year t; 𝐵𝑖𝑔4𝑡 is an indicator variable that takes 1 if the firm has a Big 4 auditor firm as its auditor;
𝑏𝑡𝑚𝑡 is the book-to-market ratio at the end of fiscal year t; and 𝑏𝑒𝑡𝑎𝑡 is the market risk factor
loading from CAPM model, estimated from the monthly stock returns of the 5-year period before
the most recent fiscal year end. We control for the state fixed effects because some states have
more than one district court and we need to disentangle the effect of court stringency from the
unobservable state level economic, social and political effects. We also control for industry fixed
effects and year fixed effects.
Table 6 reports the impact of court dismissal rate on the likelihood of firm issuing restatement
conditioning on that they committed accounting mistakes using sample 1 (Column 1), sample 2
(Column 2) and sample 3 (Column 3). Industry fixed effects, year fixed effects and state fixed
effects are included in all of the three regressions. The industry and year fixed effects filter out
time-varying and industry-level shocks that may affect the restatement decision, and the state fixed
effect controlled for state-wide differences in business and regulatory environment.
20 Note that for the counterfactual firms in sample 1 and sample 2, we take their class-end date as the hypothetical
restating date and the latest fiscal year up to the class-end date as fiscal year t in equation 2, since the restating firms
and counterfactual firms are matched by lawsuit and class-end year in these two samples. However, as the restating
firms and counterfactual firms in sample 3 are matched by discretionary accrual level, industry and fiscal year, we
directly take their fiscal year as fiscal year t in equation 2.

We find court dismissal rate exhibits a large negative impact on the likelihood of misreporting
firm issuing restatement (p=0.0256, 0.0207 and 0.0648 for the regressions with sample 1, 2 and 3,
respectively). Remarkably, court dismissal rate is the only variable that has both statistical
significance and large consistent economic magnitude among the regressions with three samples:
Column 1, Column 2 and Column 3 shows one standard deviation increase in court dismissal rate
(lowered district litigation risk) leads to 4.89%, 6.87% and 1.53% reduction in restatement
propensity, holding constant all controls and fixed effects, compared to an average restating rate
of 28.2%, 55.6% and 30.4% for the three samples, respectively. The one standard deviation
increase in dismissal rate amounts to increase that from the level of Illinois (Northern) to that of
California (Northern) district court.
Stock returns, ROA, Sales growth, Beta, Turnover, and Book-to-Market all exhibit either
insignificant effect on restatement before lawsuits or significant but contradict effects among
samples. Surprisingly, having a big 4 auditor has little impact on restatement propensity, probably
because auditors are concerned about their own legal and reputational penalties when their audited
firm made accounting mistakes (Seetharaman, Gul, and Lynn, 2002; Hope and Langli, 2010). In
sum, our baseline model analysis supports the preemptive disclosure hypothesis.
4.2. Instrumental Variable Analysis Using the Tellabs Case
To validate our proposition that firms’ restatement propensity is driven by court stringency, we
exploit the landmark case of Tellabs, Inc v. Makor Issues & Rights, Ltd. The case was originally
dismissed by the district court of Northern Illinois, reversed by the 7th circuit court upon appeal21,
further appealed to the supreme court which granted certiorati22, and finally judge Posner of the
21 See 437 F.3d 588, 602 (7th Cir. 2006) 22 See Tellabs, Inc. v. Makor Issues & Rights, Ltd. 551 U.S. 308 (2007).

7th circuit court rendered final ruling following supreme court’s clarified pleading standard.23 We
choose Tellabs because it is one of the supreme court’s first efforts to clarify the key legal element
in 10b-5 lawsuits: the strong inference standard for pleading Scienter.
Prior to Tellabs, different court of appeals followed their own approach in interpreting the
strong inference standards, and monitor by the supreme court is close to nonexistent (Westerland
et al., 2010). To illustrate, the “preponderance” standard adopted by the 1st, 4th, 6th, and 9th
circuit is most favorable to defendant. It requires the inference that the defendants had the requisite
Scienter (fraudulent intent or recklessness) to be the most plausible when compared with
competing inference of “No Scienter”. In the middle, the “equal inference” standard adopted by
the 2nd, 8th, 10th and 11th circuit required at least a “tie” of competing inference of Scienter and
No Scienter. Lastly, the “reasonable person” standard adopted by the 3rd and 7th circuits is most
favorable to plaintiffs. It only requires the court to look at the plausibility of the plaintiff’s
allegations, without requiring any assessment of competing inferences (Choi and Pritchard, 2012).
Importantly, the supreme court’s ruling on Tellabs in 2007 clarifies what is required for the
plaintiff to plead Scienter. In the supreme court’s certiorari, it addressed if there is a tie of
competing evidence showing the inference of fraudulent intent is at least as likely as an innocent
one, the ties go to the plaintiff. 24 This stance of the supreme court mimics the middle, “equal
inference” standard adopted by the 2nd, 8th, 10th and 11th circuit, which is more stringent than
the “preponderance” standard adopted by the 1st, 4th, 6th, and 9th circuit, and less stringent than
the “reasonable person” standard adopted by the 3rd and 7th circuit. To the extent that lower courts
make decisions anticipating upper court’s tendency and risk of reversal (Gulati, Choi and Posner,
23 See Makor Issues & Rights, Ltd. v. Tellabs, Inc., F.3d, No. 04-1687, 2008 WL 151180 (7th Cir. Jan. 17, 2008). 24 Specifically, Justice Ginsburg, writing for the Tellabs majority, held: “A complaint will survive, we hold, only if a
reasonable person would deem the inference of scienter cogent and at least as compelling as any opposing inference
on could draw from the facts alleged.” see Tellabs, Inc. v. Makor Issues & Rights, Ltd. 551 U.S. 308 (2007), at 324.

2012; Choi, Gulati, and Posner, 2016), the effect of Tellabs is that it homogenizes what is required
for plaintiffs to establish scienter across all circuits. Specifically, we hypothesize that the Tellabs
decision exogenously increase the pleading standard of federal courts that previously adopted a
“pro-defendant” standard of scienter, and perhaps decrease that of the federal courts that
previously adopted a “pro-plaintiff” standard of scienter.
We exploit this homogenizing effect into a two-stage, instrumental variable test. Our
instrumental variable is the relative stringency of district courts in the pre-Tellabs period. In the
first stage, following Choi and Pritchard (2011), we categorize district courts under the 1st, 4th,
6th, and 9th circuit as “pre-event low” stringency courts, and those under the 3rd and 7th circuit
as “pre-event high” stringency courts. If the homogenizing effect exists, then we expect to see a
decrease (increase) of dismissal rate in “pre-event low (high)” stringency courts in the post-
Tellabs period. In the second stage, we explore the impact of the (instrumented) change in court
dismissal on the change in restatement propensity for misreporting firms headquartered in the
relevant district courts.
Several notes on this instrumental variable design are in order: First, we believe this instrument
satisfies the conditions of both relevance and exclusion restriction. District court’s pre-event
stringency should be correlated with the homogenizing shock of Tellabs decision. It is also unlikely
that this dummy variable should have direct effect on the change of firms’ restatement policy upon
the ruling by supreme court, other than through the channel of changes in district court stringency.
Second, on the methodology, to balance internal validity and sample size, we choose our sample
1 misreporting firms as the testing sample in our two stage test. We choose two relative long event
window, the 6-year window (3-year pre- and post-Tellabs) and the 10-year window (5-year pre-
and post-Tellabs), taking into account the fact that it takes time for managers of the misreporting
firms to know about their accounting mistakes and to deliberate on their restatement decision in
response to altered pleading standard.25 Third, as the Tellabs decision spans 2006 through 2007,
these two years are excluded from our event window. Therefore, our pre-event period for the 6-
year window is from January 2003 to December 2005; the post-event period for the 6-year window
is from January 2008 to December 2010; the pre-event period for the 10-year window is from
January 2001 to December 2005; and the post-event period for the 10-year window is from January
2008 to December 2012.
Table 7 reports the results. In the first stage test (Column 1 and 3), the pre-event low stringency
dummy is negatively associated with changes in dismissal rate following Tellabs for both event
windows (p=0.0984 and 0.0338, respectively), confirming our assumption that the supreme court’s
Tellabs decision prompts low-stringency courts to increase stringency (decrease dismissal rate) in
post-Tellabs period. On the other hand, we do not find a symmetric increase in dismissal rate in
pre-event high stringency courts (the coefficient is insignificantly negative). This result is not
surprising26, and finds perfect match with Choi and Pritchard (2011), who find Tellabs correlates
with a significantly lower dismissal rate on Scienter grounds in circuits previously applying a
higher “preponderance” standard, yet no significant shift in the courts previous applying the lower
“reasonableness” standard.
In the second stage, our instrumented change in court dismissal rate presents significantly
negative correlation with the change in restating rates for both event windows (p=0.0296 and
0.0013, respectively), suggesting that court dismissal rate has a negative impact on misreporting
25 For example, in our sample of misreporting firms, the mean and medium days for the time gap between misreporting
fiscal year and restatement date (or class end date) are 151 and 132 days respectively. 26 One can reasonably expect that the effect of intensified monitoring by the supreme court to have stronger effect on
the previously lax, rather than previously stringent underline courts.

firms’ propensity to make restatement. Taken together, evidence from Tellabs decision validates
and provides causal evidence supporting a preemptive disclosure hypothesis.
4.3. Court Stringency and Market Responses to Pre-emptive Restatements
So far we have shown that misreporting firms make timelier restatements when they face a
more stringent court. A natural question is whether such a restatement policy is “rational” in the
sense that there are gains in making pre-emptive restatements. To shed light on this query this
section studies the shareholder wealth effect of pre-emptive restatements in the presence of varying
district court stringency.
Our empirical strategy is to compare the market reaction around two key dates for our samples
of misreporting defendant firms. The first is the “class end date” which is the date when the truth
that “corrected” the stock price was first revealed to the market (Kellogg, 1984; Griffin, Grundfest,
and Perino, 2004; Gande and Lewis, 2009). For firms making pre-lawsuit restatement their class
end date is typically the same with their restatement date. For firms that did not make pre-lawsuit
restatement the class end date is their “deemed” restatement date, which we extract from the SCAS.
The second event date is the “case filing date”, which is the date when the first plaintiff filed the
lawsuit in a district court. We examine both event dates because the class end date was the first
time that market knows about the misreporting, and studies that only focus on filing date returns
tend to underestimate the true economic costs associated with securities lawsuits (Gande and Lewis,
2009).
Note this event study can only be conducted using our sample 1 and 2 of sued firms, where both
event dates are available. Merging the daily stock trading data from CRSP and the filing dates and

class-end dates from SCAS reduces our sample 1 misreporting firms to 520 observations and
sample 2 misreporting firms to 286 observations.
Table 8 employing standard event study methodology presents very interesting results. Column
(1) and (2) show the 5-day (-2, +2) cumulative abnormal return (CAR) around class-end date and
case-filing date on sample 1, and Column (3) and (4) on sample 2. We first find the correlation of
court dismissal rate and CAR is significantly positive on the class-end date but insignificantly
negative on the filing date. On the economic magnitude, one standard deviation increase in court
dismissal rate leads to a net gain of 0.7% and 1.2% in market value around the class-end date, but
a net loss of 0.2% and 0.1% around the case-filing date, for sample 1 and 2 respectively.
Cumulatively the effect of court dismissal rate on CAR is positive. This evidence is consistent
with investors anticipate more legal cost for firms headquartered in high litigation risk districts.
To the extent that the market anticipates and capitalizes expected loss (including legal cost) of
securities lawsuits, we then ask whether preemptive restatements help to save shareholder value.
Interestingly, we find firms’ honesty in making pre-emptive restatements appear not rewarded by
the market. Data show that in sample 1, restated firms suffer 3.1% more loss around the class-end
date and 3.4% more loss around the case-filing date than non-restated firms. In sample 2, restated
firms suffer 0.8% more loss around the class-end date and 4.1% more loss around the case-filing
date than non-restating firms. However, the cumulative CAR differences between restating and
non-restating firms are not statistically significant.
At first look, our result seems to suggest that managers are not making rational decisions by
timely admitting their accounting mistakes. However, by allowing the effect of restatement on
CAR to depend on defendant firm’s home court dismissal rate changes the picture. We find the
CAR difference between restated and non-restated firms becomes significantly negative with the
increase of court dismissal rate. One standard deviation increase in court dismissal rate leads to
6.3% and 8.8% more shareholder value loss for restated firms than non-restated firms around the
two dates in sample 1 (p=0.0514 and 0.0028 respectively), and 7.1% and 5.5% more shareholder
value loss for restated firms than non-restated firms around the two dates in sample 2 (p=0.0014
and 0.0041 respectively). A “mechanical” explanation of the result is that investors are more
surprised (thus react more negatively) to learn that firms under more stringent courts did not restate.
The other way to interpret this result is that, for misreporting firms in more stringent courts, making
preemptive restatement saves shareholder value. However, for misreporting firms in less stringent
courts, preemptive restatement harms shareholder value.
This interesting result can be rationalized under Akerlof’s (1970) adverse selection model. In
the absence of stringent courts, the expected legal penalty for misreporting is low, thus most
misreporting firms have incentive to hide their accounting mistakes. In a lemon’s market where
investors cannot differentiate honest and opportunistic firms, honest (restating) firms are penalized
more. However, in the presence of stringent courts, the expected legal penalty for misreporting is
high and credible, causing honest firms to be rewarded by the market.
Taken together, our evidence suggests the value of being honest (through pre-emptive
restatements) increases as court stringency increases. Upfront restatements pay off (in saving
shareholders value) when investors perceive the court enforcement available to them is high.
5. Robustness Check
5.1. The Effect of Unobservable Misreporting Firms
Most of our results come from sample 1 and 2, which rely on lawsuits to identify misreporting
firms. However, many misreporting firms are not eventually sued. In this subsection, we use

simple model to show that omitting those non-sued firms does not threat the external validity of
our results. In an ideal experimental environment, we would have
𝑅𝑒𝑠𝑡𝑎𝑡𝑖𝑛𝑔 𝑅𝑎𝑡𝑒 =#𝑠𝑟𝑠𝑡 + #𝑛𝑠𝑟𝑠𝑡
#𝑠𝑟𝑠𝑡 + #𝑛𝑠𝑟𝑠𝑡 + #𝑠𝑛𝑟𝑠𝑡 + #𝑛𝑠𝑛𝑟𝑠𝑡 (3)
where, #𝑠𝑟𝑠𝑡 is the number of sued and restating firms; #𝑛𝑠𝑟𝑠𝑡 is the number of non-sued but
restating firms; #𝑠𝑛𝑟𝑠𝑡 is the number of sued but non-restating misreporting firms; and #𝑛𝑠𝑛𝑟𝑠𝑡
is the number of non-sued and non-restating misreporting firms.
Now, in sample 1 and sample 2, we do not have the number of non-sued but restating firms and
the number of non-sued and non-restating misreporting firms. This leads to a biased measure of
restating rate:
𝑅𝑒𝑠𝑡𝑎𝑡𝑖𝑛𝑔 𝑅𝑎𝑡𝑒̂ =#𝑠𝑟𝑠𝑡
#𝑠𝑟𝑠𝑡 + #𝑠𝑛𝑟𝑠𝑡. (4)
The key determinants of how 𝑅𝑒𝑠𝑡𝑎𝑡𝑖𝑛𝑔 𝑅𝑎𝑡𝑒̂ biases are the correlation between the number
of non-sued but restating firms and court dismissal rate and the correlation between the number of
non-sued and non-restating misreporting firms and court dismissal rate. Ceteris paribus, if the
number of non-sued but restating firms and court dismissal rate are not correlated or negatively
correlated, we still have that restating rate in high-dismissal rate court is lower than restating rate
in low-dismissal rate court because putting the number of non-sued but restating firms on both the
numerator and denominator of the right-hand side of equation 4 increases the restating rate and the
original higher restating rate increases even higher mathematically:
#𝑠𝑟𝑠𝑡𝑙 + #𝑛𝑠𝑟𝑠𝑡𝑙
#𝑠𝑟𝑠𝑡𝑙 + #𝑠𝑛𝑟𝑠𝑡𝑙 + #𝑛𝑠𝑟𝑠𝑡𝑙>
#𝑠𝑟𝑠𝑡ℎ + #𝑛𝑠𝑟𝑠𝑡ℎ
#𝑠𝑟𝑠𝑡ℎ + #𝑠𝑛𝑟𝑠𝑡ℎ + #𝑛𝑠𝑟𝑠𝑡ℎ
𝑖𝑓 #𝑠𝑟𝑠𝑡𝑙
#𝑠𝑟𝑠𝑡𝑙 + #𝑠𝑛𝑟𝑠𝑡𝑙>
#𝑠𝑟𝑠𝑡ℎ
#𝑠𝑟𝑠𝑡ℎ + #𝑠𝑛𝑟𝑠𝑡ℎ 𝑎𝑛𝑑 #𝑛𝑠𝑟𝑠𝑡𝑙 ≥ #𝑛𝑠𝑟𝑠𝑡ℎ ,

where, the subscript 𝑙 denotes the low-dismissal rate court; and the subscript ℎ denotes the high-
dismissal rate court. This is supported by the disclosure literature (Field, Lowry and Shu, 2005)
that the preemptive disclosure is made to reduce the litigation risk and it is easier for companies to
avoid lawsuits in low-dismissal rate court than in high-dismissal rate court, which leads to the
negative correlation between the number of non-sued but restating firms and court dismissal rate.
Also, ceteris paribus, if the number of non-sued and non-restating misreporting firms and court
dismissal rate are not correlated or negatively correlated, we still have that restating rate in high-
dismissal rate court is lower than restating rate in low-dismissal rate court because putting the
number of non-sued and non-restating firms on both the numerator and denominator of the right-
hand side of equation 4 decreases the restating rate and the original higher restating rate is still
higher mathematically:
#𝑠𝑟𝑠𝑡𝑙
#𝑠𝑟𝑠𝑡𝑙 + #𝑠𝑛𝑟𝑠𝑡𝑙 + #𝑛𝑠𝑛𝑟𝑠𝑡𝑙>
#𝑠𝑟𝑠𝑡ℎ
#𝑠𝑟𝑠𝑡ℎ + #𝑠𝑛𝑟𝑠𝑡ℎ + #𝑛𝑠𝑛𝑟𝑠𝑡ℎ
𝑖𝑓 #𝑠𝑟𝑠𝑡𝑙
#𝑠𝑟𝑠𝑡𝑙 + #𝑠𝑛𝑟𝑠𝑡𝑙>
#𝑠𝑟𝑠𝑡ℎ
#𝑠𝑟𝑠𝑡ℎ + #𝑠𝑛𝑟𝑠𝑡ℎ 𝑎𝑛𝑑 #𝑛𝑠𝑛𝑟𝑠𝑡𝑙 ≥ #𝑛𝑠𝑛𝑟𝑠𝑡ℎ .
It is reasonable to assert that non-restating misreporting firms in low-dismissal rate court are
more likely to avoid lawsuits, and thus become non-sued non-restating misstating firms, which
leads to the negative correlation between the number of non-sued non-restating misstating firms
and court dismissal rate.
To verify the analysis above, we construct sample 3 contains both sued misreporting firms and
non-sued misreporting firms and conduct the regression of equation 2. The results confirm our
argument that firms are more likely to restate their accounting misstatement when they are
headquartered in the jurisdiction of low-dismissal rate courts.

5.2. Impact of Court Stringency on the Propensity of Restating Accounting Errors
This paper highlights the impact of court stringency on the propensity of restating irregularities.
In this subsection, we check the impact of court stringency on the likelihood of restating accounting
errors. Unlike accounting irregularities which is more related to fraud, accounting errors are mainly
due to accidental omissions which are unlikely to support a 10b-5 lawsuits. This key difference
allows us to use restatement propensity on accounting errors as a placebo in a falsification test.
Intuitively, if firms’ restatement policy is indeed affected by their home court stringency in 10b-5
lawsuits, which, by definition, is only relevant to fraud, then we should not expect to find court
stringency to have significant effect on restatement propensity for accounting errors.
This test is clearly tougher because in our sample, the number of firms that restate accounting
errors and are sued in securities class action lawsuits is only 5. One alternative approach is to
construct a new sample (hereafter “accounting error sample”). In the accounting error sample, we
match all firms that restate accounting errors between January 1, 2001 and December 31, 2015
with the non-restating misreporting firms from sample 3.27 Then, we re-run the regression of
equation 2 on the accounting error sample. Table 9 reports the results. We find court dismissal
rate exhibits an insignificantly positive impact on the likelihood of misstated firm restating
accounting errors (p=0.5825). This evidence, albeit coarse, lends some support to our argument
that court stringency is only relevant to the restatement of accounting irregularities, which are
related to fraud, and not relevant to the restatement of accounting errors, which reflects
(unintentional) omissions.
27 This way of construction, we admit, is not accurate, for the counterfactual firms are selected from firms that are
considered to have accounting irregularity rather than error. However, the fact is that we cannot hope to identify firms
that made accounting errors and haven’t restated their errors.
5.3 Alternative Measure of Court Dismissal Rate
One shortcoming in the construction of our key explanatory variable, court dismissal rate, is
that cases dismissed within five years may not exactly correspond to cases filed during the same
period. However, to account for the fact that different district courts have very different number
of headquartering firms and lawsuit filings, we believe this scaling method is reasonable. To
address this issue empirically, this subsection tests our baseline hypothesis using alternative court
dismissal rate that takes into account the gap between case filing date and case dismissal date.
Our alternative court dismissal rate is defined by the number of securities cases dismissed
within five years prior to a firm’s fiscal year end in the federal district court where the firm is
headquartered, divided by total such cases filed in the same court in the five years lagged 587 days
to the period used to calculate the number of cases dismissed. 587 days is the average gap between
the filing date and dismissal date for our 1,634 dismissed cases from 1996 to 2013 in the SCAS
database:
𝑑𝑖𝑠𝑚𝑖𝑠𝑠𝑎𝑙𝑖,𝑡,587 =𝑛𝑜_𝑑𝑖𝑠𝑚𝑖𝑠𝑠𝑎𝑙𝑖,𝑡
𝑛𝑜_𝑓𝑖𝑙𝑖𝑛𝑔𝑠𝑖,𝑡,587
(5)
where, 𝑛𝑜_𝑑𝑖𝑠𝑚𝑖𝑠𝑠𝑎𝑙𝑖,𝑡 is the number of cases dismissed within the five years prior to the end of
fiscal year 𝑡 of firm 𝑖 handled by the district court where firm 𝑖 is headquartered; and
𝑛𝑜_𝑓𝑖𝑙𝑖𝑛𝑔𝑠𝑖,𝑡,587 is the number of cases filed within the five years ended 587 days prior to the end
of fiscal year 𝑡 of firm 𝑖 handled by the district court where firm 𝑖 is headquartered.
We re-run the baseline regression analysis in Equation 2 with this alternative court dismissal
rate. The sample period starts from August 10th, 2002 instead of December 31st, 2000 as it requires
587-day gap between case filing date and case dismissal date to calculate the alternative court
dismissal rate. Table 10 reports the results using sample 1 (Column 1), sample 2 (Column 2) and
sample 3 (Column 3). We find court dismissal rate exhibits a large negative impact on the
propensity of misreporting firms issuing restatement (p=0.0721, 0.0239 and 0.0647 for the
regressions with sample 1, 2 and 3, respectively). This evidence supports that the gap between case
filing date and case dismissal date does not contaminate our results.
6. Conclusion
This paper provides the first evidence that district court stringency affects misreporting firms’
propensity to admit their accounting mistakes through restatements. Novelty to this study is our
exploitation of the variation of federal district court dismissal rate in securities lawsuits as proxy
for court stringency. We find strong evidence supporting a preemptive disclosure hypothesis:
Misreporting firms headquartered in more stringent courts are more likely to make irregularity-
based, not error-based, accounting restatement. This result is robust to our three constructed
samples of misreporting firms to balance both internal and external validity, and to alternative
measures of court stringency. Instrumental variable analysis using supreme court’s Tellabs
decision provides causal evidence to our baseline result. Event study on the value implication of
pre-emptive restatements shows that investors not only anticipate higher legal cost for firms in
more stringent courts, but also the value of being honest increases as firms’ home court stringency
increases. In sum, this paper uncovers the significant, but often neglected role of court stringency
in enforcing misreporting firms to timely admit their accounting mistakes.

Reference
Ajinkya, B., Bhojraj, S., Sengupta, P., 2005. The association between outside directors,
institutional investors and the properties of management earnings forecasts. Journal of Accounting
Research 43, 343-376.
Akerlof, G.A., 1970. The market for “lemons”: Quality uncertainty and the market
mechanism. The Quarterly Journal of Economics 84, 488-500.
Amoah, N.Y., Tang, A.P., 2013. Resolution of restatement-induced lawsuits after the Private
Securities Litigation Reform Act. Research in Accounting Regulation 25, 41-46.
Atanassov, J., 2013. Do hostile takeovers stifle innovation? Evidence from antitakeover legislation
and corporate patenting. Journal of Finance 68(3): 1097‒1131.
Badertscher, B., J. Phillips, M. Pincus, and S. Rego. 2009. Earnings management strategies and
the trade-off between tax benefits and detection risk: To conform or not to conform? The
Accounting Review 84 (1):63-97.
Baginski, S.P., Hassell, J.M., Kimbrough, M.D., 2002. The effect of legal environment on
voluntary disclosure: Evidence from management earnings forecasts issued in US and Canadian
markets. The Accounting Review 77, 25-50.
Ball, R., 2001. Infrastructure requirements for an economically efficient system of public financial
reporting and disclosure. Brookings-Wharton papers on financial services 2001, 127-169.
Beatty, A., Weber, J., Yu, J.J., 2008. Conservatism and debt. Journal of Accounting &
Economics 45, 154-174.
Bertrand, M., and Mullainathan, S., 2003. Enjoying the quiet life? Corporate governance and
managerial preferences. Quarterly Journal of Economics 111(5), 1043-75.
Bhide, A. V., and H. H. Stevenson., 1990. Why be honest is honesty does not pay? Harvard
Business Review 68(5), 121–129.
Bhojraj, S., Libby, R., Yang, H., 2010. Analyzing guidance at the firm level: The association
between guidance frequency, guidance properties, and market reactions. Unpublished Paper,
Available a t/http://papers. ssrn. com/sol3/papers. cfm.
Billings, Brooke, M., Cedergren, M.C., 2015. Strategic silence, insider selling and litigation
risk. Journal of Accounting & Economics 59, 119-142.
Bird, S. W. 1975. The assignment of cases to federal district court judges. Stanford Law Review
27(2), 475-487.
Brown, S.V., Tucker, J.W., 2011. Large‐sample evidence on firms’ year‐over‐year MD&A
modifications. Journal of Accounting Research 49, 309-346.
Brown, S., Hillegeist, S.A., Lo, K., 2005. Management forecasts and litigation risk. Sauder School
of Business Working Paper.
Burks, J.J., 2007. Sarbanes-Oxley and the effect of restatements on CEO and CFO compensation
and turnover. THE University of Iowa.
Burns, N., Kedia, S., 2006. The impact of performance-based compensation on
misreporting. Journal of Financial Economics 79, 35-67.
Cao, Z., Narayanamoorthy, G.S., 2011. The effect of litigation risk on management earnings
forecasts. Contemporary Accounting Research 28, 125-173.
Cao, Z., Narayanamoorthy, G.S., 2014. Accounting and litigation risk: evidence from Directors’
and Officers’ insurance pricing. Review of Accounting Studies 19, 1-42.
Cazier, R.A., Christensen, T.E., Merkley, K.J., Treu, J.S., 2017. Litigation Risk and Non-GAAP
Reporting. Working paper, available at: https://ssrn.com/abstract=2928260.
Chalmers, K., Naiker, V., Navissi, F. 2012. Earnings quality and Rule 10b-5 securities class action
lawsuits. Journal of Accounting and Public Policy 31, 22–43.
Cheng, C.S., Huang, H.H., Li, Y., Lobo, G., 2010. Institutional monitoring through shareholder
litigation. Journal of Financial Economics 95, 356-383.
Choi, S.J., 2007. Do the merits matter less after the Private Securities Litigation Reform
Act? Journal of Law, Economics, and Organization 23, 598-626.
Choi, S.J., Gulati, M., and Posner, E.A. 2016. The Role of Competence in Promotions from the
Lower Federal Courts, 44 Journal of Legal Studies 107-131.
Choi, S.J., Pritchard, A., 2012. The Supreme Court’s impact on securities class actions: An
empirical assessment of Tellabs. Journal of Law, Economics, and Organization 28, 4: 850-881.
Choi, S.J., Pritchard, A., 2015. Securities Regulation: Cases and Analysis, Foundation Press (4th
edition)
Choi, S.J., Nelson, K.K., Pritchard, A.C., 2009. The screening effect of the private securities
litigation reform act. Journal of Empirical Legal Studies 6, 35-68.
Collins, D., Reitenga, A.L., Sanchez-Cuevas, J.M., 2005. The managerial consequences of
earnings restatements. Memphis, TN.
Collins, D., Masli, A., Reitenga, A. and Sanchez, J., 2009. Earning Restatements, the Sarbanes-
Oxley Act, and the Disciplining of Chief Financial Officers, Journal of Accounting, Auditing &
Finance 24, 1–34.
Cox, J.D., Thomas, R.S., Bai, L., 2009. Do difference in pleading cause forum shopping in
securities class action lawsuits? Wisconsin Law Review 421: 422-53.
Dechow, P.M., Sloan, R.G., Sweeney, A.P., 1996. Causes and consequences of earnings
manipulation: An analysis of firms subject to enforcement actions by the SEC. Contemporary
Accounting Research 13, 1-36.
Dechow, P.M., Ge, W., Larson, C.R., Sloan, R.G., 2011. Predicting material accounting
misstatements. Contemporary Accounting Research 28, 17-82.
Desai, H., Hogan, C.E., Wilkins, M.S., 2006. The reputational penalty for aggressive accounting:
Earnings restatements and management turnover. The Accounting Review 81, 83-112.
Djankov, S., Hart, O., McLiesh, C., and Shleifer, A., 2008, Debt enforcement around the world.
Journal of Political Economy 116, 1105–49.

Dobbie, W., Goldsmith-Pinkham, P., Yang, C.S., 2016 forthcoming. Consumer bankruptcy and
financial health. Review of Economics and Statistics.
Donelson, D.C., McInnis, J.M., Mergenthaler, R.D., Yu, Y., 2012. The timeliness of bad earnings
news and litigation risk. The Accounting Review 87, 1967-1991.
Dyck, A., Morse, A., Zingales, L., 2010. Who blows the whistle on corporate fraud? The Journal
of Finance 65, 2213-2253.
Efendi, J., Srivastava, A., Swanson, E.P., 2007. Why do corporate managers misstate financial
statements? The role of option compensation and other factors. Journal of Financial Economics 85,
667-708.
Feroz, E.H., Park, K.J., Pastena, V., 2008. The financial and market effects of the SEC's accounting
and auditing enforcement releases. Journal of Accounting Research 29, 107-142.
Field, L., Lowry, M., Shu, S., 2005. Does disclosure deter or trigger litigation? Journal of
Accounting & Economics 39, 487-507.
Files, R., Swanson, E.P., Tse, S., 2009. Stealth disclosure of accounting restatements. The
Accounting Review 84, 1495-1520.
Francis, J., Philbrick, D., Schipper, K., 1994. Shareholder litigation and corporate
disclosures. Journal of Accounting Research, 137-164.
Galasso, A., and Schankerman, M., 2015. Patents and cumulative innovation: causal evidence from
the courts. The Quarterly Journal of Economics 130, 317-369.
Gande, A., and Lewis, C.M. 2009. Shareholder-initiated class action lawsuits: Shareholder wealth
effects and industry spillovers. Journal of Financial and Quantitative Analysis 44, 823-850.
Garvey, G., and Hanka, G., 1999. Capital structure and corporate control: the effect of antitakeover
statutes on firm leverage. Journal of Finance 54, 519–546.
Graham, J., Harvey, C., and Rajgopal, S., 2005. The economic implications of corporate financial
reporting. Journal of Accounting and Economics 40, 3–73.

Griffin, P.A., Grundfest, J.A., and Perino, M.A., 2004. Stock price response to news of securities
fraud litigation: an analysis of sequential and conditional information. Abacus 40, 21-48.
Gulati, M., Choi, S.J. and Posner, E.A., 2012. What Do Federal District Judges Want?: An
Analysis of Publications, Citations, and Reversals. Journal of Law, Economics & Organization
28(3), 518-549
Habib, A., Jiang, H., Bhuiyan, M.B.U. and Islam, A., 2014. Litigation risk, financial reporting and
auditing: A survey of the literature. Research in Accounting Regulation 26, 145-163.
Hope, O. K., and Langli, J. C., 2010. Auditor independence in a private firm and low litigation risk
setting. The Accounting Review 85, 573–605.
Hribar, P., Jenkins, N.T., 2004. The effect of accounting restatements on earnings revisions and
the estimated cost of capital. Review of Accounting Studies 9, 337-356.
Hribar, P., Kravet, T., Wilson, R., 2014. A new measure of accounting quality. Review of
Accounting Studies 19, 506-538.
Jayaraman, N., Mulford, C., Wedge, L., 2004. Accounting fraud and management
turnover. Working paper, Georgia Institute of Technology.
Jayaraman, S., Milbourn, T., 2009. Does equity-based CEO compensation really increase litigation
risk. Unpublished Working Paper, Washington University.
Johnson, M.F., Nelson, K.K., Pritchard, A.C., 2007. Do the merits matter more? The impact of the
Private Securities Litigation Reform Act. Journal of Law, Economics, and Organization 23, 627-
652.
Johnson, M.F., Kasznik, R., Nelson, K.K., 2001. The impact of securities litigation reform on the
disclosure of Forward‐Looking information by high technology firms. Journal of Accounting
Research 39, 297-327.
Karpoff, J., Koester, A., Lee, S., and Martin, G.S., 2017. Proxies and Databases in Financial
Misconduct Research. The Accounting Review, forthcoming.
Kellogg, R. L., 1984. Accounting activities, security prices, and class action lawsuits. Journal of
Accounting and Economics 6, 185-204.
Kim, I., Skinner, D.J., 2012. Measuring securities litigation risk. Journal of Accounting &
Economics 53, 290-310.
Kinney, W.R., McDaniel, L.S., 1989. Characteristics of firms correcting previously reported
quarterly earnings. Journal of Accounting & Economics 11, 71-93.
Kling, J.R., 2006. Incarceration length, employment, and earnings. The American Economic
Review 96, 863-876.
Kothari, S.P., Shu, S. and Wysocki, P.D., 2009. Do managers withhold bad news?. Journal of
Accounting Research 47, 241-276.
La Porta, R., Lopez-de Silanes, F., Shleifer, A., and Vishny, R. W., 1997, Legal Determinants of
External Finance. The Journal of Finance 52, 1131–50.
La Porta, R., Lopez-de Silanes, F., Shleifer, A., and Vishny, R. W. 1998, Law and Finance. Journal
of Political Economy 106, 1113–55.
Laux, V., Stocken, P.C., 2012. Managerial reporting, overoptimism, and litigation risk. Journal of
Accounting & Economics 53, 577-591.
Lowry, M., 2009. Discussion of ‘Shareholder litigation and changes in disclosure
behavior’. Journal of Accounting & Economics 47, 157-159.
Matsumoto, D.A., 2002. Management’s incentives to avoid negative earnings surprises. The
Accounting Review 77, 483-514.
Nagar, V., 1999. The role of manager’s human capital in discretionary disclosure. Journal of
Accounting Research 37, 167–81.
Palmrose, Z.V., Scholz, S., 2004. The Circumstances and Legal Consequences of Non‐GAAP
Reporting: Evidence from Restatements. Contemporary Accounting Research 21, 139-180.

Palmrose, Z.V., Richardson, V.J., Scholz, S., 2004. Determinants of market reactions to
restatement announcements. Journal of Accounting & Economics 37, 59-89.
Pritchard, A.C., 2011. Securities Law in the Roberts Court: Agenda or Indifference. Journal of
Corporate Law 37, 105-145.
Rogers, J.L., Buskirk, A.V., 2009. Shareholder litigation and changes in disclosure
behavior. Journal of Accounting & Economics 47, 136-156.
Rogers, J.L., Stocken, P.C., 2005. Credibility of management forecasts. The Accounting
Review 80, 1233-1260.
Schrand, C.M., Zechman, S.L.C., 2012. Executive overconfidence and the slippery slope to
financial misreporting. Journal of Accounting & Economics 53, 311-329.
Seetharaman, A., Gul, F. A., Lynn, S. G., 2002. Litigation risk and audit fees: Evidence from UK
firms cross-listed on US markets. Journal of Accounting and Economics 33, 91–115.
Skinner, D.J., 1994. Why firms voluntarily disclose bad news. Journal of Accounting Research 32,
38-60.
Skinner, D.J., 1997. Earnings disclosures and stockholder lawsuits. Journal of Accounting and
Economics 23, 249-282.
Srinivasan, S., Wahid, A.S., Yu G., 2014. Admitting mistakes: Home country effect on the
reliability of restatement reporting. The Accounting Review 90, 1201-1240.
Wald, J., and Long, M., 2007. The effect of state laws on capital structure. Journal of
Financial Economics 83, 297–319.
Westerland, C., Segal, J.A., Epstein, L., Cameron, C.M., Comparato, S., 2010. Strategic defiance
and compliance in the US courts of appeals. American Journal of Political Science 54, 891-905.
Wu, M., 2002. Earnings restatements: A capital market perspective. Available at SSRN 1844265.
Yermack, D., 1997. Good Timing: CEO Stock Option Awards and Company News
Announcements. Journal of Finance 52, 449–76.
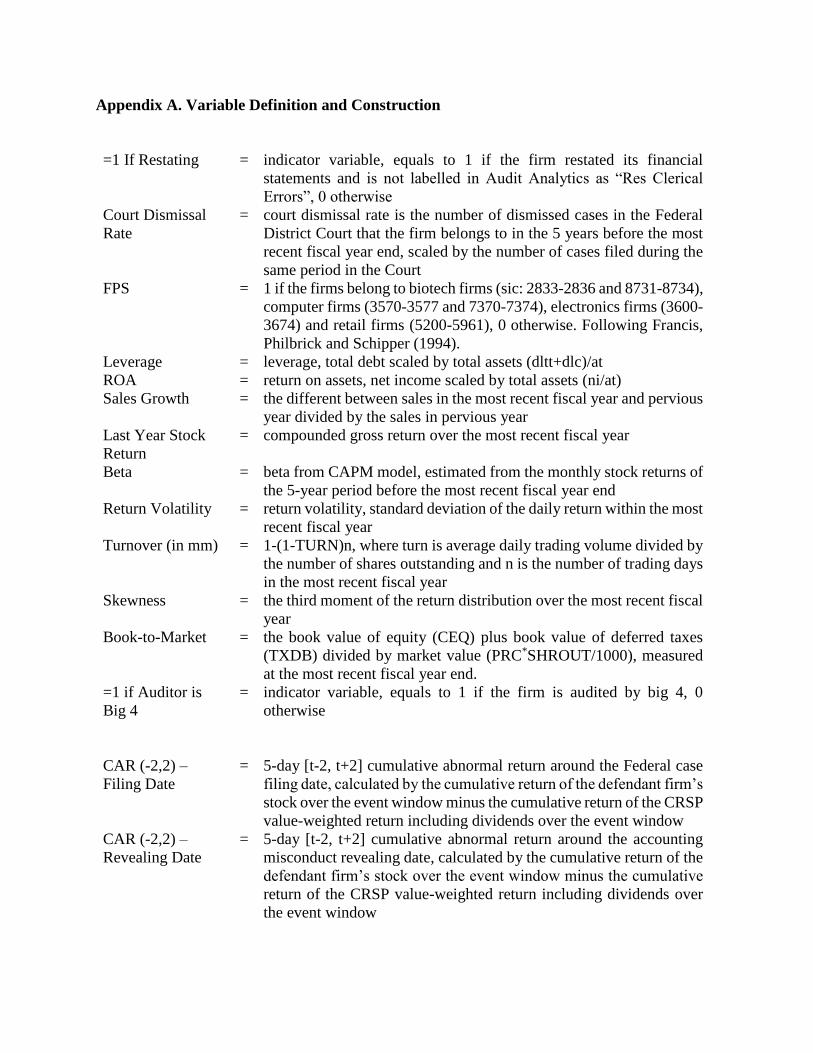
Appendix A. Variable Definition and Construction
=1 If Restating = indicator variable, equals to 1 if the firm restated its financial
statements and is not labelled in Audit Analytics as “Res Clerical
Errors”, 0 otherwise
Court Dismissal
Rate
= court dismissal rate is the number of dismissed cases in the Federal
District Court that the firm belongs to in the 5 years before the most
recent fiscal year end, scaled by the number of cases filed during the
same period in the Court
FPS = 1 if the firms belong to biotech firms (sic: 2833-2836 and 8731-8734),
computer firms (3570-3577 and 7370-7374), electronics firms (3600-
3674) and retail firms (5200-5961), 0 otherwise. Following Francis,
Philbrick and Schipper (1994).
Leverage = leverage, total debt scaled by total assets (dltt+dlc)/at
ROA = return on assets, net income scaled by total assets (ni/at)
Sales Growth = the different between sales in the most recent fiscal year and pervious
year divided by the sales in pervious year
Last Year Stock
Return
= compounded gross return over the most recent fiscal year
Beta = beta from CAPM model, estimated from the monthly stock returns of
the 5-year period before the most recent fiscal year end
Return Volatility = return volatility, standard deviation of the daily return within the most
recent fiscal year
Turnover (in mm) = 1-(1-TURN)n, where turn is average daily trading volume divided by
the number of shares outstanding and n is the number of trading days
in the most recent fiscal year
Skewness = the third moment of the return distribution over the most recent fiscal
year
Book-to-Market = the book value of equity (CEQ) plus book value of deferred taxes
(TXDB) divided by market value (PRC*SHROUT/1000), measured
at the most recent fiscal year end.
=1 if Auditor is
Big 4
= indicator variable, equals to 1 if the firm is audited by big 4, 0
otherwise
CAR (-2,2) –
Filing Date
= 5-day [t-2, t+2] cumulative abnormal return around the Federal case
filing date, calculated by the cumulative return of the defendant firm’s
stock over the event window minus the cumulative return of the CRSP
value-weighted return including dividends over the event window
CAR (-2,2) –
Revealing Date
= 5-day [t-2, t+2] cumulative abnormal return around the accounting
misconduct revealing date, calculated by the cumulative return of the
defendant firm’s stock over the event window minus the cumulative
return of the CRSP value-weighted return including dividends over
the event window

Log Total
Settlement
= natural Logarithm of the total settlement amount
Class-period
Return
= The cumulative stock return over the class period
Log Class Length = The natural logarithm of the number of days over the class period
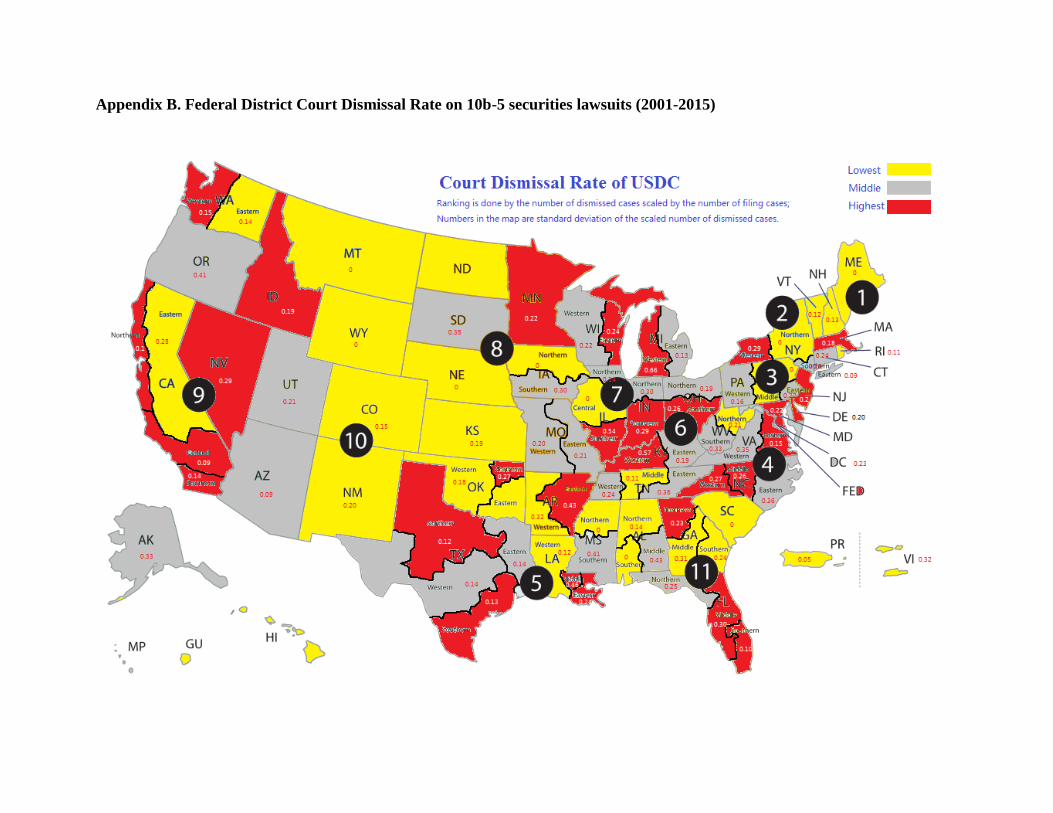
Appendix B. Federal District Court Dismissal Rate on 10b-5 securities lawsuits (2001-2015)
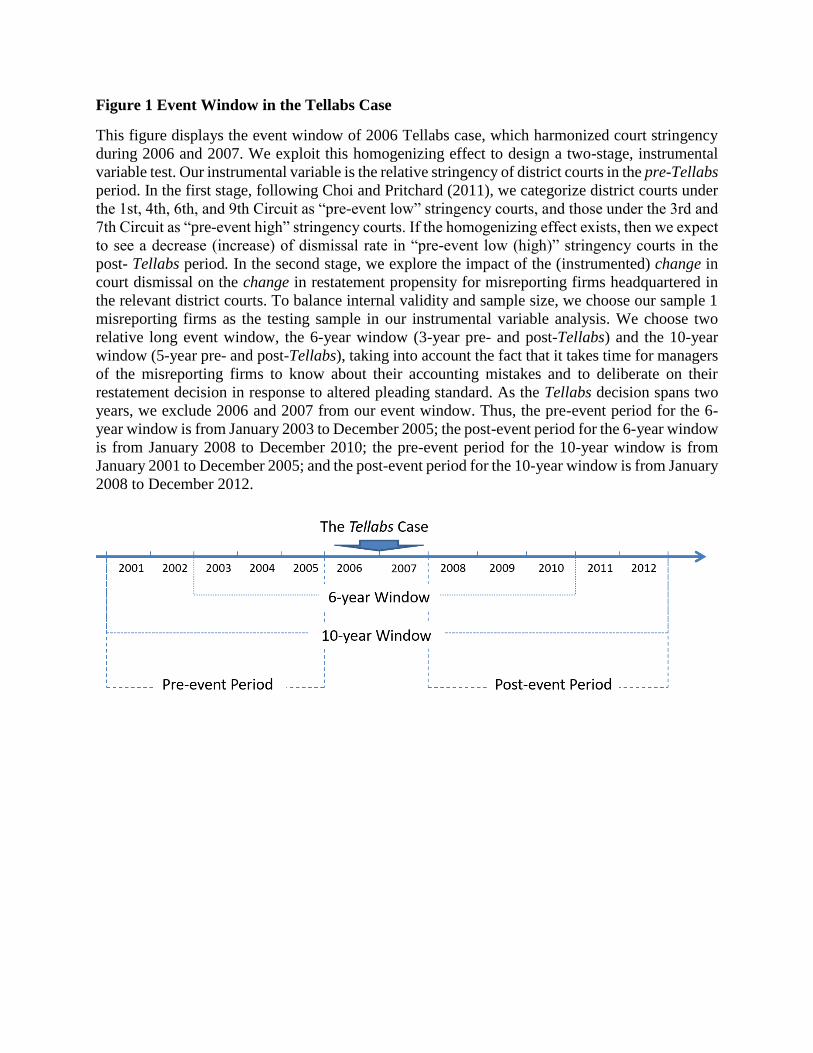
Figure 1 Event Window in the Tellabs Case
This figure displays the event window of 2006 Tellabs case, which harmonized court stringency
during 2006 and 2007. We exploit this homogenizing effect to design a two-stage, instrumental
variable test. Our instrumental variable is the relative stringency of district courts in the pre-Tellabs
period. In the first stage, following Choi and Pritchard (2011), we categorize district courts under
the 1st, 4th, 6th, and 9th Circuit as “pre-event low” stringency courts, and those under the 3rd and
7th Circuit as “pre-event high” stringency courts. If the homogenizing effect exists, then we expect
to see a decrease (increase) of dismissal rate in “pre-event low (high)” stringency courts in the
post- Tellabs period. In the second stage, we explore the impact of the (instrumented) change in
court dismissal on the change in restatement propensity for misreporting firms headquartered in
the relevant district courts. To balance internal validity and sample size, we choose our sample 1
misreporting firms as the testing sample in our instrumental variable analysis. We choose two
relative long event window, the 6-year window (3-year pre- and post-Tellabs) and the 10-year
window (5-year pre- and post-Tellabs), taking into account the fact that it takes time for managers
of the misreporting firms to know about their accounting mistakes and to deliberate on their
restatement decision in response to altered pleading standard. As the Tellabs decision spans two
years, we exclude 2006 and 2007 from our event window. Thus, the pre-event period for the 6-
year window is from January 2003 to December 2005; the post-event period for the 6-year window
is from January 2008 to December 2010; the pre-event period for the 10-year window is from
January 2001 to December 2005; and the post-event period for the 10-year window is from January
2008 to December 2012.
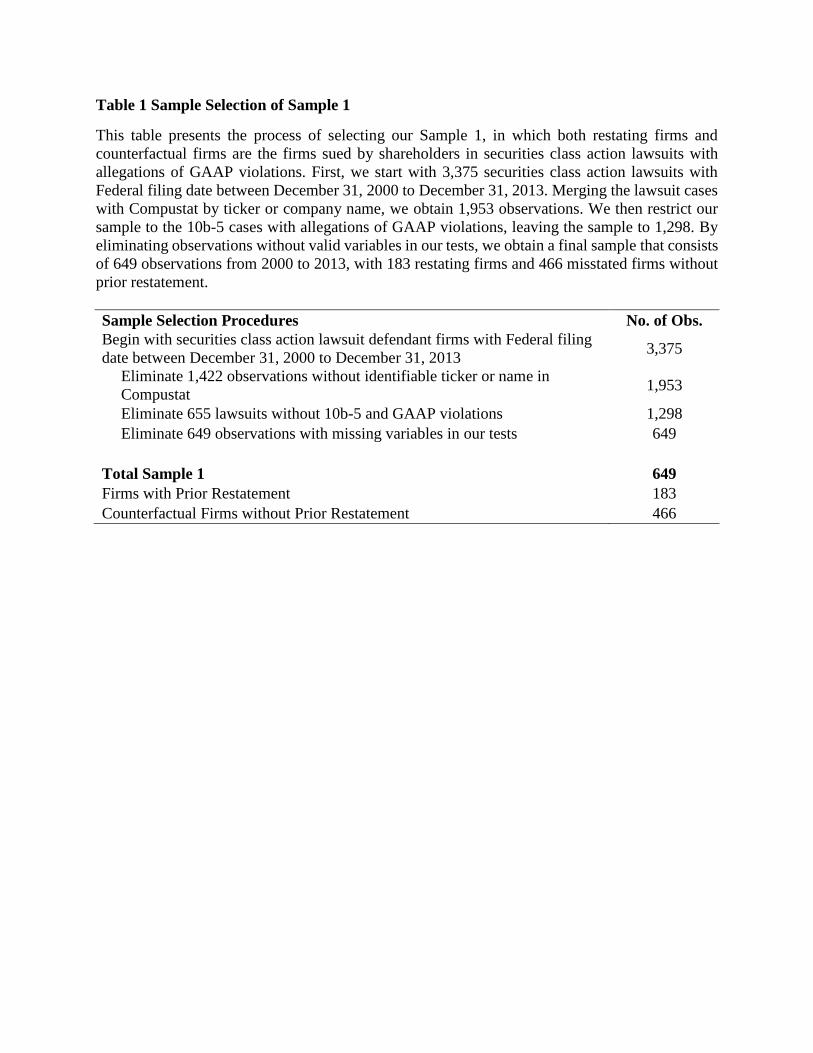
Table 1 Sample Selection of Sample 1
This table presents the process of selecting our Sample 1, in which both restating firms and
counterfactual firms are the firms sued by shareholders in securities class action lawsuits with
allegations of GAAP violations. First, we start with 3,375 securities class action lawsuits with
Federal filing date between December 31, 2000 to December 31, 2013. Merging the lawsuit cases
with Compustat by ticker or company name, we obtain 1,953 observations. We then restrict our
sample to the 10b-5 cases with allegations of GAAP violations, leaving the sample to 1,298. By
eliminating observations without valid variables in our tests, we obtain a final sample that consists
of 649 observations from 2000 to 2013, with 183 restating firms and 466 misstated firms without
prior restatement.
Sample Selection Procedures No. of Obs.
Begin with securities class action lawsuit defendant firms with Federal filing
date between December 31, 2000 to December 31, 2013 3,375
Eliminate 1,422 observations without identifiable ticker or name in
Compustat 1,953
Eliminate 655 lawsuits without 10b-5 and GAAP violations 1,298
Eliminate 649 observations with missing variables in our tests 649
Total Sample 1 649
Firms with Prior Restatement 183
Counterfactual Firms without Prior Restatement 466

Table 2 Sample Selection of Sample 2
This table presents the process of selecting our Sample 2, in which counterfactual firms are
securities class action lawsuit defendant firms that violate US GAAP and make a restatement
within the five years after case filing date. First, we start with our Sample 1 and take out the 466
counterfactual firms. Then, we restrict the counterfactual firms to be the ones that make a
restatement the five years after case filing date. This eliminates the counterfactual firms to 99
observations. Finally, we matched restating firms from our Sample 1 with the 99 counterfactual
firms by year and industry, which eliminates 59 restating firms. Our final Sample 2 consists of 124
restating firms and 99 counterfactual firms.
Sample Selection Procedures No. of Obs.
Begin with the counterfactual firms of Sample 1 466
Eliminate 367 observations without ex post restatement within the five
years after case filing date 99
Take the restating firms of Sample 1 183
Match the restating firms with the 99 counterfactual firms by year and
industry 124
Total Sample 2 223
Firms with Prior Restatement 124
Misstated Firms without Prior Restatement 99

Table 3 Sample Selection of Sample 3
This table presents the process of selecting our Sample 3, in which counterfactual firms are
identified by the discretionary accrual level. First, we restrict our sample to 10,1029 Compustat
firm-years with valid discretionary accruals calculated from Modified Jones Model (Dechow, et
al., 1995) with fiscal year end from December 31, 2000 to December 31, 2014. Among those
observations, 7,842 are firms that restates their financials in the following year. We then obtain
the 90th percentile and 10th percentile discretionary accruals of the restating firms categorized by
year and SIC 2-digit industry code, and match the restating firms with non-restating firms that
have discretionary accrual either higher than the 90th percentile discretionary accruals of the
restating firms or lower than the 10th percentile discretionary accruals of the restating firms in the
same industry and year. This selects 25,871 non-restating culpable firm-years. Finally, we match
the restating and non-restating culpable firms with SCAS, CRSP and Compustat variables in the
later tests, and obtain a sample consists of 6,930 observations from December 31, 2000 to
December 31, 2014, with 2,106 restating firm-years and 4,824 non-restating but culpable firm-
years.
Sample Selection Procedures No. of
Obs.
Begin with Compustat firm-years with valid discretionary accruals calculated from
Modified Jones Model (Dechow, et al., 1995) with fiscal year end from December
31, 2000 to December 31, 2014
10,1029
Restating Firms
7,842 of the firm-years with valid discretionary accruals are restating firms 7,842
Eliminate 5,736 observations with missing information from SCAS,
Compustat or CRSP 2,106
Non-restating Culpable Firms
93,187 of the firm-years with valid discretionary accruals are non-restating firms 93,187
Select the firm-years that have discretionary accrual either higher than the
maximum discretionary accruals of the restating firms or lower than the
minimum discretionary accruals of the restating firms in the same industry
and year
25,871
Eliminate 21,047 observations with missing information from SCAS,
Compustat or CRSP 4,824
Total Sample 6,930
Firms with Prior Restatement 2,106
Misstated Firms without Prior Restatement 4,824

Table 4 Distribution of Samples by Federal Court and by Year
This table reports the distributions of our three restricted samples. Panel A, Panel B and Panel C
display the distributions by Federal Courts of the Sample 1, Sample 2 and Sample 3
correspondently. Panel D exhibits the distribution of our three samples by year.
Panel A: Distribution of Sample 1 by Court
=1 if Restating
Federal Court N. of Obs. % Mean Std. Dev. Median
USDC - Alabama (Northern) 1 0.2% 100% . 100%
USDC - Alaska 4 0.6% 75% 50% 100%
USDC - Arizona 17 2.6% 29% 47% 0%
USDC - Arkansas (Eastern) 1 0.2% 0% . 0%
USDC - Arkansas (Western) 2 0.3% 0% 0% 0%
USDC - California (Central) 36 5.5% 36% 49% 0%
USDC - California (Northern) 85 13.1% 21% 41% 0%
USDC - California (Southern) 10 1.5% 20% 42% 0%
USDC - Colorado 18 2.8% 33% 49% 0%
USDC - Connecticut 13 2.0% 38% 51% 0%
USDC - Delaware 1 0.2% 0% . 0%
USDC - District of Columbia 2 0.3% 0% 0% 0%
USDC - Florida (Middle) 12 1.8% 25% 45% 0%
USDC - Florida (Southern) 7 1.1% 29% 49% 0%
USDC - Georgia (Northern) 14 2.2% 7% 27% 0%
USDC - Idaho 6 0.9% 33% 52% 0%
USDC - Illinois (Northern) 38 5.9% 42% 50% 0%
USDC - Indiana (Northern) 2 0.3% 50% 71% 50%
USDC - Indiana (Southern) 8 1.2% 25% 46% 0%
USDC - Kansas 15 2.3% 33% 49% 0%
USDC - Kentucky (Eastern) 1 0.2% 0% . 0%
USDC - Kentucky (Western) 2 0.3% 0% 0% 0%
USDC - Louisiana (Middle) 2 0.3% 50% 71% 50%
USDC - Maryland 13 2.0% 23% 44% 0%
USDC - Massachusetts 33 5.1% 21% 42% 0%
USDC - Michigan (Eastern) 12 1.8% 8% 29% 0%
USDC - Michigan (Western) 3 0.5% 33% 58% 0%
USDC - Minnesota 10 1.5% 20% 42% 0%
USDC - Missouri (Western) 3 0.5% 33% 58% 0%
USDC - Montana 1 0.2% 100% . 100%
USDC - Nebraska 8 1.2% 25% 46% 0%
USDC - Nevada 6 0.9% 50% 55% 50%
USDC - New Hampshire 3 0.5% 0% 0% 0%
USDC - New Jersey 21 3.2% 29% 46% 0%
USDC - New Mexico 7 1.1% 29% 49% 0%
USDC - New York (Eastern) 10 1.5% 10% 32% 0%

USDC - New York (Northern) 2 0.3% 50% 71% 50%
USDC - New York (Southern) 45 6.9% 24% 43% 0%
USDC - New York (Western) 2 0.3% 0% 0% 0%
USDC - North Carolina (Eastern) 5 0.8% 60% 55% 100%
USDC - North Carolina (Middle) 3 0.5% 0% 0% 0%
USDC - North Carolina (Western) 2 0.3% 0% 0% 0%
USDC - Ohio (Northern) 7 1.1% 57% 53% 100%
USDC - Ohio (Southern) 8 1.2% 25% 46% 0%
USDC - Oklahoma (Northern) 1 0.2% 0% . 0%
USDC - Oklahoma (Western) 1 0.2% 0% . 0%
USDC - Oregon 15 2.3% 47% 52% 0%
USDC - Pennsylvania (Eastern) 15 2.3% 20% 41% 0%
USDC - Pennsylvania (Middle) 1 0.2% 0% . 0%
USDC - Pennsylvania (Western) 8 1.2% 38% 52% 0%
USDC - Rhode Island 2 0.3% 0% 0% 0%
USDC - South Carolina 1 0.2% 0% . 0%
USDC - South Dakota 1 0.2% 0% . 0%
USDC - Tennessee (Eastern) 1 0.2% 0% . 0%
USDC - Tennessee (Middle) 3 0.5% 0% 0% 0%
USDC - Tennessee (Western) 1 0.2% 0% . 0%
USDC - Texas (Eastern) 4 0.6% 25% 50% 0%
USDC - Texas (Northern) 20 3.1% 50% 51% 50%
USDC - Texas (Southern) 17 2.6% 41% 51% 0%
USDC - Texas (Western) 9 1.4% 22% 44% 0%
USDC - Utah 6 0.9% 17% 41% 0%
USDC - Vermont 1 0.2% 100% . 100%
USDC - Virginia (Eastern) 11 1.7% 18% 40% 0%
USDC - Washington (Eastern) 4 0.6% 25% 50% 0%
USDC - Washington (Western) 18 2.8% 39% 50% 0%
USDC - West Virginia (Southern) 1 0.2% 0% . 0%
USDC - Wisconsin (Eastern) 2 0.3% 0% 0% 0%
USDC - Wisconsin (Western) 1 0.2% 0% . 0%
USDC - Wyoming 4 0.6% 25% 50% 0%
Total 649 28%

Panel B: Distribution of Sample 2 by Court
=1 if Restating
Federal Court N. of Obs. Mean Std. Dev. Median
USDC - Alabama (Northern) 1 0.4% 100% . 100%
USDC - Arizona 7 3.1% 71% 49% 100%
USDC - California (Central) 17 7.6% 59% 51% 100%
USDC - California (Northern) 35 15.7% 43% 50% 0%
USDC - California (Southern) 4 1.8% 75% 50% 100%
USDC - Colorado 3 1.3% 67% 58% 100%
USDC - Connecticut 4 1.8% 50% 58% 50%
USDC - Florida (Middle) 4 1.8% 50% 58% 50%
USDC - Florida (Southern) 1 0.4% 100% . 100%
USDC - Georgia (Northern) 4 1.8% 25% 50% 0%
USDC - Illinois (Northern) 17 7.6% 76% 44% 100%
USDC - Indiana (Northern) 1 0.4% 100% . 100%
USDC - Indiana (Southern) 5 2.2% 20% 45% 0%
USDC - Kansas 4 1.8% 50% 58% 50%
USDC - Louisiana (Middle) 1 0.4% 0% . 0%
USDC - Maryland 3 1.3% 67% 58% 100%
USDC - Massachusetts 12 5.4% 58% 51% 100%
USDC - Michigan (Eastern) 6 2.7% 17% 41% 0%
USDC - Michigan (Western) 1 0.4% 0% . 0%
USDC - Minnesota 3 1.3% 67% 58% 100%
USDC - Missouri (Western) 2 0.9% 50% 71% 50%
USDC - Nevada 4 1.8% 50% 58% 50%
USDC - New Jersey 6 2.7% 67% 52% 100%
USDC - New York (Eastern) 1 0.4% 100% . 100%
USDC - New York (Southern) 15 6.7% 67% 49% 100%
USDC - New York (Western) 2 0.9% 50% 71% 50%
USDC - North Carolina (Eastern) 1 0.4% 100% . 100%
USDC - North Carolina (Middle) 1 0.4% 0% . 0%
USDC - North Carolina (Western) 1 0.4% 100% . 100%
USDC - Ohio (Northern) 5 2.2% 60% 55% 100%
USDC - Ohio (Southern) 3 1.3% 67% 58% 100%
USDC - Oregon 1 0.4% 100% . 100%
USDC - Pennsylvania (Eastern) 7 3.1% 29% 49% 0%
USDC - Pennsylvania (Western) 2 0.9% 50% 71% 50%
USDC - Tennessee (Eastern) 1 0.4% 0% . 0%
USDC - Tennessee (Middle) 1 0.4% 0% . 0%
USDC - Tennessee (Western) 1 0.4% 0% . 0%
USDC - Texas (Eastern) 1 0.4% 0% . 0%
USDC - Texas (Northern) 11 4.9% 91% 30% 100%
USDC - Texas (Southern) 7 3.1% 71% 49% 100%
USDC - Texas (Western) 4 1.8% 50% 58% 50%

USDC - Virginia (Eastern) 4 1.8% 25% 50% 0%
USDC - Washington (Eastern) 2 0.9% 50% 71% 50%
USDC - Washington (Western) 7 3.1% 57% 53% 100%
Total 223 56%

Panel C: Distribution of Sample 3 by Court
=1 if Restating
Federal Court N. of Obs. Mean Std. Dev. Median
USDC - Alabama (Northern) 37 0.5% 49% 51% 0%
USDC - Alabama (Southern) 3 0.0% 0% 0% 0%
USDC - Alaska 10 0.1% 50% 53% 50%
USDC - Arizona 137 2.0% 26% 44% 0%
USDC - Arkansas (Eastern) 8 0.1% 38% 52% 0%
USDC - Arkansas (Western) 22 0.3% 14% 35% 0%
USDC - California (Central) 426 6.1% 34% 47% 0%
USDC - California (Eastern) 23 0.3% 17% 39% 0%
USDC - California (Northern) 567 8.2% 38% 49% 0%
USDC - California (Southern) 140 2.0% 35% 48% 0%
USDC - Colorado 192 2.8% 39% 49% 0%
USDC - Connecticut 167 2.4% 25% 44% 0%
USDC - Delaware 19 0.3% 26% 45% 0%
USDC - District of Columbia 18 0.3% 44% 51% 0%
USDC - Florida (Middle) 147 2.1% 22% 41% 0%
USDC - Florida (Northern) 3 0.0% 67% 58% 100%
USDC - Florida (Southern) 172 2.5% 26% 44% 0%
USDC - Georgia (Northern) 222 3.2% 34% 47% 0%
USDC - Idaho 5 0.1% 0% 0% 0%
USDC - Illinois (Central) 3 0.0% 33% 58% 0%
USDC - Illinois (Northern) 377 5.4% 30% 46% 0%
USDC - Illinois (Southern) 1 0.0% 0% . 0%
USDC - Indiana (Northern) 20 0.3% 15% 37% 0%
USDC - Indiana (Southern) 56 0.8% 29% 46% 0%
USDC - Iowa (Northern) 12 0.2% 8% 29% 0%
USDC - Iowa (Southern) 25 0.4% 20% 41% 0%
USDC - Kansas 38 0.5% 34% 48% 0%
USDC - Kentucky (Eastern) 12 0.2% 33% 49% 0%
USDC - Kentucky (Western) 33 0.5% 24% 44% 0%
USDC - Louisiana (Eastern) 15 0.2% 7% 26% 0%
USDC - Louisiana (Middle) 12 0.2% 33% 49% 0%
USDC - Maine 1 0.0% 0% . 0%
USDC - Maryland 94 1.4% 35% 48% 0%
USDC - Massachusetts 340 4.9% 34% 47% 0%
USDC - Michigan (Eastern) 91 1.3% 30% 46% 0%
USDC - Michigan (Western) 9 0.1% 11% 33% 0%
USDC - Minnesota 147 2.1% 25% 44% 0%
USDC - Mississippi (Southern) 4 0.1% 0% 0% 0%
USDC - Missouri (Eastern) 19 0.3% 26% 45% 0%
USDC - Missouri (Western) 48 0.7% 17% 38% 0%
USDC - Montana 1 0.0% 0% . 0%

USDC - Nebraska 35 0.5% 23% 43% 0%
USDC - Nevada 66 1.0% 45% 50% 0%
USDC - New Hampshire 34 0.5% 15% 36% 0%
USDC - New Jersey 249 3.6% 33% 47% 0%
USDC - New Mexico 3 0.0% 67% 58% 100%
USDC - New York (Eastern) 116 1.7% 20% 40% 0%
USDC - New York (Northern) 6 0.1% 50% 55% 50%
USDC - New York (Southern) 272 3.9% 38% 49% 0%
USDC - New York (Western) 52 0.8% 17% 38% 0%
USDC - North Carolina (Eastern) 31 0.4% 35% 49% 0%
USDC - North Carolina (Middle) 43 0.6% 23% 43% 0%
USDC - North Carolina (Western) 69 1.0% 30% 46% 0%
USDC - Ohio (Northern) 138 2.0% 30% 46% 0%
USDC - Ohio (Southern) 112 1.6% 23% 42% 0%
USDC - Oklahoma (Northern) 28 0.4% 25% 44% 0%
USDC - Oklahoma (Western) 20 0.3% 20% 41% 0%
USDC - Oregon 93 1.3% 25% 43% 0%
USDC - Pennsylvania (Eastern) 186 2.7% 30% 46% 0%
USDC - Pennsylvania (Middle) 6 0.1% 50% 55% 50%
USDC - Pennsylvania (Western) 78 1.1% 26% 44% 0%
USDC - Rhode Island 9 0.1% 22% 44% 0%
USDC - South Carolina 29 0.4% 31% 47% 0%
USDC - South Dakota 12 0.2% 17% 39% 0%
USDC - Tennessee (Eastern) 38 0.5% 26% 45% 0%
USDC - Tennessee (Middle) 61 0.9% 28% 45% 0%
USDC - Tennessee (Western) 28 0.4% 18% 39% 0%
USDC - Texas (Eastern) 57 0.8% 26% 44% 0%
USDC - Texas (Northern) 315 4.5% 26% 44% 0%
USDC - Texas (Southern) 373 5.4% 31% 46% 0%
USDC - Texas (Western) 98 1.4% 39% 49% 0%
USDC - Utah 79 1.1% 23% 42% 0%
USDC - Virginia (Eastern) 178 2.6% 26% 44% 0%
USDC - Virginia (Western) 27 0.4% 30% 47% 0%
USDC - Washington (Eastern) 27 0.4% 33% 48% 0%
USDC - Washington (Western) 156 2.3% 35% 48% 0%
USDC - West Virginia (Northern) 1 0.0% 0% . 0%
USDC - West Virginia (Southern) 9 0.1% 44% 53% 0%
USDC - Wisconsin (Eastern) 86 1.2% 31% 47% 0%
USDC - Wisconsin (Western) 31 0.4% 19% 40% 0%
USDC - Wyoming 3 0.0% 0% 0% 0%
Total 6930 30%
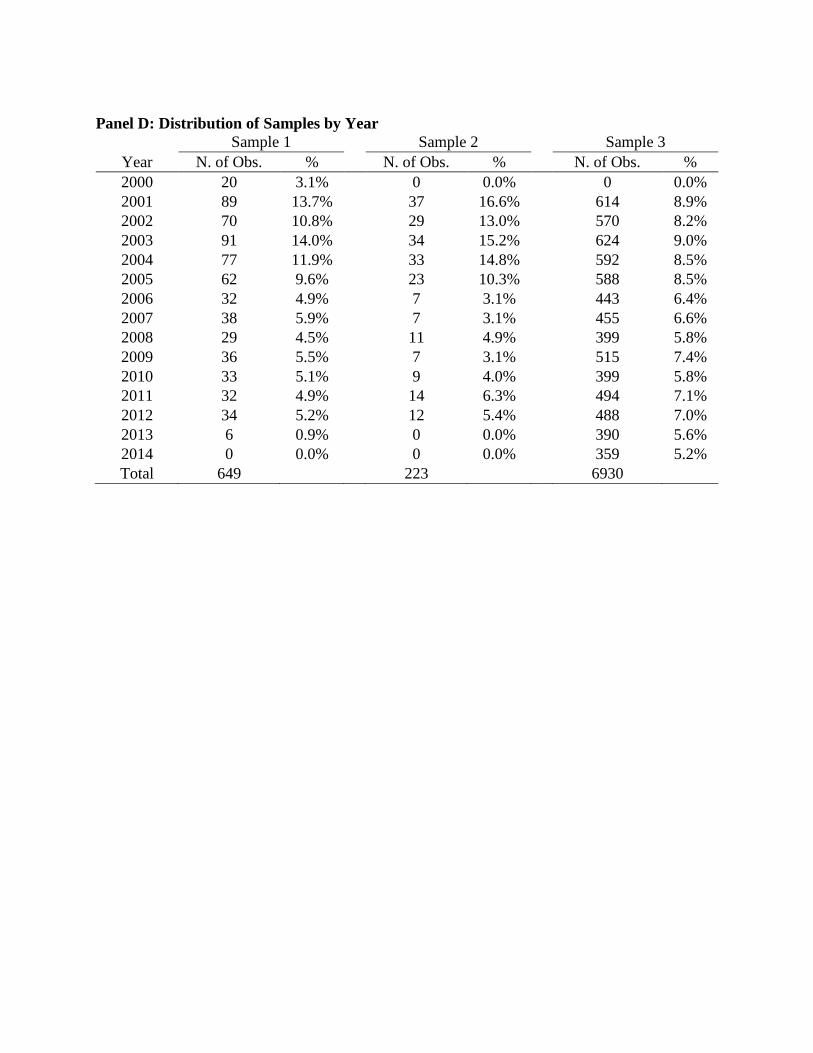
Panel D: Distribution of Samples by Year
Sample 1 Sample 2 Sample 3
Year N. of Obs. % N. of Obs. % N. of Obs. %
2000 20 3.1% 0 0.0% 0 0.0%
2001 89 13.7% 37 16.6% 614 8.9%
2002 70 10.8% 29 13.0% 570 8.2%
2003 91 14.0% 34 15.2% 624 9.0%
2004 77 11.9% 33 14.8% 592 8.5%
2005 62 9.6% 23 10.3% 588 8.5%
2006 32 4.9% 7 3.1% 443 6.4%
2007 38 5.9% 7 3.1% 455 6.6%
2008 29 4.5% 11 4.9% 399 5.8%
2009 36 5.5% 7 3.1% 515 7.4%
2010 33 5.1% 9 4.0% 399 5.8%
2011 32 4.9% 14 6.3% 494 7.1%
2012 34 5.2% 12 5.4% 488 7.0%
2013 6 0.9% 0 0.0% 390 5.6%
2014 0 0.0% 0 0.0% 359 5.2%
Total 649 223 6930

Table 5 Summary Statistics and Univariate Analysis of Sample Firms
This table reports the summary statistics of variables in the three samples and the univariate analysis between restating firms and
counterfactual firms. Panel A, Panel B and Panel C display the results of the Sample 1, Sample 2 and Sample 3 respectively. All variables
are as defined in the appendix A, and variables are winsorized at 1% level except for restating dummy and court dismissal rate. The
superscripts, ***, **, and * denote the 1%, 5%, and 10% levels of significance, respectively.
Panel A: Summary Statistics of Sample 1
Full Sample Non-restated Firms Restated Firms
N=649 N=466 N=183
(1) (2) (3)
Mean Std.
Dev. Median Mean
Std.
Dev. Median Mean
Std.
Dev. Median (3) - (2) T-stat
=1 if Restated 0.282 0.450 0.000
Court Dismissal Rate 0.315 0.199 0.308 0.340 0.194 0.333 0.275 0.194 0.278 -0.065 -3.86***
Log Total Assets 6.664 2.020 6.409 6.853 2.121 6.734 6.518 1.870 6.413 -0.335 -1.98**
Leverage 0.221 0.236 0.168 0.219 0.241 0.155 0.227 0.207 0.216 0.009 0.45
ROA -0.094 0.872 0.018 -0.093 0.782 0.031 -0.109 0.882 0.001 -0.016 -0.22
Sales Growth 0.386 1.112 0.138 0.305 0.932 0.129 0.235 0.570 0.100 -0.070 -1.17
Last Year Stock
Return 1.320 1.488 1.016 1.344 1.582 1.037 1.445 1.458 1.091 0.101 0.77
Beta 0.936 0.956 1.316 0.797 0.911 1.025 0.991 1.061 1.524 0.194 2.18**
Return Volatility 0.039 0.022 0.035 0.036 0.020 0.032 0.039 0.022 0.035 0.003 1.58
Turnover (in 1000s) 4.217 4.516 4.310 4.940 5.212 3.172 4.848 1.932 4.346 -0.092 -0.33
Skewness 0.288 1.430 0.297 0.267 1.589 0.279 0.340 1.152 0.342 0.073 0.65
Book-to-Market 0.345 0.762 0.175 0.388 0.857 0.234 0.385 0.622 0.226 -0.003 -0.06
=1 if auditor is Big 4 0.850 0.357 1.000 0.878 0.328 1.000 0.852 0.356 1.000 -0.025 -0.83

Panel B: Summary Statistics of Sample 2
Full Sample Non-restated Firms Restated Firms
N=223 N=99 N=124
(1) (2) (3)
Mean Std.
Dev. Median Mean
Std.
Dev. Median Mean
Std.
Dev. Median (3) - (2) T-stat
=1 if Restated 0.556 0.498 1.000
Court Dismissal Rate 0.335 0.183 0.333 0.347 0.199 0.344 0.285 0.170 0.283 -0.062 -2.46**
Log Total Assets 6.735 1.870 6.451 7.230 1.826 7.405 6.340 1.816 6.217 -0.890 -3.63***
Leverage 0.235 0.232 0.205 0.275 0.265 0.242 0.202 0.197 0.176 -0.073 -2.28**
ROA -0.088 0.812 0.018 -0.029 0.298 0.030 -0.135 1.056 0.002 -0.107 -1.07
Sales Growth 0.227 0.536 0.104 0.164 0.355 0.105 0.276 0.642 0.101 0.112 1.66*
Last Year Stock
Return 1.321 1.202 1.028 1.217 0.982 1.023 1.404 1.350 1.070 0.187 1.19
Beta 1.655 1.201 1.410 1.454 1.060 1.255 1.816 1.285 1.530 0.362 2.31**
Return Volatility 0.037 0.020 0.034 0.036 0.015 0.033 0.038 0.023 0.034 0.003 1.01
Turnover (in 1000s) 4.180 7.971 2.575 4.300 5.028 2.679 4.084 9.722 2.223 -0.216 -0.21
Skewness 0.351 1.254 0.324 0.320 1.264 0.318 0.376 1.249 0.342 0.056 0.33
Book-to-Market 0.550 0.609 0.414 0.511 0.510 0.346 0.582 0.678 0.476 0.071 0.89
=1 if auditor is Big 4 0.870 0.337 1.000 0.909 0.289 1.000 0.839 0.369 1.000 -0.070 -1.6
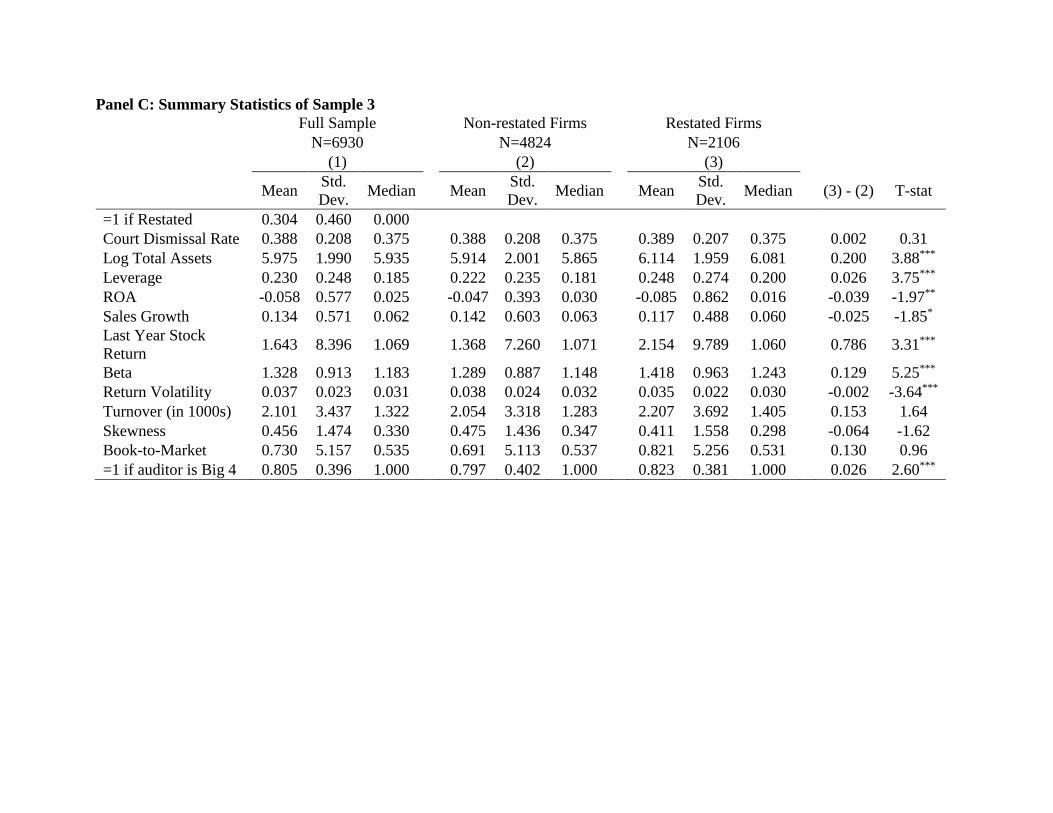
Panel C: Summary Statistics of Sample 3
Full Sample Non-restated Firms Restated Firms
N=6930 N=4824 N=2106
(1) (2) (3)
Mean Std.
Dev. Median Mean
Std.
Dev. Median Mean
Std.
Dev. Median (3) - (2) T-stat
=1 if Restated 0.304 0.460 0.000
Court Dismissal Rate 0.388 0.208 0.375 0.388 0.208 0.375 0.389 0.207 0.375 0.002 0.31
Log Total Assets 5.975 1.990 5.935 5.914 2.001 5.865 6.114 1.959 6.081 0.200 3.88***
Leverage 0.230 0.248 0.185 0.222 0.235 0.181 0.248 0.274 0.200 0.026 3.75***
ROA -0.058 0.577 0.025 -0.047 0.393 0.030 -0.085 0.862 0.016 -0.039 -1.97**
Sales Growth 0.134 0.571 0.062 0.142 0.603 0.063 0.117 0.488 0.060 -0.025 -1.85*
Last Year Stock
Return 1.643 8.396 1.069 1.368 7.260 1.071 2.154 9.789 1.060 0.786 3.31***
Beta 1.328 0.913 1.183 1.289 0.887 1.148 1.418 0.963 1.243 0.129 5.25***
Return Volatility 0.037 0.023 0.031 0.038 0.024 0.032 0.035 0.022 0.030 -0.002 -3.64***
Turnover (in 1000s) 2.101 3.437 1.322 2.054 3.318 1.283 2.207 3.692 1.405 0.153 1.64
Skewness 0.456 1.474 0.330 0.475 1.436 0.347 0.411 1.558 0.298 -0.064 -1.62
Book-to-Market 0.730 5.157 0.535 0.691 5.113 0.537 0.821 5.256 0.531 0.130 0.96
=1 if auditor is Big 4 0.805 0.396 1.000 0.797 0.402 1.000 0.823 0.381 1.000 0.026 2.60***

Table 6 Impact of Court Stringency on the Propensity of Restating
This table reports the impact of court dismissal rate on the likelihood of firm issuing restatement
conditioning on that they committed accounting mistakes. Column 1, 2 and 3 display the probit
regression results of Sample 1, Sample 2 and Sample 3 respectively. All variables are as defined
in the appendix A. Industry fixed effects, year fixed effects and state fixed effects are included in
the regressions. Numbers in parentheses represent t-values. The superscripts, ***, **, and * denote
the 1%, 5%, and 10% levels of significance, respectively.
=1 if restating
Sample 1 Sample 2 Sample 3
Variables (1) (2) (3)
Court Dismissal Rate -1.2755** -3.3446** -0.2126*
(-2.24) (-2.35) (-1.85)
Leverage -0.1391 -1.2543 0.402***
(-0.41) (-1.64) (5.24)
Log Total Assets -0.0622 -0.2825** 0.0683***
(-1.36) (-2.20) (5.38)
Last Year Stock Return -0.0116 0.0978 0.0015
(-0.24) (0.68) (1.00)
ROA 0.1162 -0.0717 -0.0318
(1.19) (-0.20) (-0.79)
Sales Growth -0.0469 0.8433** -0.13***
(-0.50) (2.14) (-4.04)
Return Volatility 9.1369* 14.1785 0.3669
(1.86) (1.02) (0.33)
Turnover (in 1000s) 0.0000 -0.1381*** -0.003
(0.88) (6.16) (0.30)
Skewness 0.0391 -0.0644 -0.012
(0.75) (-0.56) (-0.95)
=1 if auditor is Big 4 0.1302 0.1657 -0.0425
(0.60) (0.31) (-0.85)
Book-to-Market 0.1020 0.7664* 0.0039
(1.13) (1.83) (1.26)
Beta 0.0367 32.989** -2.7784
(0.33) (1.98) (-1.32)
Constant -12.4498 1.2448 -0.9231***
(0.00) (0.73) (-2.89)
No. of Obs 649 223 6,930
Time F.E. Yes Yes Yes
Industry F.E. Yes Yes Yes
State F.E. Yes Yes Yes

Table 7 Instrumental Variable Tests for the Tellabs Case
This table reports the results for the instrumental variable tests for the supreme court’s Tellabs case, which homogenizes federal courts’
pleading standards for Scienter in 10b-5 lawsuits. We exploit this homogenizing effect to design a two-stage, instrumental variable test.
Our instrumental variable is the relative stringency of a district court in the pre-Tellabs period. In the first stage, following Choi and
Pritchard (2011), we categorize district courts under the 1st, 4th, 6th, and 9th circuit as “pre-event low” stringency courts, and those
under the 3rd and 7th circuit as “pre-event high” stringency courts. In the second stage, we explore the impact of the (instrumented)
change in court dismissal on the change in restatement propensity for misreporting firms headquartered in the relevant district courts.
To balance internal validity and sample size, we choose our sample 1 misreporting firms as the testing sample in our two stage test. We
choose the 6-year window (3-year pre- and post-Tellabs) and the 10-year window (5-year pre- and post-Tellabs), taking into account
the fact that it takes time for managers of the misreporting firms to know about their accounting mistakes and to deliberate on their
restatement decision in response to altered pleading standard. As the Tellabs decision spans 2006 through 2007, these two years are
excluded from our event window. Thus, the pre-event period for the 6-year window is from January 2003 to December 2005; the post-
event period for the 6-year window is from January 2008 to December 2010; the pre-event period for the 10-year window is from
January 2001 to December 2005; and the post-event period for the 10-year window is from January 2008 to December 2012. The
superscripts, ***, **, and * denote the 1%, 5%, and 10% levels of significance, respectively.
6-Yr Window 10-Yr Window
Chg. Dismissal Rate Chg. Restating Rate Chg. Dismissal Rate Chg. Restating Rate
First-Stage Second-Stage First-Stage Second-Stage
Variable (1) (2) (3) (4)
Pre-Event Low -0.4400* -0.7789**
(-1.91) (-2.74)
Pre-Event High -0.0174 -0.0744
(-0.06) (-0.23)
IV Chg. Dismissal Rate -0.6079** -0.6322***
(-2.31) (-3.54)
Constant 0.2853 -0.097 0.4381 -0.0445
(1.60) (-1.31) (1.89) (-0.82)
No. of Obs 26 26 32 32
Adjusted R-squared 17% 15% 36% 27%
Table 8 Court Dismissal Rate and Shareholder Wealth Effect
This table exhibits the impact of court dismissal rate on the difference of legal costs between
restating firms and non-restating misstated firms. Two types of legal costs are tested: the 5-day
cumulative abnormal return (CAR) around the case filing date and the 5-day cumulative abnormal
return (CAR) around the accounting misconduct revealing date. Two litigation-oriented samples,
i.e. Sample 1 and 2, are tested in this analysis. The difference of legal costs between restating firms
and non-restating misstated firms are indicated by the variable, “=1 If Restating”; and the impact
of court dismissal rate on this difference is indicated by the interactive variable, “× Court Dismissal
Rate”. Numbers in parentheses represent t-values. The superscripts, ***, **, and * denote the 1%,
5%, and 10% levels of significance, respectively.
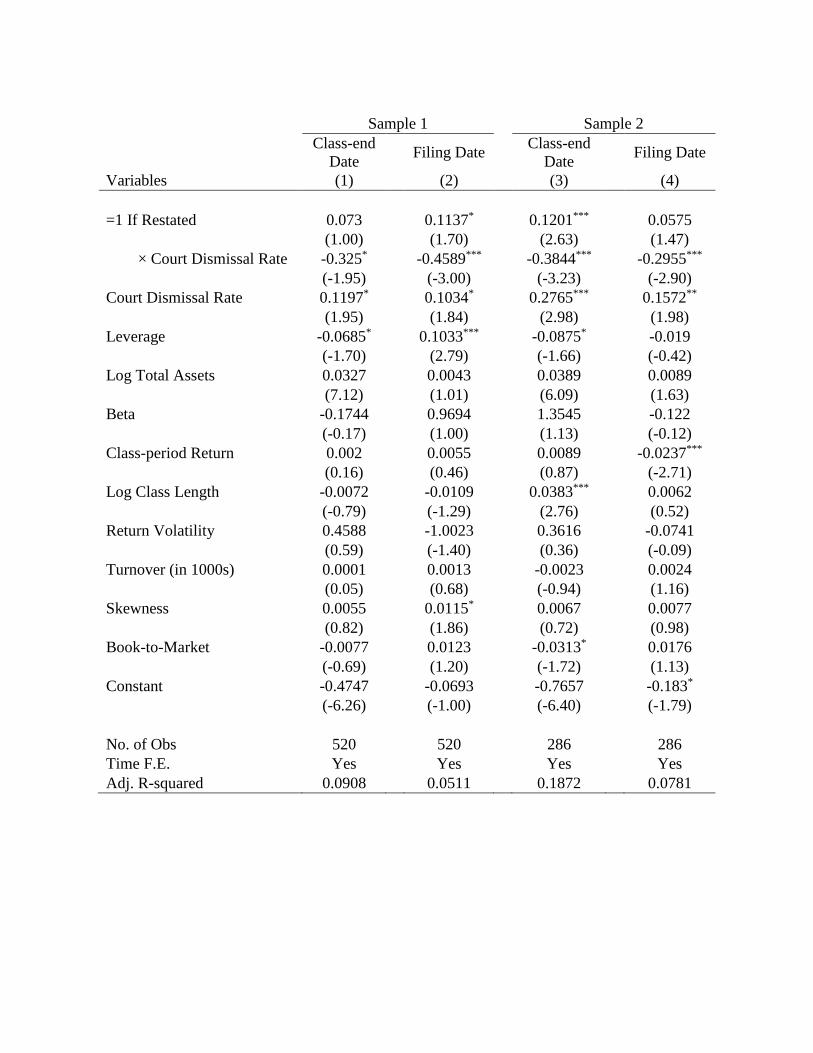
Sample 1 Sample 2
Class-end
Date Filing Date
Class-end
Date Filing Date
Variables (1) (2) (3) (4)
=1 If Restated 0.073 0.1137* 0.1201*** 0.0575
(1.00) (1.70) (2.63) (1.47)
× Court Dismissal Rate -0.325* -0.4589*** -0.3844*** -0.2955***
(-1.95) (-3.00) (-3.23) (-2.90)
Court Dismissal Rate 0.1197* 0.1034* 0.2765*** 0.1572**
(1.95) (1.84) (2.98) (1.98)
Leverage -0.0685* 0.1033*** -0.0875* -0.019
(-1.70) (2.79) (-1.66) (-0.42)
Log Total Assets 0.0327 0.0043 0.0389 0.0089
(7.12) (1.01) (6.09) (1.63)
Beta -0.1744 0.9694 1.3545 -0.122
(-0.17) (1.00) (1.13) (-0.12)
Class-period Return 0.002 0.0055 0.0089 -0.0237***
(0.16) (0.46) (0.87) (-2.71)
Log Class Length -0.0072 -0.0109 0.0383*** 0.0062
(-0.79) (-1.29) (2.76) (0.52)
Return Volatility 0.4588 -1.0023 0.3616 -0.0741
(0.59) (-1.40) (0.36) (-0.09)
Turnover (in 1000s) 0.0001 0.0013 -0.0023 0.0024
(0.05) (0.68) (-0.94) (1.16)
Skewness 0.0055 0.0115* 0.0067 0.0077
(0.82) (1.86) (0.72) (0.98)
Book-to-Market -0.0077 0.0123 -0.0313* 0.0176
(-0.69) (1.20) (-1.72) (1.13)
Constant -0.4747 -0.0693 -0.7657 -0.183*
(-6.26) (-1.00) (-6.40) (-1.79)
No. of Obs 520 520 286 286
Time F.E. Yes Yes Yes Yes
Adj. R-squared 0.0908 0.0511 0.1872 0.0781
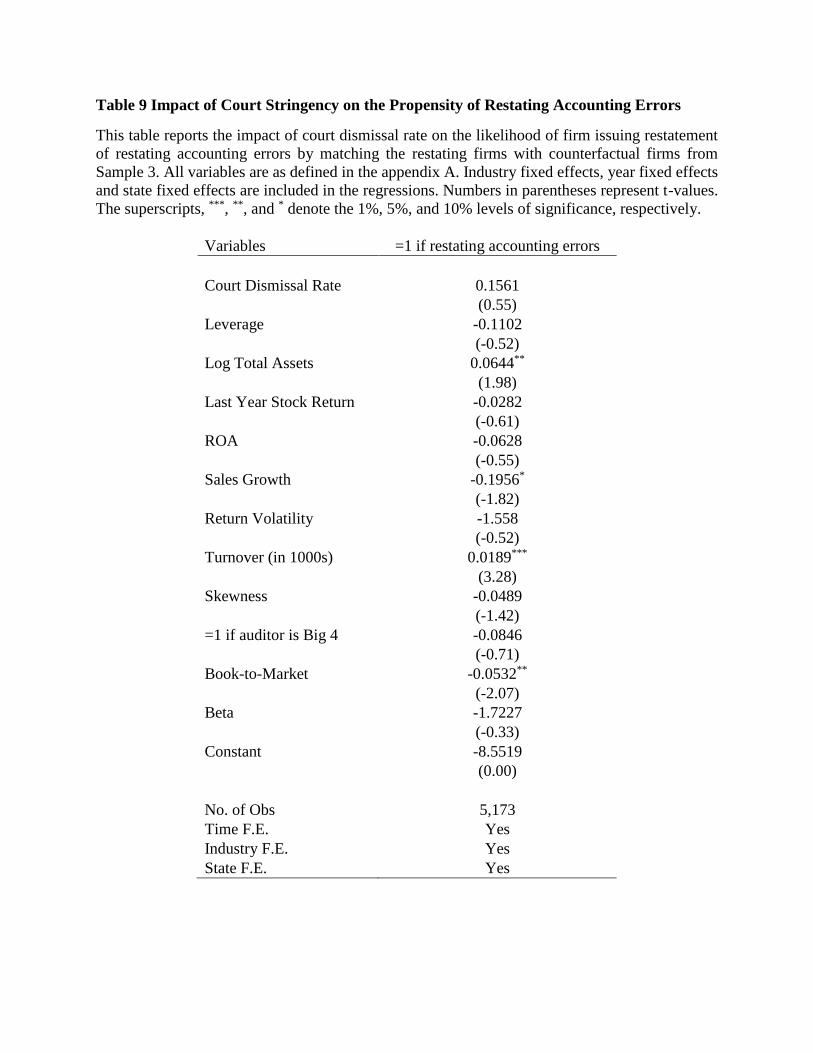
Table 9 Impact of Court Stringency on the Propensity of Restating Accounting Errors
This table reports the impact of court dismissal rate on the likelihood of firm issuing restatement
of restating accounting errors by matching the restating firms with counterfactual firms from
Sample 3. All variables are as defined in the appendix A. Industry fixed effects, year fixed effects
and state fixed effects are included in the regressions. Numbers in parentheses represent t-values.
The superscripts, ***, **, and * denote the 1%, 5%, and 10% levels of significance, respectively.
Variables =1 if restating accounting errors
Court Dismissal Rate 0.1561
(0.55)
Leverage -0.1102
(-0.52)
Log Total Assets 0.0644**
(1.98)
Last Year Stock Return -0.0282
(-0.61)
ROA -0.0628
(-0.55)
Sales Growth -0.1956*
(-1.82)
Return Volatility -1.558
(-0.52)
Turnover (in 1000s) 0.0189***
(3.28)
Skewness -0.0489
(-1.42)
=1 if auditor is Big 4 -0.0846
(-0.71)
Book-to-Market -0.0532**
(-2.07)
Beta -1.7227
(-0.33)
Constant -8.5519
(0.00)
No. of Obs 5,173
Time F.E. Yes
Industry F.E. Yes
State F.E. Yes

Table 10 Alternative Court Dismissal Rate Results
This table reports the impact of alternative court dismissal rate on the likelihood of firm issuing
restatement conditioning on that they committed accounting mistakes. Column 1, 2 and 3 display
the probit regression results of Sample 1, Sample 2 and Sample 3 respectively. All variables are
as defined in the appendix A. Industry fixed effects, year fixed effects and state fixed effects are
included in the regressions. Numbers in parentheses represent t-values. The superscripts, ***, **,
and * denote the 1%, 5%, and 10% levels of significance, respectively.
=1 if restating
Sample 1 Sample 2 Sample 3
Variables (1) (2) (3)
Alternative Court Dismissal Rate -1.0927* -4.3510** -0.1941*
(-1.8) (-2.26) (-1.75)
Leverage -0.2112 -2.4168** 0.4188***
(-0.5.00) (-2.00) (5.25)
Log Total Assets -0.105* -0.1503 0.063***
(-1.75) (-0.76) (4.74)
Last Year Stock Return -0.0292 -0.1107 0.0014
(-0.53) (-0.48) (1.27)
ROA -0.0323 -1.6635 -0.0368
(-0.25) (-1.47) (-0.78)
Sales Growth 0.0404 2.2799*** -0.1275***
(0.32) (2.87) (-3.85)
Return Volatility 2.1011 -7.5059 0.2696
(0.33) (-0.34) (0.23)
Turnover (in 1000s) 0.001* -0.1635*** -0.0042
(1.73) (4.19) (0.57)
Skewness 0.0513 -0.0569 -0.0143
(0.89) (-0.36) (-1.13)
=1 if auditor is Big 4 0.1104 -2.044* -0.0035
(0.38) (-1.67) (-0.07)
Book-to-Market 0.1763* 1.2788* 0.0033
(1.72) (1.69) (1.03)
Beta 0.1097 28.6105 -3.3772
(0.81) (1.19) (-1.58)
Constant -12.977 -5.56 -0.9332***
(0.00) (0.00) (-2.92)
No. of Obs 504 177 6,395
Time F.E. Yes Yes Yes
Industry F.E. Yes Yes Yes
State F.E. Yes Yes Yes


![RESTATEMENT FOR ARRANGER LIABILITY NDER …vjel.vermontlaw.edu/files/2013/06/Restatement-for-Arranger... · 2009] Restatement for Arranger Liability Under CERCLA 373 article will](https://cdn.vdocuments.net/doc/165x107/5b400fd77f8b9af46b8d05fd/restatement-for-arranger-liability-nder-vjel-2009-restatement-for-arranger.jpg)


