DOCUMENT RESUME
ED 372 262 CE 066 879
TITLE Labor Shortage Case Studies. Research and EvaluationReport Series 93-E.
INSTITUTION James Bell Associates, Inc., Arlington, VA.;Lewin-ICF, Fairfax, VA.
SPONS AGENCY Employment and Training Administration (DOL),Washington, DC. Office of Strategic Planning andPolicy Development.
PUB DATE 93CONTRACT 99-9-4701-75-077-01NOTE 303p.PUB TYPE Reports Research/Technical (143)
EDRS PRICE MFOI/PC13 Plus Postage.DESCRIPTORS Adult Education; Allied Health Occupations Education;
Career Education; Case Studies; Demand Occupations;Employment Projections; Engineering Education;Engineering Technicians; Engineering Technology;*Engineers; *Home Health Aides; Labor Market; *LaborNeeds; *Labor Supply; *Special Education Teachers;Supply and Demand; Teacher Burnout; TeacherEducation; *Tool and Die Makers; Trade and IndustrialEducation; Vocational Education
ABSTRACTA study assessed labor shortages in the United States
by conducting case studies of four occupations: special educationteachers, paraprofessional home care workers, electrical andelectronic engineers, and tool and aie makers. The research approachcombined analysis of existing data sources and interviews withindividuals knowledgeable about the labor markets for theoccupations. Theoretical background on the causes and consequences oflabor shortages was examined. Research indicated the presence ofoccupational shortages in two of the four occupations--specialeducation teachers and home care workers. In these two occupations,labor market conditions were more directly influenced by governmentintervention and other institutional barriers. Although stronglylinked to low wage levels, shortages of home care workers alsoresulted from an explosive growth in the demand for home health careservices and poor working conditions. Shortages of special educationteachers were linked to inflexibility in wages, "burnout," andgovernment actions that have increased the demand for these teachers.Labor shortages could result in loss of production of goods andservices. Employers were more likely to implement strategies torespond to shortages that involved relatively short-term commitmentof resources. Strategies to anticipate or recognize labor shortagesand approaches to reduce or eliminate shortages were suggested.(Appendixes include the instrument used with t.ol and die makers.)(YLB)
***********************************************************************
Reproductions supplied by EDRS are the best that can be madefrom the original document.
***********************************************************************
) i
I
/
1
1
1
111
...
a
ab
LI S. OtnalITIOINT OF EDUCATIONMice Educational Ilsonich and Intratonnaind
ED TIONAL RESOURCES INFORMATIONCENTER (ERIC)
Ass documnit Mt ImAn Ameakleed MImoved from thit omen of ottlandabononclonatuta d.
0 MOWN champs nave Ow tnda to improveropeoduclion quality
Palm ot wen co °inmate statitdsn ttPit dome.moot do not nacluanty otprosent oNcialOEM lemon or ooltcy
o0 0
1
A
RFST COPY AVAILABLE
II

Material contained in this publication is inthe public domain and may be reproduced,fully or partially, without permission of theFederal Government. Source credit is requestedbut not required. Permission is requiredonly to reproduce any copyrighted materialcontained herein.
ais material will be made available tosensory impaired individuals upon request.Voice phone: 202-2197664TDD* phone: 1-800-3262577
Telecommunications Device for the Deaf.
3
Labor Shortage Case Studies
Research and Evaluation Report Series 93-E
U.S. Department of LaborRobert B. Reich, Secretary
Employment and Training AdministrationDoug Ross, Assistant Secretary
For Employment and Training
Office of Strategic Planning and Policy DevelopmentRaymond J. Uhalde, Administrator
1993
4
RESEARCH AND EVALUATION REPORT SERIES
The Research and Evaluation Report Series presenta :nformation about and resultsof projects funded by the Office of Strategic Planning and Policy Development (OSPPD) ofthe U.S..Department of Labor's Employment and Training Administration. These projectsdeal with a wide range of training, employment, workplace literacy, labor market, andrelated issues. The series is published under the direction of OSPPD's Dissemination Unit.
This report in the series was prepared by James Bell Associates, of Arlington, Va.,and Lewin-ICF (now Lewin-VHI), of Fairfax, Va., under Department of Labor Contract No.99-9-4701-75-077-01. The authors are John W. Trutko, of James Bell Associates, andBurt S. Barnow, Any B. Chasanov, and Abhay Pande, of Lewin-ICF.
Tom NaSeil served as OSPPD's Project, Officer for the study. Others in theDepartment who provided assistance and guidance included John Heinberg, Bill Showier,Sarah Hoffman, Neal Rosenthal, Ronald Kutscher, Richard Hoff, Dan Ryan, and Gail Porter.
Malcolm Cohen provided data on employment and earnings, as well as substantivecomm;nts on the report. The authors also want to acknowiedge the many individuals andorganizations that provided both background information and their views on the labormarket conditions within the occupations that are the focus of the document.
Contractors conducting research and evaluation projects under federal sponsorshipare encouraged to express their own judgment freely. Therefore, this report does notnecessarily represent the official opinion of the Department of Labor.
5
TABLE OF CONTENTS
PAGE
EXECUTIVE SUMMARY ES-1
CHAPTER 1: INTRODUCTION 1-1
A. Background on Labor Shortages 1-2
The Social Demand Model 1-52. The Blank and Stigler Model 1-63. The Arrow-Capron Dynamic Shortage Model 1-84. Other Definitions of Shortages 1-95. Summary 1-11
B. Study Objectives, Scope, and Methodology 1-13
1. Study Objectives and Scope 1-132. Data Collection and Methodology 1-143. Structure of the Report 1-17
CHAPTER 2: CAUSES AND CONSEQUENCES OF LABOR SHORTAGES 2-1
A. Introduction 2-1
B. Reasons Why Occupational Labor Markets Arein Disequilibrium 2-3
1. Increase in the Demand for Labor 2-32. Decrease in the Supply of Labor 2-53. Restrictions on Prices 2-7
C. Adjustments to Occupational Shortages by Employers 2-8
1. Increase Recruiting Efforts 2-92. Increase Use of Overtime 2-103. Reduce Minimum Qualifications for the Job 2-114. Restructure Work to Use Current or New
Employees in Other Occupations 2-115. Substitute Machinery and Equipment for Labor 2-12
6
TABLE OF CONTENTS (CONTINUED)
PAGE
6. Train Workers for the Jobs 2-137. Improve Working Conditions 2-148. Offer Bonuses to New Employees 2-159. Improve Wages and Fringe Benefits 2-1610. Contract Out the Work 2-1811. Turn Down Work 2-18
D. Reasons Labor Markets May Adjust Slowly 2-18
1. Slow Reaction Time by Employers 2-192. Slow Response Time by Employers 2-203. Slow Reaction Time by Workers4. Slow Response Time by Workers
2-212-21
5. Restrictions on Occupational Entry 2-226. Continuous Increases in Labor Demand 2-23
E. Consequences of Labor Shortages 2-24
F. Implications for the Case Studies 2-25
CHAPTER 3: CASE STUDY OF SPECIAL EDUCATION TEACHERS 3-1
A. Description of the Occupation 3-1
B. Training and Recruitment of Special Education Teachers 3-3
C.
D.
1. Educational Qualifications and Entry Requirements2. Methods Employers Use to Recruit Teachers3. Methods Teachers Use to Seek and Obtain Employment4. Characteristics of Workers in the Occupation
Employment and Earnings in Special Education Teaching
1.
3.
Employment Trends2. Earnings Trends
Average Annual Unemployment Rate
Factors Contributing to a Labor Shortage
1.2. Demand-Side Factors3.
Presence of a Shortage
Supply-Side Factors
3-43-133-153-16
3-17
3-173-223-26
3-27
3-273-323-35
7
TABLE OF CONTENTS (CONTINUED)
PAGE
E. Adjustments to Shortages 3-41
1. By Employers 3-412. By Government 3-45
F. Conclusions and Recommendations 3-47
1. Conclusions 3-472. Recommendations 3-48
CHAPTER 4: CASE STUDY OF HOME CARE WORKERS 4-1
A. Description of the Occupation 4-1
1. The Home Care Industry 4-22. Payors 4-33. Employer3 4-8
B. Training and Recwitment of Home Care Workers 4-11
1. Training Requirements 4-112. Methods Employers Use to Recruit Home Care Workers . . . . 4-163. Characteristics of Workers in the Occupation . . . 4-17
C. Employment and Earnings of Home Care Workers 4-19
1. Employment Trends 4-192. Earnings Trends 4-22
D. Factors Contributing to a Shortage 4-24
1. Presence of a Shortage 4-242. Demand-Side Factors 4-263. Supply-Side Factors 4-29
TABLE OF CONTENTS (CONTINUED)
E. Adjustments to Shortages
1. By Employers2. By Advocacy Groups and Coalitions3. By Government
PAGE
4-40
4-404-444-45
F. Conclusions and Recommendations 4-46
1. Conclusions 4-462. Recommendations 4-47
CHAPTER 5: CASE STUDY OF ELECTRICAL AND ELECTRONIC ENGINEERS 5-1
A. Description of the Occupation 5-1
B. Training and Recruitment of Electrical and Electronic Engineers 5-6
1. Educational Qualifications and Entry Requirements 5-62. Methods Employers Use to Recruit Electrical and Electronic
Engineers 5-93. Methods Workers Use to Seek and Obtain Employment . . . . 5-114. Characteristics of Workers in the Occupation 5-12
C. Employment and Earnings in Electrical and Electronic Engineering . 5-18
1. Employment Trends 5-192. Occupational Unemployment Rates 5-233. Earnings Trends 5-25
D. Factors Contributing to a Labor Shortage 5-30
1. Presence of a Shortage 5-302. Demand-Side Factors 5-343. Supply-Side Factors 5-38
iv
TABLE OF CONTENTS (CONTINUED)
PAGE
E. Adjustments to Shortages by Employers 5-43
1. Increase Recruitment Efforts 5-442. Hire from Ranks of Non-Engineers or
Upgrade Technicians 5-453. Use Retirees to Fill Part-Time or Temporary
Engineering Positions 5-454. Substitute Equipment for Labor. 5-465. Train Workers to Enhance Engineering Skills 5-476. Improve Utilization of Existing Engineers 5-477. Contract Work Out 5-488. Increase Wages and Fringe Benefits 5-48
F. Conclusions and Recommendations of Public and PrivateSector Steps to Alleviate Shortages 5-48
1. Conclusions 5-482. Recommendations 5-49
CHAPTER 6: CASE STUDY OF TOOL AND DIE MAKERS 6-1
A. Description of the Occupation 6-1
B. Training and Recruitment of Tool and Die Makers 6-4
1. Educational Qualifications and Entry Requirements 6-42. Methods Employers Use to Recruit Tool and Die Makers . . . 6-103. Methods Tool and Die Makers Use to Saek and
Obtain Employment 6-13
C. Employment and Earnings in the Tool and Die Maker Occupation 6-15
1. Employment Trends 6-152. Earnings Trends 6-19
D. Factors Contributing to a Labor Shortage 6-23
1. Presence of a Shortage 6-232. Demand-Side Factors 6-253. Supply-Side Factors 6-30
1 0
TABLE OF CONTENTS (CONTINUED)
PAGE
E. Adjustments to Shortages by Employers 6-35
1. Intensify Recruitment Efforts 6-352. Use of Overtime 6-363. Reduce Minimum Qualifications for the Job 6-364. Restructure Work to Use Current or New Employees
in Other Occupations 6-375. Substitute Machinery and Equipment for Labor 6-386. Train Workers for Jobs 6-387. Improve Wages, Fringe Benefits, and Working Conditions 6-388. Contract Work Out and Turn Down Work 6-39
F. Conclusions and Recommendations of Public andPrivate Sector Steps/to Alleviate Shortages 6-40
1. Conclusions 6-402. Recommendations 6-41
CHAPTER 7: SUMMARY AND CONCLUSIONS 7-1
A. Existence and Causes of Shortages 7-1
B. Consequences and Responses to Shortages 7-8
C. Strategies for Anticipating and Dealing withOccupational Shortages 7-13
1. Anticipating and Recognizing Shortages 7-142. Potential Actions to Reduce Occupational Shortages 7-18
APPENDIX A: TECHNICAL NOTE ON DATA SOURCES
APPENDIX B: DISCUSSION GUIDE FOR FIRMS EMPLOYING TOOL AND DIEMAKERS
vi
LIST OF EXHIBITSPAGE
Exhibit 1.1: illustration of a Labor Shortage 1-4
Exhibit 1.2: Illustration of Blank-Stigler and Arrow-Capron Shortages 1-7
Exhibit 1.3: Illustration of Labor Demand by a Monopsonist 1-10
Exhibit 2.1: Illustration of a Labor Shortage Arising froman Increase in Labor Demand 2-4
Exhibit 2.2: Illustration of a Labor Shortage Arising from aDecrease in Labor Supply 2-6
Exhibit 2.3: Illustration of Labor Shortage Arising fromRestrictions on Wages 2-7
Exhibit 3.1: Employment of Special Education Teachersby Category, 1986-87 Academic Year 3-9
Exhibit 3.2: Number of Special Education Teachers and SecondarySchool Teachers, 1976-1987 3-20
ENhibit 3.3: Median Weekly Earnings for Special Education,Elementary School, and Secondary School Teachers;College Graduates and All Workers, 1983-1990 3-23
Exhibit 3.4: Change in Median Weekly Earnings for Special Education,Elementary School, and Secondary School Teachers;College Graduates and All Workers, 1983-90 3-25
Exhibit 3.5: Unemployment Rate for Special Education, ElementarySchool, and Secondary School Teachers; College Graduatesand All Workers, 1983-90 3-28
Exhibit 3.6: Number and Percentage of Special Education TeachersNeeded, by Category, Academic Year 1986-87 3-30
Exhibit 4.1: OBRA 1987 Requirements for Home Health Aides Employedby Medicare-Certified Home Health Agencies 4-13
Exhibit 4.2: Home Care Worker Characteristics from Local, State, andMulti-State Surveys 4-18
Exhibit 4.3: Factors Contributing to the Homemaker-HomeHealth Aide Shortage 4-30
vii
LIST OF EXHIBITS (CONTINUED)
PAGE
Exhibit 4.4: Reasons Former Workers Left Home Care in New York 4-31
Exhibit 4.5: Home Care Worker Attitudes Toward the Job 4-32
Exhibit 5.1: Employment of Engineers, by Engineering Branch, 1990 5-2
Exhibit 5.2: Overview of Other Leading Branches of Engineering 5-4
Exhibit 5.3: Major Sources of Employment Data on Engineers 5-20
Exhibit 5.4: Employment of Electrical Engineers and AllEngineers, 1983-1990 5-22
Exhibit 5.5: Unemployment Rate for Electrical Engineers, All Engineers,College Graduates, and All Workers Over Age 16: 1983-1990 5-24
Exhibit 5.6:
Exhibit 5.7:
Median Weekly Earnings, Electrical Engineers, All Engineer's,College Graduates, and All Workers Over Age 16: 1983-1990 ,
Change in Median Weekly Earnings, Electrical Engineers,All Engineers, College Graduates, and All Workers
5-26
Over Age 16: 1983-1990 5-28
Exhibit 6.1: Comments on General Entry Requirements and the Poolof Available Candidates for Positions from Firms EmployingTool and Die Makers 6-6
Exhibit 6.2: Illustrations of Apprenticeship Programs in Selected Firms 6-9
Exhibit 6.3: Employment of Tool and Die Makers and Machinists, 1983-1990 . . 6-16
Exhibit 6.4: Unemployment Rate for Tool and Die Makers, Machinists,Precision Production, Craft, and Repair Workers, and AllWorkers Over Age 16 6-18
Exhibit 6.5: Median Weekly Earnings for Tool and Die Makers, Machinists,Precision Production, Craft, and Repair Workers, and All WorkersOver Age 16 6-21
Exhibit 6.6: Percent Change in Median Weekly Earnings forTool and Die Makers 6-22
Exhibit 6.7: Illustrations of Comments from Interviews on the Extent ofShortages of Tool and Die Makers 6-26
EXECUTIVE SUMMARY
PURPOSE
This report presents the findings of a study sponsored by the Employment and
Training Administration (ETA) to enhance understanding of the factors that contribute to
occupation-specific labor shortages. It also identifies steps that can be taken to reduce
the probability of such shortages occurring, and if they do occur, to alleviate their effects.
The report is based on case studies of four occupations that currently or previously
experienced labor shortages: special education teachers, paraprofessional home care
workers, electrical and electronic engineers, and tool and die makers. Research for the
case studies was conducted in 1990.
BACKGROUND
The term "labor shortage" has no universally agreed-upon definition. It sometimes
refers to a shortfall in the total number of individuals in the labor force, and sometimes
denotes the possible mismatch between workers and jobs in the economy. Even when the
term is used to refer to a particular occupation, a number of definitions have been
proposed and used.' For this report, we use a definition of a labor shortage provided by
the Department of Labor in the Request for Proposals (RFP) for this study: "a market
disequilibrium between supply and demand in which the quantity of workers demanded
exceeds the supply available and willing to work at a particular wage and working
conditions at a particular place and point in time." This study combines analysis of
existing data sources with interviews of individuals knowledgeable about the labor markets
of the four occupations selected.
ES-1

RESULTS IN BRIEF
Our research indicates the presence of occupational shortages in two of the four
occupations studied special education teachers and home care workers. While there
was evidence of spot shortages in the two other occupations studied -- electrical and
electronic engineers and tool and die makers -- there did not appear to be general
shortages. A variety of underlying factors, particularly government intervention and
institutiohal barriers, were found to lead to labor shortages. For example, wages paid to
special education teachers and home care workers are substantially affected by the public
sector, while wages paid to electrical and electronic engineers and tool and die makers are
largely determined by private-sector employers. There are, however, other underlying
(non-monetary) conditions that affect the willingness of workers to enter and remain
within an occupation (e.g., job status, regularity of hours, certification requirements,
lengthy and costly training periods, and working conditions). There are also a variety of
demand-side conditions that can substantially affect the need for particular types of
workers (e.g., increased demand for particular types of goods, changes in technology and
emergence of new specialties within fields, decreases in government spending, and slow
economic growth).
At the most general level, the consequence of a labor shortage is that particular
goods and services are not provided. Such shortages, however, can also have impacts on
the quality of life and create bottlenecks in the production of other goods and services.
There are a variety cf steps that the private and public sectors can undertake to reduce or
eliminate occupational shortages. For example, in addition to increasing salaries and fringe
benefits, employers can intensify recruitment, provide training, and increase overtime. The
public sector can expand information available to help employers and workers better
ES-2
15
anticipate and recognize shortages. Where regulation may substantially affect either wage
levels or entry requirements for professions, government agencies should closely monitor
the effects of such regulation.
PRINCIPAL FINDINGS
1. gscupational Shortages Were Found in Special Education and Home CareOccupations: Evidence for Shortages Was Less Certain in Electrical andElectronic Engineering and Tool and Die Occupations
Overall, we found two occupations -- special education teachers and home care
workers -- where there are clear shortages of workers to fill available positions. In the
other two occupations -- electrical and electronic engineers and tool and die makers the
evidence for shortages is less certain. In the case of electrical and electronic engineers,
while there is evidence of spot shortages, especially in some emerging technological areas,
there now appears to be an overall surplus of available manpower because of recent
cutbacks in defense spending and the recession. The primavy concern is whether, and to
what extent, shortages may emerge in the future. For tool and die makers, while there
also appear to be spot shortages and considerable difficulty in hiring experienced workers,
there does not appear to be a general shortage. However, employers have major concerns
over their ability to replace an aging workforce with younger workers who possess the
requisite basic skills to learn the profession.
2. A Variety of Underlying Factors -- Particularly Government Intervention andInstitutional Barriers -- Lead to Lal?or Shortages
In the two occupations where there is clear evidence of labor shortages, labor
market conditions are more directly influenced by gove ..-ient intervention and other
institutional barriers than in the two occupations where shortages are less clearly in
evidence. In both shortage occupations, wages paid to workers are directly limited by
ES-3
1 6

what the public sector is willing and able to pay for the services produced by these
occupations. In contrast, in the two occupations where shortages are less of a problem,
wages paid to workers are determined by a large number of private-sector employers.
For home care workers, we found evidence of shortages in many areas of the
country -- especially in rural areas, on the West Coast, in the Great Lakes states, and in
states with low unemployment rates. Low wage levels, primarily because of government
regulation, appear to be the most significant factor contributing to shortages. Wages paid
to home care workers, particularly those serving patients covered by Medicaid and
Medicare, are generally not much different from those paid to workers in fast food
restaurants and are often less. The following conditions have led to a substantial increase
in the demand for home care workers:
a dramatic increase in the size of the eiderly population (especially thoseover 75 years of age), who are the major users of home health care services;
a decline in the availability of informal home care (e.g., greater female labor,participation rates have reduced the ability of women to care for the disabledand elderly);
adoption of cost containment policies under Medicaid and Medicare, whichhave resulted in a greater reliance on less expensive home care rather thanon institutional (i.e., inpatient hospital and nursing home) settings; and
expansion both in the eligibility for and the range of home care servicesprovided under federal and state health care programs.
At the same time, there are a host of underlying conditions that affect significantly the
ability and/or willingness of workers to become home care workers, including:
extremely unstable work environments, particularly in terms of irregularhours;
near poverty-level wages and few fringe benefits;
need for transportation, especially within rural settings; and
limited advancement potential and low job status.
ES-4
1 7

Hence, shortages of home care workers, while strongly linked to low wage levels, also
result from an explosive growth in the demand for home health care services and poor
working conditions that limit willingness and ability to work within the field and result in
high rates of turnover among home care workers.
In the case of special education teachers, we found that shortages -- which vary
considerably by geographic area within the country -- are partially linked to inflexibility in
wages, although wages are not quite as important a factor as they are for home care
workers. Probably more important are other factors that affect the demand for these
workers and the willingness of workers to enter and remain within the field. A particular
problem within the field of special education is "burnout," which results in high levels of
turnover. We found that the demand side is substantially influenced by government
actions, particularly federal and state laws that have increasingly mandated quality
standards for special education. This has resulted in maximum class-size standards for
special education classes, which increase the demand for special education teachers. In
addition, increasing emphasis on early intervention with the developmentally disabled has
increased the demand for special education teachers. On the supply side, while there is a
large pool of qualified special education teachers, there is a major challenge both to
attracting and to keeping fully certified special education teachers within the field. The
most often cited factor affecting the supply of special education teachers is high attrition.
In addition, there are a number of other factors that affect the ability or willingness of
workers either to enter or to stay within the special education field, including:
varying state certification requirements, which discourage geographicmobility;
lengthy training periods, with many states mandating a total of five or sixyears of college study;
ES-5
18
limited wage differentials for special education teachers compared to theirgeneral education peers, despite additional stresses and greater trainingrequirements; and
the loss of prestige that was formerly attached to teachers and teaching.
Institutional rigidity in adjusting wages for special education teachers plays an important
role in creating shortages. School boards, because of limits on local revenues and pay
equity concerns, are generally reluctant to adjust wages for special education teachers,
even where shortages exist.
In the case of electrical and electronic engineers, we concluded that there is not
currently a shortage. However, because of shifting demand and supply conditions, some
analysts feel that shortages are likely to emerge soon (by the mid-1990s) and last well into
the next decade. In comparison to the home care and special education occupations, there
appear to be relatively few government or institutional restrictions on wages paki' to
electrical and electronic engineers. Despite the ability of employers to increase wages to
adjust to labor market conditions, there are concerns about the following demand-side
conditions:
continued projected growth in demand for electronic and electrical products,which is expected to result in annual employment growth for electrical andelectronic engineers about double the average for all U.S. occupations;
an increase in replacement demand due to increasing retirements; and
rapid emergence of new fields and specialties, together with obsolescence ofexisting skills of engineers within the field.
At the same time that demand for electrical and electronic engineers is expected to
increase substantially, there are potential constraints on the number of new engineering
graduates at all levels. Because of the changing age distribution of the U.S. population
(i.e., a decrease in the size of the age cohort entering college/uniyersity in the 1 990s),
there is concern over the possibility of a substantial decrease in the number of new
ES-6

engineering graduates at all degree levels. Further, some analysts argue that there is
relatively little time to react to the projected shortfall of engineers because of the long lead
time in training.
Finally, in the case of tool and die makers, while the evidence does not appear to
support the claim by some employers that there is a severe shortage, there are some
supply-side conditions which could result in future labor shortages. Unlike the three other
occupations studied, there appear to be few demand-side factors that have or are likely to
result in shortages of tool and die makers. The primary source of concern within this field
is on the supply side: will there bo sufficient entry of new workers to the field to replace
the large number of retiring tool and die makers? Major concerns are the following:
an apparent bias on the part of younger workers (and their parents) against"blue collar" employment, which constrains the number of workers willing toenter the profession;
lack of knowledge about employment opportunities within the machinetrades, especially among high school administrators, counselors, andparents;
poor basic skills among the pool of youth likely to enter the machine trades;
the relatively long and costly training period for tool and die makers, whichaffects willingness to enter the field and makes it difficult for firms(especially smaller ones) to provide the types of training needed to becometool and die makers; and
lack of vocational training facilities, especially within high school settings.
The key question within this occupation is whether adequate information and incentives
can be provided by employers to attract younger workers to the tool and die occupation
and, once attracted, whether these workers will have the necessary basic skills and
determination to master the various technical skills that are required.
ES-7
20
3. Labor Shortages May Result in Loss of Production of Goods and Services
At the most general level, the consequence of a labor shortage is that particular
goods and services are not provided. The impact of not providing goods and services
varies by occupation. A shortage of special education teachers, for example, results in
some school districts being unable to fill teaching positions with fully qualified teachers.
This, in turn, may result in larger class size than mandated by law or in instruction of the
learning disabled by unqualified teachers. This could lead to greater costs to society in the
long run if the learning disabled are less productive and more dependent. In the case of
home care workers, shortages may result in denial or delay of necessary care, reduction in
the level of home care services received by clients, and/or diminished quality of care. The
result for the elderly and others in need of assistance is a decrease in the quality of life.
Shortages of electrical and electronic engineers or tool and die makers may lead to
bottlenecks in the production of goods and services, and ultimately to loss in productive
capability of U.S. industry. In turn, this may result in job losses for other U.S. workers,
loss of domestic production of goods and services, and increases in imports.
4. Employers Utilize a Variety of Strategies to Respond to Shortages DependingUpon the Conditions That Brought About the Shortage and the Extent toWhich the Employer Is Affected by the Shortage
In our case studies, we found a variety of empioyer responses to shortages. The
responses adopted depend upon the conditions that brought about the shortage and the
extent to which the employer is affected by the shortage. Employers are more likely to
implement strategies that involve relatively short-term commitments of resources (e.g.,
intensified recruitment, use of overtime, and signing bonuses) than longer-term
commitments of resources (e.g., increase in salaries and fringe benefits which affect all
employees, and intensified training).
ES-8
CONCLUSIONS AND RECOMMENDATIONS
We first discuss strategies that may help to anticipate shortages or recognize them.
We then suggest approaches that may be appropriate for reducing or eliminating shortages
once they are present.
1. Anticipating Labor Shortages
We conclude that we cannot project occupational supply and demand well enough
to anticipate shortages adequately. Cohen's work' points to how labor market projections
and data can be used to identify occupations that are prone to future shortages. For
example occupations that are good candidates for shortages are likely to experience wage
increases as the labor market tightens. Thus, we recommend that further research on
leading indicators" of shortages be supported. However, given economists' current lack
of ability to develop reasonably accurate projections, we recognize that projections should
be treated as general indicators rather than precise forecasts.
2. Recognizing Labor Shortages
It is not a simple matter to determine if an occupation is experiencing a shortage.
By the definition used in this study, an occupation has a shortage if the number of workers
employed falls short of the number of workers employers would like to hire at the
'prevailing wage. The key information required to assess whether an occupation is
experiencing a shortage is therefore vacancy data. Although the Bureau of Labor Statistics
(BLS) formerly collected vacancy data, the program was discontinued several years ago for
budgetary reasons. Because vacancies are the most important data for determining if
'See Malcolm S. Cohen (1990). Study on the Feasibility of Using Labor MarketInformation for Alien Certification Determination. Ann Arbor, Michigan: Institute of Labor andIndustrial Relations, University of Michigan.
ES-9
shortages are present, the lack of these data makes it very difficult to determine which
occupations have shortages. We therefore recommend that consideration be given to
reestablishing BLS data on occupational vacancies. If a complete occupational vacancy
series is not feasible, perhaps BLS and ETA could strongly urge employers to list vacancies
for occupations of special interest (e.g., engineering specialties) with the state employment
security agencies, and the results for these occupations could then be compiled at the
national level.
3. Strategies for Reducing or Eliminating Occuoational Shortages
To minimize problems with shortages resulting from government regulation, we
recommend the following actions:
Governments that directly or indirectly regulate wages in an occupationshould monitor the services provided to assure that shortages are not leadingto unmet needs (e.g., waiting lists for needed services).
In periods of rapidly rising wages, governments should make sure thatadjustments to wages are made frequently enough to keep themcompetitive.
If wage increases are considered undesirable because of the costimplications, government regulators should consider actions to assure thatservices are provided equitably. For example, programs can be reduced inscope to reduce demand for the occupations experiencing shortages.
Although the unregulated occupations covered by our case studies are not currently
experiencing shortages, the literature indicates that fields such as engineering have
experienced shortages in the past. Shortages are most likely to occur in occupations with
long training periods and long reaction and response lags by firms, students, and workers.
We have already noted that the lack of vacancy data makes it difficult to ascertain when a
shortage exists and recommended reinstituting some form of vacancy statistics.
In many instances shortages will be self correcting. As we explain in Chapter 2,
ES-10
23
employers have incentives to raise wages, improve recruiting, and take other actions to
eliminate the shortage. Thus, before taking strong action, government policymakers
should review projections of occupational supply and demand to determine if the shortage
is likely to be corrected by normal functioning of the labor market.
Federal and state governments can assist employers and workers to adjust to
shortages by publicizing occupations where shortages exist or are likely. BLS publications
such as the Occupational Outlook Handbook and Occupational Outlook Quarterly can be
valuable tools to employers, workers, and students. In addition, state employment
services, the National Occupational Information Coordinating Committee (NOICC), and
NOICC's state counterparts -- the State Occupational Information Coordinating
Committees (SOICCs) -- provide occupational data and projections for workers, firms, and
students. Although it is extremely difficult to evaluate the effectiveness of these
institutions, an evaluation might reveal ways in which these organizations could be
improved. The Department of Labor should consider evaLiting Ole effectiveness of its
occupational information programs with the goal of identifying any shortcomings and
improving the flow of information to workers, students, and employers.
Another potential bottleneck to alleviating shortages is a lack of appropriate training
and educational programs. In some instances employers can train workers themselves,
but in many occupations employers are dependent on schools and independent training
programs. If a shortage is likely to persist, and one of the problems is a lack of adequate
education and training programs, government can help eliminate the shortage by increasing
support for these programs. The Employment and Training Administration has recently
taken steps to upgrade the apprenticeship system in the United States, and this may help
avoid shortages in some skilled occupations. On a selective basis, the government can
ES-11

also support growth in institutions of higher education to increase the capacity to train
professionals in selecT.ed fields.
Finally, permitting additional immigration for individuals in shortage occupations can
provide additional workers relatively quickly. Immigration policies are often controversial,
however, because increasing the supply when there is not a shortage can reduce the
earnings of workers currently in the occupation. Even if there is a shortage, it may only be
temporary, and workers may find their wages reduced in the future. Liberalizing
immigration policies can be used to eliminate shortages, but care should be taken to
ascertain that a shortage exists and that it is expected to persist.
As we noted at the beginning of this study, labor markets are highly dynamic. To
some extent, labor shortages are inevitable as labor demand by employers and labor supply
of workers adjusts. In most instances, the natural working of the market will eliminate the
shortage, but in some cases government actions can help reduce the time required or
remove barriers to the process.
CHAPTER 1
INTRODUCTION
Major changes in the economy in recent years have generated more than the usual
interest in how well the U.S. labor market is functioning. Three general issues have been
widely discussed by economists and policy makers. First, because of recent declines in
the U.S. birth rate, some analysts are concerned that there will simply be too few workers
to maintain growth in the American economy.' Second, there has been a growing
concern that there is or will be a serious mismatch between the skills of the American
labor force and the needs of employers, resulting in a serious "skill gap" characterized by
unfilled vacancies in many high-skill occupations along with high unemployment for less-
skilled workers.' Finally, there has long been concern that shortages sometimes develop
and persist in specific occupations, leading to market inefficiencies in the U.S. economy.
It is this third topic, occupation-specific shortages, that is the subject of this report.
This report presents the findings of a study sponsored by the Employment and
Training Administration (ETA) of the U.S. Department of Labor (DOL) to enhance
understanding of the factors that contribute to occupation-specific labor shortages. It also
is intended to identify steps that can be taken by employers and the government to reduce
the possibility of such shortages occurring in the first place, and once they do occur, to
'See Sar A. Levitan and Frank Gallo (Sept. Oct. 1989). "The Shortsighted Focus onLabor Shortages." Challenge, pp. 28-32.
'See, for example, Commission on Workforce Quality and Labor Market Efficiency(1989). Investing in People: A Strategy to Address America's Workforce Crisis.Washington, D.C.: U.S. Department of Labor; and William B. Johnston and Arnold Packer(1987). Workforce 2000: Work and Workers in the Twenty-First Century. For a criticalreview of this literature, see Burt S. Barnow and D. Lee Bawden (1991). "Skill Gaps in theYear 2000: A Review of the Literature." Washington, D.C.: The Urban Institute.
1-1
alleviate their effects. The conclusions in this report are based on in-depth case studies of
four occupations that are currently or in the past have experienced labor shortages:
special education teachers, paraprofessional home care workers, electrical and electronic
engineers, and tool and die makers.
This chapter begins with a brief overview of the concept of labor shortages,
focusing on the alternative definitions that have been used to identify occupational-specific
labor shortages. A more detailed discussion of the causes and consequences of such labor
shortages is provided in Chapter 2. This chapter concludes with a discussion of the study
objectives, scope, and methodology.
A. Background on Labor Shortages
The term "labor shortage" has no universally agreed upon definition. It sometimes
refers to a shortfall in the total number of individuals in the labor force, and sometimes
denotes the possible mismatch between workers and jobs in the economy. Even when the
term is used to refer to a particular occupation, a number of definitions have been
proposed and used. In this report, we use a definition of a labor shortage provided by the
Department of Labor: "a market disequilibrium between supply and demand in which the
quantity of workers demanded exceeds the supply available and willing to work at a
particular wage and working conditions at a particular place and point in time."
'This definition, which was provided by DOL in the Request for Proposals (RFP) for thisstudy, is essentially identical to the definition used by Franke and Sobel in their study oflabor shortages: "A situatic existing over an extended period of time in which employerswere unable to hire at going wages or salaries sufficient numbers of qualified persons to fillpositions for which there were budgeted funds and for which personnel were required tomeet existing demands for services." See Walter Franke and Irving Sobel (1970). TheShortage of Skilled and Technical Workers. Lexington, Massachusetts: Heath-LexingtonBooks.
1-2
27

This definition considers a shortage as a diseouilibrium condition where the amount
of labor workers are willing to supply is less than employers are willing to buy at the
prevailing wage. A market is said to be in equilibrium when the amount of labor that
workers (i.e., sellers) are willing to provide at the market price is equal to the amount that
firms (i.e.. purchasers) wish to buy at the market price. When the quantities that workers
wish to provide and firms.wish to buy are not identical at the prevailing price, the market
is said to be in a disequilibrium situation.
If the quantity of labor offered exceeds the quantity that firms wish to purchase,
there is a surplus, and if the quantity of labor desired by firms exceeds the amount
workers offer at the prevailing price, there is a shortage. In general, the quantity that
workers are willing to provide is an increasing function of the wages (i.e., price) they can
obtain, and the relationship between the amount that workers are willing to provide at
various prices, with other factors held constant, is referred to as the supply curve.4
Exhibit 1.1 shows a typical upward-sloping supply curve for labor. As the wage rate is
increased, more workers are willing to enter a particular occupation and current workers
are generally willing to provide more labor.
In Exhibit 1.1 the amount of labor that employers will wish to hire at alternative
prices is indicated by the downward-sloping demand curve. Demand curves slope down
because as the price of a factor increases, the employer will generally substitute other
factors of production for the factor whose price has increased. In addition, higher factor
prices will generalily lead to higher product prices, which in turn will lead to a reduction in
4Technically, the supply curve for labor may be "backward bending," which means thatat very high wages workers actually reduce the amount of labor they are willing to supply.We do not consider this concept further in our discussion because it is unlikely to berelevant in a study of labor shortages.
1-3
25

Exhibit 1.1: Illustration of a Labor Shortage
the quantity of the product demanded c:nd the factors of production.
The point labeled E in Exhibit 1.1 is the market equilibrium point. If the wr ge is
equal to WE then the quantity of labor that workers are willing to supply at that wage (QE)
is exactly equal to the quantity of labor that employers will wish to hire. The market is
said to be in equilibrium because the quantity supplied is equal to the quantity demanded.
If for some reason the prevailing wage rate in the market is Wo rather than We then
the quantity of labor workers are willing to supply is equal to Qs the point on the supply
curve corresponding to Wo. Employers, however, would like to hire Qo at that wage rate.
The difference between the amount of labor that employers wish to hire and the amount
that workers are willing to provide (Qo - Qs) is the amount of the shortage. In the next
chapter we discuss how such shortages might arise.
1-4
29
Economists and other analysts have proposed several alternative definitions of
occupational shortages.' Although these definitions are not used in this report, it is
important to note that others use the term differently. It is particularly important to keep
the definition in mind when interpreting other studies of shortages and the interviews we
conducted for this study.
1. The Social Demand Model
Some armiysts consider a shortage to be present if the number of workers in an
occupation is less than what is considered the socially 'desired number. Under this
definition, a shortage of engineers exists if the analyst making the determination concludes
that society would be better off if there were more engineers. This type of definition does
not imply that the labor market is in disequilibrium; instead it describes a situation where
the person who claims there is a shortage does not like the market's results. Arrow and
Capron explain the problem with this definition as follows:
In particular, careful reading of such statements indicates that the speakers have ineffect been saying: There are not as many engineers and scientists as this nationshould have in order to do all the things that need dbing such as maintaining ourrapid rate of technological progress, raising our standard of living, keeping usmilitarily strong, etc. In other words, they are saying that (in the economic sense)demand for technically skilled manpower ought to be greater than it is it is reallya shortage of demand for scientists and engineers that concerns them.'
The Secretary of Health and Human Services' Commission on Nursing states in its
final report that: "In the most general terms, a registered nurse [RN) shortage exists when
'There are different definitions of labor surpluses as well. For example, the Bureau ofLabor Statistics concludes that the nation has a surplus of college graduates while JohnBishop concludes that there is a shortage. For a review of this area see Barnow andBawden (1991).
'See Kenneth J. Arrow and William M. Capron (May 1959). "Dynamic Shortages andPrice Rises: The Engineer-Scientist Case." Quarterly Journal of Economics.
1-5
3 0
the supply of RNs is insufficient to meet the 'requirements' for RNs. RN requirements can
be defined based on either economic demand or clinical need."' The Commission rejected
the use of clinical need for defining a shortage because they concluded that there is no
objective method of quantifying the degree of the shortage and relating it to specific
factors.
The fact that we do not use this type of definition for a shortage does not mean we
do not believe that it is unimportant for the nation to consider whether it is satisfied with
market-produced results. Quite the contrary. We believe it is important for society to
consider whether or not the market solutions are desirable, and, if not, to take appropriate
actions.' The concern in this study is with the operation of labor markets, the reasons
why they sometimes fail to achieve equilibrium, and actions that can be taken to improve
their efficiency.
2. The Blank-Stigler Model
One of the first major studies of occupational shortages was conducted by David S.
Blank arid George J. Stigler.' Blank and Stigler define a shortage as follows: "A shortage
exists when the number of workers available (the supply) increases less rapidly than the
number demanded at the salaries paid in the recent past." Blank and Stigler then argue
'See U.S. Department of Health and Human Services, Secretary's Commission onNursing (Dec. 1988). Final Report. Vol. 1, p. 3.
"See Barnow and Bawden (1991) for a review of recent studies that have concludedthat the United States should increase education and training.
'See David J. Blank and George J. Stigler (1957). The Demand and Suooly ofScientific Personnel. New York: National Bureau of Economic Research.
1-6
31
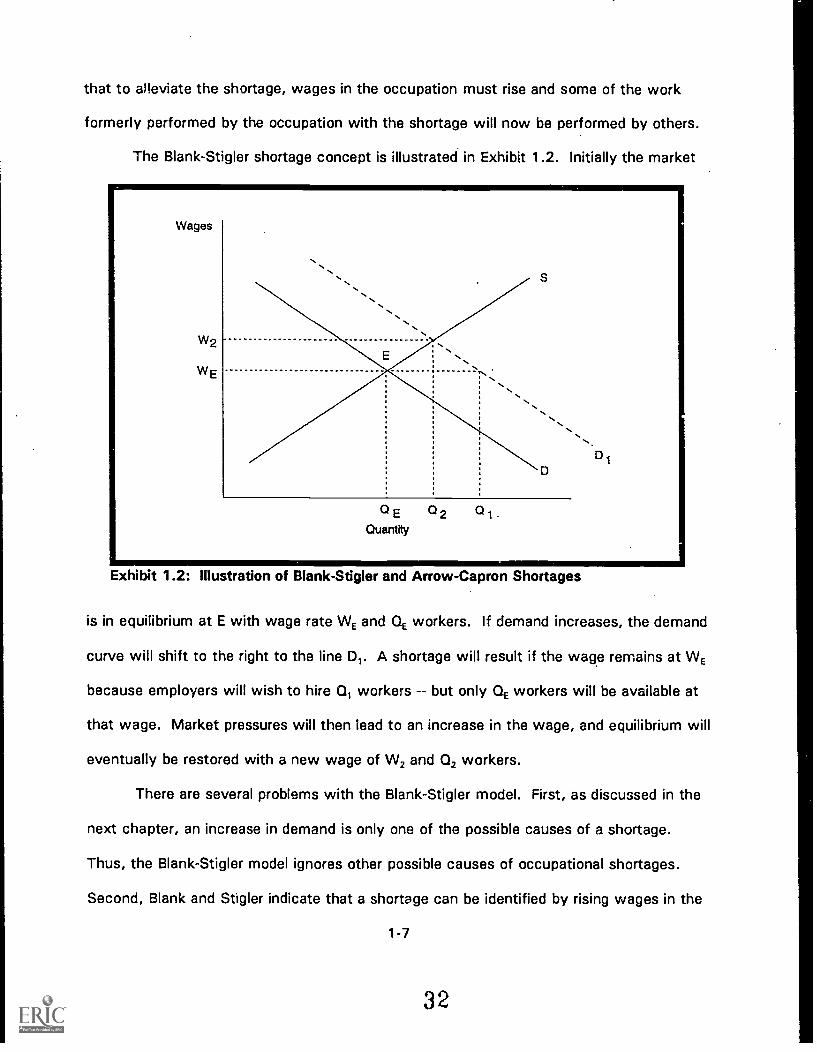
that to alleviate the shortage, wages in the occupation must rise and some of the work
formerly performed by the occupation with the shortage will now be performed by others.
The Blank-Stigler shortage concept is illustrated in Exhibit 1.2. Initially the market
Wages
W2
WE
Q E Q 2 Q -
Quanttty
Exhibit 1.2: Illustration of Blank-Stigler and Arrow-Capron Shortages
is in equilibrium at E with wage rate WE and QE workers. If demand increases, the demand
curve will shift to the right to the line DI. A shortage will result if the wage remains at WE
because employers will wish to hire C11 workers but only QE workers will be available at
that wage. Market pressures will then lead to an increase in the wage, and equilibrium will
eventually be restored with a new wage of W2 and Q2 workers.
There are several problems with the Blank-Stigler model. First, as discussed in the
next chapter, an increase in demand is only one of the possible causes of a shortage.
Thus, the Blank-Stigler model ignores other possible causes of occupational shortages.
Second, Blank and Stigler indicate that a shortage can be identified by rising wages in the
1-7
affected occupation. Wages may not rise, however, because of market imperfections such
as controls on wages or imperfect information.
3. The Arrow-Capron Dynamic Shortage Model
Kenneth J. Arrow and William W. Capron developed an alternative model of
occupational shortages.' Their definition, which they refer to as a dynamic shortage, is
based on the premise that "a steady upward thift in the demand curve will produce a
shortage, that is, a situation in which there are unfilled vacancies in positions where
salaries are the same as those currently being paid in others of the same type and quality."
The Arrow-Capron model is also illustrated in Exhibit 1.2. Like the Blank-Stigler
model, the Arrow-Capron model is characterized by increased demand. However, Arrow
and Capron note that markets are characterized by a "reaction speed," and that
institutional arrangements (such as long-term contracts) and the time it takes for
information to spread will affect the time required for employers to adjust wages. Thus,
Arrow and Capron conclude that shortages will be characterized by vacancies. In Exhibit
1.2, the number of vacancies initially resulting from the increase in demand will be equal
to Q1 - 0E If demand continues to grow, then the market may not achieve equilibrium.
The Arrow-Capron dynamic shortage model is consistent with the general model we
use, but it may be considered a specific case. In the next chapter we show how
shortages can also result from decreases in labor supply and constraints on prices.
"See Arrow and Capron (1959).
1-8
4. Other Definitions of Shortages
In additiori to the definitions presented above, several other definitions for
shortages have been proposed. Paul E. Harrington and Andrew M. Sum review several
other possible definitions of occupational labor shortages, and two of them are briefly
discussed below."
a. The Rate of Return Model
The rate of return model is baged on the application of internal rate of return
analysis to alternative occupations. The costs of investing in a particular occupation are
defined as the sum of the direct costs for higher education, training, and supplies, plus the
indirect costs of foregone wages that are incurrei during periods of training. The benefits
are the earnings typically derived from the occupation each year. The internal rate of
return is then calculated by finding the interest rate that equates the present value of the
costs and benefits." Occupations with shortages are thus defined as those occupations
with higher than average rates of return.
Harrington and Sum note that the rate of return approach is "beset with numerous
methodological and measurement difficulties." One important problem is that we cannot
observe the future earnings streams from various occupations. Relying on cross-sectional
or historical data may provide a misieading picture of what the earnings will eventually be.
In addition, the returns to various occupations may differ for reasons having little to do
"See Paul E. Harrington and Andrew M. Sum (1984). Skills Shortages andEmployment and Training Policy in the U.S.: Past Relationships and Desirable FutureDirections. Boston: Center for Labor Market Studies, Northeastern University.
"Formally, the internal rate of return is found by solving the equation0 = (Wo - Co) + (W, - C1)/(1 + i) + (W2 C2)/(1+i)2 + + Ci,)/(1 +i)", where Wtrepresents earnings in year t, C, represents costs incurred in year t, and i is the internalrate of return that is solved for.
1-9
34
with a shortage. For example, some occupations may pay higher wages because they
have high health or safety risks -- what economists refer to as compensating differentials.
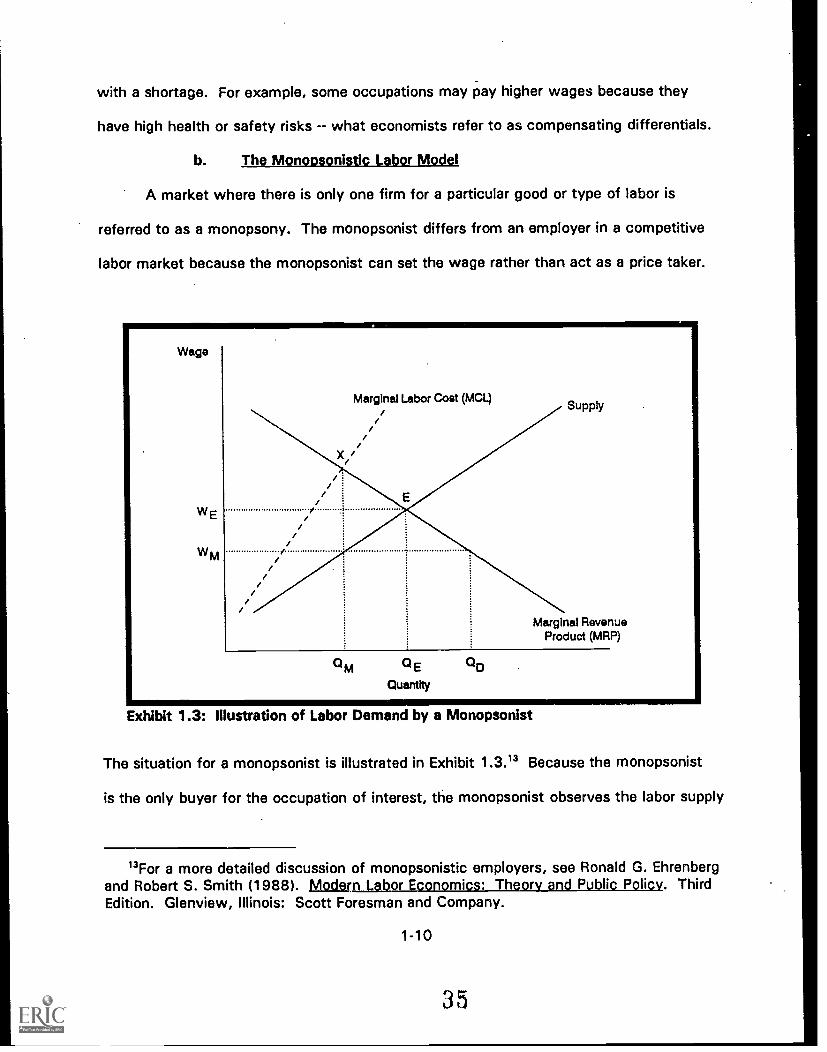
b. The Monoosonistic Labor Model
A market where there is only one firm for a particular good or type of labor is
referred to as a monopsony. The monopsonist differs from an employer in a competitive
labor market because the monopsonist can set the wage rather than act as a price taker.
Wage
WM
Marginal Labor Cost (MCL)
Marginal RevenueProduct (MRP)
Q E
Quanttty
a D
Exhibit 1.3: Illustration of Labor Demand by a Monopsonist
The situation for a monopsonist is illustrated in Exhibit 1.3.13 Because the monopsonist
is the only buyer for the occupation of interest, the monopsonist observes the labor supply
"For a more detailed discussion of monopsonistic employers, see Ronald G. Ehrenbergand Robert S. Smith (1988). Modern Labor Economics: Theory and Public Policy. ThirdEdition. Glenview, Illinois: Scott Foresman and Company.
1-10
curve for the occupation; this is in contrast to an employer in a competitive market who
can hire all the labor desired at the market wage. Because the monopsonistic employer
must pay all workers the same wage, the monopsonist faces a steep upward sloping
marginal labor cost curve -- if an additional worker is hired, wages must be increased for
all currently employed workers as well as the marginal worker. Exhibit 1.3 also illustrates
the marginal revenue product curve for the firm. To maximize profits, the monopsonist
employer will hire labor until the marginal labor cost is equal to the marginal labor product,
corresponding to the point X in the exhibit. The wage paid by the monopsonist will then
be Wm and QM workers will be hired. Note that the number of workers hired is less than in
a competitive market (OE) and the wage is lower than the competitive wage (WE).
The monopsonist might consider the resulting situation to be a shortage because
the monopsonist would like to hire more workers at the monopsony wage. However,
because the monopsonist faces an upward sloping labor supply curve, the wage must be
increased to attract additional labor into the occupation. Ronald G. Ehrenberg and Robert
S. Smith conclude that the labor shortage faced by a monopsonist is "more apparent than
real." In addition, Ehrenberg and Smith point out that monopsony situations are likely to
be very rare.
5. Summary
After careful consideration, we have elected to retain the definition of a labor
shortage provided by DOL. Some of the labor shortage concepts that have been proposed,
such as looking at the total amount of labor supplied and the potential economy-wide
mismatch between employer needs and worker qualifications, are important, but they are
not the issues that the Department of Labor wanted addressed in this particular study.
3
Like the Secretary of Health and Human Services' Commission on Nursing, we have
elected not to use the social demand concept because there is no objective way of
determining the optimal number of workers in various professions.
Definitions proposed in the 1950s by Blank and Stigler and by Arrow and Capron
are closer to the concept of a labor shortage that is used here. The principal advantage of
these definitions is that they provide relatively straightforward tests for the existence of a
shortage -- rising relative wages in the case of the Blank-Stigler definition and increasing
vacancies in the case of the Arrow-Capron definition. However, we believe that these
definitions are too narrow to capture all the types of shortages of interest. Both the Blank-
Stigler and Arrow-Capron definitions do not include labor market situations classified as
shortages by the other definition, and both omit situations where excess demand results
from market imperfections. The mo.'e general definition employed here covers such cases.
The use of a broad definition does have some disadvantages. As Walter Franke and
Irving Sobel note in using a similar definition, "The definition is neither altogether concrete
and precise nor is it susceptible to precise measuiements."" However, we also concur
with Franke and Sobel's conclusion that: "Viewed in the context of a study whose
purpose is to examine the degree to which labor market institutions respond to and
facilitate adjustment to varying degrees of labor market tightness, the definition is,
however, meaningful and operational."
"See Franke and Sobel (1970), p. 7.
1-12

B. Study Objectives, Scope, and Methodology
1 . Study Objectives and Scope
The primary objective of this study is to assess labor shortages in the United States
by conducting case studies of four occupations: special education teachers,
paraprofessional home care workers, electrical and electronic engineers, and tool and die
makers. The study is intended to enhance our understanding of the factors that cause
labor shortages and to identify employer and government policies that have alleviated or
exacerbated them.
Our approach to the study combines analysis of existing data sources and
interviews with individuals knowledgeable about the labor markets sf or the occupations
selected. We address eight specific questions in the study:
Are there common denominators across the studied occupations that canhelp us understand why they tend to recur or persist and which help usrecognize and anticipate shortages in other occupations?
Conversely, are there recognizably distinct kinds of labor shortages, withdifferent characteristics and calling for different policy initiatives?
Are there ways we can recognize when a supply imbalance is beingcorrected in one area, but where the corrective measure or measures aresimultaneously causing an imbalance in another area?
What were the responses to address the shortages used by employers, laborunions, training, etc.? What were the results?
What public and private policies in the past have been implemented thathave helped avoid or lessen the severity of these shortages?
Have any policies contributed to increasing (or causing) labor shortages?
How can all interested parties (such as employers, unions, educationalinstitutions, government agencies, etc.) cooperatively and responsiblyconfront and resolve shortage issues?
How can we best ensure that any policy implemented is working asintended? How can we track effects of policies?
1 -1 3
38

This study does not provide definitive answers to all the questions raised by the
Department of Labor. However, by limiting our analysis to four occupations, we have
deliberately set out to study a limited number of occupations in depth rather than seek to
understand how shortages work in all possible cases. !n addition, we have deliberately
selected occupations that are quite diverse in terms of educational requirements, type of
labor market arrangements, and causes of shortages. This breadth provides a wide range
of experiences for assessing the causes and consequences of labor shortages and the
efficacy of potential policies by government and employers.
2. Data Cogection and Methodology
We have relied on both primary and secondary data in carrying out the study. The
two types of data are useful for meeting different objectives of the study, and they are
likely to be complementary. Both types of data are useful for documenting the presence or
absence of a shortage, but they have different strengths and weaknesses.
Published secondary data are useful for tracking historical trends and testing
specifk such as the Blank-Stigler and Arrow-Capron definitions. On the other
hand, p. - cannot address issues not covered by the data sources (such as job
vacancies), and they are not very useful in developing policy options. Data collected
through interviews with knowledgeable people are helpful in gathering some information
on topics not covered by the published data, and interviews with employers, trade
associations, ard union officials can be very useful in identifying and assessing potential
policy initiatives. The secondary data analyzed for the study include data from national
data bases that can be used to track occupations for several years and special data bases
for particular occupations. For three of the occupations covered in this study (electrical
1 -1 4
39
and electronic engineers, special education teachers, and tool and die workers), we have
made use of a unique data base developed by Malcolm S. Cohen as part of a study on the
feasibility of using labor market information to identify occupations with shortages for the
Department of Labor's alien certification program.' In the next chapter we discuss how
these data series can be used to provide indications of shortages. In the subsequent
chapters on specific occupations, the series and the inferences that may be drawn from
them are described in more detail. The seven series compiled by Cohen and the sources
are:
Occupational unemployment rate. This provides the unemployment rate formembers of the labor force based on their current or most recentoccupation. The data are based on averages of monthly Current PopulationSurvey (CPS) data published by the Bureau of Labor Statistics (BLS).
Occupational employment. This series provides the levels and changes inemployment in the occupation's of interest. The data are based on averagesof monthly CPS data.
Occupational wage rates. This series provides median wages in theoccupations over time. The data are derived from the CPS.
BLS projected employment growth. BLS develops projections ofoccupational employment periodically.
Replacement demand. This series was developed by Cohen based onseveral CPS surveys to measure the proportion of workers in an occupationwho left the occupation between 1986 and 1987."
'Cohen drew his data from published and unpublished sources. He developedprocedures to define occupations consistently in his report and to impute missing values.In the text we describe the basic series developed by Cohen rather than the specificindicators of shortages he develops. See Malcolm S. Cohen (1990). Study on theFeasibility of Using Labor Market Information for Alien Certification Determination. AnnArbor, Michigan: Institute of Labor and Industrial Relations, University Of Michigan.
"Cohen cautons that some of the estimates obtained for specific occupations are verylarge and may be spurious.
1-15
4 0
Labor certification by occupational group. This series documents the numberof aliens receiving certification to work in the United States for eachoccupation.
Annual additions to occupational labor supply. This series providesestimates of the net addition to potential supply to occupations fromcompletions of appropriate education and training programs."
Occupation-specific data bases are also used for the analysis when available. For
example, the U.S. Department of Education sponsors special surveys on teachers, and we
present the relevant data on special education teachers.
In addition to the quantitative data on shortages from ongoing and special surveys,
we conducted a number of interviews with individuals knowledgeable about each of the
occupations of interest. The interviews were not based on random samples, but instead
were conducted with several individuals willing to discuss the labor market situation for
the occupations of interest. For all four occupations we interviewed representatives of
employers and trade associations, Where relevant, we also interviewed government
officials, researchers, educators, and representatives of unions.
We generally gathered candidates for interviews by contacting trade associations,
researchers, and government officials. In addition to interviewing appropriate people in
these organizations, we asked for suggestions of specific employers who would be good
interview candidates. We sought to include candidates from various regions to see if
shortage problems for the occupation are national or regional in scope. We also sought to
obtain some diversity in firm/organization size and other dimensions of employers.
Although the resulting sample is not likely to provide a representative sample of all
employers, we believa it provides useful qualitative data for the occupations of interest.
"Cohen points out that this measure is not always accurate because some occupationshave alternative entry paths. The utility of the data for the occupations covered in thisstudy is discussed in the relevant chapters.
1 -1 6
41

The interviews were conducted by telephone, usually requiring 30 to 60 minutes.
Some interviews ran longer because the interviewees were very interested in the study.
The interviews were semi-structured. An interview guide was used to elicit information
we considered relevant, but respondents were encouraged to speak their minds, and the
disOussions varied significantly in terms of topics covered and depth, depending upon the
knowledge and interests of the respondents. The information obtained in the interviews is
incorporated in the chapters on the relevant occupations.
Appendix A provides additional detail on the data sources used for this study and
their limitations. Appendix B provides a sample of the discussion guide used during
interviews with employers of tool and die makers.
3. Structure of the Report
The report has seven chapters. Chapter 2 provides theoretical background on the
causes and consequences of labor shortages. The chapter discusses why shortages might
develop in particular occupations, the adjustments that are likely to be made by employers
and workers, the symptoms of shortages that are likely to be observed, the reasons why
shortages might persist for extended periods, and the likely consequences of shortages.
The next four chapters provide the findings from our four case studies. For each
occupation we describe the occupation, present the entry requirements and training paths
for the occupation, and analyze employment and earnings trends for the occupation. We
then analyze the evidence on the extent to which there appears to be a shortage for the
occupation, the factors that contributed to the shortage, the consequences of the
shortage, steps that have been taken to alleviate the shortage, and recommended policies
that can be taken to further deal with the shortage. The final chapter synthesizes the
1-17
4 2

results of the four case studies and, based on our research, provides conclusions and
recommendations relating to the major objectives of this study.
1 -1 8
CHAPTER 2
CAUSES AND CONSEQUENCES OF LABOR SHORTAGES
A. Introduction
It is important to address the causes and consequences of labor shortages before
proceeding to the case studies for several reasons. First, because we have adopted a
fairly broad definition of a shortage, we will have no single indicator that a shortage exists.
Thus, in our case studies we look for evidence of the causes, adjustments, and
consequences of shortages. The four occupations covered by the case studies were
selected to provide significant variation in industry, skill levels, training, market regulation,
and other factors. Thus, we can expect shortages to arise and manifest themselves
differently in the various occupations.
By reviewing the economic theory of the causes and consequences of shortages
prior to conducting the case studies, we will be aware of the appropriate market signals to
look for in assessing whether or not a shortage exists. This is especially important
because we anticipated (and found) that under certain conditions various interest groups
have incentives to argue that a shortage is present or absent. For example, employers and
trade associations sometimes have an incentive to claim that there is a shortage to
increase immigration quotas for particular occupations, giving them access to a broader
pool of applicants. At other times, employers might find it in their interest to claim there
are no shortages in order to gain better leverage in contract negotiations with their
workforce.
Another important reason for analyzing the causes and consequences of shortages
is to help identify and assess potential public and private policies for dealing with
2-1
4 4
shortages. Being able to identify causes will help interested parties focus on the relevant
developments in labor and product markets. Understanding the consequences will help us
to assess what interventions, if any, are appropriate by government, employers, and
workers.
Before turning to the causes and consequences of labor shortages, it is useful to
note some of the dimensions of shortages:
Geographic scope of the shortage. Depending on the occupation and thenature of the market, labor markets can be national or' regional in scope.Similarly, a particular occupation may have a nationwide shortage, or theshortage may be confined to a few labor markets or a single region of thecountry.
Longevity of the shortage. As will 'be discussed below, various forces act tobring markets into and out of equilibrium. Thus, shortages can be relativelybrief, lasting for a few weeks or months, or prolonged, lasting for one ormore years.
Severity of the shortage. Unlike the two dimensions discussed above, it isnot easy to develop good measures of the severity of a shortage.Conceptually, we can measure the severity of a shortage in terms of themagnitude of the changes in wages required to restore equilibrium or interms of the number of workers added to the occupation to alleviate theshortage. There are several difficulties with these concepts. First, we donot generally observe the supply and demand curves for specificoccupations. Thus, we cannot d!rectly estimate the size of the labor orwage gap of a shortage. Second, even if we could measure supply anddemand, it would not be easy to classify a particular gap as large or small,especially when comparing across occupations occupations varysignificantly in their normal vacancy rates and wage dispersion. Thus, a highvacancy rate f or one occupation with a shortage may be characteristic ofanother occupation in equilibrium.
Sub-specialty shortages. Up to this point we have considered occupationsas if they are uniform. For some occupations this may be correct, but forothers there may be differentiation by sub-specialty (e.g., emergency roomnurses), years of work experience, or specialized training. In such cases, ashortcge may exist for the entire occupation or only for workers withselected characteristics. For example, training for engineers has changedconsiderably over the past 20 years, and older electrical engineers may notbe good substitutes for new engineers who have more training in designingintegrated circuits. Likewise, new tool and die makers may not be goodsubstitutes for experienced tool and die makers who have gained additional
2-2
4 5
skills through their work. The key determinant of whether there can beshortages for some parts of an occupation is whether all workers within theoccupation are reasonable substitutes for each other. If not, a shortage canexist within an occupation while other subcategories are in equilibrium oreven in surplus.
For an occupation to have a shortage, two conditions are necessary. First, the
occupation must be in disequilibrium, where the number of workers employers wish to hire
exceeds the number willing to work at the prevailing wage. Second, the market must
adjust slowly, if at all, with the achievement of equilibrium requiring a sufmtantial period of
time. We first discuss the reasons why markets are sometimes in disequilibrium. We then
examine the adjustments that employers make to alleviate the disequilibrium, followed by a
discussion of the reasons why disequilibria may persist. Lastly, we discuss the
consequences of prolonged shortages. The chapter concludes with a discussion of the
implications of the theory for the case studies.
B. Reasons Why Occupational Labor Markets Are in Disequilibrium
Labor shortages can result from a number of different causes. In this section we
discuss the reasons why the labor market for a particular occupation might depart from an
equilibrium situation.
1. Increase in the Demand for Labor
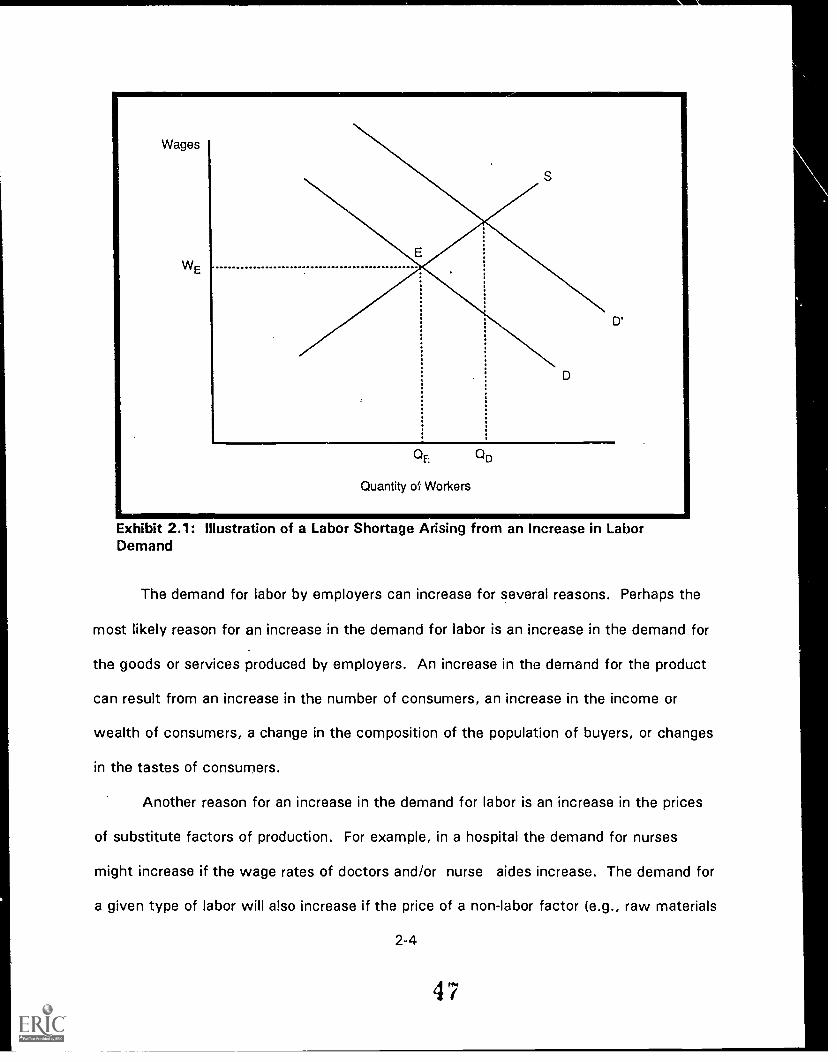
Exhibit 2.1 illustrates how a labor shortage can result from.an increase in the
demand for labor. Suppose that the labor market is initially in equilibrium at point E. If the
demand for labor increases, the demand curve will shift to the right. If the supply curve
remains the same and the prevailing price (wage) remains at WE employers would like to
hire OD workers, but only QE will be available. Thus, there will be a shortage of Qo - QE workers.
2-3
4 6
Wages
WE
Quantity o Workers
Exhibit 2.1: Illustration of a Labor Shortage Arising from an Increase in LaborDemand
The demand for labor by employers can increase for several reasons. Perhaps the
most likely reason for an increase in the demand for labor is an increase in the demand for
the goods or services produced by employers. An increase in the demand for the product
can result from an increase in the number of consumers, an increase in the income or
wealth of consumers, a change in the composition of the population of buyers, or changes
in the tastes of consumers.
Another reason for an increase in the demand for labor is an increase in the prices
of substitute factors of production. For example, in a hospital the demand for nurses
might increase if the wage rates of doctors and/or nurse aides increase. The demand for
a given type of labor will also increase if the price of a non-labor factor (e.g., raw materials
2-4
4 7

or machinery) increases and thelabor can be used as a substitute in the production
process.
Both the Arrow-Capron and Blank-Stigler labor shortage models discussed in the
previous chapter are demand-driven shortage models. The Arrow-Capron dynamic model
is somewhat more complex because it deals with a situation where demand continually
grows more rapidly than supply.
An increase in demand for labor in a particular occupation does not necessarily lead
to a shortage. If the supply of labor to an occupation can respond to the increased
demand, the result will be a new equilibrium with more workers employed and a higher
wage rate than at the previous equilibrium, as is illustrated in Exhibit 2.1. An increase in
demand will almost certainly require some time for the market to reach a new equilibrium,
but if vacancies persist for a sustained period, the occupation can be characterized as
experiencing a shortage. Reasons why occupational labor markets may adjust slowly are
discussed in Section D of this chapter.
2. Decrease in the Supply of Labor
A decrease in the supply of labor to a particular market can also create a labor
shortage. This situation is illustrated in Exhibit 2.2. Once again suppose that the market
is originally in equilibrium at point E. If the labor supply curve is shifted to the left,
indicating fewer workers available at each wage rate, there will be a labor shortage if the
prevailing wage remains at WE. Employers will still be trying to hire QE workers, but only
Qs workers will be available after the supply decreases. Thus, there will be a shortage of
QE QS workers.
2-5
48
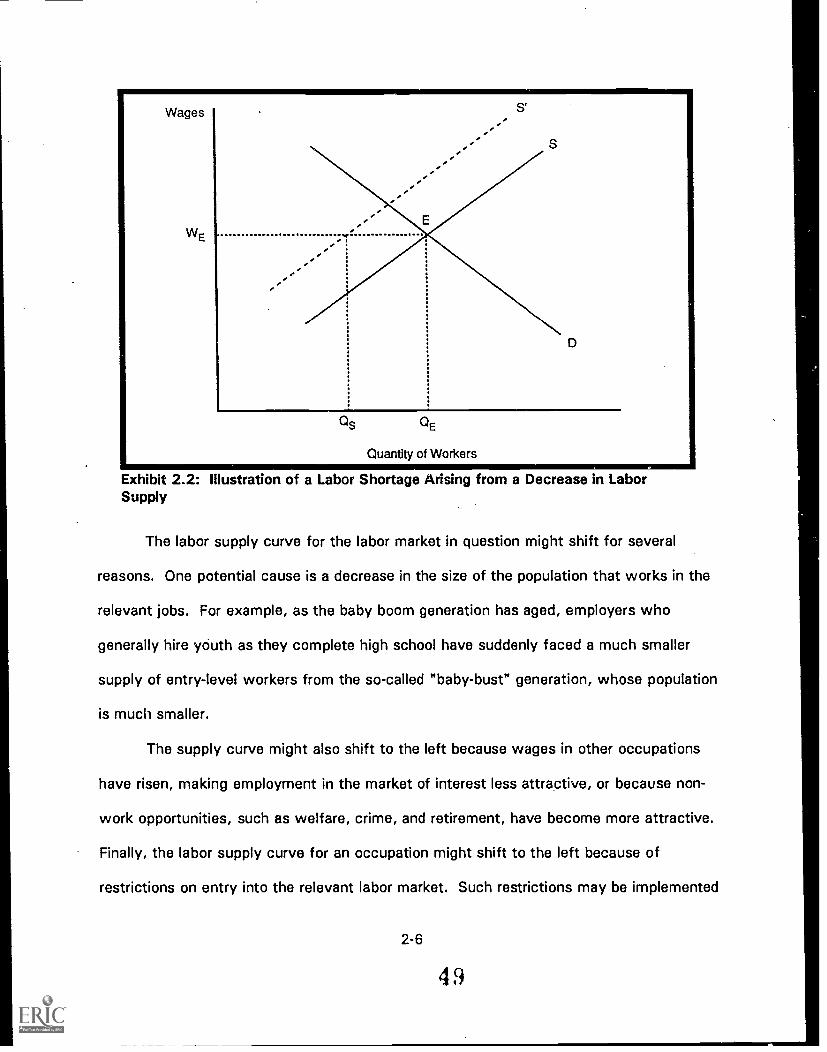
Quantity of Workers
Exhibit 2.2: Illustration of a Labor Shortage Arising from a Decrease in LaborSupply
The labor supply curve for the labor market in question might shift for several
reasons. One potential cause is a decrease in the size of the population that works in the
relevant jobs. For example, as the baby boom generation has aged, employers who
generally hire youth as they complete high school have suddenly faced a much smaller
supply of entry-level workers from the so-called "baby-bust" generation, whose population
is much smaller.
The supply curve might also shift to the left because wages in other occupations
have risen, making employment in the market of interest less attractive, or because non-
work opportunities, such as welfare, crime, and retirement, have become more attractive.
Finally, the labor supply curve for an occupation might shift to the left because of
restrictions on entry into the relevant labor market. Such restrictions may be implemented
2-6
4 9
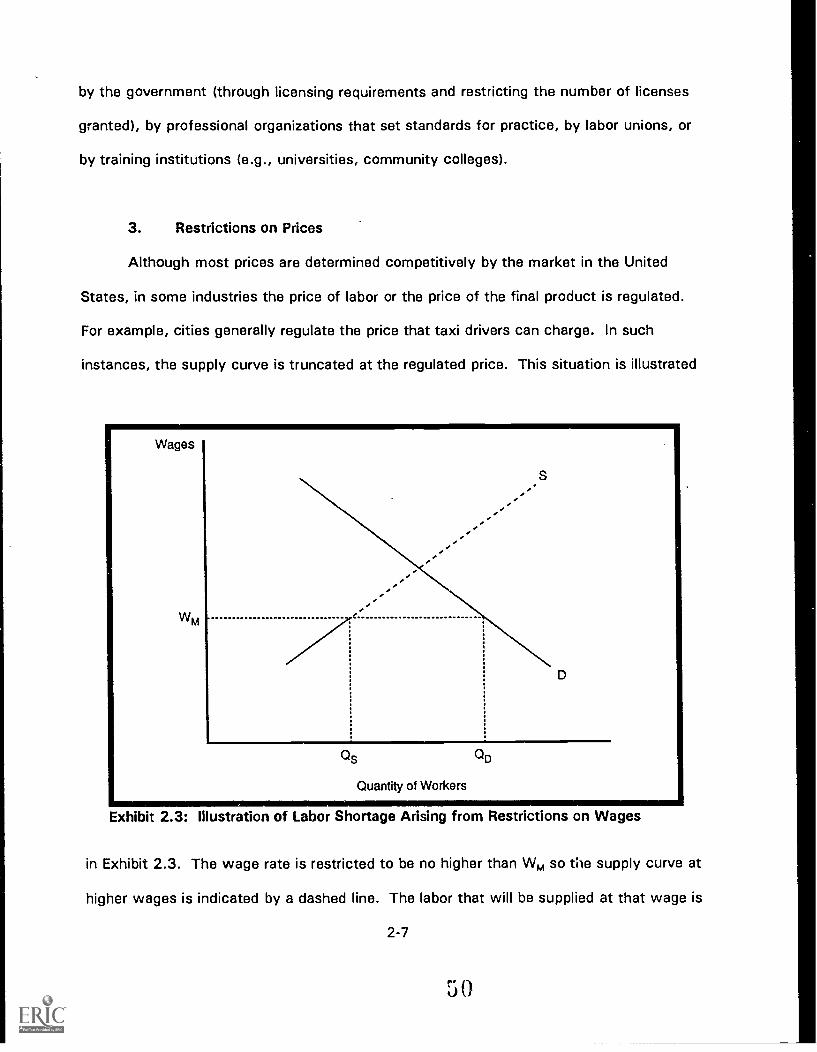
by the government (through licensing requirements and restricting the number of licenses
granted), by professional organizations that set standards for practice, by labor unions, or
by training institutions (e.g., universities, community colleges).
3. Restrictions on Prices
Although most prices are determined competitively by the market in the United
States, in some industries the price of labor or the price of the final product is regulated.
For example, cities generally regulate the price that taxi drivers can charge. In such
instances, the supply curve is truncated at the regulated price. This situation is illustrated
IIIMIIIIIIIIMINEW
Wages
Wm eZ,
as
Quantity of Workers
QD
4I/IExhibit 2.3: Illustration of Labor Shortage Arising from Restrictions on Wages
in Exhibit 2.3. The wage rate is restricted to be no higher than Wm so the supply curve at
higher wages is indicated by a dashed line. The labor that will be supplied at that wage is
2-7
50

Q. At that wage, however, the demand is for Q0 workers, so there is a shortage of Q0
Qs workers. An example of this type of shortage is the federal government's market for
entry-level Ph.D. economists. The federal government traditionally hires entry-level
economists at the GS-12 level, and agencies are generally not permitted to pay a higher
wage rate. The current market wage for entry-level economists is higher, so in many
government agencies there is a shortage of entry-level Ph.D. economists.
More commonly, the government regulates the prices of products and services
rather than labor. In industries where labor comprises a relatively small share of the
product's price, such as in the generation of electric power, the product price regulation is
not likely to cause a labor shortage. In very labor-intensive industries, however, output
price regulation can be tantamount to regulating the price of labor. Examples include the
health care industry in generbI Grid the home care industry in particular. A large share of
the health industry is financed by the Medicare and Medicaid programs. In the case of
Medicare, the federal government limits the reimbursements that providers can obtain for
treating covered elderly patients. State governments provide similar regulation under
Medicaid programs for the poor. By restricting the charges that providers can make, the
providers face limits on what they can pay workers and still cover their costs.
C. Adjustments to Occupational Shortages by Employers
This section describes some of the actions that firms are likely to take to deal with
labor imbalances. Because employers will note the problems first, as they are unable to fill
vacancies at current wage rates, employers will take actions to deal with the unfilled
positions. Some actions are more costly than others, so employers should undertake the
least expensive and most easily reversed actions first. The potential actions that
2-8
51
-employers can take are listed roughly in order of desirability from the employer's point of
view. In particular cases, of course, some of the potential actions may be inapplicable or
employers may undertake the actions in a different order. Note that all the potential
actions employers can take are the opposite of the actions that lead to vacancies:
increasing supply, decreasing demand, and increasing wages. Finally, many of the actions
described below may be undertaken by employers for reasons other than trying to fill
vacant positions.
1. Increase Recruiting Efforts
A logical first step to fill vacancies is to increase recruiting efforts. Although
employers will incur short-term costs in expanding recruiting, there are no long-term or
permanent costs involved. Recruiting can be increased through several approaches:
Increased advertising in the usual outlets. For example, employers whoadvertise in newspapers can increase the frequency of the advertisements orthe size of the advertisements to attract more attention to vacancies.
Advertise in other media. To reach a wider audience of potential employees,firms can expand their advertising campaigns. Firms that traditionallyrecruited through newspaper advertisements can add other newspapers inthe community, radio, and television. Use of job fairs is another suchtechnique.
Expand the recruiting area. Employers who believe that the problem is localrather than regional or national can increase the geographical scope of theirrecruiting efforts. For example, a firm having difficulty recruiting machinistsin Chicago might expand its recruiting efforts to nearby Milwaukee. Someoccupations, generally those with highly skilled jobs, already have nationallabor markets. For these firms, and for firms recruiting for occupations witha national shortage, the only way to increase the recruiting market is torecruit abroad.
Use public and private employment agencies. Firms that do not already doso can make use of public and private employment agencies. Publicagencies, referred to as the Employment Service or Job Service, are free toboth workers and employers. In some states the Employment Service maytend to specialize in serving particular types of workers, but all employers
2-9
52
can list their openinas with the Employment Service. Private employmentagencies charge a fee to either the worker or the firm, with the fee basedeither on the time spent by the agency or as a percentage of the hiredworker's salary.
Pay recruiting bonuses to employees who bring in new workers. For manyemployers, current workers are often the best source of potential new hires.Employees are likely to be hesitant to recommend individuals who areunqualified, and the candidates they recommend are likely to know moreabout the work and working conditions than other job candidates. Thus, formany firms current employees are a major source of job applicants. Toencourage workers to assist in the recruiting process, employers sometimesoffer a bonus for referring qualified applicants or applicants who are hired.
2. Increase Use of Overtime
A relatively simple solution to the problem of filling vacancies is to have current
employees work more hours. Employers who anticipate that the problem will not last for a
substantial period of time are likely to use this approach. If the workers are exempt from
the overtime provisions of the Fair Labor Standards Act (FLSA) and do not receive a
premium for hours in excess of 40 hours per week, overtime may actually save money
relative to hiring additional workers. This is because many fringe benefits, such as health
insurance, unemployment insurance, and workers compensation, are fixed and the firm will
not experience any increase in costs for these benefits when current employees work
additional hours.
As a long-term measure, however, increased use of overtime may not be a viable
option. For workers not exempt from the FLSA, the employer must poy a premium of at
least 50 percent for overtime work, which gives employers a strong financial incentive to
try other means to deal with vacancy problems. In addition, many workers prefer not to
work overtime, so increased use of overtime may lead to employee dissatisfaction and
increased turnover, thereby exacerbating the vacancy problem instead of reducing it.
2-10

3. Reduce Minimum Qualifications for the Job
Another method of filling vacancies is to reduce the minimum hiring standards for
the occupation. At first this may appear damaging, but this is not necessarily the case.
The firm may have set the minimum hiring qualifications higher than necessary when labor
was abundant. For example, a firm may have required a college degree for sales workers
when a high school diploma would have been adequate. For professional jobs, the firm
may have selected graduates from the most prestigious schools, or have had a minimum
grade point average or test score cutoff.
If the productivity of less qualified workers is lower, the firm may be able to train
the workers to reach the productivity levels of the more qualified workers after a
reasonable period of time. When a firm reduces the minimum hiring qualifications, it may_
be able to reduce the wages offered or at least avoid increasing wages.
4. , Restructure Work to Use Current or New Employees in Other Occupations
If employers have difficulty filling vacancies with workers in one occupation, it is
sometimes possible to restructure the work to make use of workers in other occupations.
For example, in a hospital services are performed by workers in a number of occupations,
e.g., physicians, nurses, nurse aides, and orderlies. Although some duties cannot be
readily reassigned (only physicians can make diagnoses), nurses can perform some of the
testing, and care-taking functions can be assumed by virtually any of the staff. Likewise,
some engineering tasks can be performed by drafters, and some tasks performed by
teachers can be performed by aides.
For several reasons, firms will not always make use of this option. For example,
hospitals are unlikely to use physicians to perform care-taking tasks because physicians
2-1 1
are so costly that other measures will generally be less expensive. In addition, assigning
what is perceived to be low-level work to employees may hurt morale and productivity.
Finally, reassigning tasks may involve considerable expense and disruption because of
training and rescheduling that must be conducted.
In some cases, complex jobs can be organized into simpler tasks that can be
handled by less skilled workers. For example, a tool and die maker's work could be split
among metal workers who possess some, but not all, of the skills of a tool and die maker.
In general, shortages are more likely to occur for high-skill occupations than low-skill
occupations.'
5. Substitute Machinery and Equipment for Labor
Employers can sometimes alter the production process to replace workers with
equipment. As technology has advanced in recent years, the types of tasks performed by
machines have also changed. Formerly, machines typically replaced humans in unskilled
tasks such as lifting and moving. More recently, computer-based technology permits
machines to perform more sophisticated tasks including voice recognition, drawing,
designing, and (to some extent) teaching. Artificial intelligence "expert system" models
even permit computers to substitute for professional judgment under certain
circumstances.
There are obviously limits to how much technology can substitute for labor, and in
many situations technology will be used to substitute for labor for reasons other than
'Other factors can also contribute to changes in the mix of skill levels desired byemployers. There is currently debate over whether computers and other microchipapplications have led to "up-skilling" or "de-skilling" of jobs.
2-1 2
55
difficulty in filling job openings. However, substituting technology for labor is sometimes a
viable method of dealing with difficulty in filling vacancies.
6. Train Workers for the Jobs
For some occupations, training is traditionally performed by employers, either
formally through apprenticeship or other training programs, or informally through on-the-
job training. For many other occupations, however, training for entry-level jobs is
performed by other means -- typically colleges and universities for professional
occupations, and vocational schools and trade schools for skilled craft and service
occupations. Employers who traditionally do not train their own workers may resort to
offering or sponsoring training if they are experiencing difficulty filling vacancies.
Offering training for an occupation is often a major commitment for employers, and
it is typically not provided unless most other approaches fail. There are several related
reasons why firms are reluctant to offer occupational training. First, the training is
generally time consuming. Training new employees for a skilled occupation can sometimes
take years, and by the time the workers are trained, the problem of filling vacancies may
have disappeared. Second, establishing and operating a training program to bring new
employees into an occupation is costly. Employers must feel confident that they can
recoup their investment before they are willing to underwrite these costs. Finally, training
new hires for occupations with vacancies carries several risks for employers. The
individuals selected may not be able to successfully complete the training, or if the skills
are transferable to other employers, they may quit shortly after they are trained.'
'The arguments presented above apply primarily to training new hires for entry into anew occupation. The arguments do not apply, or do not apply to the same extent, to
(continued)
2-1 3
5 6
For occupations that do not require a college degree, establishing an apprenticeship
program is one potential method of training workers for occupations through a combination
of classroom and on-the-job training. The Department of Labor has recently moved to
expand apprenticeship opportunities through its Apprenticeship 2000 program. Other
possibilities include training current or new workers in-house or in cooperation with local
colleges, vocational schools, and proprietary schools. In some cases the employer may
not pay for the training -- the courses can be partially or fully funded under federal
programs (primarily the Job Training Partnership Act EJTPAI), state training programs, or
educational institutions.
Training for entry into an occupation can be illustrated by an extreme but
interesting case. The uniformed services need physicians, but they are prohibited frorg
paying market wages to physicians (a shortage induced by market restrictions). To get
around this problem, the uniformed services established their own medical school to train
physicians at no cost to the students. To prevent the students from leaving soon after
being trained, the students are required to sign contracts agreeing to stay in the military
for a specified number of years.
7. Improve Working Conditions
Improving working conditions sometimes is an effective way to attract new
workers and/or reduce turnover. Working conditions include factors such as hours
2(...continued)training workers already on the payroll to improve their skills. Moreover, even if trainingdoes not pay for an individual employer, it might pay for society as a whole. See Burt S.Barnow, Amy B. Chasanov, and Abhay Pande (April 1990). Financial Incentives forEmployer-Provided Treinino: A Review of Relevant Experience in the United States andAbroad. Washington, D.C.: Urban Institute Policy Memorandum prepared for the U.S.Department of Labor.
2-14
57
worked, upgrades in equipment and facilities used by workers, level and type of
supervision, involvement in operation of the firm, training to deal with stress related to the
job, and recognition of the importance of workers in the occupation. Improvements in
working conditions can be especially useful in situations where vacancies are created by
high turnover. High turnover is often associated with occupations with high stress, low
wages, or low prestige. A corwomitant benefit of improving working conditions is that
productivity may increase as well.
ImproVrq the number or timing of work hours can also help in recruiting and/or
reducing vacancies. Some occupations may require split shifts (e.g., driving buses), night
and weekend work (e.g., health occupations), or downtime between productive periods
(e.g., home care). Employers sometimes deal with these unpleasant working conditions by
offering premiums for work at undesirable times, but they often tIslieve they cannot afford
a sufficiently high shift differential to eliminate the problem. Although shift differentials
are still often necessary for undesirable shifts, employers can sometimes improve
recruiting and reduce turnover by working with employees to structure shifts to be as
desirable as feasible. For example, hospitals have experimented with a number of shift
structures to fill the most undesirable shifts. In the home care industry, where workers
sometimes have a great deal of travel time and down time between cases, some
employers have been successful in restructuring caseloads to minimize these problems.
8. Offer Bonuses to New Employees
Although this approach is not commonly used, firms sometimes offer new
employees bonuses for joining the firm. Signing bonuses are similar to paying current
employees bonuses (or "bounties") for recruiting new employees for occupations that are
2-1 5
58

difficult to fill, except that bonuses go to the new employees rather than the current
employees.
For workers, this option provides an extra incentive to join the firm offering the
bonuses. This approach is more advantageous for employers than raising wages because
it is a one-time cost and only affects the employees added in the occupation of interest.
The disadvantage for employers is that the employees lured by such bonuses may not be
as interested in long-term careers with the firm, and they may.be "pirated" away by other
firms offering similar bonuses. Signing bonuses are most frequently used when employers
feel that they are under intense pressure to fill vacancies in the short run. They have been
used by hospitals to recruit nurses and by data processing firms to recruit programmers.
When employers recognize this to be the case, they sometimes resort to using hiring
bonuses to lure employees from other firms.
9. Improve Wages and Fringe Benefits
Increasing wages and/or fringe benefits would, at first glance, appear to be the
logical way for a firm to attract more workers into an occupation. Based on the simple
supply and demand curve analysis, increasing wages is an obvious way to increase the
number of workers willing to work in a particular occupation. Employers are generally
reluctant to increase wages for several reasons. First, an increase in wages will affect the
entire workforce in the occupation with vacancies, not just the new workers the firm
wishes to attract. Thus, the employer incurs costs for more than just the added workers.
Second, the employer might have to increase wages for workers in other occupations as
well. Employers generally attempt to maintain equity among workers in various
occupations. Thus, if an employer increases wages for one occupatinn because of
2-1 6
59

difficulties in filling vacancies, wages may have to be increased for other occupations as
well to maintain what are viewed as appropriate differentials. Another problem with
raising wages is that wages tend to be "sticky" in terms of moving down. That is, once
market conditions change, employers will generally have less flexibility to reduce wages
later. Finally, raising wages might not be an effective means of recruiting in the short run
if supply is not responsive to changes in wages (i.e., the supply is inelastic). In the
extreme case, if the supply is totally fixed in the short run, higher wages cannot induce
any c;lange in the number of workers qualified to work in the occupation.
Improving fringe benefits is similar to increasing wages, but in some instances
employers will reduce their vacancy rates more by improving benefits rather than
increasing wages by a similar amount. For example, health insurance is often an important
fringe benefit to provide. Because group health insurance rates are usually substantially
less expensive than individual policies, the value of health it surance to the employee will
often be greater than the cost to the employer. Health insurance is especially a concern
for employers trying to fill vacancies for relatively low-paying jobs if Aid to Families with
Dependent Children (AFDC) recipients are potential workers. This is because AFDC
recipients receive excellent health insurance through the Medicaid program, and they are
often hesitant to take jobs if they will lose coverage for themselves and their children.'
Unfortunately, many employers who do not provide health insurance are small and pay low
wages. Thus, adding banefits such as health insurance may be most ,burdensome in those
cases where it would be most important.
'The Family Support Act of 1988 partially alleviates this problem by providingtransitional Medicaid benefits for up to one year for AFDC recipients who leave theprogram to take employment. Some AFDC recipients may still be reluctant to leave AFDCif their employer does not provide health insurance, or they may quit to regain Medicaidcoverage later if they or their children require health care.
2-17
GO
10. Contract Out the Work
If a firm is unable to hire all the employees it needs in particular occupations, the
firm may be able to contract out the work to another employer who is not experiencing the
problems. In some instances the labor problem may be regional in nature, and the firm can
contract out the work to a firm in another part of the country. If the problem is
nationwide, the firm can sometimes have the work performed overseas.
11. Turn Down Work
If a firm has exhausted all means that it considers reasonable and can find no
reasonable way around its occupational vacancies, the firm always has the option of
turning down work. Employers generally use this "solution" only as a last resort because
they do not like to give up customers to competitors and, more basically, the only way to
make a profit is to sell goods and services.
If the firm has limited capacity to conduct its business because of occupational
shortages, there are more subtle measures than simply refusing work. For example, the
firm might reduce its marketing activity, and thus reduce the demand for its products.
D. Reasons Labor Markets May Adjust Slowly
As discussed above, labor markets, and other markets as well, constantly
experience changes in supply and demand that cause them to deviate from an equilibrium
situation. In most cases, firms and workers will take actions that will move the labor
market toward equilibrium. In some instances, however, the market adjusts slowly, and
equilibrium is not restored, resulting in a shortage for the occupation. The literature
2-1 8
61
suggests several factors that may result in the market failing to clear reasonably quickly.
These factors are discussed below.
1. Slow Reaction Time by Employers
In most industries, each individual firm employs a small share of the workers in a
particular occupation. Thus, individual employers may be unaware of an increase in
demand, and they are almost certainly unaware of the magnitude of the increase. As the
firm recognizes that workers cannot be attracted at what they believe to be the market
wage, they may then take the actions described in Section C to deal with the vacancies.
A number of factors can influence the reaction time of employers. If the firm does
not recruit frequently for the occupation, either because of low turnover or because it
employs few workers in the occupation, the firm may not know what the typical period is
for filling vacancies for that occupation. The firm also may not have a good idea of what
the market wage is, and thus may tend to set its offer wage too low.
Several institutional factors are likely to affect reaction time by employers.
Occupations characterized by long periods of vacancies are more likely to have slow
reaction times by employers because employers expect to take a significant amount of
time before they fill vacancies. Lengthy recruiting periods are more characteristic of
occupations with high salaries, typically professional and managerial occupations and
highly skilled craft jobs. Occupations where employment is concentrated in small firms are
likely to be characterized by slow reaction times because the employers are likely to recruit
for fewer positions and less frequently than larger employers.
Other institutional factors that can influence employer reaction time include the
extent to which employers and workers in the occupation are organized and exchange
2-1 9
62
information. For example if employers have a trade association that monitors and
publishes data on wages, vacancies, and other employment-related factors, employers will
be aware of the occupational situation early in the search process. Of course, receiving
national-level data is not as useful as local data for an employer who recruits locally. For
some occupations, hiring is done in conjunction with the trade union representing the
workers. Even if most firms are small, the centralization of the hiring process will help
employers gain a quicker grasp of the supply available.
2. Slow Response Time by Employers
After firms recognize that there is excess demand for an occupation, they majf
delay taking actions to fill their vacancies. Most strategies that a firm might try could be
risky, expensive, or both. Relatively minor responses, such as intensifying the recruiting
effort, will waste the firm's money if the positions would be filled without them. More
significant responses, such as changing the occupational structure of the firm and training
workers, require major commitments to plan and implement. Such actions are unlikeiy to
be taken unless the employer believes that the firm is facing a prolonged period of
difficulty in hiring.
Increasing wages can also be a major step for employers. As noted above, the
wage increases must also be passed on to current workers as well as the newly hired
workers, and sometimes workers in other occupations must receive increases as well. If
the firm is in a competitive product market, it must carefully balance two competing
interests. If it sets the wage too high, the firm's costs will be higher than the costs of its
competitors, and ths firm is likely to either lose market share (if it passes the costs on to
2-20
63
consumers) or profits (if it absorbs the increased costs) or both. Thus, firms are likely to
be conservative in increasing wages as a method of filling vacancies.
3. Slow Reaction Time by Workers
Workers in other occupations and individuals who are unemployed or out of the
labor force may not immediately recognize that wages and\or working conditions have
improved in the occupation with the developing shortage. If workers who might be
attracted to jobs in the occupation with the excess demand are unaware of the
opportunities, they will not be able to consider entering that occupation. The time
required for workers to become aware of the new opportunities depends on how effective
firms' recruiting strategies are and how sensitive workers are to the recruiting effort.
4. Slow Response Time by Workers
Once workers are aware of the opportunities, their response time will depend on
the time required to qualify for the positions and the costs and benefits of obtaining any
needed qualifications, applying for the positions, and changing jobs. Typically, the greater
are the incentives provided by employers to induce workers into the occubation of interest,
the quicker and greater will be the response by potential entrants.
For many occupations, training time is the most important factor slowing worker
response time. Occupations requiring a specialized college degree, such as engineering,
will be very slow in adjusting because the "pipeline" for producing new engineers is four
years. The lag might be more extensive if some potential engineers must adjust their
mathematics course load in high school. Some specialized occupations, such as
architecture and medicine, require even longer preparation.
2-21
6 4
Many occupations requiring less than a college education still demand several years
of training and will have a substantial lag before interested individuals qualify for the
occupation. For example, many technician and skilled craft positions take two or more
years of training. At the other extreme, some low-skill jobs, including paraprofessional
home health care workers, may require as little as one week of formal training. Thus, the
worker response lag generally will be shorter.
Response time can also be slowed if training institutions lack the capacity to train
additional workers. For instance, the supply of nurses cannot be readily expanded if there
are too few nursing instructors.
5. Restrictions on Occupational Entry
In some cases institutional barriers to occupational entry will slow down the
adjustment process. These restrictions are generally instituted to achieve certain
purposes, so removing or modifying the barriers is not always appropriate. However, in
times of occupational shortages, consideration is often given to modifying these
restrictions.
One example of a barrier to occupational entry is limits in the enrollment capacity of
training institutions that supply workers for the occupation. Suppose, for instance, that
hospitals needed to hire more physicians and there were enough individuals interested in
attending medical school to meet the hospitals' demands. If the nation's medical schools
could not admit the extra students because of limited capacity, the supply of physicians
could not increase. Note that hospitals do not regulate the capacity of medical schools, so
it would be difficult for this market to adjust.
2-22
65
Other institutional barriers include licensing and certification requirements.
Employers might be willing to lower the standards for a particular occupation, but if entry
to the occupation is regulated, the regulatory or licensing board would have to agree.
These boards, which are often state bodies, might not.wish to lower the standards, and
current members of the occupation might object to relaxation because it would cheapen
their credentials and possibly result in lower wages. Restrictions on immigration may
operate as a similar institutional barrier to achieving equilibrium in occupational labor
markets. Trade unions or associations, at the time of contract negotiations or through
other activities, may restrict the supply of workers or hiring requirements for workers. An
example of this type of barrier is restrictions on the ratio of apprentices to journey workers
in an occupation. In some instances such restrictions could constrain employers and
potential entrants from increasing the number of entrants in an occupation making use of
apprenticeships.
All of the barriers mentioned above were established for particular reasons, usually
to assure quality for workers in the occupation. Although consideration should be given to
changing or eliminating the barriers, their original intent should not be forgotten.
6. Continuous increases in Labor Demand
If the labor demand schedule continuously increases faster than the amount
supplied can increase, then the market will not achieve equilibrium. This scenario is the
basis of the Arrow-Capron dynamic model of labor shortages, and it can occur in periods
of rapid sustained growth in one or more industries that employ workers in the shortage
occupation. Such a period of sustained rapid growth for a particular sector of the
economy can prevent the market from clearing for a substantial period of time. According
2-23
6
to Arrow and Capron, this situation occurred for engineers following World War II. Note
that in this situation the problem is not necessarily that workers or employers cannot
adjust; rather, the problem is due to continued shocks to the equilibrium levels of
employment and wages.
E. Consequences Of Labor Shortages
Labor shortages can lead to a number of consequences for the firms experiencing
the shortages, and the rest of the economy as well. In economic terms, the major
consequence of a sustained shortage is that the economy will be operating less efficiently
than it could. Until the market achieves equilibrium, resources are not put to their most
productive use. Thus, aggregate production for the nation is below capacity. Workers
may have to work more hours than they desire, or they may be assigned to jobs they do
not want. Employers may have to use their workers and equipment less efficiently than
they desire, and this may result in lower output and reduced profits. Consumers will be
denied the goods and services they wish to buy. In some cases, the impact on consumers
will be relatively modest, but if consumers cannot obtain needed health care because of a
labor shortage, the consequences can be severe. Finally, the impact of a shortage can
extend beyond the firms directly experiencing the problem. A shortage of home health
workers or nursing home workers, for example, may result in hospitals having to keep
patients longer than is desirable. A shortage of workers who produce tires would result in
problems for the automobile industry as well. Thus, it is difficult to trace all of the effects
of an occupational shortage. In the case studies that follow we indicate the impacts of
shortages in the occupations studied for the economy as a whole as well as for the
employers experiencing the shortages.
2-24
6
F. Implications for the Case Studies
In this chapter we have presented a framework to analyze the causes of
occupational imbalances, the types of adjustments that we anticipate employers and
workers to make, the reasons why these adjustments might not ameliorate the shortages,
and the consequences of shortages. In the case studies presented in the following
chapters, we analyze four occupations believed to have experienced labor shortages.
Because vacancy data are not available, we have relied on other published data and
interviews with employers, trade associations, unions, government officials, and
researchers to analyze the occupations.
Available published data are often useful for examining objective factors of interest
such as changes in wage rates and employment levels for the occupations of interest
relative to other occupations. However, published data do not adequately address the
issues of why the shortage arose, what types of adjustments were made, and why the
market did not reach equilibrium quickly. For a better understanding of these issues, we
have relied heavily on the detailed interviews. Because shortages can vary in their scope
and intensity, because there is a lack of data on vacancies, and because there are no
simple quantitative indicators of when a shortage exists, the results presented in the four
case studies do not present precise measures of the magnitudes of the shortages.
However, we believe that the case studies will help shed light on this important is:

CHAPTER 3
CASE STUDY OFSPECIAL EDUCATION TEACHERS
A. Description of the Occupation
Special education teachers work with students who face special emotional,
developmental, and physical challenges. The special needs and abilities of these students,
who may be emotionally disturbed, learning disabled, mentally retarded, or have speech,
hearing, vision, or other impairments, cannot be met by conventional teaching practices.
Special education teachers use a variety of classroom methods to tailor their material to
the varying learning characteristics and needs of their students, usually providing
instruction to small groups or individuals.
In addition to providing educational instruction, special education teachers have
several other responsibilities. First, they are involved in the identification of exceptional
children' and with the transition of these students between special education and
ri 3instream classes. To this end, they also act as consultants to the entire faculty on
issues regarding the transition of exceptional children back into conventional classroom
settings, a process referred to as "mainstreaming." Second, they serve as advisors to
parents of exceptional children, advising them on the motivational, cognitive, and social
consequences of their children's conditions. Finally, they formulate and evaluate long-term
strategies to help their students attain a sense of social and personal self-sufficiency.
Often the special education teacher may work in a resource room, a place where students
'The terms "exceptional" and "challenged" have replaced terms such as "disabled" or"handicapped" in much of the special education literature. Except when otherwise noted,these terms should be considered synonymous.
3-1
69
with mild handicaps spend less than 50 percent of the school day working towards
specified goals.
Study of the labor market for this profession is interesting for several reasons.
Although special education teachers are usually paid according to the same wage scale as
all other teachers, special education teachers have higher rates of attrition, longer and
more rigorous training and certification requirements, and a greater number of adminis-
trative and legislative burdens.
The history of special education teaching as a distinct area of teaching is quite
brief, beginning in the late 1950s. Special education teachers prior to that time watered
down or simplified regular classroom curricula, an approach which largely reflected the
lack of empirical knowledge in the field as well as a lack of recognition that a different
approach was required for the education of children with handicaps. In the case of
severely handicapped students, who were often placed in separate centers or institutions
and thus separated from their mainstream peers, teachers for the most part focused on
controlling student behavior and attempting to teach students as best they could using
conventional instructional methods.'
In view of the lack of specialized personnel to train special education teachers, PL
85-926 was passed by Congress in 1958 to establish university doctoral-level training
programs in the area of mental retardation. This legislation, in conjunction with the
economic prosperity of the following 15 years, contributed to a proliferation of educational
programs for exceptional children.' The next major steps, in the early 1970s, were the
'Douglas J. Palmer and Robert Hall (1987). "Special Education, Teacher Training." InEncyclopedia of Special Education, eds. Cecil Reynolds and Lester Mann. New York: Wileyand Co., p. 1478.
'Palmer and Hall (1987), p. 1478.
3-2
70

passage of PL 93-112, the Vocational Rehabilitation Act, which mandated the education
and civil rights of all handicapped children and youth, and PL 94-142, the Education for All
Handicapped Children Act (EHA), which guaranteed a "free and appropriate" education to
all handicapped children between the ages of 3 and 21. These acts affected more than
eight million children and greatly increased the demand for special education personnel; in
addition, they gave the field an intellectual and professional legitimacy it had not
previously enjoyed.'
The EHA mandate had several other consequences. First, it stimulated research in
the instructional, psychological, and social aspects of special education. Second, it
hastened the accumulation and dissemination of new educational methods developed in
schools. Finally, it placed the special education teacher at the center of a network of
supporting special education personnel (e.g., psychologists, therapists, and aides), all with
the goal of providing an "appropriate" education to exceptional children.
There are several professions closely related to special education teaching, such as
occupational and physical therapists, special education psychologists, and mainstream
teachers. The nature of the work special education teachers perform most closely
resembles that of mainstream teachers; it is therefore with mainstream teaching that we
will most often compare-special education teaching.
B. Training and Recruitment of Special Education Teachers
This section discusses the educational requirements and qualifications for entry into
special education teaching, the factors affecting these requirements, and the methods
'Edward L. Settler and Joan L. Settler (1985). "Economic Realities of SpecialEducation." Teacher Education and Special Education. 8(2), p. 98.
3-3
71
employers use to fill vacancies in the field. This examination of the means by which
individuals enter the occupation will lay the groundwork for the analysis of shortages
discussed later in the chapter.
1. Educational Qualifications and Entry Requirements
a. Current Requirements
In a field with such varied responsibilities and teaching goals, the requirements to
enter special education are not universally agreed upon and are in constant flux. As the
goals cf special education progressed in the 1960s and 1970s from mere behavior control
and remedial education to also include emotional and developmental therapy, the
proficiencies and skills necessary for a special education teacher expanded beyond those
required for mainstream teachers.'
Entry into special education teaching is primarily regulated by state certification.
Not unlike those for general education, the requirements for certification reflect each
state's educational philosophy regarding the education of exceptional children, and more
recently, have reflected the severity of the shortage of qualified special education
teachers. As might be expected, there is great variation in state special education
certification standards, largely because no clear consensus exists regarding the formal
skills and knowledge special education teachers ought to have.'
'The Education for All Handicapped Children Act guarantees a "free and appropriate"education for all exceptional children, and it encourages teachers to document and reportthe children's progress. In practical terms, this call for accountability on the part ofteachers hastened the shift to replace the generalized curricula of the 1950s and 1960swith curricula matched to the abilities and needs of the students.
'Geraldine D. Chapey, Irene S. Pyszkowski, and Teresa A. Trimarco (1985). "NationalTrends for Certification and Training of Special Education Teachers." Teacher Education
(continued...)
3-4
72
Most states base their certification processes on a few broad premises. First,
special education teachers must have a firm foundation in general literacy, humanities,
liberal arts, and the sciences. Second, they must be qualified in general education as well
as in special education; this includes knowledge of basic academic skills, curricula,
instructional methods, and behavioral management strategies.' Third, special education
teachers must be able to function as team members and consultants, providing expertise
to the general teaching faculty and parents regarding the child's handicapping condition.
And finally, special education teachers must be able to assess a pupil's level of functioning
and select, implement, and evaluate instructional programs based on each student's
individual learning abilities.
Most state certification requirements reflect these fundamental premises. They
require a bachelor's degree in education, and although the degree need not be in special
education, it would optimally include some course work in special education. In addition,
some states require graduate work in special education teaching. The length and scope of
this work varies, but a master's degree in special education is often required or suggested
in certain specialties.' In addition to (or in conjunction with) graduate work, most states
require approximately one year of paid internship training in a chosen special educition
category; this is based on the recognition that supervised practical experience is important
and Special Education. 8(4), p. 207. This issue was also raised in a number of interviewswith researchers and officials in special education.
'Palmer and Hall (1987), p. 1479. As used here, the term "certification" implies fullcertification; other types, such as temporary, emergency, and provisional certification, arediscussed later.
'Graduate special education includes course work related to testing and measurement,educational statistics, and consultative and directed teaching in elementary and specialeducation (Palmer and Hall (1987), p. 1479).
3-5
73
in the formation of good instructional skills and habits.9 According to several researchers
whom we interviewed, a large number of states require "dual certification" in special
education, meaning that special education teachers are required to obtain a general
teaching certificate in order to qualify for certification in special education.1° Finally, a
majority of states (45 in 1987) also require a teacher compete6cy test such as the
National Teachers Examination (NTE) as part of the process of initially certifying all teach-
ers.11 12
A major characteristic of special education certification is the specific category in
which it is granted. States may certify special education teachers based upon specific
handicap-based categories (categorical certification), or they may certify teachers without
strictly defining the areas of special education in which they are qualified to teach (non-
categorical and multicategorical certification)." Rather than dividing certification
'Palmer and Hall (1987), p. 1479.
'As might be expected, dual certification has important consequences for the supplyof special education teachers; first, it extends the investment in time and training requiredfor special education certification; and second, it influences their possible career paths,allowing them to enter general education easily and immediately. The relevanc; of thesetwo factors to labor shortages in the occupation is discussed later in the chapter.
"Roberta Strosnider and Linda F. Little (1988). "Special Education as a Profession: AProposal for National Certification Standards." Teacher Education and Special Education.11(4), p. 169.
"J.D. Stern. Th snail n if E 1 on: El rn n r n - n. E
Volume 1. Washington, D.C.: U.S. Department of Education, National Center forEducation Statistics, pp. 70-71, 129-130.
iSn : :
"Categorical certifintion, the more traditional aproach, is based on the handicap bywhich the pupils are classified. Certificates of this type include those for the learningdisabled, mentally retarded, hearing impaired, speech impaired, and physicallyhandicapped. The less traditional and more generic policy includes noncategoricalcertification and multicategorical certification. The former, noncategorical, refers tocertification in programs teaching a range of mildly handicapped children, from those with
(continued...)
3-6
74
according to handicap classifications, the noncategorial and multicategorical approaches
often specify certification by the level of education (e.g., K-9, 9-12, etc.) or severity of
handicap (e.g., mild, moderate, severe) at which teachers are qualified to teach.
Each of these educational philosophies has its advantages: the former approach
allows specialization in a particular handicap and a better understanding of the skills and
needs of children with those handicaps; the latter and more generic approach offers more
flexibility for special education teachers, allowing them to teach children with different
types of handicaps, as well as allowing for a broader approach to teaching exceptional
children which doesn't rigidly classify them. Approximately half of all the states (24)
currently consider their certification to be noncategorical; however, a majority of these
states also issue certificates in specific categories, such as deafness/hearing impaired,
blind/visually impaired, and emotionally disturbed. The remaining states provide only
categorical certification.' 4
In 1988, over 180 different category titles were used by states, with most states
defining categories differently and dividing special education into different numbers of
categories. The U.S. Department of Education, in collecting its data on special education
programs, collapses this diverse group into 10 broad categories:
13(...continued)mild to moderate learning disabilities and behavior problems; it is based on the belief thattraditional classification schemes are not important for instructional purposes; the latter,and less common, multicategorical certification is for programs in which children of morediverse categories and various levels of severity are enrolled in a single program. SeeEdward A. Blackhurst, Deborah A. Bott, and Donald P. Cross (1987). "NoncategoricalSpecial Education Personnel Preparation." In Handbook of Special Education: Researchand Practice, Vol. 1., eds. Margaret C. Wang, Maynard Reynolds, and Herbert Walberg.New York: Pergamen Press, p. 313.
"Terry R. Berkeley (1990). "Special Education Certification Survey of the States."National Clearinghouse for Professions in Special Education, p. 1.
3-7
75
Learning Disabled (LD)Speech Impaired (SI)Mentally Retarded (MR)Emotionally Disturbed (ED)Hard of Hearing/Deaf (HI)Multihandicapped (MH)Orthopedically Impaired (01)Other Health ImpairedVisually HandicappedDeaf-Blind
Exhibit 3.1 shows the relative sizes of various special education teaching
categories, as described by the percentage of special education teachers in each category
in the 1986-87 school year. About 80 percent of all special education teachers are
included in the four largest categories: learning disabled, speech impaired, mentally
retarded, and emotionally disturbed. In addition, approximately 28,000 teachers--about
10 percent of all special education teachers--are not included in any of the above
categories and are certified in noncategorical special education.'
The difficulties that many school districts have experienced in hiring fully-certified
special education teachers has led to the development of several types of temporary
certification (e.g., emergency, provisional, and out-of-field), piovided primarily to schools
unable to hire fully-certified teachers." Temporary certification is provided to teachers
who are not fully qualified (or not fully-certified) to teach special education, often in school
districts unable to hire an adequate number of fully-certified teachers. A 1983 study
"U.S. Department of Education, Office of Special Education Programs and Office ofSpeciai Education and Rehabilitative Services (1989). Eleventh Annual Report to Congresson the Implementation of the Education of the Handicapped Act. Washington, D.C.: U.S.Department of Education, pp. A60-A62.
'MOst states' laws stipulate that in order to hire teachers with temporary certificates,the school district first must have made a "reasonable search" for fully-certified specialeducation teachers to fill their vacancies. Teachers who are not fully qualified obtaintemporary certification through school system wishing to hire them.
3-8
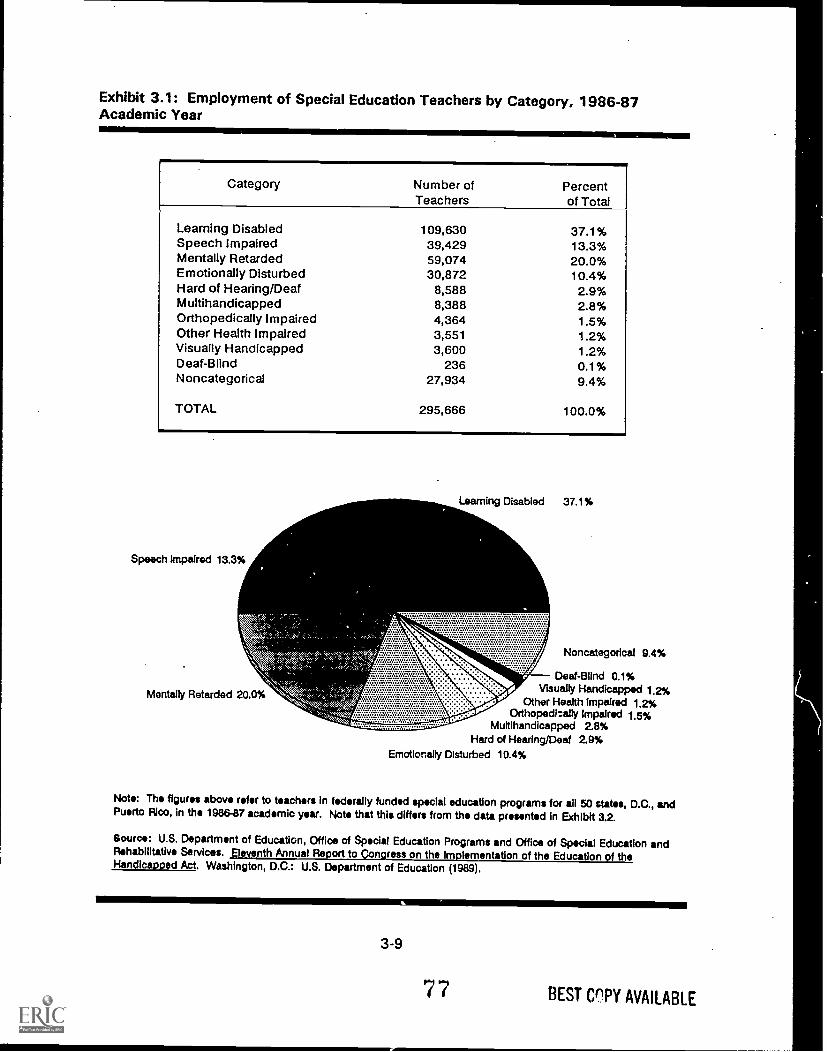
Exhibit 3.1: Employment of Special Education Teachers by Category, 1986-87Academic Year
Category Number ofTeachers
Percentof Total
Learning Disabled 109,630 37.1%Speech Impaired 39,429 13.3%Mentally Retarded 59,074 20.0%Emotionally Disturbed 30,872 10.4%Hard of Hearing/Deaf 8,588 2.9%Multihandicapped 8,388 2.8%Orthopedically Impaired 4,364 1.5%Other Health Impaired 3,551 1.2%Visually Handicapped 3,600 1.2%Deaf-Blind 236 0.1%Noncategorical 27,934 9.4%
TOTAL 295,666 100.0%
Mentalty Retarded 20.0%
Deaf-BlInd 0.1%Visually Handicapped 1.2%
Other Health Impaired 1.2%Orthopedizally Impaired 1.5%
Muttihandicapped 2.8%Hard of Hearing/Deaf 2.9%
Emotionalty Disturbed 10.4%
Note: The figures above refer to teachers in federally funded special education programs for all 50 states, D.C., andPuerto Rico, in the 1986-87 academic year. Note that this differs from the data presented in Exhibit 3.2.
Source: U.S. Department of Education, Office of Special Education Programs and Office of Special Education andRehabilitative Services. Eleventh Annual Report to Conaress on the Implementation of the Education of theHandicapped Pct. Washington, D.C. U.S. Department of Education (1989).
3-9
77 BEST COPY AVAILABLE
reported that 48 of 54 jurisdictions in the United States provided some sort of emergency
certification." A 1990 study found that 78 percent of states responding to a survey
have instituted their emergency certification procedures specifically to address critical
shortages in special education:8
A 1986 study which surveyed education agencies in 41 jurisdictions found that 13
jurisdictions reported a general rise in the number of temporary certificates issued, 19
reported that they were issuing the same number of such certificates each year, and only
7 reported a declining number of temporary certificates being issued. Two jurisdictions
claimed that the practice of issuing temporary certificates had been eliminated by
legislative action:9 One state official we interviewed said that in some areas in her
state, between 2 and 20 percent of teachers in special education hold temporary
certificates.
These special education teachers, however, are not generally regarded as
permanent replacements for fully-certified teachers; rather, they are hired often as long-
term substitutes or with short-term contracts, until the school is able to hire fully-certified
replacements. In some cases certification is "provisional," given to teachers with the
expectation that they will undertake special education training and obtain full certification
within a fixed period of time. The distinction between fully-certified special education
"Sattler and Settler (1985), p. 102.
"'Fran O'Reilly (1990). State Emergency Certification Provisions Results of a 1990
Survey. Washington, D.C.: National Clearinghouse for Professions in Special Education, p.
1.
19Margaret J. McLaughlin, Judy Smith-Davis, and Philip J. Burke (1986). Personnel to
Edusaig_lhe Flan i a ed in And_g_Apwica.;_LatISIQJsRe ort. College Park: Maryland: Institute
for the Study of Exceptional Children and Youth, College of Education, University of
Maryland, p. 44.
3-10
78
teachers and those with the types of temporary certification discussed here is important to
the discussion of shortages. Temporary certificates are granted in the face of a shortage
of fully-certified special education teachers; the long-term demand for fully-certified special
education teachers, however, does not diminish with the presence of teachers with
temporary certificates, but instead may be measured by them.
b. _CligngegiriBesargi_gnn
The patterns of special education certification requirements are constantly
changing; between 1982 and 1986, 37 out of 57 jurisdictions made some changes to their
policies governing special education certification or had some changes pending.'
Several dichotomies emerge in the certification and entry policies initiated by states in the
1980s. According to the Encyclopedia of Special Education:
"On the one hand, there were movements to professionalize teaching, developprofessional standards boards for teacher certification, make pre-service preparationmore rigorous, and improve the overall quality of education provided.' On theother, there was widespread hiring of unqualified applicants through emergencycertification and temporary certification waivers, which were allowed on the beliefthat in areas with critical shortages, having unqualified personnel was better thanhaving none."22
'McLaughlin et al. (1986), p. 7.
"The term "pre-service preparation" refers to education and training received prior tothe time the teacher begins full-time teaching; analogously, "in-service training" refers totraining and education the teacher receives after having begun teaching. See "In-ServiceTraining for Special Education Teachers." Encyclooedia of Special Education (1988), p.835.
22judy Smith-Davis (1990). "Alternative Routes to Teacher Certification." NationalClearinghouse for Professions in Special Education, p. 1.
3-11
79

This dichotomy was also noted by Darling-Hammond: "For every move to tighten
certification requirements and raise standards, other steps were taken to loosen or waive
them, often as a means of counteracting teacher shortages."'
The demand for special education teachers in the 1980s and the desire to attract
more people into the field has led to interest in alternative routes to certification.
"Alternative certification" requirements and state-sponsored alternative training programs
allow individuals who are not trained in special education (often persons with bachelor's
degrees in other areas of teaching or in other fields) to enter the field rapidly without the
long undergraduate training process.' A typical alternative certification training program
involves a summer course lasting six to eight weeks, followed by a paid supervised
internship lasting up to one year, after which the teacher is expected to receive full
certification.
The major concern regarding alternative certification programs is the impact that
they may have on the quality of special education teaching. Critics claim that acceptance
of such certification practices represents a reduction of teaching standards and will result
in inadequately prepared teachers--and ultimately, ineffectively served children.
Advocates of such programs, however, argue that alternative certification requirements,
when thoughtfully developed, will maintain the quality of teaching in special education and
still allow talented candidates to enter the field with ease.
Recent studies have found that most alternative education programs require
baccalaureate degrees, have entrance requirements equal to or greater than those for
5."L. Darling-Hammond. "The Futures of Teaching." Educational Leadership, 46(3), p.
24Dar ling-Hammond, p. 5.
3-1 2

university teacher education programs, emphasize practical training and experience over
educational methods and training seminars, and involve ongoing supervision and evaluation
of the candidates.' Although critics cite the potential danger of producing lower quality
teachers, it is estimated that between 19 and 27 states have sponsored or planned
alternative education programs, and more are likely to consider such programs if the
perceived shortage of special education teachers in certain critical areas continues.'
2. Methods Employers Use to Recruit Teachers
a. Vacancy Announcements
Traditionally employers--school districts and private schools--have recruited
special education teachers as they did all other teachers, namely by contacting prospective
teachers through college or university channels and professional conferences, or by placing
advertisements in professional publications and newspapers. Word-of-mouth has also
played an important role in attracting teachers, especially to districts or schools expanding
special education programs and seeking experienced teachers.'
The general perception of a shortage in special education has led many school
districts to devise and implement new strategies to attract and recruit special education
teachers. For example, electronic bulletin boards have been recently developed by a
number of education associations listing vacancies available for special education teaching
'L. Darling-Hammond, L.N. Hudson, and S. H. Kirby (1989). Redesigning TeacherEducation: Opening the Door for New Recruits in Science and Mathematics Teaching.Santa Monica, California: The RAND Corporation. Cited by Judy Smith-Davis (1990)."Alternative Routes to Teacher Certification," p. 4.
"Darling-Hammond (1989)
"National Information Center for Children and Youth with Handicaps (1987). SpecialEducation Personnel Recruitment Practices: A Manual for Administrators, p. 3.
3-13
81
posts around the country. Several state education agencies and associations have also
created employment clearinghouses that compile and disseminate employment information
about available teaching positions.'
While these new methods will not supplant the traditional recruiting techniques,
there are certain advantages. Electronic bulletin boards and employment clearinghouses
are accessible to any person or agency across the country, providing greater geographic
reach than newspapers. They are less expensive and more up-to-date than professional
journals, and they require none of the informal university channels that are inherently
limited in range and number. Employment clearinghouses are able to provide prospective
applicants with more recruiting material (e.g., brochures, information on requirements), and
are able to monitor and assist applicants in their employment search.
b. Recruitment Practices
Making prospective applicants aware of teaching vacancies is not the only thing
employers do to fill positions. Employers who perceive shortages of personnel often
intensify their recruiting efforts and offer incentives to entice applicants. Shortages in
special education, or the fear of them, have caused the proliferation of innovative methods
used by school districts to attract promising applicants. These include:
paying the expenses of applicants to visit their schools;
assisting in the search for affordable housing;
'For example, Special Net, a nationwide computer network developed by GTE andNASDSE (National Association of State Directors of Special Education), has anemployment bulletin board that lists employment opportunities nationwide. Anotherelectronic service is CAREER CONNECTION, which iists candidates seeking specialeducation positions. Several state agencies have also developed such systems to rapidlyand effectively disseminate teaching vacancy information (e.g., CAREER, a computerizedjob vacancy service for teachers and other educators, provides listings of openings inCalifornia public schools.)
3-14
8^

helping spouses of new employees find employment;
paying tuition costs for teachers to return to college to obtain furtheieducation; and
providing opportunities for summer employment.
Other employers sponsor job fairs for educators Florida has an annual "Teach
In," that attracts students and teachers from around the country. In some districts,
promising applicants are "sold on the advantages of the locale" (for example, some Florida
counties send out-of-state prospects to Disneyworld).
3. Methods Teachers Use to Seek and Obtain Employment
The methods that special education teachers use to seek and obtain positions ara
generally the converse of the methods employers use, i.e., they employ the opposite ends
of the same thannels. Teachers generally use university postings, word-of-mouth,
employment clearinghouses, and compute: networks to find vacancies in teaching
positions.
There is, however, variation in the methods used by different types of applicants.
Entrants to special education teaching, namely newly-trained teachers or those who have
recently obtained certification, generally rely on university-based channels, professional
conferences, job fairs, and journals to seek and obtain teaching positions. With few
exceptions, university-based channels are limited geographically within the state and to
states with similar certification procedures.' Applicants certified in the field who are re-
entering the profession who have recently obtained temporary or emergency
"Universities generally design their teacher education curricula around their state'scertification requirements; consequently the requirements of in-state employers generallymatch university curricula and new teachers find it easiest to obtain jobs in the state inwhich they were educated.
3-1 5
83

certification or who have moved from other states are more likely to use employment
clearinghouses or employer-based sources of information (advertisements, etc.), primarily
due to their lack of other connections.3°
4. Characteristics of Workers in the Occupation
Broad national data on the demographic characteristics of special education
teachers are difficult to find. Although most of the informaticn regarding the
characteristics of people in the field is anecdotal, some facts are evident from surveys.
According to the Current Population Survey:
Special education teachers are more likely to be women; in 1988, 85.2percent of special education teachers were women, compared to 72.9percent for all teachers, and 44.8 percent of all full-time workers over theage of 16. These estimates are substantiated by the SASS (School andStaffing Survey) data for that year--in which 87.7 percent of specialeducation teachers were women.'
In 1988, 10.6 percent of special education teachers were black, ascompared to 8.8 percent of all teachers and 10.1 percent of all workers.Only one percent of special education teachers were of Hispanic origin,much less than the 3.9 percent of all teachers and the 7.2 percent of allworkers.
In the period between 1983 and 1988, the national percentage of specialeducation teachers who were women and those who were black has notchanged. The national percentage of special education teachers who wereof Hispanic origin, however, declined from 2.3 percent in 1983 to 1.0percent in 1988.32 33
"Many of those who receive temporary or emergency certification are generaleducation teachers who are simply reassigned within the sam'e school district, and thusthe need for a job search is often unnecessary.
31E.E. Boe, Lynne Cook, Martin Raufman, and Louis Danielson (1990). Preliminaryanalysis of the SASS data for the 1987-88 academic year. Unpublished tabulations.
32U.S. Department of Labor, Bureau of Labor Statistics (Aug. 1989). Handbook ofLabor Statistics. Washington D.C.: Government Printing Office, pp. 79-95.
3-16
54
Studies that have observed the characteristics of special education teachers have
also found that "the teacher population in special education is generally younger than the
population in regular education," reflecting the rapid growth in employment in the field and
the fact that "nearly 50 percent of newly trained [special education] teachers leave within
their first six years of teaching." According to the SASS survey, the mean age of fully-
qualified special education teachers is 38.3, compared to 41.7 for general education
teachers.'
C. Employment and Earnings in Special Education Teaching
1. Employment Trends
This section describes and analyzes trends in the employment and earhings of
special education teachers in the United States. These trends, analyzed in comparison
with the number of exceptional children and the size of the overall teaching profession,
provide insight into the size and history of the labor market for special education teachers.
The primary source of information concerning the number of special education
teachers is the Office of Special Education Programs (OSEP) in the U.S. Department of
Education, which is charged with compiling and analyzing employment data on special
education programs and personnel; data is based primarily on the survey responses of the
"While national demogc,aphic characteristics have not significantly changed, it isimportant to note that these characteristics may have changed at the state and local level,for which data are unavailable.
'Erika G. Bogenschild, Paul Lauritzen, and Linda Metzke (1988). "A Study' of TeacherAttrition." National Clearinghouse for Professions in Special Education, p. 1.
'Boe (1990).3-17
state departments of education, which are mandated by PL 94-142 to provide data on
their special education programs.'
At the outset, it is important to list several caveats concerning the employment
data discussed below. According to several researchers who have used and studied the
employment data reported in the Annual Report to Congress, the information provided by
the states on the number of special education teachers needed is not very reliable, for a
number of reasons. First, there are semantic issues as to who exactly is considered a
"special education teacher." Although OSEP specifically requests that only "fully-
certified"' teachers currently assigned to teach special education be classified as
"special education teachers," many states, due to definition differences, also include
teachers with temporary, provisional, and emergency certification who teach special
education. Thus, teachers who are less than fully-certified and who might be replaced by
fully-certified teachers are often included.
Second, some data requested by OSEP are not collected by many states because
the state agencies do not have a system capable of collecting the requested data; this
results in the reported figures being very rough estimates by state officials. Third, changes
in definitions of categories and the emergence of new categories have altered category-
specific supply information, making analysis of such data over ime suspect. For instance,
many of the teachers who are currently classified as "noncategorical" may have been
reported as "learning disabled" teachers prior to the widespread acceptance of the
"Eleventh Annual Report to Congres_s on the htbplementation of the Education of theHandicapped Act (1989), PP. 100- 103.
""Fully-certified," as defined by OSEP, is the completion of the graduate education andinternship training required by the state.
3-18
8,6
noncategorical classification. The result is that categories are not comparable over time or
between states. Fourth, researchers have noted that some of the data reported in the
Annual Report have been discrepant with cc-responding data released directly by the
states.
Finally, school districts may under-report the number of vacancies in special
education, resulting in inaccurate data at the state level. The explanation for this final
point rests in a "Catch-22" situation in which school districts are placed: reporting a large
number of vacancies is an admission that the locality is not in compliance with federal (and
often state) regulations. This, in turn, may increase the risk of litigation from parents and
elicit pr.3ssure from the state government. These fears create a clear incentive for school
districts to under-report vacancies, even when accurate information is available. This last
motive has led several researchers with whom we talked to believe that there may be a
substantial under-reporting bias to the demand and shortage data.
Despite these flaws, the statistics provided are the best national data available and
are widely used in research and in guiding policy. Moreover, our purpose in this section is
to provide only a general context for the examination of shortages, and the usefulness of
the information outweighs the potential risks. When used in other sections of this chapter,
the data will be used only to substantiate conclusions and information found in other
sources.
Exhibit 3.2 presents the trend in the number of special education teachers in the 50
states and the District of Columbia from 1976 to 1987." As the figure reveals, the
number of special education teachers employed has increased every year during this period
"Figures are reported on December of each year. See Annual Report to Congress onImplementation of the Education of the Handicapped Act, various years.
3-19
87
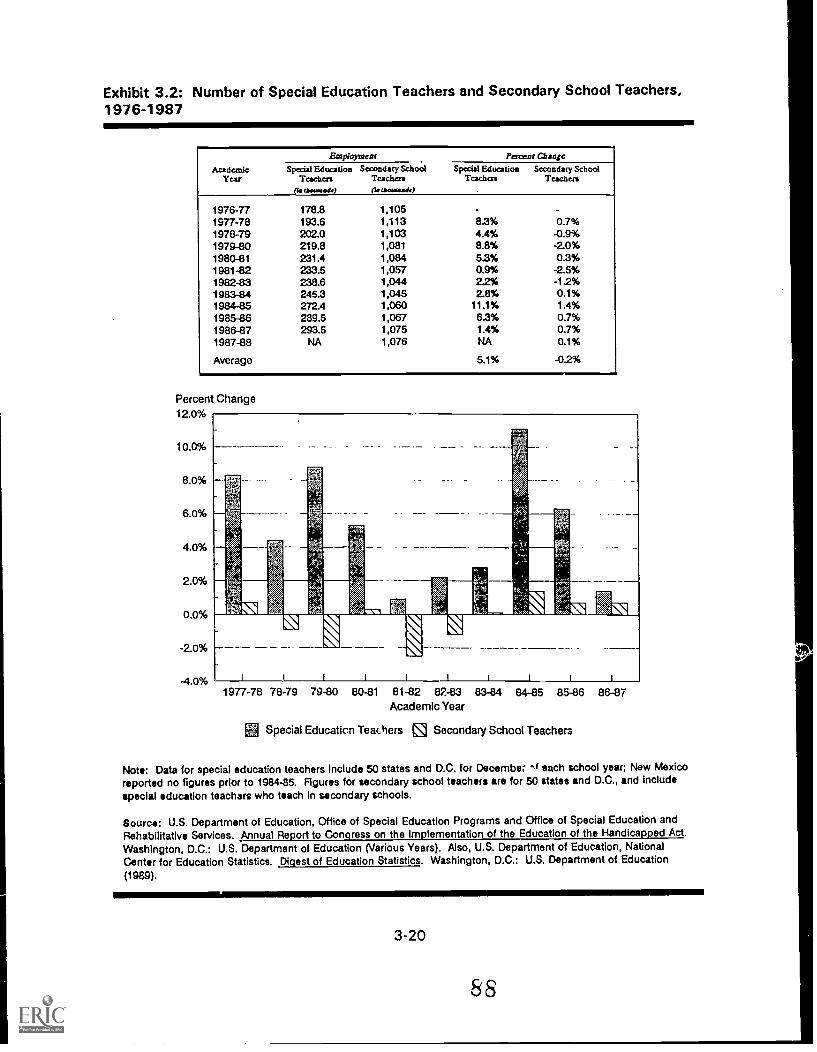
Exhibit 3.2: Number of Special Education Teachers and Secondary School Teachers,1976-1987
AcademicYear
Employment Parent ChangeSpecial Education Secondary School
Teachers TeachenthelteussattSpecial Education
TeachersSecondary School
Teachers
1976-77 178.8 1,105 -1977-78 193.6 1,113 8.3% 0.7%1978-79 202.0 1,103 4.4% -0.9%1979-80 219.8 1,081 8.8% -2.0%1980-81 231.4 1,084 5.3% 0.3%1981-82 233.5 1,057 0.9% -2.5%1982-83 238.6 1,044 2.2% -12%1983-84 245.3 1,045 2.8% 0.1%1984-85 272.4 1,060 11.1% 1.4%1985-86 289.5 1,067 63% 0.7%1986-87 293.5 1,075 1.4% 0.7%1987-88 NA 1,076 NA 0.1%
Average 5.1% -02%
Percent Change12.0%
I I i I 1 1 1 I
79-80 80-81 81-82 82-83Academic Year
Special Education Teathers Secondary School Teachers
Note: Data for special education teachers Include 50 states and D.C. for Decembe; -f each school year; New Mexicoreported no figures prior to 1984-85. Figures for secondary school teachers are for 50 states and D.C., and includespecial education teachers who teach In secondary schools.
Source: U.S. Department of Education, Office of Special Education Programs and Office of Special Education andRehabilitative Services. Annual Report to Congress on the Implementation of the Education of the Handicapped Act.Washington, D.C.: U.S. Department of Education (Various Years). Also, U.S. Department of Education, NationalCenter for Education Statistics. Digest of Education Statistics. Washington, D.C.: U.S. Department of Education(1989).
3-20
68
at an average annual rate of about 5.1 percent, resulting in an estimated 293,539 teachers
in 1987. In contrast, the overall number of secondary school teachers grew very little in
this period, with several years of decline and an average growth rate of about -0.2 percent
annually.
Although employment growth in special education teaching has been rapid over the
last decade, the future does not seem as optimistic. The Bureau of Labor Statistics
estimates that between the years 1988 and 2000, the total number of special education
teachers employed will increase 16 pert; Int, compared to the estimated 15 percent
increase for kindergarten and elementary smool teachers, 19 percent for secondary school
teachers, and 15 percent for all occupations.' This increase is also not expected to
match the increase in the number of college educated persons in the labor force, estimated
at about 30 percent for this period."
This expected growth in the employment of special education teachers, however,
by no means reflects the total number of entrants needed in this period; many more new
special education teachers will be needed to replace those who retire, leave the field, or
die (i.e., "replacement demand"). The estimated replacement demand for special
education teachers in this period is 14.2 percent annually, and accounts for most of the
"Refers to changes in civilian employment under the moderate scenario for economicgrowth between 1988 and 2000. The estimate of future employment growth for specialeducation teachers is based upon a set of assumptions about the growth in the number ofexceptional children, the percentage who are served, the expected intensity of service, andthe expected student-teacher ratios recommended by states. Deviation from theseassumptions would naturally alter this estimate. George Silvestri and John Lukasiewicz(Nov. 1989). "Projections of Occupational Employment: 1988-2000." Monthly LaborReview. Vol. 112(11), pp. 42-66.
"Lewin/ICF analysis of Bureau of Labor Statistics (BLS) and Current Population Survey(CPS) data. See also, U.S. Department of Labor, Bureau of Labor Statistics, Division ofLabor Force Statistics (July 1988). Educational Attainment of Workers: March 1988.Unpublished tabulations.
3-21
89
vacancies created in the field; this rate is the highest in teaching -- elementary and
secondary school teachers have rates of 11.1 percent and 9.1 percent, respectively.'
2. Earnings Trends
As discussed in Chapter 2, the rate at which wages in an occupation change is
often an important indicator of labor market dynamics, especially in the short run. In
occupations where market forces move freely (i.e., supply, demand, and wages are not
regulated by the government), a rapid rise in wages may indicate the presence of a
shortage. Wages in special education, as with many occupations supported by federal
funds, do not necessarily behave in this manner. Almost all of the experts and officials :13
interviewed said that generally wages for special education teachers are on the same
salary scale as those of all other teachers. In other words, a predetermined salary system,
rather than market forces, determines wages for special education teachers. It is
important nevertheless to observe the trends in the median wages for special education, as
compared to other professions.
Exhibit 3.3 shows the median weekly earnings in the United States for special
education teachers for the period 1983 to 1990, in comparison with (a) secondary school
teachers, (b) elementary school teachers, (c) persons with four or more years of college
education, and (d) all full-time.salary and wage workers over the age of 16. In 1983, the
median weekly earnings for special education teachers were $335, compared to $361 for
'Malcolm S. Cohen (1990). Study on the Feasibility of Using Labor Market Informa-tion for Alien Labor Market Certification Determination. Final Report for the U.S. Depart-ment of Labor, Employment and Training Administratipn, pp. 56-58.
3-22
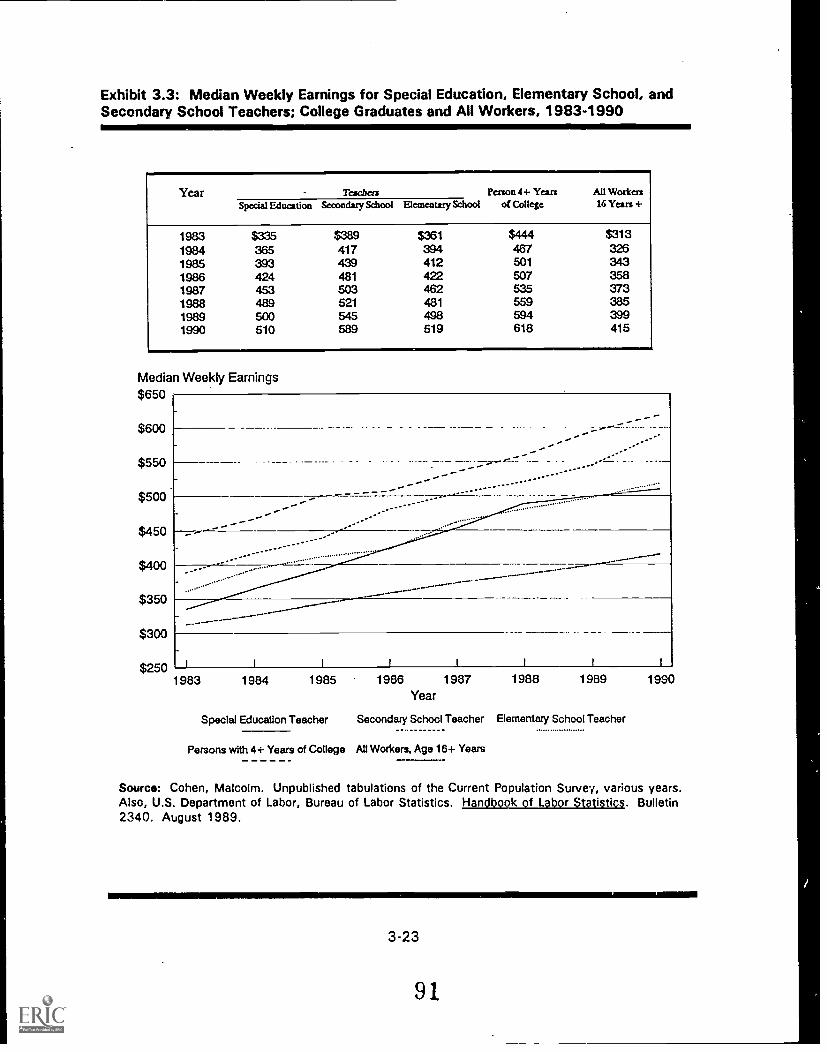
Exhibit 3.3: Median Weekly Earnings for Special Education, Elementary School, andSecondary School Teachers; College Graduates and All Workers, 1983-1990
Year Teachers Person 4+ Yearsof College
All Workers16 Years +Special Education Secondary School Elementary School
1983 $335 $389 $361 $444 $313
1984 365 417 394 467 3261985 393 439 412 501 3431986 424 481 422 507 3581987 453 503 462 535 3731988 489 521 481 659 3851989 500 545 498 594 3991990 510 589 519 618 415
Median Weekly Earnings$650
$600
$550
$500
$450
$400
$350
$300
.............-
...............
....................
+......................................
$250 I
1983 1984 1985 1986 1987Year
1988 1989 1990
Special Education Teacher Secondaq School Teacher Elementary School Teacher
Persons with 4+ Years of College All Workers, Age 16+ Years
Source: Cohen, Malcolm. Unpublished tabulations of the Current Population Survey, various years.Also, U.S. Department of Labor, Bureau of Labor Statistics. Handbook of Labor Statistics. Bulletin2340. August 1989.
3-23
91
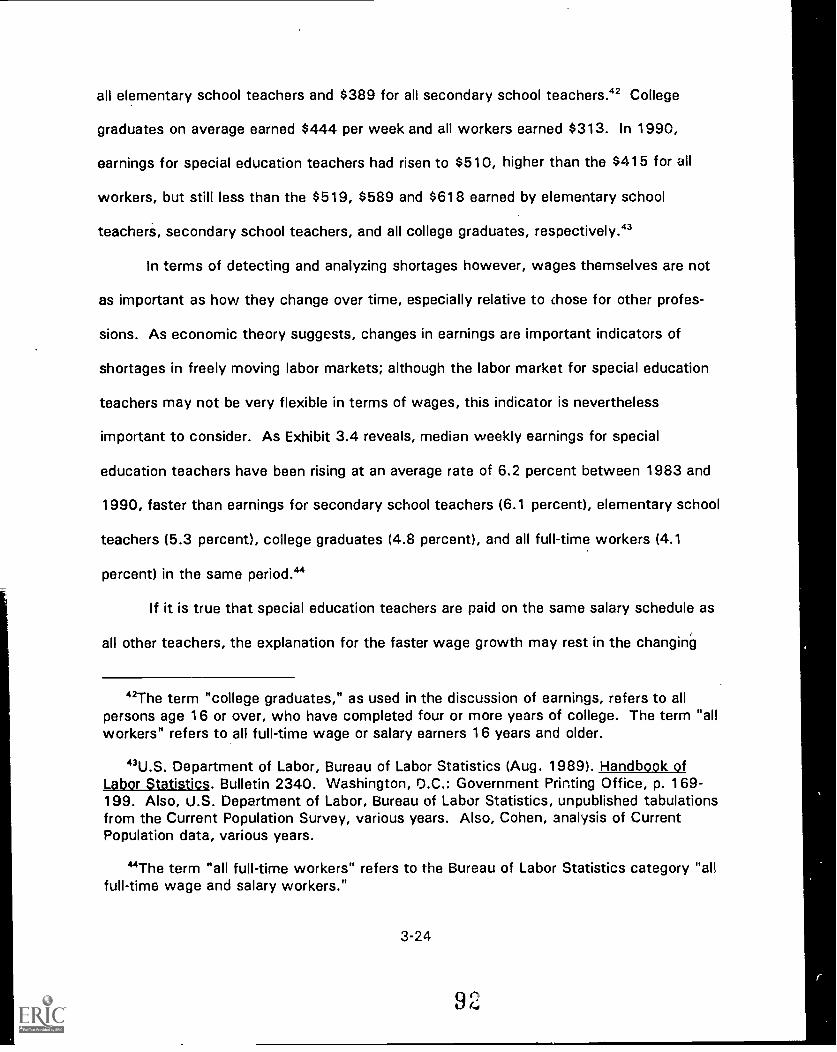
all elementary school teachers and $389 for all secondary school teachers.' College
graduates on average earned $444 per week and all workers earned $313. In 1990,
earnings for special education teachers had risen to $510, higher than the $415 for all
workers, but still less than the $519, $589 and $618 earned by elementary school
teacheri, secondary school teachers, and all college graduates, respectively.'
In terms of detecting and analyzing shortages however, wages themselves are not
as important as how they change over time, especially relative to chose for other profes-
sions. As economic theory suggests, changes in earnings are important indicators of
shortages in freely moving labor markets; although the labor market for special education
teachers may not be very flexible in terms of wages, this indicator is nevertheless
important to consider. As Exhibit 3.4 reveals, median weekly earnings for special
education teachers have been rising at an average rate of 6.2 percent between 1983 and
1990, faster than earnings for secondary school teachers (6.1 percent), elementary school
teachers (5.3 percent), college graduates (4.8 percent), and all full-time workers (4.1
percent) in the same period."
If it is true that special education teachers are paid on the same salary schedule as
all other teachers, the explanation for the faster wage growth may rest in the changing
"The term "college graduates," as used in the discussion of earnings, refers to allpersons age 16 or over, who have completed four or more years of college. The term "allworkers" refers to all full-time wage or salary earners 16 years and older.
"U.S. Department of Labor, Bureau of Labor Statistics (Aug. 1989). Handbook ofLabor Statistics. Bulletin 2340. Washington, D.C.: Government Printing Office, p. 1 69-199. Also, U.S. Department of Labor, Bureau of Labor Statistics, unpublished tabulationsfrom the Current Population Survey, various years. Also, Cohen, analysis of CurrentPopulation data, various years.
"The term "all full-time workers" refers to the Bureau of Labor Statistics category "allfull-time wage and salary workers."
3-24
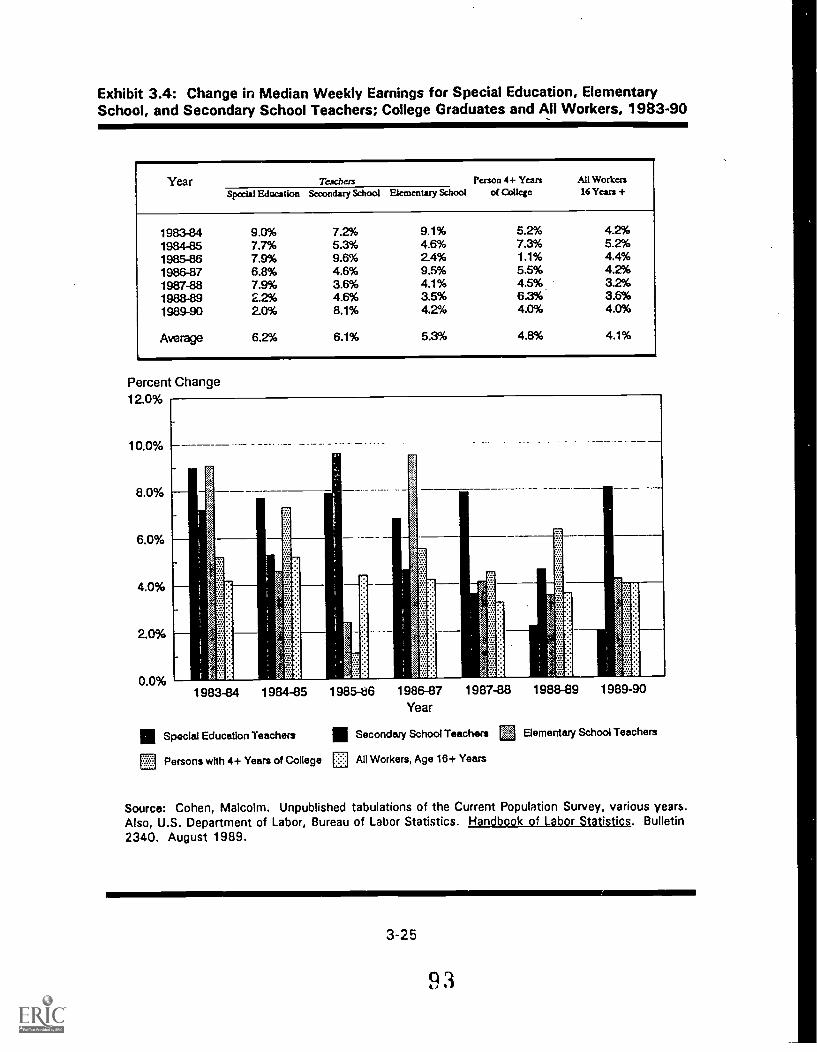
Exhibit 3.4: Change in Median Weekly Earnings for Special Education, ElementarySchool, and Secondary School Teachers; College Graduates and All Workers, 1983-90
Year Teach= Person 4+ Yearsof College
All Workers16 Years +Special Education Secondary School Elementary School
1983-84 9.0% 7.2% 9.1% 5.2% 4.2%1984-85 7.7% 5.3% 4.6% 7.3% 5.2%1985-86 7.9% 9.6% 2.4% 1.1% 4.4%1986-87 6.8% 4.6% 9.5% 5.5% 4.2%1987-88 7.9% 3.6% 4.1% 4.5% 3.2%1988-89 2.2% 4.6% 3.5% 6.3% 3.6%
1989-90 2.0% 8.1% 4.2% 4.0% 4.0%
Average 6.2% 6.1% 5.3% 4.8% 4.1%
Percent Change12.0%
10.0%
8.0%
6.0%
4.0%
2.0%
0.0%1983-84 1984-85 1985-86 1986-87 1987-88
Year
1988-89 1989-90
IISpecial Education Teachers III Secondary School Teachers 63 Elementary School Teachers
0 Persons with 4+ Years of College E All Workers, Age 16+ Years
Source: Cohen, Malcolm. Unpublished tabulations of the Current Population Survey, various years.Also, U.S. Department of Labor, Bureau of Labor Statistics. Handbook of Labor Statistics. Bulletin2340. August 1989.
3-25
9 3
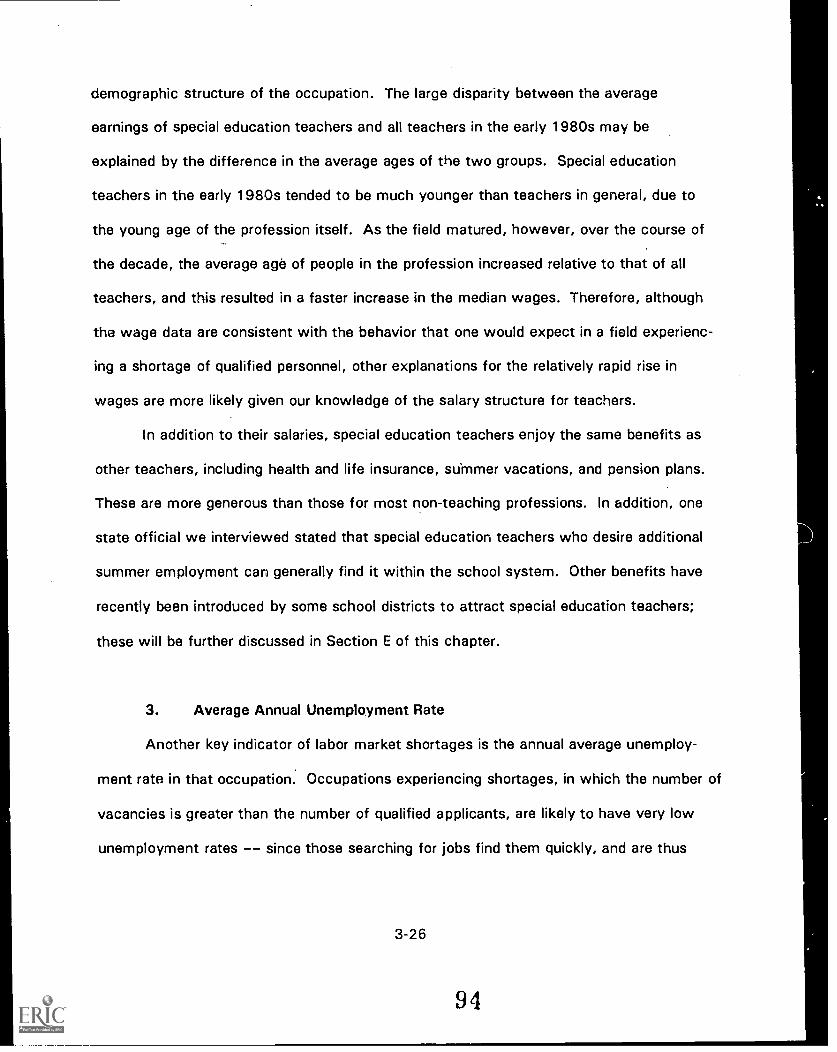
demographic structure of the occupation. The large disparity between the average
earnings of special education teachers and all teachers in the early 1980s may be
explained by the difference in the average ages of the two groups. Special education
teachers in the early 1980s tended to be much younger than teachers in general, due to
the young age of the profession itself. As the field matured, however, over the course of
the decade, the average age of people in the profession increased relative to that of all
teachers, and this resulted in a faster increase in the median wages. Therefore, although
the wage data are consistent with the behavior that one would expect in a field experienc-
ing a shortage of qualified personnel, other explanations for the relatively rapid rise in
wages are more likely given our knowledge of the salary structure for teachers.
In addition to their salaries, special education teachers enjoy the same benefits as
other teachers, including health and life insurance, suMmer vacations, and pension plans.
These are more generous than those for most non-teaching professions. In addition, one
state official we interviewed stated that special education teachers who desire additional
summer employment can generally find it within the school system. Other benefits have
recently been introduced by some school districts to attract special education teachers;
these will be further discussed in Section E of this chapter.
3. Average Annual Unemployment Rate
Another key indicator of labor market shortages is the annual average unemploy-
ment rate in that occupation. Occupations experiencing shortages, in which the number of
vacancies is greater than the number of qualified applicants, are likely to have very low
unemployment rates -- since those searching for jobs find them quickly, and are thus
3-26

unemployed for a very short period.' Exhibit 3.5 graphs the trend in the annual
unemployment rate for special education teachers, secondary and elementary school
teachers, college graduates, and all workers. The annual unemployment rate for special
education teachers averaged 1.9 percent between 1983 and 1990; the comparable rates
for secondary school teachers and elementary school teachers in this period were 1.7
percent and 2.0 percent, respectively." The unemployment rate in this period for all
college graduates was 2.4 percent and for all workers was 6.7 percent.' Although the
low unemployment rate for special education teachers indicates a tight labor market and is
consistent with the presence of a shortage, it does not conclusively prove it. For example,
both elementary and secondary school teaching, neither of which are experiencing
shortages, have similar unemployment rates.
D. Factors Contributing to a Labor Shortage
1. Presence of a Shortage
Most academic literature as well as officials we interviewed agreed that there is a
national shortage of special education teachers, although several did say that some special
education specialties may have surpluses in some geographic areas. Almost all
characterized the shortage as severe and persistent (i.e., lasting five years or more), and
"Cohen (1990), pp. 33-40.
"The period from which the average unemployment rate for persons age 25 to 64 withfour or more years of college education was calculated was March 1983 to March 1988;comparable 1989 data were not available.
'Analysis of Current Population Survey, various years as cited in Cohen, pp. 33-40.Also, U.S. Department of Labor (Jan. 1990). Employment and Earnings. Also, U.S.Department of Labor, Bureau of Labor Statistics (August 1989). Handbook of LaborStatistics. Bulletin 2340. Washington D.C.: Government Printing Office, p. 169. Theunemployment information represents the rate for persons between the ages of 25 and 64.
3-27
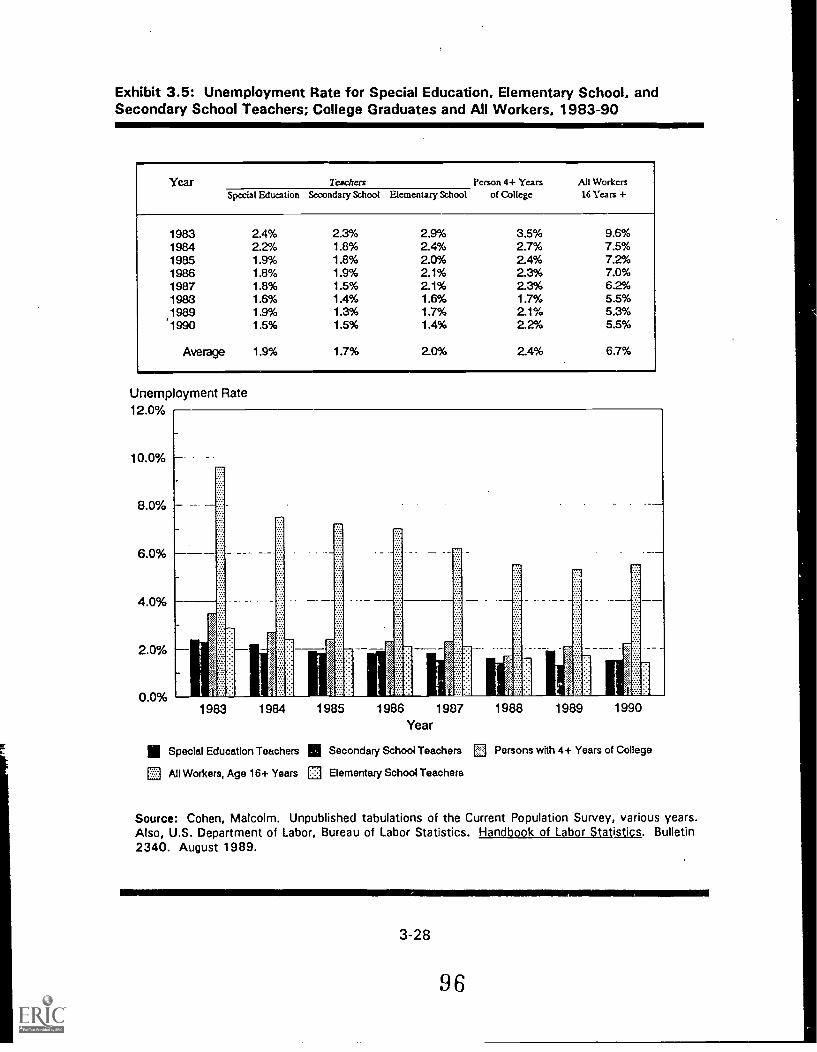
Exhibit 3.5: Unemployment Rate for Special Education, Elementary School, andSecondary School Teachers; College Graduates and All Workers, 1983-90
Year Teschers Person 4+ Yearsof College
All Workcrs16 Years +Special Education Secondary School Elementary Sc loot
1983 2.4% 2.3% 2.9% 3.5% 9.6%1984 2.2% 1.8% 2.4% 2.7% 7.5%1985 1.9% 1.8% 2.0% 2.4% 7.2%1986 1.8% 1.9% 2.1% 2.3% 7.0%1987 1.8% 1.5% 21% 2.3% 6.2%1983 1.6% 1.4% 1.6% 1.7% 5.5%1989 1.9% 1.3% 1.7% 2.1% 5.3%1990 1.5% 1.5% 1.4% 2.2% 5.5%
Average 1.9% 1.7% 2.0% 2.4% 6.7%
Unemployment Rate12.0%
10.0%
8.0%
6.0%
4.0%
2.0%
0.0%1983 1984 1985 1986 1987
Year1988 1989 1990
1111 Special Education Teachers IM Secondary School Teachers Persons with 4+ Years of College
All Workers, Age 16+ Years E] Elementary School Teachers
Source: Cohen, Malcolm. Unpublished tabulations of the Current Population Survey, various years.Also, U.S. Department of Labor, Bureau of Labor Statistics. Handbook of Labor StaVstics. Bulletin2340. August 1989.
3-28
96
expect the shortage to last for the next five years.
a. Severity of the Shortage
The Annual Report to Congress reports that 26,798 additional special education
teachers were needed in the United States for the 1986-87 school year, about nine
percent of the total number of special education teachers employed in that year." A
recent study on teacher shortages found that categories in special education comprised 5
of the top 10 teaching specialties with the most severe shortages." The categories
within special education found in this and other studies to have the most severe shortages
are multihandicapped (including deaf/blind), severe emotionally disturbed, severe mentally
retarded, visually impaired, hard of hearing/deaf, learning disabled, and speech
impaired.' Exhibit 3.6 presents the number of fully-certified teachers, by category, which
states report as needed, as a pPrcentage of fully-certified teachers employed in that
category in the 1986-87 academic year.' In general, categories dealing with more
severe handicapping conditions tend to have more severe shortages, while categories
dealing with a variety of mild handicapping conditions tend to have less marked
"The term "needed" represents the number of vacancies that occurred, even ifsubsequently filled, and the number of additional personnel necessary to fill positionsoccupied by less than fully qualified staff. Source: Annual Report to Congress on theImplementation of the Education of Handicapped Act, various years. The figures for thetotal number of teachers needed in 1986-87 include 50 states, D.C., Puerto Rico, and theinsular territories.
"Association of School, College, and University Staffing (ASCUS) (1988). TeacherSuoolv and Demand in the_Unitedatatga: A Look Ahea , ASCUS Research Report, p. 5.Other teaching specialties included Physics, Chemistry, Mathematics, Secondary ComputerEducation, and Elementary Computer Education.
'ASCUS (1988), p. 5. Also, McLaughlin, (1988), p. 35.
"These figures are for the 50 states, D.C., Puerto Rico, and the insular territories.
3-29
9 7
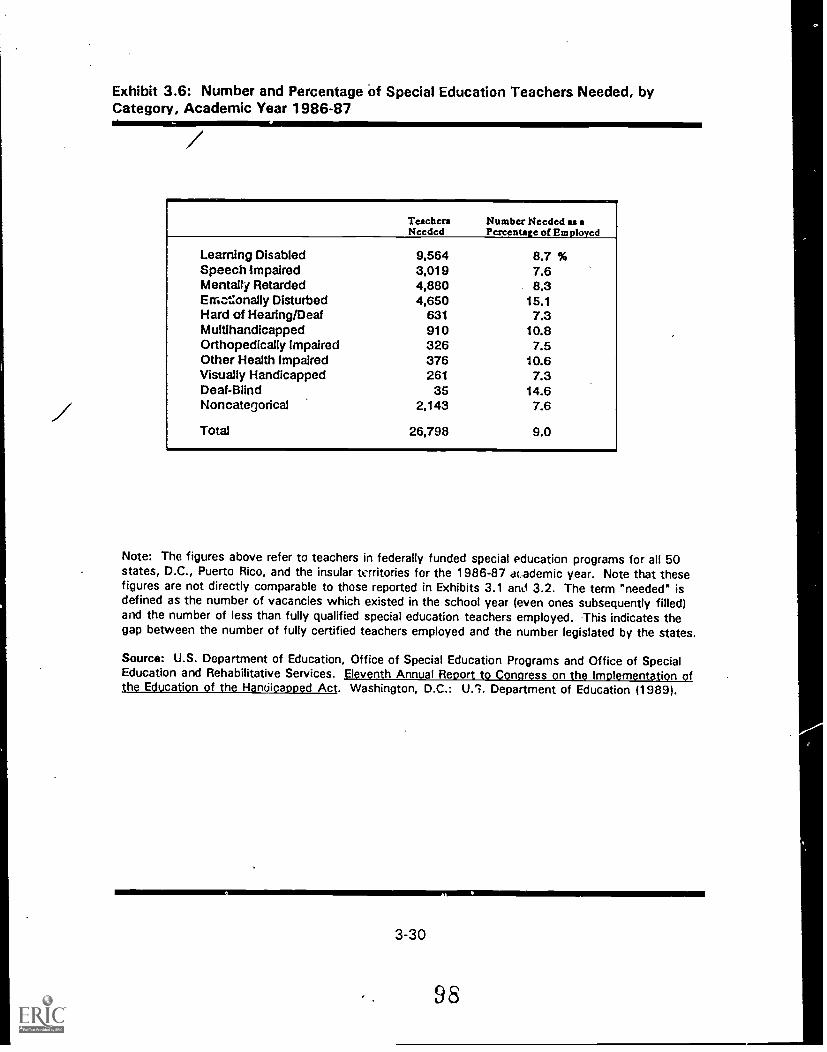
Exhibit 3.6: Number and Percentage -of Special Education Teachers Needed, byCategory, Academic Year 1986-87siume. 4111111111V
TeachersNeeded
Number Needed as aPercentate of Employed
Learning Disabled 9,564 8.7 %Speech Impaired 3,019 7.6Mentally Retarded 4,880 8.3Erfictonally Disturbed 4,650 15.1Hard of Hearing/Deaf 631 7.3Multihandicapped 910 10.8Orthopedically Impaired 326 7.5Other Health Impaired 376 10.6Visually Handicapped 261 7.3Deaf-Blind 35 14.6Noncategorical 2,143 7.6
Total 26,798 9.0
Note: The figures above refer to teachers in federally funded special education programs for all 50states, D.C., Puerto Rico, and the insular territories for the 1986-87 ac ademic year. Note that thesefigures are not directly comparable to those reported in Exhibits 3.1 and 3.2. The term "needed" isdefined as the number of vacancies which existed in the school year (even ones subsequently filled)and the number of less than fully qualified special education teachers employed. This indicates thegap between the number of fully certified teachers employed and the number legislated by the states.
Source: U.S. Department of Education, Office of Special Education Programs and Office of SpecialEducation and Rehabilitative Services. Eleventh Annual Report to Conaress on the Implementation ofthe Education of the Hanciicapped Act. Washington, D.C.: U.1. Department of Education (1989).
3-30
96

shortages.'
b. Geographic Distribution of the Shortage
Considering the wide variety of policies affecting special education among states, it
is not surprising that the shortage of special education teachers is not equally severe
throughout the nation. Several studies that have analyzed the patterns of shortages in
special education have found that:
States in the West (e.g., California, Nevada, Utah, and Arizona), SouthCentral (e.g., Texas and Oklahoma), and Southeast (Virginia and Florida)report the most severe shortages.
The Great Lakes and Middle Atlantic states report less severe shortages.This may be attributed to the large number of teacher training institutions inthose areas.
Alaska. the state with the highest average teacher salaries, reports the leastshortage of special education teachers."
Although several states have reported surpluses of special education teachers,
these are generally located in suhurban and prosperous urban areas of the states and tend
to be of teachers specializing in mild handicapping conditions such as Speech Impairment,
Mild Noncategorial special education, Learning Disabilities, and Mild Mentally Retarded."
Only two states report general surpluses in most geographic areas: Rhode Island and
Pennsylvania.
52Annual Report to Congress on the Implementation of the Education of theHandicapped Act, various years. Also, McLaughlin (1986), PP. 35-37.
"McLaughlin (1986), pp. 35-37. Also, ASCUS (1988), p. 6.
"McLaughlin (1986), p. 38.
3-31
99
2. Demand-Side Factors
An understanding of the factors influencing demand for special education teachers
is particularly important in education, as the traditional determinants of demand for labor
relevant for private firms, such as the revenue and costs per worker, do not apply.'
This section will discuss the factors, and their role in determining the size and nature of
the shortage in special education teaching.
a. Class Si 7es
The demand for special education teachers is governed, in a broad sense, by an
array of federal and state legislation that mandates "a free and appropriate" education for
all handicapped children." To comply with these fundamental requirements and to
maintain their own quality standards for special education, state educational agencies have
developed guidelines to control several variables regarding special education. The most
important of these are the student-teacher ratios suggested for each handicapping
category. These guidelines, reflecting each state's educational philosophy, are a major
determinant of the total demand for special education teachers, linking the number of
teachers employed to the number of exceptional children in the state." School districts,
in turn, base their hiring decisions on these guidelines. A portion of the growth in demand
that goes unfilled in the shortage stems from the changes in these ratios over time,
"This is not completely true; the demand for special education teachers by privateschools and institutions may be determined to a limited degree by competitive marketdynamics, but for the sake of simplicity this aspect will not be considered here. SeeRonald G. Ehrenberg and Robert S. Smith (1988). Modern Labor Economics: Theory andPublic Policy. Third Edition. Glenview, Illinois: Scott, Foresman, and Company, p. 69.
"The Education for All Handicapped Children Act (EHA). See page 3-3 of this chapter.
"See McLaughlin (1986), p. 73. In many states, the ratios provided at the state levelare mandated rather than suggested; in these cases, variation from the requirementsdemands formal waivers.
3-32
10 0

reflecting higher standards and "an improved understanding" of, or changing perceptions
of, effective teaching practices for exceptional children.
Although changes in these ratios thrnot cause shortages any more than an increase
in demand for furniture causes a shortage of carpenters, the increasing demand contrib-
utes to the persistence of the shortage--often aggravating the inability of the market to
return to equilibrium. Conversely, shortages of teachers have an effect on adherence to
the ratios; one study, finding that shortages increase the number of waivers granted to
districts to deviate from established ratios, concluded that it "is clear that ratios are still
being adjusted to accommodate both manpower shortages and economic constraints, and
the impact on program quality is unknown."58
b. Early Intervention
Demand is also influenced by policies designed to identify exceptional children at an
increasingly young age, with the belief that introduction of special education for many
handicaps is most effective in young children. This increase in the practice of early
identification and intervention also contributes to an increased demand for special
education teachers.
c. Fiscal and Budgetary Constraints
As with all public programs, fiscal and budgetary issues have considerable influence
on the demand for special education teachers. School districts hire based upon the
number of unfilled budgeted vacancies and the number of teachers needed to replace less
than fully-qualified teachers. Budget cuts can significantly reduce the overall number of
teachers needed and thus might reduce the size of_ the shortage. Likewise, an increase in
federal or state funding for special education teachers may prompt decreases in student-
"McLaughlin (1976), p. 77.
3-33
101
teacher ratios and increases in the number of budgeted vacancies, thus exacerbating the
shortage. It has been difficult, however, to isolate the independent effect of budgetary
factors; schools and states, in simultaneously changing other factors affecting teacher
demand during a period of budgetary change, obscure the impact of fiscal-budgetary policy
on demand.
Mainstreaming Issues
Another major factor that affects school districts' hiring decisions is the degree to
which they mainstream students. Educational research and several resulting state
mandates specify that exceptional children must be placed in the "least restrictive environ-
ment" in which they can effectively learn. More specifically, this may mean that special
education programs must "provide for education of the exceptional pupil, to the maximum
extent appropriate, with other pupils who do not have handicapping conditions."' For
example, a student with a mild learning disability, requiring only a few special education
classes, would be prevented by this mandate from being placed full-time in a special
education class and isolated from mainstream peers. This mandate, however, provides
plenty of latitude regarding the degree of special educational intervention that schools can
provide -- and consequently the number of special education teachers necessary to teach
those students. Although the impact of mainstreaming policy on the current size and
severity of the shortage is uncertain, one expert whom we interviewed stated that as
education research makes the advantages and disadvantages of mainstreaming more clear,
the impact of mainstreaming policy on the future supply and demand for special education
teachers is likely to be extremely significant.
"New York State Education Department, Office for Education of Children withHandicapping Conditions (Feb. 26, 1987). Regulations of the Commissioner of Education,Subchapter P: Part 200--Children with Handicapping Conditions, p. 2.
3-34

3. Supply-Side Factors
Our interviews revealed a number of significant factors affecting the supply of
special education teachers, most concerning the demands placed on and the opportunities
available to both special education teachers and those seeking to enter the profession.
Attracting more individuals into special education training programs and keeping fully-
certified special education teachers in the field seemed to our interviewees to be crucial to
solving the shortage. One expert stated that "all evidence suggests that there's a big pool
of qualified special education teachers who aren't teaching special education. Many are
teaching general education, others work in areas completely unrelated to education simply
because they don't want to move to areas where the jobs are." In this section we discuss
the importance of various aspects of the supply of special education teachers in
determining the nature of the shortage.
a. Attrition
The most often cited factor affecting the supply of special education teachers is the
high attrition rate. Unlike most fields, in which exit from the profession is often due to
retirement or family commitments, special education seems to have a particularly high rate
of "burnout" due to the pressures and responsibilities inherent in the profession. In many
states, the number of special education teachers necessary to replace teachers who leave
prematurely is much greater than that of teachers needed due to changes in student
population, changes in policy, retirement, or death. The literature suggests that the
average national rate of attrition for special education teachers is among the highest for
teaching specialties -- between 8 and 12 percent annually; one study based on a national
sample of teachers estimated it at 9.7 percent in public schools and 18.1 percent in
3-35
103
private schools.' The comparable statistics for all teachers are 4.1 percent and 8.7
percent, respectively.' For beginning emotional disturbances teachers, the rate of
attrition due to burnout and related factors has been found to be as high as 21 percent at
the end of the first year of employment with up to 53 percent having left by the end of the
fifth year.' These estimates are further substantiated by statewide studies of attrition in
Wisconsin (13.7 to 15.6 percent), Michigan (10 percent), Illinois (12 percent), and Kansas
(9.9 percen0.63
Burnout is a "syndrome of emotional exhaustion and cynicism that frequently
occurs among individuals who do 'people work'---spend considerable time in close
encounters with others under conditions of chronic tension and stress."" It is
characterized by discouragement, loss of morale, and isolation, often due to job or work-
related factors including stress, lack of feedback concerning progress and success, and
"Also, Mary Rollefson (1991). "Teacher Turnover: Patterns of Entry to and Exit fromTeaching." NCES Presentation to the 1990 Annual Meeting of the American EducationalResearch Associates, pp. 2-3.
'For the figures reported, "attrition from the profession" is defined as the number ofteachers holding full-time positions last year who are no longer teaching in that school lessthose known to be teaching elsewhere. See Rollefson (1991), p. 2.
Morsink (Feb. 1988). "Changes in the Role of Special Educators: PublicPerceptions and Demands." Exceptional Educators Quarterly, pp. 15-25.
"Joseph Gomez (1986). Special Education Personnel in Michiaan Public Schools 1978-,U. Lansing, Michigan: State Board of Education; and Illinois Board of Education (4981).Illinois SuPPly and Demand for Special Education Personnel. Springfield, Illinois: StateBoard of Education. 1981; Paul Mc Nab (1989). "Attrition of Special Education Personnel inKansas." National Clearinghouse for Professions in Special Education, p. 8.; and ErikaBogenschild, Paul Lauritzen, and Linda Metzke (1988). "A Study of Teacher Attrition."National Clearinghouse for Professions in Special Education, p. 4. These attrition figuresare for all teachers leaving employment in their certification category within the state,regardless of reason.
"Jennifer M. Platt (1990). "Why Teachers Are Leaving Special Education." TeacherEducation and Special Education. 13(3-4), p. 192.
3-36
excessive responsibilities and papei work.' The causes of burnout in special education
have been attributed to several important aspects of the field:' The lack of administrative support in dealing with the paperwork andregulations imposed upon special education by state and federal governmentagencies is often cited. The desire by states to improve and monitor specialeducation programs has led to greater accountability on the part of specialeducation teachers, requiring them to record and report the progress madeby each individual student. Special education departments in schools,usually organizational appendages of the mainstream programs in schools,often lack skilled_administrators to assist teachers in dealing with theseburdens.
Fear of possible litigation placed on teachers by increasingly watchfulparents who are intent on ensuring that their children's needs are served.
Special education teachers in categories serving severely emotionallydisturbed or mentally retarded students have higher burnout rates due tolong periods of exposure to students each needing individual attention andthe frustrations derived from a perception of helplessness in effectivelydealing with their students' conditions.66
b. Certification Reouirements
A factor that can greatly affect the number of out-of-state entrants is the lack of
uniformity among state certification requirements. Special education teachers who
migrate to a state in which they are not certified must often undertake additional training
to fulfill the new state's requirements." This burden of additional training discourages
geographic mobility of special education teachers for new entrants, current teachers, and
those returning to the field. In states where in-state training of new entrants and trained
"H.N. Chandler (1983). "The Loneliness of the Special Education Teacher." Journal ofLearning Disabilities, 16(2), pp. 126-127.
"Chandler (1983), pp. 126-127.
"Special education tedchers who find jobs in states other than the ones in which theyare currently certified are usually granted temporary certification until they fulfill all theadditional requirements.
3-37
105

re-entrants meets only a small portion of the total demand for teachers, the impact of such
disincentives may be significant.
Several states are currently attempting to solve this problem through reciprocity
agreements -- which allow teachers with certification in one state to automatically obtain
certification in another state with neighboring states. States believe such agreements
will increase the portability of special education training and encourage migration to states
with the most severe shortages. Some researchers and associations have also argued for
national certification for special education teachers. This, they argue, will establish national
standards and categories for special education teaching, provide for uniformity in training
and education requirements, and encourage more mobility between jurisdictions."
c. Teacher Education and Training
Several key factors wer(., mentioned during the interviews regarding the education
and training of special education teachers. Many pointed out that one reason not enough
people enter special education is the length of the training: in order to obtain certification,
many states require a total of five to six years of undergraduate education, graduate
education, and internships -- more time than it takes to obtain certification in general
education. Although none of those whom we interviewed advocate shortening training,
they were clear in listing the long training period as a factor in many students' decisions
not to enter the field.
d. Teacher Wages
From an economic perspective, the prevailing salary for special education teachers
seems an obvious area of interest. As discussed in the previous section, special education
teachers generally earn the same as their general education peers, despite the additional
"Strosnider and Little (1988), pp. 168-171.
3-38
0 6

stresses and burdens placed on special education teachers and the greater training required
of them. There is a lack of differentials in wages that in other professions would compen-
sate for the added disadvantages and responsibilities.
One method of determining the impertance of wages in attracting and retaining
special education teachers is to observe employers who offer financial incentives to attract
teachers. One state director for special education commented that several counties in her
state have been successful in attracting out-of-state special education teachers with
starting bonuses and higher wages, and that one of these counties currently reports no
shortage of special education teachers. It is also interesting that Alaska, the state with
the highest average teacher salaries, and Wyoming, with relatively high teacher salaries,
reported virtually no shortagiof special education teachers in 1986.'
The overall opinion among the experts we spoke with on the importance of teacher
salaries as a factor in causing or aggravating the national shortage in special education
was mixed, reflecting each person's institutional background and preferences. While some
argued that salary increases for special education teachers were not the solution to the
shortage, others insisted that salary differentials "would certainly attract individuals into
the field and provide incentives to stay."" All of them agreed, that considering all the
administrative and emotional stress placed on special education teachers, "it is not
surprising that for the same amount of money many special education teachers find it
easier to move into general teaching." Most also agreed, however, that salary differentials
between teachers would be very difficult to institute and implement given the nature of
"McLaughlin (1986), p. 48.
"Also, Settler and Settler (1985), p. 99.
3-39
107
the teaching profession and the wage negotiation process between teachers and
employers.
e. Geographic Disparities
Most of those whom we interviewed, and the literature as well, indicate that the
shortage, although nationwide, is more severe in certain geographic areas. Rural and inner
city districts, as well as districts far from teacher education institutions, generally report
more severe shortages than suburban districts. This is especially true in low incidence or
high severity categories such as visually impaired, deaf-blind, severe emotionally disturbed,
and severe mentally retarded.' Two major reasons are offered:
Spousal Considerations: Special education teachers who are married tend toavoid jobs in rural areas due to the employment considerations of theirspouses. "The teacher in a family is most often not the primary wageearner, which makes it unlikely for them to relocate to where there is a needfor teachers. One study found that the careers of over 60 percent of pre-service teachers are affected by the careers of significant others."'
Economic Considerations: Many special education teachers avoid jobs ininner city areas due to the high cost of living in urban environments. Innercity school districts, which generally do not offer compensating differentialsfor the disadvantages and dangers of teaching in urban schools relative tosuburban schools, find it more difficult to hire fully-certified special educationteachers.
f. Prestige of the Teaching Profession
A final factor cited as discouraging people from entering special education teaching
reflects the broad pattern of social attitudes toward the entire teaching profession. A
'Settler and Settler (1985), p. 101.
"P. Lauritzen (1990). "Wisconsin Teacher Supply and Demand: An Examination ofData and Trends, 1990." Madison, Wisconsin: Wisconsin Department of PublicInstruction. As cited in Paul Lauritzen and Stephen J. Friedman (Winter 1991). "Teacherswith Emotional/Behavioral Disorders: Education's Greatest Challenge." Preventing SchoolFailure. Vol.35, No. 2., p. 14.
3-40

number of the persons we interviewed expressed concern over the loss of prestige that
was formerly attached to teachers and teaching; they felt that this has led to a lower
number of talented individuals entering the profession, which in turn has led to a decline in
the quality of education as well as to shortages in fields such as special education.
E. Adjustments to Shortages
This section discusses what various groups are doing in response to the shortage of
special education teachers. The actions taken and policies adopted by employers and
government can have a variety of effects, from permanently eeducing the severity and
scope of the shortage to temporarily alleviating it for a particular geographic, area or
category. We will examine the extent to which many of these actions have been
successful in the past and the lessons learned from them.
1. By Employers
Employers are the ones most immediately affected by the shortage; they cannot
hire enough certified special education teachers, and as a result, they run the risk of being
sanctioned for noncompliance with state and federal regulations and they expose
themselves to litigation from watchful parents. For these reasons they are the ones most
compelled to take action.
a. Use of Temporary Certification
The first and easiest thing for employers to do in the face of a shortage of fully-
certified special education teachers is to hire individuals with temporary certification.
hese are often general education teachers working in the same school districts who have
some desire to move into special education, and thus are transferred to special education
3-41
109

classes. They may also be special education teachers who are certified in other states and
are still unable to immediately obtain certification in the state where they are employed.
According to those whom we interviewed, schools facing shortages often simply continue
to hire these teachers and have them renew their certifications indefinitely. One official
noted that between 2 and 20 percent of all special education teachers in her state were
not fully-certified. One study states, "clearly it is the primary means of .dealing with
personnel shortages and, at the same time, meeting the mandate for services."'
States tacitly allow this "revolving door" policy because they have no alternative
to not allow or to place limits on the recertification of temporary certificates might only
result in exceptional children becoming more under-seived. Temporary certification does
not, however, generally affect the long-term shortage for certified teachers, but rather
staves off the shortage for employers in the short term. One interviewee commented that
this was simply a "band-aid" reaction to the shortage, and that it tended to be ineffective
in dealing with the shortage in the long term.
b. More Aggressive Recruiting
As discussed earlier in this chapter, some school districts have also begun to
aggressively recruit special education teachers on a national basis, both new entrants and
those teaching in other states. In addition to pursuing traditional recruiting methods, some
participate in electronic bulletin boards and employment clearinghouses, hire teacher
"headhunting" firms to find special education teachers, and travel to universities and job
fairs to attract promising applicants to their districts. In addition to improving their
networks and vacancy announcements, employers sometimes offer promising applicants
expense-paid trips to visit schools, assist in employment searches for spouses, and help to
"McLaughlin (1986), p. 46.
3-42
1 0

find affordable housing. Some particularly innovative programs have even advertised on
television in an effort to attract the large pool of trained teachers who have left the profes-
sion.
The results of such efforts have evidently been effective in alleviating shortages for
selected districts. Several districts in Florida, which have stepped up their recruiting
efforts for special education teachers, have reported some success in alleviating shortages;
one currently reports no shortage. A disadvantage of such policies, however, is that by
reducing the shortage for one employer, aggressive recruiting tactics -- targeted at existing
special education teachers -- only increase the shortage for other employers in other areas,
offeriA a zero-sum solution.
c. Funding Teacher Training
Education officials whom we interviewed said that some schools have effectively
dealt with shortages by funding special education training for general education teachers
whom they currently employ. The advantages of such incentives are obvious: the
investment made saves the school district subsequent recruiting costs, as they have a
reasonable assurance that the teacher will return to work in the same district after
completion of the training. The disadvantages, however, are that such a policy, as a
method of alleviating serious shortages of teachers, is more expensive for employers than
recruiting, and not immediate in its impact (i.e., the district would have to wait several
years to get any return on that investment). This strategy is usually most effective for
teachers who have completed some or most of the requirements for special education
certification and for whom the investment in time and money is not great.
3-43
1 11

d. Offering Rotation into General Education
Another useful long-term strategy that schools are applying to reduce the attrition
and burnout rates among special education teachers is to transfer special education
teachers into general education every few years. This policy of offering a variety of
teaching capacities is thought to lower the alienation that many special education teachers
feel from the general teaching staff, and help "return a healthy perspective" to teachers
who have been teaching special education for long periods. The disadvantage of such a
strategy is that it actually increases the severity of the shortage in the short term, as
qualified teachers temporarily exit special edutation to enter general education.
e. Signing Bonuses and Financial Incentives
One interviewee cited examples of employers who offer signing bonuses as high as
$1,000 to qualified teachers willing to relocate to their school district. in addition, some
employers offer to help pay a portion of teachers' educational loans (up to $10,000 over
four years of employment). Our interviewees also cited examples of employers who offer
wages at a higher level in the pay structure for some special education teachers,
particularly those certified in areas of critical shortages such as severely emotionally
handicapped and severe mental retardation; these salary-based incentives, however, are
generally rare. Although such financial incentives are similar in many ways to wage
increases (and in fact, they do increase the effective salary for the recipient), there are
several notable differences: first, one-time bonuses are much less expensive for employers
than permanent salary increases; second, they inspire less opposition from other teachers,
who might have otherwise protested increases for a favored teaching specialty; and third,
offering one-time bonuses is an easier practice to end once the shortage is over, and
therefore have less of an effect on graduating students' decisions to enter the profession.
3-44
112

2. By Government
Governments, both at the state and federal level, have also taken steps to deal with
shortages in special education. Government policies differ from those of employers in both
intent and direction -- they are designed to alleviate the shortage on a broader scale rather
than for a specific employer or geographic area. Government policies revolve around four
basic goals: (1) to collect accurate information on the number of special education
teachers available and the number of vacancies available; (2) to adjust key policy variables,
such as recommended student-teacher ratios and certification requirements; (3) to provide
funding to universities to expand special education programs and to employers to assist
them in adhering to policy regulations; and finally, (4) to coordinate their policies and
programs with those of other states, reducing the barriers to interstate mobility for special
education teachers.
a. improved Data Collection
A major government initiative, partly in response to the labor shortage in special
education, is the move to improve the data on special education personnel and programs,
and is currently being undertaken by the National Center for Education Statistics and the
Office of Special Education Programs in the U.S. Department of Education. This attempt
to obtain more accurate information on the number of special education teachers who are
educated, trained, certified, and employed, as well as those employed with temporary
certificates, is a necessary precursor to any effective policies implemented to alleviate the
shortage. In an effort to focus on those who leave special education, government-funded
rasearch is also addressing the issues of burnout and other reasons for attrition.
3-45
113

b. Coordination of Special Education Programs
In an effort to lower the barriers that discourage special education teachers from
moving between states, several state governments and government-funded programs are
working towards the development of a single lexicon of categories in which special
education teachers can be certified (allowing teachers to easily evaluate certification types
between states) and the development of interstate reciprocity in special education
certification, allowing teachers to migrate between states and immediately be qualified for
certification. Such "portability" of special education certification on a national level has
also been advocated, with arguments that it would both increase mobility of teachers to
states most in need, as well as make special education teaching more attractive to
prospective special education teachers and fully-certified special education teachers who
have left the field. A number of states have already engaged in reciprocity agreements
(seven Northeast states are currently participating), and all indications point toward
increases in such agreements.
c. Expansion of Alternative Certification Programs
The final key response by state governments to the shortage of special education
teachers is the expansion and acceptance of alternative certification programs for special
education teaching. As discussed earlier, alternative certification revolves around a set of
requirements for teachers and professionals who wish to enter special education teaching
and have had no prior education or training in special education. Alternative education
requirements allow relatively easy and rapid entrance into the profession and are thus
expected to increase the supply of new entrants into special education. Twenty-four
states currently have sponsored or planned alternative certification programs, and although
there is no consensus on the overall quality of graduates that such programs produce,
3-46
114
alternative certification appears to be a gaining credibility as an effective method of dealing
with long-term shortages in the field.
F. Conclusions and Recommendations
1. Conclusions
As examined in this chapter, the market for special education teachers exemplifies
many of the institutional rigidities and supply/demand dynamics described in Chapter 2 as
influencing or characterizing occupational labor shortages. It.is a market characterized by
institutionally determined wages and employment demand, long and rigorous training
requirements, large amounts of paperwork and regulation, and a stressful work
environment. The consequence is that special education teaching has among the hignest
rates of attrition for teaching specialties, with many of those leaving the field entering
general teaching. Special education teachers, of whom a greater proportion are women
(as compared to general education teachers), are also less likely to be the primary wage
earners in the household, and thus their migration patterns tend to be heavily influenced by
their spouses, toward suburbs and middle-class urban environments and away from inner
cities and rural areas. This has resulted in several states reporting surpluses in suburban
areas and critical shortages in rural and inner city school districts. Finally, the persistence
of geographic shortages in special education teaching is aggravated by the barriers to
occupational mobility between states, caused by the differences in certification require-
ments.
Most of the researchers and government officials whom we interviewed emphasize
that the shortage is caused and exacerbated by a host of factors, and that there is no
single policy that will eliminate it; rather, they point to a number of key issues that need to
3-47
115
be addressed, each of which would affect the severity or distribution of the shortage.
Some of these recomifiendations, they noted, are currently being implemented. Several
others are listed below.
2. Recommendations
a. Radical Overhaul of the Education System
The broadest prescription offered by several of those we interviewed was to effect
"a radical shift" in the service delivery system -- that is, the method by which students
are provided with special education services. Although the specific steps necessary were
not spelled out, they made clear that such a change would involve both mainstream and
special education, and would result in special education as the product of a closely knit
network of parents, mainstream teachers, special education teachers, and school
administrators, rather than that of policymakers and administrators alone.
b. Simplification of Regulations
Other broad changes suggested include limiting or reducing the legal and regulatory
burdens placed on special education teachers. Although many restrictions and standards
established for special education ensure adequate and appropriate teaching instruction for
exceptional children, the overwhelming paperwork and constraints placed on special
education teachers was cited as a major factor influencing attrition from the field and in
reducing the time special education teachers spend teaching. One of the experts we inter-
viewed, as well as an article on shortages of emotional/behavioral disorders teachers,
suggests that a reduction in the mandated paperwork requirements for special education
teachers would increase time spent teaching.' A reduction in the complexity and degree
"Paul Lauritzen (1990), pp. 14-15.
3-48

of regulation imposed upon special education teachers, they argue, may also encourago
qualified teachers who have left the profession to return.
c. More Administrative Support for Special Education Teachers
Another important prescription relating to the administrative and regulatory
requirements placed upon special education teachers was that schools and school districts
(employers) provide special education teachers with administrative support specific to the
needs and requirements of special education. These special education admktistrators must
understand.the regulatory and legal facets of special education, and must be able to
reduce the burden that special education teachers face. The impact of this, several of our
interviewees noted, might be a reduced rate of attrition due to burnout, and would allow
teachers to focus on teaching exceptional children and not on adhering to regulatory
requirements.
d. Integration of Special Education into Mainstream Education Training
Another more specific step that our interviewees suggested was to require some
special education courses and training for all teachers. This would allow general education
teachers to better identify and understand the special disabilities and challenges that some
of their students face, as well as encourage more potential general education teachers to
obtain certification in special education. In addition, such a shift would decrease the
alie nation felt by special education teachers from the general teaching faculty. The
disadvantage of such a proposal, our interviewees pointed out, is that done to any
substantial extent, such a program would increase the length and cost of teacher training
and would certainly be met with opposition.
3-49
117

e. Increases in Wages
The suggestion that wages be raised in order to reduce the special education
teacher shortage evoked a mixed response. Some of those we interviewed argued that
attrition from the field was not in any significant way due to insufficient wages but to a
host of other burdens and stresses. Others disagreed; they stated that teacher attrition to
general education and the lack of teachers in rural and inner city areas might be reduced if
special education teachers were paid compensating differentials relative to mainstream
teachers. Furthermore, increasing wages would both attract more teachers into special
education and would encourage special education teachers to remain in the field.
Empirically, one official whom we interviewed cited several examples of counties
successfully averting shortages by offering bonuses and other financial incentives.
Moreover, one study attributed Alaska's virtual lack of a shortage and Wyoming's
relatively mild shortage to the high salary level of Alaska and Wyoming teachers. All
agreed, however, that implementation of salary differentials for special education teachers
alone would be difficult, given the nature of the teacher salary determination process.
The labor market for special education teachers, although complicated by a variety
of institutional and educational factors, displays many of the important characteristics
found in occupations experiencing shortages. Although the shortage is expected to
continue for the next several years, employers, universities, and the government have
begun to address many of the issues discussed above, and it is through this process that a
free and appropriate education for all exceptional children will be achieved.
3-50

CHAPTER 4
CASE STUDY OFHOME CARE WORKERS
A. Description of the Occupation
The home care worker' is a paraprofessional who provides assistance in and
support with basic living in the home setting. The aide performs personal care and home
management services that enable the elderly, ill, or disabled person to live at home instead
of facing institutionalization. The responsibilities of a home care worker include three main
areas: (1) housekeeping tasks such as cleaning, doing laundry, and purchasing and
preparing food; (2) personal hygiene tasks including bathing, grooming, dressing, and
assisting in ambulatory movement (e.g., moving from bed to chair); and (3) health-related
tasks such as taking standard measurernents-(e.g., pulse), helping with exercises, and
assisting with medication. The home care worker provides emotional support for the
clier,t, and is often responsible for keeping progress reports and notifying supervisors of
any changes in the client's conditions.' In addition, the successful home care worker is a
'Both states and agencies use a number of different titles for home care workers, such ashomemaker, home health aide, chore worker, home care aide, personal care worker, and homeattendant; they all describe the same basic job. Sometimes "home health aides" are used todescribe more skilled positions, and "homemakers" and "personal care attendants" refer toless skilled jobs. (It is important to note that all of the titles refer to jobs that require verylittle training and education.) The exact title used to describe a worker is usually a functionof the source of funding. Throughout this paper we will use titles interchangeably; however,when information is presented from other sources, the terminology will be consistent with theoriginal source.
'U.S. Department of Labor, Bureau of Labor Statistics (Apr. 1990). Occupational OutlookHandbook. 1990-91 Edition, pp. 313-14.
4-1
119

mature, caring individual in good physical conditicn who can perform effectively in a wide
variety of situations.3
There are a number of reasons why home care is an interesting occupation to
examine. First, the occupation is unique because each assignment is characterized almost
entirely by the client. The location of the service is by definition the client's home, the
types of services rendered (e.g., personal care, homemaking) are a function of the client's
needs, and the length of time that services are provided depends upon the client's medical
condition (e.g., short recovery from surgery, chronic condition). As a result, the work site,
hours, and level and type of effort required vary dramatically by case. Second, the policies
of various third-party payors (e.g., private health insurance and state and federal
aovernment programs) significantly affect the demand for home care services and the
supply of home care workers.
1. The Home Care Industry
Home care services have been provided historically through informal
(uncompensated) care delivered by friends or relatives, through welfare agencies that
assisted in caring for young ::hildren and helping with homemaking tasks when mothers
were sick, and through health agencies that supplemented their skilled nursing services.'
A number of factors have been important in the evolution of the home care field including:
(1) increases in the labor force participation of women, who were traditionally the primary
3Al len D. Spiegel (Apr. 1990). Home Health Care: Home Birthing to Hospice Care,National Health Publishing, pp. 502-3; and Occupational Outlook Handbook, pp. 313-14.
4U.S. Department of Health, Education, and Welfare, Office of Human Development,Administration on Aging (1977). Human Resources Issues in the Field of Aqina: Homemaker-Home Health Aide Services. AoA Occasional Papers in Gerontology, p. 2.
4-2
2 0
informal caretakers; (2) changes in the demographic composition of the nation,
characterized by individuals living longer and a rapid growth in the size of the elderly
population; (3) increased emphasis on the ability of patients to heal better at home than in
institutions; and perhaps most importantly, (4) changes in health care reimbursement
policies and shifts to manage costs by providing care at the lowest level of intensity. The
next two sections discuss the effects that payors and employers have had on the
evolution of the home care industry.
2. Payors
Medicare and Medicaid legislation (Sections .XVIII and XIX of the Social Security
Act), originally passed in 1965, provides medical services for disabled adults and people
over age 65 (Medicare) and for low-income persons (Medicaid). Under the 1965 laws,
proprietary home health agencies were required to be licensed by the state to qualify for
Medicare and Medicaid reimbursement. Sections XVIII and XIX of the Social Security Act
offered a new source of home care funding and fostered a shift in the home care industry
away from its original focus on family and child care toward care of the elderly. Home
care also became oriented more toward personal care, because reimbursement was not
offered for homemaking services.
a. Medicare
Medicare, which consists of hospital insurance (Part A) and supplementary medical
insurance (Part B), covers home health aides assisting with meal preparation, exercise,
personal care, and personal cleanliness, but does no/ cover meal delivery programs,
housekeeping chores unrelated to patient care, transportation, or shopping.' To qualify
'Spiegel (1983), p. 295.
4-3
121

for home care services under Medicare, a person must be homebound, have services
prescribed by a physician, and need intermittent skilled nursing care o, physical, speech, or
occupational therapy.
Originally, Part A of Medicare covered home health agency services after a period
of hospitalization and required no cost sharing (with the beneficiary), whereas Part B
covered home health -agency services and required an annual deductible. The initial
legislatiun in 1965 included a number of qualifications that beneficiaries had to meet in
order to receive services under Medicare, and limited the number of days service could be
provided. The Omnibus Budget.Reconciliation Act (OBRA) of 1980 reduced barriers to the
use of home health services by eliminating the 100-day visit limit, the requirement for a
prior hospital stay of three days, the Part B deductible, and the requirement for proprietary
agencies to be licensed by the state. (Medicare still requires agencies receiving Medicare
reimbursement to be certified; this process is administered by the states but it is separate
from state licensing procedures.) These changes in OBRA 1980 were instituted to make
home care more attactive and more widely available to Medicare-eligible individuals. In
1985, the Health Care Financing Administration (HCFA) tried to contain costs by limiting
the allowable cost per visit and the number and frequency of home health care visits.°
Further restrictions on reimbursement were instituted in the mid-1980s when fiscal
intermediaries (i.e., contractors who review and pay Medicare claims) were instructed to
impose stricter interpretations of medical necessity, which resulted in increased claim
denials. The Omnibus Budget Reconciliation Act of 1987 changed the requirements of the
homemaker-home health aide occupation by instituting competency exams and/or training
'Nancy M. Kane (1989). "The Home Care Crisis of the Nineties." The Gerontologist. Vol.29, No. 1., p. 29.
4-4
122

requirements for home health aides employed by Medicare-certified home health agencies.
The specifics of OBRA 1987 legislation are discussed in Section 8, Training and
Recruitment of Home Care Workers.
In fiscal year 1989, total Medicare home health benefit payments for Part A and
Part B totaled $2.6 billion for all types of services (i.e., skilled nursing, physical therapy,
and home health aide). This was an 11 percent increase over fiscal year 1988
expenditures. In 1989, there were 1,172 visits per 1,000 Medicare enrollees and the
average charge per visit was $69.7
b. Medicaid
Medicaid is a state-administered program that is linked to actual or potential
recipients of cash assistance under the Aid to Families with Dependent Children (AFDC)
and Supplemental Security Income (SSI) programs. Medicaid eligibility is extended to two
main groups -- the categorically needy and the medically needy.' Included among the
categorically needy are recipients of AFDC; former recipients of AFDC who have ,lost
benefits due to increased income; certain pregnant women and children who meet AFDC
income and resources requirements; and the aged, blind, and disabled who receive Federal
SSI payments. Included in the medically needy are the individuals who fall into the
covered categories (i.e., aged, blind, disabled, families with dependent children, and
pregnant women and children) and whose income and resources are in excess of the
standards for categorically needy coverage. Many of the persons who are medically needy
become eligible for Medicaid only :ter they have reduced their incomes and/or resources --
'Committee on Ways and Means, U.S. House of Representatives (June 5, 1990).Overview of Entitlement Programs, 1990 Green Book, p. 145.
°Overview of Entitlement Programs, pp. 1276-88.
4-5
123

this is known as "spending down." The eligibility requirements and the level of cash
assistance granted vary by state.
There is no definition of Medicaid allowable home health services under federal law;
however, ail states must identify a minimum range of home health services in their State
Medical Assistance Plari. Under OBRA 1980, Medicaid (like Medicare) removed its earlier
requirements for proprietary organizations to be licensed by the states and its limits on the
number of covered home health visits.
Under Medicaid, states share program costs with the federal government; the
federal government usually pays the majority of those costs. Medicaid spending on home
health care totaled $2.6 billion in fiscal year 1989 (a 28 percent increase frorri fiscal year
1988).9 In general, most states spend very little of their Medicaid dollars on home health
care -- the national average is 4.7 percent of all Medicaid funding. New York has the most
extensive Medicaid home health care program, accounting for a little over half of all
Medicaid home health expenditures in 1989. On average, 2.6 percent of all Medicaid
recipients receive home health care services, with a national average expenditure of
$4,200 per recipient.
c. Other Sources
There are a number of other government programs that fund home care, including
Social Service Block Grants (Title- XX of the Social Security Act) and the Older Americans
Act." There are also a number of non-government funding sources, which include
charities and associations (e.g., United Way of America, American Medical Association,
American National Red Cross, American Cancer Society), and commercial carriers of group
'Home Health Line (November 7, 1990). Vol. XV. pp. 413-14.
10Spiegel (1983), p. 295.
4-6
124

health insurance (e.g., private indemnity plans and health maintenance organizations), as
well as monies paid by self-pay clients. Changes in reimbursement policies and the
services covered by state and federal programs, private indemnity insurance, and health
maintenance organizations are driving factors in the evolution of the home care industry by
increasing demand for and recognition of the home health care occupation.
The Home Health Care Edition of the 1989 Marion Long Term Care Digest found
that on average 56 percent of the 1988 revenues of home health care agencies are from
Medicare. Other major payors consist of Medicaid (13.5 percent), private insurance other
than a Health Maintenance Organization (9.6 percent), the patient or patient's family (9.2
percent), and state or local governments (7.1 percent). Others estimate that private pay
clients account for about 30 percent of home care expenditures, and that third-party
payors account for about 70 percent of agency revenues." Many researchers note that
each public program has different target populations, eligibility requirements,
administrative procedures and agencies, methods of determining reimbursement, a;-id
reimbursement guidelines and ceilings, which result in problems due to fragmentation of
the funding and delivery of services." The current structure of public programs is largely
a product of state and federal political processes and Competing special interest groups
(e.g., provider associations, union representatives, home care advocacy groups, consumer
groups, legislators), and is not a coherent method of delivering home health care services.
"Margaret Mac Adam (Feb. 1990). "Leadership Roles in Home Care Personnel Issues: AChallenge for State Units on Aging," p. 1, 10.
"Charlene Harrington and Leslie Grant (1990). "The Delivery, Regulation, and Politics ofHome Care: A California Case Study." The Gerontologist. Vol. 30, No. 4, p. 451.
4-7
125

3. Employers
As home care has gained acceptance, the home care industry has experienced large
increases in the number and types of agencies providing home health services. The
delivery system includes home health agencies (which usually take at least one of the
following forms: government-owned, hospital-based, proprietary, proprietary not-for-profit,
and visiting nurse association agencies), as well as self-employed aides. Significant
increases in the number of proprietary agencies occurred in the early 1980s when state
licensure requirements were eliminated from Medicare and Medicaid reimbursement
policy." This resulted in the creation of new home health agencies and the conversion
nf previously non-proprietary agencies to proprietary agencies. In 1982 there were 2,924
Medicare-certified agencies, 17 percent of which were proprietary. This number increased
to 5,824 agencies in 1985, 30 percent of which were proprietary.' Some of these
proprietary agencies have expanded geographically to become multi-state chains, taking
advantage of the possible economies of scale in home health care delivery."
One major difference between the agency types is the source of funding.
According to the Home Health Care Edition of the 1989 Marion Long Term Care Digest,
government-owned home health agencies are funded by higher than average levels of
Medicaid and state ahd local government funds; hospital-based agencies receive higher
than average levels of Medicare and health maintenance organization funding; proprietary
agencies receive higher than average levels of private insurance (other than HMO) and self-
"Medicare certification, however, is still required.
"Kane (1989), pp. 24-25.
'Research on the finarfcial condition and viability of proprietary providers can be found inPenny Feldman, Alice M. Sapienza, and Nancy M. Kane (1990). Who Cares for Them?Workers in the Home Care Industry. Greenwood Press, Chapter 5.
4-8
126

pay funding; and not-for-profit and visiting nurse association agencies receive higher than
average levels of Medicare, Medicaid, and health maintenance organization (HMO)
funding." The average rates charged for "home health aide" services (i.e., personal
care, bathing, exercise, and assistance with ambulation) are highest in hospital-based
agencies and lowest in government-owned and proprietary agencies." However,
average "homemaker" wages are higher in proprietary and government-owned agencies
and lower in hospitai-based, not-for-profit, and visiting nurse association agencies."
Many of the employment characteristics of a homemaker-home health aide's job are
determined to a large extent by the type of employer and the clientele served.
Many agencies are run like temporary employment agencies, where the. majority of
workers are employed on an hourly or part-time basis, and there are no guaranteed work
hours. According to survey results published in the 1989 Marion Long Term Care Digest,
proprietary agencies employed almost three times as many "home health aides" on a part-
time basis (25.4) as they did on a full-time basis (8.9), and almost twice as many
"homemakers" on a part-time basis (19.1) as on a full-time basis (10.4). On average,
agencies employed 14.1 home health aides and 15.2 homemakers on a part-time basis,
and 6.2 home health aides and 7.6 homemakers on a full-time basis."
While there are a number of problems for home care workers employed by
agencies, such as a lack of benefits and guaranteed hours, these issues are exacerbated
when an aide is self-employed. Many states (approximately 31) reimburse independent
'1989 Marion LpnQ Term Care Di es , p. 26.
171989 Marion Long Term Care Digest, p. 28.
181989 Marion Long Term Care Digest, p. 30.
191989 Marion Lona Term Care Digest, p. 20.
4-9
127

workers who are hired directly by the elderly or their families.' Self-employed workers
are less likely than aides employed by agencies to receive fringe benefits, supervision
(beyond that of the client), or training, and are more limited in their ability to find full-time
work because there are no formal mechanisms for them to obtain new clients.
The distinction between home car3 and other occupations delivering services in the
home, such as maids and domestics, is sometimes blurred. There are also a number of
similar paraprofessional occupations that involve both personal contact and helping or
instructing others in an institutional setting. Examples of such occupations include
attendants in children's institutions, nursery school attendants, nursing aides, occupational
and physical therapy aides, and orderlies.' These institutional jobs usually pay higher
salaries and offer more stable work environments than home care. However, home care
jobs offer a significant amount of autonomy and responsibility that is not available in
institutional-oriented occupations.
Other unskilled, nonsupervisory positions that are similar to home care include hotel
workers, laundry/cleaning workers, beauty shop assistants, and grocery store workers. In
these paraprofessional-level occupations, wages are usually higher than those of home
care workers, and average weekly hours are at leait as high as home care workers.'
"Mac Adam (1990), p. 10.
21Occuoational Outlook Handbook, p. 315.
"Kane (1989), p. 29.
4-10
128

B. Training and Recruitment of Home Care Workers
This section addresses the training requirements for home health aides, the factors
influencing those requirements, and the methods employers adopt when hiring home
health aides.
1. Training Requirements
Although the minimum educational requirements for the home care field are the
ability to read and write English, the training requirements for home health aides have been
undergoing review and change. In the past, workers received training because the agency
that employed them provided it voluntarily, or because state-imposed standards required it.
However, not all states had training requirements, and the states that did have standards
varied in their requirements (e.g., requirements ranged from 0 to 120 hours of training).
Until recently, no federal standards were in place. Studies and media publicity concerning
the home health care industry in the mid-1980s highlighted its rapid growth and
unregulated atmosphere, and spurred congressional committees to investigate the
industry. The Inspector General of the U.S. Department of Health and Human Services
(DHHS) recommended that HCFA implement federal training standards for homemaker-
home health aides receiving Medicare reimbursement for their services.
OBRA 1987 establishes qualifications for home care workers who provide services
for Medicare-certified home health agencies. Certified agencies cannot use home health
aides for Medicare patients on or after August 14, 1990, unless (1) the individual
completes a training program and competency evaluation program, passes a
competency evaluation program without training; and (2) the individual is competent to
furnish home health services. In other words, the training component is not necessary if a
4-11
129
1
home care worker can pass a competency exam without it. The training and competency
evaluation programs must meet the minimum standards established by the Secretary of
Health and Human Services.' A more detailed description of the training program
requirements is provided in Exhibit 4.1. Training is to be a minimum of 75 hours, with at
least 16 hours of classroom training, followed by at least 16 hours of supervised practical
skills. The 75-hour standard was adc-pted by HCFA to reflect current statutory
requirements for nurse aides in Medicare and Medicaid certified nursing facilities; HCFA
believes that home health aides should acquire the same amount of training as nurse
aides.' There are also specific requirements regarding "authorized" instructors and
training content. OBRA 1987 outlines 12 specific items that must be covered.during
training, the majority of which are health-related; HCFA believes these approximate current
industry standards because HCFA used a composite of the training standards detailed by
the Joint Commission for Accreditation of Health Organizations, the model curriculum of
the Foundation for Hospice and Homecare," and the National League for Nursing.
Training programs may be offered by a variety of sources including the employing
"Federal Register. Vol. 54, No. 155. Monday, August 14, 1989, p. 33357. The January1, 1990, deadline discussed in this notice was later extended to August 14, 1990.
'Federal Register. August 14, 1989, pp. 33357-8.
'The Foundation for Hospice and Homecare has developed "A Model Curriculum andTeaching Guide for the Instruction of the Homemaker-Home Health Aide." The modelcurriculum was originally developed by the National Home Caring Council in 1978 withfunding from the U.S. Public Health Service. The Foundation has recently received funding
om the Administration on Aging to update the model curriculum and design a nationalcertification program that includes training materials and a two-part competency test.Organizations like the Foundation have been making strides in defining and molding thetraining and testing used in conjunction with the quality assurance provisions in Medicarelegislation.
4-12
13 0
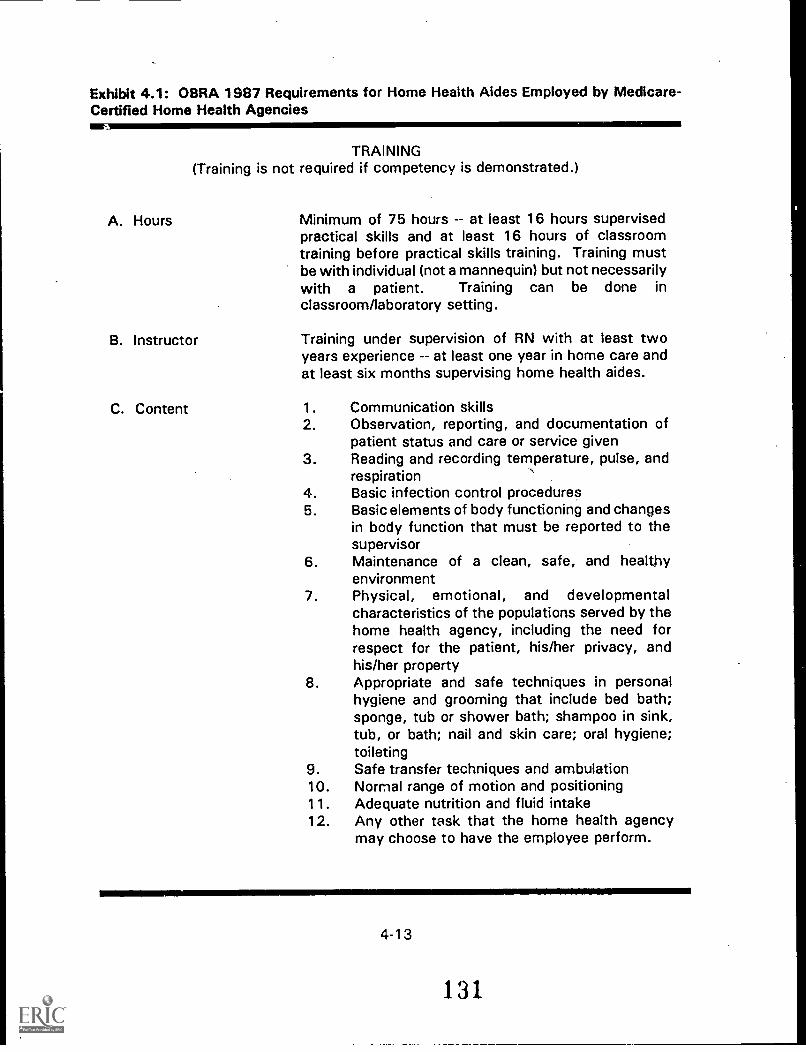
Exhibit 4.1: OBRA 1987 Requirements for Home Health Aides Employed by Medicare-Certified Home Health Agencies
TRAINING(Training is not required if competency is demonstrated.)
A. Hours
B. Instructor
C. Content
Minimum of 75 hours at least 16 hours supervisedpractical skills and at least 16 hours of classroomtraining before practical skills training. Training mustbe with individual (not a mannequin) but not necessarilywith a patient. Training can be done inclassroom/laboratory setting.
Training under supervision of RN with at least twoyears experience at least one year in home care andat least six months supervising home health aides.
1. Communication skills2. Observation, reporting, and documentation of
patient status and care or service given3. Reading and recording temperature, pulse, and
respiration4. Basic infection control procedures5. Basic elements of body functioning and changes
in body function that must be reported to thesupervisor
6. Maintenance of a clean, safe, and healthyenvironment
7. Physical, emotional, and developmentalcharacteristics of the populations served by thehome health agency, including the need forrespect for the patient, his/her privacy, andhis/her property
8. Appropriate and safe techniques in personalhygiene and grooming that include bed bath;sponge, tub or shower bath; shampoo in sink,tub, or bath; nail and skin care; oral hygiene;toileting
9. Safe transfer techniques and ambulation10. Normal range of motion and positioning11. Adequate nutrition and fluid intake12. Any other task that the home health agency
may choose to have the employee perform.
4-13
131

Exhibit 4.1 (Continued): OBRA 1987 Requirements for Home Health Aides Employed byMedicare-Certified Home Health Agencies
COMPETENCY EVALUATION
(Competency must be demonstrated in selected basic skill and knowledge areas.)
A. Competency Competency must be demonstrated in the followingEvaluated by areas while under direct supervision ofDirect qualified RN:Observation
Reading and recording temperature, pulse, andrespirationPersonal hygiene that include bed bath; sponge, tub orshower bath; shampoo in sink, tub, or bath; nail andskin care; oral hygiene; toiletingSafe transfer techniques and ambulationNormal range of motion and positioning
B. Competency Home health aides must also demonstrate competenceEvaluation of in the following areas (methods may be written, oral, orBasic Knowledge by observation)
Observation, reporting, and documentation of patientstatus and care or service givenBasic infection control proceduresBasic elements of body functioning and changes inbody function that must be reported to the supervisorMaintenance of a clean, safe, and healthy environmentPhysical, emotional, and developmental characteristicsof the populations served by the home health agency,including the need for respect for the patient', his/herprivacy, and his/her propertyAdequate nutrition and fluid intakeAny other task that the home health agency maychoose to have the employee perform.
C. Duration Yearly evaluations and quarterly in-service training arealso required. If a home health aide has not worked for24 corsecutive months, retesting of competency isrequirad.
Source: Joan Wolff (April 1990). "Training and Certification of Homemaker-HomeHealth Aides." CARING Magazine. Vol. IX, No. 4, pp. 34-35.
4-14
agencies, community colleges, and the American Red Cross.26
A detailed description of the competency evaluation is also provided in Exhibit 4.1.
All home health aides had to pass a competency exam by August 14, 1990, to serve
Medicare patients. By this date, agencies had to begin (1) conducting performance
evaluations of each homemaker-home health aide at least once every 12 months, and (2)
providing at least three hours of in-service training per calendar quarter. The requirements
for participation by home health agencies in the Medicare program are described in a HCFA
interim final rule." This rule requires home health agencies to maintain documentation
proving that the training and competency evaluation requirements are met. This'
documentation will be used by the Medicare state surveyor to determine if the home
health aides used by each home health agency meet the regulation's requirements.
The people we interviewed are supportive of the recent OBRA legislation and
believe that significant strides are being made to increase the standards and quality of
home health care. They are very concerned, however, about the status of care delivered
to non-Medicare clients. The non-Medicare portion remains unregulated by the federal
government, and aides are usually not required to be trained or to pass competency
standards. Most of those we interviewed advocate training for a home care workers,
including those serving non-Medicare clients. Training is generally viewed as the best way
to establish minimum quality standards for home care aides.
26There are some conditions under which a Medicare certified agency cannot conducttraining or competency evaluation programs. These were originally established in conjunctionwith OBRA 1987, and revised in OBRA 1990.
"Federal Register. Monday, August 14, 1989, p. 33359.
4-15
133

2. Methods Employers Use to Recruit Home Care Workers
Word-of-mouth is the-most frequent method used by agencies to recruit home care
workers. While there is no national information available, anecdotal evidence, as well as a
New York state survey, suggest that the majority of all home care workers heard about
their jobs through word-of-mouth -- often from friends within the home care
occupation.' Home care workers (i.e., current workers, new workers, and workers who
have left the field) were asked how they heard about their jobs; they could respond by
listing one or more sources. Of all workers, 54 percent heard about the job through a
friend or relative in home care, 21 percent through a friend or relative not in home care, 24
percent in a newspaper advertisement, and 12 percent by a person who needed home
care. Other sources which workers listed much less frequently included advertisements in
subways or buses, advertisements on television, community groups, employment offices,
churches/ministers, and welfare departments. Workers who had left home care were more
likely than current workers to cite newcpaper, subway, or bus advertisements;
employment offices; and relatives or friends in the home care field as a source. In
suburban areas, advertisements in newspapers were cited significantly more often than in
New York City.
According to the literature and the experts we interviewed, recruitment of home
care workers is a major problem. However, the employers we spoke with did not use
aggressive or innovative recruiting techniques. One agency encourages word-of-mouth
recruitment by offering bonuses to employees who are able to bring in friends or relatives
"Long Term Care Policy Coordinating Council, the Office of Program Planning Analysis andDevelopment, and the Divisiorl of Medical Assistance, New York State Department of SocialServices (Jan. 1990). Strengthening the Home Care Work Force in New York State: A Studyof WateLpia_r_a_gke_risticn nt, and Retention, p. 13.
4-16
134

as new employees. Some other agencies run advertisements in weeklies and free local
papers, instead of keeping the sanie advertisement in a daily newspaper for a number of
weeks."
3. Characteristics of Workers in the Occupation
While national statistics on the demographic characteristics of home health aides
are not available, some information has been published. Exhibit 4.2 highlights some of the
characteristics of workers based on a number of surveys that have been conducted.
Home care workers are usually women, approximately 45 years old, with limited formal
education and skills. National studies indicate that about half of all home care workers are
minorities, and that approximately 60 percent of home care workers are heads of
households.'
Many of the employers we interviewed confirm the above statistics. Some
anecdotal evidence suggests that there have been minor changes in the demographic
characterisf -1.ers over time. One interviewee believes that on average current
workers are . less experienced as homemakers than workers in the past. They
suggest that in the late 1960s and 1970s a large pool of older women who had finished
raising their children and desired part-time jobs became home health aides. However, with
these women leaving the field and with the labor force participation of women increasing,
"There have been limited state programs aimed at recruiting home care workers, such asa New Jersey State Department of Health program aimed specifically at training seniors (overage 50) to become homemaker-home health aides in rei'ponse to increases in need.Information on this program is available in Diedre D. Fisher and Rickey Greene (May 1988)."Training Seniors as Homemaker-Home Health Aides." c_ARING Magazine. Vol. V!I, No. 3,pp. 11-15.
'See Barnow, Burt, et al. (Aug. 1988). The Home Care Labor Market in New York State:An Analysis of the Issues and Projections through 2000, p. 5:5.
4-1 7
1 3
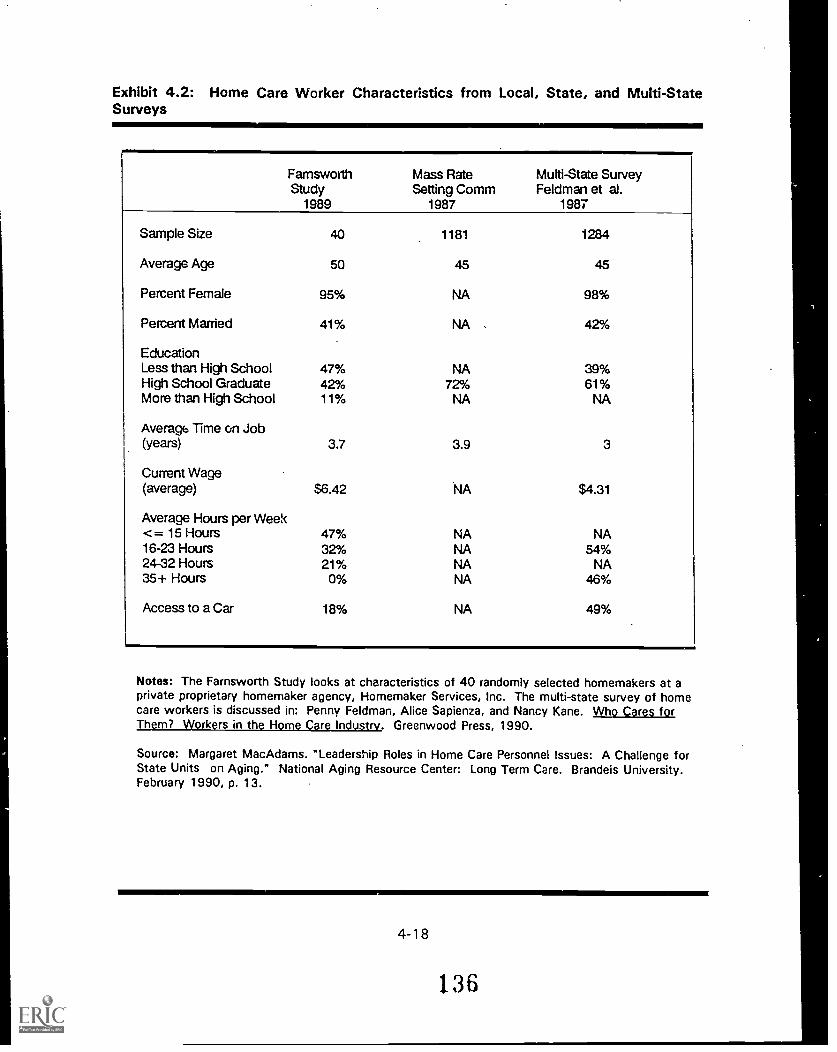
Exhibit 4.2: Home Care Worker Characteristics from Local, State, and Multi-StateSurveys
FarnsworthStudy
1989
Mass RateSetting Comm
1987
Multi-State SurveyFeldman et al.
1987
Sample Size 40 1181 1284
Average Age 50 45 45
Percent Female 95% NA 98%
Percent Married 41% NA . 42%
EducationLess than High School 47% NA 39%High School Graduate 42% 72% 61%More than High School 11% NA NA
Average Time on Job(years) 3.7 3.9 3
Current Wage(average) $6.42 NA $4.31
Average Hours per Week<= 15 Hours 47% NA NA16-23 Hours 32% NA 54%24-32 Hours 21% NA NA35+ Hours 0% NA 46%
Access to a Car 18% NA 49%
Notes: The Farnsworth Study looks at characteristics of 40 randomly selected homemakers at aprivate proprietary homemaker agency, Homemaker Services, Inc. The multi-state survey of homecare workers is discussed in: Penny Feldman, Alice Sapienza, and Nancy Kane. Who Cares forThem? Workers in the Home Care Industry. Greenwood Press, 1990.
Source: Margaret MacAdams. "Leadership Roles in Home Care Personnel Issues: A Challenge forState Units on Aging." National Aging Resource Center: Long Term Care. Brandeis University.February 1990, p. 13.

new entrants are more likely to be younger.
C. Employment and Earnings of Home Care Workers
National statistics on employment and earnings for home care workers are difficult
to obtain. Information on the home care occupation can be obtained from the Current
Population Survey (CPS), but the CPS data have a number of limitations. Problems exist in
the CPS data due to different job titles and service definitions, and difficulty discerning
which aides work in institutions and which work in the home setting. There are also
difficulties identifying independent, self-employed home health aides. The Bureau of Labor
Statistics (BLS) does not regularly publish data on home care workers; therefore, time
series data are unavailable. When figures are published, they must be interpreted with
caution, taking into account which home care aides are being identified. This section
draws upon published employment and earnings surveys and projections.
1. Employment Trends
The U.S. Bureau of the Census counted 350,000 "health aides -- except nursing" in
1985; this figure is an overestimate because it includes some aides who were working in
institutional settings. In 1986, BLS estimated that 213,000 "homemaker-home health and
nursing aides" worked in private households for organized employers; however, this figure
is an underestimato because it does not include independent workers, who constitute a
significant portion of the home care workforce. A telephone survey of states with
individual provider programs estimated that 145,000 workers served as individual
providers in 1986." A realistic estimate of the home care workforce in 1986 is about
'Feldman, (1990), p. b.
4-19
137

350,000 workers, based on the combination of BLS data and the survey identifying
individual providers. The National Association for Home Care estimates that there were
between 300,000 and 500,000 homemaker-home health aides in 1986; however this
estimate is based on "impressions," not rigorous surveys or research.'
BLS estimates that 236,000 "home health aides" were employed in 1988, and that
the number of home health aides will grow to 397,000 by the year 2000 under moderate
growth assumptions. (This estimate is low because it does not include self-employed
aides.) This increase of 160,000 jobs translates into 68 percent job growth between
1988 and 2000, and BLS projects home health aides to be the third fastest growing
. occupation in the United States.' BLS states there will be a "great demand to serve the
needs of the increasing population who are aged and ill but live at home."' Because of
this rapid growth, new jobs may grow faster than the supply of home care workers,
leading to potential shortages.
It is important to note that the increases in employment that are projected by BLS
are not the sole source of job openings -- they only represent new jobs. There are
extremely high turnover rates among home health workers, and the positions created when
workers leave will also need to be filled. However, these are not all new workers because
many aides remain in the home care field and migrate to different agencies. Exact
328ee Feldman (1990), pp. 7-8; Mac Adam (1989), p. 3.; and George Silvestri and JohnLukasiewicz (April 1990). "Projection of Occupational Employment, 1988-2000." Outlook2000. U.S. Department of Labor, Bureau of Labor Statistics, p. 54.
'BLS estimates that there were 327,000 "homemaker-home health aides" employed in1988, and that the number of homemaker-home health aides will grow to 535,000 by theyear 2000. This is an increase of 208,000 jobs, which translates into 64 percent growthbetween 1988 and 2000.
34Silvestri and Lukasiewicz (1990), p. 49.
4-20
133

turnover data are difficult to obtain because of the lack of research in the area and
conflicting definitions and computations of turnover statistics. Estimates suggest that the
industry average annual turnover for "home aides" is 60 percent for one year and 80 to 90
percent for two years." The 1989 Marion Long Term Care Digest estimates that annual
turnover is 25 percent for "home health aides" and 40 percent for "homemakers."'
Because home care workers receive little formal training, high turnover rates are less
disruptive than they would be in an industrY relying heavily on permanent, full-time labor.
Still, high turnover creates additional costs in the form of worker recruitment, training, and
orientation expenses; decreased productivity; and declines in continuity of care, client
satisfaction, and quality.'
There are also high vacancy rates among home health care jobs. Our interviews
indicate that many agencies have home care positions available which they are unable to
fill. Researchers note that the once plentiful pool of workers available for home care jobs
has diminished, with many paraprofessional positions available and no workers applying to
fill them.' The 1989 Marion Long Term Care Digest notes that home health aides have
the highest vacancy rates of all positions employed by home health agencies, with an
average vacancy rate of 4.5 percent."
'Feldman (1990), p. 11.
1989 Marion Long Term Care Diciest, p. 21. Turnover is based on the percentage ofworkers who have left each job in the last 12 months.
'Feldman (1990), p. 11.
38Human Resources Issues in the Field of Aging: Homemaker-Home Health Aide Services,p. 2; and Nola Alberts (May 1988). "The Outlook for Home Health Paraprofessionals."CARING Magazine, pp. 20-22.
39 1 989 Marion Long Term Care Digest, p. 21. Vacancy rates are based on the percentageof positions that were unfilled at the time of the survey.
4-21
13 9

The actual number of new positions created within home health care depends on a
variety of market factors, such as:
Changing Demographics. The growth in the elderly segment of thepopulation who are most in need of home care.
Changing Technology and Health Care Strategies. Increasing reliance of thehealth care industry on home care as opposed to institutional care, due toportable equipment and the belief that the home is often a more effectivemode of treatment.
Funding. The availability of public and private funds to purchase home careservices.
Reimbursement Policies. Increases in health care costs create pressure byinsurance companies to decrease hospital lengths of stay. Patients aredischarged from an institutional setting and to a home setting much earlier,and many are unable to take care of themselves. Medicare, Medicaid, andother provider policies have a significant effect on the demand for services,as occurred under OBRA 1980.
These issues are addressed in more detail in Section D of this chapter.
2. Earnings Trends
Because third-party payors provide approximately 70 percent of agency revenues
and set limits on the level of reimbursement, home care workers face a labor market in
which wages do not move freely." The remaining 30 percent of revenues come from
self-paying elderly clients, who are often on fixed incomes and are extremely limited in
their ability to pay for care. As a result, wages are often inflexible, particularly for workers
in agencies reimbursed by federal and state programs such as Medicare and Medicaid.
Fixed budget programs must often reduce the number of hours of service provided when
costs (wages) rise. In addition, reimbursement systems usually have payment mechanisms
designed to keep costs low. For example, current Medicare regulations restrict
"Mac Adam (1990), p. 10.
4-22
14 0

reimbursement based on an agency's historical costs.' Employers are unwilling to pay
workers more than the amount insurance payors are willing to compensate the agency.
Many states use contract bidding procedures which award the provision of care to the
home health agency with the lowest possible costs. This practice encourages agencies to
provide the minimum level of wages, fringe benefits, training, and supervision -- bringing
into question the quality of home health care provided through the competitive bidding
process.42
Trends on earnings are not available for homemaker-home health aides; however,
surveys indicate that the average national wage is between $4.50 and $5.00 per hour.43
Because home care is a low-skill occupation, wages are sensitive to the minimum wage; in
fact, many state rate-setting commissions set the home care wage at the minimum
wage." The increase in the federal hourly minimum wage from $3.80 to $4.25 on April
1, 1991, should slightly better the financial position of a number of home care workers.
(A lower training wage can be paid for up to six months to workers who are under 20
years of age.) Home care workers' earnings vary by geographic location, insurance
coverage, type of client served, and experience (to a limited extent). Many experts stress
that employers cannot realistically raise wages because of current state and federal
41MacAdam (1990), p. 11.
42MacAdam (1990), p. 11.
43 Estimates include $4.41 from Burt Barnow, et al., (1988), p. 5-5.; $5.13 from the1989 Marion Long Term Care Digest; $4.00 to $4.50 from Rick Surpin (Apr. 1988). "CurrentStatus of Paraprofessionals in Home Care." CARING Magazine, p. 4; $4.50 to $5.00 fromMary Koska (May 5, 1988). "Alternate Care: Aide Shortage Limits Home Health CareDelivery." Hospitals, p. 63; and $4.31 from a multi-state survey in Feldman (1990), p. 25.
"Kane (1989), p. 29.
4-23
141

reimbursement policies (as well as private health insurance reimbursement levels), and that
poorly paid home care workers in effect subsidize the cost of home care."
D. Factors Contributing to a Shortage
1 . Presence of a Shortage
Most of the available home care literature, as well as many of the -rsons we
interviewed, assert that there is a national shortage of home care workers. One expert
maintains that while there may not be a shortage in the strictest economic sense, the poor
quality of many workers suggests that having people to fill jobs does not necessarily mean
the supply of home care workers is appropriate (i.e., some of the *.:urrent home care
workers are not appropriately qualified to provide the necessary standard of care). Most
define the home care shortage as having health care authorized and funded, but not being
able to provide the necessary home care services. In other words, the demand for care
cannot be met by the current supply of home care workers at the available wage rate.
The multitude of reports by states and home care agencies highlighting their
recruitment and retention problems and their inability to provide authorized care indicate
that there are at least short-term shortages in the home care labor market in many areas of
the country." Serious problems in recruiting and retaining workers have been noted
across the nation, especially in rural states, on the West Coait, in the Great Lakes states,
"In other words, because home care workers receive such low wages and benefits, it isargued that, in effect, they provide a subsidy that allows reimbursement of home careservices by payors to be at such a low cost. This was mentioned in our interviews; in Kane(1989), p. 30; and in Rick Surpin, "Improved Working Conditions Lead to Improved Quality."CARING Magazine, p. 26.
"For example, the Massachusetts Rate Setting Commission estimated a 20 percent gapbetween hours of service authorized and hours actually provided by state health care agenciesin 1986.
4-24
142

and in states with low unemployment rates. Preliminary findings from a national study of
25 home health agencies indicate that 85 percent of agencies reported major problems in
recruiting and retaining aides at existing wage levels.' In a survey by the National
Association for Home Care, 48 percent of the agencies that responded had problems
recruiting and retaining workers; many of these respondents emphasized that
reimbursement levels were too low to attract workers." While areas with high
concentrations of immigrants have less of a problem, rural, depressed states and areas
with large growth in public funding for home care services report severe shortages."
Many states indicate that the elderly must wait weeks or even months for care, and our
interviews with employing agencies indicate that wait-listing clients, turning down clients,
and providing only part of the total authorized services are common occurrences that
result from open home care positions that cannot be filled.
Almost all of the experts we interviewed believe that there is a labor shortage of
home health care workers (at current wage levels) in certain areas of the country. While
the home care shortage does not appear "severe," it does result in the denial or delay of
necessary care, reductions in the level of home care services a client receives, and
diminished quality of care. A shortage of workers in any health field is particularly
disturbing because it jeopardizes the health, quality of life, and well-being of the individuals
who are affected. In the case of home care, this is primarily the elderly. The next two
sections discuss the factors influencing the demand and supply of home care workers.
'Mac Adam (1990), p. 4.
"Patricia Jones (May 1988). "The Home Care Personnel Shortage Crisis: PreliminaryResults of a NAHC Survey." CARING Magazine, p. 6.
"Mac Adam (1990), p. 4.
4-25
143

2. Demand-Side Factors
Important factors that influence the demand for home care workers include the size
and composition of the elderly population; trends in informal home care; cost containment
policies; changes in program eligibility and the services provided (e.g., Medicare); and the
availability of nursing home beds.'
a. Size of the Elderly Population
The size of the elderly segment of the population is projected to grow rapidly
between now and the year 2000. Estimates suggest that 71 percent of care provided by
home health agencies is delivered to senior citizens.' Additionally, about 20 percent of
all persons in the United States age 75 and over, and 7 percent of persons age 65 to 74,
are expected to use home care services each year.' The U.S. population is expected to
grow by 0.7 percent annually between 1988 and 2000, but the segment of the population
between 75 and 84 is projected to grow 2 percent annually, and the segment age 85 and
over is expected to grow at 3.8 percent annually.' Because the use of home health care
services is significantly correlated with age and the size of the elderly population, demand
for home health care services should increase.
'The majority of this discussion is from Barnow (1988), Chapter 4.
511989 Marion Long Term Care Digest, p. 13. This estimate of patient mix includes allhome health agency services (e.g., skilled nursing, medical services, home infusion therapy,respiratory services, housekeeping, personal care, etc.), not just personal and homemakingservices.
"See Alice M. Rivlin and Joshua M. Wiener (1988). Caring for the Disabled Elderly WhoWill Pay?. Washington, D.C.: The Brookings Institution, p. 6.
"Howard Fullerton (Apr. 1990). "New Labor Force Projections, Spanning 1988 to 2000,"Outlook 2000. Bureau of Labor Statistics, U.S. Department of Labor, pp. 2-3.
4-26
J44

b. Trend in Informal Home Care
The trend in informal home care is another factor that influences the demand for
home care workers. Decreases in the availability of informal family care result from (1) a
higher ratio of elderly parents to children due to increased life expectancy, delayed
marriage, and declines in fertility; (2) an increasing number of widowed elderly women
without spouses to care for them due to differences in the life spans of the sexes; and (3)
a decreasing number of women who are able and willing to take responsibility for care of
friends and relatives due to increases in female labor participation rates.'
c. Cost Containment Policies
Large increases in health care costs for acute and long-term care have prompted the
adoption of cost containment policies by payors (e.g., Medicare, Medicaid, private health
insurance, HMOs). Medicare increased its funding of home care in the early 1980s,
believing that home care was a more cost-effective mode of treatment than institutional
care; however, this resulted in large increases in expenditures. Medicare's adoption of the
111 Prospective Payment System (PPS) and its use of Diagnostic-Related Groups (DRGs) for
hospitals created an incentive to decrease hospital lengths of stay because providers are
reimbursed on a fixed amount per diagnosis, not on an individual patient's condition and
length of stay. As a result, patients are discharged from an institutional setting and to the
home setting much earlier, with many unable to take care of themselves. This shift of
health care to a less intense setting (from hospital to home) creates a greater demand for
home health services in the form of longer and more frequent visits, as well as more skilled
care.
'Feldman (1990), pp. 5-6.
4-27
145

d. Changes in Eligibility and Services Covered
Changes in program eligibility and the services provided, especially in federal
programs, have a significant impact on the demand for home care services. Changes in
the Social Security Act during the early 1980s decreased the barriers to home care use
under the Medicare program and resulted in increases in the amount of care provided at
home. Medicare expenditures on home health benefits grew from $726 million in 1980
(before implementation of OBRA 1980) to $2.2 billion in 1985." In addition, Medicare-
certified agency users increased from 35 per 1,000 Medicare enrollees in 1981 to 51 per
1,000 Medicare enrollees in 1985, while skilled nursing facility users remained
constant.' Any future long-term care policy changes with regard to eligibility, and
allowed services will also affect the demand for home care.
e. Availability of Nursing Home Beds
Although there has been an overall trend toward home care and away from
institutional care, the availability of nursing home beds will affect the demand for care in
the home: Nursing home and home care services are seen as "substitutable," and as
changes in the need for long-term care arise, there will be an interaction between these
two settings. In many states a Certificate of Need (CON) is necessary for institutions to
increase the number of nursing home beds. If the supply of beds is unable to keep up with
the demand for long-term care, due to either difficulty in obtaining a CON or lack of
appropriate capital investment, home care is likely to take up the extra slack.
550verview of Entitlement Programs, pp. 144-45.
"Marian Gornick and Margaret Hall (1988). "Trends in Medicare Use of Post-HospitalCare." Health Care Financing Review, 1988 Annual Supplement, p. 31.
4-28
3. Supply-Side Factors
There are several agency and worker surveys that identify major home health care
labor supply issues:
The National Association for Home Care (NAHC) conducted a national surveyof home care agencies in 1988, and asked what was the single mostimportant factor contributing to the homemaker and home health aideshortage. Exhibit 4.3 details the results available from the respondents.'Low wages and poor benefits are two of the most noted problems. Otherimportant issues include transportation problems, lack of advancement, poorrole image, and inadequate training.
There is potentially relevant information in the results of a New York statesurvey that studied worker characteristics, recruitment, and retention."While it is a state-specific survey, some of the results are applicable to thenation." Both current workers and workers who had left the home carefield were administered a perception-oriented survey. Only 26 percentagreed that the pay was good, 24 percent agreed that the fringe benefitswere good, and 23 percent agreed that chances for promotion were good.Even though 93 percent of the workers got a sense of accomplishment outof their jobs, the majority would not characterize their current home care jobas being financially rewarding or offering good chances for improvement.Another set of questions was asked of former workers regardirig the reasonsthey left the home care field. Exhibit 4.4 provides a summary of thequestions and response rates. Frequently mentioned reasons for leaving thefield included low wages, lack of advancement potential, poor benefits, andunstable hours.
A multi-state survey that was presented in Who Cares for Them? Workers inthe Home Care Industry focused on home care workers' attitudes towardtheir job. Home care workers were asked to rate aspects of their jobs basedon a five-point scale of their level of satisfaction (very satisfied, slightlysatisfied, not satisfied nor dissatisfied, slightly dissatisfied, and verydissatisfied). Exhibit 4.5 shows that workers were most dissatisfied withpay and benefit issues, their opportunity to advance, and the number of
"Jones (1988), p. 8. The survey went to 2,197 NAHC member agencies, over 1,000replied, and 841 were acceptable for data analysis.
"Long Term Care Policy Coordinating Council (1990).
"There are many unique features that characterize the New York home health caremarket; these include the high concentration of immigrants and minorities in the home healthfield, the large amounts of Medicaid spending on home care in New York, and the diversityof the populations in New York City and outlying counties. See Barnow (1988).
4-29
147

Exhibit 4.3: Factors Contributing to the Homemaker-Home Health Aide Shortage10
Factors Contributing to theHomemaker-Home Health Aide Shortage
Transportation Problems 15%
Poor Benefits 14%
No Advancement 14%
.......
Poor Role Image 11%
Low Wages 24%
Poor Supervision 2%High-tech Care 2%
Increased Paperwork 2%
Other 6%
Inadequate Training 10%
Source: Jones, Patricia. "The Home Care Personnel Shortage Crisis: Preliminary Results of a NAHCSurvey." CARING Magazine, May 1988.
4-30
BEST COPY AVAILABLE 148
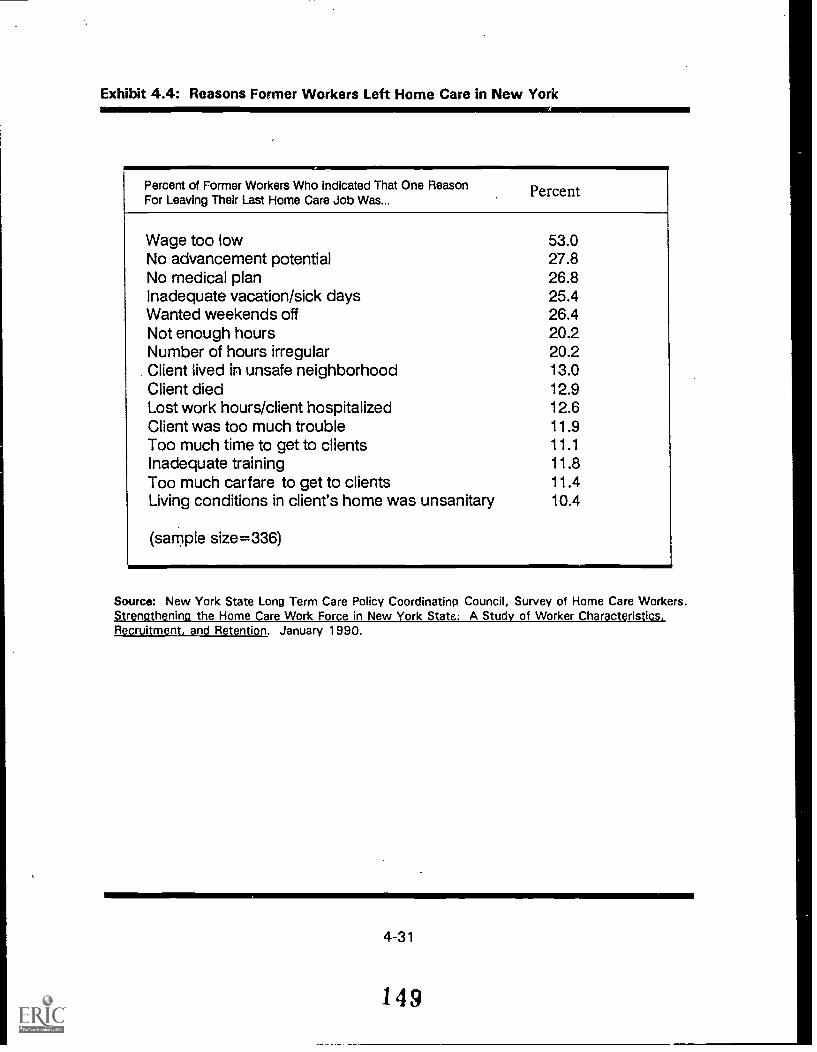
Exhibit 4.4: Reasons Former Workers Left Home Care in New York.A1111MIMINOLIMh
Percent of Former Workers Who indicated That One ReasonFor Leaving Their Last Home Care Job Was...
Percent
Wage too low 53.0No advancement potential 27.8No medical plan 26.8Inadequate vacation/sick days 25.4Wanted weekends off 26.4Not enough hours 20.2Number of hours irregular 20.2Client lived in unsafe neighborhood 13.0Client died 12.9Lost work hours/client hospitalized 12.6Client was too much trouble 11.9Too much time to get to clients 11.1Inadequate training 11.8Too much carfare to get to clients 11.4Living conditions in client's home was unsanitary
(sample size =336)
10.4
Source: New York State Long Term Care Policy Coordinatinp Council, Survey of Home Care Workers.r n h niratg_gLsthe Home Sarelnlialc orce in New Yo r lid&WM.(er Characteristics.
Recruitment, and Retention. January 1990.
4-31
149
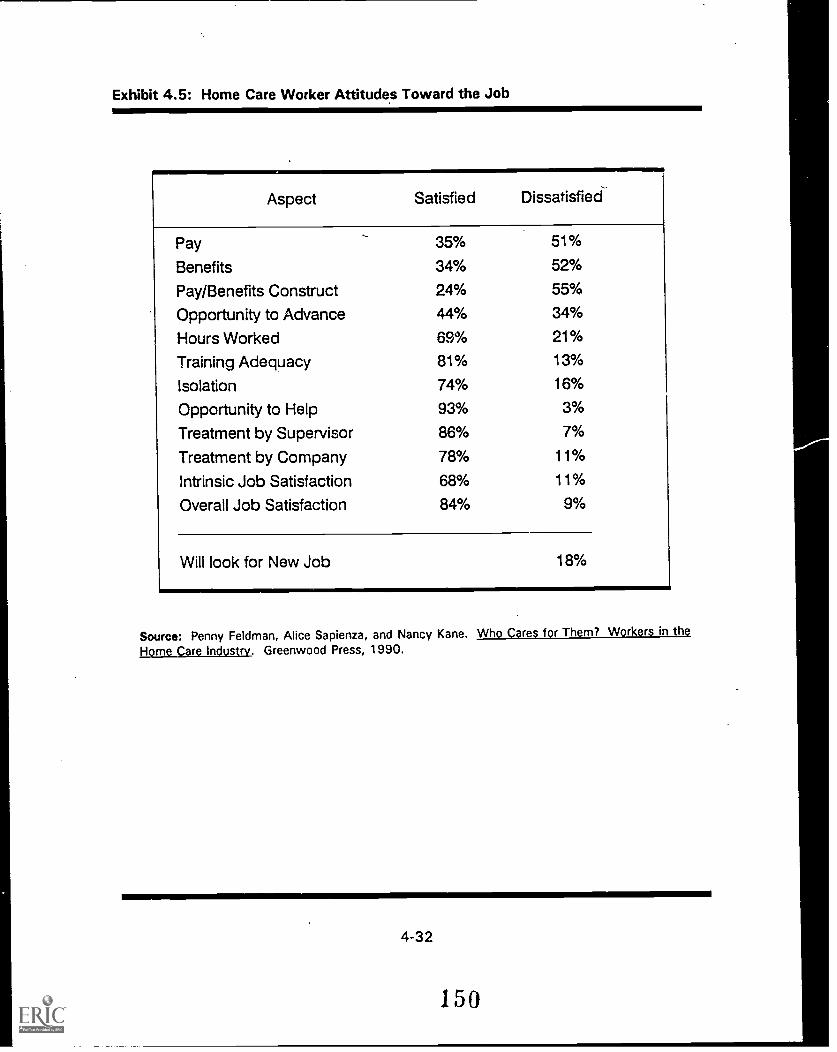
Exhibit 4.5: Home Care Worker Attitudes Toward the Job
Aspect
Pay 35% 51%
Benefits 34% 52%
Pay/Benefits Construct 24% 55%
Opportunity to Advance 44% 34%
Hours Worked 69% 21%
Training Adequacy 81% 13%
Isolation 74% 16%
Opportunity to Help 93% 3%
Treatment by Supervisor 86% 7%
Treatment by Company 78% 11%
Intrinsic Job Satisfaction 68% 11%
Overall Job Satisfaction 84% 9%
Will look for New Job 18%
Source: Penny Feldman, Alice Sapienza, and Nancy Kane. Who Cares for Them? Workers in the
Home Care Industry. Greenwood Press, 1990.
4-32

hours worked. Overall, home care workers were satisfied with their jobs;they were most satisfied with the opportunity to help others, the treatmentthey received from their supervisor and company, and the adequacy oftraining they received.'
The following supply factors were noted repeatedly in our interviews and in the
literature as being important: ability of agencies to provide stable work environments,
wage rates and fringe benefits available to home care workers compared to othdr options,
transportation and travel policies, job status and recognition of home care
paraprofessionals, advancement opportunities for home care workers, training for home
care workers, clear definitions and responsibilities for various types of home care workers,
and the size of the relevant labor pool of workers. In general, these items are barriers to
entry in the occupation, reasons for the high turnover within the occupation, or both.
a. Unstable Work Environment
Home health care workers face an extremely unstable work environment, in terms
of their ability to work a set number of hours each week. Unlike many occupations, the
work site is the client's home, and the home care worker must travel to and from that
home. Care that is authorized is limited each visit is often two to four hours in length,
and a case often lastS for only one or two months. (This is especially true for Medicare
cases, where care is often acute and short-term; private pay patients may have care for
longer periods of time.) Home care workers are usually not paid for their travel time
(although they sometimes receive a small subsidy for travel costs), so workers must have
at least two or three cases a day to piece together a full day's work. The work can
involve late night and weekend shifts and there are usually no set schedules, making work
hours extremely irregular; workers rarely receive extra compensation for accepting these
"Feldman (1990), p. 43.
4-33
151

irregular shifts. A sudden change in a client's health condition (e.g., recovery,
hospitalization, or death) often results in a lack of work for a few days because of the time
needed to schedule a new client (even though waiting lists for services usually exist).
According to the experts we interviewed, instability in hours creates an "economic roller
coaster" that has a pronounced effect on both recruitment and retention of workers; in
fact, a New York survey of home health care workers indicated that guaranteeing weekly
hours would have the largest effect on increasing job acceptability.'
b. Poor Wages and Fringe Benefits
Of the four occupations examined as part of this study, home health care is the
only one for which the hourly wages and fringe benefits are extremely poor. The experts
we interviewed note that home care workers perform a vital task in society, yet receive
poverty wages for their work. Some researchers also feel that the low wages and lack of
importance placed on the home care field is a form of discrimination against the women
and minorities who dominate the field, noting that some segments of society feel this is
"women's work" that does not merit substantial pay.' According to Rick Surpin, "Home
care paraprofessionals are the last large group of health care workers to seek adequate
wages and benefits and they are doing so at a time when financial resources are quite
scarce...they work in a relatively new, highly fragmented system that has not yet been
fully integrated into the health care mainstream.' This is partially due to the home care
"Long Term Care Policy Coordinating Council (1990), p. 36.
"issues of labor markets segregated by gender and race are discussed in Feldman (1990),pp. 20-23, and in Surpin (1988), p. 29.
"Surpin (1988), P. 28. Rick Surpin is a member of the New York City Home Care WorkGroup, President of Cooperative Home Care Associates (a worker-owned home health carecompany in New York City), and Director of the Home Care Education Project of theCommunity Service Society in New York.
4-34

workers' lack of a national collective voice; unions and other lobbying coalitions have been
able to increase wages on the state and local levels, but have not been able to produce
nationwide changes thus far.
Wages and benefits have a significant impact on both recruitment and retention of
workers. One survey indicates that introducing benefits -- specifically paid sick leave, paid
vacation leave, and tuition reimbursement would have a much bigger impact on job
acceptance than improving wages. " Medicare and payors for home care have placed
payment caps on reimbursement based on agencies' historical costs, and certified agencies
may not be fully reimbursed for wage increases given to their employees. By instructing
fiscal intermediaries to tighten the interpretation of "medical necessity," Medicare put
many agencies in a precarious position due to large increases in home care claim denials.
Contract bidding procedures, which are often used by state and local governments to
choose providers to deliver home care, reward agencies providing care at the lowest cost,
and therefore greatly discourage increases in wages or benefits. While a limited number of
firms do offer benefits such as sick leave, paid vacations, medical insurance, and tuition
reimbursement, aides must work at least 30 to 35 hours per week to qualify, and few
workers are consistently assigned an adequate number of hours. As a result, very few
home care workers receive fringe benefits.
Our interviews and published articles indicate that taking an aide job in an
institutional setting usually provides more financial stability than a home health care job.
While aides in institutional settings (e.g., nursing homes) are required to have, a level of
education and training similar to home care paraprofessionals, institutional positions offer
the stability of a full-time job, significantly higher wages (30 percent to 60 percent higher),
"Long Term Care Policy Coordinating Council (1990), pp. 37-38.
4-35
153

overtime compensation, shift differentials for night work, and annual salary increases. The
relatively low turnover within institutional positions makes them difficult to attain. Home
care jobs offer more responsibility and autonomy than institutional jobs, which may be
attractive to some people; however, the difference in compensation levels is a high
premium to pay for the independence.
There are a number of similar unskilled, nonsupervisory jobs which require the same
level of paraprr fessional workers as home care. Examples include hotel workers,
laundry/cleaning workers, beauty shop assistants, and clerical workers. In 1985, the
hourly average earnings for these occupations was about one dollar higher than for home
care. Because jobs that are similar offer better wages, it is difficult for the home care field
to attract and maintain a workforce.'
Another alternative for potential home care workers is public assistance. For many
low-skill individuals, public assistance is more lucrative than employment in home care.
Assuming (optimistically) that aides make $5 per hour, and are able to work 40 hours each
week, their annual salary would be $10,400." A welfare mother with two children and
child care costs of $240 per month (the standard Aid to Families with Dependent Children
allowance) would need to earn $12,000 as a home care worker to break even with the
public assistance alternative." This comparison, however, does not give consideration
65Kane (1989), pp. 29-30.
"Surveys indicate that the median annual salary is much lower. Feldman (1990), p. 25,estimates in the multi-state survey that median personal income was $7,000.
"Barnow (1988), p. 5-40.
4-36
154

to non-wage fringe benefits, such as medical insurance, which are available under AFDC
(i.e., Medicaid), but are rarely available to the home health worker."
c. Transportation and Travel
The transportation and travel required for home health care often deter many
individuals from accepting a position. The potential home care worker is typically not able
to afford a car and its upkeep, but the job requires travel back and forth to clients' homes.
In urban areas where public transportation networks are extensive, this is less of a
problem; however, in suburban and rural areas some potential workers cannot accept
home care jobs because they are unable to get to clients' houses. In fact, one of the
agencies we spoke with indicated that they did not have shortage problems, except for a
few periodic instances when they were unable to hire workers with cars.
d. Low Job Status
The job status of home health care workers is frequently cited as a problem in
recruiting workers. There is a general perception that home care is a "maid service," and
it has a well-known reputation for being an entry-level, dead-end job. The relatively
unskilled and untrained workforce exacerbates the poor image. Instead of being seen as
helping, caring individuals providing an important service, home care workers have
traditionally received little respect.
e. Limited Advancement Potential
Along with the poor job status of home care, the field is characterized by extremely
limited advancement potential. Most home care jobs are dead-end; there is often little
opportunity for raises or promotions. This lack of a career ladder creates retention
"The Family Support Act of 1988 does include transitional child care and medical benefitsstarting in April 1990; however, :hese were not available in the past.
4-37
155

problems. In general, firms feel that it is more expensive to retain workers by giving them
raises or benefits than it is to recruit new workers. Therefore, workers usually do not
receive financial rewards for their commitment to the occupation, the quality of care they
provide, or their acquisition of new skills. The lack of opportunity significantly impairs
many workers' desire to stay in home care jobs, despite the strong sense of self-worth and
fulfillment most home care workers receive from their jobs.
f. Lack of Training
In the past, lack of training has been a hindrance to new and existing workers. If
workers do not feel adequately prepared to take on the responsibility of caring for other
individuals, they may leave the field.69 While this may occur less with the
implementation of the 1987 OBRA regulations, it still applies to workers who serve private
pay clients exclusively or who are employed by non-certified home health agencies. Even
though training is inextricably linked to the quality of care provided, many agencies do not
offer their own training programs, and the worker almost always bears a portion of the
financial responsibility for training -- the worker must either pay for the training_course
and/or accept no wages while attending training. It is extremely rare that an agency pays
for training and also provides wages. The agencies' unwillingness to pay for training is
another indication that home care workers are seen as replaceable and that agencies do
not feel training these workers is a worthwhile investment. (Some agencies may not want
to risk losing aides for whom they have invested in training.)
"Donna Tuttle (Feb. 1989). "The Impact on Quality: Homemaker-Home Health AideTraining." CARING Magazine, p. 49; and Long )rm Care Policy Coordinating Council (1990),p. 41.
4-38
156
9. Unclear Definitions and Responsibilities
There has been a recent move on the part of home care advocacy groups and
experts in the field to establish clear definitions and responsibilities for home care workers.
The current disparity of titles and responsibilities allows some programs to take advantage
of workers by simply labeling them inappropriately. For example, calling a worker a
homemaker instead of home health aide, but requiring the same responsibilities, may allow
state programs to pay lower wages or not offer benefits (whereas the state would have to
provide these items if they called the same person a home health aide). Many feel that the
lack of job titles and corresponding responsibilities becomes a political game that
diminishes the status of the home care field.
h. Size of the Current and Future Labor Pool of Workers
The size of the current and future relevant labor pool of workers is a key factor in
the supply of home health workers. Bureau of Labor Statistics projections indicate that
there is currently a large pool of individuals with characteristics similar to those who have
traditionally been home care workers women, minorities, and the middle-aged (25 to 54
years old) -- and that their proportion in the labor force will continue to increase.' In
addition, the opportunities for many low-skill jobs are declining and are projected to
continue decreasing over the next 10 years.71 This is due to (1) large growth in
occupations with higher educational requirements, (2) stagnation of many jobs that are
low or very low skilled, and (3) declines in some industries that employ large number of
unskilled workers (primarily manufacturing businesses that have moved processes abroad
"See Burt Barnow, Amy Chasanov, and Abhay Pande (Apr. 1990). Financial Incentivesfor Employer-Provided Worker Training: A Review of Relevant Experience in the U.S. andAbroad. Washington, D.C.: Urban Institute Policy Memorandum, pp. 7-9.
71Barnow (1990), p. 4-7.
4-39
157

or have been impaired by foreign competition). As a result, there is a large potential pool
of workers available to enter the home care profession over the next 10 years. The actual
number of home care workers, however, depends not just on the size of the potential pool
of workers, but more importantly on the ability of the industry to recruit these potential
workers into home care. Based on the issues already discussed (e.g., low wages, lack of
fringe benefits, and job instability), the home care occupation may need to become more
attractive before enough workers can be recruited to meet increases in demand.
E. Adjustments to Shortages
This section discusses actions that are currently being taken by employers,
advocacy groups, and the government to alleviate the current shortages in home care
workers, and includes a discussion of the effects of these initiatives.
1. By Employers
Home care agencies are immediately affected when they must turn down business
or wait-list clients because they are unable to provide home care services. The strategies
discussed below have been taken by employers to alleviate personnel recruitment and
retention problems.
a. Increase Wages and Benefits
Some employers, either due to regulations, funding from demonstrations, or
through their own initiative, have increased wages or provided fringe benefits to home care
workers. Employers who offer higher wages and/or benefits are better able to hire the
workers they need. One employer we interviewed has a business that spans several
county jurisdictions. In one of the jurisdictions wages and benefits were mandated by city
4-40
158

wage orders at fairly high levels (over $7.00 per hour), while the other jurisdictio;is' wages
were not mandated and were significantly lower. Where wages are higher due to ,
mandates, there are no problems hiring workers, and in fact there are more qualified
applicants than open positions. However, in the neighboring jurisdictions where the
agency has fixed-price contracts with county social service departments, wages are lower
and there is a chronic need to fill home care positions. As a result, the agency loses
potential business to other home health care agencies with similar government contracts in
some of its jurisdictions.
Three demonstration projects were funded by the Ford Foundation to restructure
and upgrade the home care worker's job. The goal was to see if these changes could
improve worker satisfaction, retention, and continuity of care." One demonstration
provided experienced workers with an hourly wage increment of $0.50 and enhanced
fringe benefits; another demonstration increased hourly wages for workers serving
specifically defined difficult cases (e.g., senile dementia, Alzheimer's disease). The results
of these demonstrations indicated that increases in salaries and fringe benefits did improve
worker retention. However, if the funding for this demonstration had not been provided,
the agencies would not have had the autonomy to raise salaries and improve fringe
benefits due to the role of third-party payors.
Some wage-related strategies are currently being used in certain areas across the
country to improve recruitment and retention of workers. In New York, shift differentials
are offered and state rate increases are tied to the provision of fringe benefits. These
"Penny Hollander Feldman (February 1989). "The Ford Home Care Project: ReducingTurnover Among Paraprofessionals." CARING Magazine, p. 28-29; and Feldman, et al.(1990), Chapters 6-11.
4-41
159
techniques have proven effective in alleviating labor shortages of home health care
workers in the state.
b. Alleviate Transoortation Problems
As mentioned above, most firms do not reimburse home care workers for their
travel time, but some agencies provide a minimal subsidy for travel costs. The employers
we interviewed use two major ways to successfully overcome the transportation barriers
that often discourage a potential worker from accepting a home care position. One
method is to reimburse for transportation to and from jobs at a more substantial rate.
Another method is to have a company van transport aides either between their homes and
public transportation, or between their homes and client homes. This strategy was
adopted by one agency when hiring aides with cars became a major problem. Facilitating
travel can be used to recruit more aides, and reimbursing travel expenses and/or time can
help to make home care a more attractive job and stabilize the income of workers.
c. Improve Scheduling
Some agencies incorporate the concept of "shared aides" into their scheduling
process. A shared aide serves clients who live in close proximity to one another; this
pooling of clients helps stabilize a worker's hours and improves retention. Another
method employed by some agencies is "mapper" technology. Many agencies are currently
using inefficient, labor-intensive, and time-consuming methods where schedulers manually
keep records of workers and clients to schedule client visits. Scheduling is often difficult
because a home care worker may lack a telephone at home, may be on a case, or may be
at a second job. In addition, special consideration needs to be given to both the client's
needs (e.g., request for services in the morning) and the home care worker's needs (e.g.,
current caseload, transportation limitations). Increased use of management information
4-42
160
systems and "mapper" technology allows agencies to computerize their scheduling process
and utilize geographic information systems to plot transportation patterns that match
clients and workers more efficiently. The use of both shared aides and mapper technology
has helped New York to significantly change its severe labor shortage situation to a mild
one.
d. Provide Training
Not all agencies provide training, primarily because it is costly and the high turnover
characterizing the industry means that employers may not be able to recover their
investments. Some furnish pre-employment training; the workers usually do not receive a
salary and are hired for home care jobs at the end of the training/probation period. This is
an important tool because many potential workers cannot afford to pay for a course at a
local community college (or other location), but are willing to go unpaid for the period of
training. Some agencies we spoke with believe that their training programs are an
important tool in their recruitment of new workers.
One of the demonstration projects funded by the Ford Foundation offered extended
training in basic home care skills, and another demonstration gave experienced workers
specialized training in serving difficult cases. Other wage enhancements were offered in
conjunction with the training, and the combination effectively reduced turnover. In
addition to the acquisition of knowledge and skills, training helps home care workers get to
know their co-workers and supervisors, and identify themselves with the employing
agency. The study indicates that training can also help workers cope with isolation and
loneliness, which are often factors in the decision to leave home care. There is currently a
perverse system in the assignment of clients; new workers are often given "difficult"
cases to "test" their commitment to the job, while experienced workers are assigned
4-43
161

"easy" cases as their "reward" for their reliability. Offering specialized training to
experienced workers in problem areas is one step closer to creating an advancement
pattern for home care aides.
e. Increase Supervision
Some agencies increase the level of supervision and interaction with superiors in
order to alleviate worker stress and alienation, and make the worker feel like part of a
team. Employers who emphasize the role of supervision are more likely to ensure quality
service and to increase their workers' job satisfaction through the reinforcement of training
and the provision of an adequate support network.
f. Offer Recruitment Bonuses
One firm we interviewed offers small bonuses to current employees who bring in
friends or relatives as new workers. This helps the firm attract new employees, and it
emphasizes the importance of word-of-mouth recruiting practices.
2. By Advocacy Groups and Coalitions
According to the National Association for Home Care (NAHC) and others, defining
the levels of care and a common occupational terminology will combat the fragmentation
within the home care field, provide adjustments in compensation levels, and maintain
adequate standards for certification and appropriate training. NAHC planned a conference
aimed at standardizing the job titles, responsibilities, and levels of care within the home
care field. Many of the exputs we interviewed believe this is an important area in need of
significant improvement, and are supportive of such a venture. The adoption of a
nationally-recognized policy will need support by employers, state and federal
governments, and others to be effective. Experts believe that this will eliminate many of
4-44
162

the problems home care workers and agencies face due to the variety of funding sources,
reimbursement policies, and amounts of covered care.
3. By Government
a. Offer Transitional Assistance to Former Welfare Recioients
To attract welfare recipients into the home care occupation, the job needs to be a
better alternative than welfare. In the past, loss of medical insurance was one of the
major reasons home care was not attractive to welfare recipients (many home care
workers either are not offered medical insurance, or do not work enough hours to qualify
for it). Under the Family Support Act of 1988, the government introduced transitional
assistance for families after they lose AFDC eligibility because of increased earnings."
As of April 1990, states have extended Medicaid coverage for one year to families who no
longer qualify for cash assistance because of increases in earnings. During the second six-
month period, states can impose a premium for the Medicaid coverage on families whose
income is above the federal poverty level. In addition to Medicaid coverage, transitional
child care assistance is offered for 12 months; however, a sliding scale fee is imposed
based on the family's ability to pay. While it is still too early to tell, this transitional
assistance for welfare recipients may help recruit a new pool of workers into home care.
b. Increase State Reimbursement Levels
Some coalitions of agency administrators, workers, unions, elderly advocates, state
agencies, and elected representatives have joined together in an effort to pressure state
programs to increase wages and improve working conditions for home health aides. In
particular, the Massachusetts and New York reimbursement systems have allowed for
730verview of Entitlement Programs, p. 612-13.
4-45
163
significant salary increases and benefits. Massachusetts regulates a uniform wage rate for
all covered providers, and includes travel add-ens and differentials for weekend, evening,
and holiday hours. Massachusetts also includes optional incentive add-ons to allow
employers to encourage recruitment and retention. Under this type of add-on, agencies
can offer additional incentives, such as health insurance, paid vacation and sick leave,
guaranteed hours, or wage increments for tenure or performance, upon approval by the
state's regulatory commission. It is important to note that the progress made in
Massachusetts is the exception, and not the standard. This is a worthwhile area of
exploration, especia!ly in times of labor shortages, because it is through additional funding
and changes in.reimbursement policies that the wages of home care workers will
ultimately increase.
F. Conclusions and Recommendations
1. Conclusions
The home care occupation differs from the other three case studies because of the
low wages, the low skill requirements, the dichotomy between private pay clients and
clients from state and/or federally-supported programs in regard to training and
reimbursement, and the unique demands of delivering care in a home setting. These
characteristics create a labor market situation in which wages are inflexible for the
majority of workers, employers are extremely hesitant to make any investments in human
capital, and training and quality issues surround the non-Medicare segment of home care.
The research presented in this chapter indicates that there is a shortage of home care
workers in some areas of the country, and that it varies in intensity. The projected
increases in new jobs and the high turnover rates within the occupation at this time
4-46
suggest that innovative steps are necessary to combat current labor shortages and prevent
future ones. This can be done by decreasing the barriers of entry into the occupation,
increasing retention among home care workers, and increasing the productivity of existing
workers.
2. Recommendations
a. Increase Training
The new Medicare quality assurance legislation requires either (1) training and
competency certification, or (2) competency certification. Many of the experts we spoke
with are supportive of the new legislation; they believe it will foster higher quality care,
legitimacy for the field, and standards for training. Our research indicates that increased
training is directly related to job satisfaction -- better trained workers are more comfortable
with the daily responsibilities of their jobs. Experts in the home care field support training
requirements for All federal programs, including home care provided under all sections of
the Social Security Act. They feel that private pay patients should also be guaranteed
quality care, and that mandatory training for all home care workers is a necessary step in
assuring high quality care.
Feldman et al. suggest that training monies are well spent if they reinforce and
supplement basic training and develop special skills or a career track within the home care
field. The Ford Foundation demonstration projects indicate that training results in
decreased turnover and improvements in continuity of care. General training is a valuable
tool in building a support network of co-workers and supervisors, and specialized training
leads to the development of advancement opportunities for experienced home care
workers.
4-47
165
While increasing training may on the surface appear to hinder the ability of some
individuals to become home care workers, there are methods that could be adopted to
provide low-cost or free training to workers. Through the implementation of employer-
reimbursed training policies, federal programs such as the Job Training Partnership Act
(JTPA), and other state and federally-sponsored training demonstrations, potential workers
can be trained.' Firms that are hesitant to invest in training could require workers to sign
limited employment contracts (e.g., one year) so that employers could be reasonably
assured they would reap some of the benefits of their investment.
b. Establish a Career Ladder
To make the job more attractive to current and future home care workers,
employers should consider developing advancement opportunities for their workers.
Raises and promotions are more difficult under programs with tight reimbursement limits;
however, some strategies can be taken. Some researchers suggest that there should be
two promotional tracks established in the home care field -- administrative and clinical.'
Home care workers could be offered a clinical track, where they would be given the
opportunity to specialize in certain types of care (e.g., Alzheimer's disease, AIDS) that
would involve the acquisition of advanced skills through additional training and would be a
promotion from more general care. Progression to administrative positions, such as senior
home aides, field supervisors, and caseload managers, could be established as an alternate
career track. These two advancement opportunities could improve recruitment and
retention, the quality of care provided, and the image of home care work.
74It is important to note that home care workers' wages are currently so low that JTPAprograms are unwilling to train workers for the occupation. Such training would effect theirability to meet performance standards.
75Feldman (1990), pp. 202-3.
4-48
c. Standardize Titles and Definitions
As discussed earlier, some groups are devising proposals for consistent national job
titles, responsibilities, and levels of care within the home care field. While some states
already have standard titles and definitions, a national approach is necessary to ensure
that all government-funded programs adopt the same standardized system. This is an
opportunity to increase the status of the home care occupation, provide needed
adjustments in compensation levels, and maintain adequate standards for certification and
appropriate training. A successful standardization of state and national titles and job
descriptions needs support by employers, state and federal governments, and other
involved interest groups. NAHC and others believe that this will eliminate many of the
controversies that currently exist due to the variety of funding sources, reimbursement
policies, and amounts of covered care.
d. Increase Waoes and Benefits
As discussed earlier, mandated wage levels and current reimbursement policies
have an overwhelming effect on the wages and benefits workers receive. Studies cited
earlier have shown that increases in wages and benefits, primarily in the form of vacation
and sick leave, paid tuition, and medical insurance, have a major impact on job
acceptability. Serious consideration by employers and the government should be given to
increasing wages and benefits for home care workers. Federal and state governments
regulate wages for a significant portion of the home care market, and they should consider
more frequent and accurate wage updates, especially during periods of rapid wage
increases or particularly tight labor markets. It should be noted that one of the experts we
spoke with warned that agencies view increasing wages as the easiest way to recruit new
workers, and that requesting additional reimbursement should not be the only method used
4-49
167

to improve recruitment and retention. However, the issues of poverty wages and lack of
fringe benefits that plague most of the home care industry exist primarily because of the
low reimbursement levels of third-party payors.
Some researchers state that the home care industry should strive toward parity
with institutional wages that home-based and institutional aides perform the same basic
tasks and societal preference supports home care over institutionalization. Making the
wages and benefits of home care aides competitive with those in hospitals and nursing
homes requires changes in third-party reimbursement. Other wage-related methods of
recruiting and retaining workers include wage differentials and expanded benefits to
reward employees for length of service, reliability, and acquisition of new skills. This
provides positive reinforcement and could be linked to advancement opportunities to make
the job more attractive. Case closings have been identified as times associated with
higher levels of turnover, so transitional pay could be used for valued aides who are
between cases. Like aides in institutions, home care workers could also be given shift
differentials to compensate them for weekend and late night work.
e. Stabilize Hours
Full-time, year-round employment for those workers willing to make this
commitment could be a goal for employers; this would provide a comprehensive solution
to many of the unstable aspects of the job (e.g., hours, wages, and benefits). There are
some workers who desire part-time work (20 to 30 percent), and of the remaining
wf kers, many may not be able to work full-time. A guaranteed hours policy is more
easily attained when clients get four or more hours of service, but it is much harder when
the average length of visits is shorter.
4-50
168

There are a number of intermediate methods that could also be adopted to stabilize
the hours and pay that home care workers receive. One method is through the use of
shared aides one aide serves two or more clients in the same area and can therefore
work more hours. Another way is to set a minimum visit time (e.g., four hours), so that
an aide is given a minimum number of hours for each client visit, even if the visit is
relatively short. A guaranteed number of hours each week could be given so that when
events occur outside of the home care worker's control (e.g., a client cancels a visit, a
previous client no longer needs services, and a new client has not been scheduled), the
worker would still get credit for the hours. Paying workers for their time spent traveling to
and from clients' homes would increase workers' hours and would offset lost earnings for
time spent in transit between clients.
CHAPTER 5
CASE STUDY OFELECTRICAL AND ELECTRONIC ENGINEERS
A. Description of the Occupation
Electrical and electronic engineers design, develop, test, and supervise the
manufacture of electrical and electronic equipment. According to the Department of
Labor's Dictionary of Occupational Titleq:
...This group includes occupations concerned with the application of the laws ofelectrical energy and the principles of engineering for the generation, transmission,and use of electricity...Electrical engineers conduct research and developmentactivities concerned with design, manufacture, and testing of electricalcomponents, equipment, and systems; applications of equipment to new uses; andmanufacture, construction, and installation of electrical equipment, facilities, andsystems... Electronic engineers conduct research and development activitiesconcerned with design, manufacture, and testing of electronic components,products, and systems, and in development of applications of products tocommercial, industrial, medical, military, and scientific uses.'
Some areas of specialization within the field include electrical power transmission and
generation; atomic power generation; electrical and electronic components; equiprrLrit and
systems manufacturing; radio and television broadcasting; and telephone, telegraph, and
electronic computer engineering. There are also many highly specialized and emerging
sub-specialties within the field -- e.g., industrial robotics control systems, stealth (defense)
technology, and artificial intelligence. As demonstrated in Exhibit 5.1, electrical and
electronic engineering is the largest branch of engineering employing 581,000 workers
or 31.2 percent of all engineers in 1990. An overview of other leading branches of
'U.S. Department of Labor, Employment and Training Administration (1977).Dictionary of Occupational Titles. Fourth Edition, p. 17.
5-1
170
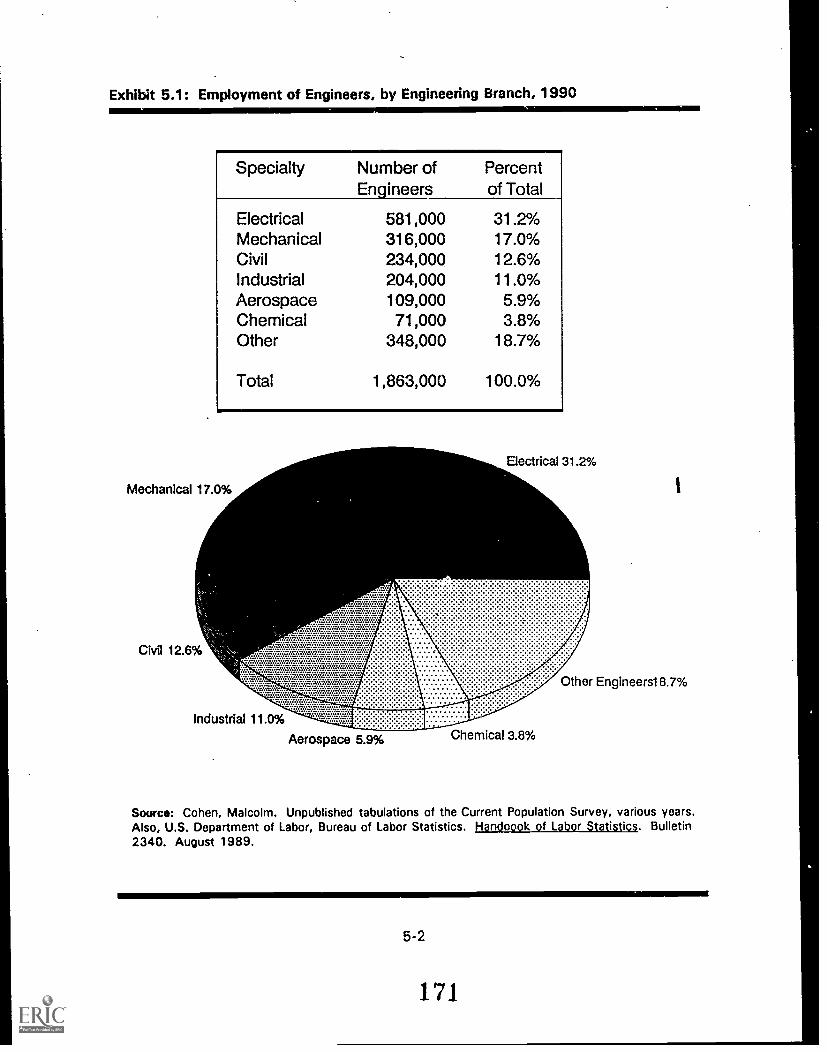
Exhibit 5.1: Employment of Engineers, by Engineering Branch, 1990
Specialty Number of PercentEngineers of Total
Electrical 581,000 31.2%Mechanical 316,000 17.0%Civil 234,000 12.6%Industrial 204,000 11.0%Aerospace 109,000 5.9%Chemical 71,000 3.8%Other 348,000 18.7%
Total 1,863,000 100.0%
Electrical 31.2%
Mechanical 17.0%
Industrial 11.0%
Aerospace 5.9% Chemical 3.8%
Other Engineersl 8.7%
Source: Cohen, Malcolm. Unpublished tabulations of the Current Population Survey, various years.Also, U.S. Department of Labor. Bureau of Labor Statistics. Hand000k of Labor Statistics. Bulletin2340. August 1989.
5-2
171
engineering is shown in Exhibit 5.2.2
The electrical and electronic engineering field is of considerable interest to labor
market analysts for several reasons. Engineering is a field that has had alternating periods
of (at least perceived) shortages and surpluses for a number of years. Shortages within
the engineering field have been the subject of many studies since World War II. For
example, in 1958 Arrow and Capron used the engineer-scientist market as the focus of
their seminal work on labor shortages. They offered several possible explanations for what
they termed 'dynamic shortades":
...A dynamic shortage is a possible explanation of the observed tensions in theengineer-scientist market because (1) there has been a rapid and steady rise indemand, (2) the elasticity of supply is low, especially for short periods, and (3) thereaction speed on the engineer-scientist market may, for several reasons, beexpected to be slow.'
Over the years, there have also been periodic complaints by employers about an
inadequate supply of engineers.' Although the unemployment rate among engineers is
typically quite low, there have also been times when there was an apparent surplus of
engineers:
...When the nation cooled its miliary-industrial jets in the early 1970s, widespreadunemployment among engineers resulted. Hordes of designers laid off from the lull
'Estimates of the number employed within the field are based on the CurrentPopulation Survey. For more detail on each of the branches of engineering, see: U.S.Department of Labor, Bureau of Labor Statistics, Occupational Outlook Handbook 1990-91, pp. 63-70.
'Kenneth J. Arrow and William M. Capron (May 1959). "Dynamic Shortages and PriceRises: The Engineer-Scientist Case." Quarterly Journal of Economics.
'For example, C.B. Jolliffe (June 21, 1956), in "Electronics: A Case Study of theShortage of Scientists and Engineers," delivered to the President's Committee for theDevelopment of Scientists and Engineers, in discussing his own company argued: "Wecould use one thousand more right now without any question. Where could we use them?Mainly on military contracts because it is here -- rather than in consumer and industrialelectronics --that the pinch is tightest."
5-3
172
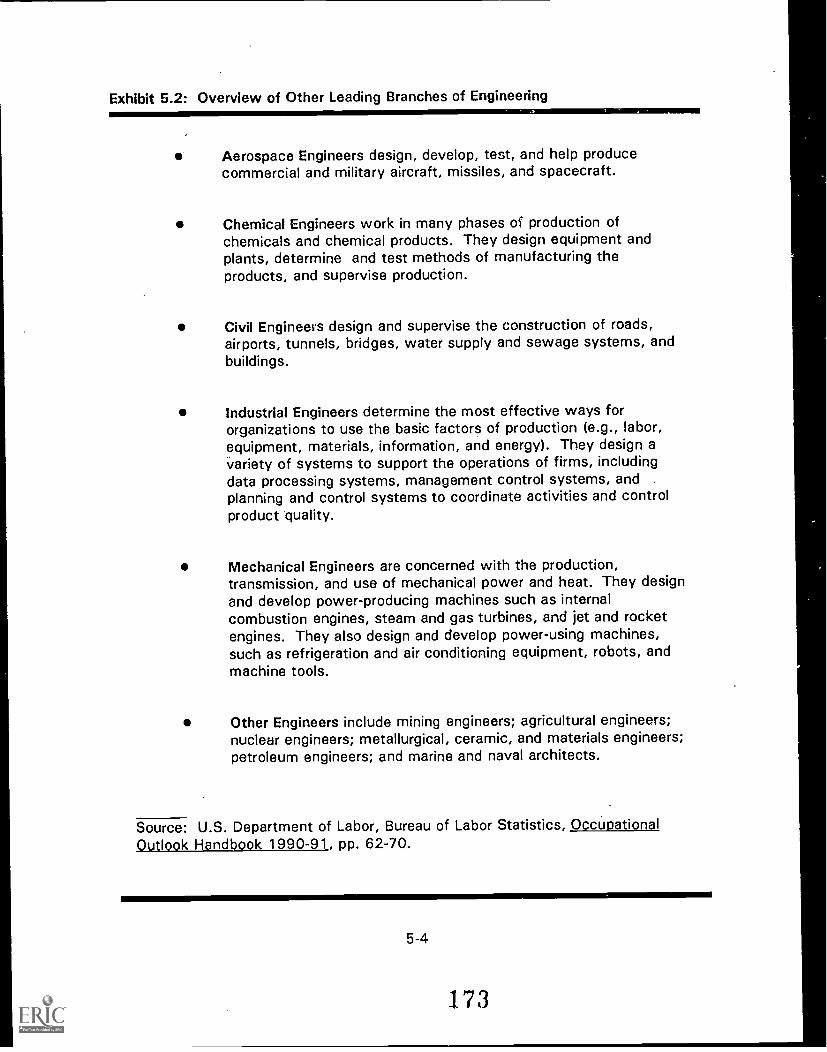
Exhibit 5.2: Overview of Other Leading Branches of Engineering
Aerospace Engineers design, develop, test, and help producecommercial and military aircraft, missiles, and spacecraft.
Chemical Engineers work in many phases of production ofchemicals and chemical products. They design equipment andplants, determine and test methods of manufacturing theproducts, and supervise production.
Civil Engineers design and supervise the construction of roads,airports, tunnels, bridges, water supply and sewage systems, andbuildings.
Industrial Engineers determine the most effective ways fororganizations to use the basic factors of production (e.g., labor,equipment, materials, information, and energy). They design avariety of systems to support the operations of firms, includingdata processing systems, management control systems, and .
planning and control systems to coordinate activities and controlproduct quality.
Mechanical Engineers are concerned with the production,transmission, and use of mechanical power and heat. They designand develop power-producing machines such as internalcombustion engines, steam and gas turbines, and jet and rocketengines. They also design and develop power-using machines,such as refrigeration and air conditioning equipment, robots, andmachine tools.
Other Engineers include mining engineers; agricultural engineers;nuclear engineers; metallurgical, ceramic, and materials engineers;petroleum engineers; and marine and naval architects.
Source: U.S. Department of Labor, Bureau of Labor Statistics, OccupationalOutlook Handbook 1990-91, pp. 62-70.
5-4
173
in NASA projects joined those let go from Vietnam wartime industries. Newspaperseven ran stories of engineers driving taxi cabs.'
Interest gly, the literature on engineering shortages is not conclusive or consistent:
different analysts have used alternative definitions of a shortage and different evidence to
assess whether a shortage exists.' At the time this study was done, some analysts were
forecasting serious shortages of engineers, which they predicted would emerge in the mid-
1990s and continue well into the next century:
...The demographics of the college-age population combined with estimates of thepercentage of students who will pursue careers in science and engineering indicatesignificant shortfalls between supply and demand for the next several decades atboth the baccalaureate and Ph.D. levels. If these projects are realized, the shortageof technical personnel will have a major impact on economic growth, internationalcompetitiveness, and national security.'
A 1989 report by the National Science Foundation' warned of the potential for future
scarcities of natural scientists and engineers because of decreases in the overall number of
bachelor degree graduates, declining interest in natural science and engineering among
college students, and an increasing retirement rate among existing scientists and engineers
in the 1990s. Other researchers and organizations have argued that no such shortages are
'D. L. Gardner (February 26, 1990). "What Defense Cuts Mean to Engineers."Design News.
'For example, Arrow and Capron criticize Blank and Stigler for defining a shortage asfollows: "A shortage exists when the number of workers available (the supply) increasesless rapidly than the number demanded at the salaries paid in the recent past." Arrow andCapron argue that Blank and Stigler's definition relates to the symptoms of a shortagerather than the existence of a shortage. See David J. Blank and George J. Stigler (1957).The Demand and Supply of Scientific Personnel. New York: National Bureau of EconomicResearch.
'R. Atkinson (April 27, 1990). "Supply and Demand for Scientists and Engineers: ANational Crisis in the Making." Science, p. 425.
'National Science Foundation, Divisicn of Policy Research and Analysis (November 13,1989). Future Scarcities of Scientists and Engineers: Problems and Solutions, WorkingDraft.
5-5
174
likely and that the natural forces of labor supply and demand will result in adequate
numbers of engineers into the next century. In short, there is substantial disagreement
about the likelihood of future shortages and the factors that might lead to such shortages.
Electronic and electrical engineers comprise the largest and perhaps most dynamic
of the engineering fields. lt is an occupation that is integral to the national defense (and
substantially affected by defense expenditures), as well as essential for high technology
advancement in the service and manufacturing sectors. Rapid technological change has
meant that this group of engineers has had to continually upgrade their skills or become
obsolete.
Finally, the Bureau of Labor Statistics, the National Science Foundation, and many
other organizations forecast rapid growth in employment for electrical and electronic
engineers and the rapid emergence of new specialties in the field. For example, the BLS
predicts that employment of electrical and electronic engineers will grow by 48 percent
between 1986 and 2000 (under a moderate growth assumption), well above the average
for all occupations. At a time when many electrical and electronic engineers are expected
to reach retirement age and a sharp decline in the number of new entrants to the
workforce is anticipated, this strong demand has heightened concern among employers
and labor market analysts about the potential for future shortages.
B. Training and Recruitment of Electrical and Electronic Engineers
1. Educational Qualifications and Entry Requirements
General qualifications and entry requirements for electrical and electronic engineers
are described in detail in the Department of Labor's Occupational Outlook Handbook:
A bachelor's degree in engineering from an accredited engineering program isgenerally acceptable for beginning engineering jobs. College graduates with a
5-6

degree in science or mathematics may occasionally qualify for some engineeringjobs, especially in engineering specialties in high demand. Most engineeringdegrees are granted in branches such as electrical, mechanical, or civil engineering.However, engineers trained in one branch may work in another.'
There are also two- and four-year college programs in engineering technology, which
prepare students for practical design and production work, rather than for jobs that require
more theoretical scientific and mathematical knowledge. Graduate training is essential for
engineering faculty positions, but is not required for the majority of entry-level engineering
jobs. Many engineers earn master's degrees to learn about new technologies or
specialties, to broaden their education, and to enhance promotion opportunities."
Admission requirements for undergraduate engineering schools include coursework
in advanced high school mathematics and the physical sciences. In a typical four-year
college curriculum, the first two years are spent studying basic sciences e.g.,
mathematics, physics, chemistry, introductory engineering, and the humanities, social
sciences, and English. In the last two years, most coursework is in engineering, usually
with a concentration in one branch. Some colleges and universities offer five-year
master's degree programs.
Many universities also offer five- and even six-year cooperative engineering
programs, which formally combine classroom study and practical work experience
permitting students to finance part of their educations. For example, at the George
Washington University's School of Engineering and Applied Science, student involvement
in the cooperative program is generally arranged after the student has successfully
completed the first year of study. Employers participating in the program typically require
90ccuoational Outlook Handbook, p. 63.
"Occupational Outlook Handbook, p. 63.
5-7
176
students to work during the summer immediately following their freshman year. The
students will then return to the university for their sophomore year, working again during
the second summer. During the third and fourth years, students alternate between work
and classroom instruction each semester, returning to the classroom for the fifth and final
year. Alternately, they may work for a full academic year and then return to the university
the following year. The emphasis and schedule of cooperative programs vary somewhat
from university to university. For example, the cooperative program at the Massachusetts
Institute of Technology (MIT), which involves research-minded firms such as Texas
Instruments, IBM, General Electric, Bell Labs, Comsat, and others, stresses the importance
of engineering students being involved in actual research with their employers.
Cooperative programs not only provide an important link between study and work, but also
present an opportunity for employers to evaluate students as prospective permanent
employees and for students to view employers in terms of their interests and future plans.
After graduation, new entrants to the electrical and electronic engineering field
usually do routine work under the close supervision of experienced engineers, and may
also receive formal classroom or seminar-type training. For example, according to an
official we interviewed at a major computer manufacturing firm, new electrical engineers
will "generally work closely with a more experienced engineer, who will show them the
ropes." As they gain knowledge and experience, they are assigned more difficult tasks
with greater independence to develop designs, solve problems, and make decisions.
All states (and the District of Columbia) require registration for engineers whose
work may affect life, health, or property, or who offer their services to the public.
Registration generally requires a degree from an engineering program approved by the
5-8
177
Accreditation Board for Engineering and Technology (ABET), four years of relevant work
experience, and passing a state competency examination."
2. Methods Employers Use to Recruit Electrical and Electronic Engineers
Employers use a variety of methods to recruit electrical and electronic engineers.
These methods will differ depending upon whether the firm is seeking to recruit new
entrants to the field from engineering schools or experienced engineers who are already
employed within the workforce.
The most pervasive method for recruiting students enrolled in engineering programs
at the baccalaureate, master's, and Ph.D. degree levels is through university or college
job placement offices. University job placement programs have established close
relationships with many employers who recruit electrical and electronic engineers. For
example, the job placement office at one leading engineering university schedules
interviews for 700 companies that come to the campus annually. According.to the
director of the job placement office at a second major engineering university, much of the
burden and costs of the job search for the graduating students is eliminated:
...It is really almost too easy for students. As is the case at almost all engineeringschools, flocks of firms come to the school for the purpose of recruiting engineers.Resumes of students are even kept in a data base at the school. Recruiters comeon campus and interview students. If the interview is successful, a secondinterview usually follows and then the student will be flown out to the employer fora round of interviews. If this goes well, the employer then will extend anemployment offer.
Universities also hold job fairs, where employers set up booths to provide prospective
recruits with information about employment opportunities and to schedule interviews.
"Occupational Outlook Handbook, p. 63.
5-9
175
For their part, employers make substantial investments to ensure an adequa;:e flow
of engineering manpower to meet their specific requirements. Large- and medium-size
employers typically maintain a recruiting force that has strong linkages with the
engineering colleges and universities and regularly visit the campuses to conduct
interviews and attend job fairs. Employers will typically target certain engineering schools
that have, in the past, provided a steady stream of qualified recruits. For example, one
large defense contracting firm interviewed for this report has "team captains" (or college
recruiters) who work closely with job placement offices and faculty at 25 "key"
universities (from which the firm has had the best success in past recruiting) to identify
potential engineering and science graduates. Through university job placement programs,
employers are able to generate a large pool of qualified candidates and to rapidly screen
this group to a core of engineers who e c likely to meet their specific workforce
requirements.
Cooperative programs are also an important method that employers ust, to recruit
electrical and electronic engineers from universities. As discussed earlier, these programs
enable students to alternate periods of college study with periods of work experience. The
work experience provides employers with opportunities to evaluate the students as
prospective employees. For example, the Cooperative Education Program in Engineering at
the George Washington University estimates that about half of the cooperative education
graduates remain in permanent positions with their employers after graduation."
The methods used by employers to recruit experienced engineers.differ from those
used to attract new entrants. Some employers run advertisements in newspapers and
"The George Washington University (1989). The George Washington UniversityBulletin: School of Engineering and Applied Science: 1989-1990. Washington, D.C., p.41.
5-10
I 7 3
trade journals, which are aimed at recruiting experienced engineers (most often with two
to five years of experience) or engineers with expertise in certain sub-specialties of
electrical and electronic engineering. Other companies use employment agencies, though
this method entails the payment of a fee by the employer to the recruitment agency.
Word-of-mouth and professional trade organizations can also be important sources of
prospective employees. Finally, employers also receive job applications and resumes
directly from potential recruits. For example, a recruiter from a major aerospace company
indicated that the firm receives in excess of a half million job applications and resumes per
year.
3. Methods Workers Use to Seek and Obtain Employment
The methods that electrical and electronic engineers use to seek and obtain
employment are, for the most part, the reverse of those used by employers. Again, the
methods vary according to whether the individual is still attending a university (either as
part of an undergraduate or graduate program) or is already in the workforce. Those who
are currently attending college typically use the services available through the university's
job placement office. These services assist students with developing resumes, analyzing
career interests, identifying potential employers, and scheduling interviews and visits with
companies. As discussed earlier, students also attend job fairs/workshops, respond to
advertisements in trade journals and newspapers, and rely on word-of-mouth. A good
opportunity for students to observe employers comes through the cooperative programs
run by most engineering schools.
5-1 1
Experienced electrical and electronic engineers are most likely to use the following
methods: (a) send resumes to employers, (b) respond to advertisements in trade journals
or newspapers, (c) use search firms, or (d) rely on word-of-mouth referrals.
4. Characteristics of Workers in the Occupation
Much has been written in recent years regarding the demographic characteristics of
engineers and the ways in which these characteristics may affect future labor market
conditions. Several of the most important trends are discussed below.
a. Age Distribution
Two aspects of the age distribution of electrical and electronic engineers have led
some analysts to forecast possible shortages:
an increase in the average age of the existing workforce, which is expectedto boost replacement demand; and
a decline in the number of B.S. and Ph.D. graduates with engineeringdegrees, which is expected to reduce the supply of new entrants into theengineering fields.
The average age of electrical and electronic engineers has risen sharply in recent years.
Between 1976 and 1986, the proportion of electrical and electronic engineers over 50
years of age increased from about 17 percent to 31 percent. Further, in 1976 about 27
percent of employed electrical and electronic engineers were under 30 years old compared
to 18 percent in 1986." Replacement demand for electrical and electronic engineers is
expected to nearly double during the latter part of the 1990s, as increasing numbers of the
existing engineering workforce reach retirement age. For example, it is estimated that
"National Science Foundation (1988). Profiles -- Electrical/Electronics Engineering:Human Resources and Funding. Washington, D.C.: NSF-88-326, p. 15.
5-1 2
one-third of the current faculty at engineering schools will have to be replaced during the
1990s.
At the same time, the supply of new entrants into engineering programs at the
bachelor's, master's, and Ph.D. degree levels is expected to decrease because of the
demographics of the U.S. population:
...The crisis that is being widely predicted over the next decade is rooted in anincontrovertible demographic fact: because of low birthrates in the 1960s and1970s, the college age population the raw material for tomorrow's educatedworkforce is shrinking. According to the Census Bureau, numbers of 18- to 24-year-olds will bottom out at a little under 24 million in the mid-1990s comparedwith a peak of over 30 million in 1980. Currently, a little over 5 percent of 22-year-old Americans earn B.S. degrees. Unless that fraction is increased, say theNational Science Foundation (NSF), there will be a shortage of 400,000 scientistsand 275,000 engineers in 2006.14
In order to make up for this shortfall in college students, the proportion of students
receiving engineering degrees will have to increase substantially. Yet, according to
Atkinson, the National Science Foundation, and others this increase is unlikely:
..Can such an increase be accomplished? The historical data are not encouraging.Between 1960 and 1980, the fraction of 22-year-olds receiving baccalaureatedegrees in the natural sciences and engineering (including computer science)combined hovered at about 4 percent. In the 1980s, the rate began to rise andreached 5.3 percent in 1986. Recent data indicate that the conferral rate in 1990will be 4.5 percent, at best. That rate would have to increase to more than 6percent by the turn of the century to maintain the current supply of scientists andengineers."
Hence, many labor market analysts though not all are concerned with the supply
pipeline of new entrants to the field of electrical and electronic engineering.
14C. Holden (June 30, 1989). "Wanted: 675,000 Future Scfrantists and Engineers."Science. Vol. 244, p. 1536.
'Atkinson (1990), p. 427.
5-13
b. Women
While over the past 20 years there h-s been a substantial increase in the number of
women entering engineering fields, the rate of growth has slowed recently and perhaps
even reversed. Women now earn about 45 percent of bachelor's degrees and 30 percent
of Ph.D.'s in science and engineering. While women earned only about 3 percent of all
engineering degrees in 1976, they were awarded almost 15 percent of the degrees in
1985. According to statistics compiled by the Engineering Manpower Commission, the
number of employed women engineers grew at a rate almost five times greater than that
of the profession as a whole between 1976 and 1986, and more women have entered the
engineering labor force over the past few years than ever before.'
Trends within the electrical and electronic engineering field have followed similar
trends as those for engineering overall. According to the National Sciencer'oundation,
despite recent gains women still account for a relatively small proportion of the
occupation: in 1986, women comprised 3.3 percent of all electrical and electronic
engineers. Among major engineering branches, only mechanical engineering (2.4 percent)
had a lower proportion of women. Across all engineering fields, women accounted for 4.1
percent of engineers. Despite the relatively small proportion of women within the
occupation, until recently the annual rate of growth for women in electrical and electronic
engineering was four times that of men: between 1976 and 1986, the annual growth rate
for women in this field was 28 percent compared to 7 percent for men."
"S. Kandebo (December 5, 1988). "Declining Female Enrollments Threaten Gains ofEarly 1980s." Aviation Week and Space Technology, p. 41.
"Profiles -- Electrical/Electronics Engineering: Human Resources and Funding, p. 17.
5-14
Despite long-term gains, there is concern that the entry of women into engineering
careers has stalled in recent years. According to the Engineering Manpower Commission,
the number of females enrolled in engineering schools climbed rapidly from 1973 to 1982,
but peaked in 1983 when women accounted for 17 percent of all freshmen engineering
students. Thereafter, female freshmen engineering enrollments declined, to about 15
percent. The retention rate for women in engineering from their freshman year to
bachelor's degree also has dropped." There also appears to have been a slight decrease
in female interest in engineering. For example, an annual survey of freshmen found that in
1982 about 4 percent of all women freshmen were interested in engineering, while in
1986 that figure had dropped to 3 percent." Holden attributes the slowdown in the
number of women entering the sciences and engineering to lingering disparities between
males and females:
...The slowdown is not surprising: Women scientists still suffer higherunemployment, lower pay, and fewer opportunities for promotion at every degreelevel than do males. According to the Office of Technology Assessment (OTA),"the gender gap in recruitment to and participation in science, reduced by twodecades of gains, is in danger of widening now."'
The slackening pace at which women are entering the engineering professions has
caused some concen about the future supply pipeline for engineers. Net new entrants to
the workforce into the next century are expected to be mainly women, immigrants, blacks,
and Hispanics -- groups that have been traditionally underrepresented in engineering fields.
For example, according to Workforce 2000, the female share of the labor force will
continue to grow:
"Kandebo (1989), p. 39.
"Kandebo (1989), p. 41.
"Holden (1989), p. 1537.
5-15
184
...By the year 2000, approximately 47 percent of the workforce will be women,and 61 percent of women will be at work. Women will comprise about three fifthsof the new entrants into the labor force between 1985 and 2000.2'
In order to replace retiring engineers and meet the expected strong demand for electrical
and electronic engineers, many analysts feel that continued growth in the entry of women
into the field will be an important factor in determining whether there is an adequate
supply of future engineers.
c. Blacks and Other Minorities
The number of blacks and Hispanics entering engineering fields is very low, with
little to suggest a change in the future. While blacks and Hispanics make up more than 20
percent of the U.S. population, they receive only about 7 percent of B.S. degrees and 4
percent of all science and engineering doctorates. Approximately 1 percent of individuals
with doctorates in the physical sciences, engineering, math, and computer sciences are
black and Hispanics.' In certain fields within the physical sciences, it is next to
impossible to find a black candidate to interview for an open position. For example, in
1988 only one black U.S. citizen earned a Ph.D. in mathematics and only one in computer
science.23
Within engineering in 1987, blacks earned about 3 percent of the bachelor's
degrees, 1.5 percent of the master's degrees, and 0.4 percent of the Ph.D.'s. Hispanics
earned 2.3 percent of engineering bachelor's degrees, 1.6 percent of master's degrees,
21W. Johnston and A. Packard (June 1987). Workforce 2000: Work and Workers forthe Twenty-First Century. The Hudson Institute, p. 85.
22Office of Technology ,\ssessment (1988). Educating Scientists and Engineers:Grade School to Grad School.
"R. Pool (April 27, 1990). "Who Will Do Science in the 19900" Science. Vol. 248,p. 435. oat
5-16
185
and 0.6 percent of Ph.D.'s. The lack of success in recruiting minorities to engineering, in
general, is also reflected in employment trends within the electrical and electronic
engineering field. In 1986, a relatively small proportion of electrical and electronic
engineers were black (2.1 percent), Native American (0.6 percent), and Hispanic (2.1
percent). The proportion of blacks within the electrical and electronic engineering branch
was marginally above the average for all engineering professions (1.7 percent). Between
1976 and 1986, the average annual rate of employment growth for blacks (15 percent)
was about double the rate for whites (7 percent)."
Despite some recent growth, most analysts expect that the number of blacks,
Hispanics, and other minorities (except Asian-Americans) entering engineering will continue
to be very low:
...There are at least some bright spots in the picture of women in the sciences, butthis is not true of underrepresented minorities blacks, Hispanics and AmericanIndians. These groups have failed to come into the system in sizable numbers, andnothing seems likely to happen in the 1990s to increase the flow ofunderrepresented minorities into science much past the trickle that is now.'
The historic problems that the electrical and electronic engineering field (and engineering,
in general) has had in attracting minorities is of future concern, in part, because minorities
(and women) are expected to be a major source of the net new workers who will be
available to replace retiring workers with!n the field. For example, according to Workforce
...Over the next 13 years, blacks, Hispanics and other minorities will make up alarge share of the expansion of the labor force. Non-whites, for example, will
'Profiles -- Electrical/Electronics Engineering: Human Resources and Funding, p. 18-
25Pool (1990), p. 435.
5-17
186
comprise 29 percent of the net additions to the workforce between 1985 and 2000and will be more than 15 percent of the workforce in the year 2000."
Unfortunately, most researchers feel that given the continued high drop-out rates from
high school and college by blacks, Hispanics, and American Indians -- and the extreme
reluctance of these groups to enter (and complete) engineering programs -- little change
can be expected in the future.
Among minorities, there is one bright spot the increasing number of Asian-
Americans entering engineering fields. For example, if both U.S. citizens and foreigners
with permanent visas are included, Asian-Americans account for 16 percent of all Ph.D.'s
in engineering.' At one leading engineering university, 27 percent of the freshman class
in the 1990-91 academic year was Asian-American. According to the National Science
Foundation, in 1987, 6.6 percent of all electrical and electronic engineers were Asian-
Americans, compared to 5.4 percent for all engineering fields.'
C. Employment and Earnings in Electrical and Electronic Engineering
In this section, aggregate data on employment and earnings is presented for
electrical and electronic engineers in relation to general trends within the United States and
compared to other engineering occupations.
28Johnston and Packard (1987), p. 89.
"Pool (1990), p. 435.
2eProfiles -- Electrical/Electronics Engineering: Human Resources and Funding, p. 19.
5-18
187
1. Employment Trends
The number of persons employed as engineers, and within the various branches of
engineering, depends upon the source of the data. As shown in Exhibit 5.3, three major
sources provide data on the number of engineers employed within various engineering
branches (two of these data sources are collected by the Department of Labor's Bureau of
Labor Statistics). According to which source is used, the number of e7Igineers employed
within the electrical and electronic engineering field varies. For example, in 1986
estimates of the number of electrical and electronic engineers ran as high as 620,700 (by
the National Science Foundation) and as low as 391,529 (according to the BLS'
Occupational Employment Survey)." Recognizing these differences, we have used
Current Population Survey (CPS) data because it (a) uses the same definition as the
decennial census, (b) is available on an annual basis broken down by distinct engineering
branch, (c) is comparable with unemployment and earnings data, and (d) is based on an
individual's (rather than an employer's) identification of their work.
Changes in the level of employment within an occupation generally reflect trends in
demand for workers within the occupation. An increase in employment suggests an
increaseln demand, while a decrease suggests a decline in demand. A labor shortage is
generally more likely to occur if demand is increasing than if it remains constant or
declines because the supply of workers may not be sufficient to meet the growing
demand.
"See J.D. Alden (January 1989). "How Many Engineers?" American Association forEngineering Societies, Inc., Number 92, for a detailed discussion of the various data basesused to estimate the number of engineers and a methodology for partially ieconcilingdifferences in estimates of employment across various data bases.
5-19
188
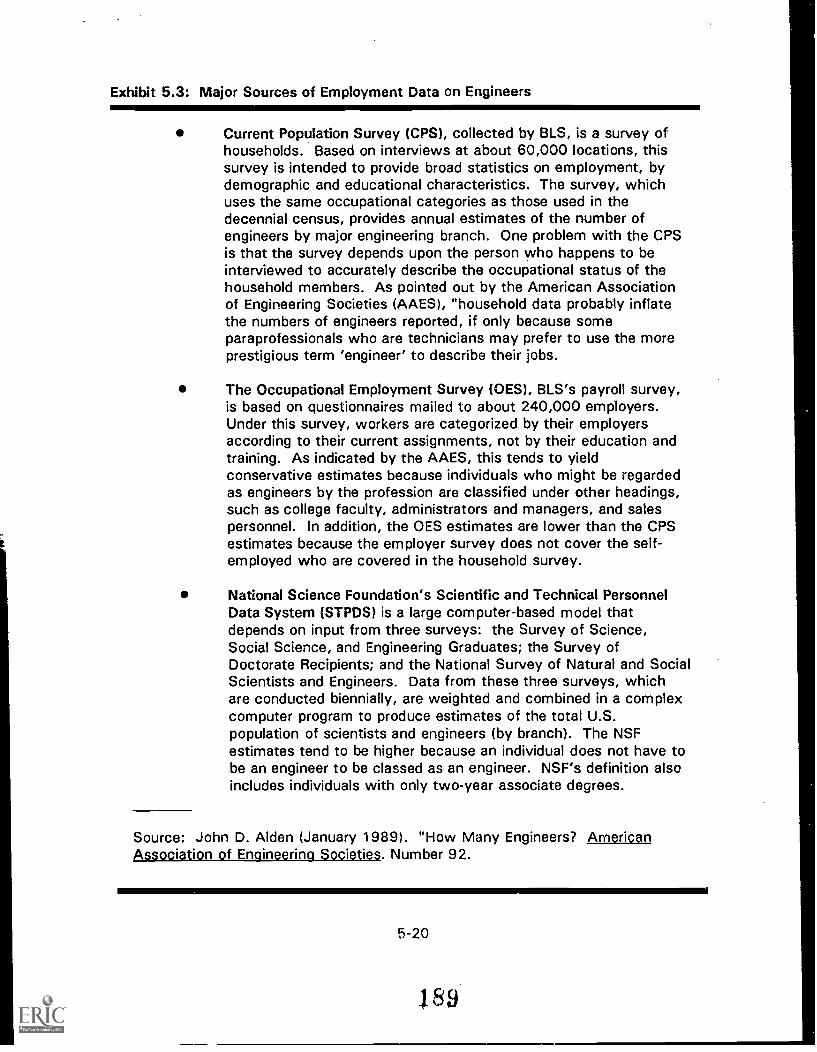
Exhibit 5.3: Major Sources of Employment Data on Engineers
Current Population Survey (CPS), collected by BLS, is a survey ofhouseholds. Based on interviews at about 60,000 locations, thissurvey is intended to provide broad statistics on employment, bydemographic and educational characteristics. The survey, whichuses the same occupational categories as those used in thedecennial census, provides annual estimates of the number ofengineers by major engineering branch. One problem with the CPSis that the survey depends upon the person who happens to beinterviewed to accurately describe the occupational status of thehousehold members. As pointed out by the American Associationof Engineering Societies (AAES), "household data probably inflatethe numbers of engineers reported, if only because someparaprofessionals who are technicians may prefer to use the moreprestigious term 'engineer' to describe their jobs.
The Occupational Employment Survey (OES), BLS's payroll survey,is based on questionnaires mailed to about 240,000 employers.Under this survey, workers are categorized by their employersaccording to their current assignments, not by their education andtraining. As indicated by the AAES, this tends to yieldconservative estimates because individuals who might be regardedas engineers by the profession are classified under other headings,such as college faculty, administrators and managers, and salespersonnel. In addition, the OES estimates are lower than the CPSestimates because the employer survey does not cover the self-employed who are covered in the household survey.
National Science Foundation's Scientific and Technical PersonnelData System (STPDS) is a large computer-based model thatdepends on input from three surveys: the Survey of Science,Social Science, and Engineering Graduates; the Survey ofDoctorate Recipients; and the National Survey of Natural and SocialScientists and Engineers. Data from these three surveys, whichare conducted biennially, are weighted and combined in a complexcomputer program to produce estimates of the total U.S.population of scientists and engineers (by branch). The NSFestimates tend to be higher because an individual does not have tobe an engineer to be classed as an engineer. NSF's definition alsoincludes individuals with only two-year associate degrees.
Source: John D. Alden (January 1989). "How Many Engineers? AmericanAssociation of Enoineering Societies. Number 92.
5-20
189
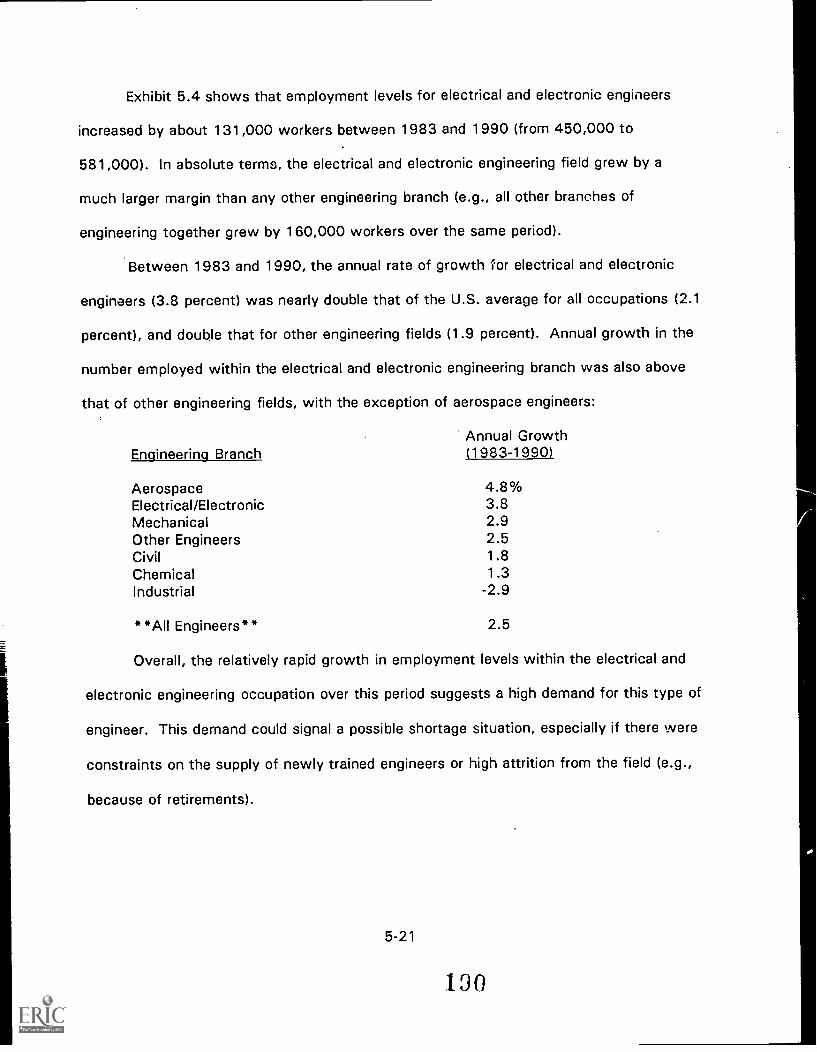
Exhibit 5.4 shows that employment levels for electrical and electronic engineers
increased by about 131,000 workers between 1983 and 1990 (from 450,000 to
581,000). In absolute terms, the electrical and electronic engineering field grew by a
much larger margin than any other engineering branch (e.g., all other branches of
engineering together grew by 160,000 workers over the same period).
Between 1983 and 1990, the annual rate of growth for electrical and electronic
engineers (3.8 percent) was nearly double that of the U.S. average for all occupations (2.1
percent), and double that for other engineering fields (1.9 percent). Annual growth in the
number employed within the electrical and electronic engineering branch was also above
that of other engineering fields, with the exception of aerospace engineers:
Annual GrowthEngineering Branch (1983-1990)
Aerospace 4.8%Electrical/Electronic 3.8Mechanical 2.9Other Engineers 2.5Civil 1.8Chemical 1.3Industrial -2.9
**All Engineers** 2.5
Overall, the relatively rapid growth in employment levels within the electrical and
electronic engineering occupation over this period suggests a high demand for this type of
engineer. This demand could signal a possible shortage situation, especially if there were
constraints on the supply of newly trained engineers or high attrition from the field (e.g.,
because of retirements).
5-21
1 0 0
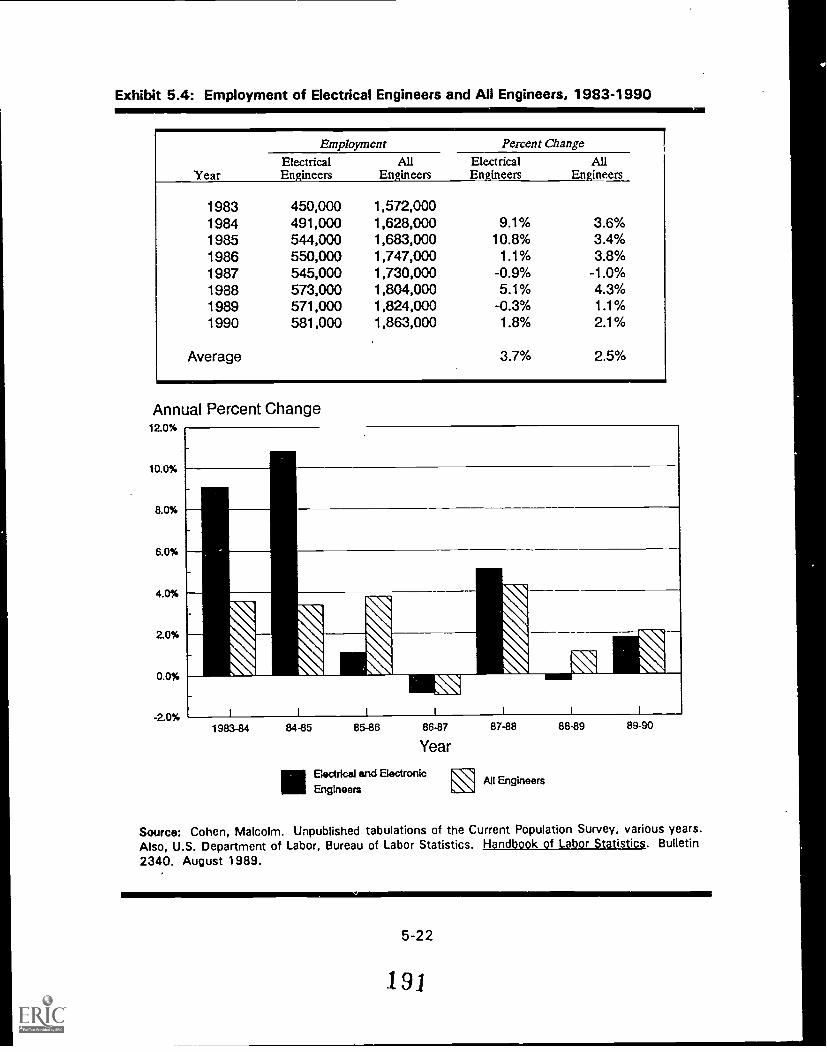
Exhibit 5.4: Employment of Electrical Engineers and All Engineers, 1983-1990
Year
Employment Percent Change
ElectricalEngineers
AllEngineers
ElectricalEngineers
AllEngineers
1983 450,000 1,572,0001984 491,000 1,628,000 9.1% 3.6%1985 544,000 1,683,000 10.8% 3.4%1986 550,000 1,747,000 1.1% 3.8%1987 545,000 1,730,000 -0.9% -1.0%1988 573,000 1,804,000 5.1% 4.3%1989 571,000 1,824,000 -0.3% 1.1%1990 581,000 1,863,000 1.8% 2.1%
Average 3.7% 2.5%
Annual Percent Change12.0%
10.0%
8.0%
6.0%
4.0%
2.0%
0.0%
-2.0%
III
i
1983-84
I I I
86-8784-85 85-86
1
c1 1
Year
IllBectrIcal end Electronic
Engineers
87-88
All Engineers
88-89 89-90
Source: Cohen, Malcolm. Unpublished tabulations of the Current Population Survey, various years.Also, U.S. Department of Labor, Bureau of Labor Statistics. Handbook of Labor Statistics. Bulletin
2340. August 1989.
5 -22
191
2. Occupational Unemployment Rates
As illustrated in Exhibit 5.5, the unemployment rate for electronic and electrical
engineers -- like most other branches of engineering is well below the average for all
workers in the United States and is somewhat below that of persons with four or more
years of college. For example, in 1990 the unemployment rate of electrical and electronic
engineers was 1.7 percent, compared to 5.5 percent for all workers 16 years of age or
older, and 2.2 percent for all workers 25 years of age or older with four or more years of
college. Over the past eight years (1983 and 1990), the unemployment rate for electrical
and electronic engineers has been very low (e.g., not exceeding 1.8 percent) and relatively
stable. Throughout this period, the unemployment rate has been consistently well below
that of the labor force as a whole (e.g., by as much as 7.9 percent lower in 1983). While
consistently lower than the unemployment rate for persons with four or more years of
college, the differences are less (e.g., the greatest difference was 1.8 percent in 1983)
and have narrowed in recent years. Overall, between 1983 and 1990, the unemployment
rate for electrical and electronic engineers averaged 1.6 percent compared to 6.7 percent
for all workers and 2.4 percent for workers with four or more years of college.
The unemployment rate for all branches of engineering (an average of 2.1 percent
between 1983 and 1990) was substantially below the rate for the U.S. labor force. For
example, from 1983 and 1990, none of the branches of engineering experienced
unemployment greater than 3.8 percent (compared to an annual average of 6.7 percent for
the U.S. labor force). In contrast to other branches of engineering, the unemployment rate
for electrical and electronic engineers was relatively low:
5-23
192
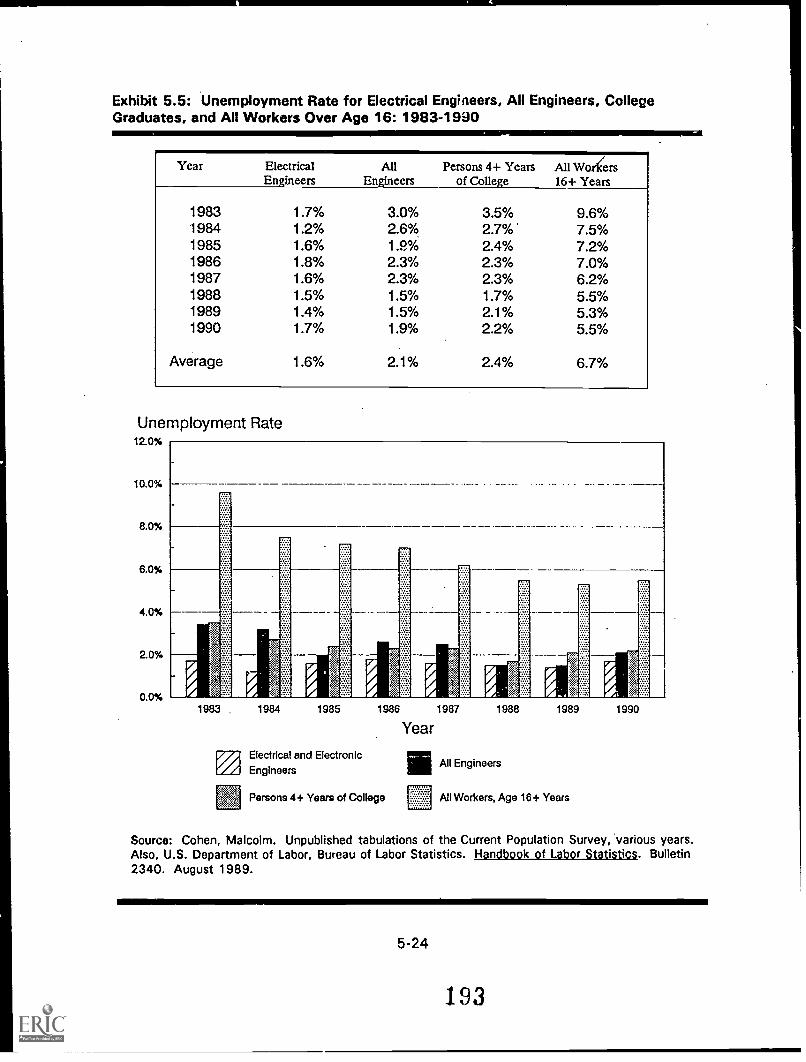
Exhibit 5.5: Unemployment Rate for Electrical Engineers, All Engineers, CollegeGraduates, and All Workers Over Age 16: 1983-1990
Year ElectricalEngineers
AllEngineers
Persons 4+ Yearsof College
All Worers16+ Years
1983 1.7% 3.0% 3.5% 9.6%1984 1.2% 2.6% 2.7% 7.5%1985 1.6% 1 .9% 2.4% 7.2%1986 1.8% 2.3% 2.3% 7.0%1987 1.6% 2.3% 2.3% 6.2%1988 1.5% 1.5% 1.7% 5.5%1989 1.4% 1.5% 2.1% 5.3%1990 1.7% 1.9% 2.2% 5.5%
Average 1.6% 2.1% 2.4% 6.7%
Unemployment Rate12.0%
10.0%
8.0%
6.0%
4.0%
20%
0.0%1984 1985
Electrical and Electronic
Engineers
1986 1987
Year
Persons 4+ Years of College
1988
ill All Engineers
1989
All Workers, Age 16+ Years
1990
Source: Cohen, Malcolm. Unpublished tabulations of the Current Population Survey, various years.Also, U.S. Department of Labor, Bureau of Labor Statistics. Handbook of Labor Statistics. Bulletin2340. August 1989.
5-24
193
AverageUnemployment Rate
Engineering Branch 11983-1990)
Aerospace 1.3%Electrical/Electronic 1.6Chemical 1.6Mechanical 2.0Civil 2.5Industrial 2.6Other Engineers 2.9
**All Engineers'. 2.1
Other things being equal, most analysts would consider the relatively low
unemployment rate for electrical and electronic engineers (in the range of 1.2 percent to
1.8 peicant between 1983 and 1990), as an indicator of potential shortages within this
occupation. For example, of the 193 occupations that Cohen examined in 1989, only 38
had an unemployment rate under 1.6 percent. While the relatively low unemployment rate
for electrical and electronic engineers is an indication of "tightness" within the labor
market, it is not in itself sufficient proof that shortages exist.
3. Earnings Trends
As mentioned in Chapter 2, the rate at which wages rise within an occupation is
often viewed as the clearest indication of whether a shortage of workers exists (at least
over the short-term). Rapidly rising wages within an occupation are generally viewed as a
signal that at least a temporary imbalance exists between the labor supply and demand.
Exhibit 5.6 shows median weekly earnings for electrical and electronic engineers from
1983 to 1990. This exhibit demonstrates that earnings for electrical and electronic
engineers were consistently much higher than the average for the U.S. labor force and
individuals with four or more years of college. For example, in 1990 the median weekly
5-25
194
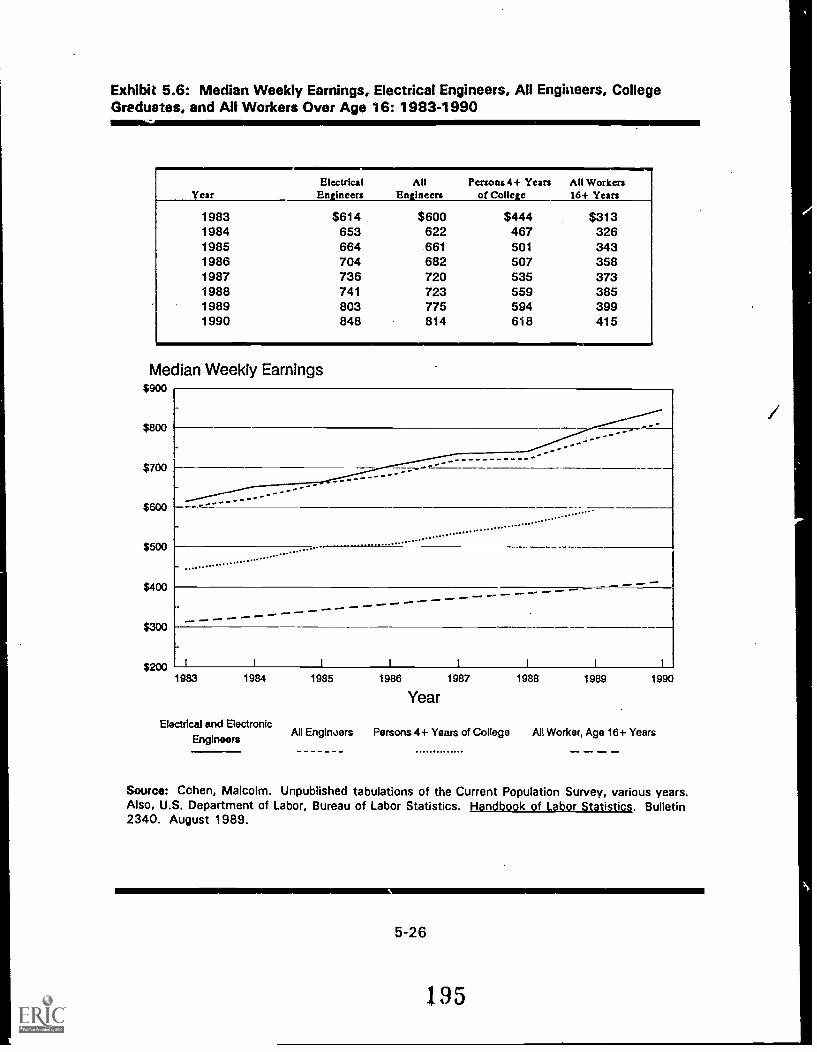
Exhibit 5.6: Median Weekly Earnings, Electrical Engineers, All Engineers, CollegeGreduates, and All Workers Over Age 16: 1983-1990
YearElectricalEngineers
AllEngineers
Persons 4+ Yearsof College
All Workers16+ Years
1983 $614 $600 $444 $3131984 653 622 467 3261985 664 661 501 3431986 704 682 507 3581987 736 720 535 3731988 741 723 559 3851989 803 775 594 3991990 848 814 618 415
Median Weekly Earnings$900
$700
$600
$500
$400
$300
-----
...........
.............................
................................
.............................
................$200
1983
1
1984 1985 1986 1987
Electrical and Electronic
Year1988 1989 1990
All Enginoers Persons 4+ Years of College All Worker, Age 16+ YearsEngineers
Source: Cohen, Malcolm. Unpublished tabulations of the Current Population Survey, various years.Also, U.S. Department of Labor, Bureau of Labor Statistics. Handbook of Labor Statistics. Bulletin2340. August 1989.
5-26
195
earnings for electrical and electronic engineers were $848, compared to $415 for all
workers age 16 and older and $594 for persons age 25 and older with four or more years
of college. Wages of electrical and electronic engineers were also somewhat above the
average for all engineers (e.g., in 1990, the median weekly earnings for all engineers were
$814). Among the major branches of engineering, only chemical engineers earned more in
1990:
Engineering BranchMedian Weekly
Earnings (1990)
Chemical $ 890Electrical/Electronic 848Aerospace 830Mechanical 805Civil 790Engineers, NEC 768Industrial 764
**All Engineers** 814
While the median weekly and lifetime earnings of electrical and electronic engineers
were relatively high compared to other U.S. workers, the rate of change in earnings is
oenerally considered to be a more reliable indicator of whether shortages exist within an
occupation. Exhibit 5.7 points out the cha....;e in median weekly earnings for electrical and
electronic engineers compared to all U.S. workers (16 years of age or older), persons with
four or more years of college, and all engineers. This exhibit shows that median weekly
earnings for electrical and electronic engineers increased by 4.7 percent on an annual basis
over the eight-year period. This is somewhat above the median average for all U.S.
workers (4.1 percent), but below that for all persons with four or more years of college
(4.8 percent). The average annual change in median full-time wages for electrical and
electronic engineers was marginally above the average for all engineers, but below those
of several engineering branches:
5-27
196
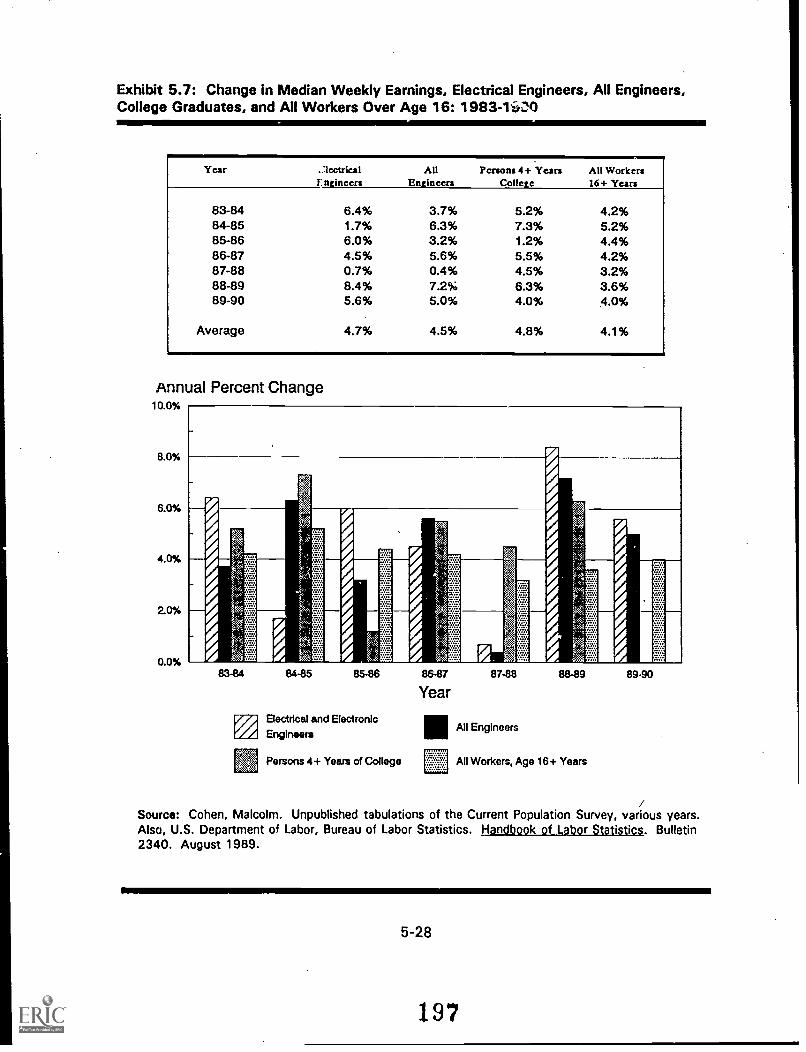
Exhibit 5.7: Change in Median Weekly Earnings, Electrical Engineers, All Engineers,College Graduates, and All Workers Over Age 16: 1983-10
Year .lectriealF. ngineers
AllEngineers
Persons 4+ YearsCollege
All Workers16+ Years
83-84 6.4% 3.7% 5.2% 4.2%84-85 1.7% 6.3% 7.3% 5.2%85-86 6.0% 3.2% 1.2% 4.4%86-87 4.5% 5.6% 5.5% 4.2%87-88 0.7% 0.4% 4.5% 3.2%88-89 8.4% 7.2% 6.3% 3.6%89-90 5.6% 5.0% 4.0% 4.0%
Average 4.7% 4.5% 4.8% 4.1%
Annual Percent Change10.0%,
8.0%
6.0%
4.0%
20%
0.0%83-84 84-85 85-86
p; Electrical and ElectronicEngineers
Persons 4+ Years of College
86-87
Year87-88 88-89
III All Engineers
LEAll Workers, Age 16+ Years
89-90
Source: Cohen, Malcolm. Unpublished tabulations of the Current Population Survey, various years.Also, U.S. Department of Labor, Bureau of Labor Statistics. Handbook of Labor Statistics. Bulletin2340. August 1989.
5-28
197
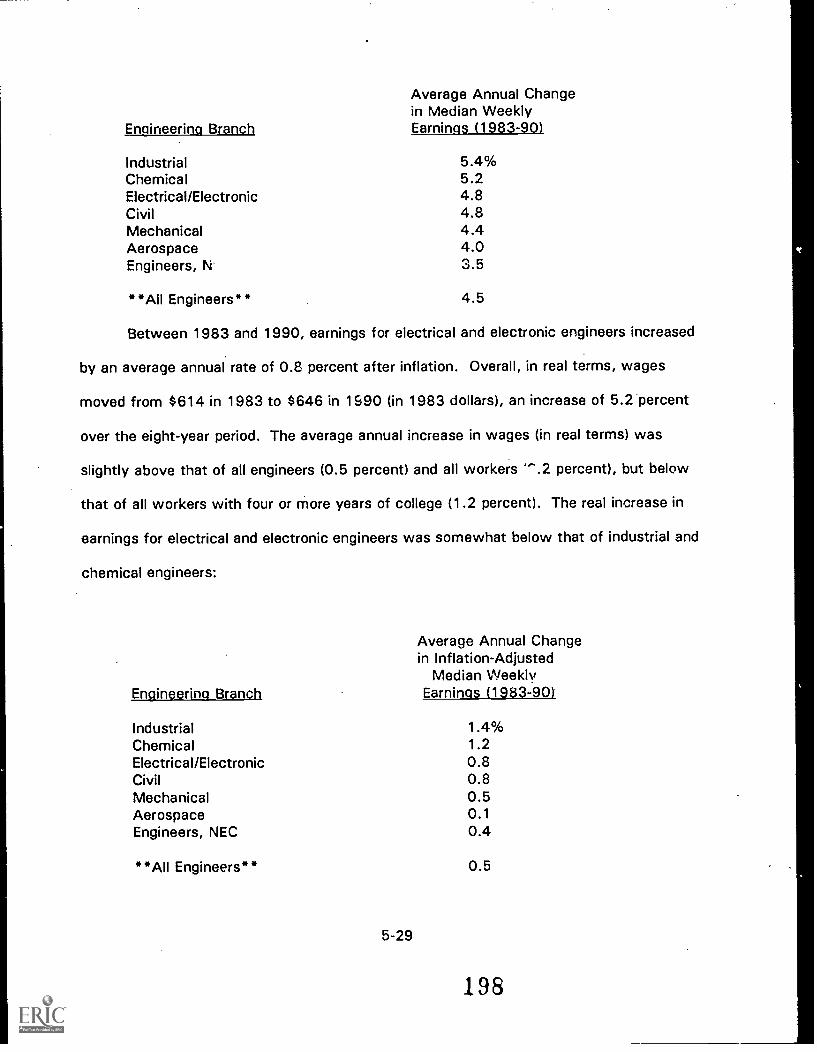
Engineering Branch
IndustrialChemicalElectrical/ElectronicCivilMechanicalAerospaceEngineers, N
Average Annual Changein Median WeeklyEarnings (1983-90)
5.4%5.24.84.84.44.03.5
"All Engineers** 4.5
Between 1983 and 1990, earnings for electrical and electronic engineers increased
by an average annual rate of 0.8 percent after inflation. Overall, in real terms, wages
moved from $614 in 1983 to $646 in 1990 (in 1983 dollars), an increase of 5.2 percent
over the eight-year period. The average annual increase in wages (in real terms) was
slightly above that of all engineers (0.5 percent) and all workers .2 percent), but below
that of all workers with four or more years of college (1.2 percent). The real increase in
earnings for electrical and electronic engineers was somewhat below that of industrial and
chemical engineers:
Engineering Branch
IndustrialChemicalElectrical/ElectronicCivilMechanicalAerospaceEngineers, NEC
"'All Engineers**
5-29
Average Annual Changein Inflation-Adjusted
Median WeeklyEarnings (1983-90)
1.4%1.20.80.80.50.10.4
0.5
198
D. Factors Contributing to a Labor Shortage
1. Presence of a Shortage
a. Current Labor Market Conditions
There is a general consensus among most employers and labor market analysts that
while there may be some spot shortages (i.e., in emerging fields, specialty areas, and
perhaps some localities), there is not a current shortage of electrical or electronic
engineers. In fact, with the recent cutbacks in defense spending coupled with the
slowdown in the economy, there have been recent layoffs within the field during the past
year. The following comments from the interviews conducted for this report reflect the
general consensus about the apparent absence of shortages of electrical and electronic
engineers at the present time:
Director of the Manpower Division of a Major Engineering Society. There are nocurrent shortages for electrical and electronic engineers. The market for this typeof engineer has been soft for the last couple years. There are probably someshortages in some emerging technology areas such as optical electronics, andspecial interest areas such as the environment, but these type of shortages alwaysexist and are not true shortages.
Personnel Recruiter from a Major Employer of Electrical and Electronic Engineers.There are lots of job applications from electrical and electronic engineers noshortages. The real problem we face is in finding recruits with computer sciencebackgrounds. We have double the applications for electrical and electronicengineers compared to programmers.
Manpower Analyst Specializing in the Field of Electrical and Electronic Engineers.There are no current shornges of electrical and electronic engineers. If anything,there appears to be a surplus of engineers because of the slack economy andcutbacks in the defense industry. Because of the forces of supply and demandwithin a free market economy, shortages cannot last for long. Only within acommand economy or a market-based economy with wage and price controls dosuch shortages occur. There have not been real shortages of engineers sincecontrols were placed on the U.S. economy during World War II.
Director of a Job Placement Office for a Major Engineering School. There has beena recent slowdown in the demand for engineers, but demand for electrical andelectronic engineers is spread across many employment sectors. Most electricaland electronic engineering graduates will find jobs within engineering. An indication
5-30
that there have not been shortages in recent years is that inflation-adjusted salariesfor electrical and electronic engineers have not moved up much since 1970 andsalaries for Ph.D.'s are actually lower (after inflation) than in 1970. Employers arenot visibly eager to hire new graduates; they have not raised wages to counter anyobvious shortage.
Not a single interviewee -- which included over 20 individuals from business, government,
and various engineering organizations -- indicated that there was a cuirent shortage of
electrical and electronic engineers. Most characterized the market for electrical and
electronic engineers as basically in equilibrium. in comparison to the 1980s, which were
characterized by very low levels of unemployment within the electrical and electronic
engineering field, most analysts feel that the demand for new entrants is currently
somewhat weaker, though most engineering graduates are still likely to find employment
within engineering. For example, according to one manpower analyst we interviewed:
...The demand for engineers has been affected recently by both defense cutbacksand the recession. Firms are not sending the recruiters to the campuses like theyhave in the past -- they are not beating the bushes for engineers.
Most analysts feel that the clearest indications of an adequate supply of electrical
and electronic engineers to meet current manpower requirements are provided by the
following:
Slow Real Wage Growth: There has been little upward pressure (relative toinflation) on either starting salaries or the salaries of existing electrical andelectronic engineers in recent years.
Recent Layoffs: The recession and defense-related cutbacks have resultedin some layoffs of electrical and electronic engineers recently.
A recent "Special Report on Engineering Careers" by the Institute of Electrical and
Electronic Engineers, Inc. (IEEE), focused particularly on the impact of the recession and
defense-related cutbacks on employment trends within electrical and electronic
engineering:
5-31
200
..Over the past year in the United States, nearly a quarter of a million engineers andother employees in high-tech companies have lost their jobs. An undeterminednumber were electrical engineers. Hardest hit hpe been big computer andaerospace companies. Widely publicized dofene cutbacks are only part of thestory. In the general civilian economy, layoffs have resulted from company mergersand decreases in the market demand for certain major electronic products (such asmicrocomputers)...And since late 1989, based on leading economic indicators, theIEEE's Engineering Manpower Committee has been projecting that the employmentoutlook for electrical and electronic engineers will grow worse before it gets better,hitting bottom early next year.3°
Some researchers feel that talk of shortages (either current or into the future) is
primarily driven by self-interest on the part of employers and universities. For example,
one engineering manpower specialist we interviewed saw the term "shortage" as a
"promotional word, used to influence politicians to open the flood gates for immigration of
scientists and engineers, and to clkids.into the engineering field." According to this
analyst, by stressing current or future shortages:
universities gain because they can maintain and even expand the size oftheir engineering programs, which receive considerable public subsidies; and
employers gain because shortages encourage individuals to enter engineeringprograms and provide a rationale for expanding immigration of foreign-trained engineers, which both serve to keep wages from escalating.
b. Future Labor Market Conditions
Despite the current conditions, there are demand- and supply-side factors that have
created major concerns over the potential for future shortages of electrical and electronic
engineers. Some researchers feel that these shortages are likely to emerge relatively soon
(as early as the mid-1990s). In particular, they point to the very strong level of demand
for this group of engineers and an anticipated sharp decline in the number of new
graduates from engineering programs. Analysts such as Atkinson predict that unless
30T. Bel (December 1990). "Special Report: Engineering Careers: '90s Employment:Some Bad News, But Some Good." The Institute of Electrical and Electronic Engineers,Inc.. (IEEE) Spectrum, p. 32.
5-32
201
something is done in the near future to stimulate the production of B.S. and Ph.D. level
degrees in engineering, there will be a severe shortfall of engineers beginning in about
1995:
...Prudent assumptions, based on demographic data and historical trends, indicatethat there may be a cumulative shortfall of several hundred thousand scientists andengineers at the baccalaureate level by the turn of the century. That shortfall couldtranslate into an annual supply-demand gap of several thousand scientists andengineers at the Ph.D. level, with shortages persisting well into the 21st century...Unless corrective actions are taken immediately, universities, industry andgovernment will begin to experience shortages of scientists and engineers in thenext 4 to .6 years, with shortages becoming significant during the early years of thenext century.'
Other researchers take a more cautious view of the future balance between supply
and demand, but feel that trends need to be carefully monitored. For example, a
manpower expert we interviewed at the Office of Scientific and Engineering Manpower
warns:
...With regard to the future, it's important to watch closely and be concerned, butevidence does not suggest that it is time now to push the panic button with regardto shortages.
SU!l cther analysts are skeptical about the likelihood of shortages, arguing that the forces
of supply and demand will eliminate long-term shortages:
...We've been hearing recently from various sources that the United States willexperience a shortage of engineers by about the year 2000. Based on theinformation that's available to make accurate employment forecasts, I think thisprediction simply is not true. The fault with many of these employment predictionsis that they look only at the supply of engineers without attempting to forecastdemand, which is the more difficult side of the equation.'
The next two sections examine demand- and supply-side factors that are likely to
effect whether future shortages occur.
"Atkinson (1990), p. 427.
32E. Bertnolli (April 1989). "Engineering Supply -- Does It Meet the Demand?" TheInstitute for Electrical and Electronic Engineering, Inc.
5-33
202
2. Demand-Side Factors
Strong demand for electrical and electronic engineers, increasing levels of
replacement demand (primarily resulting from retirements), and the demand for engineers
in sub-specialty areas of the field are three demand-side factors that are likely to influence
future labor market conditions.
a. Projected Employment Growth from 1988 to 2000
The outlook for electrical and electronic engineers appears to be one of relatively
rapid growth through the end of the century. Strong growth in employment is based on an
assessment that the market for electronic and electrical products (e.g., computers,
robotics systems, etc.) will continue to grow at a rapid pace. BLS has projected an annual
rate of employment growth of 2.8 percent for electrical and electronic engineers over
double the average for all occupations (1.2 percent)." This rate of employment growth
is quite high compared to most other occupations only 15 out of 193 occupations have
a rate of growth projected to be the same or greater than that for electrical and electronic
engineers. The rate of projected growth in employment for the occupation is also
substantially above that for all other branches of engineering. With the exception of
"other" engineers (1.9 percent), all other engineering fields have projected annual growth
rates of between 1.0 and 1.5 percent. According to the Occupational Outlook Handbook:
...Employment opportunities for electrical and electronic engineers are expected tobe good through the year 2000 because employment is expected to increase muchfaster than the average for all occupations. Despite the rapid growth, however, themajority of job openings will result from the need to replace electrical andelectronics engineers who transfer to other occupations or leave the labor force.'
"This rate of increase is for the 193 occupations examined by Cohen.
340ccuoational Outlook Handbook, p. 403.
5-34
203
Some analysts, however, have questioned whether employment growth will be as
strong as predicted by the BLS. In particular, long-term growth in employment within the
field of electrical and electronic engineering may be affected by several factors:
Recession: The extent and duration of the 1990-91 recession is likely toaffect the demand for electrical and electronic products -- which, in turn, willaffect the demand for engineers.
Defense Cuts: At the present time, an estimated 10 to 20 percent of thecountry's engineers are involved in defense-related work.' Already thedefense cutbacks have led to layoffs of electrical and electronic engineersand more of these cutbacks are expected in the future.
Foreign Competition: Growth in electrical and electronic engineering jobswill depend, in part, on the extent to which foreign-produced goods makeinroads into domestic markets and the strength of exports of electronicgoods and services. This, in turn, will depend on whether the United Statescan continue to hold its technological edge in certain areas of electrical andelectronic engineering, currency exchange rates, and import and exportrestrictions.
Advances in Technology: There have been many recent advances in thetools used by engineers to design and test new products (e.g., computerizedwork stations). These new tools are designed to improve the productivity ofworkers and, in some instances, may permit the substitution of less skilledmanpower (e.g., technicians) for some engineering tasks. It is uncertain, atthis time, whether rapid advances in these technologies will increase orreduce the number of electrical and electronic engineers that are needed.
Further, there is a consensus that future demand is more difficult to predict than supply.
Some observers would argue that demand projection by occupational group is mostly
guess work. For example, Bertnolli of the Institute of Electrical and Electronic Engineers
asserts:
_Predicting demand is a much more complex situation. The United Statesmaintains no "official" index of demand for engineers, but various public and privatesector organizations publish indicators of current and future demand that are
35Pool (1990), p. 433.
5-35
204
considered reasonably reliable. Specific data, however, on electrical, electronicsand computer engineers are not always available."
Overall, despite the uncertainty of predicting long-term demand trends for occupations, the
picture for the electronic and electrical engineering field is one of continued growth.
b. Replacement Demand
In any given year, workers leave a particular occupation for a variety of reasons --
illness, death, retirement, or to enter a new profession. High rates of turnover -- i.e., the
need to replace workers -- within an occupation may signal (though certainly not prove)
the potential for shortages. There is particular concern over whether there is an adequate
number of new engineers within the pipeline to replace the large number of electrical and
electronic engineers (hired for the space and defense programs during the 1960s) who are
expected to retire during the 1990s and early in the next century.
While the annual replacement demand for electrical and electronic engineers is
comparable to that of other engineering fields, and in the lowest quartile of all occupations
in 1986, it is expected to sharply increase in the early 1 990s because of retirements. For
example, the National Science Foundation has identified growing retirements as one of two
factors' that are likely to alter the balance between supply and demand for natural
scientists and engineers:
...The second event is an anticipated doubling of the replacement demand for Ph.D.level natural scientists and engineers during 1990-2006, as a consequence of thelarge number of Ph.D.'s hired during the 1960s."
"E. Bertnolli (1989).
"The second factor is the decline in the size of the college-age population.
nFuture Scarcity of Scientists and Engineers: Problems and Solutions, p. 3.
5-36
205
According to estimates by Rivers:"
The 1990s from 1992 on will have a Deaths and Retirements replacement demandof approximately 2.5 percent of the engineering population or between 39,000 and45,000 per year depending upon the engineering population used with the largerfigure based upon the BLS household survey of the engineering population.
This increase in replacement demand is principally due to increases in retirements
beginning in 1992. Rivers estimates that the retirement rate for engineers will increase
from 0.81 percent in the period 1988 to 1991 to about 2 percent beginning in 1992 and
lasting through the rest of the decade. Holding demand constant, this increase in
retirements suggests the need for a countervailing increase in entrants to the occupation
(e.g., through new graduates, immigrants, transfers, or upgrades).
C. Spot Shortages in High Demand and Emerging Specialty Areas
Finally, while there may not be generalized shortages of electrical and electronic
engineers, some employers and analysts point tc the existence of "spot shortages" within
either "hot" research areas or newly emerging technical areas. For excmple, with the
concentration of the federal government on the Strategic Defense Initiative (SDI) during
the late 1980s, there was intense cornpetition for engineers with experience in optical
electronics. One recent article pointed to problems with locating engineers in the emerging
specialties within the aerospace industry:
...Boeing, like other major aerospace firms, is having more difficulty recruitingengineers who are trained and experienced in emerging technologies than in findingentry-level personnel. Advanced composite materials, stealth technology, robotics,artificial intelligence, computational fluid dynamics and electronics are some of themore salient technology areas where engineering expertise is in constant orincreasing demand throughout the aerospace industry."
39R. Rivers (1990). "Death and Retirement Effects on Engineering Supply," EngineeringManpower Newsletter.
40Kandebo (1988), p. 46.
5-37
206
;.
According to one labor market expert interviewed for this report there are likely to always
be shortages in some areas of electrical and electronic engineering: "Because there are
always emerging technologies and fields within electrical and electronic engineering, there
will always be some quasi-shortages of manpower."
3. Supply-Side Factors
The supply of employed electrical and electronic engineers is made up of persons
already trained and in the labor force, along with new additions to the labor market. ;n
particular, the adequacy of the future supply of electrical and electronic engineers is
expeo7,ed to be affected by the following:
new graduates at all degree levels;
immigration of previously trained engineers from other couatries;
transfers into the field from other closely related professions, such as otherengineering specialties, computer science, mathematics, physics, andchemistry; and
upgrading non-degree technicians who are promoted into the field ofelectrical and electronic engineering on the basis of their experience.
All four of these factors represent ways in which to increase supply to meet increasing
employment demand and to replace workers who leave the occupation. The key concern
for many analysts is whether these four sources of supply particularly new graduates
will generate a sufficient number of new entrants to meet the expected strong demand for
workers within the occupation.
a. New Graduates at All Degree Levels
According to the National Science Foundation, the "dominant factor" affecting the
supply of new natural science and engineering B.A. and Ph.D. graduates is the declining
size of the college-age population:
5-38
207

...The key event is a 25 percent reduction in the number of 'college age' studentsduring 1983-1996 after a doubling during 1961-1979, as measured by the numberof 22-year-olds.41
According to the National Science Foundation, the proportion of natural science and
engineering degrees awarded annually has been a "relatively fixed fraction of the U.S. 22-
year-old population for almost three decades." As a result of the baby-bust, the National
Science Foundation and others predict a substantial decline in the number of engineering
(B.S. and Ph.D.) graduates. In addition, the National Science Foundation asserts that the
projected decline in the proportion of college students selecting natural science and
engineering majors is an important secondary factor underlying the expected future
shor.tfall. Overall, as discussed in greater detail earlier in this chapter, the National Science
Foundation and others suggest that there will be a steep decrease in the production of
engineers, resulting eventually in a shortfall of available engineers:
...During 1986-1998 a decline of 20 percent in the annual production of NS&E (i.e.,natural science and engineering) degrees is expected, mirroring the reduction in thenumber of 22-year-olds estimated by Census. This drop is expected to recoverpartially during 1998 to 2003, as the number of 22-year-olds increases accordingto Census data estimates."
b. Immigration of Foreign-Born Engineers
In order to meet specialized engineering needs and to supplement the general
supply of electrical and electronic engineers, U.S. firms have increasingly employed
foreign-born engineers. The number of foreign engineers increased from 95,000, or almost
8 percent of working engineers in 1972, to an estimated 395,000 or almost 19 percent in
'Future Scarcity of Scientists and Engineers: Problems and Solutions, p. 3.
'Future Scarcity of Scientists and Engineers: Problems and Solutions, p. 8.
5-39
1982. Current estimates place the total at more than 25 percent." According to the
National Science Foundation, the proportion of foreign citizens enrolled full-time in
electrk:al and electronic engineering graduate programs in the United States grew from 36
percent in 1977 to 47 percent in 1986. In 1987, non-U.S. citizens accounted for about
one-half of the Ph.D.'s granted in electrical and electronic engineering." Foreign-born
students constituted a much smaller proportion of the U.S. engineering undergraduate
enrollment -- earning typically less than 10 percent of all engineering bachelor's degrees
awarded annually between 1975 and 1985 by U.S. educational institutions. The
availability of foreign-born engineers increases the supply of electrical and electronic
engineers, especially at the Ph.D. level at universities and specialties within the field. For
example, according to the National Research Council, in 1985 almost half of all
engineering faculty and engineering assistant professors under the age of 35 in U.S.
universities and colleges were foreign-born.
One indication of the importance of foreign-born workers within an occupation is
the number of labor certifications issued by the U.S. Department of Labor. In fact, Cohen
argues that labor certifications as a percentage of total employment may be used "as an
indicator of labor shortage under the assumption that immigrants are being certified
because employers are unable to find U.S. workers in those occupations where large
numbers of certifications are being made.' In 1988, the number of labor certifications
"W. Wingo (June 5, 1989). "Engineers: Growing Demand, Short Supply: ChangingTechnology, Demographics Alter the Way Companies Select Engineers." Design News, p.32.
"Profiles -- Electrical/Electronics Engineering: Human Resources and Funding, p. 33.
'Malcolm. S. Cohen (1990). Study on the Feasibility of Using Labor MarketInformation for Alien Certification Determination. Ann Arbor, Michigan: Institute of Laborand Industrial Relation, University of Michigan, p. 65.
5-40
209
within the electrical and electronic engineering branch were over 10 times as great as the
averege for all occupations in the United States (e.g., 352 per 100,000 versus 32 per
100,000 for the entire country). In fact only three other occupations (of the 193
occupations examined by Cohen) had a higher level of labor certifications."
Immigration of foreign-born engineers not only serves to fill employment positions
for which there may be an inadequate number of U.S.-born engineers, but also provides for
a more continuous supply of engineers. For example, according to a manpower analyst
interviewed for this report:
...The availability of foreign-born engineeis makes the flow of engineers to firmsmore fluid. In the past, there was a lag, with engineers graduating in June andbeing picked up shortly thereafter by firms. Firms would then wait until the nextclass graduated. But now it is possible for firms to bring in foreign-born engineersthroughout the year to meet specific needs. Therefore, the supply is morecontinuous now and better matched to the demand and specific needs ofemployment.
The 1965 immigration law was especially important in increasing the flow of engineers to
the United States, because it liberalized rules with regard to firms certifying engineers to
immigrate to America. There are, however, still a number of barriers that foreign-born
graduates of engineering programs in the United States must overcome before they may
become permanent employees of U.S. firms. Before hiring a non-U.S. citizen, employers
must convince the Immigration and Naturalization Service that the erigineer has
"distinguished merit and ability." Should this worker next apply for a permanent resident
"These are painters, sculptors, craft-artists, and artist-printmakers (1,022 per100,000); other professional specialty occupations (668 per 100,000); and other precisiontextile, apparel, and furnishings machine workers (385 per 100,000).
5-41
210
visa, the company must show the Department of Labor that it has advertised the position
and cannot find a more qUalified candidate.'
The improvement of telecommunications and the growing internationalization of the
market for skilled manpower may also help to alleviate future shortages, should they arise.
For example, one labor markei analyst asserted that with improvements in
telecommunications (e.g., fax machines and computer networks) it is now relatively easy
for business to contract out to engineers in other countries work that in the past would
have been done by engineers in the United States:
...The electrical and electronic engineering field has become increasinglyinternationalized in recent years. There are now many multinationals that arecontracting work to engineers in other countries. For example, a company mightcontract out software development to an engineer in India, and communicate acrosstelephone lines.
By utilizing an engineer in Europe or India, for example, a U.S. firm may be able to obtain
expertise that it is unable to find domestically. Further, such an arrangement may provide
a substantial reduction in production costs especially where wages are substantially
below those paid to domestic engineers.
Hence, immigration of foreign-born engineers (both for study at U.S. universities
and to work for American firms) serves to increase the availability of electrical and
electronic engineers within the country. In recent years, this has particularly been a factor
that has affected the supply of Ph.D. candidates to fill faculty positions at universities in
the United Stales.
'The recent enactment of the 1990 immigration law by Congress is expected to easesome of these barriers, most likely further increasing the flow of foreign-born engineers tothe United States.
5-42
2 ti
C. Transfer and Upgrading of Engineers
Finally, three other factors tend to provide a cushion against an inadequate supply
of electrical and electronic engineers:
Upgrading of Technicians. Technicians and other workers can be upgradedto fill engineering positions based on experience. For example, technicianswith two-year associate degrees may be upgraded to fill engineering.positions. Alternatively, technicians may be used to perform some of thetasks normally done by cmgineers.
Transfers from Other Related Fields. There is an ability for workers trainedin other scientific areas to cross over to fill vacancies in engineering.According to the National Research Council there is increasing reliancewithin the engineering field on "residual sources." Primary residual hiringfocuses on degrees in mathematcs, physics, and chemistry. The NationalResearch Council reports that the number of employed engineers withdegrees in non-engineering fields rose from about 130,000 or 15 percent in1972, to more than 400,000, or 20 percent in 1982. According to somepersonnel experts, this percentage could now be as high as 30 percent."
Reserve Pool of Engineers. Some of those trained in electrical and electronicengineering never go into the field or fail to land a job within the occupationbecause of economic conditions. These individuals serve as a reserve thatcan be called upon should the market become tight. For example, of the 89percent of 1984 and 1985 electrical/electronics engineering baccalaureaterecipients employed in 1986, 20 percent were in other science orengineering fields and 7 percent were employed outside of engineering. Inaddition, of those graduates, 3 percent remained unemployed in 1986."
E. Adjustments to Shortages by Employers
As discussed in Chapter 2, there is a range of strategies that employers can use to
adjust to or alleviate the effects of shortages of labor. Some of the adjustments that
employers (e.g., electronics firms, defense contractors, and universities) have used in the
past or that are planned to deal with what are expected to be shortages in the future are
48vvin-og (1989), p. 32.
"Profiles -- Electrical/Electronics Engineering: Human Resources and Funding, p. 37.
5-43
212
examined below. Potential government and educational responses to future shortages are
discussed in the final section of this chapter (under recommendations).
1. Increase Recruiting Efforts
A logical first step for firms facing shortages of electrical and electronic engineers
involves intensifying or targeting recruitment efforts. In response to generalized shortages
of engineers, businesses may need to intensify existing efforts or perhaps initiate new
recruitment approaches. Traditionally, engineering firms have focused their recruitment
efforti -- particularly for entry-level engineers -- by building strong linkages with
engineering colleges and universities. For example, employers might expand the number of
engineering schools to which they send company representatives, or they may increase
the number of visits that their representatives make to these schools. To fill vacant
positions in emerging technological areas (e.g., stealth technology and robotics),
employers might target certain universities that have specialized graduate training in these
areas.
Attracting more experienced engineers, especially in emerging technological areas,
is more difficult. Companies can intensify their recruitment efforts through advertising in
professional journals, comOuter bulletin boards, and newspapers. Firms may increase
efforts through expanded use of employment agencies. Alternatively, businesses may
expand the geographical scope of their recruiting efforts. For example, a medium-sized
engineering firm in New England might expand their search to other regions of the country.
Many engineering firms are increasingly relying upon recruitment of foreign-born engineers.
Finally, firms might employ entirely new approaches. For example, an aircraft company
that was experiencing shortages of if id-level engineers introduced several new recruiting
5-44
213
techniques: (a) providing employment opportunities for spouses of engineers, (b)
increasing use of hiring bonus programs, and (c) improving relocation benefits.'
2. Hire from the Ranks of Non-Engineers or Upgrade Technicians
As mentioned earlier, the number of new engineers in the pipeline has decreased in
recent years (because of the end of the baby boom) and engineering firms have
increasingly turned to non-engineers and the upgrading of engineering technicians to fill
engineering positions. Hiring personnel from non-engineering fields -- especially individuals
with degrees in mathematics, physics, and chemistry -- has increased considerably over
the past two decades. Within the electrical and electronic engineering occupation, firms
have particularly concentrated recruitment on computer scientists. Another sourCe of
electrical and electronic engineers has been the upgrading of experienced technicians. The
U.S. workforce has an estimated one million technicians from which to draw. In upgrading
technicians, it may be necessary for firms to provide workers with additional education
and training.
3. Use Retirees to Fill Part-Time or Temporary Engineering Positions
As discussed earlier, a major problem for engineering firms and universities during
the 1990s is expected to center on filling vacancies created by the retirement of existing
engineers. Many firms that employ large numbers of engineers have already taken steps
to minimize the effects of retirement. Firms emphasize the importance of anticipating
"block retirements" and planning ahead to fill positions. Some examples of these efforts
include:
"Kandebo (1988).
5-45
214
General Electric, like other aerospace companies, employs retired engineerson a part-time basis when its work load becomes too heavy. The companyalso uses retirees for special temporary projects that require their particularskills or knowledge.
Pratt and Whitney rehires retired personnel on a temporary basis, providingthem with short work weeks as an extra incentive.
Hughes. Aircraft makes a concerted effort to transfer specialized skills andknowledge before it is lost."
4. Substitute Equipment for Labor
Recent advances in computer-aided design and engineering, expert systems, and
computer-integrated manufacturing have had a substantial effect on the manpower
requirements and the nature of engineering work. The tools that engineers use have been
greatly expanded -- especially in the area of computerized tools. For example, computer
workstations, linked directly to numerically-controlled machines, are increasingly replacing
nearly all drafting tables that were once a key design component. CD-ROM disks at
engineering workstations provide engineers with instant access to an enorious collection
of data (in text, graphics, and even sound). CAD/CAM makes it possible to customize
hand-made mass production.' Increasing use of automated systems has several
important implications for manpower requirements of electrical and electronic engineers.
First, such technology is designed to improve productivity of existing engineers hence, it
may somewhat reduce the need for additional manpower. Second, it may expand the
capabilities of existing engineers, perhaps reducing the need for hiring specially-trained
labor. Third, it may somewhat lessen the manpower requirements for some tasks,
"Kandebo (1988), p. 53.
"Wingo (1989), p. 32.
5-46
?15
enabling firms to substitute either non-engineers or to upgrade technicians to perform
tasks previously done by engineers.
5. Train Wolters to Enhance Engineering Skills
Two problems that firms often face in the rapidly changing field of electrical and
electronic engineering are (a) obsolescence of skills and (b) locating manpower in emerging
sub-specialties. As a result, many firms provide workers with both on-the-job training and
educational benefits that can be used to upgrade engineering knowledge or skills. Firms
may pay part or all of the cost of continuing education for their workforce. One problem in
offering such benefits, however, is that firms may not be able to recoup the costs of the
training. For example, individuals receiving such training or education may move to
another employer shortly after training is completed.
6. Improve Utilization of Existing Engineers
Some analysts have suggested that effective utilization of existing engineers would
help to alleviate shortages. While many firms effectively utilize the time, knowledge,
skills, and judgement of their engineers, there are some instances where engineers are
either under-utilized or used in sub-engineering tasks. For example, the Institute of
Electrical and Electronic Engineers, Inc. argues: "The nation's competitiveness and
productivity can be substantially increased through proper utilization of the time and skills
of its engineering professionals."

7. Contract Work Out
Certain technological advances particularly in communications and computerized
workstations -- have enabled firms to increasingly contract work out to other geographic
locations. For example, firms can now easily contract with engineers in other regions of
the country and internationally to perform engineering tasks. This is particularly helpful in
gaining access to engineers with experience in sub-specialties and emerging technologies.
8. Increase Wages and Fringe Benefits
As discussed earlier in this chapter, the earnings of electrical and electronic
engineers have increased at about the same rate as earnings in other fields in the United
States in recent years. Hence, general increases in wages and fringe benefits have not
been used to any large degree by firms to increase the supply of engineers. However,
improved wages and fringe benefits have been used by employers to recruit engineers with
sub-specialties (especially in new technological areas for which few engineers are trained)
and to entice experienced engineers to change firms.
F. Conclusions and Recommendations of Public and Private Sector Steps to AlleviateShortages
1. Conclusions
There is a general consensus that while there may be some spot shortages (i.e., in
emerging fields, specialty areas, and perhaps some localities), there is not a current
shortage of electrical or electronic engineers. In fact, with the recent cutbacks in defense
spending coupled with the slowdown in the economy, there have been layoffs within the
field during the past year. Engineering school job placement programs and employers
report less intensity in their recruitment activities. There has been little upward pressure
5-48
217
(relative to inflation) on either starting.salaries orthe salaries of existing electrical and
electronic engineers in recent years.
Despite the current conditions, there are demand- and supply-side factors that have
created concerns over the potential for future shortages of electrical and electronic
engineers. Some observers feel that these shortages are likely to emerge relatively soon
(as early as the mid-1990s). In particular, they point to the very strong level of demand
for this group of engineers and an anticipated sharp decline in the number of new
graduates from engineering programs. Analysts such as Atkinson predict that unless
something is done in the near future to stimulate the production of bachelor's and Ph.D.
degrees in engineering, there will be a severe shortfall of engineers beginning in the mid-
1990s.
2. Recommendations
There is a considerable range of opinion on what steps should be taken to reduce
the likelihood of future shortages of engineers. Some analysts contend that the best thing
for the government to do is simply nothing at all. This line of argument views the market
for engineers as being relatively free (compared, for example, to the market for home
health care workers, where wages for workers are substantially influenced by government
regulations), with many employers competing for the services of engineers, and relatively
good information available on employment opportunities and wages available to workers.
It is argued that over time the market will gradually work to eliminate any shortages that
might occur (e.g., by increasing wages). Given these circumstances, government should
do what it can to ensure that the labor market works efficiently. For example, the
government should ensure that all of those involved in the market (both workers and
5-49
2 18
employers) have the necessary information to make informed decisions about employment
or engineering occupations.
Other analysts feel that there are a variety of steps that the government,
educational institutions, and employers need to implement in the next few years to ensure
an adequate supply of engineers. These researchers maintain that active steps need to be
taken given (a) the decreasing supply of college students, (b) the increasing level of
retirements among existing engineers, and (c) the expected continuing growth in the
demand for electrical and electronic engineers. The National Science Foundation, for
example, contends that occupational shortages in science and engineering fields can be
remedied through two basic strategies:
Attraction: More qualified individuals need to be attracted into the naturalscience and engineering fields. Attraction strategies seek to increase thenumber and quality of students who are interested in science and math bythe time they reach high school. Such efforts focus on teaching methodsthat stress the interesting features of science and math. These strategiesare most applicable during grades one through eight, and thereafter diminishin importance.
Retention: Retention strategies are aimed at keeping a large number ofindividuals in the natural science and engineering pipeline. Retentionstrategies seek to maintain student interest at all levels of education and tostrengthen the depth ,of learning without losing students through poorteaching, fear of complexity and abstract concepts, and financial need.These strategies are particularly applicable during secondary education and
The sections that follow lay out major recommendations for government and educational
institutions to both attract and retain a greater number of students to engineering fields.
53Future Scarcity of Scientists and Engineers: Problems and Solutions, p. 25.
5-50
219

a. improve Science Curriculum and Reduce Attrition of Able Studentsfrom the Natural Science and Engineering Pipeline Prior to College
The National Science Foundation has found a rapid constriction in the pool of
natural science nd engineering students during high school:
...ln 1980, there were approximately 3,650,000 high school sophomores. Of these700,000 had an interest in natural science and engineering and another 500,000 orso were not yet permanently out of the NS&E pipeline. However, only 260,000had plans to attend a 4-year college and major in an NS&E field. High school agestudents are typically quite flexible in changing career intentions in response to newinformation and pressures. Only about 90,000 (35 percent) of the high schoolsophomores planning NS&E majors at 4-year colleges were still in the NS&E pipelineas high school seniors."
An Office of Technology Assessment study found that more than half of those students
interested in science and engineering careers as high school sophomores shifted their plans
to other subjects by the time they reached their senior years. Analysts point to several
problems that appear to foster disinterest in science and engineering coursework:
Some studies have found that teachers tend to identify and encourage thebest students to go on to the next level of math and science education,while discouraging those who appear to be neither the best nor thebrightest.
Another problem is the method of instruction: most science teaching inelementary and secondary educations consist of lectures and tests based onrecall, which is unlike scientific work that is often based on experimentation.
Poorly equipped labs or the absence of labs, as well as large class size,increase emphasis on book work rather than laboratory study.
Teachers, particularly below the high school level, are often unqualified toteach sciences.'
Most researchers point to the need for better curriculum and teaching to keep students
interested in the sciences. In addition, the fact that high school students are relatively
"Future Scarcities of Scientists and Engineers: Problems and Solutions, p. 18.
'Kandebo (1988).
5-51
220
flexible in their decisions concerning career intentions argues for enhanced career
counseling.
There is also a concern over the relatively large group of students who successfully
complete high school coursework with concentration in science and math, but fail to
attend college. Statistics collected by the Department of Education tracking students from
the high school class of 1980 found, for example, that about one-quarter of students who
had not enrolled in any type of college program, had taken 20 or more semesters of
mathematics and science in high school. Atkinson and others argue that the projected
shortfall of scientists and engineers over the next two decades could be largely avoided if
this group of students went on to college in science and engineering, even allowing for
Subsequent attrition." To more effectively capture this group, it is generally
recommended that financial assistance and counseling be targeted to them.
Finally, there is much concern over the very low proportion of minorities who are
still within the engineering pipeline at the end of high school. Minorities -- especially
blacks and Hispanics -- are more likely to drop out of high school before graduation and,
even when they complete high school, are much less likely than their white counterparts
to enter engineering and science programs at universities. Intensified efforts .on the part of
educational institutions (beginning in the grade schools) and government funding targeted
on assisting minorities along the educational pathway are likely to be needed."
"Atkinson (1990), p. 430.
"The Health Career Opportunity Program, administered by the Health Service andResources Administration (HRSA) of the U.S. Department of Health and Human Services,is an example of a federal initiative that provides funds for medical schools to.prepare,recruit, and retain minorities within the health professions.
5-52
221

b. Reduce Attrition from Engineering Programs at the Undergraduatekeys.'
Recent studies have also found that a large proportion of qualified and interested
students are lost to science and engineering between their freshman and senior years of
college. For example, only 46 percent of those freshmen who declare their intention to
major in science or engineering eventually receive baccalaureate degrees in those fields.
Of those freshmen who switched from engineering or sciences, only 31 percent did so
because they found the coursework too difficult -- 43 percent found other fields more
interesting."
In response, the National Science Foundation and others stress the need for
retention strategies aimed at reducing the high level of attrition from natural science and
engineering studies at the undergraduate level. The NSF has identified four areas in which
retention should be directed:
ensure that all two-year and vocational college students have an opporturityto sample natural science and engineering curricula and to transfer to four-year colleges;
convince freshmen not to switch from natural science and engineering intoother programs;
raise the graduation rate of women and minorities to that of majority men;and
improve the quality of the teaching and the teaching environment in publiccolleges to that of private colleges."
In order to retain college students, the NSF and others point to the importance of
curriculum revision, expansion of teacher training programs, more effective college and
career counseling, and increases in scholarship programs. For example, it is recommended
"Atkinson (1990), p. 430.
59Future Scarcity of Scientists and Engineers: Problems and Solutions, p. 25.
5-53
222

that scholarship programs be targeted at students who lack the financial resources to
attend college, but who have at least an A-/B + average and at least 10 semesters of math
and science in high school.
c. Expand Financial Assistance for Post-Graduate Study
Many observers have also pointed to the need for increased production of Ph.D.
recipients in the engineering field, especially in light of the expected increase in retirements
of university faculty in the 1990s. Analysts generally point to the need for expansion in
the number of scholarships for graduate study in natural science and engineering, as well
as an increase in the stipend provided to students (perhaps as high as 50 percent of the
starting salary for new bachelor degree holders).
d. Improve Data on Demand for Engineers
Beyond increased support for attracting and retaining students within the natural
science and engineering pipeline, some analysts urge that the federal government work to
improve the data that is available to individuals and firms on the labor market conditions
for engineers. Special attention is needed to improve data on the current demand for
engineers. For example, periodic collection of vacancy rate data from major employers.of
engineers, by field and sub-specialty, is needed to accurately anticipate potential
shortages.
5-54
2 23

CHAPTER 6
CASE STUDY OFTOOL AND DIE MAKERS
A. Description of the Occupation
Tool and die makers are highly-skilled machinists who make tools, dies, and special
guiding and holding devices that are used in machines to produce a variety of products --
from clothing and furniture to heavy equipment and aircraft parts. Working from blueprints
or instructions from supervisors, tool and die makers craft precision tools that are used to
cut, shape, and form metal and other materials. They produce jigs and fixtures (devices
that hold metal while it is bored, stainped, or drilled), gauges, and other measuring
devices. Tool and die makers also construct metal forms (i.e., dies) that are used to shape
metal in stamping and forging operations. They make metal molds for diecasting and for
molding plastics, ceramics, and composite materials. In addition, tool and die makers may
repair worn or damaged tools, dies, gauges, jigs, and fixtures, and help design tools and
dies. Of the 152,000 tool and die makers employed in 1990, most worked for small firms
that manufactured tools and dies, metal working machinery, motor vehicles, aircraft, and
plastics products.' 2
According to the U.S. Department of Labor's Dictionary of Occupational Titles, a
tool and die maker:
'U.S. Department of Labor, Bureau of Labor Statistics (April 1990). OccupationalOutlook Handbook: 1990-91. Washington D.C.: Bulletin 2350, p. 402.
'John D. Bell and Lonny D. Garvey (1986). Opportunities in the Machine Trades.Lincolnwood, Illinois: Published in cooperation with the National Tooling and MachiningAssociation by the National Textbook Company, p. 37.
6-1
2 24
analyzes specifications, lays out metal stock, sets up and operates machinetools, and fits and assembles parts to make and repair metal working dies,cutting tools, jigs and fixtures, gauges, and machinists' handtools, applyingknowledge of tool and die designs and construction, shop mathematics,metal properties, and layouts, machining, and assembly procedures;
studies specifications, such as blueprints, sketches, modes, and descriptionsand visualizes products;
computes dimensions and plans layout and assembly operations;
measures, marks, and scribes metal stock for machining;
sets up and operates machine tools such as lathe, milling machine, shaper,and grinder, to machine parts, and verifies conformance of machined partsto specifications.'
Tool and die makers plan the sequence of operations necessary to manufacture a tool or
die. Tool and die makers measure and mark the pieces of metal that will be cut to form
parts of the final product. They then do the cutting, boring, or drilling that is required.
They check the accuracy of what they have done to insure that the final product will meet
specification. Then they assemble the parts and perform finishing jobs such as filing,
grinding, and smoothing surfaces. In shops that use numerically-controlled (NC) and
computer numerically-controlled (CNC)4 machine tools, tool and die makers' jobs may be
slightly different. For example, although they still manu,glly check and assemble the tool or
die, each of its components may be produced on a NC or CNC machine. In addition, they
often assist tool programmers in the planning and writing of NC programs.'
'U.S. Department of Labor, Employment and Training Administration (107).Dictionary of Occupational Titles. Washington, D.C.: Fourth Edition, p. 491-492.
4NC equipment requires the operator to punch or otherwise prepare a tape, feed it intothe controls, position the piece to be machined, set the machine in motion, make thenecessary adjustments, oversee the operation, measure or otherwise check the results,and, in general, be responsible for the machine, the controls, and the production. CNCrequires the same procedures of the operator, but commands are issued by a computer.
50ccuoational Outlook Handbook, p. 402.
6-2
225
This occupation is of considerable interest to labor market analysts for several
reasons. First, although the demand for tool and die makers is expected to increase more
slowly than the average for all occupations through the year 2000, the Bureau of Labor
Statistics (BLS) notes that this occupation is already experiencing apparent shortages,
which are expected to grow primarily because of an aging workforce:
...A relatively large proportion of mil and die makers are 50 years of age or older.Currently, employers in many locations are finding it difficult to attract enoughqualified candidates and training program enrollments have not increased enough tosatisfy the growing demand. As these older workers begin to leave the occupation,employers in certain parts of the country may face more pronounced shortages.'
If shortages exist in this occupation, they appear to be primarily a function of supply-side
constraints, rather than prevailing wages or a high demand for services. Despite relatively
high wages, the tool and die industry has had difficulty attracting qualified job applicants.
Firms and experts have suggested that a variety of factors might lie behind perceived
shortages of tool and die makers, including lengthy training periods, higher entry-level
requirements than other manufacturing jobs, lack of job mobility, and an overall bias
against blue-collar employment by potential entrants.
Tool and die makers provide an interesting contrast to the other occupations
selected for the case studies in this report. Unlike the other occupations, tool and die
makers are "blue collar" workers -- though highly-skilled, and well-paid blue collar workers.
Second, these workers are an integral part of the manufacturing sector and are considered
essential to the production of many manufactured goods in the United States, including
the national defense. A shortage of qualified tool and die makers could affect the
productive capability of U.S. manufacturers and be a factor in locating manufacturing
plants abroad. Third, it is a profession with low turnover -- workers have strong
°Occupational Outlook Handbook, p. 403.
6-3
226

attachment to their jobs because of the long training period, relatively high wages, and the
high degree of skill involved in the production process. Because of this strong attachment
and difficulty in attracting new workers, the workforce in this occupation has aged to the
point where some employers have complained of severe problems in replacing retiring
workers.
Finally, despite a trend toward automation that has eliminated many manufacturing
jobs, the impact of new technologies on the employment of tool and die workers is still
uncertain. Over the past two decades, the machining of tools and dies has increasingly
become reliant on NC and CNC equipment. Using electronic circuitry and controls, NC and
CNC equipment permit the operator to program a series of machining operations that
enable a lathe, mill, drill press, or other equipment to automatically machine a tool or part.
Increasingly, tool and die workers have been required to supplement more traditional
tooling methods with the use of NC and CNC equipment.
B. Training and Recruitment of Tool and Die Makers
This section discusses the educational requirements and qualifications for entry into
the toot and die maker field, the factors affecting these requirements, and the methods
employers use to fill vacancies in the field.
1. Educational Qualifications and Entry Requirements
General qualifications and entry requirements for tool and die makers are described
in ihe Department of Labor's Occupational Outlook Handbook:
Most employers prefer persons with a high school or vocational school educationand mechanical ability. Prior to hiring, some employers test applicants to determinetheir mechanical aptitude and their mathematical ability. As a result, courses in
6-4
227
shop math, blueprint reading, metal working, physics, and drafting, as well asmachine shop experience, may be helpful.'
However, in our discussions with employers, we found considerable variation in the entry
requirements and the extent to which these requirements were formally applied. Typically,
larger firms with apprenticeship programs tended to have more formal entry requirements
(i.e., as part of their requirements for entry into the apprenticeship program). Some
smaller tool and die shops (of which there are many) appeared somewhat less strict in
their requirements. The type and complexity of the machining work to be performed also
contributed to the level of skills required.
In our interviews, we found that employers were generally looking for high school
or vocational school graduates. Considerable emphasis was placed on basic educational
skills -- particularly mathematics (including algebra, trigonometry, and geometry), science,
reading comprehension, and problem-solving skills. Because of the relatively long training
period for tool and die makers, employers were looking for candidates who had a "good
attitude" and "conveyed an ability to learn." Employers also were looking for individuals
with an "ability to use their hands" and a mechanical aptitude. Exhibit 6.1 displays some
comments from our interviews with employers on general entry requirements and concerns
about the available pool of candidates for tool and die maker positions and apprenticeship
programs.
There is some disagreement over whether the entry requirements for tool and die
makers have increased or decreased over the past decade. Some employers argue that the
introduction of new technologies (particularly NC and CNC equipment) and increasing
precision (e.g., often at one ten-thousandth of an inch in tolerances) has placed increasing
'Occupational Outlook Handbook, p. 403.
6-5
228
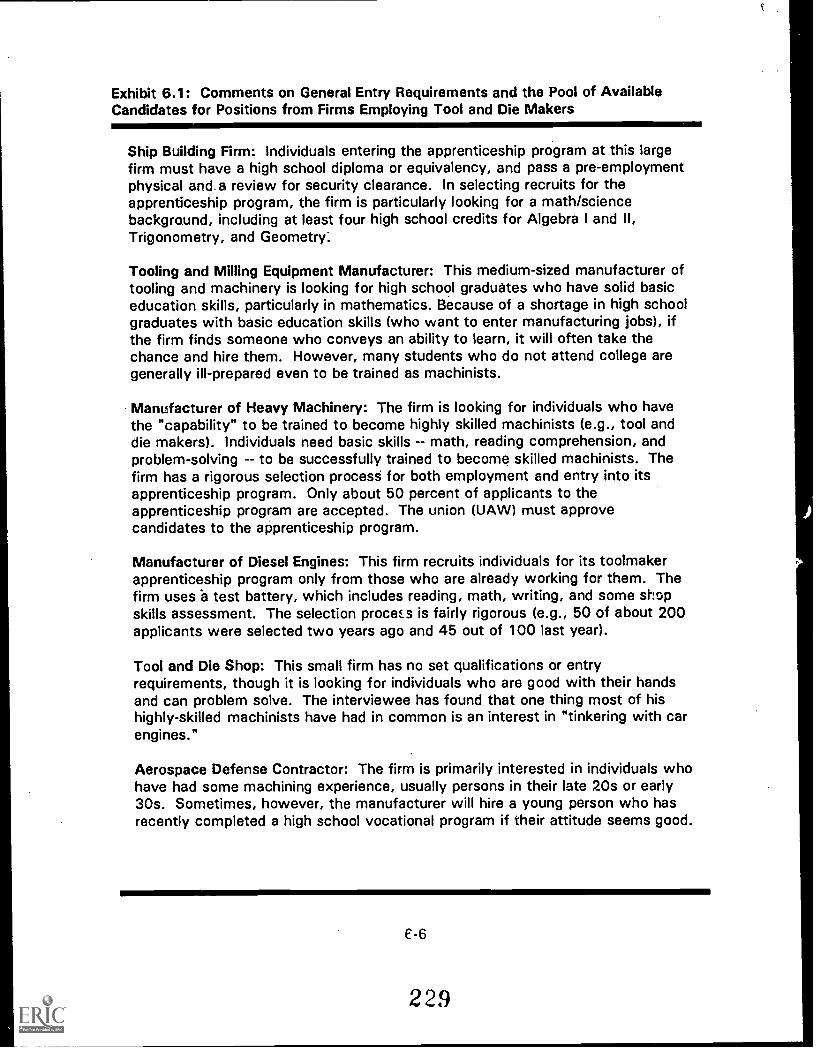
Exhibit 6.1: Comments on General Entry Requirements and the Pool of AvailableCandidates for Positions from Firms Employing Tool and Die Makers
Ship Building Firm: Individuals entering the apprenticeship program at this largefirm must have a high school diploma or equivalency, and pass a pre-employmentphysical an&a review for security clearance. In selecting recruits for theapprenticeship program, the firm is particularly looking for a math/sciencebackground, including at least four high school credits for Algebra I and II,Trigonometry, and Geometry:
Tooling and Milling Equipment Manufacturer: This medium-sized manufacturer oftooling and machinery is looking for high school graduates who have solid basiceducation skills, particularly in mathematics. Because of a shortage in high schoolgraduates with basic education skills (who want to enter manufacturing jobs), ifthe firm finds someone who conveys an ability to learn, it will often take thechance and hire them. However, many students who do not attend college aregenerally ill-prepared even to be trained as machinists.
Manufacturer of Heavy Machinery: The firm is looking for individuals who havethe "capability" to be trained to become highly skilled machinists (e.g., tool anddie makers). Individuals need basic skills math, reading comprehension, andproblem-solving -- to be successfully trained to become skilled machinists. Thefirm has a rigorous selection process for both employment and entry into itsapprenticeship program. Only about 50 percent of applicants to theapprenticeship program are accepted. The union (UAW) must approvecandidates to the apprenticeship program.
Manufacturer of Diesel Engines: This firm recruits individuals for its toolmakerapprenticeship program only from those who are already working for them. Thefirm uses 'a test battery, which includes reading, math, writing, and some shopskills assessment. The selection process is fairly rigorous (e.g., 50 of about 200applicants were selected two years ago and 45 out of 100 last year).
Tool and Die Shop: This small firm has no set qualifications or entryrequirements, though it is looking for individuals who are good with their handsand can problem solve. The interviewee has found that one thing most of hishighly-skilled machinists have had in common is an interest in "tinkering with carengines."
Aerospace Defense Contractor: The firm is primarily interested in individuals whohave had some machining experience, usually persons in their late 20s or early30s. Sometimes, however, the manufacturer will hire a young person who hasrecently completed a high school vocational program if their attitude seems good.
E-6
229
stress upon basic education skills (particularly mathematics and computer literacy). In
addition, some employers note that work as a tool and die maker (and for highly-skilled
machinists, in general) has become increasingly a "group" effort requiring stronger
interpersonal and communication skills. For example, according to an owner-operator of
one small tool and die shop, "more is being asked of new recruits now: they need to have
math skills, be able to read blueprints, communicate, and work in groups."
Other employers acknowledge that while the work is becoming more complex and
technologically based, firms have been forced to actually lower their recruiting standards
because high school graduates (who do not plan to attend college) lack the basic skills and
preparation that are needed to enter the field. This viewpoint is illustrated in the comment
from an interview with an owner-operator of a medium-sized company that manufactures
tooling and milling equipment: "In recent years, the entry requirements for tool and die
makers have fallen to an all-time low because of a shortage of skilled machinists and the
difficulty in locating new recruits who have the basic skills needed to enter the field."
Workers typically obtain the skills needed for entry into the tool and die profession
through formal apprenticeship programs and/or on-the-job training. Apprenticeship
programs, which involve four or five years of training, combine practical shop experience
with classroom instruction. Apprentices learn to operate a variety of equipment, including
milling machines, lathes, grinders, and other machine tools. They learn to use handtools in
fitting and assembling tools, gauges, and other mechanical equipment. They also study
heat treating and other metal working processes. Classroom training consists of shop
mathematics, mechanical drawing, tool designing, tool programming, and blueprint
6-7
230

reading. Several years of experience and on-the-job training after apprenticeship are often
necessary to qualify for the most difficult tool and die work.'
Bell and Garvey' provide an overview of key characteristics of apprenticeship
programs, which coincides with what we found in our interviews with employers
sponsoring such programs:
Apprenticeship programs are conducted or sponsored by employers. Theemployer identifies and defines the skills which are expected of ajourneyman worker.
The typical apprenticeship program has two major components: (1) on-the-job training, and (2) classroom instruction related to on-the-job training. Inthe metalworking industry, an apprenticeship program involves typically fouryears of on-tie-job training, encompassing approximately 8,000 hours.While the apprentice is working on the job, he or she will normally take atleast 144 hours of classroom instruction per year (e.g., two hours per night,twice a week, over a 36-week school year).
The employer and apprentice employee enter into a formal writtenagreement which sets out the work processes which the apprentice willlearn, the hours which will be worked and the wages the apprentice will bepaid during the program. The employer agrees to provide employment andtraining, and the employee-apprentice agrees to learn the skills identified.
id of the apprenticeship program, the graduating journeypersoncertificate of completion, similar to the diploma awarded byinstitutions. The certificates are issued by the Federal Bureau of
:eship and Training or the state apprenticeship agency.
Exhibit 6.2 provides illustrations (from our interviews with employers) of the structure of
apprenticeship programs and how they are used to prepare recruits for entry into the
profession.
Workers whc become tool and die makers without completing formal
apprenticeships must acquire their skills through many years of on-the-job training. The
9Qccueational Outlook Handbook, p. 403.
9Bell and Garvey (1986).
6-8
231
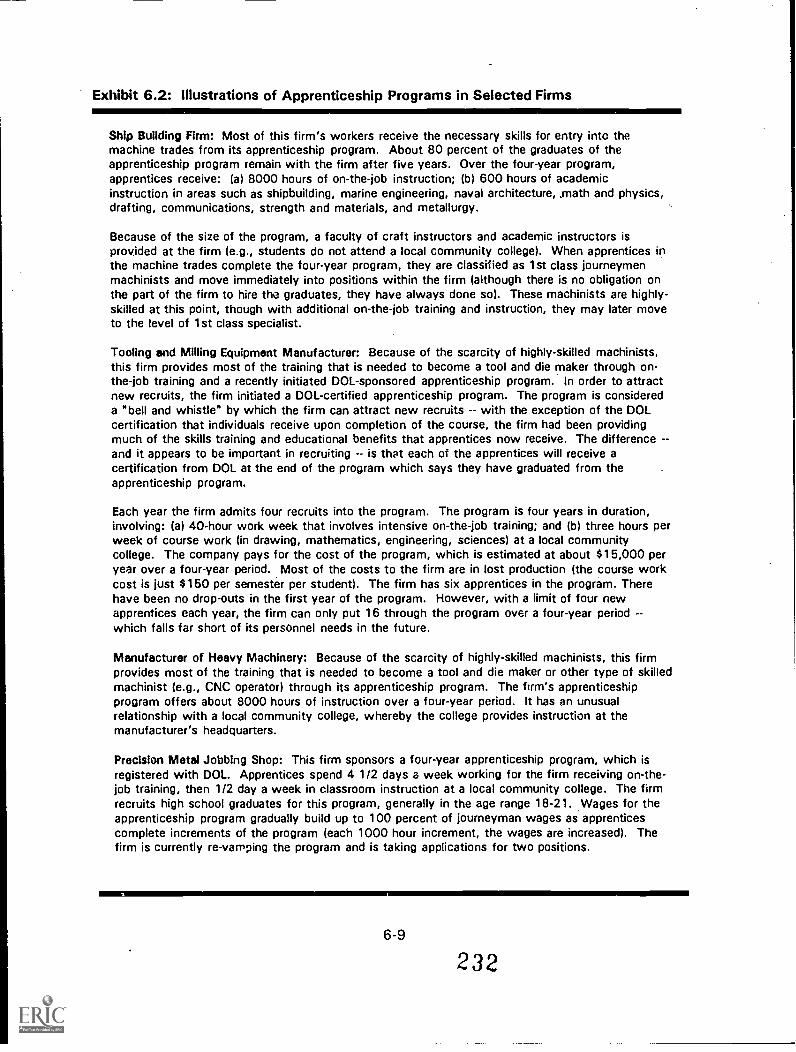
Exhibit 6.2: Illustrations of Apprenticeship Programs in Selected Firms
Ship Building Firm: Most of this firm's workers receive the necessary skills for entry into themachine trades from its apprenticeship program. About 80 percent of the graduates of theapprenticeship program remain with the firm after five years. Over the four-year program,apprentices receive: (a) 8000 hours of on-the-job instruction; (b) 600 hours of academicinstruction in areas such as shipbuilding, marine engineering, naval architecture, _math and physics,drafting, communications, strength and materials, and metallurgy.
Because of the size of the program, a faculty of craft instructors and academic instructors isprovided at the firm (e.g., students do not attend a local community college). When apprentices inthe machine trades complete the four-year program, they are classified as 1st class journeymenmachinists and move immediately into positions within the firm (although there is no obligation onthe part of the firm to hire the graduates, they have always done so). These machinists are highly-skilled at this point, though with additional on-the-job training and instruction, they may later moveto the level of 1st class specialist.
Tooling and Milling Equipment Manufacturer: Because of the scarcity of highly-skilled machinists,this firm provides most of the training that is needed to become a tool and die maker through on-the-job training and a recently initiated DOL-sponsored apprenticeship program. In order to attractnew recruits, the firm initiated a DOL-certified apprenticeship program. The program is considereda "bell and whistle" by which the firm can attract new recruits -- with the exception of the DOLcertification that individuals receive upon completion of the course, the firm had been providingmuch of the skills training and educational benefits that apprentices now receive. The differenceand it appears to be important in recruiting is that each of the apprentices will receive acertification from DOL at the end of the program which says they have graduated from theapprenticeship program.
Each year the firm admits four recruits into the program. The program is four years in duration,involving: (a) 40-hour work week that involves intensive on-the-job training; and (b) three hours perweek of course work (in drawing, mathematics, engineering, sciences) at a local communitycollege. The company pays for the cost of the program, which is estimated at about $15,000 peryear over a four-year period. Most of the costs to the firm are in lost production (the course workcost is just $150 per semester per student). The firm has six apprentices in the program. Therehave been no drop-outs in the first year of the program. However, with a limit of four newapprentices each year, the firm can only put 16 through the program over a four-year period --which falls far short of its personnel needs in the future.
Manufacturer of Heavy Machinery: Because of the scarcity of highly-skilled machinists, this firmprovides most of the training that is needed to become a tool and die maker or other type of skilledmachinist (e.g., CNC operator) through its apprenticeship program. The firm's apprenticeshipprogram offers about 8000 hours of instruction over a four-year period. It has an unusualrelationship with a local community college, whereby the college provides instruction at themanufacturer's headquarters.
Precision Metal Jobbing Shop: This firm sponsors a four-year apprenticeship program, which isregistered with DOL. Apprentices spend 4 1/2 days a week working for the firm receiving on-the-job training, then 1/2 day a week in classroom instruction at a local community college. The firmrecruits high school graduates for this program, generally in the age range 18-21. ,Wages for theapprenticeship program gradually build up to 100 percent of journeyman wages as apprenticescomplete increments of the program (each 1000 hour increment, the wages are increased). Thefirm is currently re-vamping the program and is taking applications for two positions.
6-9
232

worker will usuaily start with straightforward machining jobs, on perhaps an engine lathe
or drill press. Gradually, the worker will receive additional training in order to take on more
difficult assignments. He or she also may receive some vocational school training in shop
math, blueprint reading, and related subjects. Nearly all of the employers interviewed as
part of this study provided considerable on-the-job training as part of their regular work
environment.
2. Methods Employers Use to Recruit Tool and Die Makers
Employers use a variety of methods to recruit tool and die makers. Firms with
apprenticeship programs (generally larger firms) attempt to fill most of their needs through
these programs. Other firms (typically smaller firms, such as tool and die shops) recruit
workers for lower-level machining and then gradually provide the on-the-job training that is
necessary to guide workers to increasingly more sophisticated levels. Most employers and
experts interviewed for this study asserted that it was difficult, if not impossible, to fill a
vacant position by simply placing an advertisement in a local newspaper or with the
employment service for an experienced tool and die maker. Several interviewees stressed
that because of critical shortages of skilled machinists, they had become more creative in
their recruiting methods in recent years. A number of employers we interviewed felt that
their recruitment efforts needed to overcome an apparent bias (on the part of students,
parents, and educators) against blue collar jobs. As will be discussed in greater detail later
in this chapter, most employers felt that there was a great need for the machining industry
to better inform educators (especially high school counselors and administrators), parents,
and students of the challenging opportunities available in the machine trades (see Section
E.2, Factors Contributing to Shortages).
6-1 0
233
Some of the methods used for recruitment of workers either to apprenticeship
programs or directly into positions as tool and die makers are discussed below.
a. Newspaper Advertisements
Some firms use advertisements in local newspapers to recruit workers. Firms
report relatively little success in recruiting tool and die makers, though they are sometimes
successful in recruiting entry-level workers who may eventually be trained to become tool
and die makers. For example, according to the owner-operator of one firm we
interviewed: "When I run an ad, I get plenty of response from cooks, taxi drivers, and
others that lack any sort of basic skills. What I need is someone that is capable of being
trained. I get 50 responses to an ad, but few, if any, have the sort of basic skills that are
needed to become a highly skilled machinist." This same owner indicated that at one point
several years ago his firm was facing such a problem in recruiting skilled machinists. The
firm advertised in local newspapers in other states (including Pennsylvania, Michigan, and
Indiana) where large machine shops had closed down.
b. Job listings with the Public Employment Service
Some firms list job openings with the Employment Service or other employment
agencies. However, while this can be effective for lower-skill positions within the
machining industry (production-type workers), firms appear to have relatively little success
in recruiting workers that have the higher-level skills and experience that are needed to be
tool and die makers.
c. Linkages with High Schools, Vocational Schools, and CommunityCo lleaes
Some firms have found that establishing close linkages with local schools can
provide a valuable source of candidates for apprenticeship programs and for entry-level
machinist positions. Ties with local schools range from informal contacts with machine
6-1 1
234

shop instructors and counselors, especially when firms have vacancies, to establishment
of formal programs with local school systems. For example, one large ship building firm
that has an apprenticeship program for tool and die makers recently established an "adopt-
a-school program." Under this initiative, instructors from the apprenticeship program are
assigned to high schools, vocational and technical schools, and community colleges in the
areas from which the program recruits. The instructors send literature and visit the
schools on a monthly basis talk with students and educators and provide other
information services. Another firm we interviewed recently purchased a school bus, which
it uses to bring high school counselors, teachers, and students to the plant so they can see
for themselves the kinds of careers in which tool and die makers and other skilled
machinists are involved. According to the owner of this firm, this is part of a general
effort to overcome the bias that exists against manufacturing and blue-collar jobs among
educators, parents, and students. The owner-operator of a small tool and die shop
indicated that he regularly goes out to the schools to promote the machine trades (and
manufacturing, in general) through sessions with students and teachers.
d. Word-of-Mouth
For many firms, particularly smaller firms that may only recruit as vacancies arise,
word-of-mouth is viewed as perhaps the most reliable method of recruitment. Having
employees, friends, and relatives "spread the word" about openings can often be the best
means for identifying good prospects. One employer, for example, indicated that the firm
had joined a variety of local and national tooling organizations in an effort to expand
contacts and enhance recruitment efforts.
6-1 2
235
g. Other Methods
Because of the high degree of skill required of tool and die makers, a firm that has
an apprenticeship program often will promote the program as an opportunity to learn a
"career." As mentioned earlier, one firm indicated that it uses its recently initiated DOL-
certified apprenticeship program as a "bell and whistle" to attract new recruits. Another
firm indicated that it uses current apprentices and recent graduates of its apprenticeship
program to disseminate information and assist in recruiting new candidates.
3. Methods Tool and Die Makers Use to Seek and Obtain Employment
There are a variety of methods that workers use to obtain employment within the
tool and die occupation. The paths vary depending upon the background and training of
the individual and the specifics of the local labor market. As discussed above, there are
two major paths through which to enter the occupation: (a) enrolling in a formal
apprenticeship program, generally operated by metalworking manufacturers, or (b) seeking
employment as a machine operator (or other semi-skilled worker) for a metalworking
manufacturer, then gradually acquiring the many skills that are necessary through a
mixture of on-the-job training and classroom instruction. In either case, the worker
typically must locate an employer who offers the formal or informal training that is
necessary to develop the varied technical skills and experience that are needed within the
profession. Several of the principal paths to employment within the machine trades are
discussed below.
a. High School Counseling and Placement Activities
Most vocational and technical high schools maintain a more or less formalized
employment service for their students. Often business and labor leaders serve on advisory
6-1 3
236

boards of the schools to assist them in defining the curricula and securing equipment for
the schools' machine shops. These business and labor leaders also provide invaluable
contacts with local employers for placing students in apprenticeship programs and jobs
within the machine trades. In our interviews, employers indicated that they have become
increasingly involved with wcal schools, both to ensure that their training needs are being
met and to identify and recruit qualified candidates for employment. As a result of these
linkages, teachers and advisors play key roles in disseminating information to students
about apprenticeship programs and job opportunities as tool and die makers.
b. Registration with Public and Private Employment Service Agencies
Local offices of the Employment Service provide information about job openings
within the metalworking industry. In our interviews, employers indicated that they often
list jobs with local Employment Service agencies, but that by and large the workers who
are referred through these agencies lack the basic skills necessary to become tool and die
makers. There are also private employment agencies that maintain listings of openings in
the machine trades.
c. Other Methods
In addition to the methods referred to above, workers might find out about potential
job openings or training slots by (a) consulting want ads in local newspapers, (b) using
union hiring halls, (c) contacting trade associations and their local chapters (e.g., National
Tooling and Machining Association), and (d) word-of-mouth referrals from relatives,
friends, or other acquaintances.
6-1 4
237
C. Employment and Earnings in the Tool and Die Maker Occupation
This section describes and analyzes trends in the employment and earnings of tool
and die makers in the United States. These trends provide insight into the size and history
of the labor market for tool and die makers, as well as preliminary indications of whether
potential shortages of tool and die makers exist.
1. Employment Trends
a. Overall Employment Levels
Changes in the level of employment within an occupation often reflect trends in
demand for workers within the field. An increase in employment sugvests an increase in
demand, while a decrease suggests a decline in demand. A labor shortage is typically
more likely to occur if demand is increasing than if it remains constant or declines because
the supply of workers may not be adequate to meet the growing demand.
Exhibit 6.3 shows that employment levels for tool and die makers have been
relatively stable over the past eight years. In fact, the number of tool and die makers
employed in 1990 -- 152,000 workers -- was only slightly above the number employed in
1983 (148,000). As shown in this exhibit, there have been only relatively modest
changes in the number of tool and die workers during this period, ranging from 143,000 in
1984 to 154,000 in 1986. This exhibit also compares the average annual percentage
change in employment for tool and die makers with machinists. Between 1983 and 1990,
there was only slight growth in the number of workers employed within either occupation -
- averaging 0.5 percent per year for tool and die makers and 0.6 percent for machinists.
Overall, the relatively slow growth in employment levels within the tool and die maker
occupation over such a lengthy period is an indication of sluggish demand. Unless there
6-15
238
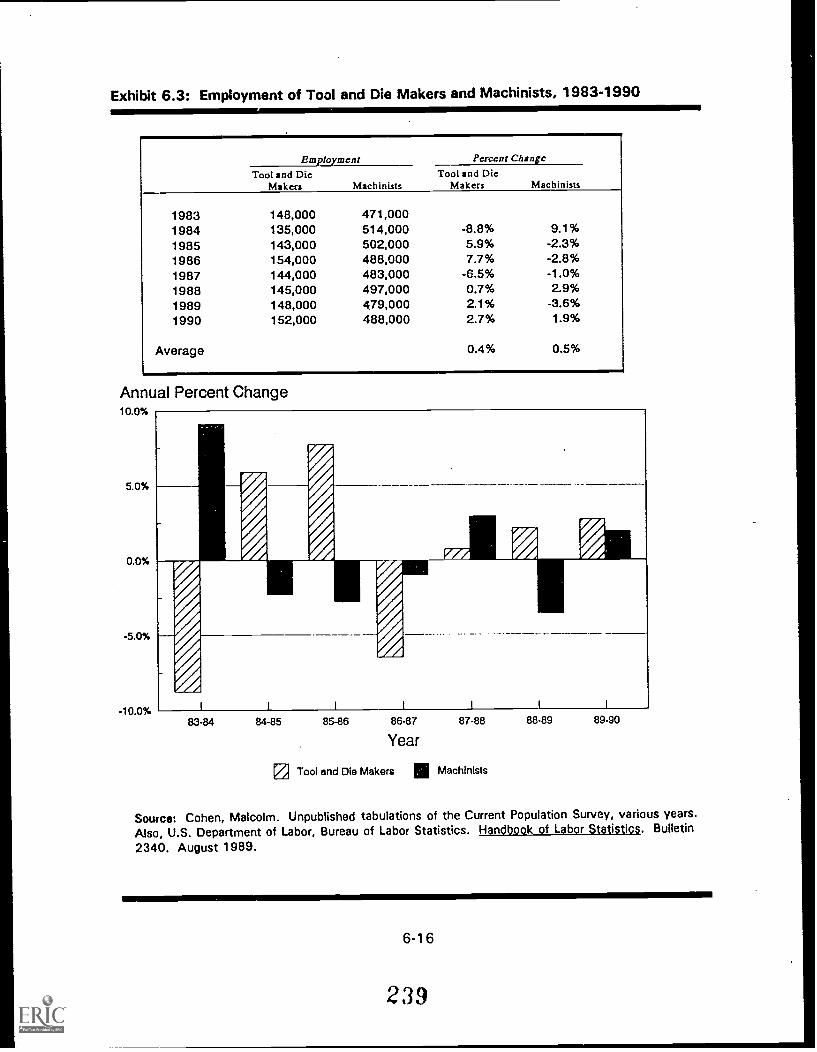
Exhibit 6.3: Employment of Tool and Die Makers and Machinists, 1983-1990
Employment Percent Change
Tool and DieMakers Machinists
Tool and DicMakers Machinists
1983 148,000 471,0001984 135,000 514,000 -8.8% 9.1%1985 143,000 502,000 5.9% -2.3%1986 154,000 488,000 7.7% -2.8%1987 144,000 483,000 -6.5% -1.0%1988 145,000 497,000 0.7% 2.9%
1989 148,000 479,000 2.1% -3.6%1990 152,000 488,000 2.7% 1.9%
Average 0.4% 0.5%
Annual Percent Change10.0%
5.0%
0.0%
-5.0%
-10.0%83-84 84-85 85-86 86-87
Year
3 Tool and Die Makers II Machinists
87-88 88-89 89-90
Source: Cohen, Malcolm. Unpublished tabulations of the Current Population Survey, various years.Also, U.S. Department of Labor, Bureau of Labor Statistics. Handbook of Labor Statistics. Bulletin
2340. August 1989.
6-1 6
239
were constraints on supply -- perhaps caused by shrinkage in the pool of candidates to
select from or by retirement of existing workers slack demand within the occupation
would normally signal that shortages are not a major problem.
b. Average Annual Unemployment Rates
In the absence of vacancy rate data, perhaps the most direct measure of a labor
shortage that is currently available is the occupational unemployment rate.'
Occupations experiencing shortages, in which the number of vacancies is greater than the
number of qualified applicants, are likely to have very low unemployment rates -- since
those searching for jobs find them quickly, and are thus unemployed for a very short
period. Exhibit 6.4 illustrates the unemployment rate for tool and die workers; machinists;
precision production, craft, and repair workers; and all workers. The annual
unemployment rate for tool and die makers was very low between 1983 and 1990
averaging 2.9 percent. The comparable rate for machinists during this period was over
double that for tool and die makers 6.1 percent. The average unemployment rate for all
precision production, craft, and repair workers was 6.9 percent and for all full-time salary
and wage workers over the age of 16 was 6.7 percent.
The relatively low rates of unemployment for tool and die makers appear to be
related to several factors. According to the Occupational Outlook Handbook, the relative
stability (even in recessionary periods) is related to the difficulty that employers have in
"These data are derived from the Current Population Survey. Unemployment rates arecomputed by aggregating total unemployment within an occupational classification anddividing by the total labor force in that classification. The unemployment rate is low eitherwhen demand exceeds supply, or when the two are in balance. In general, according toCohen, a low unemployment rate suggests the possibility of a labor shortage within anoccupation. See: Malcolm S. Cohen (1990). Study on the Feasibility of Using LaborMarket Information for Alien Certification Determination. Ann Arbor, Michigan: Instituteof Labor and Industrial Relations, University of Michigan.
6-1 7
240
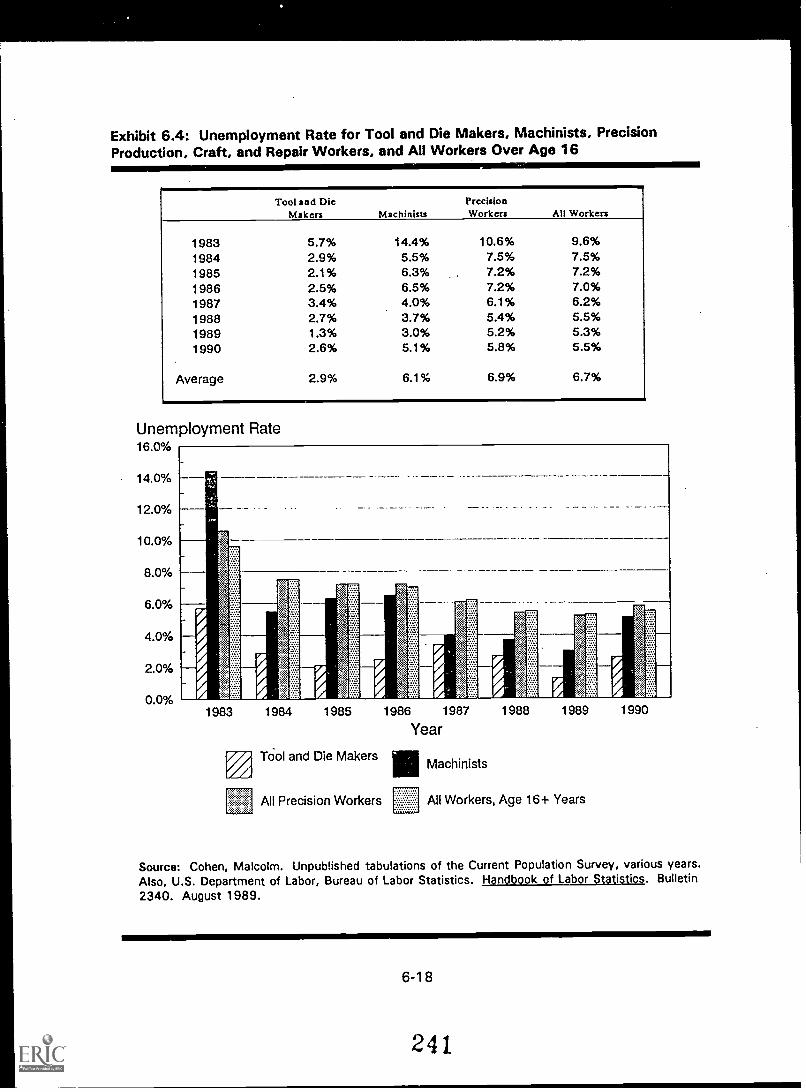
Exhibit 6.4: Unemployment Rate for Tool and Die Makers, Machinists, PrecisionProduction, Craft, and Repair Workers, and All Workers Over Age 16.
Tool and DieMakers Machinists
PrecisionWorkers AU Workers
1983 5.7% 14.4% 10.6% 9.6%
1984 2.9% 5.5% 7.5% 7.5%1985 2.1% 6.3% 7.2% 7.2%1986 2.5% 6.5% 7.2% 7.0%1987 3.4% 4.0% 6.1% 6.2%1988 2.7% 3.7% 5.4% 5.5%1989 1.3% 3.0% 5.2% 5.3%1990 2.6% 5.1% 5.8% 5.5%
Average 2.9% 6.1% 6.9% 6.7%
Unemployment Rate16.0%
14.0%
12.0%
10.0%
8.0%
6.0%
4.0%
2.0%
0.0%1983 1984 1985 1986 1987
Year
Tdol and Die Makers IIIMachinists
1988 1989
All Precision Workers All Workers, Age 16+ Years
1990
Source: Cohen, Malcolm. Unpublished tabulations of the Current Population Survey, various years.Also, U.S. Department of Labor, Bureau of Labor Statistics. Handbook of Labor Statistics. Bulletin
2340. August 1989.
6-18
241
replacing tool and die makers:
...Employment of tool and die makers is less sensitive to fluctuations in thebusiness cycle than many other production occupations. Because these workersare highly-skilled and not easily replaced, employers are reluctant to lay them offeven when production is cut back."
Employers we interviewed were clearly reluctant to lay off experienced tool and die makers
because of costly investments they had made in training their workforce through on-the-
job training and formal apprenticeships and concern over an inability to hire other workers
with the specific blend of machining skills needed. For example, an owner-operator of a
small tool and die shop stated: "I would have skilled machinists paint the factory floor
before I'd let them go ... I try to keep them as happy as I can." For their part, tool and die
makers typically choose to be with one employer for relatively long periods.
Other things being equal, most analysts would consider the relatively low
unemployment rate for tool and die makers (especially when it reached 1.3 percent in
1989) as an indicator of a relatively tight labor market. For example, of the 193
occupations that Cohen examined in 1989, only 38 had an unemployment rate under 1.6
percent. While the relatively low unemployment rate for tool and die makers is an
indication of "tightness" or potential shortage, it is not proof that a shortage exists.
2. Earnings Trends
As discussed in Chapter 2, the rate at which wages change within an occupation is
often viewed as an important indicator of labor market dynamics, especially in the short
run. In occupations where markets move freely (i.e., supply, demand, and wages are not
regulated by the government), a rapid rise in wages may indicate the presence of a
"Occupational Outlook Handbook, p. 403.
6-19
242
shortage. Exhibit 6.5 shows median weekly earnings in the United States for tool and die
makers from 1983 to 1990, in comparison with (a) machinists, (b) precision production,
craft, and repair workers, and (c) all full-time salary and wage workers over the age of 16.
This exhibit demonstrates that earnings for tool and die makers have been substantially
higher than the average for all workers. For example, in 1990 the median weekly earnings
for a tool and die maker was $557, compared to $415 for the U.S. labor force. In fact,
one recent study by the Bureau of Labor Statistics of 26 skilled occupations found that
tool and die makers ranked seventh in net lifetime earnings, behind dentists, physicians
and surgeons, several types of engineers, and owners and managers in finance, insurance,
and real estate.
In 1988, according to the Bureau of Labor Statistics, most tool and die makers
earned between $433 and $680 per week. Ten percent earned less than $335 a week,
while the upper 10 percent made more than $818. Tool and die makers employed in
metropolitan areas had average earnings of $15.35 per hour. In comparison, the average
for all non-supervisory workers in private industry, except farming, was $9.29. In addition
to their hourly wages, tool and die makers usually enjoy a variety of benefits, including
health and life insurance, vacation and sick leave, and retirement plans."
While the median weekly and lifetime earnings of tool and die makers were
relatively high compared to other manufacturing occupations,,the rate of change in
earnings is a more reliable indicator of whether shortages exist within an occupation.
Economic theory suggests that within freely moving labor markets greater changes
(relative to other occupations) in earnings within a profession may indicate the presence of
a shortage of workers. As Exhibit 6.6 shows, median weekly earnings for tool and die
"Occupational Outlook Handbook, p. 403.
243
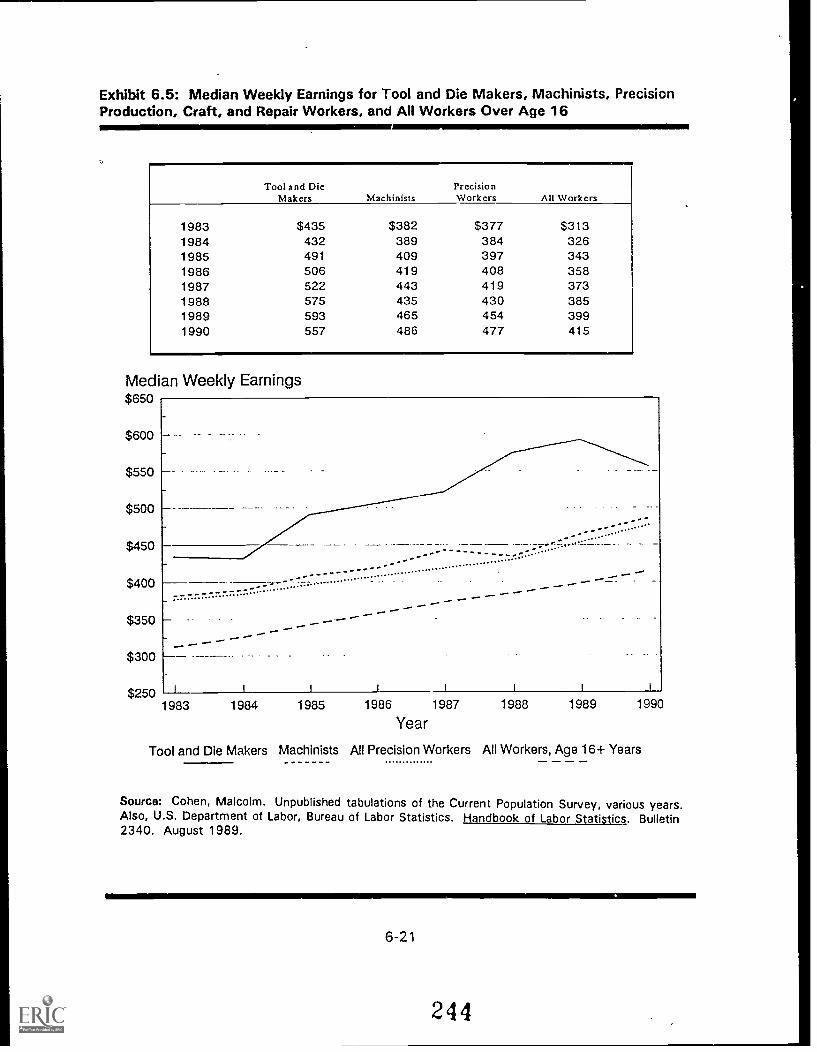
Exhibit 6.5: Median Weekly Earnings for Tool and Die Makers, Machinists, PrecisionProduction, Craft, and Repair Workers, and All Workers Over Age 16
Tool and DieMakers Machinists
PrccisionWorkers All Workers
1983 $435 $382 $377 $3131984 432 389 384 3261985 491 409 397 3431986 506 419 408 3581987 522 443 419 3731988 575 435 430 3851989 593 465 454 3991990 557 486 477 415
Median Weekly Earnings$650
$600
$550
$500
$450
$400
$350
$300
.... ........ 7. 7,
7.7.7." " " ....... 7. 7. 7. 7. 7.
. . . . ... .........................,
........
$250 I
1983
1 I I I
1984 1985 1986 1987
Year1988 1989 1990
Tool and Die Makers Machinists AU Precision Workers AH Workers, Age 16+ Years
Source: Cohen, Malcolm. Unpublished tabulations of the Current Population Survey, various years.Also, U.S. Department of Labor, Bureau of Labor Statistics. Handbook of Labor Statistics. Bulletin2340. August 1989.
6-21
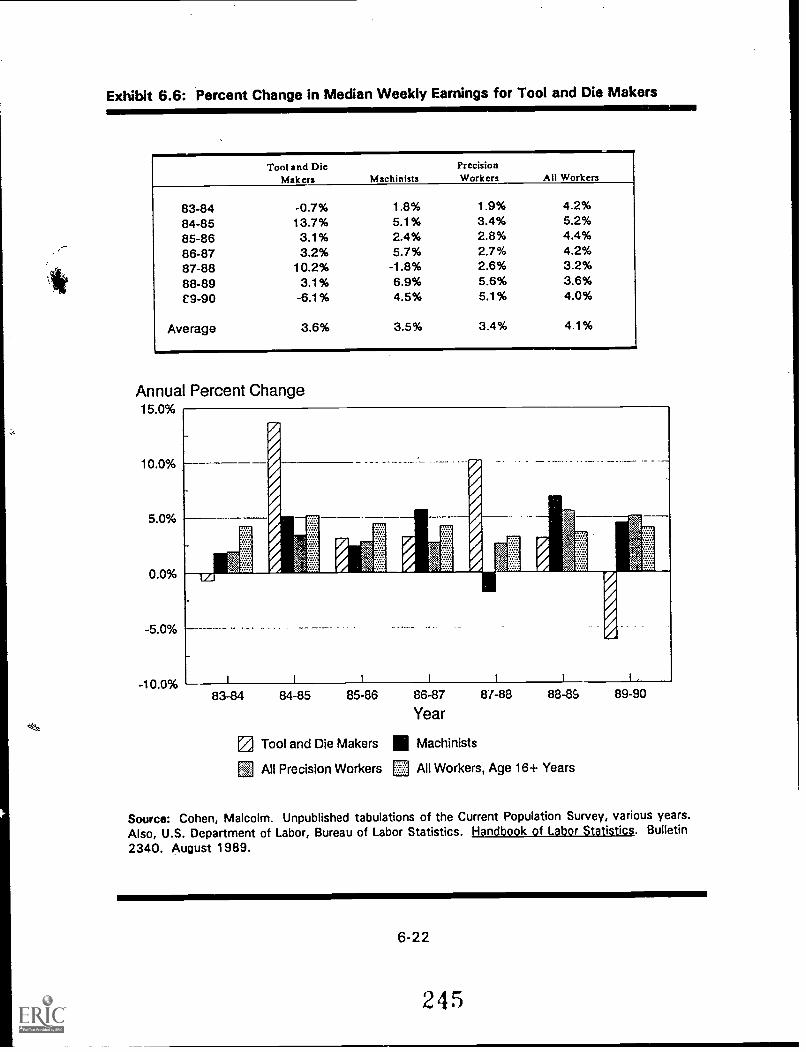
Exhibit 6.6: Percent Change in Median Weekly Earnings for Tool and Die Makers
Tool and DieMakers Machinists
PrecisionWorkers All Workers
83-84 -0.7% 1.8% 1.9% 4.2%
84-85 13.7% 5.1% 3.4% 5.2%
85-86 3.1% 2.4% 2.8% 4.4%
86-87 3.2% 5.7% 2.7% 4.2%
87-88 10.2% -1.8% 2.6% 3.2%
88-89 3.1% 6.9% 5.6% 3.6%
e9-90 -6.1% 4.5% 5.1% 4.0%
Average 3.6% 3.5% 3.4% 4.1%
Annual Percent Change15.0%
10.0%
5.0%
0.0%
-5.0%
-10.0%83-84 84-85 85-86 86-87
Year
[2] Tool and Die Makers 111 Machinists
87-88 88-86
All Precision Workers All Workers, Age 16+ Years
89-90
Source: Cohen, Malcolm. Unpublished tabulations of the Current Population Survey, various years.Also, U.S. Department of Labor, Bureau of Labor Statistics. Handbook of Labor Statistics. Bulletin
2340. August 1989.
6-22
245
makers increased by 3.6 percent on an average annual basis between 1983 and 1990.
This average rate of increase was about the same as that for machinists (3.5 percent) and
precision production, craft, and repair workers (3.4 percent), but slightly below that for all
U.S. workers (4.1 percent).
Finally, there is considerable variation in average hourly earnings for tool and die
makers in selected geographic areas across the United States. For example, according to
the Bureau of Labor Statistics, average hourly earnings in selected geographical areas in
1988 were as follows:
San Jose $17.63Detroit $16.30St. Louis $16.04Boston $15.44Atlanta $15.24Cleveland $14.93New York $13.51Houston $12.89Scranton-Wilkes Barre $12.50
This variation in earnings may reflect shortages of tool and die makers within specific labor
markets. Alternatively, it may reflect regional differences in the cost-of-living, union
contract negotiations, or the extent of competition by local employers for skilled
manpower.
D. Factors Contributing to a Labor Shortage
1. Presence of a Shortage
Our assessment of the labor market conditions for tool and die makers neither
confirms nor rejects the notion of the presence of a shortage for this type of worker.
Rather, it provides conflicting evidence -- both quantitative and qualitative -- that suggests
the possible existence of supply-side constraints that may result in "tightness" or even
6-23
246
shortages in some local labor markets. Further, the nature of the supply-side constraints
particularly the lack of qualified younger workers to replace a highly-skilled, aging
workforce -- may signal increasing shortages of tool and die makers in the coming years.
The aggregate patterns of employment and earnings (discussed in the preceding
section) provide conflicting evidence as to whether shortages exist (or will exist in the near
future) within the tool and die making occupation. Two aggregate trends point to potential
ortages for tool and die makers:
a consistently low rate of unemployment; and
relatively high earnings and higher than average growth in median weeklyearnings.
However, other aggregate data (particularly those reflecting demand-side factors) suggest
relatively less likelihood of shortages:
virtually no employment growth in recent years;
sluggish growth in projected demand for tool and die makers through theyear 2000 (discussed below); and
low replacement demand (discussed below).
In our interviews, we found a considerable range of opinion about whether
shortages did in fact exist. Some employers indicated that they faced "severe shortages"
that constrained their ability to expand their businesses and, at times, to even meet
existing demand for their products. Others suggested that while they did not face current
shortages, they had periodically experienced shortages of tool and die makers in the past
and expected to face shortages in the future. Even those who did not view shortages as a
problem for their firms felt that most employers faced a relatively "tight" and shrinking
pool of qualified candidates from which to draw skilled manufacturing workers. There
6-24
247
appeared to be a general consensus that "supply-side" constraints were the principal
causes of such shortages.
The evidence of shortages provided by employers is, of course, anecdotal,
particularly citing (a) a serious shortage of skilled machinists who can move directly into
positions (without training), and (b) a shrinking pool of young, unskilled workers who have
the basic education and skills that are necessary to master the variety of machining skills
that a tool and die maker must possess. To further exacerbate this problem, employers
point to a generally "aging" group of existing tool and die makers who will need to be
replaced during the next decade. Several illustrations of the varying views of employers
regarding shortages of tool and die makers are shown in Exhibit 6.7.
2. Demand-Side Factors
Labor market analysts and employers generally point to few demand-side factors
resulting in the present or future likelihood of shortages. Looking back over past trends in
employment and forecasts for growth through the year 2000, there is little to suggest that
demand-side factors have or are likely to exacerbate shortages for tool and die makers.
a. Projected Employment Growth from 1988 to 2000
The outlook for tool and die makers appears to be one of relatively slow growth.
The Bureau of Labor Statistics has projected an annual rate of employment growth of 0.4
percent for the tool and die occupation compared to 1.2 percent for the United States as a
whole." This rate of change in the demand for workers is slightly below that of
machinists (0.7 percent), the same as that of sheet metal workers, and well above that for
other precision product occupations (-1.4 percent) and metal working and plastic working
"This rate of increase is for 193 occupations examined by Cohen (1990).
6-25
248
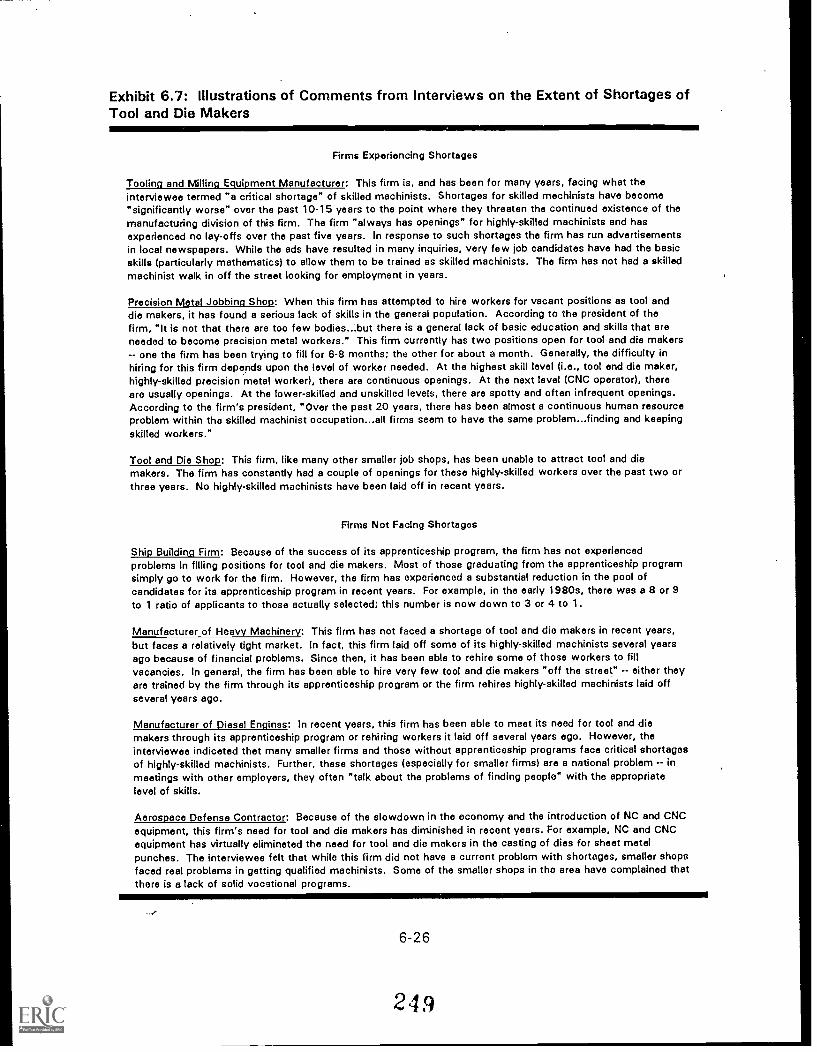
Exhibit 6.7: Illustrations of Comments from Interviews on the Extent of Shortages ofTool and Die Makers
Firms Experiencing Shortages
Tooling and Milling Equipment Manufacturer: This firm is, and has been for many years, facing what theinterviewee termed "a critical shortage" of skilled machinists. Shortages for skilled machinists have become"significantly worse" over the past 10-15 years to the point where they threaten the continued existence of themanufacturing division of this firm. The firm "always has openings" for highly-skilled machinists and hasexperienced no lay-offs over the past five years. In response to such shortages the firm has run advertisementsin local newspapers. While the ads have resulted in many inquiries, very few job candidates have had the basicskills (particularly mathematics) to allow them to be trained as skilled machinists. The firm has not had a skilledmachinist walk in off the street looking for employment in years.
Precision Meta) Jobbing Shop: When this firm has attempted to hire workers for vacant positions as tool anddie makers, it has found a serious lack of skills in the general population. According to the president of thefirm, "It is not that there are too few bodies...but there is a general lack of basic education and skills that areneeded to become precision metal workers." This firm currently has two positions open for tool and die makers-- one the firm has been trying to fill for 6-8 months; the other for about a month. Generally, the difficulty inhiring for this firm depends upon the level of worker needed. At the highest skill level (i.e., tool and die maker,highly-skilled precision metal worker), there are continuous openings. At the next level (CNC operator), therearo usually openings. At the lower-skilled and unskilled levels, there are spotty and often infrequent openings.According to the firm's president, "Over the past 20 years, there has been almost a continuous human resourceproblem within the skilled machinist occupation...all firms seem to have the same problem...finding and keepingskilled workers."
Tool and Die Shop: This firm, like many other smaller job shops, has been unable to attract tool and diemakers. The firm has constantly had a couple of openings for these highly-skilled workers over the past two orthree years. No highly-skilled machinists have been laid off in recent years.
Firms Not Facing Shortages
Ship Building Firm: Because of the success of its apprenticeship program, the firm has not experiencedproblems in filling positions for tool and die makers. Most of those graduating from the apprenticeship programsimply go to work for the firm. However, the firm has experienced a substantial reduction in the pool ofcandidates for its apprenticeship program in recent years. For example, in the early 1980s, there was a 8 or 9to 1 ratio of applicants to those actually selected; this number is now down to 3 or 4 to 1.
Manufacturer of Heavy Machinery: This firm has not faced a shortage of tool and die makers in recent years,but faces a relatively tight market. In fact, this firm laid off some of its highly-skilled machinists several yearsago because of financial problems. Since then, it has been able to rehire some of those workers to fillvacancies. In general, the firm has been able to hire very few tool and die makers "off the street" -- either theyare trained by the firm through its apprenticeship program or the firm rehires highly-skilled machinists laid offseveral years ago.
Manufacturer of Diesel Engines: In recent years, this firm has been able to meet its need for tool and diemakers through its apprenticeship program or rehiring workers it laid off several years ago. However, theinterviewee indicated that many smaller firms and those without apprenticeship programs face critical shortagesof highly-skilled machinists. Further, these shortages (especially for smaller firms) are a national problem -- inmeetings with other employers, they often "talk about the problems of finding people" with the appropriatelevel of skills.
Aerospace Defense Contractor: Because of the slowdown in the economy and the introduction of NC and CNCequipment, this firm's need for tool and die makers has diminished in recont years. For example, NC and CNCequipment has virtually eliminated the need for tool and die makers in the casting of dies for sheet metalpunches. The interviewee felt that while this firm did not have a current problem with shortages, smaller shopsfaced real problems in getting qualified machinists. Some of the smaller shops in tho area have complained thatthere is a lack of solid vocational programs.
6-26
249
machine operators (-0.4 percent). According to the Occupational Outlook Handbook:
Employment of tool and die makers is expected to increase more slowly than theaverage for all occupations through the year 2000. As the economy grows, thedemand for motor vehicles, aircraft, machinery, and other products that usemachined metal parts will increase. Rising demand for these goods will increasethe need for tools and dies and the workers who make them."
Despite the relatively slow projected employment growth through the end of the
century, there are a number of underlying factors that create uncertainty about future
demand for tool am. die makers. First, there is considerable uncertainty concerning the
potential long-term effects on employment within this occupation from increasing use of
NC and CNC equipment. The Occupational Outlook Handbook suggests that such
expansion will probably reduce the demand for tool and die makers:
Employment growth, however, will be limited by increased use of numerically-controlled machine tools and imports of machined products. The greater use of NCmachine tools has reduced the number of operations done by hand. Producersobtain high quality precision parts with fewer workers.'
Other analysts 'suggest that the expanded use of NC and CNC equipment, while
substantially changing the way in which tool and die makers operate, will create new
opportunities and perhaps expanded demand for skilled machinists:
...More and more of these automated devices and machines will be used in thefuture, but they will not replace the skilled machinist. Skilled machinists will beneeded to build and maintain these systems... In short, while new technology willsurely bring many more changes in manufacturing processes, the skilled person willalways be needed. Skilled toolmakers, diemakers, moldmakers, and machinists areoften called the high priests of mass production technology. They will continue tobe at the leading edge of new production developments. Tremendous opportunitiesabound in the skilled metal working trades for those aggressive individuals who arewilling to learn new techniques and skills."
"Occupational Outlook Handbook, p. 403.
15Occupational Outlook Handbook, p. 403.
1°Bell and Garvey (1986), p. 57.
6-27
2 5 0
Second, economic conditions within the country will play an important role in determining
the growth in employment within the tool and die occupation. Because the tool and die
industry provides the tools, dies, and molds that are used in mass production (by other
firms) of consumer goods (e.g., automobiles), employment within the field will be
substantially affected by general economic conditions. If the economic slowdown of
1990-91 should continue and even deepen, employment growth within the tool and die
occupation could be even slower than that projected by the BLS. Finally, employment
within the tool and die occupation is also dependent upon the extent of imports and
exports of both machine tools and finished products. For example, according to the
Occupational Outlook Handbook:
... Because precision metal products are a primary component of manufacturingmachinery, increased imports of finished goods, as well as precision metalproducts, affect employment demand for tool and die makers."
Given likely fluctuations in currency rates, current negotiations over barriers to
international trade (e.g., the Free Trade Agreement with Mexico and Canada), and
uncertain international economic conditions, there is considerable uncertainty about how
the level of imports and exports of both machine tools and finished products will affect
employment within the tool and die occupation in the coming years.
b. Replacement Demand
In any given year, workers leave an occupation for a variety of reasons -- illness,
death, retirement, or to enter new professions. High rates of turnover -- i.e., the need to
replace workers -- within an occupation may signal (though certainly not prove) the
existence of potential shortages. There is considerable concern within the machine tool
industry over the relatively high proportion of tool and die makers over tho age of 50.
"Occupational autlook Handbook, p. 403.
6-28
251
Given the relatively long training period, there are some fears that as these older workers
leave the occupation, employers will be unable to find workers with the appropriate skills
and experience to fill vacancies (i.e., not enough trainees in the pipeline).
In recent years, the replacement demand" for tool and die makers (8.7 percent in
1986-87) has been relatively low compared to most other occupations in the United
States. For example, among the 193 occupations analyzed by Cohen (in 1986-87), the
replacement demand for tool and die workers was in the lowest quartile. Further, the
replacement demand for tool and die makers was also low compared to other related
professions: it was slightly below that for machinists (9.1 percent) and sheet metal
workers (10.7 percent), and well below that of other precision production occupations
(13.9 percent) and metalworking and plastic working machine operators (17.2 percent).
The relatively low rate of replacement demand for tool and die makers most likely
reflects the strong attachment that tool and die makers generally have to their jobs. This
strong job attachment -- in which workers often stay with the same employer for 20 or 30
years -- appears to be a result of several factors, including: (a) long and costly
investments in training by workers, (b) relatively high wages and lifetime earnings
(compared to other manufacturing jobs), and (c) rigorous efforts on the part of employers
to hold on to a skilled workforce in which they have made substantial (human capital)
investments. While the low rates of replacement demand appear to suggest a lower than
average probability of generalized shortages within the tool and die occupation, the general
"aging" of the tool and die workforce in the United States suggests that the replacement
"Although BLS does not currently publish estimates of replacement demand byoccupation, Cohen was able to estimate replacement demand by using unpublished dataprovided by BLS. To obtain a measure of replacement demand, Cohen counted all workerswho left an occupation, and then expressed the ra. ) as a percentage of workers employedin the occupation in 1986.
6-29
252
demand for this type of worker may increase substantially during the 1990s. This
possibility, coupled with the relatively long training periods and a shrinking pool of young,
qualified workers willing to enter the tool and die making profession, may signal growing
shortages in the future (at least in some local labor markets).
3. Supply-side Factors
Employers who indicate they face shortages of tool and die makers identified
several supply-side factors that restrict the flow of new workers into the profession. The
major problem identified by employers is that they are finding it increasingly difficult to
replace retiring workers with younger workers. For example, one employer (a
manufacturer of tooling and milling equipment) complained that over the past decade many
of the tool and die workers who had been with the firm for 30 to 40 years have retired
and it has been virtually impossible to find experienced workers to replace them: "I can't
find a highly-skilled machinist...haven't found one in three years..." Given this apparent
lack of experienced tool and die makers, flans are typically forced to recruit young,
unskilled workers and provide apprenticeship training and more informal on-the-job
training. According to employers and other labor market experts, several factors
contribute to an inadequate supply of younger workers who can be trained to become tool
and die makers. These factors are discussed below.
a. Lack of Prestige -- "Blue Collar" Bias
Many of those interviewed felt that a strong "blue collar" bias has affected the
willingness of younger workers to consider entering occupations within the manufacturing
sector. High school graduates who have mastered the basic skills necessary for entry into
the skilled machinist field have been, by and large, encouraged by educators and parents
6-30
25.3
alike to prepare for more prestigious and well-paying occupations. This perspective was
echoed by a number employers that we interviewed:
...High school counselors are in 'never-never land.' They are unaware of the well-paying opportunities within the machine trades. Parents are also a big obstacle --they definitely have a bias against their children entering the machine trades.
...The machine trades have not been promoted in our schools and are not a glorifiedfield. It's a tough society in which to sell a job in the machine trades. Every parentwants their kids to attend college and then get a M.B.A. or Ph.D.
...One of the major barriers that our firm's apprenticeship program has had toovercome in recruiting young workers has been an apparent bias against careers inthe manufacturing sector. Part of this problem stems from the fact that high schoolprincipals and counselors are evaluated in terms of the percentage of graduates thatgo on to college. This reinforces a bias against students entering manufacturingoccupations. Manufacturing jobs, like those of tool and die makers, are not giventhe same recognition as jobs requiring a college education within the service sector.
...Image has been a major factor that has contributed to the inadequate supply ofskilled machinists. Everyone wants to attend college.
b. Lack of Knowledge About Opportunities within the Machine Trades
Many interviewees felt that high school students are not provided with adequate
information about employment and training opportunities within the machine trades.
Interviewees felt that the machine trades industry has failed "to get out its message"
about the many well-paying and challenging opportunities for skilled machinists. They also
feel that educators and parents generally lack knowledge of the machine trades and/or are
reluctant to provide information to students that would encourage them to enter the
trades. Several comments from employers we interviewed illustrate this viewpoint:
...The bias against entry into blue collar professions is further exacerbated by thefact that educators, parents, and high school students are unaware of the well-paying opportunities within the machinist field and manufacturing in general. Highschool teachers and counselors are simply not equipped to counsel students aboutopportunities within manufacturing.
...There is a serious problem with high school counselors who are unaware of themany well-paying opportunities within vocational trades and push students towardcollege. Industry and education have not established satisfactory linkages.
6-31
254
..The machine trades is not telling its story very well. There is a lack of activism onthe part of industry. We have not encouraged schools to prepare students for jobsin industry and people are generally misinformed about the role of manufacturing inthe economy. Public awareness is a lot of the problem.
c. Poor Basic Skills
As a prerequisite for being trained as a tool and die maker, an individual needs a
solid foundation of basic education and skills, particularly in mathematics and science.
Employers complain that while basic education skills were the standard 20 years ago (e.g.,
neirly all entrants to the field had at least some training in solid geometry, algebra,
trigonometry), many of those seeking to enter the machine trades today are seriously
lacking in the required basic skills. Without such skills, employers find that it is difficult, if
not impossible, to provide workers with the training needed to plan and execute complex
machining projects and to effectively operate a variety of machining equipment. In
addition, employers are often reluctant to take the time and absorb the costs of providing
recruits with basic education training (i.e., generalized training), before providing more
specialized training as a tool and die maker. In general, employers feel students who are
not planning to attend college are not being adequately prepared by high schools to
directly enter other vocations. Some examples from our interviews of this perspective
follow:
...The quality of new entrants has really fallen over the last 10 to 15 years. Newentrants need basic education especially basic mathematics background (algebra,solid geometry, trigonometry) but the candidates that are coming to the field lackthese basic skills. Basic skills that were the standard 20 years ago are woefullylacking now. Part of the problem is that high school kids who have basic skills areall going off to college and those that are left have very little in the way of skills.
...As technology has advanced within the machining trades, entry levelrequirements have changed skilled machinists can no longer be trained on the jobif they lack appropriate basic skills.
...High schools are geared for college preparation. There is really very littlemeaningful vocational education. Vocational classes are unfortunately viewed as
6-32
255

an easy way through high school. Students who do not attend college often havethe aptitude for a job like a tool and die maker but lack confidence and self-esteem.In fact, the educational system is doing a disservice because students are left witha feeling of low self-esteem if they do not attend college. For most studentsvocational education is not a reality, it is just a way to get through school and avoidmost classes. This is a national problem.
...The real problem is with the students who neither plan to attend college nor havedevelopmental disabilities: upon graduation, these students do not have the skillsto do much of anything.
...The work for skilled machinists is more technical and complicated than beforerequiring greater skills and precision. Those who come to our apprenticeshipprogram are often lacking in the basic skills that are needed to become skilledmachinists.
d. Relatively Long Training/Apprenticeship Period
Some employers indicate that the relatively long training period for skilled
machinists may be a factor in the willingness of younger workers to enter the tool and die
trade. For example, one firm that produces milling machinery, claims it took new recruits
10 to 12 years to become fully trained for some of the highest precision work. While none
of the firms interviewed that have apprenticeship programs complain of problems with
recruitment for their programs, a long training period can reduce the size of the applicant
pool, result in higher levels of attrition during the training period, and reduce the ability of
employers to respond to short-term shortages. In addition, the length and costs of
apprenticeship programs reduce the willingness of small- and medium-size firms to sponsor
such programs.
e. Lack of Training Facilities in High Schools
A number of interviewees complain that area high schools have eliminated machine
shop and vocational programs. In general, such programs have been eliminated because of
cutbacks in expenditures by local school districts it is relatively expensive to run such
programs and a lack of interest on the part of students. Interviewees also blame the
6-33
256

educational system as a whole, which creates incentives for high school principals and
counselors to prepare students for and place them in universities and colleges. Some
examples of this perspective from our interviews follow:
...Over the past 15 years, there has been a loss of 19 vocational machine shopprograms in the four counties that surround our factory. In 1975, there were 23vocational machine shop programs, now there are only four. It appears to be avicious cycle: students are not aware of opportunities and are biased against acareer as a machinist, so they do not select the coursework; the costs of running amachine shop are relatively high, so when there is little demand for the coursework,schools cut back or eliminate the facilities.
...Not a single high school within 10 miles of the firm has shop class available forstudents. Where 10 years ago all of the high schools had such facilities, they nolonger do. As a consequence, students are not introduced to shop.
...School districts are increasingly closing down vocational programs. Recently,three more high schools in the state closed down their machine shops (turning theminto maintenance shops for the school) as cost cutting measures. In addition, thoseschools that retain their vocationai programs generally lack state-of-the-artequipment.
f. Other Factors
A number of other factors may also contribute to the tightness in the market for
tool and die makers:
"Baby bust": The "baby bust" has reduced the applicant pool forapprenticeship programs and entry-level positions.
Apprenticeship Wages: While the earnings of tool and die makers arerelatively high compared to other manufacturing workers, apprenticesreceive a training wage that is a percentage of what is paid to experiencedtool and die makers. With the apprenticeship period for tool and die makersquite long, some prospective workers may be discouraged by such a lengthyperiod of relatively low earnings.
Traditionally Male Workforce: Until recently, the machine trades have beenviewed almost exclusively as an occupation for men. While this ischanging -- especially with increasing emphasis on use of CNC equipment --the number of women interested and willing to work as tool and die makersis still quite restricted.
6-34
257

E. Adjustments to Shortages by Employers
As discussed in Chapter 2, there are a range of strategies that employers can use
to adjust to or alleviate the effects of shortages of labor. Some of the adjustments that
employers of tool and die makers have used in the past or are planned should future
shortages emerge are examined below. Potential government and educational responses
to future shortages are discussed in the final section of this chapter (under
recommendations).
1. Intensify Recruitment Efforts
Several firms indicated that they have become more intensive and "creative" with
their recruitment efforts in recent years. Some firms have intensified recruitment through
established channels -- such as increasing advertisements in local newspapers or
intensifying efforts within public and private employment agencies. However, some firms
indicated that increasing efforts through established channels has relatively little effect on
the ability to fill vacancies. Such efforts generally result in an increase in the number of
job applications, but generate few workers with the basic education and skills needed to
become highly-skilled machinists.
Several firms stressed the importance of being more creative in their approach to
recruitment. They emphasized the importance of establishing linkages with local high
schools and technical schools to promote careers within the machine trades and to identify
potential candidates for employment. For example, an owner-operator of a small tool and
die shop we interviewed indicated that he regularly goes to local high schools to discuss
opportunities within the machine trades With teachers and students. According to this
owner-operator: "Firms need to go into the schools and let their needs be known and to
6-35
258

educate guidance counselors, teachers, and students about the many opportunities that
are available within the machine trades." In his discussions, he tries to emphasize that
students need to be "realistic" about their futures. This owner-operator stresses that even
if a student plans to attend college, it is possible to start with a career in metal working.
Such a career is likely to provide educational benefits and resources that can help to pay
for college. Employers emphasize the importance of overcoming biases against the
machine trades (and other manufacturing jobs) by talking directly with educators and
students about the many high-paying jobs within the field, the potential for continuing
education and advancement, and the changing nature of the machining trades with the
advent of NC and CNC equipment.
2. Use of Overtime
-Overtime work is cqmmon within the machine trades. Most firms we interviewed
indicate that they use overtime as one method to get around shortages of tool and die
makers and to meet delivery dates for products. For example, in one firm, tool and die
makers typically work 56 hours per week; another firm indicates that tool and die makers
generally get about 10 percent in overtime work above their 40 hours per week. For the
firm, the advantage of overtime is that fringe benefit costs are largely fixed and worker
hours can be varied on a weekly basis in accordance with the demand for services.
3. Reduce Minimum Qualifications for the Job
Some firms indicated that there has been a de facto lowering of minimum hiring
requirements because of an inability to find younger workers to replace retiring machinists.
For example, according to one employer we interviewed:4016
6-36
...Over the past 10 to 15 years, we have lowered our standards for hiring youngerworkers to become machinists. This is because we have experienced suchdifficulties in finding qualified individuals. Where strong mathematic skills and basiceducation were formerly a requirement, we will take a chance with someone thatwe believe we can successfully train.
However, there is not a consensus on the issue of reduction in minimum hiring
requirements -- several of those interviewed suggest that because the work is increasingly
computerized, hiring requirements have actually increased over the years.
4. Restructure Work to Use Current or New Employees in Other Occupations
Several of those interviewed indicated that in response to new technologies and
shortages of skilled machinists, work in the shops has become le'ss vertically integrated.
For example, one interviewee asserted that a decade ago tool and die makers in his shop
would start with raw material, make a "blank," and then manufacture the part or tool from
the blank. Today, this firm contracts out for the "blanks" so that its tool and die makers
can concentrate on the end product. Further, two firms we interviewed indicated that
they have dealt with shortages by increasing the level of specialization in the production
process and substituting lower-skilled workers:
...Because of shortages of skilled machinists, the firm has introduced increasingspecialization into its manufacturing process. For example, where one highly-skilledmachinist may.have made a tool in the past, now three less skilled workers mightbe used: one worker will do the churning, another the milling, and a third thefinishing work.
...Because of severe shortages of highly-skilled machinists, our firm is getting awayfrom one tool and die maker who does all the work on a job. Instead, there isincreasing specialization, where several skilled machinists do one part of the totaljob.
6-37
260

5. Substitute Machinery and Equipment for Labor
One of the biggest changes in the production process within the tool and die
industry has involved the use of NC, CNC, and other new labor-saving technologies. Most
of those interviewed indicated they have introduced new technologies that have affected
their need for highly-skilled machinists. Two illustrations from our interview's:
...We have gradually introduced NC and CNC equipment into our operations. Theprimary reason for introducing such equipment has been the shortage of highly-skilled machinists. NC equipment and other computerized equipment can be usedin some instances in place of what would have formerly been done by highly-skilledtool and die makers.
...The production process has increasingly substituted computer equipment forhighly-skilled machinists: where 15 years ago a highly-skilled machinist would workon a $5,000 machine to produce a tool or part, today a $5 to $7 Iwage per hour)relatively unskilled worker is employed using a $100,000 machine.
6. Train Workers for Jobs
Company-sponsored apprenticeship programs and on-the-job training have always
been an important part of recruiting and preparing workers to enter the machine trades
(see Section 6.2). Because of the range and complexity of the machining oquipment and
the highly specialized and precise nature of the work, most employers have a commitment
to training workers.
7. Improve Wages, Fringe Benefits, and Working Conditions
A number of those interviewed stressed that because of shortages of highly-skilled
machinists and the costs associated with training new workers, they are concerned about
the competitiveness of their wage and fringe benefit packages. For example, one
employer indicated "we bend over backwards to keep the machinists that we have" by
providing competitive wages and fringe benefits and by providing personal recognition for
6-38
work that has been done. Aggregate data on earnings of tool and die makers suggests
that while tool and die makers receive relatively high wages compared to most
manufacturing workers, the percentage increase in earnings over the last eight years has
actually been below that of all workers over 16 years of age. Hence, while some
employers may increase earnings in response to localized shortages or shortages of
specific types of tool and die makers, this has not been a generalized response in the
industry.
8. Contract Work Out and Turn Down Work
Several firms indicated that the first strategy if they do not have sufficient
manpower is to attempt to delay the delivery date of the order. If this cannot be done,
then they will contract part or all of the order to another shop. For example, one employer
indicated that when they have too much work, they will subcontract orders to former
employees who have established their own shops. Another employer indicated that he
was contracting substantially more work to other tool and die shops than in the past.
As a last resort, firms may turn down business. The firms that we interviewed
indicated that they are very reluctant to turn away business. Only one firm provided an
example of how the inability to hire skilled machinists had led directly to a loss of
business. In this case, the firm was approached by a local manufacturer that had decided
to divest its manufacturing operation and to bebome only an assembly operation. This firm
was one of 12 companies asked to become a primary supplier. It would have meant an
extra million dollars in sales (an increase of 30 percent in the firm's sales). To meet this
demand, the firm would have needed to add an extra 15 tool and die makers and other
highly-skilled machinists -- however, one year later it had been able to add only two highly-
6-39

skilled machinists. In the end, the firm had to curtail its efforts to become one of the
primary suppliers for this manufacturer, primarily because of shortages of experienced,
highly-skilled machinists. According to the owner-operator of this firm: "A firm cannot
respond to opportunities if there is a lack of human resources. While you can usually
borrow money or get machinery, finding the necessary human resources is a problem.
However, this is not a new problem within our industry; it has been a problem since
1951."
F. Conclusions and Recommendations of Public and Private Sector Steps to AlleviateShortages
1. Conclusions
Overall, the evidence presented in this chapter does not resolve the issue of
whether shortages do or do not exist for tool and die makers. It does suggest that some
employers -- especially smaller firms that do not sponsor apprenticeship programs -- have
problems in recruiting experienced tool and die makers and in finding qualified younger
workers for training in the field. However, in the face of generally sluggish demand for
tool and die makers (both during the past decade and expected through the year 2000),
supply-side constraints will need to continue and intensify before serious shortages will
likely emerge.
The experience of employers points primarily to supply-side problems. Most firms
indicate that from time to time they have faced shortages of tool and die makers. They
find it generally difficult to locate experienced tool and die makers (i.e., individuals who
already have the specific skills that are needed). As a result, it is necessary for firms to
provide training through formal apprenticeship programs or on-the-job training for most
new recruits.
6-40
263
When asked whether they currently are experiencing shortages for tool and die
makers, the responses vary: some employers indicate that they face "severe shortages,"
while others say that they do not have current openings, and when they have in the past
they have been generally able to fill them. There is, however, concern among even those
who do not cite specific shortages about the following factors that might result in a future
imbalance in supply and demand:
the high proportion of older tool and die makers who are nearing retirement;
an apparent bias against employment within the manufacturing sector,which together with the "baby bust" is resulting in a shrinkage of the pool ofyoung high school graduates from which to select young workers;
lack of basic education and skills development in high school for studentsnot bound for college, together with a decreasing emphasis on vocationaleducation, which results in new recruits being poorly prepared for training ashighly-skilled machinists;
lengthy and costly periods of training for tool and die makers. which make itdifficult for employers to adjust quickly to increased product demand; and
an uncertain impact of technological change (especially NC and CNCequipment) on the demand for highly-skilled machinists and the types oftraining that are required.
2. Recommendations
Despite the lack of consensus on whether shortages do or do not exist within this
occupation, there are a number of steps that can be taken within the public and private
sectors to help avert or alleviate shortages in the future. These recommendations are
particularly aimed at relieving some of the constraints on the supply of workers to the tool
and die maker occupation.
6-41
264
a. Promote Manufacturing at the National Level
Many of those who were interviewed stress the importance of a "national strategy"
for promoting manufacturing and encouraging workers to enter the manufacturing sector.
Such a campaign is needed to improve the "image" of manufacturing and to demonstrate
to the American people that manufacturing is as important to the prosperity of the country
as the services sector. Several comments from our interviews illustrate this viewpoint:
...A large national effort is needed to get students to understand the types of jobsthat are available within the manufacturing sector. In addition, students need tounderstand that their career path can begin with an apprenticeship or that eventhose with a college education may want to enter apprenticeship programs to learnmore practical skills.
...The government needs to provide a clear signal to the American people thatmanufacturing is important to the economy and that we do not intend to besubservient to Japan and Germany.
...A concentrated effort is needed to promote the machine trades andmanufacturing jobs, in general. The industry needs to introduce the idea thatentering the machine trades is a "good start" on a career where skills and goodwork habits are learned which can later be applied to other fields.
...More prestige needs to be placed on vocational jobs in this country, as is done inJapan, Germany, Australia, and other countries. There is a perception (in the U.S.)that a blue collar worker is not of the same caliber as a white collar worker. This isapparently not the case in Japan and some other countries. For example, a recentJapanese gold medal winner in an international competition among youngmachinists met with national leaders and was featured on national television and inlocal newspapers. A bronze medal winner in this same competition from a U.S.firm, by comparison, was lucky to get his name in the company newspaper.
b. Encourage the Formation of Emo lover-Based Aoorenticeship Programsand On-the-Job Training
Providing younger workers with the skills to become tool and die makers and other
types of highly-skilled machinists is expensive and requires a long-term commitment on the
part of employers (and workers). From the employer's perspective, there are no
assurances that the investment made in workers through apprenticeship programs and on-
the-job training will necessarily be rewarded by long and productive years of employment
6-42
2135

by those workers with the firm. As a result, unless they are relatively certain that they
can recoup their investment, firms may be unwilling to sponsor employer-based training
programs. Sponsoring such programs is particularly a problem for smaller tool and die
shops, where the costs of training must be spread across a smaller number of workers.
However, in a field such as tool and die making that requires highly specialized
skills, there are few (if any) alternatives to employer-based training. Employers and
experts stress the importance of encouraging firms through financial incentives and
technical assistance to sponsor employer-based training, which closely integrates the
workplace with the schools. Some experts, such as Stephen Hamilton, argue that
employer-based apprenticeship programs similar to those found in Germany are what is
needed:
...Apprenticeship enables ordinary German teenagers to begin careers at the sameage that their U.S. counterparts are being turned out of school to sell candy, flipburgers, and pump gas. West Germany's system can aid our thinking about how tointegrate high school graduates into the labor market. The system vividlydemonstrates that the floundering period results from educational and labor marketconditions not from any inherent irresponsibility or instability of youth. Rather thaneschewing young employees, West German employers prefer hiring 15- and 17.-year-olds as apprentices in order to instill in them the kinds of attitudes, workhabits, and skills that they require. The success of the German system suggeststhat some kind of apprenticeship might improve the transition of U.S. youth fromschool to work."
Hamilton argues that, based on the German experience, there are four key features needed
in any effective apprenticeship program:
workplaces and other community settings need to be exploited as learningenvironments;
work experience needs to be linked to academic training;
"Stephen F. Hamilton (1990). Apprenticeship for Adulthood: Preparing Youth for theFuture. New York: The Free Press, a Division of Macmillan, Inc., p. 4.
6-43

youth need to be simultaneously workers with real responsibilities andlearners; and
close relationships need to be fostered between youth and adult mentors.'
The cost and lengthy duration of training programs for tool and die makers can be a
major impediment to employers setting up such programs, especially for smaller firms.
There may be no simple solution to this problem and, in fact, with the use of technology
expanding, it may be necessary for firms to spend even more on training the workers.
One suggestion is that smaller firms join together and share the costs of establishing and
maintaining an apprenticeship program within certain localities. For example, local tool and
die shops might join to form a program that provides classrooni instruction at a local
community college, and on-the-job training at the tool and die shops participating in the
initiative. This collaboration is likely to reduce start-up costs and costs associated with
recruiting workers into the program, as well as enable apprentices to work on a wider
variety of equipment at the various shops involved in the program.
c. Enhance Basic Education and Vocational Education for Students
The role of high schools, vocational schools, and community colleges in preparing
students for entry into careers in the machine trades is the focus of many comments by
employers and experts. One of the most frequent comments by employers is that high
schools need to prepare students better for entry into the job market by providing greater
emphasis on basic education. Employers we interviewed stress the need for students who
are not planning to attend college to receive basic education and skills training:
...Greater emphasis needs to be placed on the three Rs especially mathematics.The students who are completing high school and not going on to college aregenerally poorly equipped to enter the machine trades.
"Hamilton (1990), p. 61.
6-44
267

...High schools need to beef up their vocational programs and provide students thatare not going on to college with the basic skills (math, reading comprehension, andproblem-solving) that are needed to enter the machine trades.
With the tasks involved in machining becoming increasingly complex, basic skills and the
ability to learn are becoming more important within the tool and die occupation.
Second, schools need to increase and better target funding on vocational training.
Employers complain that school districts are dismantling their vocational education
programs by reducing funding for such programs and, in some cases, machine shops. It is
felt that schools have to work closer with local employers to enhance (and better target)
curriculum and to replace antiquated equipment. For example, according to one employer,
"Schools need to be provided with the types of facilities and equipment that are needed to
support quality vocational education. Instead the trend is toward cuts in funding for
vocational training programs within many local school districts." Another employer
suggested that with the increasing reliance on technology within the machine trades, the
solution to this problem is to enhance the role of community.colleges:
...A "two and two program" is needed, whereby students get two years ofpreparation and training in high school in the machine trades, then attend a two-year program at a local community college.
Third, educators, parents, and students need to be provided with a better
understanding of the machine trades and the many challenging and well-paying
opportunities within the field. As discussed earlier in the chapter, industry and the schools
need to work closely to overcome perceived biases against blue collar employment and to
provide students with accurate information about employment opportunities within the
machine trades.
6-45
268
d. improve Data on Demand for Tool and Die Makers
Some analysts urge that the government work to improve the data that are
available to individuals and firms on the labor market conditions for manufacturing
workers. Special attention is needed to improve data on the current demand for fields
such as tool and die makers and to improve the methods used to project future demand.
For example, periodic collection of vacancy rate data from major employers of tool and die
makers and other specialized manufacturing occupations is needed to accurately anticipate
potential shortages.
6-46
269
CHAPTER 7
SUMMARY AND CONCLUSIONS
This chapter synthesizes findings across the four case studies and provides
recommendations on how the likelihood of occupational shortages can be reduced. The
first section of this chapter discusses the underlying conditions responsible for the
emergence of shortages within occupations. This is followed by an analysis of the
consequences of shortages in the occupations that we studied and responses to
shortages. The final section provides general recommendations on how occupational
shortages can be anticipated and avoided, and when they do occur, how their duration and
impact can be minimized.
A. Existence and Causes of Shortages
Overall, across the four occupations that were the focus of this study, we found
two occupations special education teachers and home care wcrkers -- where there are
clear shortages of workers to fill available positions. In the other two occupations --
electrical and electronic engineers and tool and die makers the evidence for shortages is
less certain. In the case of electrical and electronic engineers, while there is evidence of
spot shortages, especially in some emerging technological areas, there now appears to be
an overall surplus of available manpower because of recent cutbacks in defense spending
and the recession. The primary concern is whether and to what extent shortages may
emerge in the future. With regard to tool and die makers, while there also appear to be
spot shortages and considerable difficulty in hiring experienced workers, there does not
appear to be a general shortage. However, employers have major concerns over their
7-1
270

ability to replace an aging workforce with younger workers who possess the requisite
basic skills to learn the profession.
In the two occupations where there is clear evidence of labor shortages, labor
market conditions are more directly influenced by government intervention and other
institutional barriers than in the two occupations where shortages are less clearly in
evidence. That is, for the two occupations subject to government intervention, labor
markets appear to have substantially less freedom to react to the forces of supply and
demand -- leading more generally to a disequilibrium condition where the amount of labor
workers are willing to supply is less than employers are willing to buy at the prevailing
wage. In both shortage occupations, wages paid to workers are directly limited by what
the public sector is willing and able to pay for the services produced by these occupations.
In contrast, in the two occupations where shortages are less of a problem, wages paid to
workers are determined by a large number of private sector employers that are not
constrained in what,they pay their workers.
In the case of home care workers, we-found evidence of shortages in many areas
of the country -- especially in rural areas, on the West Coast, in the Great Lakes states,
and in states with low unemployment rates. Low wage levels because of government
restrictions appear to be the most significant factor contributing to shortages. Wages paid
to home care workers, particularly those serving patients covered by Medicaid and
Medicare, are generally not much different from those paid to workers in fast food
restaurants and often are less. In addition to low prevailing wages which is probably the
dominant factor underlying shortages of home care workers -- there are a variety of other
conditions that contribute to shortages of these workers. On the demand side, the
following conditions have led to a substantial increase in the demand for home care workers:
7-2
271

a dramatic increase in the size of the elderly population (especially thoseover 75 years of age), who are the major users of home health care services;
a decline in the availability of informal home care (e.g., greater female laborparticipation rates have reduced the ability of women to care for the disabledand elderly);
adoption of cost containment policies under Medicaid and Medicare, whichhave resulted in a greater reliance on less expensive home care rather thanon institutional (i.e., inpatient hospital and nursing home) settings; and
expansion both in the eligibility for and the range of home care servicesprovided under federal and state health care programs.
At the same time, there are a host of underlying conditions that affect significantly the
ability and/or willingness of workers to become home care workers, including:
extremely unstable work environments, particularly in terms of irregularhours;
near poverty-level wages and few fringe benefits;
need for transportation, especially within rural settings; and
limited advancement potential and low job status.
Hence, shortages of home care workers, while strongly linked to low wage levels, also
result from an explosive growth in the demand for home health care services and poor
working conditions that limit willingness and ability to work within the field and result in
high rates of turnover among home care workers.
In the case of special education teachers, we found that shortages -- which vary
considerably by geographic area within the country are partially linked to inflexibility in
wages, although wages are not quite as important a factor as they are for home care
workers. Probably more important are other factors that affected the demand for these
workers and the willingness of workers to enter and remain within the field. A particular
problem within the field of special education is "burnout," which results in high levels of
turnover. We found that the demand side is substantially influenced by government
7-3

actions, particularly federal and state laws that have increasingly mandated quality
standards for special education. This has resulted in maximum class size standards fore
special education ctadses, which increase the demand for special education teachers. In
addition, increasing emphasis on early intervention with the developmentally disabled has
increased the demand for special education teachers. On the supply side, while there is a
large pool of qualified special education teachers, there is a major challenge both to
attracting and to keeping fully certified special education teachers within the field. (This is
not unlike the problem faced in recruiting and retaining nurses.) The most often cited
factor affecting the supply special education teachers is high attrition. Unlike most
teaching fields, in which exit from the profession is due primarily to retirement or family
commitments, special education seems to have a particularly high rate of "burnout" due to
the pressures and responsibilities inherent in the job. The literature on special education
teachers suggests that attrition for special education teachers is among the highest for
teaching specialties. In addition, there are a number of other factors that affect the ability
or willingness of workers either to enter or to stay within the special education field,
including:
varying state certification requirements, which discourage geographicmobility;
lengthy training periods, with many states mandating a total of five or sixyears of college study;
limited wage differentials for special education teachers compared to theirgeneral education peers, despite additional stresses and greater trainingrequirements; and
the loss of prestige that was formerly attached to teachers and teaching.
While wage levels for special education teachers are perhaps not the overriding factor (as
they are for home care workers), institutional rigidity in adjusting wages for special
7-4
273
education teachers certainly plays a role in shortages. School boards, because of limits on
local revenues, are generally reluctant to adjust wages for special education teachers, even
where shortages exist.
The existence of shortages in the two other occupations studied in this report
electrical and electronic engineers and tool and die makers are less certain. While there
are labor market conditions on both the demand and supply sides that certainly could
result in shortages -- particularly spot shortages and shortage situations in particular
localities there does not appear to be sufficient evidence to conclude that there are
widespread or acute shortages in either occupation. However, the labor market conditions
within these two occupations are still of considerable interest in studying shortages
because (a) they provide an interesting comparison to our two shortage occupations, and
(b) there are both demand and supply conditions which may result in future shortages,
particularly within the electrical and electronic engineering field.
In the case of electrical and electronic engineers, we concluded based on aggregate
data on earnings and employment and views of employers and manpower experts, that
:here is not currently a shortage. Some analysts feel that shortages are likely to emerge
relatively soon (by the mid-1990s) and last well into the next decade. The relatively long
training period for electrical and electronic engineers has led some experts to conclude that
the nation must immediately take action to head off future shortages. In comparison to
the home care and special education occupations, there appear to be relatively few
government or institutional restrictions on wages paid to electrical and electronic
engineers. Despite tha ability of employers to increase (or decrease wages) to adjust to
labor market conditions, there are concerns about the following demand-side conditions:
continued projected growth in demand for electronic and electrical products,which is expected to result in annual employment growth for electrical and
7-5
2 74
electronic engineers that is about double the average for ali U.S.occupations;
an increase in replacement demand due to increasing retirements; and
rapid emergence of new fields and specialties, together with obsolescence ofexisting skills of engineers within the field.
At the same time that demand for electrical and electronic engineers is expected to
increase substantially, there are potential constraints on the number of new engineering
graduates at all levels. Because of the changing age distribution of the U.S. population
(i.e., a decrease in the size of the age cohort entering college/university in the 1990s),
there is concern over the possibility of a substantial decrease in the number of new
engineering graduates at all degree levels. Further, some analysts argue that there is
relatively little time to react to the projected shortfall of engineers because of the long lead
time in training.
There is a considerable range of opinion, however, on whether such shortages are
likely to occur and, if so, what should be done to reduce their likelihood. Some argue that
little or nothing at all should be done; they say that market forces (especially increasing
wages rates) will provide sufficient incentives for workers to enter and stay within
electrical and electronic engineering. They also point to a reserve of workers who can be
upgraded (e.g., technicians), transferred from related professions (e.g., physicists,
mathematicians), or brought in from other countries (e.g., foreign-born electrical and
electronic engineers). Other analysts feel that the market response -- given lags in training
time for engineers and the historic patterns of low participation of the general population in
natural science and engineering is likely to be too slow and inadequate. These analysts
strongly urge adoption of strategies to attract and retain students within natural sciences
7-6
275

and engineering disciplines (e.g., immediate expansion of financial aid and changes in
curriculum).
Finally, in the case of tool and die makers, while the evidence does not appear to
support the claim by some employers that there is a severe shortage of these highly skilled
manufacturing workers, there are some supply-side conditions which could result in future
labor shortages. Unlike the three other occupations studied, there appear to be few
demand-side factors that have or are likely to result in shortages of tool and die makers.
For example, employment within this profession has been reintively flat over the past
decade and relatively slow employmerv: growth is projected through the end of the
century. Growth could even be slower than predicted if economic conditions deteriorate
or further cutbacks in defense expenditures occur. Further, there is uncertainty over the
likely effects of changes in technology (especially advances in computer numerically-
controlled (CNC) equipment) on the demand for tool and die makers.
The primary source of concern within this field is on the supply side: will there be
sufficient entry of new workers to the field to replace the large number of retiring tool and
die makers? Major concerns are the following:
an apparent bias on the part of younger workers (and their parents) against"blue collar" employment, which constrains the number of workers willing toenter the profession;
lack of knowledge about employment opportunities within the machinetrades, especially among high school administrators, counselors, andparents;
poor basic skills among the pool of youth likely to enter the machine trades;
the relatively long and costly training period for tool and die makers, whichaffects willingness to enter the field and makes it difficult for firms(especially smaller ones) to provide the types of training needed for workersto become tool and die makers; and
lack of vocational training facilities, especially within high school settings.
7-7
The key question within this occupation is whether adequate information and incentives
can be provided by employers to attract younger workers to the tool and die occupation
and-, once attracted, whether these workers have the necessary basic skills and
determination to master the various technical skills that are required. Another issue is
whether smaller employers, who have relatively few workers across whom to spread
training costs, can afford to provide recruits with the training that is needed to become
tool and die makers, when there is a possibility that they will not be able to re-coup the full
cost of the training.
Overall, the four case studies confirm the general economic theory of shortages
presented in Chapter 2. In that chapter, we presented three major explanations of labor
market shortages within a specific occupation: (1) an increase in the demand for labor, (2)
a decrease in the supply of labor, and (3) restrictions on price. We found increases in
demand or decreases in supply established conditions necessary but not sufficient for the
existence of persistent shortages within an occupation. For example, there are clear
examples in all four occupations of supply- and demand-side factors that contribute to
actual or perceived shortages of workers. However, for shortages to persist over longer
periods -- as they have in the home ca7e and special education occupations -- restrictions
on the ability to -adjust wages appear to be the major contributing factor.
B. Consequences and Responses to Shortages
At the most general level, the consequence of a labor shortage is that particular
goods or services are not provided. "I'ne impact of not providing goods or services varies
by occupation. A shortage of special education teachers, for example, directly results in
some school districts being unable to fill needed teaching positions. This, in turn, may
7-8
result in larger class size than mandated by law or in instruction of the learning disabled by
unqualified teachers. In the case of home care workers, shortages may result in denial or
delay of necessary care, reduction in the level of home care services received by clients,
and/or diminished quality of care. Shortages of electrical and electronic engineers or tool
and die makers may lead to bottlenecks in the production of goods and services, and
ultimately to loss in productive capability of U.S. industry. In turn, this may result in job
losses for other U.S. workers, loss of domestic production of goods and services, and
increases in imports.
In our four case studies, we found a variety of employer responses to shortages.
The responses adopted depend upon the conditions that brought about the shorta6e and
the extent to which the employer is affected by the shortage. Employers carefully weigh
their responses, considering both short-term and long-term costs. For example, employers
are more likely to implement strategies that involve relatively short-term commitments of
resources (e.g., intensified recruitment, use of overtime, signing bonuses) than longer-
term commitments of resources (e.g., increase in salaries and fringe benefits which affect
all employees, intensified training), in structuring responses to shortages, employers are
also concerned with both (a) the speed with which they can expect a response in the labor
market and (b) the number and quality of the new recruits likely to be generated. For
example, some tool and die firms complain that while intensification of recruitment efforts
through newspaper advertisements and the use of the Employment Service increases the
number of job applicants, relatively few applicants have the necessary basic skills to
successfully complete the long and rigorous training that is required to become a highly-
skilled tool and die maker.
7-9
278
The responses of employers to shortages in the two occupations special
education teachers and home care workers -- /here we found clear evidence of shortages
have both similarities and differences. Government regulation substantially affects labor
market conditions in both occupations particularly affecting the extent to which
employers (i.e., home care agencies and local school districts) can increase wages and
fringe benefits to attract and keep additional workers. In both occupations there is also a
major problem with "burnout," which in turn leads to high levels of attrition that further
exacerbate shortages. At the same time, there are important differences that have lead to
somewhkit different employer responses. For example, in the special education field there
is a relatively long training period (five or more years), clearly-defined certification
requirements (varying from state to state), and relatively generous fringe benefits. In
contrast, the home care field requires relatively little training, has few certification
requirements, and attracts a relatively low-skill worker who typically receives near poverty-
level wages and few fringe benefits.
The responses of employers to shortages of special education teachers, which vary
considerably by locality, include the following:
increasing use of teachers with temporary (rather than full) certification;
initiatirg more aggressive recruitment, including expanding the recruitingarea and introducing new recruitment methods (e.g., electronic bulletinboards, using "headhunting" firms, recruiting at universities and job fairs);
providing additional funds for special education training; and
providing signing bonuses and other financial incentives.
Employers within the home care field, in responding to shortages, have sought to reduce
some of the conditions that kept low-wage workers from entering or remaining within the
field. Some of the key responses include:
7-1 0
2 79
alleviating transportation problems, including providing reimbursement fortravel expenses and/or travel time;
improving scheduling, so that home care workers are better able to use theiravailable time efficiently;
providing additional training and supervision for workers;
intensifying recruitment, with emphasis on word-of-mouth recruitingpractices; and
increasing wages and fringe benefits, though concern over cost containmenton the part of Medicare, Medicaid, and third-party payors place a constrainton this response.
While we did not find evidence for (current) generalized shortages within our other
two occupations electrical and electronic engineers and tool and die makers employers
have developed a number of creative responses to localized zhortages or spot shortages
within specific occupational sub-specialties. In addition, within these two occupations,
employers, associations, and government agencies have developed a number of longer-
term strategies for dealing with what could be future generalized shortages (especially
within the electrical and electronic engineering field).
Within the electrical and electronic engineering field, analysts have focused on
strategies that are likely to attract and retain students within the natural science and
engineering pipeline. These longer-term responses to shortages, however, predominantly
focus on educational institutions e.g., rnak;ng the curriculum more interesting, providing
career counseling, increasing financial aid f or undergraduate and graiii:ate engineering
study -- than on employers. However, there are a variety of responses which are currently
being used by employers to recruit within tight local labor markets or for sub-specialties:
intensifying recruitment efforts (e.g., through use of electronic bulletinboards, increased use of head hunters, or intensified on-campus recruiting);
hiring from the ranks of non-engineers and upgrading electrical and electronictechnicians;
7-1 1
280
using retirees on a part-time or temporary basis;
substituting new equipment for labor (e.g., especially computerizedworkstations for design and simulation);
improving utilization of existing engineers;
providing enhanced educational benefits to train existing workers inemerging sub-specialties or to reduce problems of obsolescence;
contracting work out, which is facilitated by improvements intelecommunications and computer workstations; and
increasing wages and fringe benefits, particularly for workers with expertisein emerging technologic& areas.
Employers within the tool and die industry are particularly concerned with what is
perceived to be an inability to recruit younger workers with adequate basic skills.
According to employers, recruitment problems (for what is a relatively high-paying career
within the manufacturing sector) primarily stem from the poor image of manufacturing and
poor preparation of youth for blue collar careers within the United States. Many employers
have responded by establishing closer links with high schools, vocational schools, and
community colleges to: (a) encourage more emphasis on "basic skills" for non-college
bound students and improve the relevancy of vocational education, (b) promote a more
positive image (among administrators, counselors, faculty, parents, and students) of
manufacturing and the machine trades, (c) promote apprenticeship programs, and (d)
directly recruit students with the requisite basic skills. Those employers that report
current problems with recruiting tool and die makers have taken a number of additional
steps, including:
intensifying recruitment;
restructuring work and substituting the use of computerized equipment (e.g.,computer numerically-controlled [CNC] equipment) requiring fewer manualskills of workers;
7-1 2

improving working conditions;
providing company-sponsored apprenticeship programs and on-the-jobtraining; and
improving wages and fringe benefit packages.
Overall, there are a wide variety of responses that can be used by employers to
eliminate or gradually reduce the effects of labor shortages. Responses vary according to
the underlying factors that are perceived by employers to be contributing to the shortage
and the extent to which employers are affected by the shortage.
C. 'Strategies for Anticipating and Dealing with Occupational Shortages
In this section, we present our recommended strategies for anticipating and dealing
with occupational shortages. The reader should not be surprised that we have very few
global recommendations. We have found that shortages stem from a number of causes,
and the harm they cause to various sectors of the economy -- notably workers, employers,
and consumers -- varies significantly. In addition, the actions needed to eliminate
occupational shortages also must be tailored to the cause of the problem. Use of an
inappropriate strategy may create other problems in the economy that are worse than the
presence of the shortage. For example, increasing immigration to alleviate a temporary
shortage may lead to labor surpluses later.
We first discuss strategies that may help to anticipate shortages or recognize them.
We then suggest approaches that may be appropriate to eliminate shortages once they are
present.
7-1 3
282

1. Anticipating and Recognizing Shortages
In this section we provide our conclusions and recommendations regarding
projecting occupational shortages before they occur and recognizing them when they
occur. To the extent that shortages can be anticipated, it might be possible to take
preventive actions. Recognizing shortages quickly can also be important, as corrective
actions can be taken before the shortages become severe.
a. Anticipating Shortages
Ideally, we would like to be able to develop accurate economic forecasts that
enable us to predict which labor markets are likely to have shortages. To do so requires
that we be able to project the number of workers that employers want to employ in the
future at various wage rates (the labor demand curve) and the number of workers available
for each occupation at various wages (the labor supply curve). Alternatively, if we could
project the wage rate, we would only need to project the corresponding supply and
demand numbers at that wage rather than the entire supply and demand curves. In
addition, we would like to be able to identify the factors that would prevent the market
from reaching equilibrium reasonably quickly.
Economy-wide occupational projections, such as those produced by the Bureau of
Labor Statistics (BLS) and several private firms, are generally not designed to project
occupational shortages. For example, BLS develops occupational projections based on
aggregate macroeconomic projections and projections of the industrial mix of the
economy. However, the occupational projections developed by BLS are projections of
employment and are based on the assumption that there will be sufficient workers
available in each occupation to meet demand. Because the BLS occupational projections
do not include projections of occupational supply, the BLS occupational projections alone
7-1 4
283
cannot be used to determine if shortages are likely to develop in particular occupations.
Moreover, the BLS projections provide only point estimates of employment, not an entire
demand schedule. In addition, it is quite difficult to develop accurate projections of
occupational employment, and BLS has sometimes been criticized for failing to project the
occupational composition of the labor force accurately.'
Projecting changes in supply to various occupations is also difficult. As we would
expect, occupations with tight labor markets tend to increase wages and attract more
individuals into the occupation. Shortages will only develop if the wages adjust too slowly
or there are barriers to entry. Some of the supply-side factors can be readily identified, but,
others are more difficult to predict. For example, we can often judge the supply of
entrants to occupations requiring specialized college degrees or long apprenticeship periods
several years in advance by admissions to appropriate training and educational programs.
On the other hand, some factors affecting supply are more difficult to predict.
Examples include limitations on wages imposed by government, as we saw for home
health workers, or by institutional constraints, as was observed for special education
teachers. It is very difficult to predict the extent to which such barriers will be maintained
over a period of years.
An alternative to projecting the occupational supply and demand schedules is to
project the changes in the number of worker's that will be demanded and available in the
future. Assuming an occupation is currently in equilibrium, the number of additional
workers needed to be hired for the occupation consists of net employment growth plus
'For example, Bishop and Carter concluded that in its last round of projections BLSsignificantly overprojected growth of low-skill jobs and underprojected gi owth of jobs requiringa college diploma. See John H. Bishop and Shani Carter (1990). "The Deskilling vs.Upskilling Debate: The Role of BLS Projections." Ithaca, NY: Center for Advanced HumanResource Studies Working Paper 90-14.
7-15
284
replacement demand generated by occupational mobility, deaths, labor force withdrawal,
and retirements. This figure could then be compared to the number of new entrants to the
occupation plus re-entrants. Cohen's analysis of shortages makes use of such measures,
but he does not project specific shortages; instead he uses various data series to serve as
indicators of possible shortages.'
Our conclusion is that we cannot project occupational supply and demand well
enough to anticipate shortages adequately. Cohen's work points to how labor market
projections and data can be used to identify occupations that are prone to shortages in the
future. Although analyses such as those performed by Cohen can at best point to likely
candidates for shortages, such information can be very useful. For example, occupations
that are good candidates for shortages are likely to experience wage increases as the labor
market tightens. Projections of tighter labor -markets will therefore encourage entry into
the ocCupations. Thus, we recommend that further research on "leading indicators" of
shortages be supported. However, given economists' current lack of ability to develop
reasonably accurate projections, we recognize that projections should be treated as general
indicators rather than precise forecasts.
b. Recognizing Shortages
It is not a simple matter to determine if an occupation is experiencing a shortage.
By the definition used in this study, an occupation has a shortage if the number of workers
employed falls short of the number of workers employers would like to hire at the
prevailing wage. The key information required to assess whether an occupation is
'See Malcolm S. Cohen (1990). Studv on the Feasibility of Using Labor MarketInformation for Alien Certification Determination. Ann Arbor, Michigan: Institute of Labor andIndustrial Relations, University of Michigan.
285
experiencing a shortage is therefore vacancy data. Although BLS formerly collected
vacancy data, the program was discontinued several years ago for budgetary reasons.
In the absence of general vacancy data, we can directly assess if an occupation has
a shortage only when special occupation-specific data are available. One of the
occupations in our study, special education teachers, has vacancy data available because
states are required to report vacancies to Congress annually. Although schools have an
incentive to under-report such vacancies to the states (so they will not be considered out
of compliance with requirements to provide qualified special education teachers to
students in need), the data indicate that approximately nine percent of the special
education positions in the nation are vacant or occupied by staff without the required
qualifications.
In the home care field, national data on shortages are not available, but in our
interviews we were able to ascertain the presence of vacancies by asking employers if
they were unable to provide home care services for which they would have been paid
because of a lack of workers. The fact that many of the employers indicated they could
not provide all the home care for which they would have been paid is strongly indicative of
a shortage.
For tool and die makers and electrical and electronic engineers, however, we were
unable to obtain meaningful vacancy data. Although some of the employers interviewed
complained of difficulty in filling positions, they could not provide evidence of vacancies
beyond those caused by normal turnover in the occupation. The lack of vacancy data no
doubt contributes to the strongly differing opinions that were voiced concerning whether
or not shortages exist in these occupations.
7-1 7
286

Because vacancies are the most important data for determining if shortages are
present, the lack of these data makes it very difficult to determine which occupations have
shortages. As we noted in our case studies, different parties often have incentives to
argue for or against the presence of shortages. If occupational vacancy data were
available, assessments of shortages could be cqnducted more simply and more objectively.
We therefore recommend that consideration be given to reestablishing BLS data on
occupational vacancies. If a complete occupational vacancy series is not feasible, perhaps
BLS and ETA could- strongly urge employers to list vacancies for occupations of special
interest (e.g., engineering specialties) with the state employment security agencies, and
the results for these occupations could then be compiled at the national level.
2. Potential Actions to Reduce Occupational Shortages
Although we have identified a number of potential causes of occupational
shortages, they all may be classified as either market failures or eovernment or institutional
barriers. Perhaps because the nation was in a recession while our research was conducted
and because we conducted only four case studies, we did not observe shortages that
resulted from market failure. Thus, our conclusions and recommendations regarding
shortages resulting from market failures are not based on our case studies.
Both special education teachers and home care workers had moderate to severe
labor shoiages. The shortage of home care workers clearly results from government
barriers that prevent the market from clearing: the job requires few skills, training is very
short, and there is no general shortage of low-skill workers. The reason for the shortage
of home care workers is that wages for the occupation are primarily determined by state
7-1 8
287

and federal reimbursement policies. Because wages are not free to adjust upward to meet
the wages of other low-skill jobs, a shortage results.3
The shortage of special education teachers results from a combination of
government interventions and institutional constraints. The government intervention in the
market takes the form of requirements by the states that the educational needs of
exceptional children be met by teachers with particular qualifications. This requirement
alone would generally not result in a shortage because in a competitive market such
teachers would presumably command a premium salary or receive special working
conditions to deal with the extra stress associated with the job. Institutional constraints,
however, generally result in uniform salary scales for all teachers in an institution. This
makes special education relatively less attractive, and many special education teachers
leave the field.
The shortages induced by government actions are not caused by government
ineptitude. Rather, they often result from government efforts to meet other goals. Most
home care workers are supported by Medicare funds, and the federal government has
deliberately sought to contain costs of health care by restricting price increases. Thus, the
goal of cost containment conflicts with the goal of attracting sufficient workers to the
home care field. If reimbursement is not regulated sufficiently, costs may rise by
unacceptable amounts, but if wages are kept too low, a shortage results and some
individuals entitled to home care are denied their services.
Likewise, the federal requirements for special education teachers are intended to
ensure that children with special needs are taught by highly qualified teachers. In the
3As documented in the case study, low wages are not the only cause of the shortage.However, government restrictions on reimbursement are the primary cause of the shortage.
7-1 9
288

absence of such requirements, some states and local districts might deny these children a
satisfactory education. The resistance to paying special education teachers premiums to
compensate them for their extra training and more Jifficult working conditions results from
equity concerns of teacher unions and others in the educ-tion system.
It is not surprising that occupationt where government intervenes by restricting
wages (e.g., home care) or mandating certain levels of employment (e.g., special
education teachers) sometimes experience shortages. Situations where normal market
forces are not free to operate can and often do lead to shortages. Government regulators
need to be aware of the potential problems and consider the consequences of the
shortages relative to what would occur if actions are taken to alleviate the shortages.
In the case of home care, the shortage results primarily in rationing of services,
resulting in newly eligible patients experiencing some delays in obtaining services and
some patients receiving fewer hours than prescribed. All the employers and researchers
we spoke with found the current method of dealing with the shortage to be unacceptable.
Alternatives that have been considered include reducing the demand for home care by
instituting stricter eligibility requirements, using home care workers more efficiently (e.g.,
establishing shared aide programs), and increasing wages and fringe benefits. New York
State eliminated its shortage of home care workers by using aides more efficiently and
increasing wages and benefits. However, if funding had been the primary concern, the
shortage could have been eliminated by restricting patient eligibility for home care. In
special education, the shortages do not result primarily from budgetary concerns. The net
!esult, however, is that exceptional students do not receive instruction from fully qualified
special ethication teachers.
7-20
289
Sectors of the economy with significant regulation of prices or labor market entry
(through licensing or certification requirements) are, by definition, most likely to experience
shortages caused by government regulation. Because of the high degree of regulation, the
health care industry is especially prone to experiencing shortages because of government
actions. It is therefore not surprising that about half of the top shortage occupations
ranked by Cohen are in the health field.
To minimize problems with shortages resulting from government regulations, we
recommend the following actions:
Gover,-;,-nents that directly or indirectly regulate wages in an occupationshould monitor the services provided to assure that shortages are not leadingto unmet needs (e.g., waking lists for needed services).
In periods of rapidly rising wages, governments should make sure thatadjustments to wages are made frequently enough to keep themcompetitive.
If wage increases are considered undesirable because of the costimplications, government regulators should consider actions to assure thatservices are provided equitably. For example, programs can be reduced inscope to reduce demand for the occupations experiencing shortages.
Although the unregulated occupations covered by our case studies are not currently
experiencing shortages, the literature indicates that fields such as engineering have
experienced shortages in the past. Shortages are most likely to occur in occupations with
long training periods and long reaction and response lags by firms, students, and workers.
We have already noted that the lack of vacancy data makes it difficult to ascertain when a
shortage exists and recommended reinstituting some fon.... of vacancy statistics.
We discussed the actions employers are likely to take to eliminate shortages in
Chapter 2. For the most part, employers are aware of the actions they can take to
eliminate shortages, and they will generally take these actions if they believe it is in their
best interests. To briefly summarize, employers will generally take actions such as
7-21
290
increase recruiting efforts, increase the use of ovortime, reduce the minimum qualifications
for the job, restructure the work to use current or new workers in other occupations,
substitute machinery and equipment for labor, train workers for the jobs with shortages,
improva working conditions, offer hiring bonuses to new workers, improve wages and,
fringe benefits, contract out work, or turn down work.
In many instances snortages will be self correcting. As we explain in Chapter 2,
employers have incentives to raise wages, improve recruiting, and take other actions to
eliminate the shortage. Thus, before taking strong action, government policymakers
should review projections of occupational supply and demand to determine if the shortage
is likely to be corrected by normal functioning of the labor market.
Federal and state governments can assist employers and workers to adjust to
shortages by publicizing occupations where shortages exist or are likely. BLS publications
such as the Occupational Outlook Handbook and Occupational Outlook Quarterly can be
valuable tools to employers, workerm and students. In addition, state employment
services, the National Occupational Information Coordinating Committee (NOICC), and
NOICC's state counterparts -- the State Occupational Information Coordinating
Committees (SOICCs) provide occupational data and projections for workers, firms, and
students. Although it is extremely difficult to evaluate the effectiveness of these
institutions, an evaluation might reveal ways in which these organizations could be
improved. The Department of Labor should consider evaluating the effectiveness of its
occupational information progrc ra:! with the goal of identifying any shortcomings and
improving the flow of information to workers, students, r nd employers.
Another potential bottleneck to alleviating shortages is a lack of appropriate training
and educational programs. In some instances employers can train workers themselves,
7-22
291
but in many occupations employers are dependent on schools and independent training
programs. if a shortage is likely to persist, and one of the problems is a lack of adequate
education and training programs, government can help eliminate the shortage by increasing
support for these programs. The Employment and Training Administration has recently
taken steps to upgrade the apprentioeship system in the United States, and this may help
avoid shortages in some skilled occupations. On a selective basis, the government can
also support growth in.institutions of higher education to increase the capacity to train
professionals in selected fields.
Finally, permitting additiorK.I immigration for individuals in shortage occupations can
provide additional workers relatively quickly. Immigration policies are often controversial,
however, because increasing the supply when there is not a shortage can reduce the
earnings of workers currently in the occupation. Even if there is a shortage, it may only be
temporary, and workers may find their wages reduced in the future. Liberalizing
immigration policies can be used to eliminate shortages, but care should be taken to
ascertain that a shortage exists and that it is expected to persist.
As we noted at the beginning of this study, labor markets are highly dynamic. To
some extent, labor shortages are inevitable as labor demand by employers changes and
labor supply of workers adjusts. In most irstances the natural working of the market will
eliminate the shortage, but in some cases government actions can help reduce the time
required or remove barriers to the process.
7-23
292

APPENDIX A: /TECHN:CAL NOTE ON DATA SOURCES
/
293
TECHNICAL NOTE ON DATA SOURCES
Current Population Survey (CPS)
The Current Population Survey data used in this report on occupational
employment, occupational unemployment rates, and earnings by occupation represent for
a number of occupations very small samples. Consequently, the data are subject to
considerable year-to-year sample variation.
Interviews of Individuals Knowledgeable About Selected Occupations
The interviews conducted as part of this study were not based on random samples,
but instead were conducted with individuals willing to discuss the labor market situation
for the occupations of interest. For all four occupations we interviewed representatives of
employers and trade associations. Where relevant, we also interviewed government
officials, researchers, educators, and representatives of unions. :.,ome of those
interviewed requested anonymity, so we have not included the names of any interviewees
within this report.
A-1
294

APPENDIX B:
DISCUSSION GUIDE FOR FIRMSEMPLOYING TOOL AND DIE WORKERS
s-
295

Firm:Interviewee:
Position:Interviewer:
Date:
DISCUSSION GUIDE FOR FIRMSEMPLOYING TOOL AND DIE WORKERS
Introduction: My name is and I'm with James Bell Associates. (Ifpossible, say who suggested that you call.) We are conducting a study oftrends within the tool and die occupation and other occupations for the U.S.Department of Labor. I would like to ask you a few questions about yourfirm's experience with recruiting tool and die workers. It will take about 30to 45 minutes; is this a good time? (If not, when can I call you back or isthere another person within your firm that I can talk to?)
A. Employment Trends and Structure of Firm
1. How do you define the occupation "tool and die maker?"
2. What tasks does a tool and die maker perform within your firm? Have those taskschanged over the past five years?
3. Have duties of the tool and die maker changed over the past five years? If yes...
a. How?
work has become more complexwork has become more specializedwork requires more precisionnew products and techniques have been introduced
b. Have former duties of tool and die makers been taken over by other workersor machines during the past five years?
4. How many journeymen tool and die makers does your firm currently employ?
5. How does this number compare with the number employed 5 years ago? 10 yearsago?
B-1
296

6. What are the reasons for the increase or decrease in the number employed?
7. How have the demographic characteristics of workers/new entrants changed overthe past five years (e.g., age, sex, race, education, and training)?
8. Is retention of tool and die workers a major problem within your firm? If yes...
**
a. Why do workers leave?
1. Higher pay within the tool and die occupation2. Higher pay in other occupation3. Retired4. Laid off, lack of work5. Laid off, poor performance
b. How many tool and die workers have left your firm over the past five years?
Preface to sections B and C: The next two sets of questions probe into theextent of laboishortages. The first is related to the industry in generalwhereas the second is aimed specifically at your firm's experience.
B. Extent of Shortages - General Trends Within the Industry
1. To what industry does your firm belong?
2. How do you define a "shortage?"
3. What do you feel are the major signs that shortages exist?
Possible signs:-increases in wages-decreases in entry requirements-intensified recruiting-signing bonuses-decreased size of the entry pool
B-2

4. Do you feel there is a current shortage of tool and die workers to fill vacancieswithin your industry as a whole? If yes...
a. How serious is this shortage?
b. Do you think these shortages are local or national?
C. Do you expect that these industry-wide shortages will continue into thefuture? For how long? Why?
d. Were there historic shortages of tool and die workers in your industry?
C. Extent of Shortages - Specific Experience of the Firm
1. Is your firm experiencing a current shortage of tool and die workers to fillvacancies? If yes...
a. How serious is this shortage for your firm?
b. How does the shortage affect your firm?
c. Do you expect that your firm will continue to be affected by shortages oftool and die workers into the future? For how long? Why?
d. Are these shortages more severe for tool and die workers than for othertypes of workers that you employ?
2. Do you currently have any unfilled openings for tooi and die makers? If yes...
a. How many current openings?
b. How long have these vacancies remained open?
c. Is this amount of time typical?
3. Looking back over the past five years, has your firm experienced shortages of tooland die workers to fill vacancies? If yes...
a. When?
b. Have these shortages been intermittent or continuous?
c. Have the shortages gotten worse or better in recent years?
8-3
228

4. During the past five years, have shortages of tool and die makers:
a. Resulted in your firm turning down business?
b. Caused your firm to delay filling orders?
c. Affected your ability to compete with other firms? How?
5. During the past five years, have you laid off any tool and die makers? If yes...
a. Why (e.g., lack of business; changing technology has reduced the need)?
b. Were you able to rehire these same workers later?
D. Factors that Explain Shortages, Consequences, and Reactions to Shortages
1. What do you feel are the major causes of shortages of tool and die workers?
Possible reasons:
-cyclical trends in demand for goods-shrinking labor force-long training/apprenticeship period-bias against blue collar professions-aging workforce-loss of tool and die workers to other occupations-pricing of goods (e.g., competition with foreign imports)
2. Do you expect these same conditions to continue over the next five years?
3. When you experience a shortage of tool and die workers, how does your firmreact? Possible reactions:
-raise wages-improve fringe benefits-increase overtime work-substitute with lower level workers-substitute with higher level workers-substitute with capital equipment/new technology-contract work out-stop seeking additional work-stop taking orders for additional work-intensify recruiting efforts-lower minimum requirements-offer signing bonuses
B-4

4. What are the consequences of shortages of tool and die workers for your firm?
Fossible consequences:
-substitution of other types of labor-substitution of capital for labor-unmet product demand
5. Do shortages of tool and die workers result in a substitution of foreign products fordomestic products?
E. Training and Recruitment of Workers to the Occupation
1 . Have your hiring requirements changed over the past five years?
NoYes, loweredYes, raised
a. If yes, how?
b. Was this change in response to a shortage?
2. Do you think hiring requirements for your firm are likely to change over the nextfive or ten years?
3. How does your firm currently recruit tool and die workers?
Possible methods:
-newspaper advertisements-radio advertisements-school recruiting-job fairs-public/private employment agencies-walk-ins-word-of-mouth

4. Have these recruitment techniques changed over the past five years? If yes....
a. How?
b. What are the reasons for these changes?
5. What are the skills necessary for entry into the tool and die profession? How doworkers obtain these skills?
6. What methods are used by workers to seek and gain employment within the tooland die profession? Are there any licensing or certification requirements?
7. What types of barriers do workers face in obtaining employment?
8. Does your firm currently have an apprenticeship program to train tool and diemakers? If yes, interviewer may wish to discuss its role and effectiveness.
9. Do you hire people who are not tool and die makers and train them? If yes...
a. Is this a useful approach to deal with shortages?
b. Explain.
F. Additional Questions
1. How have wages paid to tool and die workers in your area changc :-.! uver the pastfive years? Has your firm adjusted wages because of shortages of qualified tooland die workers?
Has the structure of your fringe benefits for tool and die workers changed in recentyears? If yes...
a. How?
b. Why?
B-6

3. What can be done to alleviate labor shortages in the future? Have there beenpublic/private policies that have worked in the past? What can the followingentities do to alleviate shortages:
federal/state/local governmentemployerstrade unionsapprenticeship/trade schoolsworkers within the machine trades
G. Company Data
1 . Number of Employees
2. Year of Incorporation
3. General DescriptiOn of the Business
B-7
* U.S. GOVERNMENT PRINTING OFFICE: 1993 342-561/94372302

'Departrnpnt cof F lt)Or(,rhyrilero
at,
THIRD CLASS MA'lrino, f ; I
tl Dc,p.irtrT)prt'4. (
lEST COPY MUM*2) 3


