
Does Unionization Increase Faculty Retention?
DANIEL I. REES”
Although there has been a large amount of research on the union- nonunion salary differential in higher education, little empirical work has been done on the possible nonsalary effects of faculty unions. This paper, using data from the AAUP and other sources, investigates unionization’s impact on faculty retention rates. It is found that, holding salary, benefits, and other factors constant, unions increase a school’s faculty retention rate for associate and full professors (although not for assistant profes- sors). The impact of unionization, however, is not felt until a number of years after a representation election.
A LARGE NUMBER OF studies have attempted to estimate the union-nonunion salary differential for university and college professors. Very little empirical work, however, has been done on the nonsalary ef- fects of faculty unions. This paper will investigate unionization’s impact on the retention of professors. The analysis will be at the level of the college or university, and will depend heavily, but not exclusively, on data from the AAUP (American Association of University Professors).
Studies using nationally representative samples of workers have shown that union workers are less likely to quit their jobs than are nonunion workers, even when wages and other factors are held c0nstant.l This is an important result in that it suggests that it is possible for unionization to have a net positive effect on productivity. The research in this area by
* Department of Economics, University of Colorado at Denver. The author wishes to thank Ronald Ehrenberg, Albert Rees, and the labor economics workshop participants at Cornell University for comments on earlier versions. Correspondence should be sent to the author at University of Colorado at Denver, Economics Department, Campus Box 181, P.O. Box 173364, Denver, CO 80217-3364. Access to the data used in this paper is limited because some school’s data submissions to the AAUP are confidential.
See, for example, Freeman (1980) or Freeman and Medoff (1984).
INDUSTRIAL RELATIONS, Vol. 33, No. 3 (July 1994). 0 1994 Regents of the University of California Published by Blackwell Publishers, 238 Main Street, Cambridge, MA 02142, USA, and 108 Cowley
Road, Oxford, OX4 IJF, UK.
297

298 / DANIEL I. REES
TABLE 1 NUMBER AND PERCENT OF FACULTY REPRESENTED BY A BARGAINING
AGENT ACCORDING TO INSTITUTION TYPE: 1987-88”
Institution Type
Two-year Four-year
Total Number of Faculty Number of Faculty Represented by a Bargaining
Agent in the Public Sector Number of Faculty Represented by a Bargaining
Agent in the Private Sector Percent of Faculty Represented by a Bargaining
Agent in Public and Private Sectors Combined
21 4,000 80,106
82 1
38
509,000 123,638
9.108
26
SOURCES: Douglas (1988); American Council on Education (1990). a Figures are for full- and part-time faculty, including instructors and lecturers. Some schools include librarians and
other professional support staff when reporting the number of faculty represented by a bargaining agent.
Freeman and Medoff (1984) is perhaps the best known. These authors argued that the effect of unions on quits comes about through unions acting as conductors of worker “voice,” a term they borrowed from Hirschman (1970). If unionization is found to increase a school’s faculty retention rate (holding salary and benefits constant), this would suggest that faculty unions can provide their members with a voice alternative to quitting much in the same way that more traditional unions provide a voice alternative to their members.
Two basic models will be used in the paper: a cross-section model, which will be estimated for the academic year 1987-88; and a fixed-effects model, which will be estimated using data from the years 1970-71 through 1987-88. In addition to measuring the average effect of faculty unions on retention rates, I will explore how this effect varies with the length of time an institution has been organized. Also, issues such as whether the effect depends upon institution type or faculty rank will be explored.
Background In the 1987-88 academic year, approximately 26 percent of faculty at four-
year colleges and universities were represented by a union (Table 1). At two- year institutions, the corresponding figure was even higher-38 percent .2
These union densities should be viewed as rough approximations. The total numbers of faculty in two- and four-year schools are reported to the nearest thousandth. Also, some schools include librari- ans and other professional support staff when reporting the number of faculty represented by a bargaining agent. (See Table 1 for sources.)

Does Unionization Increase Faculty Retention? I 299
Clearly, organizations such as the AAUP, NEA, and AFT have had some success in organizing professor^.^
However, it could be argued that unionization has not had a large impact on the employment conditions of faculty members. A number of studies have concluded that the union-nonunion salary differential in higher educa- tion is small or even n e g a t i ~ e . ~ Why, then, do such a large proportion of professors continue to support unionization? What is it that the unions are doing if not raising their members’ salaries?
In the 1960s the higher education sector grew tremendo~sly.~ With this growth came an increase in bureaucratization, and, according to authors such as Garbarino and Johnstone, a feeling on the part of professors that they were being forced out of the decision-making process. These authors suggested that unionization was, at least in part, an attempt by faculty members to regain some control over their work environment (Garbarino, 1975, pp. 10-11; Johnstone, 1981, p. 8).
This is, of course, a difficult hypothesis to test formally. It fits in nicely, however, with Freeman (1976) and with Freeman and Medoff’s (1984) exit-voice model of unionism. According to Freeman and Medoff, unions can enhance communication between workers and management, and pro- vide workers with protection from arbitrary or unfair management deci- sions. As a result, unions can reduce quits. It is important to note that this “voice effect” on quits comes with little or no economic cost to manage- ment or society, and is separate from the effect that one would expect due to higher wages and benefits.
In his 1980 article, Freeman showed that the typical union worker in the United States was less likely to leave a job than was the typical nonunion worker. He attributed this result to a voice effect, since wages and other factors were controlled for in the analysis. The question this paper will attempt to address is whether Freeman’s result can be duplicated when university and college professors are examined separately. Or, in other words, it will ask, Do faculty unions have a voice effect on quits?6
The bulk of organized schools in the United States are affiliated with at least one of these three organizations. For instance, of the 476 contracts listed in Douglas (1989), 418 cited either the AAUP, the AFT, or the NEA as a bargaining agent.
See Bacharach, Schmidle and Bauer (1987) for a review of the literature on the union-nonunion salary differential. Also see Barbezat (1989), Kesselring (1991), and Rees (1993).
In 1960,3.8 million students were enrolled in institutions of higher learning. By 1970 this figure had jumped to 8.6 million (American Council on Education, 1990, p. 68).
6The presence of a union voice effect on quits does not necessarily translate into increased productiv- ity. If new hires are typically made at the assistant professor level, then the answer in part depends on the relationship between faculty productivity and general experience or age. (Rees and Smith [1991, pp. 53-78] review the literature in this area and argue that age effects on teaching quality are quite

300 / DANIEL I. REES
One reason to expect there to be a voice effect is that most faculty union contracts include a grievance procedure provision. In a sample of 89 con- tracts from four-year schools Johnstone (1981, p. 25) found that only 2 did not contain a section outlining a grievance p r ~ c e d u r e . ~ Grievance proce- dures, according to Freeman and Medoff, are an important factor distin- guishing the union from the nonunion sector.* They allow workers to appeal management decisions with which they disagree, and give workers a sense that they were treated justly even if a management decision is upheld. Of course, not all grievance procedures are alike, and these differ- ences will result in different effects on quits (Rees, 1991). However, at least in four-year schools, most academic grievance procedures seem to be fairly strong. For instance, 84 percent of the grievance procedures in John- stone’s survey ended in binding arbitration (Johnstone, 1981, p. 29).
Despite the presence of grievance procedures in faculty collective bar- gaining contracts, it is possible that university and college professors pres- ent special problems for the exit-voice model of unionism. Professionals, even when not represented by a union, generally enjoy a fair amount of influence over their immediate workplace environment. Also, formal mechanisms for representation such as faculty senates give professors at some schools an especially important role in determining how their institu- tion is run. This suggests that there may be little room for faculty unions to enhance employee voice.
However, it may be that those faculty who choose to organize are pre- cisely those who want to increase their influence, perhaps because they felt shut out in the past. The fact that two-year schools make up the bulk of organized institutions seems to support this view.g These are among the institutions that have traditionally restricted faculty input in decision mak- ing the most (Keller, 1983, p. 37).
It is interesting to note that the exit-voice model of unionism is silent with regard to the timing of unionization’s effect on quits. Do quits immedi-
small. Research output, however, clearly declines with age.) Other factors that need to be considered are hiring costs and the existence of institution-specific human capital.
One of these two schools had a “hearing procedure” that seemed to function as a grievance procedure (Johnstone, 1981, p. 25) .
Freeman and Medoff (1984, pp. 107-109) noted the presence of grievance procedures outside the union sector, but argued that these procedures do not work well. Schools without collective bargaining agreements frequently have some type of grievance procedure in place. Typically, however, these procedures end with a nonbinding recommendation to the administration, and provisions for arbitra- tion seem to be extremely rare (Estey, 1986, p. 13). Begin (1978) gives a detailed account of the grievance process at Rutgers University before and after unionization.
In the 1988-89 academic year, a total of 1027 schools were organized. Of these schools, 606 were two-year institutions (Douglas, 1989, p. 110).

Does Unionization Increase Faculty Retention? I 301
ately decrease when an establishment’s employees elect a union to repre- sent them, or does it take time for the union to become an effective conduit for worker voice? At what point in time after the election is the union most effective at representing its members’ concerns? Might there even be an immediate increase in turnover after an election due to employ- ees who were unhappy with the outcome of the vote leaving? The essay will explore these questions in addition to estimating the average impact faculty unions have on quits.
Distinguishing between Quits and Other Exits
In order to test Freeman and Medoff’s exit-voice model of unionism, ideally one would like to have individual-level data that allow the re- searcher to precisely identify employee quits. Unfortunately, no such data are available for professors from a set of schools that include unionized institutions. Instead, what is used are school-level data for full-time profes- sors in which a school’s faculty retention rate will serve as a measure of the level of quits.
An institutions’s faculty retention rate for a particular rank in year t will be defined as follows: the number of full-time faculty in the rank who were employed by the institution in year t and remained employed at that same institution in year t + 1, divided by the total number of full-time faculty in the rank employed at the institution in year t. Faculty who did not change institutions but who advanced in rank from one year to the next are counted as continuing and so are part of the numerator. Also, faculty on leave with pay are included in both the numerator and denominator.
Obviously, when quits increase the retention rate will fall, holding all else equal. But other types of exit behavior, such as terminations, retire- ments, and deaths, will also influence the faculty retention rate of a school. If unionization is found to affect faculty retention rates, can one be certain that it is through quits and not one of these other factors?
One way to address this question is to focus the analysis on associate professors. The advantage of this approach is that a large proportion of associate professors have tenure, and so their retention rate in a given school can be thought of as a reflection of voluntary decisions to leave.I0 (A voluntary decision to leave is presumably based on a comparison of
lo According to data from the AAUP’s Annual Survey of Compensation, 80 percent of associate professors were tenured in the 1987-88 academic year. The corresponding figures for full and assistant professors were 94 and 21 percent, respectively.
See Rosovsky (1990, p. 178) for a brief discussion of the circumstances under which a tenured faculty member can be dismissed.

302 / DANIEL I . REES
utility in the current job with expected utility from the best alternative option.) Of course, full professors also generally have tenured status, but their retention rate will vary more strongly according to factors that affect the retirement decision.
It may be interesting to briefly examine the effect of unionization on the retention rates of ranks other than that of associate professor. There is at least anecdotal evidence that unionization tends to make it easier for assistant professors to attain tenure. Most union contracts allow faculty to grieve tenure decisions, and stories of overturned denials of tenure are common (see Lindenberg, 1986, p. 23, for an example of such a story). According to this argument, one would expect unionization to have a positive effect on the retention rate of assistant professors.
One might also expect full professors to have higher retention rates in organized institutions; unions, acting in their voice capacity, could discour- age quits and early retirements. However, it may be that unions actually encourage early retirements through their impact on retirement benefits and procedures. This potential effect of unions will be partially controlled for in the analysis by using a measure of the average total benefits paid by the institution.
The Data Each year the AAUP sends colleges and universities across the country
its Annual Survey of Faculty Compensation. In this survey, institutions are asked to report the number of full-time faculty employed by rank, and the number of full-time faculty currently employed who also worked at the institution in the previous year by rank. These questions allow for the calculation of a school’s faculty retention rate for a given rank and year.
The number of schools surveyed by the AAUP has varied over the years; and, in general, a little less than half the responding schools provide the necessary information in order to calculate faculty retention rates. Schools for which a faculty retention rate cannot be calculated are ex- cluded from the analysis, as are schools for which information on other variables is missing. In most years, between six hundred and nine hundred schools are included in the sample.
Information on when a school’s faculty elected a bargaining agent comes from the Directory of Faculty Contracts and Bargaining Agents in Institu- tions of Higher Education (Douglas, 1990). The sample’s organized schools tended to have, on average, slightly higher retention rates than did the unorganized schools. This seems to be true across all three ranks. Whether it is due to factors such as higher salaries and benefits or to a voice effect is,

Does Unionization Increase Faculty Retention? I 303
of course, an open question at this point in the analysis. Other variables used in the paper are gathered from various sources, which are detailed in appendix A.
The Cross-Section Model The cross-section model used here is similar to the one presented in
Ehrenberg, Kasper, and Rees (1991). The dependent variable is a school’s faculty retention rate for a particular rank. It is written as a linear function of a constant, a vector of explanatory variables X,, and an error term:
r, = a + X,p + E,, (1) where the subscript s stands for school. Equation (1) is estimated sepa- rately for assistant, associate, and full professors using OLS.11
The main independent variable of interest is a union dummy, equal to 1 for schools whose faculty voted to be represented by a bargaining agent, and 0 for all other schools.12 If factors such as salary, benefits, and working conditions are controlled for, then a positive estimated coefficient for this variable could be interpreted as evidence of a voice effect on quits. In some estimations, the number of years a school has been organized and its square are used as explanatory variables in order to explore how the voice effect changes over time.
Two other variables in the X, vector are Salary and Benefits. The vari- able Salary is equal to the mean salary for all full-time faculty in school s and the relevant rank. It is measured in 1987-88 dollars in all estimations. As one would expect, past studies of faculty turnover have found that better paid faculty are less likely to leave their jobs.13
Benefits is equal to the mean dollar cost of an institution’s benefit pack- age for full-time faculty in the relevant rank.14 Again, it is measured in 1987-88 dollars. Because there is evidence that unionized schools have
l1 Simply using OLS to estimate equation (1) ignores the fact that, because the dependent variable is limited to the 0-1 range, the error term cannot be distributed normally. In order to correct for this problem a log-odds transformation of the dependent variable was used in re-estimating equation (1). The results were consistent with those reported.
l2 Therefore, if a school and its faculty have not agreed to a contract, the school is nevertheless counted as unionized.
l3 Ehrenberg, Kasper, and Rees (1991) find that total compensation and retention rates are posi- tively related for assistant and associate professors, but not for full professors. Weiler’s (1985) results indicate that the probability of a professor quitting increases with the gap between current and expected salary.
l4 Institutions were asked to assess the cost of their contributions to retirement and insurance plans, tuition waivers and payments, social security taxes, unemployment taxes, workers’ compensation taxes, and benefits in kind with cash alternatives.

304 / DANIEL I. REES
higher levels of employee benefits than do comparable nonunion schools (Freeman, 1978, pp. 19-20), it is important to use a good benefits measure as a control when estimating the union voice effect on quits. A problem with Freeman’s (1980) work was that he did not have adequate informa- tion on nonwage compensation, and so his estimate of the union voice effect may have been inflated.
The variable Faculty Size is equal to the total number of full-time faculty in the institution and is meant as a measure of an institution’s size. It is not clear what effect the size of a school should have on faculty retention. Although large schools can become bureaucratic and impersonal, they typically offer resources and opportunities that cannot be duplicated in a smaller setting.
A measure of the faculty-student ratio is also included in the vector X,. Because it is unclear how one should count part-time students and faculty when constructing such a measure, the estimations were run using a num- ber of different formulations. In the reported estimations part-time stu- dents and faculty were counted as one-half their full-time equivalents. Graduate students were given the same weight as that of undergraduates. Other formulations of the variable did not change the reported results appreciably. Its presence on the right-hand side of equation (1) is meant to control for differences in average faculty work loads across schools.
The remaining variables included in the vector X, are as follows: the fraction of full-time faculty members holding doctorate degrees, included as a measure of faculty quality; four regional dummies; the percent of full- time faculty in the rank who are women; the percent of full-time faculty in the rank who are tenured; admission selectivity dummies based upon the rankings in Barron’s Profiles of American Colleges (Epstein et al., 1984); whether the school is private, public, or church affiliated; and institutional- type dummies, defined by the number and type of degrees granted. The definitions of all the variables are in appendix A. Means by union status are given in Table 2.
The Cross-Section Results Turning first to the results for associate professors, in column (1) of
Table 3 the estimated coefficient of Union is positive as predicted but is not significant at the .10 level using a two-tailed test.15 When the number of years a school has been organized is also included as an independent variable (column 2), the estimated coefficient of the union dummy actually turns negative, but remains insignificant. The estimated coefficient of
The estimated coefficient of Union increases to ,009 with a t-statistic of 1.5 when the variable Benefits is dropped from equation (1).

Does Unionization Increase Faculty Retention? I 305
TABLE 2 VARIABLE MEANS, 1987-88 ACADEMIC YEAR
(sample sizes in parentheses)
Variable Union Sample Nonunion Sample
Associate Professors Retention Rate Union Years Organized Salary Benefits Faculty Size Faculty-Student Ratio Proportion of Faculty w/Ph.D.’s Private Church- Affiliated Category E (two-year)
Assistant Professors Retention Rate Union Years Organized Salary Benefits Faculty Size Faculty-Student Ratio Proportion of Faculty w/Ph.D.’s Private Church- Affiliated Category E (two-year)
(131) .93
12.2s 1
35,012 8,477
311 . 0s .47 . l l .02 .26
(141) .87
12.45 1
28,847 7,122
323 .05 .47 ,13 .02 .27
(653) .91
0 0
31,562 7,007
232 .08 .56 .30 .33 .08
(684) .85
0 0
26,597 5,729
231 .08 .56 .30 .33 .08
Full Professors (130) (620)
Years Organized 12.51 0
Retention Rate .93 .92 Union 1 0
Salary 42,915 39,607 Benefits 9,942 8,714 Faculty Size 319 239
Proportion of Faculty w/Ph.D.’s .47 .56 Private .10 .29 Church- Affiliated .02 .35 Category E (two-year) .26 .08
Faculty-Student Ratio .05 .07
Years Organized, however, is positive and significant: an additional year of being organized is associated with an increase in the retention rate for associate professors of .2 percentage points.
Further results from Table 3 show that an increase of $10,000 in the mean level of benefits paid to associate professors is associated with an increase in their retention rate of 4.6-4.9 percentage points. The effect of

306 / DANIEL I. REES
TABLE 3
RATE OF ASSOCIATE PROFESSORS: 1987-88 ACADEMIC YEAR^ (absolute t-statistics in parentheses)
CROSS-SECTION ESTIMATES OF THE IMPACT OF UNIONISM ON THE RETENTION
Intercept
Union
Years Organized
Years Organized Squaredb
Salaryb
Benefitsb
Faculty Sizec
Faculty-Student Ratio
Proportion of Faculty w/Ph.D.’s
,755 * * *
,008 (24.0)
(1.3) -
,011
.049* * *
,000
.009
- ,020’ * *
(1.3)
(3.3)
(0.6)
(0.5)
(2.8)
.756*** (24.0)
-.015 (1.0)
(1.8) ,002 *
-
,013 (1.5)
.046* * * (3.1)
,001 (0.8)
,009 (0.5) - .020* * * (2.8)
.749* * * (23.3) - ,037 (1.5)
(1.5)
(1.1) .015*
(1.7) .046***
(3.1) ,001
(0.8) .008
(0.5) - .021* * * (2.9)
,008
- ,031
n Adjusted R-Squared
784 784 784 ,124 .127 .127
a All observations weighted by the number of full-time associate professors in the institution. Dependent variable is equal to the retention rate for associate professors. Controls for proportion of associate professors with tenure, proportion female, region, admissions selectivity, whether the school is public, private, or church affiliated, and type of degree granted by the school are also included in equations. See appendix A for sources and definitions of variables.
Coefficient multiplied by 10,000. Coefficient multiplied by 100. Statistically significant at the .10 level; ** at the .05 level; * * * at the .01 level (two-tailed tests).
an increase in the mean salary level, however, is much smaller and is statistically significant only in column (3)’s specification of the model. l6
There are a number of factors that could explain why it is that associate professors appear to value pay in the form of benefits more highly than in the form of salary. First, fringe benefits are generally taxed at a lower rate than salaries are (Ehrenberg and Smith, 1991, p. 400). Second, pensions are nonportable at many institutions, especially those that are publicly controlled (Commission on College Retirement, 1990, pp. 172-202). Fi- nally, the average benefit package was valued according to how much the
l6 An F-test cannot reject the hypothesis that the estimated coefficients of Salary and Benefits are equal.

Does Unionization Increase Faculty Retention? I 307
TABLE 4
RATE OF ASSISTANT PROFESSORS: 1987-88 ACADEMIC YEAR& (absolute t-statistics in parentheses)
CROSS-SECTION ESTIMATES OF THE IMPACT OF UNIONISM ON THE RETEN TION
Variables
Intercept
Union
Years Organized
Years Organized Squaredc
Salaryb
Benefitsb
Faculty Sizec
Faculty-Student Ratio
Proportion of Faculty w/Ph.D.'s
.766'** (17.6) - .007 (0.9)
-
.766*** (17.6) - ,022
.001 (1.1)
(0.7) -
,020
.068*** (1.4)
(3.1)
(2.8)
(1.6)
(1.7)
- .003***
- ,032
-.017*
,021
.067* * *
-.002***
- ,032
-.018*
(1.4)
(3.0)
(2.6)
(1.6)
(1.7)
.763*** (17.3) - ,036
.005
- ,094
,022
.067***
-.002***
- ,032
(1.0)
(0.7)
(0.5)
(1.5)
(3.0)
(2.7)
(1.6)
(1.7) -.OM*
n Adjusted R-Squared
825 825 825 .088 ,088 ,087
All observations weighted by the number of full-time assistant professors in the institution. Dependent variable is equal to the retention rate of assistant professors. Controls for proportion of assistant professors with tenure, proportion female, region, admissions selectivity, whether the school is public, private, or church affiliated, and type of degree granted by the school are also included in equations. See appendix A for sources and definitions of variables.
Coefficient multiplied by 10,OOO. Coefficient multiplied by 100. Statistically significant at the .10 level; * * at the .05 level; *** at the .01 level (two-tailed tests).
institution actually paid, not how much it would have cost an individual to buy the same level of benefits on the open market. Typically, the cost to an individual would be higher than the cost to the in~tituti0n.l~
Neither the number of full-time faculty at a school nor the faculty- student ratio is associated with differences in the associate professor reten- tion rate. However, it would seem that the proportion of faculty members holding doctorates is negatively related to the associate professor retention rate. This result could be because professors with doctorates receive more, or better, outside job offers than do those without.
Tables 4 and 5 present the cross-section results for assistant and full
For instance, see Rejda (1982, p. 441) for a discussion of the cost advantages of group insurance plans.

308 / DANIEL I . REES
TABLE 5
RETENTION RATE OF FULL PROFESSORS: 1987-88 ACADEMIC YEAR^ (absolute t-statistics in parentheses)
CROSS-SECTION ESTIMATES OF THE IMPACT OF UNIONISM ON THE
Variables (1) (2) (3)
Intercept
Union
Years Organized
Years Organized Squaredc
Salaryb
Benefitsb
Faculty Sizec
Faculty-Student Ratio
Proportion of Faculty w/Ph.D.’s
.605***
.014** (12.0)
(2.1) -
-.011* (1.8)
(2.4)
(0.5)
(0.7)
(0.4)
.028**
- ,000
,021
,003
.593*** (11.8)
-.028** (2.3)
(3.9) . 005* * *
-
- ,007 (1.1)
(1.7)
(0.2)
(0.6)
(0.4)
.021*
- ,000
,017
,003
.567***
- .083* * *
.020***
- .083 * * *
- ,002
(11.2)
(3.6)
(3.7)
(2.9)
(0.3)
(1.7)
(0.4)
(0.5)
(0.4)
,020 *
-.000
.014
.002
~~~~ ~
n Adjusted R-Squared
750 750 750 ,119 ,136 ,144
a All observations weighted by the number of full-time full professors in the institution. Dependent variable is equal to the retention rate of full professors. Controls for proportion of full professors with tenure, proportion female, region, admissions selectivity, whether the school is public, private, or church affiliated, and type of degree granted by the school are also included in equations. See appendix A for sources and definitions of variables.
Coefficient multiplied by 10,000. Coefficient multiplied by 100.
* Statistically significant at the .10 level; ** at the .05 level; * * * at the .O1 level (two-tailed tests).
professors, respectively. The exit behavior of assistant professors does not seem affected by unionization. For full professors, the results suggest that a vote to be represented by a bargaining agent initially causes a drop in a school’s retention rate. After the first five or six years, unionization is associated with an increase in the full professor retention rate.
The level of benefits provided by a school is positively related to its retention rate for assistant and full professors. There is no evidence, how- ever, of a positive relationship between salary and retention for either rank. This pattern of results is difficult to explain and can perhaps be attributed to schools with undesirable, but unmeasured, qualities having to raise their salary levels in order to retain faculty. Support for this explana- tion can be found in the fixed-effects results presented below, where salary has the expected relationship to retention for all ranks.

Does Unionization Increase Faculty Retention? I 309
Finally, equation (1) was estimated, for associate professors, separating the sample according to institution type and control (see appendix B). The results for publicly controlled schools and four-year schools were similar to those found using the overall sample. When two-year schools were exam- ined separately, however, estimates of the union coefficients were much less precise, probably because of the reduction in sample size. The results for private and church-affiliated schools, although not statistically signifi- cant, suggest that unionization is associated with an initial increase in the retention of associate professors, followed by a reduction in the retention rate almost to the nonunion level.
The Fixed-Effects Model Although the results presented in Tables 3 through 5 suggest the pres-
ence of a union voice effect that grows over time, a potential problem should be addressed before a firm conclusion is drawn. If there exists a school-specific omitted variable, v,, that is correlated with both union status and faculty retention, then the estimates will be biased. This could be the case, for instance, if schools with high levels of administration- faculty conflict tend to have both a greater propensity to unionize and lower retention rates. One approach to take in order to correct this prob- lem is to estimate a fixed-effects model.
If one assumes that the effect of the omitted variable, v,, is constant over time, then a school’s faculty retention rate in period t can be written as
rst = a + X,,p + v, + E , ~ . (2) Notice, too, that p is assumed to be constant. Following Brown (1980), an unbiased estimate of p can be obtained by defining
R,, = rst - 1ITXT rst s = 1,2, . . . , (number of schools), t = 1,2, . . . ,T
and
ZSjt = Xsjt - l l T Z ~ X s j t j = 1,2, . . . , (number of x’s),
and regressing R on Z . This procedure is equivalent to letting each school have its own intercept. The effects of all variables that do not change over time, including vi, will be taken up by these school-specific intercepts.
The fixed-effects model will be estimated using eighteen years’ worth of data (1970-71 through 1987-88). Although the panel is unbalanced, there is no reason to believe that the movement of schools in and out of the sample is related to changes in union status or faculty retention rates. Only

310 / DANIEL I. REES
schools that were surveyed at least twice during the eighteen-year period are used in the analysis.
The control variables in the vector X,, are Salary, Benefits, Faculty Size, and seventeen year dummies. This list is short because information on other variables used in the cross-section analysis, such as the fraction of faculty holding doctorates, is not available on a consistent basis for the years prior to 1987-88. Also, variables that are constant over time cannot be included in the vector X,, because they would be exact linear combina- tions of the school-specific intercepts.
A majority of the colleges and universities in the sample did not change union status during the period from 1970-71 to 1987-88. For instance, looking at the associate professor subsample, 1,284 schools are nonunion every year in which they appear, and 145 are union in every year. Only 179 schools (or 11 percent of the total) changed their union status. The identifica- tion of the coefficient of Union is dependent on the presence of these latter schools. However, it would be possible to estimate the relationship between years organized and faculty retention without these schools because institu- tions that turned union before their first appearance in the sample neverthe- less registered changes in the number of years that they were organized.
More so than in the previous section, the analysis will focus on how the voice effect varies with the length of time an institution has been organized. To this end, the variables Union, Years Organized, and Years Organized Squared will be replaced by a step function. This new specification of the model is less restrictive than the one it replaces, and it allows for the closer examination of the immediate impact of unionization. Because the AAUP data set covers the period in which organizing activity in higher education was at its height (the early- to mid-seventies), it is possible to observe a large number of schools in the years immediately after unionization.
The Fixed-Effects Results With a few exceptions, OLS estimates of equation (2) conform to the
estimates of the cross-section model presented earlier. l8 Table 6 presents the associate professor results. In column (1) of Table 6, the union dummy is entered on the right-hand side without the number of years an institution has been organized. The estimated coefficient of Union is positive, as one would expect, but not statistically significant. l9 When Years Organized is also included as an independent variable (column 2), the estimated coeffi-
Equation (2) was also estimated using a log-odds transformation of the dependent variable. The
l9 The estimated coefficient of Union increases to .006 with a t-statistic of 1.6 when the variable results were consistent with those reported.
Benefits is dropped from equation (2).

Does Unionization Increase Faculty Retention? I 31 1
TABLE 6 FIXED-EFFECTS ESTIMATES OF THE IMPACT OF UNIONISM ON THE
RETENTION RATE OF ASSOCIATE PROFESSORS: YEARS 1970-71 TO 1987-8ga (absolute t-statistics in parentheses)
V a r i a b 1 e s (1) (2) (3)
School Dummies Year Dummies Salaryb
Benefitsb
Faculty Sizec
Union
Years Organized
Organized 0-3 Years
Organized 3-6 Years
Organized 6-9 Years
Organized 9-12 Years
Organized 12-15 Years
Organized 15 or More Years
Yes Yes .017***
.032* * * (4.5)
(5.8)
(7.7)
(1.3)
- .007* * *
.005
Yes Yes .017***
.030* * *
-.007***
(4.6)
(5.4)
(7.6) -
- ,001
,004
.012***
.011**
.015**
,006
(0.3)
(0.9)
(2.6)
(2.1)
(2.5)
(0.8)
n DOF R-Squared
13922 13922 13922 12293 12292 12288
,298 ,302 ,302
a All observations weighted by the number of full-time associate professors in the institution. Dependent variable is equal to the retention rate for associate professors. See appendix A for sources.
Coefficient multiplied by 10,ooO. Coefficient multiplied by 100.
* Statistically significant at the .10 level; ** at the .05 level; *** at the .01 level (two-tailed tests).
cient of Union drops considerably. The estimated coefficient of Years Orga- nized, however, is positive and significant.
In column (3), the step function is used. For approximately the first six years after unionization, there is no evidence that faculty unions decrease turnover.20 However, schools that were organized for six to nine years
20 Estimating this specification of the model is meant only to give a rough idea of the relationship between years organized and faculty retention. The exact point at which unionization is associated with a positive and statistically significant effect on the associate professor retention rate is obviously dictated by the step function being estimated.

312 i DANIELI. REES
showed, on average, an increase in their retention rates for associate pro- fessors of 1.2 percentage points. For schools organized from nine to twelve and from twelve to fifteen years, the corresponding figures are 1.1 and 1.5 percentage points, respectively. Schools organized for fifteen years or more do not seem to have higher retention rates than when they were nonunion. This result may be due to waning union power, but more likely can be ascribed to the small number of schools (34) that appear in the sample at least once in a nonunion state, and then again after fifteen or more years of having been organized.
Surprisingly long is a lag of six years before unionization is associated with an increase in faculty retention, and this could be due to newly elected unions requiring a signed contract before they can effectively represent their members. Another possibility is that faculty retention rates are artifi- cially low following a successful election because of individuals who are unhappy with the outcome of the vote leaving.
Further results from Table 6 show that increases in benefits are again associated with increases in a school’s retention rate. A similar result can be found with regard to the mean salary level. However, it is interesting to note that the estimated coefficient of Benefits is almost twice the size of the estimated coefficient of Salary.21
Unlike in the cross-section analysis, there is evidence that an institu- tion’s size has an effect on faculty retention. An increase of one hundred full-time professors is associated with a drop in the faculty retention rate for associate professors of .006-.007. To put this result in perspective, from 1970-71 to 1987-88, roughly 14 percent of the schools in the sample experienced absolute net changes in the number of full-time professors of one hundred or more. The average absolute net change for the period was 56.
Tables 7 and 8 present fixed-effects estimates of retention equations for assistant and full professors, respectively. For assistant professors, the results suggest that retention rates immediately drop after an election of a bargaining agent, and then, after six years, go back to their earlier levels. These results could be seen as evidence that schools actually tighten their standards for granting tenure in the wake of unionization.
In the full professor equations, the estimated coefficients of the union variables follow the same general pattern as do those in the associate professor equations. However, the impact of unionization on the retention rate of full professors seems to be larger than in the case of associate professors and can be observed after only three years.
21 An F-test shows that the estimated coefficients of Salary and Benefits are different at the .10 level.

Does Unionization Increase Faculty Retention? I 313
TABLE 7 FIXED-EFFECTS ESTIMATES OF THE IMPACT OF UNIONISM ON THE RETENTION
RATE OF ASSISTANT PROFESSORS: YEARS 1970-71 TO 1987-Ba (absolute t-statistics in parentheses)
School Dummies Year Dummies Salaryb
Benefitsb
Faculty Sizec
Union
Years Organized
Organized 0-3 Years
Yes Yes .034* * *
.028***
- .010***
- .009**
(6.1)
(4.2)
(9.7)
(2.2) -
Organized 3-6 Years
Organized 6-9 Years
Organized 9-12 Years
Organized 12-15 Years
Organized 15 or More Years
Yes Yes ,035 * * *
.028***
- .010***
(6.2)
(4.11
(9.6)
- .014* * * (2.9)
(2.9)
(1.5)
(1.2)
(0.3)
(0.1)
- .015***
,008
- ,008
,003
- .001
n DOF R-Squared
15668 15668 15668 13986 13985 13981
.316 ,317 ,318
a All observations weighted by the number of full-time assistant professors in the institution. Dependent variable is equal to the retention rate for assistant professors. See appendix A for sources.
Coefficient multiplied by 10,000. Coefficient multiplied by 100.
* Statistically significant at the .10 level; ** at the .05 level; * * * at the .01 level (two-tailed tests).
Salary and benefit levels are positively related to a school's faculty reten- tion rate for both ranks. In the case of full professors, the estimates suggest that changes in benefits have a greater impact than do changes in salary.2* The number of full-time faculty employed by an institution is negatively related to faculty retention for both ranks.
zz The difference between the estimated coefficient of Salary and the estimated coefficient of Benefits is statistically significant at the .O1 level in the case of full professors, but not significant in the case of assistant professors.

314 / DANIEL I . REES
TABLE 8 FIXED-EFFECTS ESTIMATES OF THE IMPACT OF UN~ONISM ON THE
RETENTION RATE OF FULL PROFESSORS: YEARS 1970-71 TO 1987-88= (absolute t-statistics in parentheses)
Variables (1) (2) (3)
School Dummies yes Yes Yes Year Dummies Yes Yes Yes Salaryb .006** .008*** .007***
(2.2) (2.7) (2.6)
(5.2) (4.9) (4.8)
(3.9) (4.2) (3.9)
(2.3) (0.3) Years Organized - .002***
(4.4) Organized 0-3 Years - -
Organized 3-6 Years - - .015***
Benefitsb ,024* * * .023'** ,022 * * *
Faculty Sizea - .004* * * - .004* * * - ,004' * *
Union .009** ,011 -
-
- ,003 (0.7)
(2.9)
(2.6)
(3.8)
(4.6)
(2.4)
Organized 6-9 Years - - .013**
Organized 9-12 Years - - .020***
Organized 12-15 Years - - .032* * *
Organized 15 or More Years - - .018**
n 12888 12888 12888 DOF 11349 11348 1 I344 R-Squared ,295 ,296 .297
a All observations weighted by the number of full-time full professors in the institution. Dependent variable is equal to the retention rate for full professors. See appendix A for sources.
Coefficient multiplied by 10,000. Coefficient multiplied by 100.
* Statistically significant at the .10 level; ** at the .05 level; * * * at the . O 1 level (two-tailed tests).
Equation (2) was also estimated, for associate professors, by institution type and control (see appendix B).23 The results for publicly controlled and four-year schools were similar to those obtained using the overall sample. In contrast, there is evidence that the effect of unionization is greater at two-year institutions than at other institutions. Finally, private and church- affiliated schools seem to experience an increase in associate professor retention three years after an election, followed by a drop in retention. It
23 In the estimations of equation (2) institution type and contro1 were determined using data from the 1987-88 academic year.

Does Unionization Increase Faculty Retention? I 3 15
should be noted, however, that very few unionized private and church- affiliated schools were in the sample.24
The Size of the Voice Effect Although it seems clear that faculty unions have indeed had an impact
on retention rates, a natural question to ask at this point is, How large has this impact been? Estimates of the fixed-effects model suggest that, ap- proximately six years after a representation election, unionization is associ- ated with an increase in the associate professor retention rate of a little more than 1 percentage point. The effect of unionization remains at about this level for the next nine years, after which time it appears to drop off.
Should this difference between union and nonunion schools be consid- ered large or small? One way to look at the issue is to ask how much of an increase in the average salary or benefit level would be needed to produce the same impact on retention. According to the fixed-effects estimates presented in Table 6, a typical school would need to increase the mean salary level of its associate professors by nearly $6,000 in order to achieve a drop in its associate professor retention rate of 1 percentage point. The same school would need to increase its mean benefits level by more than $3,000 to get a similar result. Thus, when seen in these terms, unionization can be said to have a sizeable effect .25
Conclusion The usual objection to the type of analysis presented in this paper is that
some costly effect of unionization has gone unmeasured and is responsible for the reduction in turnover associated with unionism. The most often cited culprit is unionization’s effect on employee benefits. However, the retention equations estimated in this paper include a comprehensive mea- sure of benefits, and so the reported estimates of the union voice effect on retention should not be biased upward.
These estimates suggest that the union voice effect can have a substan- tial impact on the exit behavior of associate and full professors. For in-
24 Although over half the schools in the associate professor fixed-effects sample were privately controlled or church affiliated, only 17 of these privately controlled or church-affiliated schools were unionized at some point.
Another way of approaching this issue is to compare the effect of unionization on faculty turnover with its effect on the exit behavior of the average union worker. Using nationally representative samples, Freeman and Medoff (1984, p. 96) found that unionization was associated with a 31-33 percent reduction in the probability that a worker quits, controlling for wages, personal characteristics, occupation, and industry. The corresponding figure for associate professors who have been organized for six to nine years is roughly 13 percent. This comparison suggests that there is less opportunity for unions to enhance worker voice in higher education than in the typical union setting.

316 I DANIEL I. REES
stance, estimates of a fixed-effects model suggest that six years after an election, holding the level of salary and benefits constant, the average effect of unionization on the retention rate of associate professors is ap- proximately 1.2 percentage points. For full professors, the impact of unionization seems to be somewhat larger.
However, it should be noted that, especially in the case of associate professors, this impact is not felt until a number of years after a representa- tion election. This lag could be because a signed contract is needed before grievance procedures and other union voice mechanisms can work prop- erly. Another possibility is that immediately after an election, faculty reten- tion rates temporarily dip as professors who are dissatisfied with the vote’s outcome search for work at other institutions.
Appendix A: Variable Definitions and Sources
Faculty Size Salary
Benefits
The total number of full-time faculty employed at the institution. The mean salary of full-time faculty in the relevant rank, mea-
The mean level of benefits received by full-time faculty in the rele- sured in 1987-88 dollars.
vant rank, measured in 1987-88 dollars. SOURCE: The A A U P s Annual Survey of Faculty Compensation, academic years 1970-71 through 1987-88.
Proportion Female
Proportion Tenured
The proportion of full-time faculty in the relevant rank who are female.
The proportion of full-time faculty in the relevant rank who are tenured (if the number of tenured faculty was not reported, then this variable was set equal to 0 and a dummy variable was set equal to 1).
Region Northeast Region North-central Region West
Private Church Affiliated
Category B
= I if school is in northeast region, otherwise = 0. =1 if school is in north-central region, otherwise = 0. =1 if school is in the west, otherwise = 0. (South is the omitted region.) = 1 if the school is privately controlled, otherwise = 0. = 1 if church affiliated, otherwise = 0. (Publicly controlled schools comprise the omitted category.) = 1 if comprehensive institution, otherwise = 0 (comprehensive
institutions “are characterized by diverse post-baccalaureate programs, but do not engage in significant doctoral level education”).
tutions concentrate on undergraduate education). Category C
Category E
SOURCE: The A A U P s Annual Survey of Faculty Compensation, academic years 1987-88.
=1 if general baccalaureate institution, otherwise = 0 (these insti-
=1 if two-year institution, otherwise = 0. (Doctoral-level institutions comprise the omitted category.)
A1 A2 A3 A4 A5
=1 if most competitive admissions, = 0 other. =1 if highly competitive admissions, = 0 other. =1 if very competitive admissions, = 0 other. = I if competitive admissions, = 0 other. = I if less competitive admissions, = 0 other.

Does Unionization Increase Faculty Retention? J 317
A6 = 1 if noncompetitive admissions, = 0 other. (Omitted category is comprised of schools that specialize in music,
art, or theater, most two-year schools, and a few four-year schools not included in Barron’s.)
SOURCE: Barron’s Profiles of American Colleges (Epstein et al. 1984).
Faculty-Student Ratio The school’s overall faculty-student ratio (part-time students and faculty are counted as one-half their full-time counterparts).
Proportion of Faculty w/Ph.D.’s Proportion of full-time faculty who hold Ph.D.’s.
SOURCE: The College Entrance Examination Board’s Annual Survey of Colleges Research Tape, academic years 1987-
Union = 1 if the school is organized, = 0 otherwise. Years Organized The current year minus the year in which the school was organized
SOURCE: Directory of Faculty Contracts and Bargaining Agents in Institufions of Higher Education (Douglas, 1990).
88 and 1988-89.
(nonunion schools are assigned the value 0).
Appendix B: Additional Tables TABLE B1
CROSS-SECTION ESTIMATES OF THE IMPACT OF UNIONISM ON THE RETENTION OF ASSOCIATE PROFESSORS^
(sample divided by institution type and control)
Estimated Absolute Value Coefficient t-statistic
Publicly Controlled Schools (n = 355, Adjusted R-Squared = ,130) Union Years Organized Years Organized Squaredb
Private and Church-Affiliated Schools (n = 429, Adjusted R-Squared = .120) Union Years Organized Years Organized Squaredb
Two-Year Schools (n = 89, Adjusted R-Squared = ,139) Union Years Organized Years Organized Squaredb
Four-Year Schools (n = 695, Adjusted R-Squared = .125) Union Years Organized Years Organized Squaredb
- .084** * .016**
-.064*
,111 - .017
,069
,021 ,004
- .046
- ,035 .007
- ,023
2.6 2.3 1.8
1.6 1.3 1.0
0.3 0.3 0.7
1.4 1.2 0 .7
a All observations are weighted by the number of associate professors in the institution. Dependent variable is equal to the retention rate of associate professors. Controls are the same as those used in Table 3.
* Statistically significant at the .10 level; ** at the .05 level; * * * at the .01 level (two-tailed tests). Coefficient multiplied by 100.

318 / DANIEL I . REES
TABLE B2 FIXED-EFFECTS ESTIMATES OF THE IMPACT OF UNIONISM
ON THE RETENTION OF ASSOCIATE PROFESSORS^ (sample divided by institution type and control)
Estimated Absolute Value Coefficient t-statistic
Publicly Controlled Schools (DOF = 5591, R-Squared = ,310)
Years Organized 0-3 3-6 6-9 9-12
15 or more 12-15
Private and Church-Affiliated Schools (DOF = 6639, R-Squared = ,298)
Years Organized 0-3 3-6 6-9 9-12 12-15 15 or more
Two-Year Schools (DOF = 1093, R-Squared = ,372)
Years Organized 0-3 3-6 6-9 9-12
15 or more 12-15
Four-Year Schools (DOF = 11169, R-Squared = .301)
Years Organized 0-3 3-6
9-12
15 or more
6-9
12-15
- ,003 - ,000
,008 ,007 .014*
- .002
,001 .028** ,006
- ,014 - ,023
.011
,017 ,030 ,029 ,031 .082* * *
- ,001
- ,001 ,004 .012** .010* ,006 .OM**
0.5 0.1 1.4 1.1 1.7 0.2
0.1 2.5 0.5 1.1 1.5 0.5
1.0 1.6 1.4 1.4 3.4 0.1
0.3 0.8 2.4 1.9 0.9 2.2
a All observations weighted by the number of associate professors in the institution. Dependent variable is equal to
* Statistically significant at the ,10 level; * * at the .05 level; * * * at the .01 level (two-tailed tests). the retention rate of associate professors. Controls are the same as those used in Table 6 .

Does Unionization Increase Faculty Retention? I 319
TABLE B3
AND FULL PROFESSORS: 1987-88 ACADEMIC YEAR^ (absolute t-statistics in parentheses)
FULL CROSS-SECTION RESULTS FOR ASSOCIATE, ASSISTANT,
Variables Associate Assistant Full
Intercept
Union
Salaryb
Benefitsb
Faculty Sizec
Faculty-Student Ratio
Proportion of Faculty w/Ph.D.’s
Proportion Female
Proportion Tenured
Tenure Dummy
Northeast
North-central
West
Private
Church Affiliated
Category B
Category C
Category E
A1
A2
A3
A4
A5
.755***
,008
,011
.049***
,000
.009
- .020* * *
-.021
(24.0)
(1.3)
(1.3)
(3.3)
(0.6)
(0.5)
(2.8)
(1.0)
(7.0)
(1.8)
(0.1)
(0.2)
(1.2)
(1.1)
(2.5)
(0.4)
(0.8)
(0.3)
(1.4)
(1.1)
(0 .5)
(0.0)
(0.2)
.117***
.040*
-.001
- .001
- ,009
,008
.019**
,003
.007
,005
- ,028
- ,015
- ,006
,001
,003
.766** * (24.0) - ,007
,020
.068***
(0.9)
(1.4)
(3.1)
(2.8)
(1.6)
(1.7)
(1.7)
(3.1)
(1.4)
(1.2)
(0.9)
(1.1)
(2.6)
(0.2)
(0.8)
(0.9)
(1.1)
(2.5)
(0.2)
(1.1)
(1.4)
(0.6)
- .003***
- ,032
- .017*
- .047*
.064* * *
- ,014
,011
.007
- ,011
- .026***
,002
- .007
.010
,027
.064**
,003
,020
,024
,011
.605* * *
.014** (12.0)
(2.1)
(1.8)
(2.4)
(0.5)
(0.7)
(0.4)
(1.7)
(7.1)
(5.9)
(1.6)
(0.1)
(0.6)
(1.9)
(2.2)
(1.1)
(0.0)
(1.2)
(0.3)
(0.1)
(0.2)
(0.7)
(0.8)
-.011*
.028**
-.ooo
,021
,003
- .053*
.337* * *
.311***
,011
- ,001
-.004
.016*
.020**
- ,007
- ,000
,022
,005
,001
,002
,002
,010
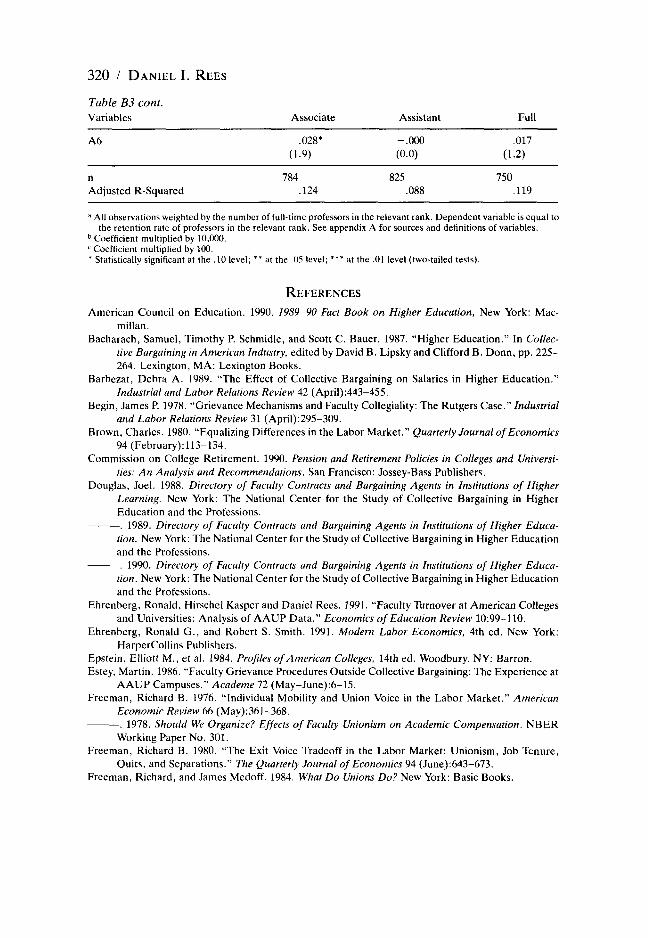
320 / DANIEL I. REES
Table B3 cont. Variables Associate Assistant Full
A6 .028* - ,000 ,017 (1.9) (0.0) (1.2)
n Adjusted R-Squared
784 825 750 .124 ,088 ,119
a All observations weighted by the number of full-time professors in the relevant rank. Dependent variable is equal to the retention rate of professors in the relevant rank. See appendix A for sources and definitions of variables.
Coefficient multiplied by 10.000. Coefficient multiplied by 100.
* Statistically significant at the . I 0 level; * * at the .0S level; * * * at the .01 level (two-tailed tests).
REFERENCES American Council on Education. 1990. 1Y8Y-YO Fact Book on Higher Education, New York: Mac-
millan. Bacharach, Samuel, Timothy P. Schmidle, and Scott C. Bauer. 1987. “Higher Education.” In Collec-
tive Bargaining in American Industry, edited by David B. Lipsky and Clifford B. Donn, pp. 225- 264. Lexington, MA: Lexington Books.
Barbezat, Debra A. 1989. “The Effect of Collective Bargaining on Salaries in Higher Education.” Industrial and Labor Relations Review 42 (April):443-455.
Begin, James P. 1978. “Grievance Mechanisms and Faculty Collegiality: The Rutgers Case.” Industrial and Labor Relations Review 31 (April):295-309.
Brown, Charles. 1980. “Equalizing Differences in the Labor Market.” Quarterly Journal of Economics 94 (February): 113-134.
Commission on College Retirement. 1990. Pension and Retirement Policies in Colleges and Universi- ties: An Analysis and Recommendations. San Francisco: Jossey-Bass Publishers.
Douglas, Joel. 1988. Directory of Faculty Contracts and Bargaining Agents in Institutions of Higher Learning. New York: The National Center for the Study of Collective Bargaining in Higher Education and the Professions. . 1989. Directory of Faculty Contracts and Bargaining Agents in Institutions of Higher Educa-
tion. New York: The National Center for the Study of Collective Bargaining in Higher Education and the Professions. . 1990. Directory of Faculty Contracts and Bargaining Agents in Institutions of Higher Educa-
tion. New York: The National Center for the Study of Collective Bargaining in Higher Education and the Professions.
Ehrenberg, Ronald, Hirschel Kasper and Daniel Rees. 1991. “Faculty Turnover at American Colleges and Universities: Analysis of AAUP Data.” Economics of Education Review 10:99-110.
Ehrenberg, Ronald G., and Robert S. Smith. 1991. Modern Labor Economics, 4th ed. New York: HarperCollins Publishers.
Epstein, Elliott M., et al. 1984. Profiles ofAmerican Colleges, 14th ed. Woodbury, NY: Barron. Estey, Martin. 1986. “Faculty Grievance Procedures Outside Collective Bargaining: The Experience at
AAUP Campuses.” Academe 72 (May-June):6-15. Freeman, Richard B. 1976. “Individual Mobility and Union Voice in the Labor Market.” American
Economic Review 66 (May):361-368. . 1978. Should We Organize? Effects of Faculty Unionism on Academic Compensation. NBER
Working Paper No. 301. Freeman, Richard B. 1980. “The Exit Voice Tradeoff in the Labor Market: Unionism, Job Tenure,
Quits, and Separations.” The Quarterly Journal of Economics 94 (June):643-673. Freeman, Richard, and James Medoff. 1984. What Do Unions Do? New York: Basic Books.

Does Unionization Increase Faculty Retention? I 32 1
Garbarino, Joseph W. 1975. Faculty Bargaining Change and Conflict. New York: McGraw-Hill Book
Hirschman, Albert 0. 1970. Exit Voice and Loyalty. Cambridge, MA: Harvard University Press. Johnstone, Ronald L. 1981. The Scope of Faculty Collective Bargaining. Westport, CT: Greenwood
Keller, George. 1983. Academic Strategy. Baltimore: Johns Hopkins University Press. Kesselring, Randall G. 1991. “The Economic Effects of Faculty Unions.” Journal of Labor Research
12 (Winter):61-72. Lindenberg, Karen E. 1986. “The Grievance Process in a Collective Bargaining Setting.” Academe 72
(May-June):20-24. Rees, Albert, and Sharon P. Smith. 1991. Faculty Retirement in the Arts and Sciences. Princeton, NJ.
Princeton University Press. Rees, Daniel I. 1991. “Grievance Procedure Strength and Teacher Quits.” Industrial and Labor
Relations Review 45 (October):31-43. . 1993. “The Effect of Unionization on Faculty Salaries and Compensation: Estimates from the
1980s.” Journal of Labor Research 14 (Fall):399-422.
Company.
Press.
Rejda, George E . 1982. Principles of Insurance. Glenview, IL: Scott, Foresman and Company. Rosovsky, Henry. 1990. The University: An Owner’s Manual. New York: W . W. Norton and Company. Weiler, William C. 1985. “Why Do Faculty Members Leave a University?” Research in Higher Educa-
tion 23:270-278.


