
Dr Stuart Stapleton
Director, Emergency Department
Calvary Healthcare Bruce, ACT
Taking control of Your Destiny:The effect of a medical team model
for ED patients
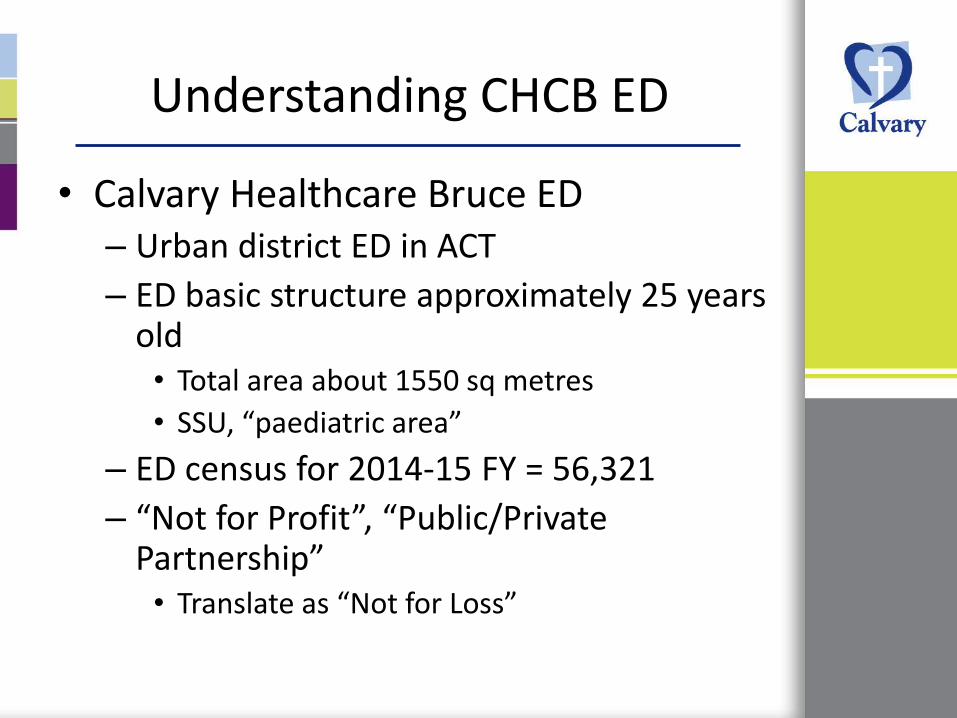
Understanding CHCB ED
• Calvary Healthcare Bruce ED– Urban district ED in ACT
– ED basic structure approximately 25 years old• Total area about 1550 sq metres
• SSU, “paediatric area”
– ED census for 2014-15 FY = 56,321
– “Not for Profit”, “Public/Private Partnership”• Translate as “Not for Loss”
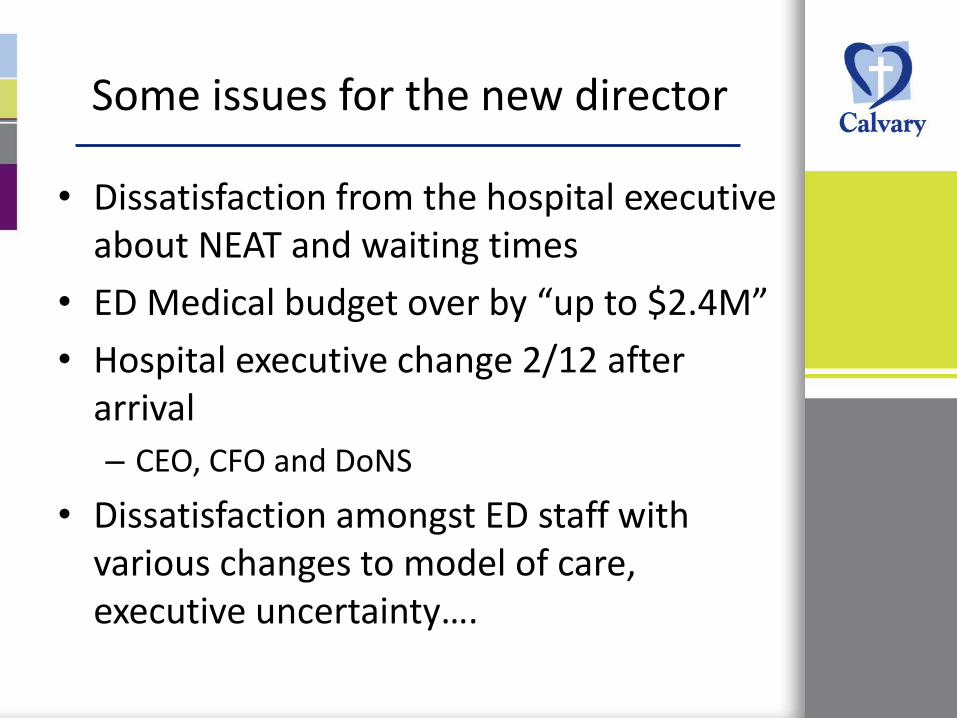
Some issues for the new director
• Dissatisfaction from the hospital executive about NEAT and waiting times
• ED Medical budget over by “up to $2.4M”
• Hospital executive change 2/12 after arrival
– CEO, CFO and DoNS
• Dissatisfaction amongst ED staff with various changes to model of care, executive uncertainty….

Control your own destiny or someone else will. Jack Welch

Basic Plan
• Get the ED to start functioning as team with common goals based around patient care
• Control our own destiny in factors we have control over– Pick the low hanging fruit for quick wins
• Go to the data….

CHCB ED Annual Census 2009-2014
0
10000
20000
30000
40000
50000
60000
Total presentations
Total Admissions
SSU admissions

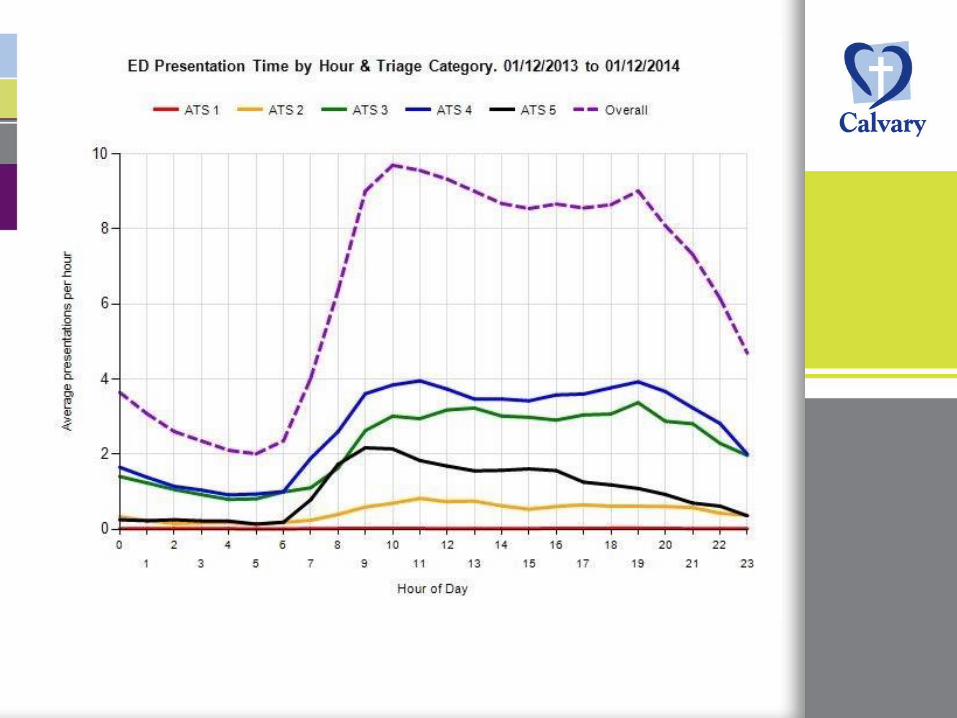
The Data Told Us…
• Increasing workload
• We own at least 80% of the patient flow issues

CHCB ED Presentations/ATS 2009-2014
0
5000
10000
15000
20000
25000
30000
2009-20102010-20112011-20122012-20132013-20142014-2015
ATS 1 ATS 2 ATS 3 ATS 4 ATS 5

The Data Told Us…
• Increasing workload
• We own at least 80% of the patient flow issues, as they are discharged from the ED
– Need to get it right for the discharged patients

ED Medical Staffing
• Numbers per shift– Day/Evening: 2 consultants, 10 others
• Others: 2 interns, 2 RMO1s, mix SRMO/CMO/reg
– Night: 1 Reg, 1 SRMO/Reg, 2RMOs
• Geographical allocation– Acute Care/RR– Sub-acute/Primary Care– SSU
major loss of continuityworkload inequities excessive waits for patients who would be discharged
The Data Told Us…
• Increasing workload
• We own at least 80% of the patient flow issues, as they are discharged from the ED– Need to get it right for the discharged patients
patients
• Focus on the times when the patients arrive– Have staffing to match workload– Improved staff availability during handovers

ED Medical Team Model
• Between 0800-2400hrs, 3 teams of 4 MOs – Red
• Consultant led
• Morning team takes the night handover of all patients
• New patient from about 1000hrs
– Yellow• Consultant led – ED Admitting Officer, supervises Blue
team
• Starts receiving new patients from 0800hrs
– Blue• Registrar/Senior CMO led
• Starts receiving new patients from 0800 hrs

ED Medical Team Model
• Patients allocated to team at triage in order of arrival– Not automated via EDIS
– Reallocation by Yellow team leader or CNUM if workload imbalance
– Resus patients to the next team
• Each team responsible for managing its own workload
• Team leader point of contact for external clinicians
ED Medical Team Model
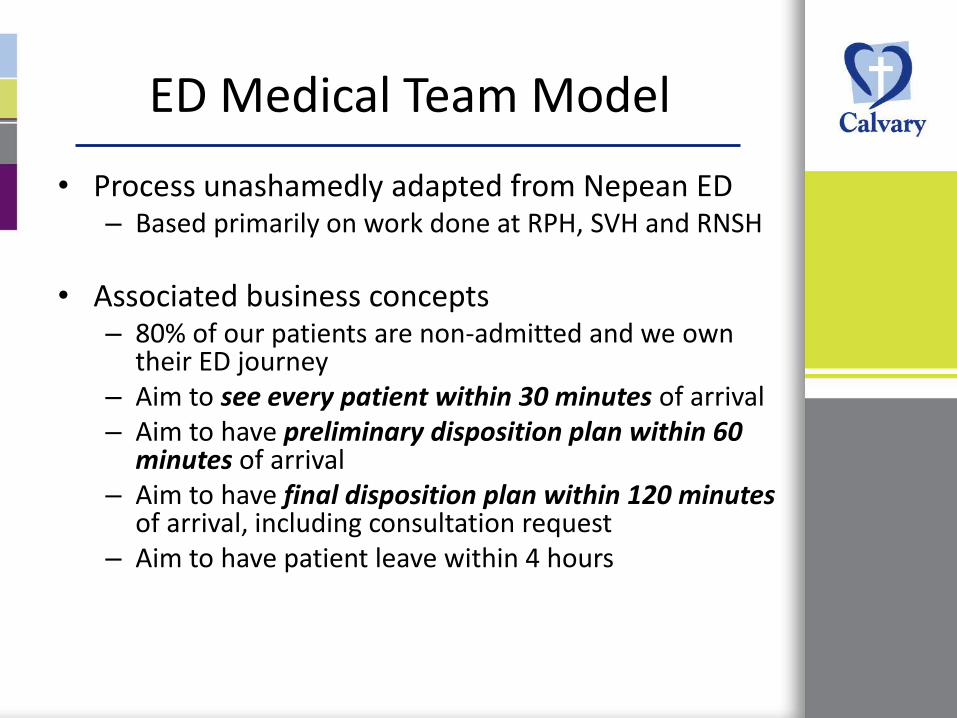
• Process unashamedly adapted from Nepean ED– Based primarily on work done at RPH, SVH and RNSH
• Associated business concepts– 80% of our patients are non-admitted and we own
their ED journey– Aim to see every patient within 30 minutes of arrival– Aim to have preliminary disposition plan within 60
minutes of arrival– Aim to have final disposition plan within 120 minutes
of arrival, including consultation request– Aim to have patient leave within 4 hours

Goals of the team model
• Improvement in seen times from 0800hrs
• Reduction in DNWs
• Better NEAT performance, especially for non-admitted patients
• Better supervision of junior MOs
• Better access to senior ED MOs for JMOs and nursing staff
• Improved patient satisfaction/decreased complaints at 12 months
ED Medical Team Model
• Implemented in Dec 2014
• Review of data
• Initial staff survey results
Coming together is a beginning; keeping together is progress; working together is success.
Henry Ford


Waiting Times and DNWs
0
10
20
30
40
50
60
70
80
2009 2010 2011 2012 2013 2014 2015
Av Wait
%Seen on Time
%DNW

Seen times, NEAT and Access Block
0
10
20
30
40
50
60
70
80
90
2009 2010 2011 2012 2013 2014 2015
%Seen on Time
NEAT %
Admitted NEAT %
ACEM Access Block%
D/C NEAT %

What do the staff think?
• Very basic survey
– Roles
– Duration in ED practice
– Perceived effects of the Medical Team Model
• More detail at the 12 month mark

0%
5%
10%
15%
20%
25%
30%
35%
40%
45%
50%
Much worse Sowehatworse
Nodifference
Somewhatbetter
Much better
Rate the ED MTM in terms of knowing who is looking after a specific patient in the ED (n=30)

0%
5%
10%
15%
20%
25%
30%
35%
40%
45%
50%
Much better Somewhatbetter
No Change Somewhatworse
Much worse
ED MTM effect on decision making processes for ED patients (n=30)

0%
5%
10%
15%
20%
25%
30%
35%
Much easier Somewhateasier
No change Somewhatharder
Much harder
Does the ED MTM make your job harder? (n=30)

0
0.5
1
1.5
2
2.5
3
3.5
4
4.5
5
Much moredifficult
Somewhatmore difficult
No change Somehatbetter
Much easier
The ED MTM has made it easier to access Senior ED MOs (n=30)

0%
10%
20%
30%
40%
50%
60%
70%
Much slower Somewhatslower
No change Somewhatquicker
Muchquicker
Perception of timelines for decision making for ADMITTED patients (n=30)

0%
10%
20%
30%
40%
50%
60%
70%
Muchquicker
Somewhatquicker
No change Somewhatslower
Much slower
Perception of timelines for decision making for DISCHARGED patients (n=30)

Has the ED MTT been a positive change for the ED? (n=30)
0%
10%
20%
30%
40%
50%
60%
70%
80%
90%
100%
Positive/Very Positive
Patients in ED
ED Admin
ED Nursing
ED Medical
ED other clinical
Non-ED clinical

Things to work on….
• Triage nurse control of allocations in EDIS
• Resus response
• Trainee supervision, especially with WBAs
• Team leader dependency
• ED size – especially assessment areas
• Overnight

Coming together is a beginning; keeping together is progress; working together is success.
Henry Ford


Thank you


