portofrotterdam.com
Wor
ld
Port
Cen
ter
Nie
uwe
Wat
erwe
g
Het
Sch
eur
Cala
ndka
naal
Nie
uwe
Maa
s
Waalhaven
Eemha
ven
Rijn
hav.
Maa
shav
en
Merwehav.
1e Petr. haven
2e P
etr.
hav.
3e P
etr.
have
nBo
tlek
Chemiehav.
St. Laurensh.
Britt
anni
ëhav
en
Sein
ehav
en
7e P
etr.h
aven
5e P
etr.
have
n
4e P
etr.
have
n
Beneluxhaven
Dintelhaven
Har
telk
anaa
l
Har
telk
anaa
l
Maa
smon
d
Noo
rdze
e
Yang
tzek
anaa
l Euro
paha
ven
Am
azon
ehav
en
Miss
issip
piha
ven
Prinses AlexiahavenPrinses Amaliahaven
Prinses Arianehaven
Prin
ses
Mar
grie
t-ha
ven
Beerkanaal
Hartelhaven
8e Petr.
haven
6e P
etr.
have
n
Oos
tvoor
nse
Mee
r
Oud
e M
aas
Brie
lse M
eer
Ho
ek v
an
Ho
lland
Ma
ass
luis
Vla
ard
ing
en
Schie
da
m
Rott
erd
am
Ca
pel
le a
an
den
IJs
sel
Kri
mp
en a
an
den
IJs
sel
Rid
der
ker
k
Ba
rend
rech
t
Zw
ijnd
rech
t
Spijk
enis
se
Ho
og
vlie
t
Hel
levo
etsl
uis
Roze
nb
urg
Rotte
rdam
-The
Hag
ue
Airp
ort
Dord
rech
t
Per
nis
Bri
elle
Oost
voorn
eSl
ufte
r
Ge
ne
ral C
arg
o
Dry
bu
lk
Ch
em
ica
ls/R
efi
ne
rie
s/E
ne
rgy
Liq
uid
bu
lk
Dis
trib
uti
on
Off
sho
re
Oth
er
acti
viti
es
310
95
7
4
34
57
6
9
10
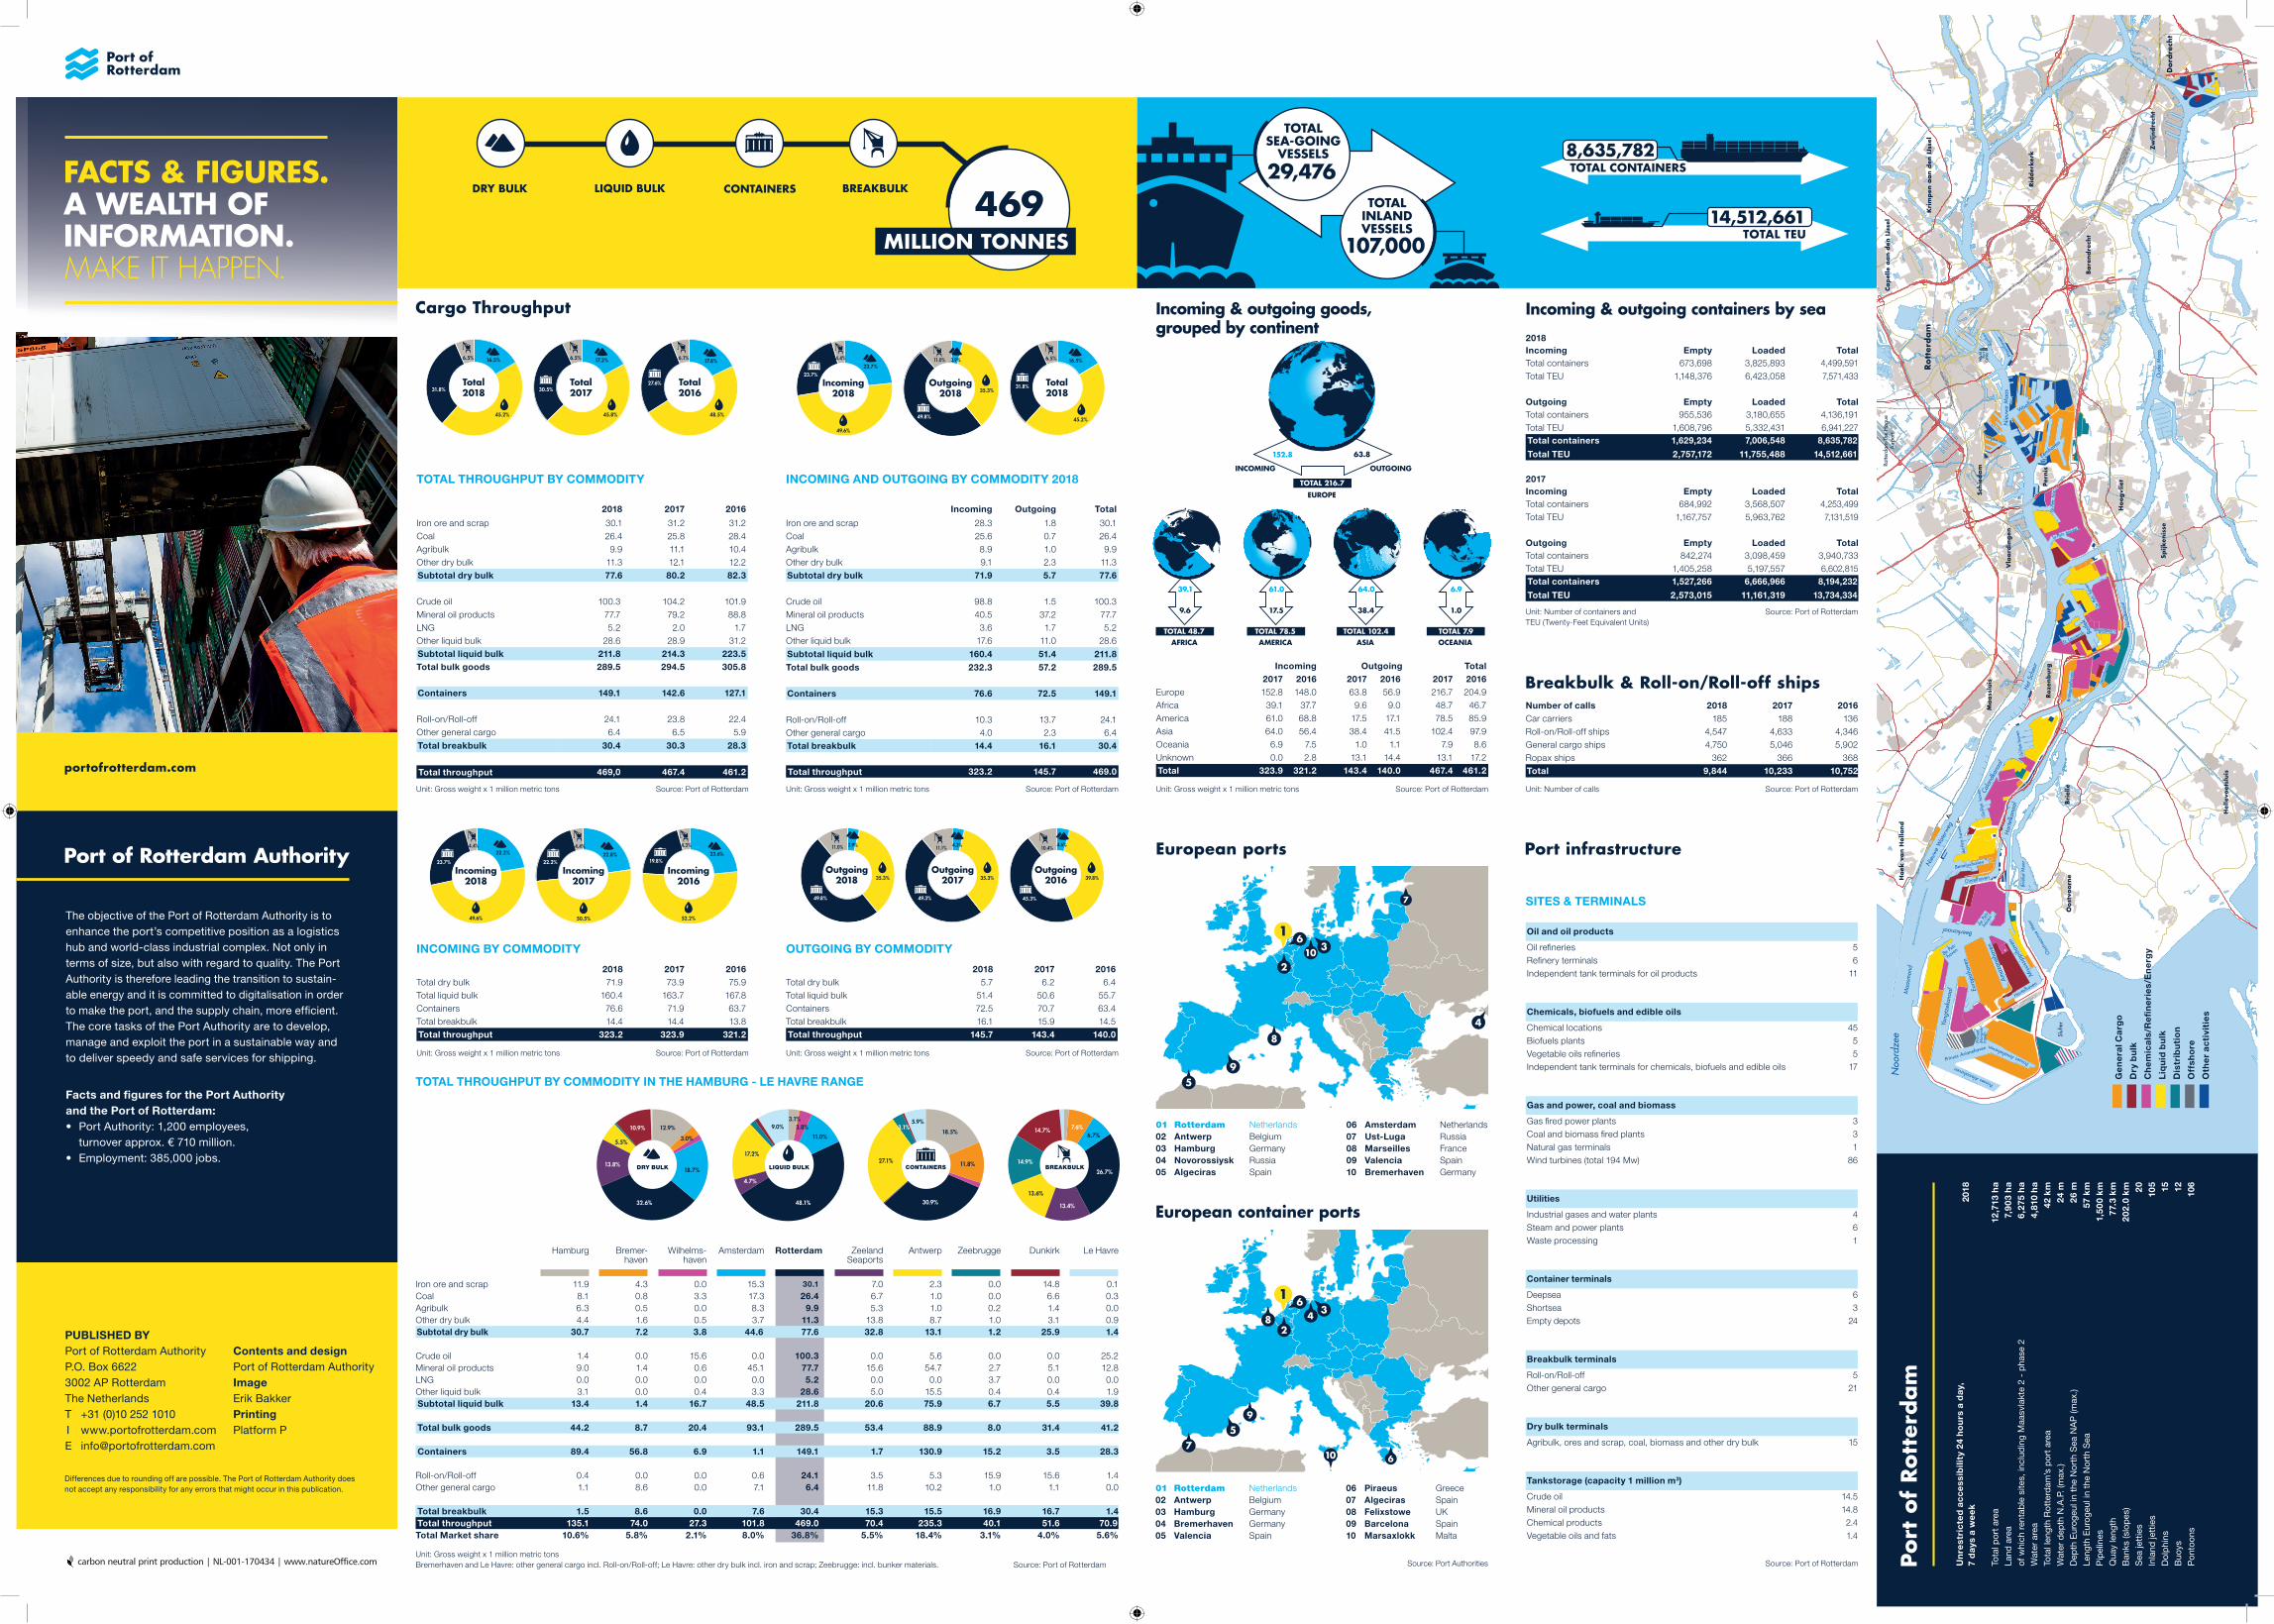
European ports
European container ports
Incoming Outgoing Total 2017 2016 2017 2016 2017 2016
Europe 152.8 148.0 63.8 56.9 216.7 204.9Africa 39.1 37.7 9.6 9.0 48.7 46.7America 61.0 68.8 17.5 17.1 78.5 85.9Asia 64.0 56.4 38.4 41.5 102.4 97.9Oceania 6.9 7.5 1.0 1.1 7.9 8.6Unknown 0.0 2.8 13.1 14.4 13.1 17.2 Total 323.9 321.2 143.4 140.0 467.4 461.2
Number of calls 2018 2017 2016 Car carriers 185 188 136Roll-on/Roll-off ships 4,547 4,633 4,346General cargo ships 4,750 5,046 5,902Ropax ships 362 366 368 Total 9,844 10,233 10,752
2018Incoming Empty Loaded TotalTotal containers 673,698 3,825,893 4,499,591Total TEU 1,148,376 6,423,058 7,571,433
Outgoing Empty Loaded TotalTotal containers 955,536 3,180,655 4,136,191Total TEU 1,608,796 5,332,431 6,941,227Total containers 1,629,234 7,006,548 8,635,782
Total TEU 2,757,172 11,755,488 14,512,661
2017Incoming Empty Loaded TotalTotal containers 684,992 3,568,507 4,253,499Total TEU 1,167,757 5,963,762 7,131,519
Outgoing Empty Loaded TotalTotal containers 842,274 3,098,459 3,940,733Total TEU 1,405,258 5,197,557 6,602,815Total containers 1,527,266 6,666,966 8,194,232
Total TEU 2,573,015 11,161,319 13,734,334
Incoming Outgoing Total
Iron ore and scrap 28.3 1.8 30.1Coal 25.6 0.7 26.4Agribulk 8.9 1.0 9.9Other dry bulk 9.1 2.3 11.3Subtotal dry bulk 71.9 5.7 77.6
Crude oil 98.8 1.5 100.3Mineral oil products 40.5 37.2 77.7LNG 3.6 1.7 5.2Other liquid bulk 17.6 11.0 28.6
Subtotal liquid bulk 160.4 51.4 211.8Total bulk goods 232.3 57.2 289.5
Containers 76.6 72.5 149.1
Roll-on/Roll-off 10.3 13.7 24.1Other general cargo 4.0 2.3 6.4Total breakbulk 14.4 16.1 30.4
Total throughput 323.2 145.7 469.0
2018 2017 2016
Iron ore and scrap 30.1 31.2 31.2Coal 26.4 25.8 28.4Agribulk 9.9 11.1 10.4Other dry bulk 11.3 12.1 12.2Subtotal dry bulk 77.6 80.2 82.3
Crude oil 100.3 104.2 101.9Mineral oil products 77.7 79.2 88.8LNG 5.2 2.0 1.7Other liquid bulk 28.6 28.9 31.2Subtotal liquid bulk 211.8 214.3 223.5Total bulk goods 289.5 294.5 305.8
Containers 149.1 142.6 127.1
Roll-on/Roll-off 24.1 23.8 22.4Other general cargo 6.4 6.5 5.9
Total breakbulk 30.4 30.3 28.3
Total throughput 469,0 467.4 461.2
2018 2017 2016 Total dry bulk 71.9 73.9 75.9Total liquid bulk 160.4 163.7 167.8Containers 76.6 71.9 63.7Total breakbulk 14.4 14.4 13.8 Total throughput 323.2 323.9 321.2
2018 2017 2016 Total dry bulk 5.7 6.2 6.4Total liquid bulk 51.4 50.6 55.7Containers 72.5 70.7 63.4Total breakbulk 16.1 15.9 14.5 Total throughput 145.7 143.4 140.0
Oil and oil products
Oil refi neries 5Refi nery terminals 6Independent tank terminals for oil products 11
Chemicals, biofuels and edible oils
Chemical locations 45Biofuels plants 5Vegetable oils refi neries 5Independent tank terminals for chemicals, biofuels and edible oils 17
Gas and power, coal and biomass
Gas fi red power plants 3Coal and biomass fi red plants 3Natural gas terminals 1Wind turbines (total 194 Mw) 86
Utilities
Industrial gases and water plants 4Steam and power plants 6Waste processing 1
Container terminals
Deepsea 6 Shortsea 3 Empty depots 24
Breakbulk terminals
Roll-on/Roll-off 5Other general cargo 21
Dry bulk terminals
Agribulk, ores and scrap, coal, biomass and other dry bulk 15
Tankstorage (capacity 1 million m3)
Crude oil 14.5Mineral oil products 14.8Chemical products 2.4Vegetable oils and fats 1.4
Port infrastructure
SITES & TERMINALS
19.8%
4.3%
23.6%
52.2%
23.7%
4.4%22.2%
49.6%
22.2%
4.4%
22.8%
50.5%
Incoming2018
Incoming2017
Incoming2016
11.0%
49.3%49.8%
11.1% 4.3%3.9%
45.3%
10.4%4.6%
35.3%35.3% 39.8%Outgoing
2018Outgoing
2017Outgoing
2016
30.5%
6.5% 17.2%
45.8%
27.6%
6.1% 17.8%
48.5%
31.8%
6.5% 16.5%
45.2%
Total2018
Total2017
Total2016
23.7%
4.4%
49.6%
23.7%
49.8%
11.0% 3.9%
35.3%31.8%
6.5% 16.5%
45.2%
Incoming2018
Outgoing2018
Total2018
TOTAL 48.7 TOTAL 78.5
TOTAL 216.7
TOTAL 102.4 TOTAL 7.9
39.1
9.6
63.8152.8
AFRICA
61.0
17.5
AMERICA
EUROPE
INCOMING OUTGOING
64.0
38.4
ASIA
6.9
1.0
OCEANIA
12.9% 9.0% 3.8%
11.0%
11.8%
13.6%
6.7%
27.1%
5.9%
17.2%
13.8%
5.5%
10.9%
18.7%
32.6% 48.1%
4.7%
3.1%
18.5%7.6%14.7%
14.9%
26.7%
13.4%30.9%
3.1%
3.0%
DRY BULK CONTAINERSLIQUID BULK BREAKBULK
carbon neutral print production | NL-001-170434 | www.natureOffice.comUnit: Gross weight x 1 million metric tons Bremerhaven and Le Havre: other general cargo incl. Roll-on/Roll-off; Le Havre: other dry bulk incl. iron and scrap; Zeebrugge: incl. bunker materials. Source: Port of Rotterdam
Cargo Throughput Incoming & outgoing goods, grouped by continent
TOTAL THROUGHPUT BY COMMODITY INCOMING AND OUTGOING BY COMMODITY 2018
INCOMING BY COMMODITY OUTGOING BY COMMODITY
Source: Port of Rotterdam Source: Port Authorities
Unit: Gross weight x 1 million metric tons Source: Port of Rotterdam Unit: Gross weight x 1 million metric tons Source: Port of Rotterdam Unit: Gross weight x 1 million metric tons Source: Port of Rotterdam Unit: Number of calls Source: Port of Rotterdam
Unit: Gross weight x 1 million metric tons Source: Port of Rotterdam Unit: Gross weight x 1 million metric tons Source: Port of Rotterdam
TOTAL THROUGHPUT BY COMMODITY IN THE HAMBURG - LE HAVRE RANGE
Incoming & outgoing containers by sea
Breakbulk & Roll-on/Roll-off ships
Unit: Number of containers and Source: Port of RotterdamTEU (Twenty-Feet Equivalent Units)
Un
rest
ric
ted
ac
ce
ssib
ility
24
ho
urs
a d
ay,
7 d
ays
a w
ee
k 20
18
Tota
l por
t ar
ea12
,713
ha
Land
are
a7,
903
ha
of w
hich
ren
tab
le s
ites,
incl
udin
g M
aasv
lakt
e 2
- p
hase
26,
275
ha
Wat
er a
rea
4,81
0 h
aTo
tal l
engt
h R
otte
rdam
’s p
ort
area
42 k
mW
ater
dep
th N
.A.P
. (m
ax.)
24 m
Dep
th E
urog
eul i
n th
e N
orth
Sea
NA
P (m
ax.)
26 m
Leng
th E
urog
eul i
n th
e N
orth
Sea
57 k
mP
ipel
ines
1,50
0 k
mQ
uay
leng
th77
.3 k
mB
anks
(slo
pes
)2
02.0
km
Sea
jett
ies
20
Inla
nd je
ttie
s10
5D
olp
hins
15B
uoys
12P
onto
ons
106
Port
of
Rott
erd
am
Differences due to rounding off are possible. The Port of Rotterdam Authority does not accept any responsibility for any errors that might occur in this publication.
PUBLISHED BYPort of Rotterdam AuthorityP.O. Box 66223002 AP RotterdamThe NetherlandsT +31 (0)10 252 1010 I www.portofrotterdam.comE [email protected]
Contents and designPort of Rotterdam AuthorityImageErik BakkerPrintingPlatform P
DRY BULK LIQUID BULK CONTAINERS BREAKBULK
469
8,635,782
14,512,661
29,476
107,000
Port of Rotterdam Authority
The objective of the Port of Rotterdam Authority is to enhance the port’s competitive position as a logistics hub and world-class industrial complex. Not only in terms of size, but also with regard to quality. The Port Authority is therefore leading the transition to sustain-able energy and it is committed to digitalisation in order to make the port, and the supply chain, more effi cient. The core tasks of the Port Authority are to develop, manage and exploit the port in a sustainable way and to deliver speedy and safe services for shipping.
Facts and fi gures for the Port Authorityand the Port of Rotterdam:• Port Authority: 1,200 employees,
turnover approx. € 710 million.• Employment: 385,000 jobs.
01 Rotterdam Netherlands02 Antwerp Belgium03 Hamburg Germany04 Bremerhaven Germany05 Valencia Spain
06 Piraeus Greece07 Algeciras Spain08 Felixstowe UK09 Barcelona Spain10 Marsaxlokk Malta
01 Rotterdam Netherlands02 Antwerp Belgium03 Hamburg Germany04 Novorossiysk Russia05 Algeciras Spain
06 Amsterdam Netherlands07 Ust-Luga Russia08 Marseilles France09 Valencia Spain10 Bremerhaven Germany
FACTS & FIGURES.A WEALTH OFINFORMATION. MAKE IT HAPPEN.
Hamburg Bremer-haven
Wilhelms-haven
Amsterdam Rotterdam Zeeland Seaports
Antwerp Zeebrugge Dunkirk Le Havre
Iron ore and scrap 11.9 4.3 0.0 15.3 30.1 7.0 2.3 0.0 14.8 0.1Coal 8.1 0.8 3.3 17.3 26.4 6.7 1.0 0.0 6.6 0.3Agribulk 6.3 0.5 0.0 8.3 9.9 5.3 1.0 0.2 1.4 0.0Other dry bulk 4.4 1.6 0.5 3.7 11.3 13.8 8.7 1.0 3.1 0.9 Subtotal dry bulk 30.7 7.2 3.8 44.6 77.6 32.8 13.1 1.2 25.9 1.4
Crude oil 1.4 0.0 15.6 0.0 100.3 0.0 5.6 0.0 0.0 25.2Mineral oil products 9.0 1.4 0.6 45.1 77.7 15.6 54.7 2.7 5.1 12.8LNG 0.0 0.0 0.0 0.0 5.2 0.0 0.0 3.7 0.0 0.0Other liquid bulk 3.1 0.0 0.4 3.3 28.6 5.0 15.5 0.4 0.4 1.9Subtotal liquid bulk 13.4 1.4 16.7 48.5 211.8 20.6 75.9 6.7 5.5 39.8
Total bulk goods 44.2 8.7 20.4 93.1 289.5 53.4 88.9 8.0 31.4 41.2
Containers 89.4 56.8 6.9 1.1 149.1 1.7 130.9 15.2 3.5 28.3
Roll-on/Roll-off 0.4 0.0 0.0 0.6 24.1 3.5 5.3 15.9 15.6 1.4Other general cargo 1.1 8.6 0.0 7.1 6.4 11.8 10.2 1.0 1.1 0.0
Total breakbulk 1.5 8.6 0.0 7.6 30.4 15.3 15.5 16.9 16.7 1.4 Total throughput 135.1 74.0 27.3 101.8 469.0 70.4 235.3 40.1 51.6 70.9 Total Market share 10.6% 5.8% 2.1% 8.0% 36.8% 5.5% 18.4% 3.1% 4.0% 5.6%

Segment build-up 2017 2002
Direct added value 18.0 11.7Indirect added value (backwards) 9.2 5.8
‘Rotterdam effect’, direct and indirect added value 14.8 6.0Maritime business services, direct added value 2.3 1.1
Maritime business services, indirect added value 1.3 0.6
Total added value 45.6 25.2
The Netherlands’ share 6.2% 5.0%
Segment build-up 2017 2002
Direct employment 121.8 103.4Indirect employment (backwards) 103.3 90.4
‘Rotterdam effect’ 130.3 81.4Maritime business services, direct employment 18.4 11.5
Maritime business services, indirect employment 10.7 6.3
Total employment 384.5 293
The Netherlands’ share 4.20% 3.40%
Earning power mainport Rotterdam
Employment mainport Rotterdam
Unit: billions of euros Source: Erasmus University Rotterdam
Unit: x thousand employed persons Source: Erasmus University Rotterdam
ADDED VALUE IN 2002 - 2017
EMPLOYMENT IN THOUSANDS OF PEOPLE
?p svs
M
CSR
CONNECTEDPORTS
Pecém
SCHOOL TO WORK
JOB INTHE PORT
WORK TO WORK
BACK TO WORK AGAIN
45.6 bil.
384,500
ADDED VALUE
Shell residual heat for 16,000 householdsThe Pernis Residual Heat Initiative is being delivered in Rotterdam’s
Katendrecht district. Shell, the Port of Rotterdam Authority and Warmte-
bedrijf Rotterdam are contributing to accelerating the Dutch energy
transition by heating 16,000 Rotterdam households with residual
heat from the refinery in Pernis. This results in annual CO2 reductions
of 35,000 tonnes. Industry still has residual heat available for over
500,000 households.
LyondellBasell invests in efficiency and CO2 reductionBy investing approx € 150 million in new systems, LyondellBasell is
reducing CO2 emissions by 140,000 tonnes per year. This amounts to
some 20% of the company’s CO2 emissions. The LyondellBasell
and Covestro plant on Maasvlakte produces raw materials including
for insulation materials, paints and adhesives. The aim is for the new
systems to be constructed by 2020.
Report from Rotterdam-Moerdijk Industry Cluster A report the describes the concrete steps the industry should take in
the region to help achieve the climate objectives. Step 1: take efficiency
measures, use residual heat to heat homes and greenhouses and
capture CO2 to store this beneath the North Sea. At the same time,
develop and scale up sustainable technologies, such as creating
hydrogen through electrolysis. Step 2: switch from oil and gas heating
to electricity and hydrogen (generated with green electricity instead
of natural gas). Step 3: replace fossil fuels with biomass: recycle ‘waste’
and use sustainably produced hydrogen.
Largest ever oil spill in RotterdamThe tanker Bow Jubail crashed into a jetty in the third Petroleumhaven
on 23 June. This resulted in a leaking fuel tank and 217,000 litres of fuel
oil in the port water. Not only the Port Authority but also many other
parties in the port worked day and night to clean the water surface and
remove oil residues from vessels as well as from some 500 swans.
The banks, quays and jetties also needed to be cleaned. This oil spill
was by far the biggest ever in the port of Rotterdam.
Maasvlakte radar tower taken into operationThe Maasvlakte 2 radar tower was taken into operation in October.
The 70-metre-high tower on the seawall is taking over the radar coverage
from the former lighthouse on Europaweg. Radar coverage continues
to decrease the more built-up Maasvlakte becomes. This means that
the new radar tower becoming operational will improve safety in the
port. As well as a unique design (oval-shaped), it is also a sustainable
design. The material is 100% recyclable and is low-maintenance.
Camera surveillance in the portIn 2018, a partnership for camera surveillance was established. Various
parties aim to deliver a coordinated contribution to combat drug crimi-
nality, illegal immigration, human trafficking and environmental criminality.
A camera supervision pilot started in the Waalhaven-Sluisjesdijk/
Waalhaven-Noordzijde in July.
New Pronto applicationThe Port of Rotterdam Authority has launched the first version of Pronto.
This application enables shipping companies, agents, terminals and
other service providers to optimise planning, implementation and moni-
toring of all activities during a port call. Pronto can reduce vessel waiting
times in the port by 20%.
Better traffic and logistics information forfreight traffic in port of RotterdamThe Mainport Traffic Monitor is expanded with real-time information,
including from road hauliers. This expansion will enable logistics
companies to gain more accurate information in an intuitive way with
respect to the current traffic situation and handling times at container
terminals and empty depots.
5G in the port The first industrial applications have been tested with the latest genera-
tion of mobile networks in the port of Rotterdam area. 5G applications
will enable production processes to be optimised, industrial mainte-
nance to be better predicted and safety to improve further. 5G also
enables the large-scale use of wireless sensors and the process
industry will have immediate access to relevant information from the
production environment.
Float your idea. MAKE IT HAPPEN.This literally means FLOAT YOUR IDEA: test out an idea. Rotterdam
Floating Lab does actually also float ideas and innovations. The Port of
Rotterdam Authority offers the opportunity to test inno-
vations relating to shipping autonomy and digitisation on relief vessel
RPA3. We are cooperating with market parties, start-ups, government
agencies, educational institutions and research institutes to build a
knowledge network around Smart Shipping.
Four contracts with start-upsThe Port of Rotterdam Authority has signed a partnership agreement with
four young companies. The products of these promising start-ups vary
from compact tulip-shaped wind turbines to blockchain applications
for vessel cargo monitoring. The companies completed the PortXL pro-
gramme, which brings innovations from across the world to Rotterdam.
McNetiq: magnetic jetty anchors forsmart and safe maintenanceSafe, cost-effective and better for the environment: start-up McNetiq
produces and sells magnetic anchors with which jetties can be fitted to
steel walls without welding. The company’s growth is a good example of
the successful operation of the Port of Rotterdam’s innovative ecosystem.
Rotterdam aims to be the world’s smartest port. To maintain
our leading position, we need to keep on innovating. Innovation
is a crucial means of realising the envisaged changes in energy
transition and digitisation in the Port of Rotterdam.
Digitisation is taking off across the world. New techniques,
players, partnerships and business models. The Port of Rotterdam
is fully committed to innovation in order to maximise the benefits
of the new potential that digitisation offers.
In order to strengthen its position as Europe’s largest logistical
and industrial hub, the Port of Rotterdam works continuously to
improve accessibility. In this context, sustainable solutions are
sought to optimise access to Europe by road, rail, pipeline and
coastal and inland navigation.
Public bus transport to MaasvlakteMaasvlakte has been accessible by public transport since December.
The new bus connection forms part of Transferium Maasvlakte and is an
addition to the organised company transport and the Fast Ferry from
Hoek van Holland.
Minister starts deepening of Nieuwe WaterwegMinister Cora van Nieuwenhuizen of Infrastructure and Water Manage-
ment and Ronald Paul (COO Port of Rotterdam Authority) gave the official
go-ahead for the deepening of the Nieuwe Waterweg and the Botlek.
Rijkswaterstaat and the Port of Rotterdam Authority have joined forces
to ensure that sea-going vessels with a draught of 15 metres can also
reach the Botlek port.
10 years of Traffic Management CompanyThe Traffic Management Company celebrated its tenth anniversary.
It has achieved the most diverse projects to improve the accessibility
of greater Rotterdam, such as bicycle schemes and reward projects,
having recovery services on standby during rush hour and improving
bicycle and public transport networks. The Traffic Management
Company is a partnership between bodies including Rijkswaterstaat,
the Port of Rotterdam Authority and the Municipality of Rotterdam.
ENERGY TRANSITION ADDED VALUE & EMPLOYMENT
DIGITISATION INNOVATION ACCESSIBILITY
SAFETY
The Port of Rotterdam Authority is committed to combat climate
change and would like to play a leading role in worldwide energy
transition. The reduction of CO2 emissions and efficient use of raw
and residual materials are important tasks for the Port Authority.
The Port of Rotterdam aspires to be the safest and most efficient
port in the world, and is working on this ambition constantly.
This requires close cooperation, for which the port undertakes
various activities.
Port of Rotterdam Authority financesThe Port of Rotterdam Authority’s turnover decreased to € 707.2 million and
the net result to € 254.1 million. Site lease charges decreased to € 373.7
million and the revenues from port dues to € 302.4 million. Operating
expenses rose to € 267.8 million, mainly through increased Energy Transi-
tion and Digitisation activities. The Port Authority has proposed paying
out € 68.3 million in dividends to the Municipality of Rotterdam and
€ 28.2 million to the State, both of which are shareholders.
High investment levelFor the Port of Rotterdam, 2018 was marked by a high level of investment.
Gross investments rose 91% to € 408.1 million (with a turnover of over
€ 700 million), the highest amount since the construction of Maasvlakte 2.
CO2 footprintThe Port Authority’s CO2 footprint was 7.3 kilotonnes in 2018. Particularly
direct emissions fell from 6.8 kilotonnes in 2016, via 5.9 kilotonnes in
2017 to 4.5 kilotonnes last year. This means that the 20%-reduction objec-
tive (compared with 2016) was achieved. Particularly activities regarding
our patrol vessels and the introduction of the updated mobility policy are
bearing fruit.
For the Port of Rotterdam Authority, the large oil spill in June
was the low point of 2018 (see Safety). Investments in the port
last year were at the highest level for a long time.
Port of Rotterdam Authority makesgreener sea-going shipping more accessible The Port of Rotterdam Authority is expanding and simplifying the
discounts on port dues for shipping (Green Award). The discount
will encourage safe and green shipping in the liquid bulk segment.
From 2019 onwards, certified chemical tankers and sea-going vessels
with a cargo capacity (DWT) of below 20,000 tonnes may also use
the scheme.
Many firsts for LNG bunker operationShell and Sovcomflot Shell bunkered a vessel with cleaner liquefied natural gas, LNG,
from another vessel for the first time in 2018. This was a unique event
in several respects. The fuel was supplied to the Sovcomflot vessel,
the first LNG-fuelled Aframax tanker. It was also the first time that LNG
was bunkered ship to ship in the Port of Rotterdam.
Bee paradise in the port areaThe Port of Rotterdam Authority has introduced a swarm of bees on
the Maasvlakte in the verge next to the Stenen Baakplein. Ten thousand
bees will be collecting pollen and nectar in this section of the ‘Honey
Highway’. The goal of this initiative is the conservation of the original
Dutch honey bee by reintroducing it to this region.
SUSTAINABILITY
The Port of Rotterdam creates economic and social value and
plans to realise sustainable growth. Here you can see a small
selection of projects that will contribute to a sustainable future
for the port.
The direct and indirect added value of the port of Rotterdam
in 2017 (last known figures) was 45.6 million euro. This represents
6.2% of Dutch gross domestic product (GDP).
INTERNATIONAL PORT DEVELOPMENT WORK AND EDUCATION
Reassessing international activitiesThe revised strategy for international activities was agreed in 2018.
With this, the Port of Rotterdam Authority is creating economic and
social value for the Netherlands and the Rijnmond region.
Participation in Pecém and Porto Central, BrazilThe Port Authority’s participation in Sohar Port and Freezone reached
15 years. In this period, Sohar has expanded to become a leading inter-
national success. In Brazil, the Port Authority has obtained shares in
the Port of Pecém, an already existing and fast-growing port in the north-
east of the country. The Port Authority has 30% of the shares, as well
as joint control over strategic decisions.
Consultancy, digital products and educationThe Port Authority has implemented various advice contracts,
including in India, Argentina, Mozambique, Latvia, Indonesia, Brazil
and Oman, including master planning, feasibility studies and port
management. Digital solutions were provided to national and inter-
national ports. In India, together with Erasmus University and the
Shipping and Transport College, we provided advice on the establish-
ment of a Maritime University. In Rotterdam, a Port Management
course saw a huge number of international participants.
Ambachtslab (Skills Lab) helps young peopleto gain work experienceThe Port of Rotterdam Authority and National Programme Rotterdam
South have established ‘Ambachtslab’. This helps young people
without employment and a diploma to find a job with companies in
the port. Young people can learn a trade during a three-month
period at companies, with the ultimate goal: a permanent job.
IT CampusTo be smartest port in the world, we need well-educated IT talent.
Technology students and Port of Rotterdam staff are trained in
digitisation at RDM Rotterdam. IT training in cyber security, cloud
engineering and the internet of things is offered at the IT Campus.
The objective is to train thousands of extra IT specialists in the
coming years as well as to enable thousands of Rotterdam primary
school pupils to become familiar with IT.
Social InnovationDeltalinqs, Vakbond CNV Vakmensen and the Port of Rotterdam
Authority are using the Rotterdam Initiative Social Innovation (RISI)
project to search for innovative ways of working in the port. Develop-
ment & learning, organising and innovation smarter by employees
are central at RISI. Concrete initiatives will be presented in 2019 with
respect to knowledge transfer, employability of older employees
and the creation of a business culture that develops social innovation.
More sustainable patrol vesselsThe Port of Rotterdam Authority’s (RPA) harbour patrol boats
started sailing partly using biodiesel (hydrotreated vegetable
oil) in 2018. This reduces CO2 emissions by 80 to 90 percent
and particulate matter emissions by 35 percent. The Port
Authority also introduced the hybrid RPA 8, which can sail on
both diesel and diesel-electric.
ESPO Award for Social InnovationThe Port of Rotterdam Authority won the 2018 ESPO Award.
According to the European Sea Ports Organisation, the Port
Authority has the best programme to transform the port
into the most attractive working environment for everyone.
ESPO values the way in which Rotterdam seeks connections
between port, city and region with respect to the labour
market, good working conditions and the relationship between
education and the business world.
Children pitch ideas for port in 2050On the Day of Sustainability, pupils from ’t Prisma primary
school in Hoogvliet presented their ideas about sustainability
in the Port of Rotterdam in 2050 to COO Ronald Paul from
the Port of Rotterdam Authority. The children had studied the
subject in depth, had devised fantastic sustainable solutions
and had developed these into an outline.
CORPORATE SOCIAL RESPONSIBILITY
Our Corporate Social Responsibility (CSR) statement
sets out what we stand for. It guides our moral
compass and defines the social issues that we focus
on and where we can make a difference.
The Port of Rotterdam Authority is involved in international
port developments as both a consultant and partner.
COAL OIL LNG
WINDENERGY
SOLAR ENERGY
NATURAL GAS
SAFE & HEALTHY ENVIRONMENT
CLIMATE & ENERGY
PEOPLE & WORK
MORAL COMPASS
CORE VALUES
LAWS AND REGULATIONS
PORT OF ROTTERDAM AUTHORITY
‘Our world is changing rapidly and pro-foundly. Global developments such as the energy and raw materials transition, digitisation and changing freight flows have far-reaching consequences for all our activities. Flexibility and adaptabilityare therefore required in the further deve- lopment and renewal of the Rotterdam port and industrial area. To maintain prosperity in our region, the Netherlands and Northwest Europe, we must create sufficient space for developments today and tomorrow. Our strategy therefore primarily focuses on innovative capacity, broadening the portfolio and enhancingthe business climate.’
In the annual report, Allard Castelein, CEO Port of Rotterdam Authority stated about 2018.
SPACE FOR TODAY AND TOMORROW
You can view the complete annual report at:www.portofrotterdam.com
These pages contain a selection of the 2018 milestones and projects within the themes that are important forthe port.
The port and work are changing fundamentally. We need
strong hands as well as smart minds if we are to remain a
vital and competitive port. That is why it is important to get
more and more people from school to work, from work to
work and back to work again.


