
HAL Id: insu-01864521https://hal-insu.archives-ouvertes.fr/insu-01864521
Submitted on 30 Aug 2018
HAL is a multi-disciplinary open accessarchive for the deposit and dissemination of sci-entific research documents, whether they are pub-lished or not. The documents may come fromteaching and research institutions in France orabroad, or from public or private research centers.
L’archive ouverte pluridisciplinaire HAL, estdestinée au dépôt et à la diffusion de documentsscientifiques de niveau recherche, publiés ou non,émanant des établissements d’enseignement et derecherche français ou étrangers, des laboratoirespublics ou privés.
Dynamics of calcium carbonate formation: geochemicalmodeling of a two-step mechanism
Arnault Lassin, Laurent André, Nicolas Devau, Adeline Lach, ThomasBeuvier, Alain Gibaud, Stéphane Gaboreau, Mohamed Azaroual
To cite this version:Arnault Lassin, Laurent André, Nicolas Devau, Adeline Lach, Thomas Beuvier, et al.. Dynamicsof calcium carbonate formation: geochemical modeling of a two-step mechanism. Geochimica etCosmochimica Acta, Elsevier, 2018, 240, pp.236-254. �10.1016/j.gca.2018.08.033�. �insu-01864521�

Accepted Manuscript
Dynamics of calcium carbonate formation: geochemical modeling of a two-stepmechanism
Arnault Lassin, Laurent André, Nicolas Devau, Adeline Lach, Thomas Beuvier,Alain Gibaud, Stéphane Gaboreau, Mohamed Azaroual
PII: S0016-7037(18)30477-0DOI: https://doi.org/10.1016/j.gca.2018.08.033Reference: GCA 10906
To appear in: Geochimica et Cosmochimica Acta
Received Date: 8 February 2018Revised Date: 17 August 2018Accepted Date: 20 August 2018
Please cite this article as: Lassin, A., André, L., Devau, N., Lach, A., Beuvier, T., Gibaud, A., Gaboreau, S., Azaroual,M., Dynamics of calcium carbonate formation: geochemical modeling of a two-step mechanism, Geochimica etCosmochimica Acta (2018), doi: https://doi.org/10.1016/j.gca.2018.08.033
This is a PDF file of an unedited manuscript that has been accepted for publication. As a service to our customerswe are providing this early version of the manuscript. The manuscript will undergo copyediting, typesetting, andreview of the resulting proof before it is published in its final form. Please note that during the production processerrors may be discovered which could affect the content, and all legal disclaimers that apply to the journal pertain.
Dynamics of calcium carbonate formation: geochemical modeling of a two-
step mechanism
Arnault Lassin1*, Laurent André1,2, Nicolas Devau1, Adeline Lach1, Thomas Beuvier3, Alain Gibaud3,
Stéphane Gaboreau1, Mohamed Azaroual1,2
1 BRGM – 3 avenue Claude Guillemin, 45100 Orléans, France
2 Université d’Orléans-CNRS/INSU-BRGM, UMR ISTO 7327, 45071 Orléans, France
3 LUNAM, Université du Maine, Institut des Molécules et Matériaux du Mans, UMR CNRS 6283 –
Avenue Olivier Messiaen, 72085 Le Mans Cedex 9, France
* Corresponding author: tel. +33 238 643 025, e-mail: [email protected]
Abstract A new kinetic model was developed based on a transition-state-theory (TST)/surface-complexation-
model (SCM) coupling. It aims to describe the successive precipitation of amorphous calcium
carbonate (ACC) and calcite, taking account of their mutual influence: ACC precipitates according to
the standard TST and creates surface complexation sites from which calcite can form and create new
surface complexation sites. When the kinetics of calcite precipitation are fast enough, the
consumption of dissolved matter leads to the re-dissolution of ACC. This model is first compared to
batch experiments (Gebauer et al., 2008) and then applied with a reactive transport calculation code
to a dynamic experiment carried out on a microfluidic device composed of a single straight channel
(Beuvier et al., 2015). The results show a good match between experiments and reactive transport
modeling. This suggests that the combination of simple experimental microfluidic devices and
reactive transport modeling could be a promising integrated methodology to study the dynamics of
geochemical reactivity at the pore scale, as a first step before application to more complex and larger
systems.
1. Introduction Understanding the mechanisms of calcium carbonate (CC) formation is a key issue because these
minerals are quasi ubiquitous in the geosphere and are involved in a number of anthropogenic
activities. A typical example concerns the geological storage of CO2 in deep aquifers where the
injection of this acid gas is known to induce chemical reactions involving the CaCO3-H2O chemical
system, and to imply issues regarding changes in hydrodynamic properties of the rock (André et al.,
2010; Gaus et al., 2005 and references therein).
1.1. Calcium carbonate formation mechanisms
Calcium carbonate formation has been studied for decades (e.g., Plummer and Busenberg, 1982),
and it is now well accepted that it results from a multistep process. It involves nucleation (either
homogeneous or heterogeneous) and crystal growth mechanisms (Morse et al., 2007).

The understanding of the process of homogeneous nucleation is still a subject under active research.
It involves a number of possible mechanisms, either successive or simultaneous. They rely on several
concepts/hypotheses including the genesis of locally dense liquid phases inside the aqueous solution,
which are organized (meta)stable clusters that may act as precursors to the formation of amorphous
calcium carbonate (ACC) nanocrystals (Cartwright et al., 2012). This ACC can be hydrated or
anhydrous (Ihli et al., 2014). Its aging generates a calcium carbonate polymorph (vaterite, aragonite,
calcite), depending on the physical and physicochemical conditions (Gebauer et al., 2008; Rodriguez-
Blanco et al., 2011; Sun et al., 2015), e.g. temperature, pressure, chemical composition of the
aqueous solution, including pH, salinity, Mg content, etc. (Blue et al., 2017; Tai and Chen, 1998;
Wolthers et al., 2012). Dehydration of ACC provides another driving force (i.e. an energetic
contribution) to orientate the crystallization process towards one particular polymorph (Ihli et al.,
2014). The stable crystalline phase may also nucleate directly from the solution, without the genesis
of cluster precursors (Nielsen et al., 2014). According to the classic nucleation theory, surface tension
plays a key role in the evolution of a nucleus although literature data on surface energies of CC
polymorphs are rather scattered and inconsistent (Aquilano et al., 1997; Bruno et al., 2013; Forbes et
al., 2011; Manoli et al., 2002; Spanos and Koutsoukos, 1998; Sun et al., 2015). It is however possible
to play with the shape of the CC precipitates by using organic molecules that modify surface tensions
(Rudloff and Cölfen, 2004) and thus the direction of growth. Laws for calculating nucleation rates can
be found in Espinosa-Marzal and Scherer (2010); Pokrovsky (1998); Steefel and Van Cappellen (1990);
and Sun et al. (2015).
Heterogeneous nucleation is often considered as a form of surface nucleation (Schott et al., 2009). It
lowers the energy demand for creating a surface from a solution as for homogeneous nucleation.
Thus, the induction time for nucleation is lowered when it can take place on an existing solid surface.
In order to favor this type of nucleation at the expense of the homogeneous nucleation, solutions can
be seeded with mineral grains that provide surfaces on which heterogeneous nucleation can take
place (Nehrke et al., 2007; Noiriel et al., 2012).
Crystal growth can result from a number of mechanisms (Spanos et al., 1998). They include epitaxial
type mechanism (Wolthers et al., 2012) according to a spiral pattern or a 2D nucleation-mediated
growth, depending on the magnitude of the supersaturation of the initial solution with respect to the
mineral (Teng et al., 2000). The kinetics of crystal growth can be described using a combination of a
surface complexation model (SCM) and the transition state theory (TST) (Pokrovsky and Schott,
2002), especially when the reaction occurs close to equilibrium. This may particularly apply when an
amorphous precursor precipitates so that the system is temporarily brought from far-from-
equilibrium to conditions close to equilibrium with calcite. SCMs of calcite surface have been
developed (Heberling et al., 2011; Pokrovsky et al., 1999; Van Cappellen et al., 1993; Wolthers et al.,
2012) and can be used in combination with adapted kinetic laws. The role of the physicochemical
conditions is also of major importance (Morse et al., 2007), including the solution stoichiometry
(Zhang and Nancollas, 1998), in addition to the saturation ratio (Schott et al., 2009). Crystal growth
can also result from attachment (De Yoreo et al., 2015) and, in some instances, oriented attachment
of nanoparticles (Zhang et al., 2014).
The different natural and lab conditions of occurrence of CC polymorphs have been studied (Morse
et al., 2007) and main factors acting on the orientation of a system to evolve towards a given CC
polymorph are identified: pH, magnitude of supersaturation, calcium vs. carbonate ratio, presence of

additives (like magnesium), temperature, etc. However, the underlying mechanisms are still not well
understood despite the major progress made in recent years (Van Driessche et al., 2017), which
highlight the role of amorphous carbonate precursors (Blue et al., 2017; Ihli et al., 2014), of the water
content in the amorphous solid (Nebel et al., 2008; Raiteri and Gale, 2010; Bushuev et al., 2015;
Albéric et al., 2018), or of the incorporation of Ca(OH)2 solid structure in the composition of
amorphous basic calcium carbonates at high pH (> 11) (Wang et al., 2017). There is still a matter of
debate, even for the physicochemical conditions of CC polymorph occurrences, and inconstancies
can be found in the literature. For instance, Tai and Chen (1998) observed experimentally that, at
24°C, vaterite is most abundant at pH < 10.5 while aragonite is most abundant at 10.5 < pH < 11.5
and calcite is most abundant at pH > 11.5. On the contrary, in the pH range 8.5-10.5, Gebauer et al.
(2008) observed experimentally that calcite is most abundant at pH < 9.5 and vaterite is most
abundant at pH > 9.5.
Of course, different natural and lab conditions have not only consequences on the nature of the
stable CC, but they lead to different precipitation kinetics of CC and of calcite in particular
(Rodriguez-Blanco et al., 2011; Spanos and Koutsoukos, 1998; Teng et al., 2000; Nielsen et al., 2014;
Carino et al., 2017).
In this context, our study is limited to pH values ranging between 8.5 and 10.5, in the Ca-Na-Cl-CO2-
H2O system, at 25°C.
1.2. Towards application to porous media
Geological environments are mostly made of porous media through which fluids percolate. The
porosity of rocks is largely due to small pores that are connected together and form complex
frameworks (Schön, 2015; Wang, 2014). When the formation of CC takes place in the porosity, it can
affect the rock hydrodynamic properties. As extensively discussed by Steefel et al. (2015), the
description of these changes can nowadays benefit from numerous microscopic characterization
methods as well as experimental microfluidic devices and numerical tools able to describe a number
of mechanisms occurring at the pore scale.
Different modelling approaches have been developed since more than 20 years. The most popular is
the Lattice-Boltzmann approach which allows a direct modelling from a particle-based technique
(Blunt et al., 2013 and references therein). This approach suits well for reactive systems and fluid
flows in complex geometries of pore spaces, fracture apertures and fracture networks (Meakin and
Tartakovsky, 2009). These models were tested on microfluidic experiments of calcite precipitation
and dissolution (Tartakovsky et al., 2008). More complex systems have also been investigated,
including biogeochemical reactions (Yoon et al., 2015; 2012), showing the growth of biofilm and
CaCO3 biomineral formation in the transverse mixing zone, and allowing the determination of their
impact on porosity (Singh et al., 2015). This transverse mixing zone is the most investigated zone
since it is the most reactive with respect to mineral precipitation. It led to substantial pore blockage
under all experimental conditions (Boyd et al., 2014; Yoon et al., 2015). It also appeared that the
pore scale suits well to catch multicomponent transport mechanisms like Coulombic effects on
transverse hydrodynamic dispersion, as studied by Rolle et al. (2013a, b) and Muniruzzaman and
Rolle (2015).
These rigorous calculation methods are often compared to more traditional ones like the continuum
approach. Continuum models represent a spatially and temporally averaged conceptualization of the

porous media that neglects the details of pore and solid geometry (Galindo-Rosales et al., 2012;
Scheibe et al., 2015). In such an approach, the domain is assumed sufficiently homogeneous so that
the fluid behavior can be modelled with averaged parameters like permeability and porosity (Noiriel
et al., 2012). Tartakovsky et al. (2008) used Darcy-scale simulations for modelling calcite precipitation
in a two-dimensional flow cell. These simulations showed that, despite violation of some constraints
related to characteristic lengths of the investigated system, local Darcy-scale advection-dispersion
equations can still capture the essential qualitative (but not quantitative) characteristics observed in
the laboratory experiments. These authors compared this continuum approach to a pore-scale model
by the means of the calculated effect of Peclet and Damkholer dimensionless numbers on the mixing-
induced calcite precipitation (Tartakovsky et al., 2009). For low Peclet and Reynolds numbers, pore-
scale models and Darcy-scale models give comparable results with errors that do not exceed 1 %.
However, discrepancies raise between the two approaches when the Peclet number increases. Errors
larger than 50 % are obtained for large Peclet numbers. In this specific case, the continuum approach
tends to over-estimate the extent of the mixing-controlled reaction zone (Acharya et al., 2007;
Tartakovsky et al., 2009).
1.3. Goals and approach
Given the above considerations, the presents work aims at proposing a kinetic model for calcite
growth after the preliminary formation of amorphous calcium carbonate (ACC). The model aims to
reconcile different observations and interpretations made in the literature. It relies on bibliographic
experimental data acquired on simple systems, so that complex cross-related effects are limited. The
kinetic model relies on a transition state theory (TST) approach, coupled to an up-to-date surface
complexation model (SCM) for calcite. The SCM is extended to ACC, the precipitation kinetics of
which partly controls that of calcite. Such an imbrication of the formation mechanisms contributes to
lower the energy barrier that has to be overcome in order to precipitate calcite. To our knowledge,
this imbricated description of the formation of calcium carbonate solids has not been modelled
within this theoretical framework so far, even though the preliminary formation of an amorphous
solid is for long considered as a way to decrease the activation energy required for the precipitation
of a better crystallized polymorph (Steefel and Van Cappellen, 1990).
Both batch and dynamic flow through systems are considered since the model intends to apply to
issues relevant to geosciences, using popular reactive transport softwares, such as PhreeqC
(Parkhurst and Appelo, 2013), Phast (Parkhurst et al., 2004), but also CrunchFlow (Steefel, 2009), and
possibly others.
2. Development of a kinetic model for calcite growth from ACC The variety of mechanisms involved in the formation of CC (see section 1.1) have inevitably led to a
number of models for dissolution/precipitation kinetic rates (Rodriguez-Blanco et al., 2011; Schott et
al., 2009; Teng et al., 2000; Wolthers et al., 2008; Wolthers et al., 2012). In the present work, we
follow the same approach as Pokrovsky and Schott (2002) and use it as a basis for new developments
since it relies on the coupling between the transition state theory (TST) and a surface complexation
model (SCM), allowing several physicochemical characteristics of the aqueous solution-solid systems
to be taken into account. In particular, the change of reactive surface area and of surface site density
is inherently accounted for during the precipitation and dissolution reactions of the different
minerals.

2.1. Selection of experimental data
The works of Gebauer et al. (2008) reveal interesting constraints on the reaction kinetics. These
authors continuously added a 0.01 M CaCl2 aqueous solution at constant flow rate into a vessel
containing a known volume of 0.01 M Na2CO3 aqueous solution. The pH was maintained constant at
stipulated values by adding a 0.01 M NaOH solution when needed. As the CaCl2 solution was added,
the concentration of free Ca+2 was continuously measured by means of a selective electrode. This
allowed accurate measurements of the time required for ACC to precipitate at various pH values
between 9 and 10 at 25°C.
In addition to these batch experiments, the dynamic experiment performed by Beuvier et al. (2015)
provided consistent complementary information. These authors co-injected two aqueous solutions
into a silicon/glass micro-channel especially developed to resist to extended operating conditions at
high temperature and high pressure (Liu et al., 2012; Marre et al., 2010, 2012; Marre and Jensen,
2010) and to allow for direct observations. So, the products of the reactions were observed directly
in the channel by applying Small-Angle and Wide-Angle X-ray Scattering (SAXS/WAXS) techniques,
using the ID02 synchrotron beamline at ESRF (Grenoble, France). The two injection solutions were
binary aqueous solutions of 10 mmol of Na2CO3/kg and 10 mmol of CaCl2/kg, respectively. Their co-
injection led to the formation of calcite in the mixing zone when the two solutions came into contact,
in the middle of the channel. Observations were made after the solutions had been injected for one
hour. As discussed later on, the fact that the microfluidic device used by Beuvier et al. (2015) is a
straight microchannel strongly simplifies hydrodynamic and multicomponent transport issues.
The experimental results obtained by Gebauer et al. (2008) during the continuous injection of a CaCl2
solution into a Na2CO3 solution suggest the possibility for the following succession of mechanisms to
occur (Figure 1). (i) The growth of ACC (assuming it is slower than nucleation at the relatively low
super-saturation levels); (ii) the simultaneous creation of ACC surface complexation sites from which
calcite starts to precipitate; (iii) the calcite growth from ACC; (iv) the creation of calcite surface
complexation sites from which it can further precipitate (i.e. grow); (v) the competitive precipitation
of calcite at the expense of ACC. Figure 1 also shows the expected evolution of free Ca2+
concentration with time, as the different mechanisms of calcium carbonate formation are triggered.

Figure 1 – Schematic representation of the successive mechanisms involved in the kinetic model for calcium
carbonate formation (in the chemical conditions of interest in this work), and unscaled evolution of the free Ca2+
concentration (heavy black curve) expected according to the different mechanisms: 1- homogeneous nucleation
of ACC and creation of ACC surface complexation sites, 2- growth of the ACC particles, heterogeneous
nucleation of calcite and creation of calcite surface complexation sites, 3- growth of calcite at the expense of
ACC, 4- disappearance of ACC and of the associated surface complexation sites, and further growth and
precipitation of calcite.
2.2. Development of the kinetic model for ACC and calcite precipitation
The general equations for dissolution and precipitation rates rn (mol·s-1 kg-1) of a mineral n, in the
framework of the transition state theory (TST), are the following (Lasaga et al., 1994):
( 1 )
where by convention, rn is positive for a dissolving mineral and changes sign for a precipitating
mineral phase; kn is the kinetic dissolution or precipitation rate coefficient (mol m-2 s-1); Sn is the
reactive surface area (m2 kg-1), and n is the saturation ratio. The two fitting parameters and
empirically describe the dependence of the reaction rate on the saturation ratio. In the present work,
the reactive surface area is assumed to vary linearly with the amount of mineral: ,
where mn is the current content of mineral (mol kg-1), Mm is the molar mass of the mineral (g mol-1),
and is the reactive surface area per unit mass (m2 g-1). The mass balance equation for ACC and
calcite dissolution, allowing for the saturation ratio is: CaCO3 = Ca2+ + CO32-, and
, where and
are the activity of Ca2+ and CO32-, respectively; and Ksp,n is the
solubility product of mineral n, i.e. ACC or calcite.

kn is expressed as a combination of kinetic coefficients which describe different elementary
mechanisms responsible for the kinetic limitations of dissolution and/or precipitation reactions. Its
general expression can be written as follows:
( 2 )
where represents the intrinsic kinetic constant related to the ith elementary mechanism; every
aij represents the activity of the aqueous species j that contributes to the ith mechanism, and the
superscript nij represents the order of this contribution. In the present case, it appeared necessary to
extend the meaning of the aij term to concentration quantities as detailed below. The superscript nu
represents the limiting mechanism acting in circum-neutral pH conditions. Ea is the activation energy
which controls the temperature dependence of the different mechanisms involved, and R is the ideal
gas constant. However, since the temperature considered in this study is 298.15 K, the Arrhenius
terms equal unity and are consequently discarded from the following equations for the sake of
clarity.
2.2.1. Amorphous calcium carbonate formation
Because of the poor crystallographic structure of ACC grains, the relative contribution of their surface
chemistry to the kinetic control of their formation cannot be clearly distinguished from other
mechanisms. The simplest approach is thus to assume that the formation of ACC grains is controlled
in a first approximation by the chemistry of the aqueous solution from which they nucleate. The
dissolution/precipitation kinetic law for ACC is therefore based on the TST calcite kinetic law
parameterized by Marty et al. (2015) for building their database of kinetic reaction rates. However,
this law must be revised for ACC since its stability, shape and specific surface area must be different
from those of calcite.
Moreover, it was found necessary to modify the precipitation rate in the alkaline domain. Indeed, the
experimental data of Gebauer et al. (2008) showed that the formation of ACC occurred faster at pH
10 than at pH 9. The relationship between this increase in precipitation rate and pH is not trivial.
Indeed, it was found in the present work that it can be linked to the evolution of “free” carbonate
and bicarbonate content in the solution. By employing the term “free”, we mean all carbon (IV)
species which are not complexed with foreign elements to the calcium-carbonate system, such as
sodium.
The resulting expression for the ACC precipitation kinetic coefficient adapted from Eq. ( 2 ) is
composed of two distinct mechanisms acting in circum-neutral (nu) and alkaline (alk) conditions,
respectively:
( 3 )
In the alkaline-domain mechanism, stands for the ion activity term in Eq. ( 2 ) and actually
represents the total concentration of free inorganic carbon species. In the present case, it is
calculated as follows given the aqueous speciation calculated using the Thermoddem
thermochemical database (Blanc et al., 2012):

The dissolution kinetic coefficient for ACC is given by Eq. ( 4 ) which is similar to the expression
selected for calcite by Marty et al. (2015) at 298.15 K:
( 4 )
The values of parameters used within the combinations of Eq. ( 1 ) with ( 3 ) and of Eq. ( 1 ) with ( 4 )
were determined/selected in the present study. They are summarized in Table 1. In particular, it can
be noted that the intrinsic kinetic constant for ACC precipitation in neutral conditions (6.0·10-8
mol·m2·s-1) is larger than the value proposed by Noiriel et al. (2012) for calcite precipitation (1.79·10-9
mol·m2·s-1), what can be expected since ACC is poorly structured compared to calcite.
The solubility product Ksp determined here for ACC is 10-7.7, which is slightly stabilizing compared to
the value of 10-7.51 proposed by Gebauer et al. (2008). Higher values (e.g., 10-6.4) have been proposed
elsewhere in the literature (Brečević and Nielsen, 1989) and highlight the difficulty in defining one
single value since homogeneous nucleation mechanisms may lead to various sizes of nuclei, with
various surface energy vs. bulk energy contributions, depending on the initial solution composition
(see section 1.1). Moreover, the polyamorphism phenomenon (Cartwright et al., 2012) or the
hydration state (Ihli et al., 2014) are other reasons that can explain significant variability in the ACC
solubility product (see section 5.1). However low, our proposed value remains consistently higher
than the solubility products of crystalline carbonate polymorphs such as vaterite (-7.9), aragonite (-
8.31) and calcite (-8.48), according to the Thermoddem database (Blanc et al., 2012).
Regarding dissolution kinetics, we used the parameters chosen for calcite by Marty et al. (2015),
based on the selection of Palandri and Kharaka (2004), for both the neutral pH-independent and the
acidic pH-dependent mechanisms. However, Schultz et al. (2013) performed surface measurements
on high surface area calcite particles (with values comprised between 14 and 17 m² g-1), and Forbes
et al. (2011) performed surface area measurements on nano-calcites (with values comprised
between 13.09 and 34.06 m² g-1, depending on the nature of the sample and on the characterization
technique). Therefore, the specific surface area of ACC is assumed to be within the average range of
these experimental data and corresponds to 30 times that of calcite, with a value of 21 m² g-1.
2.2.2. Calcite
According to the combined TST-SCM approach, the kinetic coefficients for dissolution, ,
and precipitation, , include information related to the quantity of Ca-type surface
complexation sites. For dissolution, only the calcite surface is taken into account since ACC is not
expected to coexist with calcite in dissolving conditions. On the contrary, both ACC and calcite
surfaces are taken into account for precipitation, keeping in mind that ACC is a metastable temporary
phase which is expected to re-dissolve because of the Gibbs phase rule. Following the conclusions of
Pokrovsky and Schott (1999) and Schott et al. (2009), the rate-controlling surface species in neutral
to alkaline solutions is , and the kinetic coefficient for calcite dissolution can be
written as:
( 5 )

The first term in the right-hand side of Eq. ( 5 ) represents the acid-mechanism rate-limiting
contribution since it depends on the activity of the proton, . The second term stands for the
surface contribution of calcite. The acid-mechanism term here comes from the kinetic law selected
by Marty et al. (2015) because Pokrovsky and Schott (2002) did not provide the parameters required
for a surface-controlled mechanism at low pH. In the calcite’s surface contribution term,
is the density of active surface complexation sites at
the calcite surface (in mol·m-2), where is the molality of active surface
complexation sites (in mol·kg-1), Mw is the mass of water (in kg), m(Calcite) is the current number of
moles of calcite (in mol), sCalcite is the reactive surface area of calcite (in m2·g-1), and M is the molar
mass of calcite (in g·mol-1). is the kinetic constant for the precipitation mechanism related to
calcite surface sites, in s-1. For these calculations, we chose to use the recent SCM model of Heberling
et al. (2014) because it has been shown by Li et al. (2016) to successfully describe both zeta potential
and calcite surface conductivity data.
Table 1 – Parameters for the kinetic dissolution and precipitation reaction rates of amorphous calcium carbonate (ACC) and calcite.
Amorphous Calcium Carbonate (ACC) Calcite
Parameter Value ref. Parameter Value ref.
log Ksp a -7.7 [1] log Ksp
a -8.48 [2] Surface area
(m² g-1) 21 [1] Surface area
(m² g-1) 0.7 [3] Surface site
density (sites nm-²)b 16.32 [1]
Surface site density
(sites nm-²)b 4.95 [4]
Dissolution
1.55E-06 [1] on the basis of [3]
0.024 [1]
1
0.5 [1] on the basis of [3]
0.5 [3]
1
1 1 [1] on the basis of [3] 1 [3]
1
1 Precipitation
6.0E-08 [1]
0.024 [1]
-
1 [1] on the basis of [5]
0.035 [1]
0.024 [1]
2 1 0.5 [1] on the basis of [3] 1 [4]
1 [1] 1
[1]: this work; [2]; Blanc et al. (2012); [3]: Marty et al. (2015); [4]: Pokrovsky and Schott (2002); [5]: Schott et al. (2009). a: Ksp refers to the following dissolution/precipitation reaction: CaCO3(s) Ca2+ + CO3
2-, where CaCO3(s) represents either ACC or calcite. — b: The total surface site density for calcite includes both carbonate-type and

calcium-type sites. The corresponding surface site densities on ACC are arbitrarily multiplied by a factor of 10 (see text).
As soon as the surface site density is known (see below), the total number of surface sites can be
directly calculated from the quantity of calcite present in the system. On the other hand, the relative
amount of the different surface species is given by the mass action laws related to each surface
complexation reaction. The different parameters and surface complexation reactions related to the
model of Heberling et al. (2014) are summarized in Table 2. The reactive surface area of calcite is 0.7
m² g-1 (Marty et al., 2015), which compares well with the values proposed by Forbes et al. (2011)
(0.3-0.44 m² g-1) for bulk calcite.
Assuming that the equivalent surface species on ACC is also rate-controlling for calcite precipitation,
while calcite is not expected to precipitate in acidic conditions, we obtain:
( 6 )
where
is the density of active surface complexation sites
at the ACC surface (all terms and units are similar to those for the active surface complexation sites
at the calcite surface). It plays a role during calcite precipitation only, as long as ACC is present in the
system, while is involved both in calcite dissolution and precipitation
reactions.
Surface site density is also an important property for describing surface complexation reactions. A
value of 4.95 sites nm-² (including both carbonate and calcium surface sites), which is equivalent to
8.22 µmol m-², has been proposed for the [104] calcite face (Pokrovsky and Schott, 2002; Zhang et al.,
2014). We used the corresponding value of 0.0057 mol sites/mol of mineral, multiplied by an
arbitrary factor of 10, for ACC surface site density to take account of a higher number of defects
logically expected on ACC surface compared to calcite. Despite the abundant literature on the
characterization of amorphous calcium carbonates we were unable to find relevant information to
make a better choice (some elements of discussion are given in Appendix B).
For consistency of the surface complexation model, the capacitance used in this work is 1.24 F m-² as
put forward by Li et al. (2016). This value is in relative accordance with the works of Heberling et al.
(2014; 2011) who proposed a capacitance value of 0.45 F m-² according to experimental observations
of the calcite surface by AFM.
Table 2 – Parameters values for surface complexation reactions at the calcium carbonate – water interface, at
298.15 K. The parameters 0, and K are the electrical potentials at the 0- and -planes and the equilibrium constants of the reactions, respectively (after Heberling et al., 2014; and Li et al., 2016).
Reaction log K
>CaOH-0.5 + H+ >CaOH2+0.5 0.5 1 0

>CaOH-0.5 + H+ + Cl- >CaOH2Cl-0.5 0.45 1 -1
>CaOH-0.5 + Na+ >CaOHNa+0.5 0.56 0 1
>CaOH-0.5 + Ca+2 >CaOHCa+1.5 1.68 0 2
>CaOH-0.5 + H+ + HCO3- >CaOH2HCO3
-0.5 0.54 1 -1
>CaOH-0.5 + H+ + CO3-2 >CaOH2CO3
-1.5 -6.57 1 -2
>CO3-0.5 + H+ >CO3H+0.5 -20 1 0
>CO3-0.5 + Na+ >CO3Na+0.5 0.56 0 1
>CO3-0.5 + Ca+2 >CO3Ca+1.5 1.68 0 2
3. Numerical approach
3.1. Chemical modeling
With a view to applying the model proposed above to experimental conditions other than those
considered in this study, or to other contexts, it was considered interesting to implement these
equations in a geochemical calculation code. The complexity of the combined kinetic and sorption
laws established for this study led our choice towards the PhreeqC-v3 software (Parkhurst and
Appelo, 2013) because of its robustness and its flexibility, making it easy to implement such coupled
processes.
3.2. Flow and Transport modeling
Modeling flow and transport in a microchannel is challenging because of the small size of the system
and because only one pore is considered (i.e., the microchannel) instead of a porous medium. In
practice, we opted for a grid with dimensions close to those of the experimental microchannel which
is 20 mm long and 0.5 mm wide (Figure 2). Only the height was exaggerated: 10 mm instead of 0.22
mm, the actual height of the microchannel used by Beuvier et al. (2015). This high value was used to
make numerical convergence of the calculations easier without modifying the results since no
vertically oriented mechanisms are involved in the system. This means that the system actually
comes down to a 2D simulation. The channel is discretized into 20 cells along the x-axis (1 mm-long
cells), 40 cells along the y-axis (0.0125 mm-wide cells) and 1 cell along the z-axis (10 mm-high cells).
The volume of each cell is thus 0.125 mm3. The calculation time-step is optimized in order to respect
the Courant Number, i.e. to prevent full renewal of the volume-cell during a calculation time-step.

Figure 2 – Diagram of the micro-channel used for the numerical simulations
Initially, the micro-channel is fully saturated with deionized water (i.e., numerically pure water). At
t = 0 s, two solutions are injected: the first one contains dissolved sodium carbonate (Na2CO3) and
the second contains dissolved calcium chloride (CaCl2). The concentrations of the two solutions are
10 mmol kg-1 as in the lab experiment of Beuvier et al. (2015). The Na2CO3 solution is injected in the
left part of the micro-channel (in cells 1 to 20) while the CaCl2 solution is injected in the right part (in
cells 21 to 40). As shown in Figure 2, solutions are injected in the x = 0 plane and flow along the x-
axis. The injection rate is determined by the imposed head gradient.
The initial head gradient is defined to be linear in the x-direction, ranging from 20 mm at x = 0 to 0
mm at x = 20 mm. To ensure consistency with the experiments described in Beuvier et al. (2015), the
pore flow velocity is U = 5 mm s-1 and the porosity in the micro-channel is 1. Consequently, the
resulting hydraulic conductivity given by the Darcy law is equal to 5 mm s-1. The longitudinal
dispersivity (along the x-axis) is set to 1 mm whereas it is considered as nil in the two other
directions. The effective diffusion coefficient is set to D = 10-9 m² s-1 for all dissolved species. This
value was selected because sensitivity tests showed that, with lower values, no mixing of the injected
solutions occurs along the y-axis: the two solutions were flowing in parallel along the channel
without any interaction. In addition, tests for multicomponent diffusion have been performed too
(see appendix A), showing no major effect on the behavior of the system. Consequently, we chose
1 cm heigth
(1 cell) x
y
z
2 cm length
(20 cells)
0.05 cm width
(40 cells)
x = 0
Inlet face of micro-channel
Injection of Na2CO3 solution
Injection of CaCl2 solution
Ou
tle
t fa
ce o
f m
icro
-ch
ann
el

the unique value of 10-9 m² s-1 although we are aware that this value could be optimized using
specific quantitative experiments in order to constrain the numerical model.
With the above information, one can calculate the Reynolds number (Re = UL/) and the Peclet
number (Pe = UL/D), where L is a characteristic length (m), is fluid density (kg m-3), and is the fluid
dynamic viscosity (kg m-1 s-1). In this example, Re = 2.5 which is characteristic of a laminar flow, and
Pe = 2500.
The simulations are performed according to a continuum approach using the reactive transport code
PHAST (PHREEQC And HST3D) (Parkhurst et al., 2004), which calculates multicomponent, reactive
solute transport in three-dimensional saturated groundwater systems. The flow and transport
calculations are based on a modified version of HST3D that is restricted to constant fluid density and
constant temperature (Parkhurst et al., 2004). Except the chemical considerations, different reasons
conditioned the choice for this code for transport calculations. First, the microchannel is considered
as a homogeneous medium in which a steady state flow is assumed. The flow is laminar (Re = 2.5).
The Peclet Number (Pe = 2500) is probably a little bit high for such an approach as referred to the
work of Tartakovsky et al. (2009). But according to the estimation of these authors, the excess
formation of carbonate should not exceed 20-30 % which is considered as acceptable in a first
approximation of flow and transport calculations (see discussion in section 5.5).
4. Results
4.1. Batch experiments
The coupled TST-SCM kinetic model and its related parameters were established based on the
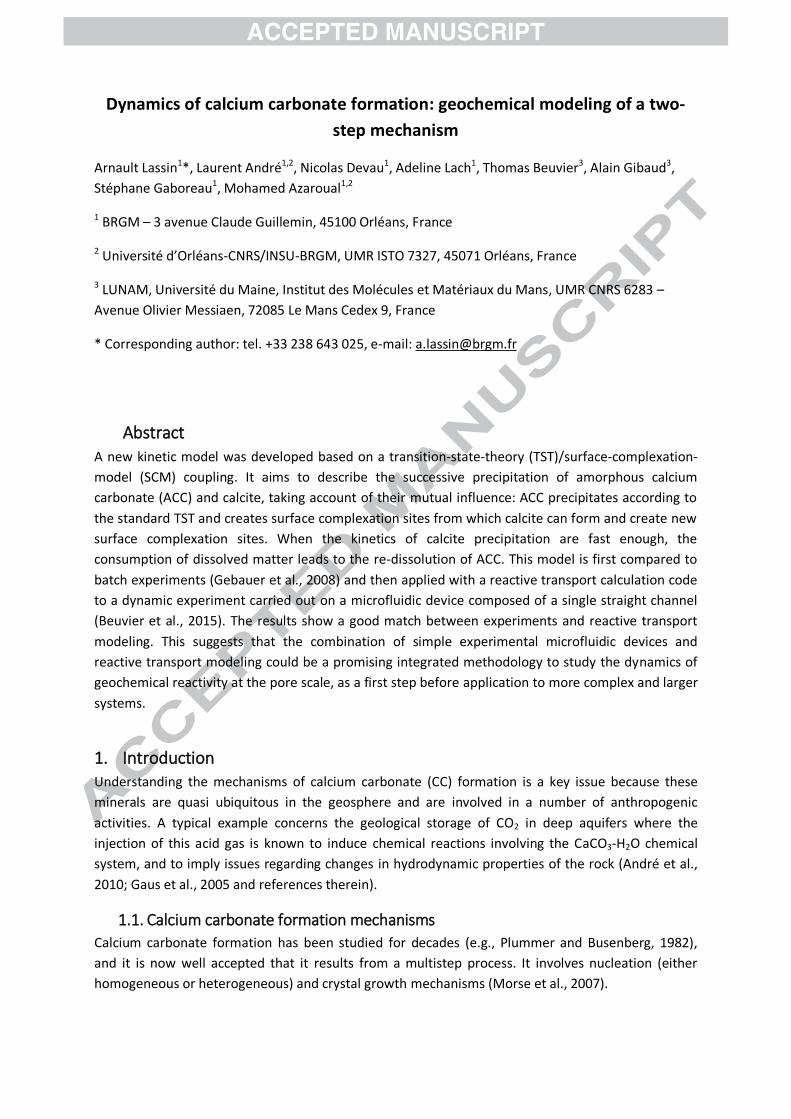
experimental work of Gebauer et al. (2008). Their experimental data and our model results for the
same conditions are compared in Figure 3. They are given in terms of the number of moles of Ca2+ in
the aqueous solution (25 g of water) as a function of time during the continuous addition of the feed
CaCl2 solution.
The shape of the concentration drop is determined by the energetic (thermodynamic) term of the
kinetic law (eq. ( 1 )) and, more specifically, by the exponents and which were found to equal 0.5
and 1, respectively. On the other hand, the time at which the “massive” precipitation of ACC occurs is
conditioned by the amount of “free” carbonate present in the solution (eq. ( 3 )). The same set of
parameters can be used to successfully describe the experimental measurements of Gebauer et al.
(2008) over the investigated range of pH values (from 9 to 10).
The results reported by Gebauer et al. (2008) suggest that the induction time for nucleation
decreases with increasing pH in the pH range [9-10]. However, it also depends on the initial
supersaturation level of the solution with respect to CC and on the composition of the solution
(Nielsen et al., 2014; Pokrovsky, 1998). Increasing (by a factor of 10) the rate of addition of the CaCl2
solution into the Na2CO3 solution at pH 9.25 leads to higher supersaturation levels. As a
consequence, the successive formation of ACC and calcite occurs within 9,000 s (150 min), the latter
crystal precipitating at the expanse of the former (Figure 4). These results are in a qualitative
agreement with the experimental observations reported above.
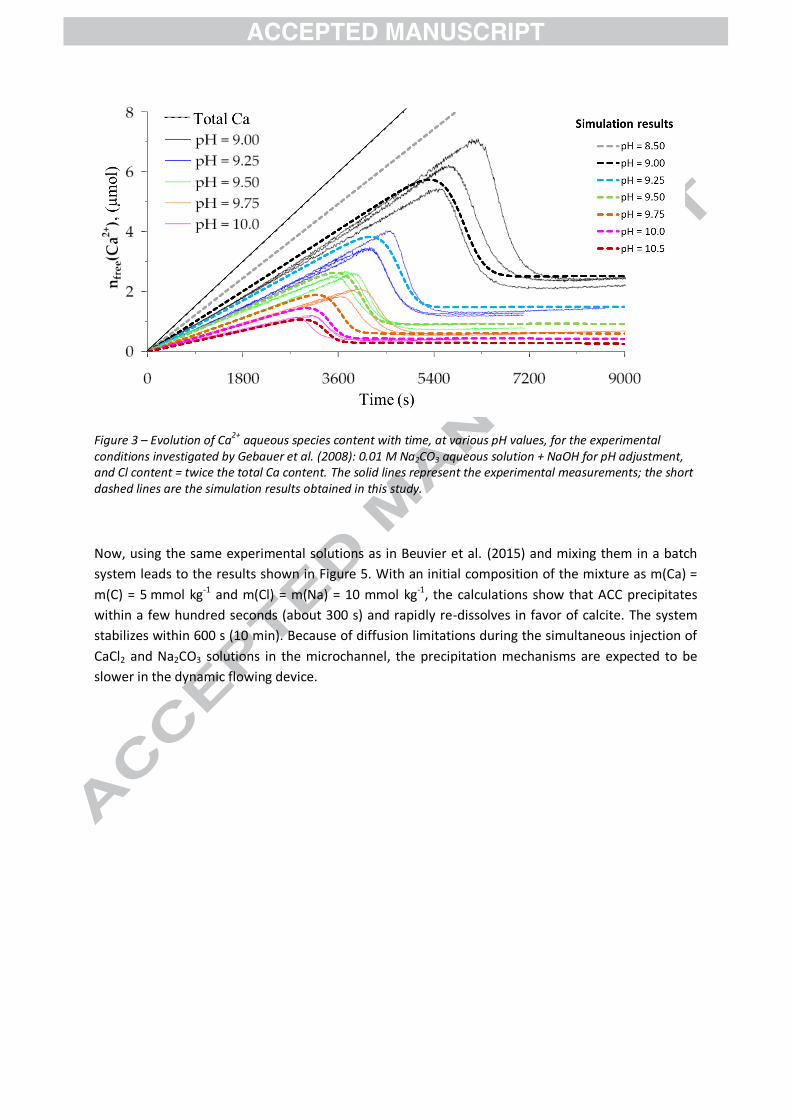
Figure 3 – Evolution of Ca2+ aqueous species content with time, at various pH values, for the experimental conditions investigated by Gebauer et al. (2008): 0.01 M Na2CO3 aqueous solution + NaOH for pH adjustment, and Cl content = twice the total Ca content. The solid lines represent the experimental measurements; the short dashed lines are the simulation results obtained in this study.
Now, using the same experimental solutions as in Beuvier et al. (2015) and mixing them in a batch
system leads to the results shown in Figure 5. With an initial composition of the mixture as m(Ca) =
m(C) = 5 mmol kg-1 and m(Cl) = m(Na) = 10 mmol kg-1, the calculations show that ACC precipitates
within a few hundred seconds (about 300 s) and rapidly re-dissolves in favor of calcite. The system
stabilizes within 600 s (10 min). Because of diffusion limitations during the simultaneous injection of
CaCl2 and Na2CO3 solutions in the microchannel, the precipitation mechanisms are expected to be
slower in the dynamic flowing device.

Figure 4 – Calculated amount of precipitated calcium carbonate over time, in the experimental conditions investigated by Gebauer et al. (2008) (dashed lines) and with a 10-fold higher addition rate of CaCl2 solution (full lines). In the first case, only ACC forms within the time interval. In the second case, ACC first precipitates and then re-dissolves as calcite precipitates in turn. The initial Na2CO3 content of the batch solution is 0.01 mol·kg
-1.
The pH is held constantly equal to 9.25 by NaOH addition. The CaCl2 content in the injection solution is 0.01 mol·kg-1.
The various experimental conditions investigated here cover a relatively wide range of conditions
encountered in the literature. They led to different values for the saturation ratio (IAP/K)1/2 from
which the massive precipitation of ACC started. These are summarized in Table 3 and have been
defined at the point of maximum Ca2+ content that can be observed in Figure 3. In the Gebauer et al.
(2008) experiments, this “induction” time for massive ACC precipitation increased from 50 to 87
minutes with decreasing pH (from 10.0 to 9.0). The corresponding saturation ratio for ACC decreased
from 1.89 to 1.60 (from 4.60 to 3.89 for calcite) while the Ca2+/CO32- molal concentration ratio
increased from 0.013 to 0.377. Further decreasing the pH of the solution, down to 8.5, increased the
induction time up to 170 minutes, decreased the saturation ratio triggering the massive ACC
precipitation, and increased the Ca2+/CO32- concentration ratio to 2.77. On the contrary, increasing
the pH to 10.5 slightly decreased the induction time (48 minutes) compared to pH 10 for which the
induction time was 50 minutes. Saturation ratios for ACC and calcite reached values of 2.01 and 4.90,
respectively, while the Ca2+/CO32- ratio did not exceed 0.008. In short, the highest supersaturation
ratio was reached for the highest pH value (in the range investigated), but at the lowest Ca
concentration (see Figure 3) at constant C concentration, according to the experimental setup.

Figure 5 – Calculated amount of precipitated calcium carbonate over time, for a 1:1 mixture of initial solutions with the same composition as the injection solutions investigated by Beuvier et al. (2015). ACC is very ephemeral and calcite forms within a few hundred seconds.
Table 3 – Calculated saturation ratios (IAP/K)1/2
with respect to ACC and calcite, Ca2+
/CO32-
molal concentration ratio and induction time corresponding to the triggering of massive ACC precipitation, in the different experimental conditions investigated in this study.
Chemical conditions Gebauer et al. experiments CaCl210 a
Beuvier et al. exp b
pH Mineral
8.5c 9 9.25 9.5 9.75 10 10.5c 9.25 10.7
(IAP/KACC)1/2 1.38 1.60 1.69 1.78 1.85 1.89 2.01 2.89 8.81
(IAP/KCalcite)1/2 3.37 3.89 4.13 4.34 4.51 4.60 4.90 7.04 21.47
(Ca2+/CO32-) 2.77 0.377 0.147 0.061 0.028 0.013 0.0075 0.536 1.39
Time (min) 170 87 68 58 52 50 48 24 0 a: corresponds to the Gebauer et al. (2008) experiment at pH 9.25, but with a CaCl2 injection rate 10 times
greater than in the actual experiment. b: corresponds to the hypothetical instantaneous perfect mixing of
the two solutions injected in the microfluidic device by Beuvier et al. (2015). c: these pH values were not
considered in Gebauer et al.(2008); these conditions are extrapolated in the present study.
When the rate of CaCl2 addition to the Na2CO3 solution was increased by a factor of 10, at pH 9.25,
the induction time was significantly reduced since it dropped down to 24 minutes. On the other
hand, the corresponding saturation ratios of ACC and calcite, and Ca2+/CO32- ratio were significantly
increased, with values of 2.89, 7.04 and 0.536, respectively.
Lastly, the perfect mixture of the CaCl2 and Na2CO3 solutions used by Beuvier et al. (2015) leads to a
very short induction time, with a maximum ACC precipitation rate reached after around 5-6 minutes.
The latter is rapidly cancelled by the very fast formation of calcite. Indeed, the initial conditions
0
0.001
0.002
0.003
0.004
0.005
0.006
0
1
2
3
4
5
6
0 1000 2000 3000 4000 5000 6000
nA
CC(µ
mo
l)
nCa
lcit
e(m
mo
l)
Time (s)
Calcite
ACC

correspond to saturation ratios as high as 8.81 for ACC and 21.47 for calcite. In addition, the
Ca2+/CO32- ratio is 1.39, a value that corresponds to the most favorable conditions for fast
precipitation kinetics, with a pH of at least 10.2 according to Nehrke et al. (2007), with all other
parameters being constant. In the present case however, the triggering of the massive ACC
precipitation (i.e., with the highest kinetic rate) occurs at pH 10.68, after 216 seconds (almost 4
minutes). On the other hand, as the pH is not constrained, its value decreases with time from 10.69
down to 9.94, once calcite has formed and replaced ACC.
4.2. Reactive transport simulations
The two solutions are both injected in parallel at the same injection rate into the micro-channel.
Using conservative ions (Cl- and Na+) as tracers, Figure 6 shows that the volume of the channel is
renewed after about 8 seconds, which is consistent with the injection rate and the length of the
channel. The first chloride ions are detected at the output of the channel after about 1.5 seconds,
according to the dispersion process along the x-axis. Because of the selected diffusion coefficient,
some mixing occurs between the two injected solutions in the center (y = 0.025 mm) of the micro-
channel.
Due to the concentration gradients between the two solutions, a mixing zone forms at the interface
of the two solutions. It looks like a prism, with the top of the prism close to the inlet, while it enlarges
towards the outlet of the micro-channel. In this prism, a concentration gradient stands between the
maximum value (defined by the concentration of one of the injected solutions) and a nil value
(defined by the concentration of the other injected solution). Figure 7 (right side) shows that
significant pH variations extend over the whole width of the channel after 60 seconds. This
apparently different behavior compared to the other solutes has to be linked to the log dimension of
this parameter.
Figure 6 – Variation of Cl concentration (left column) and Na concentration (right column) at 3 (up), 6 (middle) and 60 (bottom) seconds along the x-axis. Cl and Na concentrations in mol·kg
-1. X direction, total length = 2 cm.
Y direction, total width = 0.05 cm.
y
x
Flow direction Flow direction

Figure 7 – Variation of Ca concentration (left column) at 3, 6 and 60 seconds and pH (right column) at 1, 6 and 60 seconds along the x-axis. Ca concentrations in mol·kg-1. X direction, total length = 2 cm. Y direction, total width = 0.05 cm.
The prism zone, in the center of the channel, is the most reactive. The mixing of the two solutions
triggers the precipitation of both amorphous calcium carbonate (ACC) and calcite. The initial
concentrations of both solid phases in the kinetic block were set to 10-10 mol kg-1 (see discussion
about this parameter in section 5.3). After 60 seconds, the concentrations have multiplied by 4 for
ACC and by 16 for calcite (Figure 8). This increase is mainly located in the center of the channel
(prism zone). In the basic part of the channel (corresponding to the side of the channel where the
Na2CO3 solution is injected), the increase in the solid phase concentration is lower. First, it is located
close to the outlet of the column (beyond 5 mm) and second, the increasing factors are 3 and 2 for
ACC and calcite, respectively. In the neutral part (corresponding to the channel side where CaCl2
solution is injected), the increase factor is lower than 1.5. This result confirms the role of pH in the
precipitation process (Genovese et al., 2016).
A quantitative interpretation of the results shows that calcite is the main mineral precipitated in the
microchannel. The amounts of calcite deposits can be summed for the entire volume of the micro-
channel: a total amount of 7.0510-5 moles of calcite is obtained after one hour. During this time
period, according to the injection flow rate (25 mm3 s-1, which corresponds to a flow velocity of 5 mm
s-1), about 4.510-4 moles are injected into the micro-channel, meaning that about 17% of the injected
calcium (in moles) precipitated as calcite. The final content of ACC, which results from successive
precipitation and dissolution events, is negligible (many orders of magnitude lower than calcite). The
total number of moles of calcite can be used to determine the volume of calcite in the micro-
channel. For a molar volume of 36.9 cm3 mol-1 for calcite (Thermoddem data, Blanc et al., 2012),
about 2.5% of the channel volume is occupied by this mineral after one hour of injection. When
looking at the calcite content profile (Figure 8), it appears that most of the precipitation occurred in
the first 5 millimeters of the channel, with a maximum content of approximately 23 moles of calcite
per kg of water within the first millimeter, after one hour of injection.
Flow direction Flow direction

Figure 8 – Variation of carbonate complex (solid red lines) and calcite (solid blue lines) along the channel at time = 60 seconds (first line), 900 seconds (second line), 1800 seconds (third line) and 3600 seconds (fourth line). Left column: basic part of the channel (y = 0.000375 m), second picture: in the center of the channel (y = 0.00025 m), right picture: neutral part of the channel (y = 0.000125 m)
Given the 0.1 mm wide lateral distribution of this accumulation (Figure 9), the volume of calcite at
the entrance to the channel can be estimated at 4.210-4 cm3 (i.e. 1.1510-5 moles) in a pore volume
of 5.010-3 cm3. In other words, a little less than 10% of the first millimeter of the channel is occupied
by calcite, mostly concentrated in the center part of it. Comparison of these simulations with the
experiment is further discussed below. On the other hand, Figure 9 also highlights the asymmetric
precipitation of each solid phase. Calcite is centered with respect to the channel whereas ACC clearly
precipitates in the basic side of the channel.
0.00E+00
2.00E-10
4.00E-10
6.00E-10
8.00E-10
1.00E-09
1.20E-09
1.40E-09
1.60E-09
1.80E-09
0 0.005 0.01 0.015 0.02
Co
nce
ntr
atio
n (
mo
l/kg
w)
Channel length (m)
t = 60 s - Mid channel
Calcite
ACC
0.00E+00
5.00E-11
1.00E-10
1.50E-10
2.00E-10
2.50E-10
3.00E-10
3.50E-10
0 0.005 0.01 0.015 0.02
Co
nce
ntr
atio
n (
mo
l/kg
w)
Channel length (m)
t = 60 s - Basic pH
Calcite
ACC
0.00E+00
5.00E-11
1.00E-10
1.50E-10
2.00E-10
2.50E-10
3.00E-10
3.50E-10
0 0.005 0.01 0.015 0.02
Co
nce
ntr
atio
n (
mo
l/kg
w)
Channel length (m)
t = 60 s - Neutral pH
Calcite
ACC
0.00E+00
2.00E-09
4.00E-09
6.00E-09
8.00E-09
1.00E-08
1.20E-08
1.40E-08
1.60E-08
1.80E-08
0.00
0.50
1.00
1.50
2.00
2.50
3.00
3.50
4.00
0 0.005 0.01 0.015 0.02
Co
nce
ntr
atio
n A
CC
(m
ol/
kgw
)
Co
nce
ntr
atio
n C
alci
te (
mo
l/kg
w)
Channel length (m)
t = 900 s - Mid channel
Calcite
ACC
0.00E+00
5.00E-11
1.00E-10
1.50E-10
2.00E-10
2.50E-10
3.00E-10
0.00E+00
2.00E-09
4.00E-09
6.00E-09
8.00E-09
1.00E-08
0 0.005 0.01 0.015 0.02
Co
nce
ntr
atio
n A
CC
(m
ol/
kgw
)
Co
nce
ntr
atio
n C
alci
te (
mo
l/kg
w)
Channel length (m)
t = 900 s - Neutral pH
Calcite
ACC
0.00E+00
1.00E-09
2.00E-09
3.00E-09
4.00E-09
5.00E-09
6.00E-09
7.00E-09
8.00E-09
0.00E+00
5.00E-08
1.00E-07
1.50E-07
2.00E-07
2.50E-07
3.00E-07
3.50E-07
0 0.005 0.01 0.015 0.02
Co
nce
ntr
atio
n A
CC
(m
ol/
kgw
)
Co
nce
ntr
atio
n C
alci
te (
mo
l/kg
w)
Channel length (m)
t = 900 s - Basic pH
Calcite
ACC
0.00E+00
2.00E-09
4.00E-09
6.00E-09
8.00E-09
1.00E-08
1.20E-08
0.00
2.00
4.00
6.00
8.00
10.00
12.00
0 0.005 0.01 0.015 0.02
Co
nce
ntr
atio
n A
CC
(m
ol/
kgw
)
Co
nce
ntr
atio
n C
alci
te (
mo
l/kg
w)
Channel length (m)
t = 1800 s - Mid channel
Calcite
ACC
0.00E+00
5.00E-11
1.00E-10
1.50E-10
2.00E-10
2.50E-10
0.00E+00
2.00E-09
4.00E-09
6.00E-09
8.00E-09
1.00E-08
1.20E-08
1.40E-08
0 0.005 0.01 0.015 0.02
Co
nce
ntr
atio
n A
CC
(m
ol/
kgw
)
Co
nce
ntr
atio
n C
alci
te (
mo
l/kg
w)
Channel length (m)
t = 1800 s - Neutral pH
Calcite
ACC
0.00E+00
2.00E-09
4.00E-09
6.00E-09
8.00E-09
1.00E-08
1.20E-08
0.00E+00
2.00E-07
4.00E-07
6.00E-07
8.00E-07
1.00E-06
1.20E-06
1.40E-06
0 0.005 0.01 0.015 0.02
Co
nce
ntr
atio
n A
CC
(m
ol/
kgw
)
Co
nce
ntr
atio
n C
alci
te (
mo
l/kg
w)
Channel length (m)
t = 1800 s - Basic pH
Calcite
ACC
0.00E+00
1.00E-09
2.00E-09
3.00E-09
4.00E-09
0.00
5.00
10.00
15.00
20.00
25.00
0 0.005 0.01 0.015 0.02
Co
nce
ntr
atio
n A
CC
(m
ol/
kgw
)
Co
nce
ntr
atio
n C
alci
te (
mo
l/kg
w)
Channel length (m)
t = 3600 s - Mid channel
Calcite
ACC
0.00E+00
1.00E-11
2.00E-11
3.00E-11
4.00E-11
5.00E-11
6.00E-11
7.00E-11
8.00E-11
0.00E+00
5.00E-09
1.00E-08
1.50E-08
2.00E-08
0 0.005 0.01 0.015 0.02
Co
nce
ntr
atio
n A
CC
(m
ol/
kgw
)
Co
nce
ntr
atio
n C
alci
te (
mo
l/kg
w)
Channel length (m)
t = 3600 s - Neutral pH
Calcite
ACC
0.00E+00
2.00E-09
4.00E-09
6.00E-09
8.00E-09
1.00E-08
0.00E+00
1.00E-06
2.00E-06
3.00E-06
4.00E-06
5.00E-06
6.00E-06
0 0.005 0.01 0.015 0.02
Co
nce
ntr
atio
n A
CC
(m
ol/
kgw
)
Co
nce
ntr
atio
n C
alci
te (
mo
l/kg
w)
Channel length (m)
t = 3600 s - Basic pH
Calcite
ACC
Flow direction Flow direction Flow direction

Figure 9 – Variation of calcite (left picture) and amorphous calcium carbonate (right picture) along the channel width at time = 60 seconds (first line), 900 seconds (second line), 1800 seconds (third line) and 3600 seconds (fourth line) for three positions (x = 5, 10 and 15 mm).
0.00E+00
2.00E-10
4.00E-10
6.00E-10
8.00E-10
1.00E-09
1.20E-09
1.40E-09
1.60E-09
0 0.0001 0.0002 0.0003 0.0004 0.0005
Co
nce
ntr
atio
n C
alci
te (
mo
l/kg
w)
Channel width (m)
t = 60 s
x=0.005 m
x=0.010 m
x=0.015 m
0.00E+00
5.00E-11
1.00E-10
1.50E-10
2.00E-10
2.50E-10
3.00E-10
3.50E-10
4.00E-10
4.50E-10
5.00E-10
0 0.0001 0.0002 0.0003 0.0004 0.0005
Co
nce
ntr
atio
n A
CC
1 (
mo
l/kg
w)
Channel width (m)
t = 60 s
x = 0.005 m
x = 0.010 m
x = 0.015 m
0.00E+00
2.00E-01
4.00E-01
6.00E-01
8.00E-01
1.00E+00
1.20E+00
1.40E+00
1.60E+00
1.80E+00
2.00E+00
0 0.0001 0.0002 0.0003 0.0004 0.0005
Co
nce
ntr
atio
n C
alci
te (
mo
l/kg
w)
Channel width (m)
t = 900 s
x=0.005 m
x=0.010 m
x=0.015 m
0.00E+00
5.00E-09
1.00E-08
1.50E-08
2.00E-08
2.50E-08
0 0.0001 0.0002 0.0003 0.0004 0.0005
Co
nce
ntr
atio
n A
CC
1 (
mo
l/kg
w)
Channel width (m)
t = 900 s
x = 0.005 m
x = 0.010 m
x = 0.015 m
0.00
1.00
2.00
3.00
4.00
5.00
6.00
0 0.0001 0.0002 0.0003 0.0004 0.0005
Co
nce
ntr
atio
n C
alci
te (
mo
l/kg
w)
Channel width (m)
t = 1800 s
x=0.005 m
x=0.010 m
x=0.015 m
0.00E+00
5.00E-09
1.00E-08
1.50E-08
2.00E-08
2.50E-08
3.00E-08
3.50E-08
4.00E-08
4.50E-08
5.00E-08
0 0.0001 0.0002 0.0003 0.0004 0.0005
Co
nce
ntr
atio
n A
CC
1 (
mo
l/kg
w)
Channel width (m)
t = 1800 s
x = 0.005 m
x = 0.010 m
x = 0.015 m
0.00
2.00
4.00
6.00
8.00
10.00
12.00
14.00
0 0.0001 0.0002 0.0003 0.0004 0.0005
Co
nce
ntr
atio
n C
alci
te (
mo
l/kg
w)
Channel width (m)
t = 3600 s
x=0.005 m
x=0.010 m
x=0.015 m
0.00E+00
1.00E-08
2.00E-08
3.00E-08
4.00E-08
5.00E-08
6.00E-08
7.00E-08
8.00E-08
9.00E-08
1.00E-07
0 0.0001 0.0002 0.0003 0.0004 0.0005
Co
nce
ntr
atio
n A
CC
1 (
mo
l/kg
w)
Channel width (m)
t = 3600 s
x = 0.005 m
x = 0.010 m
x = 0.015 m

5. Discussion
5.1. About the chemical processes
The numerical modeling results (Figure 3) show that, contrary to the findings of Gebauer et al.
(2008), it is not necessary to assume that precursor structured clusters are formed to explain the
discrepancy between dosed (total) Ca and free Ca2+ concentrations in the solutions. The classic
geochemical approach that considers detailed aqueous speciation suffices to describe Gebauer et
al.’s experimental data before nucleation/formation of ACC. This result is fully consistent with the
conclusions of the recent works of Carino et al. (2017) and Henzler et al. (2018), which consider that
the linear increase of the free Ca2+ with the injection of the CaCl2 solution is not consistent with a
system dominated by large, oligomeric clusters.
Detailed description of the aqueous speciation also provides key information on the conditions for
calcium carbonate crystallization (Genovese et al., 2016). Figure 3 shows different Ca2+
concentrations in “equilibrium” with ACC according to pH, represented by the plateaus measured
after ACC formation. The experimental data (Gebauer et al., 2008) are correctly reproduced which
demonstrates that this can be explained by the pH effect on aqueous speciation and its
consequences on the solubility of ACC. This comprehensive numerical simulation thus demonstrates
that there is no need to define two different polyamorphs, as done by Gebauer et al. (2008), to
describe their experimental data. Nevertheless, issues remain when considering only one ACC. This
assumption is indeed limiting for current opinions, which suggest that polyamorphism can be a route
to initiate polymorphism. Indeed, Cartwright et al. (2012) suggest that polyamorphism of ACC is due,
in particular, to pH conditions in the case of additive-free formation conditions.
Actually, one can qualify the notion of polyamorphism according to the definition of an amorphous
state. A solid is amorphous (or glassy) if the long-range order of the atomic positions is absent
(Zallen, 1998). Such solids thus look like frozen liquids. Thermodynamic studies on silicate glasses,
but also on pharmaceutical products, showed that such solids could exhibit an infinity of
configurations, depending on the speed of cooling and of the related glass transition temperature
(Richet and Bottinga, 1984; Debenedetti and Stillinger, 2001; Graeser et al., 2010). Given the
numerous processes that can take place in aqueous systems, this suggests that, as a general rule,
amorphous solids that precipitate from aqueous solutions may exhibit a distribution of
configurations rather than one or two well-defined configurations. The range of configurations may
vary depending on the conditions like temperature, pH, supersaturation, etc. Consequently, this may
contribute to explain the difficulty to realize reproducible experiments and obtain identical
experimental data from one laboratory to another. As an illustration, the experiments of Carino et al.
(2017) only differ from those of Gebauer et al. (2008) by the rate of injection of the solutions into the
reactor: 30 µL·min-1 vs. 10 µL·min-1, respectively. However, the solubility of the ACC measured by
Carino et al. (2017) corresponds to 1.0·10-4 mol Ca2+·kg-1 at pH 9.25, while it corresponds to 5.5·10-5
mol Ca2+·kg-1 in the experiments of Gebauer et al. (2008) at the same pH. The resulting solubility
products are 10-7.52 and 10-7.70, respectively. In Carino et al. (2017), ACC massive formation occurs at
ca. 45-50 minutes, while it occurs at 72 minutes in Gebauer et al. (2008) because of the different
injection rate. The faster the formation, the less stable is the amorphous solid, as in the case of the
temperature effect on the glass transition rate: the higher the cooling rate, the higher are the glass
transition temperature and the destabilizing configurational properties (Richet and Bottinga, 1984).

Therefore, depending on the experimental conditions, some of the parameters included in the
combined SCM-TST kinetic law may vary (see appendix B).
5.2. About the kinetic rate for calcite precipitation
When the duration of the Gebauer et al. (2008) experiment is extended to 260 minutes (15,600 s) the
calcium content starts to decrease again beyond the plateau recorded experimentally until 9,000 s
(Figure 10), and stabilizes again. As illustrated in Figure 1, this additional decrease is due to calcite
precipitation since the formation of this mineral, which is more stable than ACC, tends to equilibrate
with lower concentrations of calcium (and carbon). A faster kinetic rate for calcite precipitation
would have led to an earlier decrease in Ca2+ content which is not shown by the experimental
recordings reported in Figure 3. On the other hand, we have no specific information to constrain the
lower limit of the calcite precipitation kinetic rate (see appendix B). Observation of the experimental
results obtained in Beuvier et al. (2015) suggests that the volume occupied by calcite after 1 h of
injection is rather small compared to the size of the pore channel. Because the device has been dried,
calcite is spread on the channel walls (both on the silicon and glass sides) and the coverage of the
surfaces by calcite is roughly estimated at around 30% (by image processing of pictures taken by
optical microscopy (Beuvier et al., 2015), see appendix C). According to the average dimensions of a
calcite grain as estimated in Beuvier et al. (2015), namely a parallelepiped with dimensions of 1.9, 3.7
and 4.3 µm (equivalent to a cube of 3.3 µm per side), and those of the micro-channel (470 µm wide
on average, and 220 µm high), the estimated volume occupied by calcite after one hour of injection
is about 1.5%. This rough estimate assumes the distribution of calcite is homogeneous along the
whole micro-channel, as suggested by image processing (see appendix C). Nevertheless, it allows a
comparison of the orders of magnitude of the volume percentage occupied by calcite estimated from
the experiments and estimated by numerical modeling. The latter is around 2.5% (see previous
section), which is very satisfactory and indicates that the kinetics of calcite precipitation are not
underestimated.

Figure 10 – Evolution of Ca2+ aqueous species and total Ca content with time, at pH 9.25, for extended durations beyond experimental monitoring (beyond 9000 s).
5.3. About the kinetic rate for ACC and calcite nucleation
Technically, an initial ACC and calcite content must be defined in the PhreeqC-v3 input file to initialize
the composition of the reactive surfaces and the related kinetic law for calcite
dissolution/precipitation. This means that an equivalent quantity of “seeds” for the two minerals is
initially present in the simulated system. A sensitivity analysis on the value of the initial quantity of
seeds (Figure 11) shows that the optimal initial content is 10-10 moles of calcite and ACC (heavy
dashed lines). Indeed this quantity does not artificially increase the precipitation rates compared to
an initial content of 10-11 moles (full lines), but it helps calculations to converge faster. A initial value
of 10-9 moles of calcite and ACC further stabilizes calculations. However, since both the reactive
surface areas and the number of surface complexation sites are assumed proportional to the amount
of minerals (see section 2.2), this value artificially accelerates the precipitation of both calcite and
ACC (dotted lines). These calculation results are obtained whatever the pH in the range 9.00 - 10.50
(results for initial amounts of 10-9 moles are shown for pH 9.0, 9.25 and 10.5 only).

Figure 11 – Effect of the initial content of ACC and calcite on the modelled precipitation kinetics, for various pH values.
5.4. About the chronology of events
According to the hypothesis of perfect mixing of the CaCl2 and Na2CO3 aqueous solutions used in
Beuvier et al. (2015), the successive formation of ACC and calcite can occur within several minutes
(see section 4.1 and Figure 5). On the other hand, the mixing rate or the molecular diffusion between
the two solutions in the micro-channel is fast since the concentration gradient prism is in place 6
seconds after the beginning of injection (Figure 6 and Figure 7). Therefore, the limiting rate process
during the co-injection of the two solutions in the microchannel should be chemical.
On the other hand, the rapid formation of calcite after the nucleation of ACC occurred in the batch
exercise (Figure 5) and the results of the reactive transport simulations (Figure 8 and Figure 9)
indicate that after 15 minutes (900 s), calcite is by far the most abundant mineral in the center part
of the micro-channel. This suggests that the time interval during which the relative abundance of
calcite and ACC is comparable is very short, meaning that the observation of ACC can be missed and
interpreted as the direct nucleation and growth of calcite. So, Beuvier et al. (2015) tried to track the
changes in SAXS data but failed to observe ACC.
This succession of precipitation/dissolution events can also give an interpretation of the evolution of
the reactive surface area often observed in porous media (Noiriel et al., 2009, 2012). First, the
reactive surface area is related to the amount of each solid (see Eq. (1), section 2.2). Despite this
relationship is assumed linear for each solid, the fact that their relative abundance changes with time
makes the evolution of the overall reactive surface area nonlinear with respect of the mass of
precipitated CaCO3 (regardless the crystal structure), each solid being characterized by a different
specific surface area. In addition, the surface site density being different on each solid, the number of
reactive sites varies with the surface area, and thus with the mass of each solid. Here again, this
results in an evolution of the surface reactivity of the system that cannot be described otherwise.

5.5. About flow and transport modeling
The choice of the PHAST software to model flow and transport in a microchannel is worth discussing.
Indeed, HST3D equations implemented in PHAST are based on Darcy-type flow equations (Parkhurst
et al., 2004) while a code able to solve Navier-Stokes’ or Poiseuille’s equations would be more
appropriate (see section 1.2).
However, the geometry of the microfluidic device being a straight channel, the porosity being set to
1 and the Reynolds number being about 2.5, the flow can thus be considered as laminar, with no
tortuosity and no dispersion perpendicular to the longitudinal direction. PHAST outputs for
calculations performed with no diffusion are consistent with the expected behavior observed for a
laminar flow: water moves in the micro-channel according to a “piston effect” mechanism (same flow
velocity across the entire channel width), and the solutes are transported in the flow direction, at the
flow velocity. To further evaluate the appropriateness of using PHAST, we performed some simple
additional calculations using the Navier-Stokes equation. We simulated flow rate in a microchannel
with dimensions similar to those used in the simulations made with PHAST. The partial differential
equations (PDE) were resolved using COMSOL Multiphysics®. The simulation results indicate that the
flow rate at the center of the micro-channel is equal to 6.5 mm s-1. Within a distance of 0.10 mm
away from the center, the flow rate decreases slowly down to a value of 5.5 mm s-1. Thereafter, the
decrease in the flow rate is more marked, reaching a value close to zero at the wall of the micro-
channel. These simulation results thus indicate that the flow velocity is quasi constant over
approximatively 50% of the width of the microchannel. As the majority of the chemical reactions
occur in the center of the channel (where the two solutions mix together), the simple calculations
presented above suggest that our main hypothesis of homogeneous flow rate in the micro-channel,
imposed by the use of the Darcy-like and mass transfer equations implemented in PHAST, has a
reasonably limited impact on the reactive transport modeling results.
On the other hand, the results obtained for diffusion simulations (Appendix A) show that the
microfluidic experimental device made of a single straight channel, as considered in the present
study, cannot clearly bring multicomponent diffusion effects to light. This suggests that microfluidic
devices with more complex structures, and thus non-zero tortuosity, must be used to catch
multicomponent transport mechanisms like Coulombic effects on transverse hydrodynamic
dispersion, as studied by Rolle et al. (2013a, b) and Muniruzzaman and Rolle (2015). Conversely,
these results mean that simply-structured microfluidic devices are well suited for studying chemical
processes without the disturbance of complex transport-related phenomena.
According to Sugano (2008), cited by Noiriel et al. (2012), a diffusion boundary layer of c.a. 10-30 µm
can form next to mineral grains with sizes of about or greater than 250 µm in radius, or media under
stagnant conditions. Such a diffusion layer can affect the overall dissolution/precipitation reaction
rate by diffusion control. These conditions are not met in the present work since the experimental
data we use correspond to stirred batch experiments or to flow through experiments in a straight
micro-channel, both leading to homogeneous nucleation of grain minerals that do not exceed a few
µm in size. In particular, the size of the crystallites precipitated during the flow-through experiment
of Beuvier et al. (2015) is not larger than 3-4 µm.
Furthermore, our calculation results suggest an accumulation of calcite close to the injection side in
the center part of the channel (see Figure 8 and section 4.2), with approximately 16% (i.e. 1.1510-5

moles) of the total calcite content (7.0510-5 moles) within the first millimeter of the channel. The
optical microscopy images taken during the experiments of Beuvier et al. (2015) (see appendix C)
show an overall more homogenous distribution of calcite crystals along the longitudinal axis of the
channel. However, careful observation of the image of the end of the T-junction (where the two
aqueous solutions meet each other, see Fig. 2-C-a in the appendix C) clearly reveals a darker zone
several calcite grains in diameter, in the center of the channel, which suggests a local accumulation
of calcite grains. Despite the fact that these images were taken after the micro-channel had been
dried out, and no quantification is possible here, it seems that the main features of the behavior of
the system are described by the numerical modeling. However, additional mechanisms may have
come into play and could explain the more homogeneous distribution of calcite particles along the
channel. One of these mechanisms could be the heterogeneous nucleation of calcium carbonates on
the silicon and silicate surfaces in contact with the supersaturated solution of the mixing region (Li et
al., 2014; Lioliou et al., 2007). Another mechanism that is well known in desalination technologies
and geothermal energy production wells is related to the transport and adhesion of particles (Cooper
et al., 2001; Gudipaty et al., 2011; Reed, 1989; Sefrioui et al., 2013; Shang et al., 2013). It is not
considered in the reactive transport code used in this study. Implementing these mechanisms in the
modeling would extend the region in the flow direction where calcium carbonates can precipitate. In
particular, according to the kinetic law proposed in the present work, the transport of particles would
allow the ACC grains to be carried along while growing. When large enough or when close to the
channel walls where the flow velocity is lower, the grains could slow down, adhere to the walls, keep
on growing and finally lead to calcite precipitation with a more homogeneous distribution.
6. Conclusions The new kinetic model, based on a transition-state-theory/surface-complexation-model coupling, is
able to describe the successive precipitation of amorphous calcium carbonate and calcite, taking
account of their mutual influence. This model is calibrated on literature data acquired on batch
experiments and then applied in a dynamic context. A reactive transport simulation has been carried
out to reproduce literature data obtained from a dynamic experiment on a microfluidic device. The
main outcomes of this simulation can be summarized as follows:
- the setup of a mixture/diffusion prism in the center of the microchannel,
- the major formation of calcite (compared to ACC) after 1 h of injection,
- the volume fraction of the microchannel, of a few percent, occupied by calcite after 1 h of
injection,
- the localization of the main mineral precipitations in the center part of the microchannel,
- the limited cross-related multicomponent transport mechanisms that could alter information
relative to the chemical processes.
The reaction path towards a crystalline CC polymorph as described with the combined kinetic law
proposed here is consistent with the fact that it is a pH- and supersaturation-dependent process
(supersaturation being the distance to thermodynamic equilibrium for a precipitation reaction), and
with the favorable thermodynamic pathway that lowers the energy barrier for calcite precipitation. It
is conceptually in accordance with, for instance, an ACC-to-calcite-via-vaterite crystallization
mechanism which has been observed by Rodriguez-Blanco et al. (2011, 2017) at pH > 11 and initial
CaCl2 and Na2CO3 concentrations of 1 M. Such conditions were beyond those explored in the present

work, both in terms of supersaturation, pH and ionic strength. Moreover, the kinetics of the
dissolution/precipitation mechanism of vaterite would have been required to be introduced in the
model presented here. The consideration of aragonite would also be an interesting prospect for
improving the model, extending its application, and increase the understanding of the carbonate
system.
Moreover, the composition of the aqueous solutions injected into the system resulted in pH values
ranging between 7 and 11. The proposed combined kinetic law for calcium carbonate
dissolution/precipitation applies with a relative confidence in the pH range comprised between 9 and
10.5, in dilute solutions. It was not possible to propose a completely predictive model covering the
whole range of pH values, supersaturation conditions, and chemical compositions (including, for
instance, inhibitors). Further work should therefore be carried out in order to apply the present
numerical modeling approach, coupled with dynamic experiments on microfluidic devices, to CO2
geological storage activities in deep aquifers. In particular, the kinetic law proposed here should be
extended to lower pH values and higher salinities (above that of seawater), and should consider the
role of magnesium (Blue et al., 2017), provided relevant experimental data are acquired both in
batch and dynamic systems. Indeed, the role of impurities or of inhibitors (Albéric et al., 2018) can be
implemented in the model in a quite easy way by characterizing the relevant competitive surface
complexation reactions.
The combination of experimental microfluidic devices and reactive transport modeling is now well
recognized as a promising integrated and comprehensive methodology to study mass transfers
within reactive hydrogeochemical systems at the pore scale. The present study highlights the fact
that simple geometrical configurations can provide interesting information focused on the dynamics
of chemical processes relevant to identify key steps in the successive transformations of CaCO3(s)
polymorphs. The coupled approach developed in this study requires to be improved and the priority
for further study would be to incorporate the transport and adhesion of particles, and/or
heterogeneous nucleation on the pore walls into the model. Meanwhile, additional experiments,
both on static batch and dynamic flow-through microfluidic devices, would be necessary to acquire
more quantitative data in order to cover physico-chemical conditions representative of geological
and industrial contexts.
Acknowledgements The ANR (French National Research Agency) is acknowledged for its financial support to the CGSµLab
project, grant n° CGSµLab-ANR-12-SEED-0001-02. Our thanks go to Yves Garrabos, Samuel Marre and
Carole Lecoutre from ICMCB, CNRS-Université de Bordeaux, France, who provided the Lab-on Chip
device for the experiments of Beuvier et al. (2015). Our thanks also go to Sally Ferguson who helped
improving the English of the manuscript.
References Acharya, R.C., Valocchi, A.J., Werth, C.J. and Willingham, T.W. (2007) Pore‐scale simulation of
dispersion and reaction along a transverse mixing zone in two‐dimensional porous media. Water resources research 43.

Albéric, M., Bertinetti, L., Zou, Z., Fratzl, P., Habraken, W. and Politi, Y. (2018) The crystallization of amorphous calcium carbonate is kinetically governed by ion Iimpurities and water. Advanced Science 5, 1701000.
André, L., Azaroual, M. and Menjoz, A. (2010) Numerical simulations of the thermal impact of supercritical CO2 injection on chemical reactivity in a carbonate saline reservoir. Transport in Porous Media 82, 247-274.
Aquilano, D., Rubbo, M., Catti, M. and Pavese, A. (1997) Theoretical equilibrium and growth morphology of CaCO3 polymorphs. I. Aragonite. Journal of Crystal Growth 182, 168-184.
Beuvier, T., Panduro, E.A.C., Kwasniewski, P., Marre, S., Lecoutre, C., Garrabos, Y., Aymonier, C., Calvignac, B. and Gibaud, A. (2015) Implementation of in situ SAXS/WAXS characterization into silicon/glass microreactors. Lab on a Chip 15, 2002-2008.
Blanc, P., Lassin, A., Piantone, P., Azaroual, M., Jacquemet, N., Fabbri, A. and Gaucher, E.C. (2012) Thermoddem: A geochemical database focused on low temperature water/rock interactions and waste materials. Applied Geochemistry 27, 2107-2116.
Blue, C.R., Giuffre, A., Mergelsberg, S., Han, N., De Yoreo, J.J. and Dove, P.M. (2017) Chemical and physical controls on the transformation of amorphous calcium carbonate into crystalline CaCO3 polymorphs. Geochimica et Cosmochimica Acta 196, 179-196.
Blunt, M.J., Bijeljic, B., Dong, H., Gharbi, O., Iglauer, S., Mostaghimi, P., Paluszny, A. and Pentland, C. (2013) Pore-scale imaging and modelling. Advances in Water Resources 51, 197-216.
Boyd, V., Yoon, H., Zhang, C., Oostrom, M., Hess, N., Fouke, B., Valocchi, A.J. and Werth, C.J. (2014) Influence of Mg2+ on CaCO3 precipitation during subsurface reactive transport in a homogeneous silicon-etched pore network. Geochimica et Cosmochimica Acta 135, 321-335.
Brečević, L. and Nielsen, A.E. (1989) Solubility of amorphous calcium carbonate. Journal of Crystal Growth 98, 504-510.
Bruno, M., Massaro, F.R., Pastero, L., Costa, E., Rubbo, M., Prencipe, M. and Aquilano, D. (2013) New estimates of the free energy of calcite/water interfaces for evaluating the equilibrium shape and nucleation mechanisms. Crystal Growth & Design 13, 1170-1179.
Bushuev, Y.G., Finney, A.R. and Rodger, P.M. (2015) Stability and structure of hydrated amorphous calcium carbonate. Crystal Growth & Design 15, 5269-5279.
Carino, A., Testino, A., Andalibi, M.R., Pilger, F., Bowen, P. and Ludwig, C. (2017) Thermodynamic-kinetic precipitation modeling. a case study: The amorphous calcium carbonate (ACC) precipitation pathway unravelled. Crystal Growth & Design 17, 2006-2015.
Cartwright, J.H., Checa, A.G., Gale, J.D., Gebauer, D. and Sainz‐Díaz, C.I. (2012) Calcium carbonate polyamorphism and its role in biomineralization: how many amorphous calcium carbonates are there? Angewandte Chemie International Edition 51, 11960-11970.
Cooper, K., Gupta, A. and Beaudoin, S. (2001) Simulation of the adhesion of particles to surfaces. Journal of Colloid and Interface Science 234, 284-292.
Debenedetti, P.G. and Stillinger, F.H. (2001) Supercooled liquids and the glass transition. Nature 410, 259.
De Yoreo, J.J., Gilbert, P.U., Sommerdijk, N.A., Penn, R.L., Whitelam, S., Joester, D., Zhang, H., Rimer, J.D., Navrotsky, A. and Banfield, J.F. (2015) Crystallization by particle attachment in synthetic, biogenic, and geologic environments. Science 349, aaa6760.
De Yoreo, J.J., Sommerdijk, N.A. and Dove, P.M. (2017) Nucleation pathways in electrolyte solutions, in: New perspectives on mineral nucleation and growth, A. Van Driessche, M. Kellermeier, L. Benning and D. Gebauer (Eds). Springer, pp. 1-24.
Espinosa-Marzal, R.M. and Scherer, G.W. (2010) Advances in understanding damage by salt crystallization. Accounts of Chemical Research 43, 897-905.
Forbes, T.Z., Radha, A.V. and Navrotsky, A. (2011) The energetics of nanophase calcite. Geochimica et Cosmochimica Acta 75, 7893-7905.
Galindo-Rosales, F.J., Campo-Deaño, L., Pinho, F., Van Bokhorst, E., Hamersma, P., Oliveira, M.S. and Alves, M. (2012) Microfluidic systems for the analysis of viscoelastic fluid flow phenomena in porous media. Microfluidics and nanofluidics 12, 485-498.

Gaus, I., Azaroual, M. and Czernichowski-Lauriol, I. (2005) Reactive transport modelling of the impact of CO2 injection on the clayey cap rock at Sleipner (North Sea). Chemical Geology 217, 319-337.
Gebauer, D., Völkel, A. and Cölfen, H. (2008) Stable prenucleation calcium carbonate clusters. Science 322, 1819-1822.
Genovese, D., Montalti, M., Otálora, F., Gómez-Morales, J., Sancho-Tomás, M., Falini, G. and García-Ruiz, J.M. (2016) Role of CaCO3° neutral pair in calcium carbonate crystallization. Crystal Growth & Design 16, 4173-4177.
Graeser, K.A., Patterson, J.E., Zeitler, J.A. and Rades, T. (2010) The role of configurational entropy in amorphous systems. Pharmaceutics 2, 224-244.
Gudipaty, T., Stamm, M.T., Cheung, L.S.L., Jiang, L. and Zohar, Y. (2011) Cluster formation and growth in microchannel flow of dilute particle suspensions. Microfluidics and Nanofluidics 10, 661-669.
Heberling, F., Bosbach, D., Eckhardt, J.-D., Fischer, U., Glowacky, J., Haist, M., Kramar, U., Loos, S., Müller, H.S., Neumann, T., Pust, C., Schäfer, T., Stelling, J., Ukrainczyk, M., Vinograd, V., Vučak, M. and Winkler, B. (2014) Reactivity of the calcite–water-interface, from molecular scale processes to geochemical engineering. Applied Geochemistry 45, 158-190.
Heberling, F., Trainor, T.P., Lützenkirchen, J., Eng, P., Denecke, M.A. and Bosbach, D. (2011) Structure and reactivity of the calcite–water interface. Journal of Colloid and Interface Science 354, 843-857.
Henzler, K., Fetisov, E.O., Galib, M., Baer, M.D., Legg, B.A., Borca, C., Xto, J.M., Pin, S., Fulton, J.L., Schenter, G.K., Govind, N., Siepmann, J.I., Mundy, C.J., Huthwelker, T. and De Yoreo, J.J. (2018) Supersaturated calcium carbonate solutions are classical. Science Advances 4.
Ihli, J., Wong, W.C., Noel, E.H., Kim, Y.-Y., Kulak, A.N., Christenson, H.K., Duer, M.J. and Meldrum, F.C. (2014) Dehydration and crystallization of amorphous calcium carbonate in solution and in air. Nature Communications 5.
Lasaga, A.C., Soler, J.M., Ganor, J., Burch, T.E. and Nagy, K.L. (1994) Chemical weathering rate laws and global geochemical cycles. Geochimica et Cosmochimica Acta 58, 2361-2386.
Li, Q., Fernandez-Martinez, A., Lee, B., Waychunas, G.A. and Jun, Y.-S. (2014) Interfacial energies for heterogeneous nucleation of calcium carbonate on mica and quartz. Environmental Science & Technology 48, 5745-5753.
Li, S., Leroy, P., Heberling, F., Devau, N., Jougnot, D. and Chiaberge, C. (2016) Influence of surface conductivity on the apparent zeta potential of calcite. Journal of Colloid and Interface Science 468, 262-275.
Lioliou, M.G., Paraskeva, C.A., Koutsoukos, P.G. and Payatakes, A.C. (2007) Heterogeneous nucleation and growth of calcium carbonate on calcite and quartz. Journal of Colloid and Interface Science 308, 421-428.
Liu, N., Aymonier, C., Lecoutre, C., Garrabos, Y. and Marre, S. (2012) Microfluidic approach for studying CO2 solubility in water and brine using confocal Raman spectroscopy. Chemical Physics Letters 551, 139-143.
Manoli, F., Kanakis, J., Malkaj, P. and Dalas, E. (2002) The effect of aminoacids on the crystal growth of calcium carbonate. Journal of Crystal Growth 236, 363-370.
Marre, S., Adamo, A., Basak, S., Aymonier, C. and Jensen, K.F. (2010) Design and packaging of microreactors for high pressure and high temperature applications. Industrial & Engineering Chemistry Research 49, 11310-11320.
Marre, S. and Jensen, K.F. (2010) Synthesis of micro and nanostructures in microfluidic systems. Chemical Society Reviews 39, 1183-1202.
Marre, S., Roig, Y. and Aymonier, C. (2012) Supercritical microfluidics: Opportunities in flow-through chemistry and materials science. The Journal of Supercritical Fluids 66, 251-264.
Marty, N.C.M., Claret, F., Lassin, A., Tremosa, J., Blanc, P., Madé, B., Giffaut, E., Cochepin, B. and Tournassat, C. (2015) A database of dissolution and precipitation rates for clay-rocks minerals. Applied Geochemistry 55, 108-118.
Meakin, P. and Tartakovsky, A.M. (2009) Modeling and simulation of pore‐scale multiphase fluid flow and reactive transport in fractured and porous media. Reviews of Geophysics 47.

Morse, J.W., Arvidson, R.S. and Lüttge, A. (2007) Calcium carbonate formation and dissolution. Chemical Reviews 107, 342-381.
Muniruzzaman, M. and Rolle, M. (2015) Impact of multicomponent ionic transport on pH fronts propagation in saturated porous media. Water Resources Research 51, 6739-6755.
Nebel, H., Neumann, M., Mayer, C. and Epple, M. (2008) On the structure of amorphous calcium
carbonate – A detailed study by solid-state NMR spectroscopy. Inorganic Chemistry 47, 7874-7879.
Nehrke, G., Reichart, G.J., Van Cappellen, P., Meile, C. and Bijma, J. (2007) Dependence of calcite growth rate and Sr partitioning on solution stoichiometry: Non-Kossel crystal growth. Geochimica et Cosmochimica Acta 71, 2240-2249.
Nielsen, M.H., Aloni, S. and De Yoreo, J.J. (2014) In situ TEM imaging of CaCO3 nucleation reveals coexistence of direct and indirect pathways. Science 345, 1158-1162.
Noiriel, C., Luquot, L., Madé, B., Raimbault, L., Gouze, P. and van der Lee, J. (2009) Changes in reactive surface area during limestone dissolution: An experimental and modelling study. Chemical Geology 265, 160-170.
Noiriel, C., Steefel, C.I., Yang, L. and Ajo-Franklin, J. (2012) Upscaling calcium carbonate precipitation rates from pore to continuum scale. Chemical Geology 318, 60-74.
Palandri, J.L. and Kharaka, Y.K. (2004) A compilation of rate parameters of water-mineral interaction kinetics for application to geochemical modeling. U.S. Geological Survey Open File Report 2004-1068, p. 64.
Parkhurst, D.L. and Appelo, C.A.J. (2013) Description of input and examples for PHREEQC version 3: a computer program for speciation, batch-reaction, one-dimensional transport, and inverse geochemical calculations, Techniques and Methods, Reston, VA, p. 519.
Parkhurst, D.L., Kipp, K.L., Engesgaard, P. and Charlton, S.R. (2004) PHAST--A program for simulationg ground-water flow, solute transport, and multicomponent geochemical reations. . U.S. Geological Survey Techniques and Methods 6-A8, p. 154 pages.
Pokrovsky, O.S. (1998) Precipitation of calcium and magnesium carbonates from homogeneous supersaturated solutions. Journal of Crystal Growth 186, 233-239.
Pokrovsky, O.S. and Schott, J. (1999) Processes at the magnesium-bearing carbonates/solution interface. II. kinetics and mechanism of magnesite dissolution. Geochimica et Cosmochimica Acta 63, 881-897.
Pokrovsky, O.S. and Schott, J. (2002) Surface Chemistry and dissolution kinetics of divalent metal carbonates. Environmental Science & Technology 36, 426-432.
Pokrovsky, O.S., Schott, J. and Thomas, F. (1999) Processes at the magnesium-bearing carbonates/solution interface. I. a surface speciation model for magnesite. Geochimica et Cosmochimica Acta 63, 863-880.
Raiteri, P. and Gale, J.D. (2010) Water is the key to nonclassical nucleation of amorphous calcium carbonate. Journal of the American Chemical Society 132, 17623-17634.
Reed, J. (1989) The adhesion of small particles to a surface, Particles on Surfaces 2. Springer, pp. 3-17.
Richet, P. and Bottinga, Y. (1984) Glass transitions and thermodynamic properties of amorphous SiO2, NaAlSinO2n+2 and KAlSi3O8. Geochimica et Cosmochimica Acta 48, 453-470.
Rodriguez-Blanco, J.D., Shaw, S. and Benning, L.G. (2011) The kinetics and mechanisms of amorphous calcium carbonate (ACC) crystallization to calcite, via vaterite. Nanoscale 3, 265-271.
Rodriguez-Blanco, J.D., Sand, K.K. and Benning, L.G. (2017) ACC and vaterite as intermediates in the solution-based crystallization of CaCO3, in: New perspectives on mineral nucleation and growth. Springer, A. Van Driessche, M. Kellermeier, L. Benning and D. Gebauer (Eds). Springer, pp. 93-111.
Rolle, M., Chiogna, G., Hochstetler, D.L. and Kitanidis, P.K. (2013) On the importance of diffusion and compound-specific mixing for groundwater transport: An investigation from pore to field scale. J Contam Hydrol 153, 51-68.

Rolle, M., Muniruzzaman, M., Haberer, C.M. and Grathwohl, P. (2013) Coulombic effects in advection-dominated transport of electrolytes in porous media: Multicomponent ionic dispersion. Geochimica et Cosmochimica Acta 120, 195-205.
Rudloff, J. and Cölfen, H. (2004) Superstructures of temporarily stabilized nanocrystalline CaCO3 particles: Morphological control via water surface tension variation. Langmuir 20, 991-996.
Scheibe, T.D., Perkins, W.A., Richmond, M.C., McKinley, M.I., Romero‐Gomez, P.D., Oostrom, M., Wietsma, T.W., Serkowski, J.A. and Zachara, J.M. (2015) Pore‐scale and multiscale numerical simulation of flow and transport in a laboratory‐scale column. Water Resources Research 51, 1023-1035.
Schön, J.H. (2015) Physical properties of rocks: Fundamentals and principles of petrophysics. Elsevier. Schott, J., Pokrovsky, O.S. and Oelkers, E.H. (2009) The link between mineral dissolution/precipitation
kinetics and solution chemistry. Reviews in Mineralogy and Geochemistry 70, 207-258. Schultz, L.N., Andersson, M.P., Dalby, K.N., Müter, D., Okhrimenko, D.V., Fordsmand, H. and Stipp,
S.L.S. (2013) High surface area calcite. Journal of Crystal Growth 371, 34-38. Sefrioui, N., Ahmadi, A., Omari, A. and Bertin, H. (2013) Numerical simulation of retention and
release of colloids in porous media at the pore scale. Colloids and Surfaces A: Physicochemical and Engineering Aspects 427, 33-40.
Shang, J., Liu, C. and Wang, Z. (2013) Transport and retention of engineered nanoporous particles in porous media: Effects of concentration and flow dynamics. Colloids and Surfaces A: Physicochemical and Engineering Aspects 417, 89-98.
Singh, R., Yoon, H., Sanford, R.A., Katz, L., Fouke, B.W. and Werth, C.J. (2015) Metabolism-induced CaCO3 biomineralization during reactive transport in a micromodel: implications for porosity alteration. Environmental science & technology 49, 12094-12104.
Spanos, N. and Koutsoukos, P.G. (1998) Kinetics of precipitation of calcium carbonate in alkaline pH at constant supersaturation. Spontaneous and seeded growth. The Journal of Physical Chemistry B 102, 6679-6684.
Steefel, C. (2009) CrunchFlow. Software for modeling multicomponent reactive flow and transport. User’s manual. Earth Sciences Division. Lawrence Berkeley, National Laboratory, Berkeley, CA. October, 12-91.
Steefel, C.I., Beckingham, L.E. and Landrot, G. (2015) Micro-continuum approaches for modeling pore-scale geochemical processes. Reviews in Mineralogy and Geochemistry 80, 217-246.
Steefel, C.I. and Van Cappellen, P. (1990) A new kinetic approach to modeling water-rock interaction: The role of nucleation, precursors, and Ostwald ripening. Geochimica et Cosmochimica Acta 54, 2657-2677.
Sugano, K. (2008) Theoretical comparison of hydrodynamic diffusion layer models used for dissolution simulation in drug discovery and development. International journal of pharmaceutics 363, 73-77.
Sun, W., Jayaraman, S., Chen, W., Persson, K.A. and Ceder, G. (2015) Nucleation of metastable aragonite CaCO3 in seawater. Proceedings of the National Academy of Sciences 112, 3199-3204.
Tai, C.Y. and Chen, F.B. (1998) Polymorphism of CaCO3, precipitated in a constant-composition environment. AIChE Journal 44, 1790-1798.
Tartakovsky, A.M., Redden, G., Lichtner, P.C., Scheibe, T.D. and Meakin, P. (2008) Mixing‐induced precipitation: Experimental study and multiscale numerical analysis. Water Resources Research 44.
Tartakovsky, A.M., Tartakovsky, G.D. and Scheibe, T.D. (2009) Effects of incomplete mixing on multicomponent reactive transport. Advances in Water Resources 32, 1674-1679.
Teng, H.H., Dove, P.M. and De Yoreo, J.J. (2000) Kinetics of calcite growth: surface processes and relationships to macroscopic rate laws. Geochimica et Cosmochimica Acta 64, 2255-2266.
Van Cappellen, P., Charlet, L., Stumm, W. and Wersin, P. (1993) A surface complexation model of the carbonate mineral-aqueous solution interface. Geochimica et Cosmochimica Acta 57, 3505-3518.

Van Driessche, A.E., Kellermeier, M., Benning, L.G. and Gebauer, D. (2017) New perspectives on mineral nucleation and growth: From solution precursors to solid materials. Springer.
Wang, Y. (2014) Nanogeochemistry: Nanostructures, emergent properties and their control on geochemical reactions and mass transfers. Chemical Geology 378, 1-23.
Wang, H.-W., Daemen, L.L., Cheshire, M.C., Kidder, M.K., Stack, A.G., Allard, L.F., Neuefeind, J., Olds, D., Liu, J. and Page, K. (2017) Synthesis and structure of synthetically pure and deuterated amorphous (basic) calcium carbonates. Chemical Communications 53, 2942-2945.
Wolthers, M., Charlet, L. and Van Cappellen, P. (2008) The surface chemistry of divalent metal carbonate minerals; a critical assessment of surface charge and potential data using the charge distribution multi-site ion complexation model. American Journal of Science 308, 905-941.
Wolthers, M., Nehrke, G., Gustafsson, J.P. and Van Cappellen, P. (2012) Calcite growth kinetics: Modeling the effect of solution stoichiometry. Geochimica et Cosmochimica Acta 77, 121-134.
Yoon, H., Kang, Q. and Valocchi, A.J. (2015) Lattice Boltzmann-based approaches for pore-scale reactive transport. Reviews in Mineralogy and Geochemistry 80, 393-431.
Yoon, H., Valocchi, A.J., Werth, C.J. and Dewers, T. (2012) Pore‐scale simulation of mixing‐induced calcium carbonate precipitation and dissolution in a microfluidic pore network. Water Resources Research 48.
Zhang, H., De Yoreo, J.J. and Banfield, J.F. (2014) A unified description of attachment-based crystal growth. ACS Nano 8, 6526-6530.
Zhang, J. and Nancollas, G.H. (1998) Kink density and rate of step movement during growth and dissolution of an AB crystal in a nonstoichiometric solution. Journal of Colloid and Interface Science 200, 131-145.
References in Appendices A, B and C
Appelo, C.A.J., Van Loon, L.R. and Wersin, P. (2010) Multicomponent diffusion of a suite of tracers
(HTO, Cl, Br, I, Na, Sr, Cs) in a single sample of Opalinus Clay. Geochimica et Cosmochimica Acta
74, 1201-1219.
Appelo, C.A.J. and Wersin, P. (2007) Multicomponent Diffusion Modeling in Clay Systems with
Application to the Diffusion of Tritium, Iodide, and Sodium in Opalinus Clay. Environmental
Science & Technology 41, 5002-5007.
Beuvier, T., Panduro, E.A.C., Kwasniewski, P., Marre, S., Lecoutre, C., Garrabos, Y., Aymonier, C., Calvignac, B. and Gibaud, A. (2015) Implementation of in situ SAXS/WAXS characterization into silicon/glass microreactors. Lab on a Chip 15, 2002-2008.
Carino, A., Testino, A., Andalibi, M.R., Pilger, F., Bowen, P. and Ludwig, C. (2017) Thermodynamic-Kinetic Precipitation Modeling. A Case Study: The Amorphous Calcium Carbonate (ACC) Precipitation Pathway Unravelled. Crystal Growth & Design 17, 2006-2015.
Debenedetti, P.G. and Stillinger, F.H. (2001) Supercooled liquids and the glass transition. Nature 410, 259.
Gebauer, D., Völkel, A. and Cölfen, H. (2008) Stable Prenucleation Calcium Carbonate Clusters. Science 322, 1819-1822.
Hayduk, W. and Laudie, H. (1974) Prediction of diffusion coefficients for nonelectrolytes in dilute
aqueous solutions. AIChE Journal 20, 611-615.
Parkhurst, D.L. and Appelo, C.A.J. (2013) Description of input and examples for PHREEQC version 3: a
computer program for speciation, batch-reaction, one-dimensional transport, and inverse
geochemical calculations, Techniques and Methods, Reston, VA, p. 519.
Rasouli, P., Steefel, C.I., Mayer, K.U. and Rolle, M. (2015) Benchmarks for multicomponent diffusion
and electrochemical migration. Computational Geosciences 19, 523-533.

Sternberg, S.R. (1983) Biomedical Image Processing. Computer 16, 22-34.
Sheppard, A.P., Sok, R.M. and Averdunk, H. (2004) Techniques for image enhancement and
segmentation of tomographic images of porous materials. Physica A: Statistical mechanics and
its applications 339, 145-151.


