EL PASO
COUNTY
COLORADO
EL PASO
COUNTY
COLORADO
2012 Sales Tax CollectionsAs of August 31,2012
Nicola Sapp
County Budget OfficerOctober 30, 2012
Attachment A
Budget Administration 2
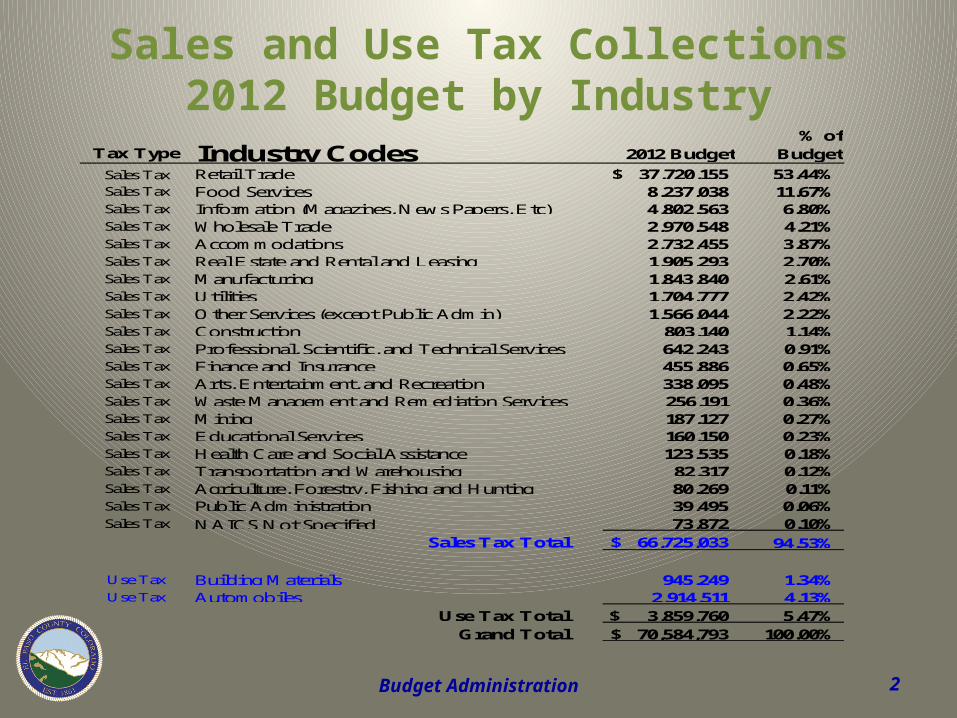
Sales and Use Tax Collections2012 Budget by Industry
Tax Type Industry CodesSales Tax Retail Trade 37,720,155$ 53.44% Sales Tax Food Services 8,237,038 11.67% Sales Tax Information (Magazines, News Papers, Etc) 4,802,563 6.80% Sales Tax Wholesale Trade 2,970,548 4.21% Sales Tax Accommodations 2,732,455 3.87% Sales Tax Real Estate and Rental and Leasing 1,905,293 2.70% Sales Tax Manufacturing 1,843,840 2.61% Sales Tax Utilities 1,704,777 2.42% Sales Tax Other Services (except Public Admin) 1,566,044 2.22% Sales Tax Construction 803,140 1.14% Sales Tax Professional, Scientific, and Technical Services 642,243 0.91% Sales Tax Finance and Insurance 455,886 0.65% Sales Tax Arts, Entertainment, and Recreation 338,095 0.48% Sales Tax Waste Management and Remediation Services 256,191 0.36% Sales Tax Mining 187,127 0.27% Sales Tax Educational Services 160,150 0.23% Sales Tax Health Care and Social Assistance 123,535 0.18% Sales Tax Transportation and Warehousing 82,317 0.12% Sales Tax Agriculture, Forestry, Fishing and Hunting 80,269 0.11% Sales Tax Public Administration 39,495 0.06% Sales Tax NAICS Not Specified 73,872 0.10%
Sales Tax Total 66,725,033$ 94.53%
Use Tax Building Materials 945,249 1.34% Use Tax Automobiles 2,914,511 4.13%
Use Tax Total 3,859,760$ 5.47% Grand Total 70,584,793$ 100.00%
2012 Budget% of
Budget

Budget Administration 3
Retail Historical ComparisonAs of August 31, 2012
2007 2008 2009 2010 2011 2012% Chg
'07 to '08% Chg
'08 to '09% Chg
'09 to '10% Chg
'10 to '11% Chg
'11 to '12
Cumulative % Chg
'07 to '12
Cumulative % Chg
'11 to '12
January 2,673,625 2,596,224 2,375,134 2,316,376 2,493,010 2,760,731 (2.90%) (8.52%) (2.47%) 7.63% 10.74% 3.26% 10.74%
February 2,697,395 2,725,955 2,456,929 2,561,683 2,854,283 2,918,194 1.06% (9.87%) 4.26% 11.42% 2.24% 5.73% 6.20%
March 3,036,516 3,039,085 2,734,633 2,874,172 3,113,723 2,993,879 0.08% (10.02%) 5.10% 8.33% (3.85%) 3.16% 2.50%
April 2,863,589 2,832,890 2,490,665 2,698,774 2,976,064 3,499,619 (1.07%) (12.08%) 8.36% 10.27% 17.59% 8.00% 6.43%
May 3,067,621 3,101,106 2,942,163 3,038,978 3,094,359 3,384,424 1.09% (5.13%) 3.29% 1.82% 9.37% 8.50% 7.06%
June 3,294,218 3,242,390 3,111,760 3,155,333 3,345,943 3,478,511 (1.57%) (4.03%) 1.40% 6.04% 3.96% 7.95% 6.48%
July 3,106,378 2,951,800 2,869,759 3,108,714 3,154,783 3,376,518 (4.98%) (2.78%) 8.33% 1.48% 7.03% 8.06% 6.56%
August 3,104,475 3,055,854 2,947,631 3,163,934 3,168,387 3,480,509 (1.57%) (3.54%) 7.34% 0.14% 9.85% 8.59% 6.99%
September 3,334,738 2,837,891 2,812,915 2,998,081 3,162,259 (14.90%) (0.88%) 6.58% 5.48%
October 3,031,130 2,689,121 2,615,472 2,939,411 2,947,723 (11.28%) (2.74%) 12.39% 0.28%
November 3,080,544 2,889,581 2,861,290 3,098,170 3,133,421 (6.20%) (0.98%) 8.28% 1.14%
December 4,005,099 3,563,724 3,623,459 3,944,361 3,962,534 (11.02%) 1.68% 8.86% 0.46%
Year Total 37,295,328 35,525,621 33,841,812 35,897,986 37,406,489 25,892,385 (4.75%) (4.74%) 6.08% 4.20% 6.99% 8.59% 6.99%
Budget Administration 4
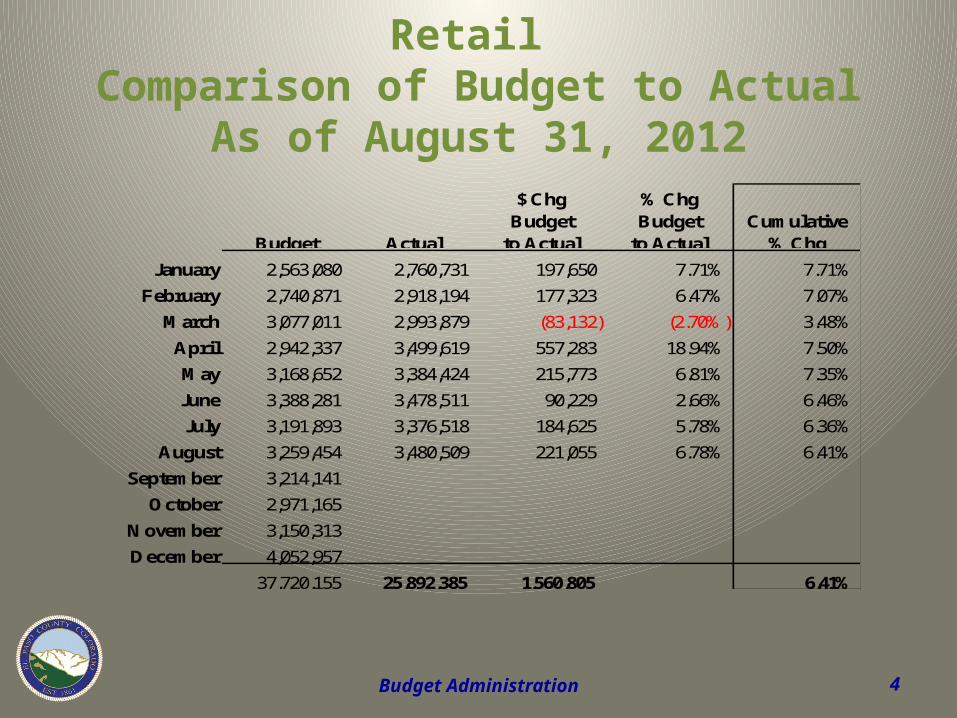
Retail Comparison of Budget to Actual
As of August 31, 2012
Budget Actual
$ Chg Budget
to Actual
% Chg Budget
to ActualCumulative
% Chg
January 2,563,080 2,760,731 197,650 7.71% 7.71%
February 2,740,871 2,918,194 177,323 6.47% 7.07%
March 3,077,011 2,993,879 (83,132) (2.70%) 3.48%
April 2,942,337 3,499,619 557,283 18.94% 7.50%
May 3,168,652 3,384,424 215,773 6.81% 7.35%
June 3,388,281 3,478,511 90,229 2.66% 6.46%
July 3,191,893 3,376,518 184,625 5.78% 6.36%
August 3,259,454 3,480,509 221,055 6.78% 6.41%
September 3,214,141
October 2,971,165
November 3,150,313
December 4,052,957
37,720,155 25,892,385 1,560,805 6.41%

Budget Administration 5
Food Services Historical ComparisonAs of August 31, 2012
2007 2008 2009 2010 2011 2012% Chg
'07 to '08% Chg
'08 to '09% Chg
'09 to '10% Chg
'10 to '11% Chg
'11 to '12
Cumulative % Chg
'07 to '12
Cumulative % Chg
'11 to '12
January 509,199 550,823 538,050 585,385 586,990 657,296 8.17% (2.32%) 8.80% 0.27% 11.98% 29.08% 11.98%
February 540,600 557,561 562,962 590,274 632,272 705,527 3.14% 0.97% 4.85% 7.12% 11.59% 29.82% 11.77%
March 640,009 673,883 663,369 691,477 742,376 696,879 5.29% (1.56%) 4.24% 7.36% (6.13%) 21.89% 5.00%
April 564,415 661,777 607,507 637,952 697,608 812,135 17.25% (8.20%) 5.01% 9.35% 16.42% 27.40% 7.99%
May 626,621 677,202 714,628 731,314 738,165 796,062 8.07% 5.53% 2.33% 0.94% 7.84% 27.32% 7.96%
June 705,395 713,705 698,558 737,573 763,054 806,511 1.18% (2.12%) 5.59% 3.45% 5.70% 24.77% 7.55%
July 647,457 694,377 694,083 734,668 765,936 793,008 7.25% (0.04%) 5.85% 4.26% 3.53% 24.42% 6.92%
August 651,782 702,930 710,906 711,144 727,169 794,850 7.85% 1.13% 0.03% 2.25% 9.31% 24.09% 7.23%
September 655,247 669,648 679,015 675,855 696,510 2.20% 1.40% (0.47%) 3.06%
October 618,222 658,299 669,939 695,527 724,750 6.48% 1.77% 3.82% 4.20%
November 570,329 568,222 565,860 612,715 644,415 (0.37%) (0.42%) 8.28% 5.17%
December 663,824 611,756 658,238 666,889 688,396 (7.84%) 7.60% 1.31% 3.22%
Year Total 7,393,100 7,740,184 7,763,114 8,070,771 8,407,642 6,062,268 4.69% 0.30% 3.96% 4.17% 7.23% 24.09% 7.23%
Budget Administration 6
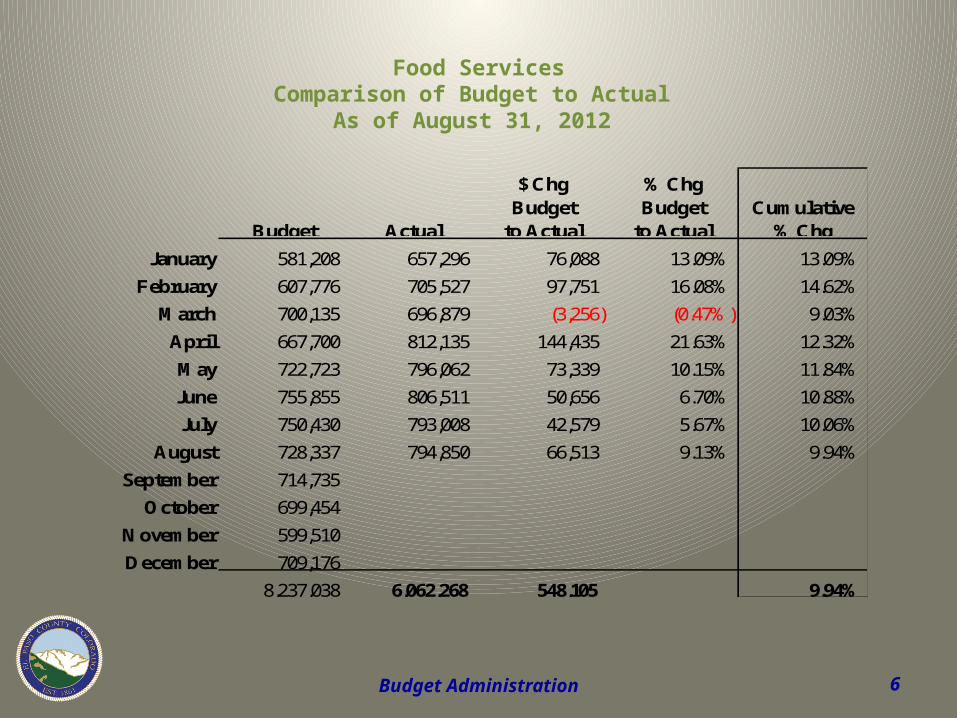
Food ServicesComparison of Budget to Actual
As of August 31, 2012
Budget Actual
$ Chg Budget
to Actual
% Chg Budget
to ActualCumulative
% Chg
January 581,208 657,296 76,088 13.09% 13.09%
February 607,776 705,527 97,751 16.08% 14.62%
March 700,135 696,879 (3,256) (0.47%) 9.03%
April 667,700 812,135 144,435 21.63% 12.32%
May 722,723 796,062 73,339 10.15% 11.84%
June 755,855 806,511 50,656 6.70% 10.88%
July 750,430 793,008 42,579 5.67% 10.06%
August 728,337 794,850 66,513 9.13% 9.94%
September 714,735
October 699,454
November 599,510
December 709,176
8,237,038 6,062,268 548,105 9.94%

Budget Administration 7
Information (Magazines, Newspapers, Etc.)Historical ComparisonAs of August 31, 2012
2007 2008 2009 2010 2011 2012% Chg
'07 to '08% Chg
'08 to '09% Chg
'09 to '10% Chg
'10 to '11% Chg
'11 to '12
Cumulative % Chg
'07 to '12
Cumulative % Chg
'11 to '12
January 365,215 367,870 393,322 355,082 256,363 325,416 0.73% 6.92% (9.72%) (27.80%) 26.94% (10.90%) 26.94%
February 347,550 362,758 375,750 373,274 351,713 351,114 4.38% 3.58% (0.66%) (5.78%) (0.17%) (5.08%) 11.26%
March 367,113 371,904 426,143 467,257 378,091 337,880 1.30% 14.58% 9.65% (19.08%) (10.64%) (6.06%) 2.86%
April 441,600 399,484 393,054 386,043 457,407 359,180 (9.54%) (1.61%) (1.78%) 18.49% (21.47%) (9.72%) (4.85%)
May 360,434 361,921 406,312 426,463 366,712 357,375 0.41% 12.27% 4.96% (14.01%) (2.55%) (8.02%) (4.38%)
June 357,140 415,249 385,870 403,633 374,941 368,435 16.27% (7.08%) 4.60% (7.11%) (1.74%) (6.24%) (3.93%)
July 359,141 394,689 420,625 403,323 356,773 384,808 9.90% 6.57% (4.11%) (11.54%) 7.86% (4.39%) (2.27%)
August 356,597 414,428 394,573 383,493 283,983 375,827 16.22% (4.79%) (2.81%) (25.95%) 32.34% (3.21%) 1.20%
September 374,117 406,675 383,425 375,089 357,971 8.70% (5.72%) (2.17%) (4.56%)
October 367,365 407,928 385,662 373,241 359,073 11.04% (5.46%) (3.22%) (3.80%)
November 392,268 396,493 380,236 367,544 349,460 1.08% (4.10%) (3.34%) (4.92%)
December 402,595 421,630 418,669 379,070 375,680 4.73% (0.70%) (9.46%) (0.89%)
Year Total 4,491,136 4,721,029 4,763,640 4,693,512 4,268,166 2,860,035 5.12% 0.90% (1.47%) (9.06%) 1.20% (3.21%) 1.20%
Budget Administration 8
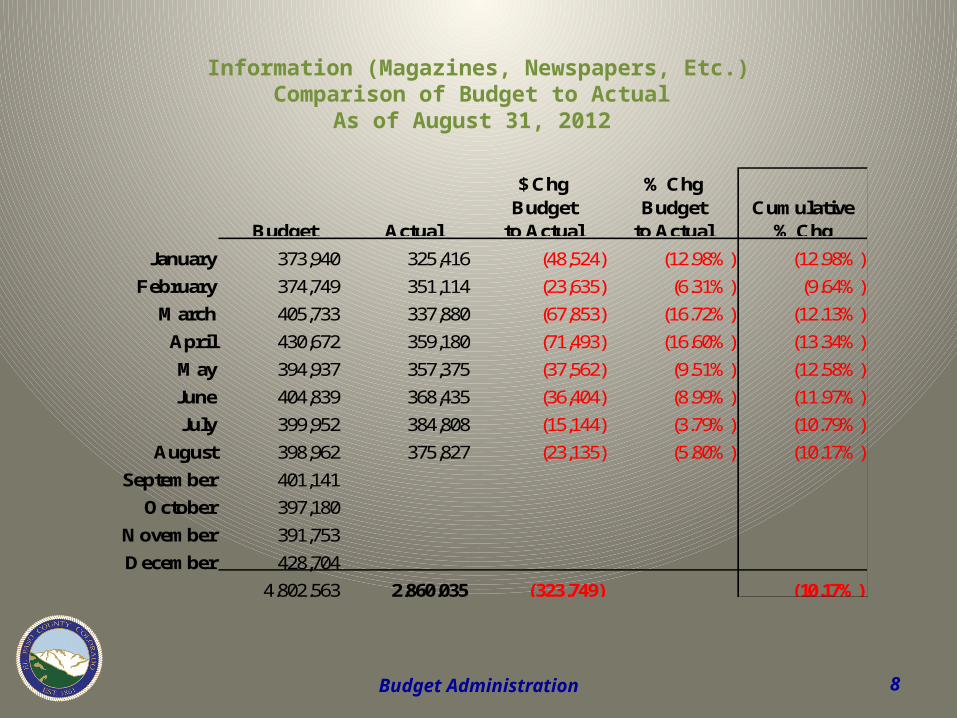
Information (Magazines, Newspapers, Etc.)Comparison of Budget to Actual
As of August 31, 2012
Budget Actual
$ Chg Budget
to Actual
% Chg Budget
to ActualCumulative
% Chg
January 373,940 325,416 (48,524) (12.98%) (12.98%)
February 374,749 351,114 (23,635) (6.31%) (9.64%)
March 405,733 337,880 (67,853) (16.72%) (12.13%)
April 430,672 359,180 (71,493) (16.60%) (13.34%)
May 394,937 357,375 (37,562) (9.51%) (12.58%)
June 404,839 368,435 (36,404) (8.99%) (11.97%)
July 399,952 384,808 (15,144) (3.79%) (10.79%)
August 398,962 375,827 (23,135) (5.80%) (10.17%)
September 401,141
October 397,180
November 391,753
December 428,704
4,802,563 2,860,035 (323,749) (10.17%)
Budget Administration 9
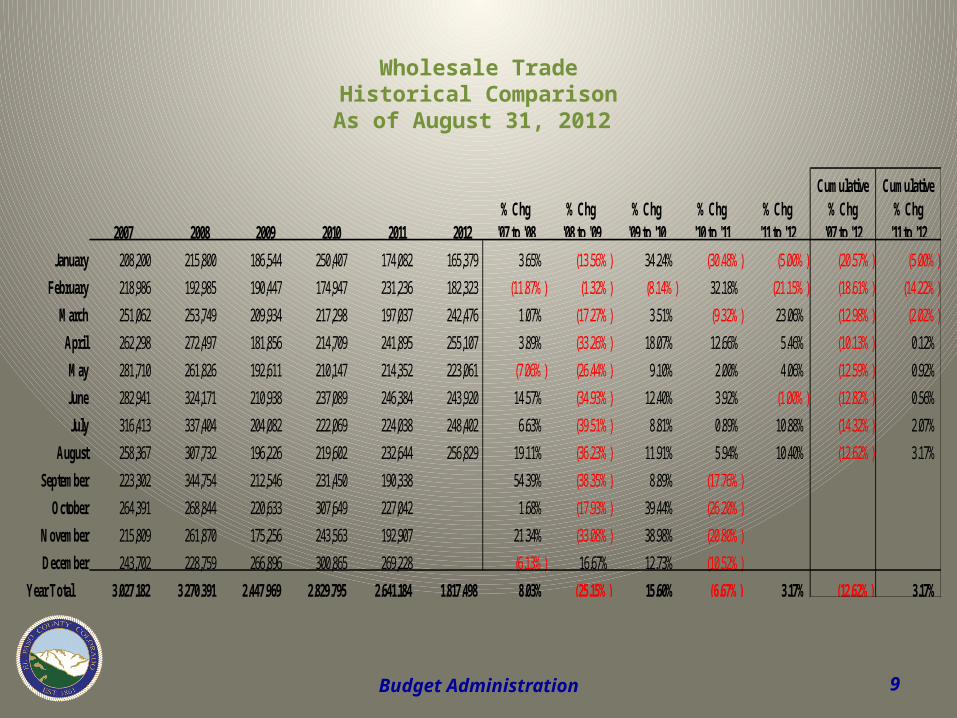
Wholesale TradeHistorical ComparisonAs of August 31, 2012
2007 2008 2009 2010 2011 2012% Chg
'07 to '08% Chg
'08 to '09% Chg
'09 to '10% Chg
'10 to '11% Chg
'11 to '12
Cumulative % Chg
'07 to '12
Cumulative % Chg
'11 to '12
January 208,200 215,800 186,544 250,407 174,082 165,379 3.65% (13.56%) 34.24% (30.48%) (5.00%) (20.57%) (5.00%)
February 218,986 192,985 190,447 174,947 231,236 182,323 (11.87%) (1.32%) (8.14%) 32.18% (21.15%) (18.61%) (14.22%)
March 251,062 253,749 209,934 217,298 197,037 242,476 1.07% (17.27%) 3.51% (9.32%) 23.06% (12.98%) (2.02%)
April 262,298 272,497 181,856 214,709 241,895 255,107 3.89% (33.26%) 18.07% 12.66% 5.46% (10.13%) 0.12%
May 281,710 261,826 192,611 210,147 214,352 223,061 (7.06%) (26.44%) 9.10% 2.00% 4.06% (12.59%) 0.92%
June 282,941 324,171 210,938 237,089 246,384 243,920 14.57% (34.93%) 12.40% 3.92% (1.00%) (12.82%) 0.56%
July 316,413 337,404 204,082 222,069 224,038 248,402 6.63% (39.51%) 8.81% 0.89% 10.88% (14.32%) 2.07%
August 258,367 307,732 196,226 219,602 232,644 256,829 19.11% (36.23%) 11.91% 5.94% 10.40% (12.62%) 3.17%
September 223,302 344,754 212,546 231,450 190,338 54.39% (38.35%) 8.89% (17.76%)
October 264,391 268,844 220,633 307,649 227,042 1.68% (17.93%) 39.44% (26.20%)
November 215,809 261,870 175,256 243,563 192,907 21.34% (33.08%) 38.98% (20.80%)
December 243,702 228,759 266,896 300,865 269,228 (6.13%) 16.67% 12.73% (10.52%)
Year Total 3,027,182 3,270,391 2,447,969 2,829,795 2,641,184 1,817,498 8.03% (25.15%) 15.60% (6.67%) 3.17% (12.62%) 3.17%
Budget Administration 10
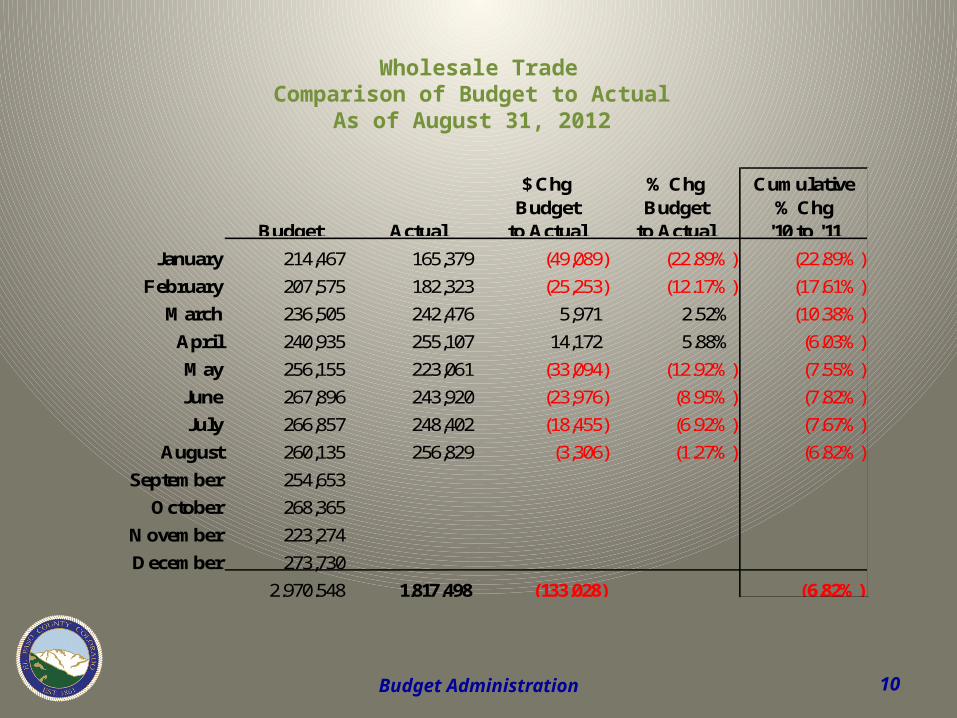
Wholesale TradeComparison of Budget to Actual
As of August 31, 2012
Budget Actual
$ Chg Budget
to Actual
% Chg Budget
to Actual
Cumulative % Chg
'10 to '11
January 214,467 165,379 (49,089) (22.89%) (22.89%)
February 207,575 182,323 (25,253) (12.17%) (17.61%)
March 236,505 242,476 5,971 2.52% (10.38%)
April 240,935 255,107 14,172 5.88% (6.03%)
May 256,155 223,061 (33,094) (12.92%) (7.55%)
June 267,896 243,920 (23,976) (8.95%) (7.82%)
July 266,857 248,402 (18,455) (6.92%) (7.67%)
August 260,135 256,829 (3,306) (1.27%) (6.82%)
September 254,653
October 268,365
November 223,274
December 273,730
2,970,548 1,817,498 (133,028) (6.82%)
Budget Administration 11
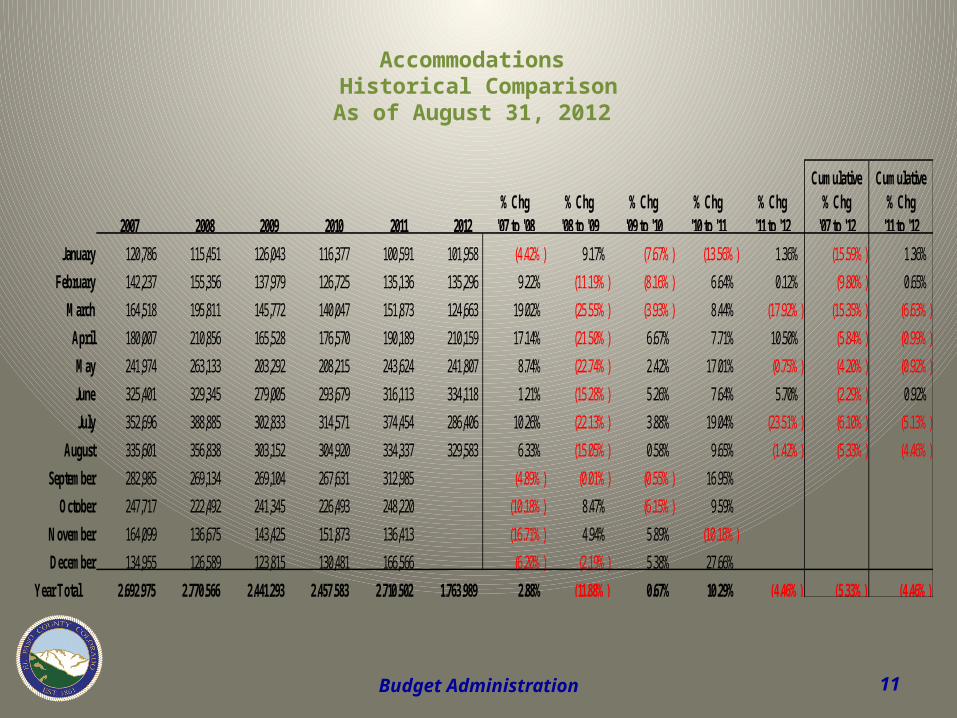
Accommodations Historical ComparisonAs of August 31, 2012
2007 2008 2009 2010 2011 2012% Chg
'07 to '08% Chg
'08 to '09% Chg
'09 to '10% Chg
'10 to '11% Chg
'11 to '12
Cumulative % Chg
'07 to '12
Cumulative % Chg
'11 to '12
January 120,786 115,451 126,043 116,377 100,591 101,958 (4.42%) 9.17% (7.67%) (13.56%) 1.36% (15.59%) 1.36%
February 142,237 155,356 137,979 126,725 135,136 135,296 9.22% (11.19%) (8.16%) 6.64% 0.12% (9.80%) 0.65%
March 164,518 195,811 145,772 140,047 151,873 124,663 19.02% (25.55%) (3.93%) 8.44% (17.92%) (15.35%) (6.63%)
April 180,007 210,856 165,528 176,570 190,189 210,159 17.14% (21.50%) 6.67% 7.71% 10.50% (5.84%) (0.99%)
May 241,974 263,133 203,292 208,215 243,624 241,807 8.74% (22.74%) 2.42% 17.01% (0.75%) (4.20%) (0.92%)
June 325,401 329,345 279,005 293,679 316,113 334,118 1.21% (15.28%) 5.26% 7.64% 5.70% (2.29%) 0.92%
July 352,696 388,885 302,833 314,571 374,454 286,406 10.26% (22.13%) 3.88% 19.04% (23.51%) (6.10%) (5.13%)
August 335,601 356,838 303,152 304,920 334,337 329,583 6.33% (15.05%) 0.58% 9.65% (1.42%) (5.33%) (4.46%)
September 282,985 269,134 269,104 267,631 312,985 (4.89%) (0.01%) (0.55%) 16.95%
October 247,717 222,492 241,345 226,493 248,220 (10.18%) 8.47% (6.15%) 9.59%
November 164,099 136,675 143,425 151,873 136,413 (16.71%) 4.94% 5.89% (10.18%)
December 134,955 126,589 123,815 130,481 166,566 (6.20%) (2.19%) 5.38% 27.66%
Year Total 2,692,975 2,770,566 2,441,293 2,457,583 2,710,502 1,763,989 2.88% (11.88%) 0.67% 10.29% (4.46%) (5.33%) (4.46%)
Budget Administration 12
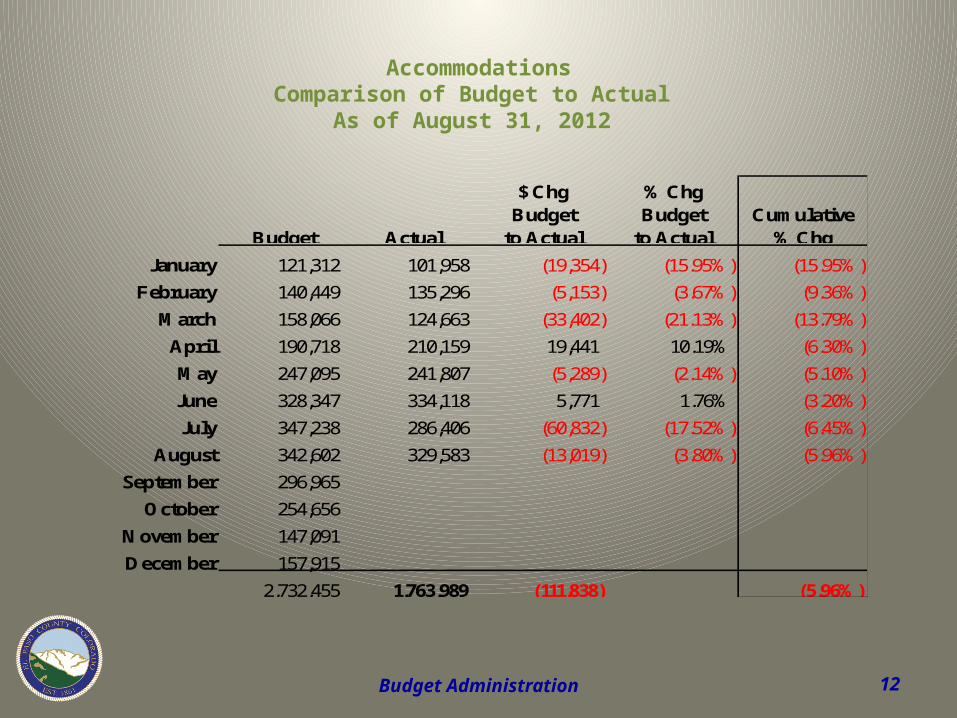
AccommodationsComparison of Budget to Actual
As of August 31, 2012
Budget Actual
$ Chg Budget
to Actual
% Chg Budget
to ActualCumulative
% Chg
January 121,312 101,958 (19,354) (15.95%) (15.95%)
February 140,449 135,296 (5,153) (3.67%) (9.36%)
March 158,066 124,663 (33,402) (21.13%) (13.79%)
April 190,718 210,159 19,441 10.19% (6.30%)
May 247,095 241,807 (5,289) (2.14%) (5.10%)
June 328,347 334,118 5,771 1.76% (3.20%)
July 347,238 286,406 (60,832) (17.52%) (6.45%)
August 342,602 329,583 (13,019) (3.80%) (5.96%)
September 296,965
October 254,656
November 147,091
December 157,915
2,732,455 1,763,989 (111,838) (5.96%)
Budget Administration 13
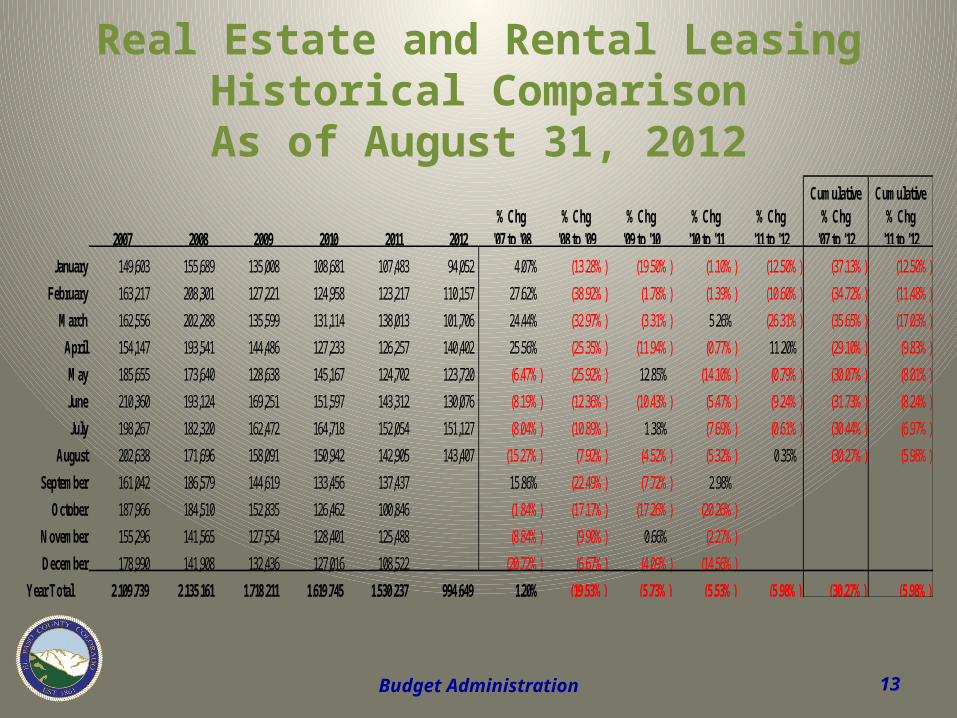
Real Estate and Rental LeasingHistorical ComparisonAs of August 31, 2012
2007 2008 2009 2010 2011 2012% Chg
'07 to '08% Chg
'08 to '09% Chg
'09 to '10% Chg
'10 to '11% Chg
'11 to '12
Cumulative % Chg
'07 to '12
Cumulative % Chg
'11 to '12
January 149,603 155,689 135,008 108,681 107,483 94,052 4.07% (13.28%) (19.50%) (1.10%) (12.50%) (37.13%) (12.50%)
February 163,217 208,301 127,221 124,958 123,217 110,157 27.62% (38.92%) (1.78%) (1.39%) (10.60%) (34.72%) (11.48%)
March 162,556 202,288 135,599 131,114 138,013 101,706 24.44% (32.97%) (3.31%) 5.26% (26.31%) (35.65%) (17.03%)
April 154,147 193,541 144,486 127,233 126,257 140,402 25.56% (25.35%) (11.94%) (0.77%) 11.20% (29.10%) (9.83%)
May 185,655 173,640 128,638 145,167 124,702 123,720 (6.47%) (25.92%) 12.85% (14.10%) (0.79%) (30.07%) (8.01%)
June 210,360 193,124 169,251 151,597 143,312 130,076 (8.19%) (12.36%) (10.43%) (5.47%) (9.24%) (31.73%) (8.24%)
July 198,267 182,320 162,472 164,718 152,054 151,127 (8.04%) (10.89%) 1.38% (7.69%) (0.61%) (30.44%) (6.97%)
August 202,638 171,696 158,091 150,942 142,905 143,407 (15.27%) (7.92%) (4.52%) (5.32%) 0.35% (30.27%) (5.98%)
September 161,042 186,579 144,619 133,456 137,437 15.86% (22.49%) (7.72%) 2.98%
October 187,966 184,510 152,835 126,462 100,846 (1.84%) (17.17%) (17.26%) (20.26%)
November 155,296 141,565 127,554 128,401 125,488 (8.84%) (9.90%) 0.66% (2.27%)
December 178,990 141,908 132,436 127,016 108,522 (20.72%) (6.67%) (4.09%) (14.56%)
Year Total 2,109,739 2,135,161 1,718,211 1,619,745 1,530,237 994,649 1.20% (19.53%) (5.73%) (5.53%) (5.98%) (30.27%) (5.98%)
Budget Administration 14
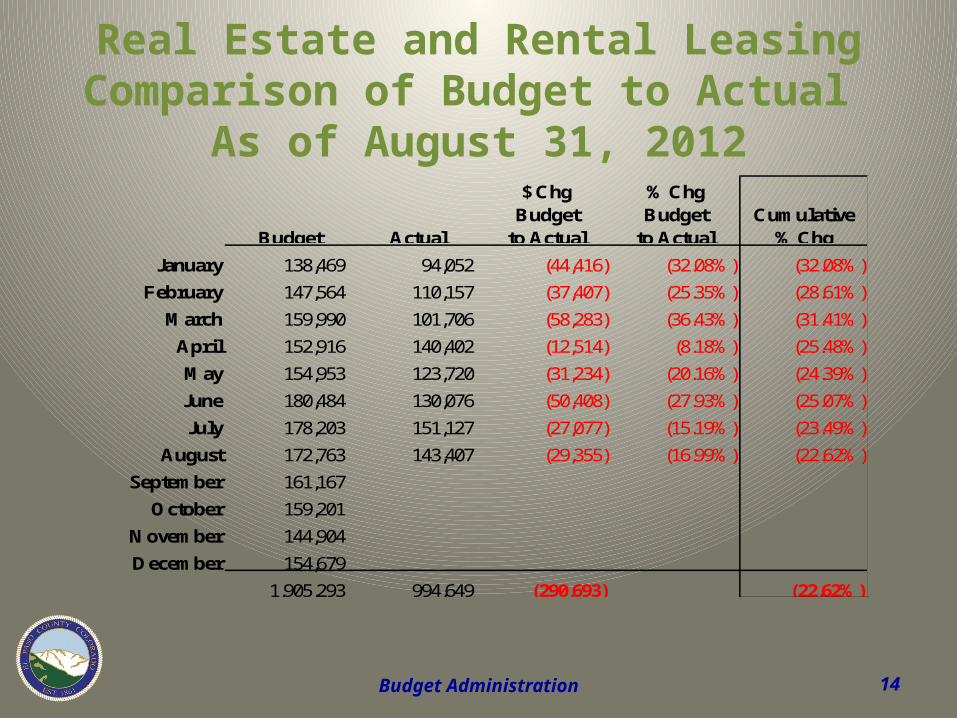
Real Estate and Rental LeasingComparison of Budget to Actual
As of August 31, 2012
Budget Actual
$ Chg Budget
to Actual
% Chg Budget
to ActualCumulative
% Chg
January 138,469 94,052 (44,416) (32.08%) (32.08%)
February 147,564 110,157 (37,407) (25.35%) (28.61%)
March 159,990 101,706 (58,283) (36.43%) (31.41%)
April 152,916 140,402 (12,514) (8.18%) (25.48%)
May 154,953 123,720 (31,234) (20.16%) (24.39%)
June 180,484 130,076 (50,408) (27.93%) (25.07%)
July 178,203 151,127 (27,077) (15.19%) (23.49%)
August 172,763 143,407 (29,355) (16.99%) (22.62%)
September 161,167
October 159,201
November 144,904
December 154,679
1,905,293 994,649 (290,693) (22.62%)

Budget Administration 15
ManufacturingHistorical ComparisonAs of August 31, 2012
2007 2008 2009 2010 2011 2012% Chg
'07 to '08% Chg
'08 to '09% Chg
'09 to '10% Chg
'10 to '11% Chg
'11 to '12
Cumulative % Chg
'07 to '12
Cumulative % Chg
'11 to '12
January 134,366 107,961 95,044 94,826 131,174 241,263 (19.65%) (11.96%) (0.23%) 38.33% 83.93% 79.56% 83.93%
February 156,548 148,191 106,953 94,950 111,709 157,497 (5.34%) (27.83%) (11.22%) 17.65% 40.99% 37.07% 64.18%
March 177,946 158,640 120,802 126,120 192,154 170,114 (10.85%) (23.85%) 4.40% 52.36% (11.47%) 21.33% 30.76%
April 186,365 148,377 104,233 116,139 157,050 175,055 (20.38%) (29.75%) 11.42% 35.23% 11.46% 13.54% 25.65%
May 170,291 146,521 135,827 152,442 203,475 199,048 (13.96%) (7.30%) 12.23% 33.48% (2.18%) 14.23% 18.53%
June 187,751 161,556 191,167 152,574 164,469 164,497 (13.95%) 18.33% (20.19%) 7.80% 0.02% 9.30% 15.36%
July 159,537 145,280 150,363 115,237 180,040 210,447 (8.94%) 3.50% (23.36%) 56.23% 16.89% 12.37% 15.60%
August 175,585 159,998 202,287 126,026 157,359 154,975 (8.88%) 26.43% (37.70%) 24.86% (1.52%) 9.23% 13.52%
September 163,889 163,922 150,653 134,808 174,757 0.02% (8.09%) (10.52%) 29.63%
October 75,119 152,825 125,003 169,602 135,219 103.44% (18.21%) 35.68% (20.27%)
November 151,239 119,790 71,139 118,472 184,056 (20.79%) (40.61%) 66.54% 55.36%
December 225,351 139,295 131,279 139,910 197,771 (38.19%) (5.75%) 6.57% 41.36%
Year Total 1,963,988 1,752,356 1,584,748 1,541,106 1,989,234 1,472,896 (10.78%) (9.56%) (2.75%) 29.08% 13.52% 9.23% 13.52%
Budget Administration 16
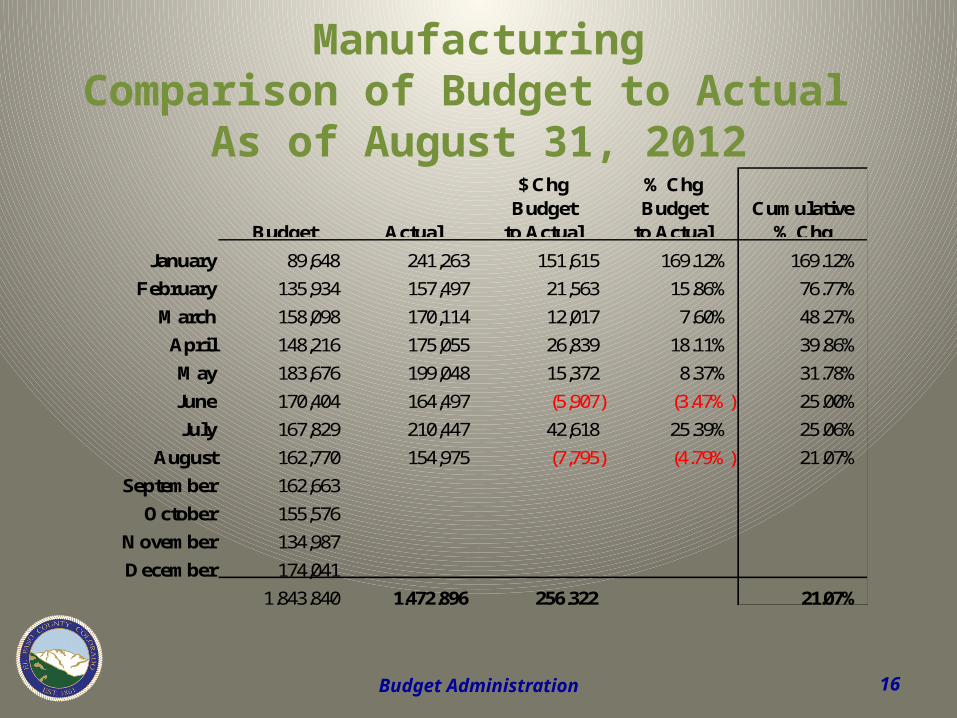
ManufacturingComparison of Budget to Actual
As of August 31, 2012
Budget Actual
$ Chg Budget
to Actual
% Chg Budget
to ActualCumulative
% Chg
January 89,648 241,263 151,615 169.12% 169.12%
February 135,934 157,497 21,563 15.86% 76.77%
March 158,098 170,114 12,017 7.60% 48.27%
April 148,216 175,055 26,839 18.11% 39.86%
May 183,676 199,048 15,372 8.37% 31.78%
June 170,404 164,497 (5,907) (3.47%) 25.00%
July 167,829 210,447 42,618 25.39% 25.06%
August 162,770 154,975 (7,795) (4.79%) 21.07%
September 162,663
October 155,576
November 134,987
December 174,041
1,843,840 1,472,896 256,322 21.07%
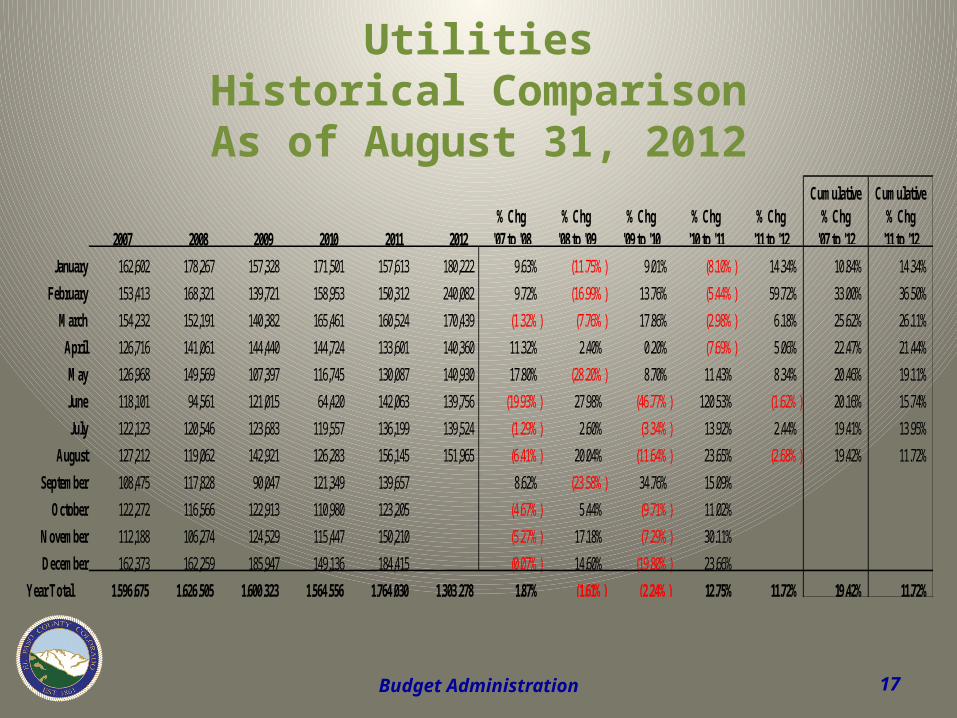
Budget Administration 17
UtilitiesHistorical ComparisonAs of August 31, 2012
2007 2008 2009 2010 2011 2012% Chg
'07 to '08% Chg
'08 to '09% Chg
'09 to '10% Chg
'10 to '11% Chg
'11 to '12
Cumulative % Chg
'07 to '12
Cumulative % Chg
'11 to '12
January 162,602 178,267 157,328 171,501 157,613 180,222 9.63% (11.75%) 9.01% (8.10%) 14.34% 10.84% 14.34%
February 153,413 168,321 139,721 158,953 150,312 240,082 9.72% (16.99%) 13.76% (5.44%) 59.72% 33.00% 36.50%
March 154,232 152,191 140,382 165,461 160,524 170,439 (1.32%) (7.76%) 17.86% (2.98%) 6.18% 25.62% 26.11%
April 126,716 141,061 144,440 144,724 133,601 140,360 11.32% 2.40% 0.20% (7.69%) 5.06% 22.47% 21.44%
May 126,968 149,569 107,397 116,745 130,087 140,930 17.80% (28.20%) 8.70% 11.43% 8.34% 20.46% 19.11%
June 118,101 94,561 121,015 64,420 142,063 139,756 (19.93%) 27.98% (46.77%) 120.53% (1.62%) 20.16% 15.74%
July 122,123 120,546 123,683 119,557 136,199 139,524 (1.29%) 2.60% (3.34%) 13.92% 2.44% 19.41% 13.95%
August 127,212 119,062 142,921 126,283 156,145 151,965 (6.41%) 20.04% (11.64%) 23.65% (2.68%) 19.42% 11.72%
September 108,475 117,828 90,047 121,349 139,657 8.62% (23.58%) 34.76% 15.09%
October 122,272 116,566 122,913 110,980 123,205 (4.67%) 5.44% (9.71%) 11.02%
November 112,188 106,274 124,529 115,447 150,210 (5.27%) 17.18% (7.29%) 30.11%
December 162,373 162,259 185,947 149,136 184,415 (0.07%) 14.60% (19.80%) 23.66%
Year Total 1,596,675 1,626,505 1,600,323 1,564,556 1,764,030 1,303,278 1.87% (1.61%) (2.24%) 12.75% 11.72% 19.42% 11.72%
Budget Administration 18
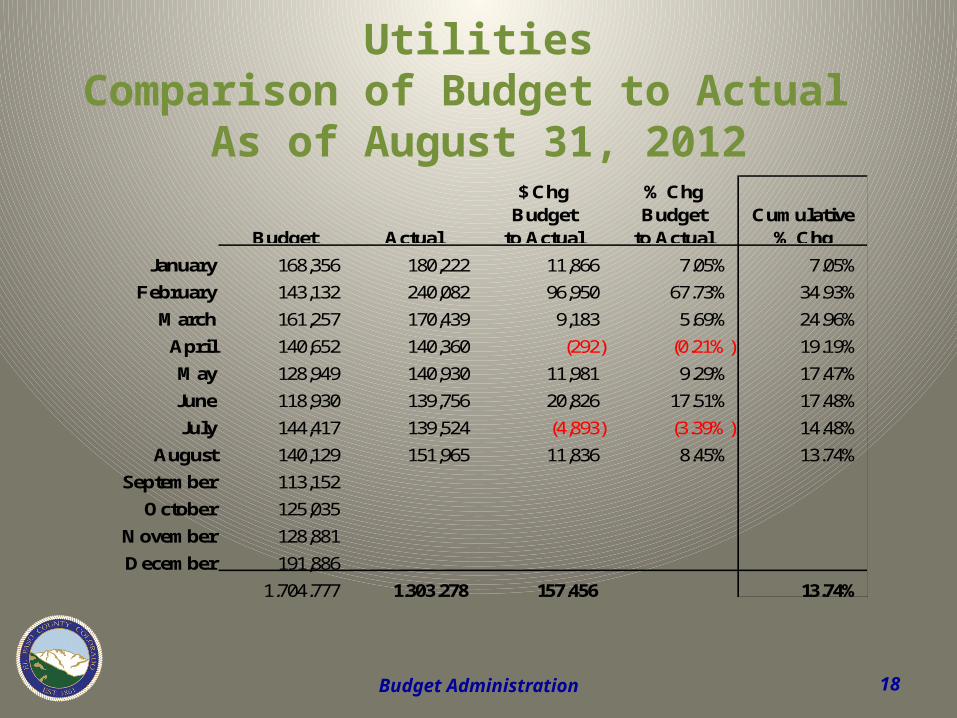
UtilitiesComparison of Budget to Actual
As of August 31, 2012
Budget Actual
$ Chg Budget
to Actual
% Chg Budget
to ActualCumulative
% Chg
January 168,356 180,222 11,866 7.05% 7.05%
February 143,132 240,082 96,950 67.73% 34.93%
March 161,257 170,439 9,183 5.69% 24.96%
April 140,652 140,360 (292) (0.21%) 19.19%
May 128,949 140,930 11,981 9.29% 17.47%
June 118,930 139,756 20,826 17.51% 17.48%
July 144,417 139,524 (4,893) (3.39%) 14.48%
August 140,129 151,965 11,836 8.45% 13.74%
September 113,152
October 125,035
November 128,881
December 191,886
1,704,777 1,303,278 157,456 13.74%
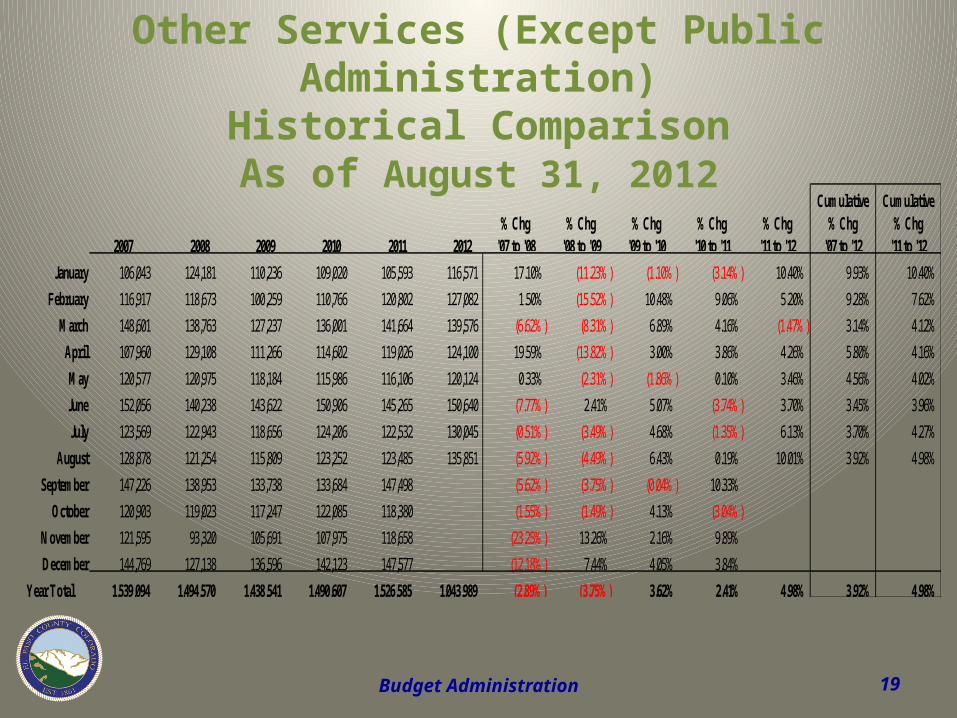
Budget Administration 19
Other Services (Except Public Administration)Historical ComparisonAs of August 31, 2012
2007 2008 2009 2010 2011 2012% Chg
'07 to '08% Chg
'08 to '09% Chg
'09 to '10% Chg
'10 to '11% Chg
'11 to '12
Cumulative % Chg
'07 to '12
Cumulative % Chg
'11 to '12
January 106,043 124,181 110,236 109,020 105,593 116,571 17.10% (11.23%) (1.10%) (3.14%) 10.40% 9.93% 10.40%
February 116,917 118,673 100,259 110,766 120,802 127,082 1.50% (15.52%) 10.48% 9.06% 5.20% 9.28% 7.62%
March 148,601 138,763 127,237 136,001 141,664 139,576 (6.62%) (8.31%) 6.89% 4.16% (1.47%) 3.14% 4.12%
April 107,960 129,108 111,266 114,602 119,026 124,100 19.59% (13.82%) 3.00% 3.86% 4.26% 5.80% 4.16%
May 120,577 120,975 118,184 115,986 116,106 120,124 0.33% (2.31%) (1.86%) 0.10% 3.46% 4.56% 4.02%
June 152,056 140,238 143,622 150,906 145,265 150,640 (7.77%) 2.41% 5.07% (3.74%) 3.70% 3.45% 3.96%
July 123,569 122,943 118,656 124,206 122,532 130,045 (0.51%) (3.49%) 4.68% (1.35%) 6.13% 3.70% 4.27%
August 128,878 121,254 115,809 123,252 123,485 135,851 (5.92%) (4.49%) 6.43% 0.19% 10.01% 3.92% 4.98%
September 147,226 138,953 133,738 133,684 147,498 (5.62%) (3.75%) (0.04%) 10.33%
October 120,903 119,023 117,247 122,085 118,380 (1.55%) (1.49%) 4.13% (3.04%)
November 121,595 93,320 105,691 107,975 118,658 (23.25%) 13.26% 2.16% 9.89%
December 144,769 127,138 136,596 142,123 147,577 (12.18%) 7.44% 4.05% 3.84%
Year Total 1,539,094 1,494,570 1,438,541 1,490,607 1,526,585 1,043,989 (2.89%) (3.75%) 3.62% 2.41% 4.98% 3.92% 4.98%

Budget Administration 20
Other Services (Except Public Administration) Comparison of Budget to Actual
As of August 31, 2012
Budget Actual
$ Chg Budget
to Actual
% Chg Budget
to ActualCumulative
% Chg
January 113,372 116,571 3,199 2.82% 2.82%
February 115,006 127,082 12,076 10.50% 6.69%
March 146,347 139,576 (6,771) (4.63%) 2.27%
April 119,161 124,100 4,939 4.14% 2.72%
May 124,356 120,124 (4,232) (3.40%) 1.49%
June 156,603 150,640 (5,962) (3.81%) 0.42%
July 126,551 130,045 3,494 2.76% 0.75%
August 127,978 135,851 7,873 6.15% 1.42%
September 149,659
October 123,038
November 111,404
December 152,569
1,566,044 1,043,989 14,615 1.42%
Budget Administration 21
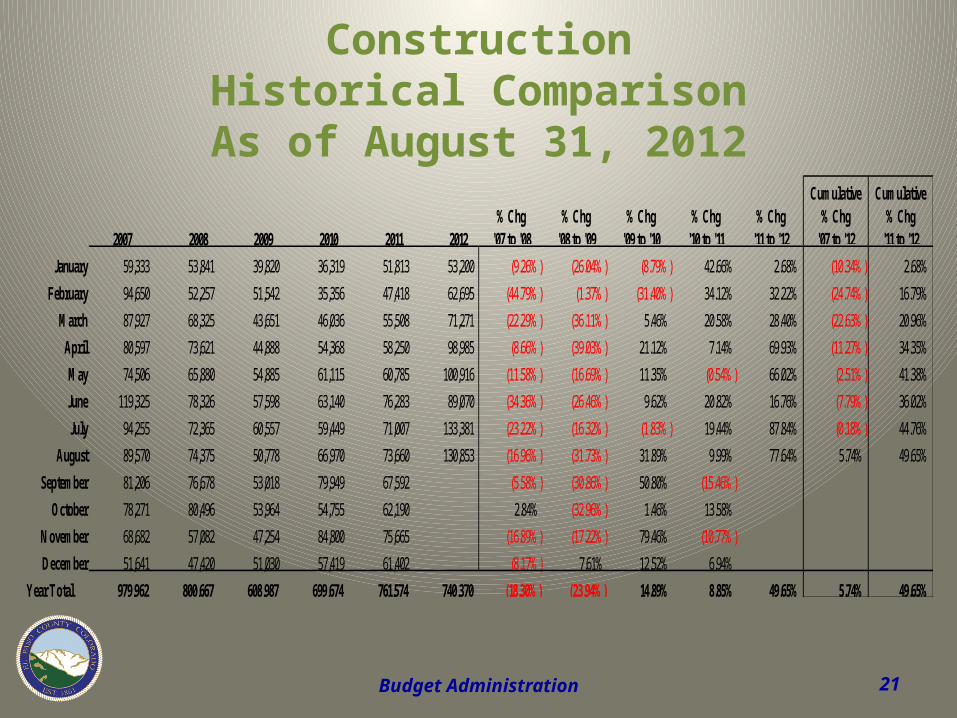
ConstructionHistorical ComparisonAs of August 31, 2012
2007 2008 2009 2010 2011 2012% Chg
'07 to '08% Chg
'08 to '09% Chg
'09 to '10% Chg
'10 to '11% Chg
'11 to '12
Cumulative % Chg
'07 to '12
Cumulative % Chg
'11 to '12
January 59,333 53,841 39,820 36,319 51,813 53,200 (9.26%) (26.04%) (8.79%) 42.66% 2.68% (10.34%) 2.68%
February 94,650 52,257 51,542 35,356 47,418 62,695 (44.79%) (1.37%) (31.40%) 34.12% 32.22% (24.74%) 16.79%
March 87,927 68,325 43,651 46,036 55,508 71,271 (22.29%) (36.11%) 5.46% 20.58% 28.40% (22.63%) 20.96%
April 80,597 73,621 44,888 54,368 58,250 98,985 (8.66%) (39.03%) 21.12% 7.14% 69.93% (11.27%) 34.35%
May 74,506 65,880 54,885 61,115 60,785 100,916 (11.58%) (16.69%) 11.35% (0.54%) 66.02% (2.51%) 41.38%
June 119,325 78,326 57,598 63,140 76,283 89,070 (34.36%) (26.46%) 9.62% 20.82% 16.76% (7.79%) 36.02%
July 94,255 72,365 60,557 59,449 71,007 133,381 (23.22%) (16.32%) (1.83%) 19.44% 87.84% (0.18%) 44.76%
August 89,570 74,375 50,778 66,970 73,660 130,853 (16.96%) (31.73%) 31.89% 9.99% 77.64% 5.74% 49.65%
September 81,206 76,678 53,018 79,949 67,592 (5.58%) (30.86%) 50.80% (15.46%)
October 78,271 80,496 53,964 54,755 62,190 2.84% (32.96%) 1.46% 13.58%
November 68,682 57,082 47,254 84,800 75,665 (16.89%) (17.22%) 79.46% (10.77%)
December 51,641 47,420 51,030 57,419 61,402 (8.17%) 7.61% 12.52% 6.94%
Year Total 979,962 800,667 608,987 699,674 761,574 740,370 (18.30%) (23.94%) 14.89% 8.85% 49.65% 5.74% 49.65%
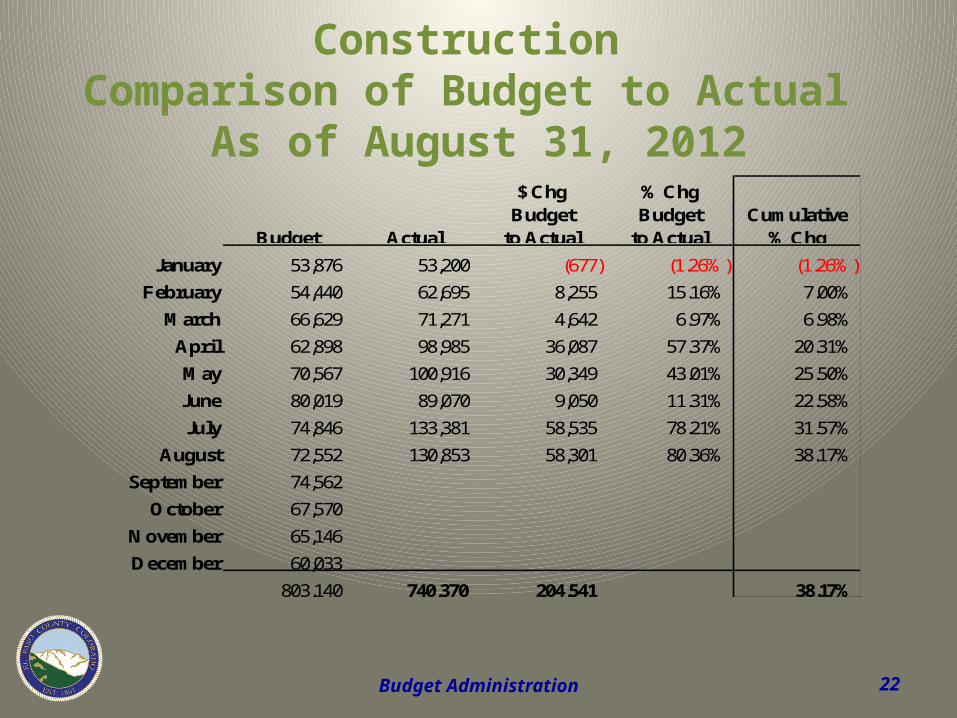
Budget Administration 22
Construction Comparison of Budget to Actual
As of August 31, 2012
Budget Actual
$ Chg Budget
to Actual
% Chg Budget
to ActualCumulative
% Chg
January 53,876 53,200 (677) (1.26%) (1.26%)
February 54,440 62,695 8,255 15.16% 7.00%
March 66,629 71,271 4,642 6.97% 6.98%
April 62,898 98,985 36,087 57.37% 20.31%
May 70,567 100,916 30,349 43.01% 25.50%
June 80,019 89,070 9,050 11.31% 22.58%
July 74,846 133,381 58,535 78.21% 31.57%
August 72,552 130,853 58,301 80.36% 38.17%
September 74,562
October 67,570
November 65,146
December 60,033
803,140 740,370 204,541 38.17%

Budget Administration 23
Professional, Scientific, and Tech Services Historical ComparisonAs of August 31, 2012
2007 2008 2009 2010 2011 2012% Chg
'07 to '08% Chg
'08 to '09% Chg
'09 to '10% Chg
'10 to '11% Chg
'11 to '12
Cumulative % Chg
'07 to '12
Cumulative % Chg
'11 to '12
January 36,535 44,016 35,303 33,021 32,222 30,177 20.48% (19.80%) (6.47%) (2.42%) (6.35%) (17.40%) (6.35%)
February 45,300 42,714 34,966 43,749 34,053 44,840 (5.71%) (18.14%) 25.12% (22.16%) 31.68% (8.33%) 13.19%
March 56,362 55,389 43,738 54,649 44,458 52,390 (1.73%) (21.03%) 24.94% (18.65%) 17.84% (7.81%) 15.06%
April 40,769 39,421 37,488 97,920 57,010 27,520 (3.31%) (4.90%) 161.21% (41.78%) (51.73%) (13.43%) (7.64%)
May (64,113) 66,035 43,359 36,364 39,175 85,447 (203.00%) (34.34%) (16.13%) 7.73% 118.12% 109.29% 16.17%
June 62,865 47,405 57,804 53,005 68,334 65,045 (24.59%) 21.94% (8.30%) 28.92% (4.81%) 71.85% 10.96%
July 39,036 53,233 44,891 30,048 17,930 47,116 36.37% (15.67%) (33.06%) (40.33%) 162.78% 62.64% 20.24%
August 45,513 39,138 37,633 59,893 53,186 82,635 (14.01%) (3.85%) 59.15% (11.20%) 55.37% 65.93% 25.64%
September 57,400 53,197 49,548 174,293 100,805 (7.32%) (6.86%) 251.77% (42.16%)
October 41,610 45,154 48,073 65,648 38,958 8.52% 6.46% 36.56% (40.66%)
November 49,834 47,411 47,343 40,934 30,981 (4.86%) (0.14%) (13.54%) (24.32%)
December 117,791 55,094 63,277 119,708 82,713 (53.23%) 14.85% 89.18% (30.90%)
Year Total 528,903 588,207 543,422 809,231 599,824 435,170 11.21% (7.61%) 48.91% (25.88%) 25.64% 65.93% 25.64%
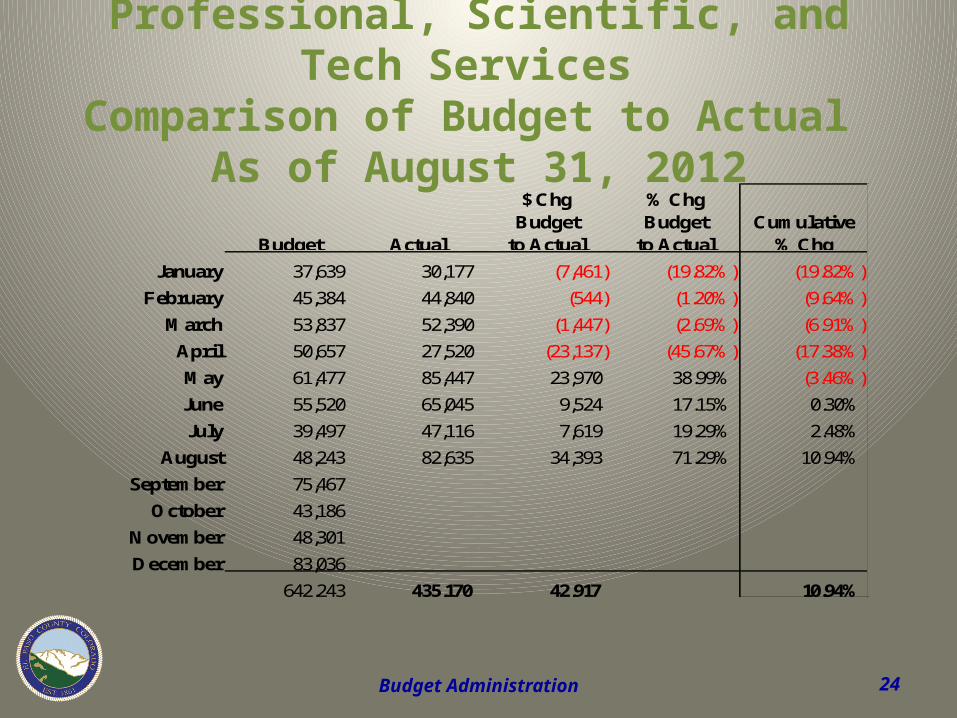
Budget Administration 24
Professional, Scientific, and Tech Services Comparison of Budget to Actual
As of August 31, 2012
Budget Actual
$ Chg Budget
to Actual
% Chg Budget
to ActualCumulative
% Chg
January 37,639 30,177 (7,461) (19.82%) (19.82%)
February 45,384 44,840 (544) (1.20%) (9.64%)
March 53,837 52,390 (1,447) (2.69%) (6.91%)
April 50,657 27,520 (23,137) (45.67%) (17.38%)
May 61,477 85,447 23,970 38.99% (3.46%)
June 55,520 65,045 9,524 17.15% 0.30%
July 39,497 47,116 7,619 19.29% 2.48%
August 48,243 82,635 34,393 71.29% 10.94%
September 75,467
October 43,186
November 48,301
December 83,036
642,243 435,170 42,917 10.94%


