
Seton Hall UniversityeRepository @ Seton HallSeton Hall University Dissertations and Theses(ETDs) Seton Hall University Dissertations and Theses
2009
Early Childhood Education: The Sustainability ofthe Benefits of Preschool Participation in AbbottDistrictsNorma FernandezSeton Hall University
Follow this and additional works at: https://scholarship.shu.edu/dissertations
Part of the Elementary Education and Teaching Commons, and the Pre-Elementary, EarlyChildhood, Kindergarten Teacher Education Commons
Recommended CitationFernandez, Norma, "Early Childhood Education: The Sustainability of the Benefits of Preschool Participation in Abbott Districts"(2009). Seton Hall University Dissertations and Theses (ETDs). 379.https://scholarship.shu.edu/dissertations/379

EARLY CHILDHOOD EDUCATION: THE SUSTAINABILITY OF THE BENEFITS OF PRESCHOOL
PARTICIPATION IN ABBOTT DISTRICTS
BY
NORMA FERNANDEZ
Dissertation Committee:
Elaine Walker, Ph.D., Mentor Daniel Gutmore, Ed. D. Hermione McNeil, Ed.D. William Ronzitti, Ph. D.
Submitted in partial fulfillment of the
Requirements for the Doctor of Education Seton Hall University

SETON HALL UNIVERSITY COLLEGE OF EDUCATION AND HUMAN SERVICES
OFFICE OF GRADUATE STUDIES
APPROVAL FOR SUCCESSFUL DEFENSE
Doctoral Candidate, Norma Fernandez, has successfully defended and made the
required modifications to the text of the doctoral dissertation for the Ed.D. during this
Fall Semester 2009.
DISSERTATION COMMITTEE (please sign and date beside your name)
Mentor: Dr. Elaine Walker
Committee Member: c--- Dr. Daniel Gutmore J 74,ul/ ~ - i d , + d , /,A - ? - d (
/
Committee Member: Dr. Hermoine McNeil
Committee Member: Dr. William Ronzitti 12-4-09
External Reader:
The mentor and any other committee members who wish to review revisions will sign and date this document only when revisions have been completed. Please return this form to the Office of Graduate Studies, where it will be placed in the candidate's file and submit a copy with your final dissertation to be bound as page number two.

0 Copyright by Norma Fernandez, 2009
All Rights Resewed

Acknowledgements
I am very appreciative of the faculty and staff at Seton Hall University. They were
always available to provide their expertise and guidance. Especially my mentor, Dr. Elaine
Walker, who created valuable learning experiences as she guided students through the
dissertation process. Her knowledge and kindness are inspirational. Dr. Walker was always
willing to provide additional support to help her students' master statistics and complete the
dissertation process. My sincere gratitude is offered to my Seton Hall reader, Dr. Daniel
Gutmore, whose guidance provided much needed support.
In additional, I would like to thank my colleagues and mentors, Dr. William Ronzitti and
Dr. Hermione McNeil. Their professionalism and dedication to student learning provided a role
model. Dr. Ronzitti the motivating force behind my choice to enroll in a doctoral program.
I would like to thank my colleagues in Cohort X. The "power of X was inspirational in
completing the dissertation process - especially Janet and Adele, who kept words of
encouragement flowing when giving up would have been easier.
Additionally, I would like to acknowledge the district's administration for their
commitment to student learning. This focus on students has provided the guidance for the
implementation of the Abbott Remedies in every classroom. Last but certainly not least, I am
very appreciative of my many colleagues in the Jersey City Public School System, who
supported my quest and provided an endless amount of support. In particular, to my friends
Franklin, Pat, Jim, and Mary Beth who believed in me and helped in so many ways.

ABSTRACT
EARLY CHILDHOOD EDUCATION: THE SUSTAINABILITY OF THE BENEFITS OF PRESCHOOL PARTICIPATION IN ABBOTT DISTRICTS
The landmark New Jersey Supreme Court school funding case, Abbott v. Burke,
established the availability of preschool for all three- and four-year-olds living within the state's
thirty-one poorest districts as a means of eradicating the effects of poverty. Longitudinal studies
have shown the value of high quality preschool programs for improving student achievement,
immediately and well into adulthood. This quantitative study examines the sustainability of the
benefits of high-quality preschool in an Abbott District. This research examines to what extent
academic achievement in third grade is influenced by continuous enrollment, by comparing the
differences in academic outcomes between students who have a history of continuous enrollment
in the same school and those who have changed schools since preschool or those who have never
attended preschool in the district. Links between participation in preschool and mobility support
the contention that preschool participation positively impacts student achievement, while
mobility negatively impacts the sustainability of benefits. Seven questions guided the researcher
in investigating how the interaction of preschool participation and socioeconomic status, gender,
mobility, absences; and a school's No Child Left Behind (NCLB) status affects the sustainability
of benefits through the third grade, as measured by the State-mandated assessment in language
arts literacy and mathematics.

Results align with the literature and identify participation in a quality preschool program
as a primary factor affecting student achievement. Findings captured pertinent information as to
how participation in a quality preschool is sustained through the third grade, especially for
students who remain at the same school. Mobility negatively impacts student achievement and
the sustainability of benefits of preschool participation. This study revealed that the school's
NCLB status is negatively associated with the benefits of preschool participation. The
sustainability of benefits for students enrolled in schools that failed to meet the adequate yearly
progress, as monitored by NCLB Legislation, is lower than for students enrolled in schools that
meet all the requirements. Additionally, when a school fails to meet NCLB's requirements for
three years in a row, the benefits are sustained the least, and once the school implements
interventions, students' achievement improves. As schools start to implement interventions to
change the school's status, student achievement is better sustained all the way through the third
grade. Student attendance, gender, and socioeconomic status do not affect the sustainability of
the benefits of preschool participation. In summary, the academic benefits of preschool
participation are sustained through the third grade, but when students move between schools the
benefits decrease.

Dedication
This dissertation is dedicated to my family for the sacrifices they made to give me
the necessary time to complete a doctoral program. They allowed me the opportunity to
grow, develop and find my true place in life. Especially, to my husband Alberto, you
were, as the song claims, "the wind beneath my wings". To my sons Albert and Adam,
who always believed in me and had no doubts I would finish. I am eternally grateful to
my parents who sacrificed so much to give me an opportunity to live with freedom.
Their mantra that "education is the one thing no one can ever take from you" helped me
become the educator I am today.
"Destiny is not a matter of chance, it is a matter ofchoice; it is not a thing to be
waitedfor, it is a thing to be achieved". William Jennings Bryan

TABLE OF CONTENTS
CHAPTER I . INTRODUCTION .............................................................................. ................................................................................... Statement of the Problem
Purpose of the Study ........................................................................................ Research Question .......................................................................................... Subsidiary Questions ....................................................................................... Design and Methods of the Study ......................................................................... Limitations ................................................................................................... Significance of the Study .................................................................................. Definition of Terms .........................................................................................
............ CHAPTER I1 . REVIEW OF RELATED RESEARCH. THEORY AND LITERATURE ................................................................... History of Early Childhood Education
.......................................................................... Abbott v . Burke Court Decision ............................................................ Sustainability of Early Childhood Education
...................................................... Essential Components of High Quality Preschool Perry High/Scope Curriculum .............................................................................
...................................................... Socioeconomic Status and Student Achievement ........................................................................... Race and Student Achievement
....................................................................... Mobility and Student Achievement ........................................................................ Gender and Student Achievement
Orientation of the Study ....................................................................................
CHAPTER I11 . METHODOLOGY ........................................................................... Introduction .................................................................................................. Sample ........................................................................................................ Research Design ............................................................................................. Third-Grade Assessment ................................................................................... Early Childhood Assessment ..............................................................................
.......................................................................................... Research Question Subsidiary Questions .......................................................................................
.................................................................................... Subsidiary Question 1 Subsidiary Question 2 .................................................................................... Subsidiary Question 3 ................................................................................... Subsidiary Question 4 ................................................................................... Subsidiary Question 5 ................................................................................... Subsidiary Question 6 ................................................................................... . . Subsidiary Question 7 ...................................................................................
Variables ..................................................................................................... Data Collection .............................................................................................. Data Analysis ................................................................................................ Summary .....................................................................................................

CHAPTER IV . DATA ANALYSIS AND RESULTS ..................................................... 56 Introduction ................................................................................................... 56
................................................................................. Data Used for the Research 57 Subsidiary Research Questions 58
Subsidiary Research Question 1 ....................................................................... 58 Subsidiary Research Question 2 ....................................................................... 64 Subsidiary Research Question 3 ....................................................................... 72 Subsidiary Research Question 4 ....................................................................... 80 Subsidiary Research Question 5 .................................................................. 87 Subsidiary Research Question 6 ....................................................................... 90
....................................................................... Subsidiary Research Question 7 93
CHAPTER V . SUMMARY .................................................................................... 107 Introduction ................................................................................................... 107 Summary of the Study ...................................................................................... 109 Summary of the Findings .................................................................................. 111 Recommendations .......................................................................................... 118
APPENDIX I. ECERS.R ....................................................................................... 121 APPENDIX 11. SELA ........................................................................................... 122 APPENDIX III. PCMI .......................................................................................... 124
REFERENCES .................................................................................................. 126

LIST OF TABLES
2.1 Comparison of the Impact of the HigWScope and Head Start Programs on Social and Behavioral Outcomes of Preschool Participants and Nonparticipants ............................
2.2 The Impact of Social &d Behavioral Outcomes Based on Participation in Chicago Child- Parent Centers ............................................................................................
2.3 Average New Jersey Scale Score for Reading by Ethnicity Used by NAEP Reports After 2001 .................................................................................................
3.1 Description of the Three Enrollment Groups of Students Included in the Data Sample ........... 3.2 Language Arts Literacy and Mathematics Scores Based on District DFG* .......................... 3.3 Validity of the NJ ASK Content Based on the Alignment of the Assessment with the New
Jersey Core Curriculum Content Standards ........................................................... 3.4 Description of Variables Used for SPSS Analysis ...................................................... 4.1 Language Arts Literacy Analysis of Variance NJ ASK 3 Scores 2007 ............................... 4.2 Language Arts Literacy Mean NJ ASK 3 Scores 2097 .................................................. 4.3 Language Arts Literacy Scheffe ............................................................................ 4.4 Mathematics Analysis of Variance NJ ASK 3 Scores 2007 ........................................... 4.5 Mathematics Mean .......................................................................................... 4.6 Mathematics Scheffe NJ ASK 3 Scores 2007 ............................................................ 4.7 Language Arts Literacy Analysis of Variance NJ ASK 3 Scores 2007 ............................... 4.8 Language Arts Literacy 2007 Descriptive Studies Tests of Between-Subjects Effects ............. 4.9 Mathematics Analysis of Variance Tests of Between-Subjects Effects .............................. 4.10 Mathematics 2007 Means ................................................................................... 4.1 1 Mathematics and CES Sheffe .............................................................................. 4.12 Language Arts Literacy Scores 2007 Socioeconomic Status and Enrollment Status ............... 4.13 Language Arts Literacy 2007 Socioeconomic Status Means ........................................... 4.14 Language Arts Literacy Socioeconomic Status Scheffe ................................................ 4.15 Mathematics Scores 2007 Socioeconomic Status and Enrollment Status ............................ 4.16 Mathematics Scores 2007 Socioeconomic Status and Enrollment Status Means ................... 4.17 Mathematics Scores 2007 Socioeconomic Status and Enrollment Status Scheffe .................. 4.18 Language Arts Literacy 2007 Analysis of Variance by Gender ....................................... 4.19 Language Arts Literacy 2007 Means by Gender ......................................................... 4.20 Language Arts Literacy 2007 Gender Scheffe ........................................................... 4.21 Language Arts Literacy 2007 Gender and Enrollment Status Means ................................. 4.22 Mathematics Scores 2007 Analysis of Variance ......................................................... 4.23 Language Arts Literacy 2007 Means by Gender ......................................................... 4.24 Mathemitics Scores 2007 Gender and Enrollment Status ANOVA .................................. 4.25 Mathematic Scores 2007 Gender and Enrollment Status Means ..................................... 4.26 Language Arts Literacy 2007 Impact of Absences ...................................................... 4.27 Language Arts Literacy 2007 Impact of Absences Descriptive Statistics ............................
........... 4.28 Language Arts Literacy 2007 Impact of Absences Tests of Between-Subjects Effects 4.29 Mathematics 2007 Impact of Absences ................................................................... 4.30 Mathematics 2007 Impact of Absences Descriptive Statistics ......................................... 4.3 1 Mathematics 2007 Impact of Absences Tests of Between-Subjects Effects ......................... 4.32 Language Arts Literacy 2007 Means Based on Enrollment Status ....................................

4.33 Language Arts Literacy 2007 Sheffe ...................................................................... 91 4.34 Mathematic Scores 2007 Means Based on School Effects and Enrollment Status ................. 92 4.35 Language Arts Literacy Scores 2007 School Effect and Enrollment Status ANOVA .............. 94 4.36 Language Arts Literacy 2007 Means Based on School Effect ......................................... 94 4.37 Language Arts Literacy 2007 Means Based on School Effect and Enrollment Status ............. 95 4.38 ~ a n ~ u a ~ e ~ r t s ~iteracy 2007 school ~ f f e c t and CES Status Scheffe ................................ 99 4.39 Mathematics Scores 2007 ANOVA ....................................................................... 100 4.40 Mathematics Scores 2007 Means Based on Enrollment Status and School Effect Descriptive
Studies .................................................................................................... 101 4.41 Mathematics Scores 2007 Enrollment Status and School Effects Sheffe ............................ 102

CHAPTER I
INTRODUCTION
Students' achievement in school severely affects their social and economic success as
adults. Research has long documented the link between student poverty, socioeconomic status,
and low academic performance. During the last three decades, education has been influenced by
legal controversy, mandated remedies, and reforms at the state and federal levels to create
opportunities that overcome these social injustices and improve student achievement.
Policymakers have mobilized an arsenal of policy instruments to ensure that all children receive
quality education, in an effort to advocate for the academic and social success of their "at risk"
students. One such policy relies on a high-quality preschool program as a reform that aims to
improve the education that economically and socially disadvantaged minority students receive,
because "...poverty, particularly among urban minorities, is associated with academic performance
that is well below international means on a number of different intemational assessments. Scores
of poor students are also considerably below the scores achieved by white middle class American
students" (Berliner, 2005, p.1).
There is a large gap in the educational achievement of poor students, particularly in
school districts with a high concentration of economically disadvantaged minority students.
Academic performance is lower in highpoverty urban schools than in low-poverty schools
(Flaxman, Schwartz, Weiler, & Lahey, 1998). Student achievement nationwide indicates a
strong relationship between a concentration of poverty and low achievement. Students attending
high-poverty schools trpically perform significantly below national norms, and dramatically
short of the performance benchmarks employed to measure academic success (Balfanz &

Legters, 2004). Nearly 30 million, or 41%, of the school age children in the United States are
living at or below the poverty rate (Gelberg, 2008). The achievement gap is a constant reminder
of an area where public education continues to fall short. In a 2007, the United Nations
Children's Fund (UNICEF) study of child well-being in developed countries, the United States'
overall score was 20th of the 21 nations evaluated and placed 12th of the twenty-one countries
on educational well-being (UNICEF 2007). According to the Early Childhood Longitudinal
Study of the kindergarten class of 1998-1999 (NCES 2004), which studied student achievement
in mathematics and reading through the early grades, found that the number of family risk factors
is negatively associated with academic achievement. The more family risk factors students have;
such as, living below the poverty level, primary home language other than English, mother's
highest education less than a high school diploma, or living in a single-parent household; the
smaller the gains realized from the beginning of kindergarten through the end of third grade,
while children with no family risk factors had higher gains in mathematics and reading.
Statement of the Problem
Poverty is a problem that negatively influences student achievement and becomes an
obstacle for postsecondary education. Studies have documented that students from families with
lower socioeconomic status are "more likely to suffer from preventable illnesses, fail in school,
become teenaged parents, and become involved with the justice system. As a result, young
people frequently reach adulthood without the necessary tools, experiences and connections to
succeed" (Annie E. Casey Foundation 2005). Schools are not responsible for poverty, nor can
they eradicate its existence. However, in spite of these pessimistic realities, as a society we
continually develop policies and advocate for programs of interventions to be implemented in
schools, in an effort to eradicate the negative impact of poverty and shrink the achievement gap

while educating disadvantaged students. This study was designed to analyze the sustainability of
Abbot Preschool education as a remedy for the risks associated with poverty in a poor urban
district and the program's impact on student achievement.
According to research, a quality preschool program is an intervention that reduces the
achievement gap (Barnett, 1998; Bennett, Bridglall, Cauce, Everson, Gordon, & Lee, et al.,
2004; Boyd, Barnett, Leong, Bodrova, & Gomby, 2000; Espinosa, 2002; Reynolds, 2004).
Research demonstrates, with persuasive evidence, that highquality preschool participation
positively impacts student social-emotional development (Boyd, Bamett, Leong, Bodrova,
Gomby, 2000). These findings propelled the New Jersey Supreme Court to mandate early
childhood education as a remedy for the State's poorest students under the Abbott decision.
Therefore, what is the sustainability of preschool education? To what extent is academic
achievement influenced by continuous enrollment in the same school from preschool to third
grade; and are there differences in academic outcomes between students who have a history of
continuous enrollment in the same school versus those who have changed schools since
preschool or those who have never attended preschool in the district? Policymakers at the
political, legislative and educational arena have increasingly recognized the potential of
preschool as an economic investment in the future of the children most at risk (Haynes 2008).
Many studies of short-term or immediate outcomes show preschool to impact significantly on
selfesteem, motivation, and social behavior. Longitudinal studies demonstrate the sustainable
impact on classroom behavior, social adjustment, higher income potential, higher graduation
rates, and lower crime rates. Research on long-running programs, such as the Peny Preschool
Program, Head Start, and the Chicago Parent Center Program, show that many of the long-term
effects come from the economic payoff resulting from the public investment in high-quality

preschool as a means of improving short- and long-term achievement and a decrease in crime
rates and delinquency. Data from the previously mentioned preschool programs demonstrate
that quality preschool programs for disadvantaged children are a productive investment for future
generations.
Different states across the nation and, more recently, the Federal government with the No
Child Left Behind Legislation, have initiated many efforts to alleviate the inequalities of low
socioeconomic status and reduce the achievement gap. In New Jersey, the history of school
reform has largely been influenced by the 1973 Robinson v. Cahill decision that found New
Jersey's system of financing education to be unconstitutional and that it violated the state's own
constitutional mandate of a "thorough and efficient education" by basing school funding on local
taxation. Ensuing decisions that evolved from the Robinson case, which later became known as
the "Abbott decisions," modified school funding and created remedies intended to eliminate New
Jersey's discriminatory practice of funding suburban schools at a much higher level than urban
schools. Therefore, the new legislation created parity aid for the state's poorest districts to match
the more affluent districts, based on the District Factor Group (DFG), a system of ranking New
Jersey school districts based on their socioeconomic status.
The New Jersey Supreme Court decision in the Abbott v. Burke case required significant
reforms and mandates for the state's poorest school districts. In an attempt to remedy the
inequalities of school funding and its impact on the poorest residents of the state, the New Jersey
Supreme Court ordered an unprecedented series of entitlements for urban school children. These
mandates required that per-pupil spending be equalized between the urban districts and the more
affluent suburban districts. The courts also ordered the implementation of a series of specific
standards-based education reforms for all students in New Jersey, in what came to be known as

"the Abbott Remedies," for the thirty-one poorest districts. These remedies contained a strong
focus on assessment and data to close the achievement gap, alignment of district cumculum and
instruction based on the State Core Curriculum Content Standards, class-size limits, a
comprehensive literacy program from kindergarten through third grade, intensive and continual
professional development, and very importantly, the subject of this study, quality early childhood
programs for all three- and four-year-olds in the thirty-one Abbott districts.
The Abbott regulations made high-quality early childhood programs, including intensive
early literacy and the mastery of mathematics, a focus of the State's efforts to design equalized
funding and diminish the effects of poverty in New Jersey's poorest districts. Many longitudinal
studies on the impact of poverty (Bamen & Boocock, 1998; Bamen, 2002; Barnett, 2007;
Esposito-Lamy, Frede, Seplocha, Jambunatham, & Wolock, 2005; Frede, Jung, Barnett, &
Figueras 2009; Karoly, Ghosh-Dastiday, Zellman, Perlman, & Femyhough, 2008; Brooks-Gum,
Fuligni, & Berlin, NICHD Early Childcare Research Network, 2003; Prince, Pepper, & Brocato,
2006; Shonkoff, Meisels, & Ziegler, 2000) revealed that high-quality early childhood education
leads to the development of better cognitive skills and social interactions, higher graduation and
employment rates and lower rates of involvement in violence and delinquency. Decades of data
from various programs demonstrates that it is possible to improve the future of vulnerable
children well into their adult years so that, "early experiences determine whether a child's
developing brain architecture provides a strong or weak foundation for all future learning,
behavior, and health" (Center on the Developing Child at Harvard University, August 2007).
Purpose of the Study
The New Jersey Supreme Court in the Abbort v Burke 1998 decision held that, "intensive
preschool and MI-day kindergarten e ~ c h m e n t programs are necessary to reverse the

educational disadvantages these children start out with" (Abbott v. Burke, 1998). The purpose of
this study was to investigate and explore the sustainability of the benefits of preschool
participation through the third grade for students who remained at the same school, students who
moved within the district, and students new to the school district who did not participate in this
specific Abbott preschool program.
The New Jersey Department of Education (NJDOE) has pledged its commitment to the
dual goal of ensuring that all students in the Abbott districts (New Jersey's 3 1 poorest districts),
including English language learners (ELL) and special education students, are reading at grade
level by the end of third grade and will achieve mastery of the New Jersey Core Curriculum
Content Standards (NJCCCS). The NJDOE proposes to achieve these goals by mandating that
every public elementary school in the Abbott districts implement an intensive early literacy
program, and that every Abbott district offers a high-quality preschool program for all three- and
four-year-olds. The components of a high-quality preschool will be discussed a little further in
the literature review. The goal of this study was to explore whether the benefits of participation
in an Abbott high-quality early childhood program are sustained and impact on student
achievement in third grade as evidenced by their NJ ASK3 scores in 2007.
All Abbott preschool programs are continually monitored by the New Jersey Department
of Education, and are expected to implement a preschool cumculum that is standards-based,
meets the Abbott regulations for quality preschool programs, and are fully aligned with the
Preschool Teaching and Learning Expectations: Standards of Quality. Therefore, it will be
understood that the studied district (District A) has complied with all the regulations as it
implements a HighIScope curriculum, a methodology approved by the NJDOE as a high quality

curriculum. In order to meet the regulations established by NCLB, District A tests all students
yearly in grades three and beyond, as mandated by the NJDOE to meet these requirements.
The Abbott regulations have allocated substantial amounts of resources and paid careful
attention to the Abbott Preschool Program. According to the National Institute for Early
Education Research's (NIEER) annual report on state-funded preschool in 2006 and the Abboa
Preschool Program Longitudinal Effects Study (APPLES) in June 2007, the Abbott preschool
program ranks as one of the highest-quality state preschool programs in the nation, as the highest
in providing access to three year olds, and the best funded. The APPLES study reveals evidence
that classroom quality in the Abbott Preschool programs continues to improve as a whole, that
children who attend the program are improving in language literacy and mathematics at least to
the end of kindergarten year, and that children who attend preschool for two years at ages three
and four significantly outperform those who attend for only one year or not at all. The study also
found that preschool children in public school classrooms slightly outperformed others in early
literacy support.
This study included data from the Early Learning Improvement Consortium (ELIC)
results from 2003, the year the subjects attended preschool (Appendix I, I1 and 111) to document
the quality of District A's Abbott preschool program. The ELIC is an ongoing multi-year
initiative, in which participating New Jersey institutions of higher learning assist the NJDOE in
identifying the needs of the preschool children and programs. The data from the ELIC on
District A was used to establish the quality of the early childhood program. ELIC is responsible
for collecting the data, reporting the findings, and assisting in the development of improvement
plans and professional development programs related to the identified areas in need of
improvement. ELIC collected classroom data using the Early Childhood Environment Rating

Scale (ECERS-R), the Supports for Early Literacy Assessment (SELA) and the Preschool
Classroom Mathematics Inventory (PCMI).
The study investigated student achievement in mathematics and language arts literacy on
the New Jersey Assessment of Skill and Knowledge 3 (NJ ASK 3) during the spring of 2007.
The NJ ASK3 is a standards-based test given to all third-grade students in New Jersey's public
and charter schools to measure student attainment of the New Jersey Core Curriculum Content
Standards. All students are tested, with the exception of a very small limited number of special
needs students with the most significant and severe cognitive disabilities who are tested using an
alternative assessment tool.
The significance of this study lies in its ability to assess to what degree, if any, have
interventions mandated by the Abbott regulations in the form of Early Childhood education for
three- and four-year-olds been sustained through the third grade for different groups of students
who participate in the District's Early Childhood Program. This research is a quantitative study
to analyze the sustainability of the effects of participation in a quality preschool program through
the third grade for different groups of children. Student achievement in District A is analyzed
based on the scores attained in mathematics and language arts literacy in the spring of 2007.
The analysis delved into the sustainability of the benefits and the effects based on participation in
the program, socioeconomic status, race, mobility, gender, and school NCLB status for students
who participated in the District's Abbott's early childhood program at the same school, moved
within the district, and new students who did not participate in the District A's preschool
program.

The Research Question
What is the sustainability of the academic benefits of preschool education in an Abbott
district? To what extent is academic achievement influenced by continuous enrollment in the
same school from preschool to third grade; and are there differences in academic outcomes
between students who have a history of continuous enrollment in the same school versus those
who have changed schools since preschool or those who have never attended preschool in the
district?
Subsidiary Questions
1. What is the difference in language arts literacy and mathematics achievement between
students who participated in an Abbott preschool program at the same school and those
students who transferred schools within the district and those who did not attend
preschool?
2. When race is controlled for, does academic achievement in language arts literacy and
mathematics persist for students continuously enrolled, as opposed to those who
transferred within the district, or those who did not attend the preschool program within
the district?
3. When socioeconomic status, SES, is controlled for, does academic achievement in
language arts literacy and mathematics persist for students continuously enrolled at the
same school, students who transferred within the district, and students who did not attend
the Abbott preschool program?
4. What are the effects in language arts literacy and mathematics achievement associated
with gender for students continuously enrolled at the same school, students who
transferred within the district and students who did not attend preschool in the district?

5. When absences are controlled, does preschool participation in an Abbott program impact
students' academic achievement in mathematics and language arts literacy, based on their
enrollment at the same school, different schools in the district, and lack of participation?
6. How does mobility impact third-graders' academic achievement in language arts literacy
and mathematics, based on preschool participation and enrollment status at the same
school, different schools within the district, and lack of participation in an Abbott
district?
7. How does the school's NCLB status impact student achievement, based on enrollment for
different groups of students in language arts literacy and mathematics?
Design and Methods of the Study
The design of the study is exploratory, to analyze the sustainability of preschool
education through the third grade. Quantitative data were gathered through state- mandated
assessments and numerical data available in the public domain. The school district is classified
as AB in New Jersey's District Factor Group (DFG), meaning it is ranked lowest in
socioeconomic status, compared to J, the highest-ranked district. District A is classified as an
Abbott district receiving additional funds for parity with the more affluent districts in the State.
The statistical analysis was conducted using SPSS sohare .
Limitations
This study has several limitations in terms of scale and research design. The Abbott
districts have poverty as a common descriptor, but their location is spread throughout the state
and range in population. A limitation of this investigation is that the study was restricted to only
one large urban Abbott District. The sample size is roughly 2,200 third-grade students during
the spring of 2007. The sample is all of District A's third-grade students.

A second limitation is the inability to identify the quality of the early childhood program
at different sites. The study assumed that the district implements the Abbott Remedies of quality
preschool mandated by the New Jersey Department of Education and assessed by the Early
Learning Improvement Consortium uniformly. District A implements the High/Scope
curriculum in all district classrooms to deliver a quality program. The data presented by the
Early Learning Improvement Consortium are only representative of classroom observations in
thirty-four classrooms in District A using the Early Childhood Environment Rating Scale
(ECERS-R), the Supports for Early Literacy Assessment (SELA) and the Preschool Classroom
Mathematics Inventory (PCMI). The data are presented in Appendix I, 11, and 111. Due to the
limited number of classrooms sampled within the district, the data may not represent the district
as a whole and changes may be due to random chance, rather than programmatic quality. The
data were collected from statewide assessments.
The third limitation is that the NJ ASK 3 and Early Learning Improvement Consortium
data do not account for other factors that impact on student achievement; such as, school culture
and leadership, home environment, parents' education, written cumculum, implemented
curriculum, and teacher qualification or teacher efficacy.
The Significance of the Study
"The early years are believed to offer perhaps singular opportunities for intervention and
prevention efforts" (Brooks-Gunn & Aber, 1997; Duncan & Brooks-Gunn, 1997), and the
National Institute of Health recently reported that poor children who participate in an intensive
early childhood program show gains far into adulthood. Adults who had participated in an
intensive childhood program as children demonstrate higher educational attainment, lower rates
of serious crime and incarceration, and lower rates of depressive symptoms, than adults who did

not participate as children. The benefits of high-quality child care experiences enhance
children's ability to take advantage of the educational opportunities in school (Ackerman 2006,
Bennett 2004 and Strickland 2006).
Longitudinal studies of the Perry Preschool Program, the Abecedarian North Carolina
Program, and the Chicago Parent Center Program - three programs studied extensively - found
that students who attend a high-quality preschool program are more likely to experience positive
long-term effects academically and socially through the rest of their schooling, and later as adults
in their personal and professional lives (Slaby, Loucks, & Stelwagon 2005; Reynolds, 1999;
Schweinhart, 2008; Jacobson, 2008). Learning in the twenty-first century will be shaped by
global competition; therefore, it is imperative that all members of society are prepared for a
demanding ever-changing workplace. The most important task facing our schools is providing
our students with the necessary tools for the twenty-first century. Consequently, is the preschool
education provided in District A sustained at least through the third grade?
Definitions of Terms
Abbott- is the shorthand name for a series of New Jersey Supreme Court decisions that grew out
of the litigation filed in 1981 on behalf of children residing in New Jersey's most economically
disadvantaged municipalities.
Abbott Districts-are the thirty-one poorest districts in New Jersey to benefit from state
financial assistance to implement specific remedies mandated by the New Jersey Supreme Court.

Achievement Gap-is the disparity in school performance associated with ethnicity, high school
graduation rates, test scores, grades, dropout rates, and college completion (Hernandez Sheets,
2006).
Early childhood - is defined by the NJDOE as "a continuum of developmental stages."
District Factor Grouping System (DFG) - was introduced by the New Jersey Department of
Education in 1975 as a system of providing a means of ranking school districts in New Jersey by
their socioeconomic status (SES). The DFG is a composite statistical index created using
statistical procedures, a "model" of socioeconomic status, and input data for various
socioeconomic traits (NJDOE, 2009).
HighIScope- is one of five research-based curriculum models endorsed by the NJDOE to be used
in the early childhood classrooms, which is directly aligned to the "Preschool Teaching and
Learning Expectations: Standards of Quality" adopted by the New Jersey State Department of
Education.
High-quality preschool- Refers to the quality set forth by the New Jersey Supreme Court in the
Abbot- decisions, and monitored by the NJDOE with the "Preschool Teaching and Learning
Expectations: Standards of Quality".

High-quality early childhood education -in this research, is best described as Pianta, et
a1.(2005) uses it to denote a multidimensionai construct "a comprehensive approach to assessing
quality entails measurement of different constructs and at different levels of analysis".
N J ASK- is a state assessment of student achievement in language arts, math, and science
that was implemented in 2003 to meet the requirements of the No Child Left Behind Act. There
are two major types of questions; multiple-choice, in which students choose one correct answer
from four choices; or open-ended, in which students give a short or long written response.
Language Arts Literacy tests reading and writing skills. The math section tests students'
knowledge of numbers, numerical operations, geometry and measurement, patterns and algebra,
data analysis, probability, and discrete mathematics. The science portion tests life science,
physical science, and earth science in the fourth and eighth grade only (NJ DOE, 2008). The
language arts and mathematics section are used by the NJDOE to measure student achievement
and monitor school quality.
New Jersey Preschool Teaching and Learning Expectations- Standards of Quality- The term
"standards" is used in early childhood education as "Creating the conditions for success." This
definition is the joint position statement of the National Association for the Education of Young
Children (NAEYC and the National Association of Early Childhood Specialists in State
Department of Education NAECSISDE).

CHAPTER I1
REVIEW OF RELATED RESEARCH, THEORY AND LITERATURE
There is a vast amount of educational research documenting the positive impact for
children who attend quality preschool programs. The literature review in this study focuses on
the body of research pertaining to the impact and sustainability of a quality early preschool
education for urban student. Included, as well, is how achievement is associated with traits such
as low socioeconomic status (SES), ethnicity, mobility and gender. The review will also seek to
summarize the history of the Abbott Early Childhood Program that guarantees a free and
appropriate education for New Jersey's poorest three- and four-year-old children. The state-
funded Abbott early childhood program is constructed on the groundwork of the Abbon
litigation and ruling, which increased the opportunity for poor students in New Jersey to
participate in a quality preschool program, leveling the playing field for students enrolled in the
State's poorest districts and eradicate the achievement gap. The gap in academic achievement
for reading and mathematics persists across the United States for poor and minority groups. The
achievement gap between Whites and minority students is not just between race and ethnic
background, but also between race and class, since most urban minorities have lower S.E.S.
History of Early Childhood Education
Originally, infant schools were created throughout Europe in the 1700's to care for the
children of workers at mills and fields. The negative aspect of these schools was that they were
largely copies of schools for older children. Young children were required to sit in rows in large
classrooms, recite lessons, and spend hours doing reading, writing, and arithmetic. It was not
until later that Friedel Froebel founded a school for very young learners. Early childhood

education dates back to the 1 800's, when Friedrich Froebel founded the first kindergarten in
Germany. His theories were highly disregarded because it was believed that children did not
need to play in order to learn. His theory of child development maintained that childhood was a
special phase in life. Froebel's theory emphasized that children learned largely through play. He
felt that young children should not be subjected to formal instruction, as were older children, but
should learn through "self-activity" in play. Froebel opened his first kindergarten at Bad
Blankenburg in 1837. Within 25 years after his death in 1852, his educational theories had
spread to the extent that kindergartens had been started in Austria, Belgium, Germany, Canada,
Great Britain, Hungary, Japan, The Netherlands, Switzerland, and the United States. Many of
the nurseries or kindergartens established during this time were run by philanthropically minded
women to help children of poverty.
A famous name in the history of preschool education is Maria Montessori, a researcher in
education theory who had studied medicine in Rome. She began her studies of educational
problems while working with culturally deprived and mentally deficient children at the
Orthophrenic School in Rome, Italy, in 1899 (Baader, 2004). To implement her theories on
normal children, Montessori opened her Casa dei Bambini (Children's House) in 1907. Within a
few years, her methods had become world famous and Montessori schools were started in many
countries. She is also credited with promoting a substantial number of important educational
reforms that have worked their way over the course of the twentieth century into the mainstream
of education. These include the recognition of multiple pathways to learning, the importance of
concrete, or hands-on, learning, the stages of cognitive development in children, and the link
between children's emotional development and their ability to learn at an optimal rate.
The basis of the Montessori theory was that children go through a series of phases during

which they are particularly ready to learn certain skills, such as reading and arithmetic. If these
early periods are missed in the schooling process, later difficulties in learning may result.
Therefore, she believed, all children should be given a measure of freedom to work at their own
pace, without the tension that results from being in competition with others. The amount of
freedom allowed was not absolute, however, for she believed that all freedom must be combined
with self-discipline and a respect for authority. The individual initiative and self-direction
allowed to children in her school were combined with group exercises and learning social
manners. At the Montessori schools, children learned to read, write, count, and artistically
express their thoughts and plans.
Kindergartens were introduced into the United States by German immigrants. The first
kindergarten was opened in Watertown, WI, in 1856 by Margarethe Schurz, wife of the German-
horn Fredrich Froebel. The first public preschool program in the United States was created in
1925, with the support of a women's club.
In January of 1964, President Lyndon B. Johnson declared "The War on Poverty" in his
State of the Union speech, during an optimistic period of American history, a time when it was
believed that government should take a proactive role in eradicating the negative effects of
poverty on children's development. It was a time when it was popular to think that the growth of
intelligence could be changed by interventions. In May of 1965, President Lyndon B. Johnson
announced Project Head Start in the White House Rose Garden (Styfco 2003), The National
Head Start Program for disadvantaged preschoolers. The Office of Economic Oppomnity
(OEO) was charged with the task of establishing the Head Start program (Kagan, 2002), and it
started in the summer of 1965 as an eight-week summer program for children from low-income
communities who were going into public school in the fall. The program served over 560,000
17

children across the United States of America in the first summer (http://www.ilheadstart.org),
and the program provided preschool classes, medical care, dental care, and mental health
services. The recommended components of the Head Start program were not especially unique,
but it was the first time it was combined with so many interventions and parents played a central
role - an unprecedented component of the design.
In 1969, under the Richard M. Nixon administration, Head Start was transferred from the
Office of Economic Opportunity to the Office of Child Development in the Department of
Health, Education, and Welfare (http:Nwww.ilheadstart.org). The Director of the Office of Child
Development was Edward Zigler, a professor of psychology and Director of the Child Study
Center at Yale University, who also served on the Planning Committee under President Lyndon
B. Johnson.
In 1977, under President Carter's administration, Head Start began bilingual/bicultural
programs in about 21 states (Kagan, 1991). Seven years later, in October 1984, under the Ronald
Reagan administration, Head Starts' grant budget exceeded one billion dollars, and the number
of children assisted was a little more than nine million (2003). In September of 1995, under the
Bill Clinton administration, the first Early Head Start grants were given; and in October of 1998,
Head Start was reauthorized to expand to full-day and full-year services
(http://www.acf.hhs.gov/opa/fact - sheets/headstartgintable.html).
The reauthorization of the Head Start School Readiness Act of 2007 provided additional
funds to improve program quality and expand access. Additional funds were allocated for the
next five years to increase the number of participants, by including children whose families'
incomes were between 100 and 130 percent of the poverty level, ensuring that children with
lower incomes, or are homeless, have priority. The reauthorization also states that, by 2013, at

least 50% of the coordinators and teachers will have a baccalaureate or advanced degree in
childhood education, and teaching assistants will have associate's degrees.
The number of children participating in preschool programs has grown steadily,
especially in the last four decades. The manner in which we finance early childhood education
has changed as well. Information from the last four decades of early preschool programs has
provided important longitudinal data on the impact of participation in preschool programs and
the components of quality preschool programs, based on students' emotional, social and
academic growth.
Longitudinal research studies have found that regular participation in high-quality
preschool programs is linked to significant gains in standardized test scores and work habits, as
well as the reduction of negative behaviors, well into adulthood. Research on the Abecedarian
Program, the Chicago-Parent Child Program, and the High-Scope Peny Program during the last
twenty years illustrates that children who lack stable, consistent relationships with caregivers,
poor access to health care, and little or no access to age-appropriate early childhood learning
activities, will continue to create a workforce that is less-prepared for postsecondary education
and more likely to drop out of school. The first five years of a child's life are particularly critical
in developing basic learning patterns and abilities that will be used for the rest of their lives.
Abboft v. Burke Court Decision
The landmark New Jersey Supreme Court school h d i n g case, Abbott v. Burke,
established the availability of free preschool program for all three- and four-year-olds living in
the state's thirty-one poorest districts, beginning in September 1999. Conversely, this decision
evolved over a thirty-year period and was built as a continuation of the 1970's Robinson v.
Cahill litigation. The Robinson case was filed over the constitutionality of the formula used to

fund public education with property tax revenues. As a result, the Public School Education Act
of 1975 set forth the responsibilities of the NJDOE, including the responsibility of monitoring
local districts to assure that all children were provided with the oppor!xnities to function
politically, economically, and socially in a democratic society. The Abbott v. Burke suit, filed in
1981by the Educational Law Center (ELC), a not-for-profit organization, challenged the
constitutionality of the Act as it applied to low-income school districts, saying it actually
increased disparities (Coffman, 2002). The ELC claimed that the Act was inadequate in assuring
a thorough and efficient education for the poorest children in New Jersey, and the case came to
be known as Abbott I. The disputes continued, and in 1990 with Abbott 12, the New Jersey
Supreme Court ruled that the 1975 Act was unconstitutional as it applied to the state's poorest
districts. The court called for new legislation as well as special programs and services for the
Abbott districts, thereby passing the Quality Education Act in 1990. In 1994, the Abbott 111
decision found the 1990 Act to be unconstitutional, because it failed to provide parity of
educational spending and the State did not adequately address supplemental programs for
disadvantaged students. The Court gave the New Jersey Department of Education (NJDOE)
until 1997 to comply with the ruling, at which time the NJDOE released a plan that then-
Governor Whitman signed into law. The goal was to provide a school-funding formula, cap
spending in suburban districts, implement the New Jersey Core Curriculum Content Standards
(NJCCCS), and limit spending in urban districts at $1,200, an amount per pupil below the
suburban districts. The law was called the "Comprehensive Education Improvement and
Financing Act" (CEIFA).
The ELC challenged the Law and returned to the Supreme Court to expose CEIFA
failure. The New Jersey Supreme Court declared CEIFA unconstitutional and ordered the State

to increase funding for urban schools to place them on a parity with suburban schools. The
Court also called for a special hearing to determine what programs and facilities were needed in
the Abbott districts. "This decision ... meant that the Court assumed administrative
responsibility for establishing policies for overhauling programs in the districts" (Walker,
Achilles, & Frances 2005).
In 1997, the State allocated millions of dollars to the Abbott districts to comply with the
Abbott IV ruling, making it the first year funding was equalized between urban and suburban
districts in New Jersey. After months of hearings, the judge recommended implementation of a
package of supplemental programs, including preschool, at an additional $3 12 million a year.
Thus, the NJ Supreme Court issued the Abbott V, Abbott VI, and Abbott VIIrulings. With the
Abbon VIII decision, the NJ Supreme Court said that a well-planned, high quality preschool "will
have a significant substantial positive impact on academic achievement in both early and later
school years," and ordered an unprecedented series of entitlements for urban school children.
The Court not only ruled in support of early childhood education, but it also delineated
what components were essential for a high-quality, well-planned model. "High quality" was
defined as "universal eligibility for all three- and four-year-olds, with enrollment on demand;
district-led collaboration, with community and Head Start programs able and willing to meet the
Abbott standards; small class size, with fifteen students staffed with a certified (P-3) teacher and
an assistant; State-funded, with adequate facilities to meet the district's needs; a developmentally
appropriate curriculum aligned with the Preschool Teaching and Learning Expectations:
Standards of Quality; social and health services; technical assistance; supervision; and
professional development and evaluation, to assure uniform high quality."

The model for high-quality preschool programs required collaboration between districts
and community programs for funding, services, assistance and oversight, to assure that each
program met the Abbott standards of quality. An outreach and recruitment strategy was required
to identify underserved children and remove the obstacles for future enrollment. The children's
needs must be taken into account, and programs must be designed based on children's needs in
academics, health, social development, possible disabilities, and home language other than
English. The preschool staff must receive professional development and salaries that are
comparable to public schools. The districts must identify their needs and plan individual
programs and district wide programs to meet those needs with a budget prepared for each school,
community program, and district, as well as any additional budgetary needs for the school year.
Lastly, schools and community programs must be assessed for needed improvements and
potential expansion to seek state facilities funding. With the Abbott legislation, the New Jersey
Supreme Court placed the ultimate legal responsibility for the implementation of the Abbott
preschool program upon the State.
Sustainability of Early Childhood Education
Longitudinal studies demonstrate, through current research in neuroscience and child
development, that it is possible to improve outcomes for at-risk students well into their adult
years, and that the financial investment of preschool benefits society with a return on its
investment. According to the National Scientific Council on the Developing Child and the
National Forum on Early Childhood Program Evaluation based at Harvard University, early
experiences determine all future learning, behavior, and health because the genes determine how
the circuits are formed, but a child's experiences shape how they respond (Shonkoff, Boyce, &
McEwen, 2009).

Children from low-income families who participate in high quality early childhood
programs have improved cognition and social development - necessary assets for successful
adults. There is empirical evidence of the short- and long-term effects of participation in quality
preschool programs (Barnett & Jarosz, 2007; Barnett & Boocock, 1998; Gorey 2001 ; Vandell,
Reisner, & Pierce 2007). Participation in quality programs produces results, both immediately
and over a period of time. The immediate benefits are higher levels of cognitive development,
early school achievement, improved motivation, lower retention rates, and fewer referrals for
special education services. In the long run, participation produces higher graduation rates, lower
antisocial behavior, more economic success, and a decrease in delinquency and crime.
The long-term effects of early childhood programs are attributed to the cognitive and
scholastic advantages experienced in the programs (Barnett, 2002; Temple, Reynolds, Miedel
2000). A current hypothesis of the studies tracking participants enrolled in early childhood
programs is that these attributes are enhanced because the abilities are cumulative over time
since childhood (Reynolds & Temple 2005). The effects start out as better classroom adjustment
and school commitment, and later transform into positive adult traits. Additionally, there is
emerging support for the significant role of family participation during a quality early childhood
education, which later translates into less mobility and more involvement with education.
Another major conclusion of the literature on the sustainability of early childhood
programs is that the timing and the duration matters (Mersky & Reynolds, 2007). The most
effective programs are those that begin within the first three years since birth and continue to
multiply over the years and provide support to the families. It is easy to understand why an early
start makes a difference since prevention and positive traits reduce learning difficulties Mersky
& Reynolds, 2007). Early interventions provide the opportunity to improve children's cognitive,

language, and motor skills. Comprehensive programs that include a variety of services and
support on a regular basis over a period of time matter as well.
Long-term studies in the United States have shown the value of high-quality preschool
programs in improving children's achievement immediately, and well into adulthood.
According to Gorey (2001), such programs are the Chicago Child-Parent Centers, the Carolina
Abecedarian Program, the HigWScope Perry Preschools, and Head Start, a federally funded
program. It appears that children from low socioeconomic backgrounds, and those whose
parents have a limited education, may benefit the most as they encounter difficulties in school
and later in life (Frede, Jung, Bamett, & Figueras, 2007).
Studies on the effects of the HigWScope Perry Preschool found that, despite diminishing
effects on academic achievement and intellectual performance by age ten, for the participants
enrolled in an early childhood program, fewer students (17%) were retained at a grade level or
enrolled in special education classes, compared to 38% of the children who did not participate.
Also, by age fourteen the academic achievement gap seemed to get bigger between the
participants of the experimental group, and those students who did not participate, the control
group.
The social and behavioral impact of participation in the Perry program is considerable by
age 27. Only 7% of the adults who participated had been arrested a number of times, compared
to 35% for the non-participants (Table 2.1). As adults, the participants were more likely to be
successful and attain ahigher economic status, while 29% of the participants were more likely to
earn $2,000 more per month, as opposed to only 7% of the control group. Almost three times as
many participants owned their homes by age twenty-seven and demonstrated a lower rate of
public assistance. About 80% of the adults who did not participate in the Peny program received

welfare or public assistance at some time, as opposed to only 13% of the program participants.
The educational attainment was also significant for the participants. Seventy-one percent of the
participants attained a high school diploma, compared to only 54% of the non-participants.
Table 2.1 Comparison of the Impact of the HiiWScope and Head Start Programs on Social and Behavioral Outcomes for Preschool Participants and Nonparticipants
HighJScope Perry Preschool Retained or classified bv age 10 17% - - Arrested by age 27 7% Higher monthly income 29% Collect welfare 13% Educational attainment 71% Head Start Female HS. diploma 95% Arrested by age 27 5% 15%
Source: Strengthening Head Start What the Evidence Shows, U.S. Department of Health and Human Services 2003 and "Dollars and Sense: A Review of Economic Analyses of Pre-K
Head Start, a federally funded program for low income families, was created in 1965 to
promote school readiness and enable each child to develop his or her fullest potential. A recent
study of children in the Head Start Program found that they scored higher than their peers on
cognitive, language, and social and emotional competency (Table 2.1). However, Head Start
children continue to perform below the national average. In 2000, a follow-up study of the long-
term effects found evidence of school success and diminished crime. For female students, only
5% failed to receive a high school diploma, while 19% of the non-participants failed to graduate.
Similarly, only 5% of the participants were arrested for crimes, while 15% of the control group
had been arrested (Schweinhart, 2002).
The Chicago Child-Parent Center is an early intervention program that provides
comprehensive educational and family support services for economically disadvantaged minority

children from age three to nine who grew up in high-poverty Chicago neighborhoods. The
program was established in 1967 with Title I funding. Reynolds, the chief investigator of the
Chicago Longitudinal Study and a professor at the University of Wisconsin-Madison, reported
that the large-scale study demonstrates long-term effects. Additionally, Reynolds examined the
effects of intervention on education, economic well-being, health and family outcomes. The
study documented the determinants of child maltreatment, delinquency and crime, as well as
educational attainment and economic well-being. The goal of the program was to understand
how early childhood experiences affect development, adulthood, and " ... promote children's
academic success and to facilitate parent involvement in children's education" (Reynolds & Ou,
2004). Criminal incidents were lower for the preschool group, with a 33% reduction in juvenile
arrests and a 41% drop for participants on violent arrests. By age twenty, the preschool group
had a higher rate of high school graduation than the non-participants by 29%, and a lower
dropout rate. When examined by gender, the data demonstrated that the program was more
beneficial for boys than for girls, a significant finding, since African American boys show a
higher risk for school failure. Similar to the Peny program, the Chicago program had a lower
retention rate and a lower referral rate for special education. Reynolds claimed that these
findings have significant social and economical implications since "success builds on success, so
this type of early success is providing a strong foundation for learning that culminates in long-
term benefits."

Table 2.2 The Impact on Social and Behavioral Outcomes Based on Participation in the
Chicago Child-Parent Centers
Chicago Child-Parent Centers Juvenile arrests Violent arrest Drop-out rate -29%
Source: The Chicago Longitudinal Study: A Study of Children in the Chicago Public Schools
The Carolina Abecedarian Project was a comprehensive early childhood program
designed for children h m age 4 months through age 5 years at risk of developmental delays and
school failure. It operated in a single site from 1972 through 1985 in North Carolina, and has
been the subject of extensive studies. The preschool program until age three was essentially a
day care service, with the goal of creating a stimulating and structured environment to promote
growth and learning, along with nutritional supplements, pediatric care, disposable diapers, and
supportive social work services. Children began attending the program between six weeks and
three years of age and continued until kindergarten. At age three, the children received a more
structured curriculum similar to the public schools. As children grew older and entered public
school, a resource teacher was assigned to each child and family and provided supplemental
activities for the children, assisted or tutored the family on how to use the home activities,
tutored the children directly, met regularly with the classroom teacher, and became an advocate
for the child and family. Research has found that children who participated had higher cognitive
test scores from toddler to age 2 1. The academic achievement of participants in reading and
math was higher from the primary grades through adulthood and participants were more likely to
attend college. The participants as a group were older when their first child was born. The
mothers of children who participated in the program achieved higher educational and

employment status, especially if they had been teenage mothers. The Abecedarian results
suggest that interventions early in life have greater influence than later experiences (Reynolds,
Mann, Miedel, & Smokowski, 1997).
Essential Components of High-Quality Preschool
Longitudinal studies of the previously mentioned programs have produced strong
evidence of the short- and long-term effects and benefits for participants. Even though the
programs vary greatly, with mixed evidence, some major elements have consistently been
present in the programs and produced an impact. The data have produced a substantial body of
evidence on the components of a high-quality preschool program that create sustainable impact.
Effective center-based programs provide some combination of the following characteristics
which have been demonstrated to enhance child cognitive and social development. The
consistent components of a quality preschool program are: a developmentally appropriate
curriculum, small classes, highly qualified certified staff, and a supportive environment for
adequate social development. These components are pathways through which high quality early
childhood education affects competence and behaviors.
Highquality preschool programs have developmentally appropriate curricula, being
based on interactive or constructivist theory, which is essential in an active exchange between
the teacher and the student. This exchange includes all the planned. As well as the unplanned,
activities within the day - the entire range of experiences children have at school. There are clear
content objectives and learning outcomes with careful observations of the teachers' guide to the
curriculum. In New Jersey, to assess the quality of the experiences, the New Jersey Office of
Early Childhood Education (OECE) developed the Preschool Teaching and Learning
Expectations: Standards of Quality to define effective teaching practices linked to

developmentally suitable outcomes. Since there is no one best curriculum, the OECE allows all
Abbott districts to choose and implement the curriculum that best suits the needs of the district
(NJOECE).
Small class size needs to be a component of a quality early childhood program, since the
interactions young children experience can be either growth-promoting or toxic. The research on
established programs suggests that when groups are smaller teachers tend to have more positive,
supportive, and stimulating interactions with the children. Warm and caring interactions are
closely linked to social development and future academic success.
Employing certified, highly skilled, early childhood teachers with adequate salaries,
correlates by far with the strongest student achievement in reading and mathematics, while
controlling for student poverty and language status (Darling-Hammond 1999). These findings
are consistent with the literature of the Abecedarian Study, the Perry Preschool Project, and the
Chicago Child-Parent Center program. Teacher qualifications for the program were a bachelor's
degree and an early childhood certification for all teachers. The programs had well-paid, well-
educated, and continually trained teachers (Malleo, 2007).
Studies link teacher quality and effective practices to adequate economic compensation.
A good salary tends to be appealing and provides administrators with the tools to recruit highly
qualified personnel and prevents teacher hunover. In 2004, Barnett, Bridglall, Cauce, Gordon
and Lee, et al. wrote that teacher mobility is extremely detrimental to the effectiveness of quality
preschool programs and wasteful of resources. Regrettably, the United States lags behind other
developed nations in providing equitable learning opportunities for young children.
Sensitivity to non-educational issues must be a component of a high quality early
childhood program. Longitudinal studies, with repeated measures from birth to adulthood, show

that most antisocial adolescents and adults had behavior problems during childhood (Keating &
Hetzman, 2000). The origin of these problems can be traced to prenatal and infancy
development. Preventive interventions for at-risk families clearly reduce the frequency and
seriousness of the behavior. Highquality preschool education can support social development
and yield short- and long-term benefits. Practitioners must have the professional knowledge,
obtained through certification, and ongoing professional development to support students and
their families. Nurturing, responsive, and individualized relationships increase the advantageous
outcomes by promoting healthy brain development, as the relationships contribute to the
formation of well-functioning neural circuits (Shonkoff, 2000). Caregivers and teachers in
quality early childhood programs play as important a role in promoting social and emotional
skills as parents. A small number of studies also suggest that long periods of time in low-quality
programs slightly increase children's aggression levels. Scientific knowledge is clear that
cognitive, emotional, and social competence evolve hand in hand in a supportive environment
(Shonkoff, Meisels, & Zigler, 2000). Currently, teacher preparation programs and professional
development for practitioners do not pay as much attention to the nation's demographic in terms
of cultural and linguistic diversity, or to the diversity of family structures, as is needed to close
the achievement gap (American Association of Colleges for Teacher Education Focus Council
on Early Childhood Education, 2007).
Perry HigWScope Curriculum
District A implements the HigWScope Preschool Curriculum. The curriculum is based
on the work of constructivist Jean Piaget and High/Scope founder David Weikart. The basic
premise of the curriculum is that children learn best by doing. Children and adults share control
in the HighIScope curriculum, while at the same time, the teacher is the facilitator who observes,

interacts, and keeps children engaged, while promoting learning. Preschoolers' leaming is
guided by 58 experiences in language and literacy, mathematics and science, social-
development, physical development and the arts. Additionally, children are actively involved in
group activities, develop self-care skills, socialize during meals, and participate daily in outdoor
physical activities to promote large motor skill development. The HighJScope curriculum
integrates most aspects of children's development through daily routines.
Support for the HighJScope curriculum comes from the data of longitudinal studies of the
model conducted by the foundation, independent research, and interventions replicated in several
studies, including the Abecedarian Project and Chicago Child-Parent Centers. Tbe studies find
that children attending a well-implemented HigMScope program academically and socially
surpass those in other settings. The HigMScope Perry Preschool Study (Schweinhart, 2002), as
well as studies in the United Kingdom and the Netherlands, found that, when children plan and
carry out their own learning activities, their behavior is more purposeful and perform better on
language and intellectual measures.
Socioeconomic Status and Student Achievement
Family income and poverty, the socioeconomic status (SES) of the family, are powerful
correlates of the cognitive development and behavior of children. As far back as 1966, the
Coleman Report concluded that differences in students' family backgrounds accounted for the
greatest amount of variance in their achievement. This statement has been supported by other
researchers, who concluded that academic achievement is affected by the lack of support for
academic development. They made the, now obvious, point that books, positive role models,
help with homework, and a place to study in the home are associated with school achievement
(Haynes, 2008).

Children's IQ is found to be higher in neighborhoods with greater concentrations of
prosperous neighbors, while in low-income neighborhoods the incidence of behavioral problems
increases. Lack of money has a significant impact on toddlers' health, beyond the influence of
maternal education and health problems. Even in industrialized nations like the United States,
children's health can be negatively influenced by a lack of material resources. In the United
States, our youngest citizens suffer the highest poverty rates. Nearly one in five children under
the age of six lives in poverty (Lynch, 2004). Black and Hispanic families have the lowest
family income, compared to their Caucasian and Asian counterparts. The rise of child poverty is
a result of many societal and economic factors, such as the changes in divorce and marital
patterns, unemployment, and falling wages for less-educated adults. The increase of the divorce
rate and number of single mothers has resulted in more children living with only one parent and
living on a lower income.
Literacy is closely connected to social status as a defining characteristic of social class.
People use language to engage in social activities, increase their potential knowledge, and
advance their status (Keating & Hertunan, 2000). A longitudinal study by Hart and Risley in
2003 demonstrated a discrepant exposure to word stimuli fiom parents at home based on their
SES. For example, the average child with a parent receiving welfare assistance was exposed to
about 616 words per hour, while the average working-class child was exposed to 1,251 words
and a professional's child was exposed to about 2,153 words per hour. The researchers also
observed that the ratio of affirmative words to prohibitive words was alarming. Professional
families used affirmative words at a ratio of 6: 1 , for working families it was 2: 1, and for families
on public assistance it was 1 :2, which can produce developmental implications (Zaman, 2006).

Data from the U.S. Department of Education National Center for Education Statistics
Early Childhood Longitudinal Study, Kindergarten class of 1998-1999 concluded that low-
income children entering kindergarten score significantly below their more affluent counter parts
in reading and math. The average cognitive score for children in the highest socioeconomic
group is 60% above the average score of children in the lowest socioeconomic group. The
achievement gap between the scores of children in the highest and lowest socioeconomic is
present at age four, and remains throughout their academic experience, depending on their
parents' income and education. The disparity in achievement is also evident in the size of their
vocabulary by third grade. Students from middle- and upper-classes with educated parents have
a vocabulary that is three times as large, or composed of about 12,000 words, compared to a
vocabulary of 4,000 words for lower SES students.
A widespread conviction among educators is that learning to read and write is crucial for
a child's success in school, and later in life. Literacy, reading and writing, is based on
prerequisite foundations such as processing cognitive skills, emergent literacy skills, vocabulary,
and strategies. Children need a rich language and conceptual knowledge, based on a broad and
deep vocabulary and verbal reasoning, to understand the printed message (McCardle,
Scarborough, & Cans, 2001). Hispanic students tend to perform the worst in school, and a
perceived explanation is the difference between communication styles, verbal and nonverbal, of
Hispanic children and their parents, as well as the residential segregation among poor Hispanic
immigrant families.
Race and Student Achievement
According to ongoing studies of The Trends in International Mathematics and Science
Studies (TIMSS), fourth- and eighth-grade American students continue to exceed the

international average on math and science tests. However, American students are well behind
their Asian students, and trail behind a few European countries. In the United States, the
achievement gap for certain ethnic or minority groups is well-documented by decades of data
from standardized tests in reading, mathematics, and science. In 2004, Secretary of Education
Rod Paige stated, "The Achievement Gap is the major driver of racial inequity in this country,"
and educators across the nation tend to agree. Table 2.3 demonstrates these differences in
reading achievement for fourth grade students from 2002 to 2007 using the National Assessment
of Educational Progress (NAEP) data.
Table 2 3 Average New Jersey Scale Score for Reading by Ethnicity Used By NAEP Reports After 2001
White 2003 2005 2007
Black 2003 2005 2007
Hispanic 2003 2005 2007
Fourth grade scores 235 232 238
Eighth grade scores 277 278 278
Note: The NAEP Reading scale ranges from 0-500. Observed differences are not necessarily statistically significant. SOURCE: US . Department of Education Sciences, National Center for
Education Statistics, National Assessment of Educational Progress (NAEP), 2003,2005 and 2007 Reading Assessment
Every year, Black and Hispanic students perform significantly lower than White students
in reading. Trends in White, Black and Hispanic achievement tell the same story for fourth- and
eighth-grade reading achievement. These achievement scores have ramifications for students'

subsequent educational attainment. Economic, racial and ethnic divisions are closely connected
and persistent in New Jersey, as minorities and lower-income students make up most of the
population in urban school districts around the state. As a result, there is a pattem of
concentration of people of color within urban cities and towns, while surrounding areas have
small numbers of these population groups. The longer a child is in poverty, the more harmful the
effect on his or her educational growth. Furthermore, the concentration of poverty within a
school can be detrimental for all students, whether or not they come from poverty (Orland,
1990).
While educators and most citizens affirm the importance of education in the twenty-first
century, Black students, as a group, are the poorest-performing children on virtually every
standardized academic assessment instrument in every school district in the United States, one of
the most educated countries in the world. "As a group, Blacks persist as the most economically
and socially marginalized group in America" (Davis & Martin, 2008). The US. Census Bureau
reports that Blacks are the poorest, economically and academically, when compared to other
ethnic groups in the country. As researchers report their findings on the achievement gap of
Black students, they are unable to communicate, or explain, precisely the cause. Why do Black
students consistently score, on average, below other ethnic groups? In a report, published in
2004 by the National Center for Education Statistics (NCES), entitled, "Status and Trends in the
Education of Blacks," Black students scored lower than all other racial groups and Hispanic
subgroups on both the verbal and mathematics section of the SAT. On average, Blacks scored
96 points below their White counterparts. Even when one compares Blacks and Hispanics with
incomes comparable to those of Whites, the achievement gap, as measured by standardized
testing (NCES, 2001), is still evident.

Hispanics now constitute one-fifth of the population in the United States and, in District
A constitutes almost two-fifths of the student enrollment, due to the segregation of minority
students in urban districts. According to national projections, the number of Hispanic students
around the country will continue to increase. Hispanic children lag well behind their White
counterparts on measures of school readiness and achievement, and the pattern of lower
achievement persists through high school and college. Research attributes the lower
achievement to lower levels of school readiness, and school achievement to the family's level of
education as well as low incomes combined with the different home language. Hispanic students
experience more risk factors associated with lower academic achievement than their White
counterparts. Although background differences are evident in the Hispanic community, many
factors are common. Hispanic students are much less likely to have a parent with an earned
educational credential at any level than White students. Hispanic students nationwide are more
likely to live in poverty, with family income below $25,000 a year. The disparity in student
achievement is evident even among the more affluent when compared to their White
counterparts.
Mobility and Student Achievement
The population of the United States is highly mobile. However, in urban schools
instability is increased by neighborhood and community poverty, and also by the attempt of
families to secure better housing and a safer environment. Students' moving from one school to
another for reasons other than being promoted to the next school level is widespread in the
United States. Studies that do not control for background characteristics of students consistently
find that mobile students have lower achievement, on average, than stable students. Studies that
do account for background differences, however, find that mobility may be more of a symptom

than a cause of poor school performance. Such studies indicate that only frequent moves of three
or more predict grade retention, and that mobility during elementary school as well as during
high school diminishes the prospect of high school graduation. The mobility caused by changing
schools has an impact psychologically, socially, and academically. However, the size of the
impact is dependent on the number of changes, when the changes occur, the reason for the
changes, and the student's personal and family situation. Mobility has potentially deep and
pervasive consequences for the students involved, and more broadly for the classrooms and
schools they attend (Kerbow, 1996).
Kerbow, in a study funded by the Office of Educational Research and Improvement and,
US Department of Education, and published by the Center for Research on the Education of
Students Placed at Risk (CRESPAR) of the Chicago public schools, revealed that most of the
instability was caused by the shifting of students within the system rather than by families'
moving into and out of the district. According to the study, mobile students are a distinct group,
compared to their stable counterparts with very clear trends. White students were more likely to
remain at the same school, while the pattern is reversed for African American students, who are
more likely to move. Hispanic and Asian students had mobility rates similar to the rate for
White students. The study found that students with higher SES were more stable, and that
students who lived in a "mother-father" household were also less mobile. Students in the
Chicago public schools who moved more often were more likely to move several times a year at
various times within schools of similar academic accomplishments and come from homes with
lower SES and non-traditional compositions.

Gender and Student Achievement
According to a report using NAEP data, scores showed that, "with few exceptions,
American boys are scoring higher and achieving more than they ever have before" (Perkins-
Gough, 2006). In reading, the achievement of both fourth- and eighth-grade boys has improved
since 1992, even though the trend for twelfth-grade boys tends to remain flat. In mathematics,
boys of all ages and races are scoring as high as, or higher than, ever before. When compared
with girls' performance, boys' performance shows no recent decline. Boys score higher in
science and mathematics, while girls score higher in language literacy. Elementary school boys
have been more likely to be held back a grade, but the trend is diminishing. The biggest gender
gap in educational attainment is for Black and Hispanic boys. Even though the scores are
improving for all students, the gap for Black and Hispanic males is from two- to-five times as
big.
Orientation of the Study
"Academic ability is one expression of intellectual competence that is recognized as the
universal currency for technologically advanced societies" (Haynes 2008). Such aptitudes,
according to numerous researchers, are the product of exposure to the demands of specialized
cultural experiences like schooling, an interaction which widens the variety of human potentials.
Students from poor families are less likely to succeed in school for a variety of reasons.
Nonetheless, significant amounts of data from longitudinal studies demonstrate that quality
preschool programs positively impact on students' achievement and lifelong attainments.
Research demonstrates that the benefits of early treatment, with a quality preschool
program for children living in poverty, positively impacts on their literacy and mathematics
achievement. New Jersey has passed legislation and provided funding for high-quality preschool

programs in the state's thirty-one poorest districts. This study seeks to assess the sustainability
of preschool education on students' third grade achievement. To what extent is academic
achievement influenced by continuous enrollment in the same school from preschool to third
grade; and are there differences in academic outcomes between students who have a history of
continuous enrollment in the same school versus those who have changed schools since
preschool, or those who have never attended preschool in the district? Has the Abbott preschool
program in District A assisted in improving children's social and cognitive skills? Has
participation in an Abbott preschool program impacted on children's mathematics and literacy
skills, as measured by the mandated third grade NJASK assessment? How does the academic
achievement of students who participated in District A's preschool program, and remained in the
same school, compared with the achievement of students who changed schools within the district
and the achievement of students who did not participate in the early childhood program, when
controlling for the school effect?
Over the past forty years, many studies have been conducted to analyze the short- and
long-term benefits of preschool programs. The findings are consistent, regardless of the research
style. High-quality preschool programs produce meaninghl gains in cognitive, social, and
emotional development (Bowman, Donovan, & Burns, 2001; Bamett & Boocock, 1998; Barnett,
2002). Conversely, the gains on IQ tests clearly disappear over time in the vast majority of
studies, which have caused considerable controversy about the sustainability of early
achievement and how well IQ tests measure intelligence.
The inequalities of cognitive ability are substantial, right from the beginning;
disadvantaged children enter kindergarten with significantly lower cognitive skills than their
more affluent counterparts. According to the ECLS-K, a data collection that offers a nationally

representative picture, there are observable differences in mathematics and literacy by race,
ethnicity, and socioeconomic status (SES).

CHAPTER I11
METHODOLOGY
Introduction
This study of preschool sustainability, as demonstrated by academic achievement in third
grade, is a descriptive research study that examines data to explain patterns andlor relationships.
Research supported by the National Institute for Early Education Research (NIER) provides clear
evidence that classroom quality in the Abbott Preschool Program continues to improve, and that
children who attend the program continue to improve in language, literacy and math, at least
through the end of kindergarten. How sustainable are the effects of an Abbott highquality
preschool program on student achievement in literacy and mathematics assessment by the end of
third grade? This study measures student achievement using the mandated state assessment NJ
ASK3. The NJ ASK3 is a standards-based test used to assess achievement in Language Arts and
Mathematics in New Jersey, as it relates to the New Jersey Core Curriculum Content Standards.
The study also used data from the Early Learning Improvement Consortium Summary Report
(Appendix I, I1 and 11) to establish that the preschool program was of high-quality. Chapter 111
describes the sample used for the study, the instrument used to collect the data, the validity and
reliability of the data, the instrument used to confirm the quality of the preschool program, and
the procedures for data collection and analysis.
In order to analyze the sustainability of preschool participation in an Abbott high-quality
preschool program, a large northern urban district from the thirty-one poorest districts in New
Jersey, District A, was selected. The school district used for this study is the second largest city
in the state, a culturally diverse urban community of approximately 15 square miles and home to

240,055 individuals within 93,648 housing units with a population density of a little more than
16,000 people per square mile, according to the 2000 Census. District A is located in one of the
five poorest counties in the state, with an official poverty rate of about 43% according to the
Census in 2005. This city is the eighth poorest city with a population of more than sixty-five
thousand. According to Census 2000, the population of the city is diverse, made up of
approximately 29% White (non-Hispanic), 22% Black (non-Hispanic), 21% Hispanic, 13%
Asian, and 15% other.
District A is composed of twenty-seven elementary schools, five middle schools, and six
high schools for residents from age 4 to high school graduation. There are 28,245 students
enrolled in the district. The ethnicity of the students enrolled in District A are divided as
follows: African American, 35.71%; Asian American, 13.60%; Latino American, 38.3 1%;
Native American, 1.66%; and Caucasian, 10.72%. The graduation rate for the district's high
schools is 66%, according to the New Jersey State Report Card. During the 2006-2007 school
year, the first language spoken at home in order of frequency for District A was Spanish, 53.3%;
English, 37.4%; Arabic, 2.6; Urdu, 2.1%; Gujarati, 1.8%; Tagalong, 0.6%; and others, 1.9%.
Sample
From the population of District A, the sample used in the research is all the third-grade
students enrolled in the district's elementary schools during the 2007-2008 school year. The
sample consists of students who participated in the Abbott preschool program and are coded
continuously enrolled, and students who for some reason did not participate in the preschool
program and are coded not continuously enrolled. The data of all 2,200 registered third-grade
students were collected during the spring administration of the 2007 NJ Ask 3 Test. All three-
and four-year-olds are eligible to participate in the Abbott Preschool Program. All four-year-old

students are enrolled in the district's elementary schools; however, due to limited space not all
schools can accommodate three-year-olds. Students who are not accepted into the district's
public schools due to lack of space are enrolled in centers coordinated by non-public school
personnel. District A supervisors and master teachers monitor the centers and providers to make
sure they follow the mandated guideline created by the Abbott Legislation. The lack of space
within the district's public schools creates much of the mobility experienced by the preschool
students.
The sample is divided into three groups of continuously enrolled students, CES, see
Table 3.1. Group 1, coded "students continuously enrolled," is all the students who attended the
district's Abbon preschool program and remained at the same school from preschool through the
third grade. Group 2, coded "students continuously enrolled in the district," is all the students
who attended the district's Abbott preschool program but moved to another school before the
third grade, either because the family moved or because the school does not have the facilities
for a preschool program within the school building. Group 3, coded "students who did not
attend preschool," is all the students who did not attend the district's Abbott preschool program,
either because the family moved into the district from another city or country, the family chose
not to send the child to preschool, or the child attended a non-Abbott preschool program. The
data are public domain and readily available. The score of every student was included in the
data. The study did not identify students by name or any other distinguishing information.

Table 3.1 Description of the Three Enrollment Groups of Students Included in the Data Sample
CES Description Grouu 1 Students who attended ureschool and remained at the same school
through the third grade Group 2 Students who attended preschool and remained within the school
district through the third grade Group 3 Students who did not attend the district's Abbott preschool
Research Design
This was a quantitative research study that explored the sustainability of the benefits of
preschool participation in a specific Abbott district, and to determine which children benefit the
most when analyzed by enrollment status such as continuously enrolled in the same school since
preschool, enrolled in the same district since preschool but attended more than one school, and
students who did not attend the district's Abbott high-quality preschool. A quantitative approach
is used to determine the relationship between two variables, as it seeks to establish a relationship
between participation in a high-quality preschool program and the sustainability of the effects on
student achievement in language arts and mathematics for different groups.
The methodology of this research is descriptive and lends itself to a cross-sectional study,
since student achievement was assessed only once during the spring of 2007. Descriptive
research methods are designed to clarify, compare, and explain any association or relationship
that may occur in the data (McMillan, 2000). The statistical analysis will be conducted using
SPSS software. The data of this study lends itself to univariate analysis of variance (ANOVA).
A univariate analysis is used to compare several means. The study compared the academic
achievement of students who participated in an Abbott preschool program to investigate if

students who participated in an early childhood program have scores that are statistically
significant, and the impact of gender, SES, ethnicity, mobility, school effect and attendance on
student achievement in mathematics and language arts.
The purpose of this study was to examine the sustainability of the Abbott Remedy, high-
quality preschool program, as mandated by the Abbott Legislation and implemented in District
A, as well as its sustainability on specific groups of students when implemented in District A.
To determine the sustainability of highquality preschool in District A, this study relied heavily
on numerical data available to the public domain. The numerical data are the result of the state-
mandated NJ ASK3 testing in language arts literacy and mathematics, and district level data on
socioeconomic status (SES), attendance, ethnicity and gender. An additional source of data for
this study was the Early Learning Improvement Consortium Spring 2007 Five year Summary
Report (ELIC) for District A.
Third-Grade Assessment
Student achievement in third grade was measured using the NJ ASK 3. The New Jersey
Assessment of Knowledge (NJ ASK) is designed to provide an early indication of the progress
students are making in mastering the knowledge and skills described in the New Jersey Core
Curriculum Content Standards, according to the Executive Summary published by the NJDOE.
In the spring of 2007, the third grade NJ ASK 3 consisted of two content areas, language arts
literacy and mathematics. The NJ ASK scores are reported as a scale score in each of the content
areas. The scores range from 100-199 (Partially Proficient), 200-249 (Proficient), and 250-300
(Advanced Proficient).

Table 3.2 NJ ASK 3 2007 Language Arts Literacy and Mathematics Scores - - Based on District's DFG*
Partiallv Proficient Advanced Proficient " Proficient
Language Arts Literacy State 16.60% 75.20% 8.20% DFG A 33.90% 63.70% 2.40% District A 29.53% 66.97% 3.50% Mathematics State 12.70% 55% 32.30% DFG A 27.70% 56% 16.40% District A 15.91% 59.69% 24.40%
'* DFG school district's socioeconomic status
The N.J.D.O.E. claims that the information from the mandated assessment is used by
schools and districts to identify strengths and weaknesses of the education program, thereby
improving instruction and alignment to the NJCCCS. The information is also used to create the
School Report Card required under the 1995 law, as well as the NCLB Report. In order to meet
the requirements of the NCLB legislation, the NJDOE uses the information from the NJ ASK
which provides state mandated assessment in grades 3 through 11, as well as incorporating all
the required conditions such as student attendance, the dropout rate, teacher and paraprofessional
certification. The NCLB Report includes school, district, and state summary for the current and
previous year. Data are presented by content area, indicating the proficiency level for a band of
grades, elementary grades 3-5, middle school grades 6-8, and the high school grade 11.
Therefore, without going into details of the obvious, the importance of student achievement on
the NJ ASK has significant implications for the students, the school, and the district.
According to the New Jersey Department of Education's NJ ASK 3's Technical Report
published during the spring of 2007, the validity of the NJ ASK scores is based on the alignment

of the NJ ASK assessment with the NJCCCS, and the knowledge and skills expected of third
grade students. The reliability estimates are based on content areas and clusters using
Cronbach's coefficient alpha measure of internal consistency. Cronbach's alpha is used on tests
containing items scored along a range of values. The standard errors of measurement (SEM) are
based on a raw score metric and the scale score metric ranges from 100 to 300. Following are
the reliability estimates and standard errors of measurement for language arts literacy and
mathematics based on the NJ ASK 3 administered during the spring of 2007.
Table 3.3 Validity of the NJ ASK Content Based on the Alignment of the Assessment with the New Jersey Core Curriculum Content Standards
- - - - -
Number Reliability Raw Scale Score of Points Score SEM
SEM Language Arts Literacy 40 0.83 2.07 9.24 Mathematics 33 0.86 2.53 10.72 Source New Jersey's Department of Education Technical Report 2007
Early Childhood Assessment
The ELIC administers observations annually in all Abbott districts to establish and
monitor the quality of the preschool programs. The ELIC use trained data collectors to observe
randomly selected preschool classrooms, using structured classroom observation instruments that
assess the materials, the environment, and teacher-child interactions. The selection of preschool
classroom was made after an initial observation of 3 16 classrooms and stratified by auspice.
Then random selection was made, appropriately, with a final sample made up of 104 public
school administered classrooms, 176 private child care center classrooms, and 25 Head Start
classrooms. The observations were recorded using the Early Childhood Environment Rating
Scale-Revised (ECERS-R), the Support for Early Literacy Assessment (SELA), and the
Preschool Classroom Mathematics Inventory (PCMI). The ECERS-R has been used extensively

in the field and has well-established validity and reliability (Frede, Jung, Barnett, Figueras 2009).
Classroom quality is rated using a 7-point Likert scale. The ECERS-R is comprised of seven
subscales: Space and Furnishings, Personal Care Routines, Language-Reasoning, Activities,
Interactions, Program Structure, and Parents and Staff. The SELA measures 16 items on a scale
from 1 to 5, low quality being 1 and high quality being 5, for the support of early literacy
development. The SELA is comprised of these six subscales, the Literate Environment,
Language Development, Knowledge of PrintIBook Concepts, Phonological Awareness, Letters
and Words, and Parent Involvement. The PCMI measures children's early development of
mathematical skills. This tool uses two sub-scales with 5-points, one being the lowest score and
five the highest. The PCMI measures the materials and strategies used in the classroom to
support children's early mathematical development by assessing counting, comparing,
estimating, recognizing number symbols, classifying, seriating, geometric shapes, and spatial
relations. All the preschool classrooms served school age children in Abbott-funded districts
(Frede, Jung, Barnett, Figueras 2009).
According to the Abbott Preschool Program Longitudinal Effects Study's (APPLES)
Interim Report published in June 2007, the reliability of the ECERS-R assessment has excellent
internal consistency. The Cronbach's Alpha scale demonstrates an internal consistency of
alpha=.90. The SELA has an internal consistency of alpha=.87 and the PCMI's internal
consistency is good at alpha=.86.
The study analyzed student achievement in language arts literacy and mathematics in the
spring of 2007, which was four years after the students participated in an Abbott preschool
program in District A. The assertion of this study is the assumption that participation in a high-
quality preschool program, as mandated by the Abbott legislation has made a sustainable impact

on academic achievement through the third grade, and thereby in the future reducing the negative
impact of poverty. It is also assumed that student achievement in mathematics and language arts
literacy is statistically higher for students who participated in preschool, and that specific groups
of students - those continuously enrolled at the same school, students who moved and attended
more than one school in the district, and students who did not attend preschool - show different
patterns of sustainability.
The New Jersey Supreme Court, through the Abbott legislature, developed a framework
for providing the children in the thirty-one poorest school districts in the state with a thorough
and efficient education by establishing certain remedies. The framework included universal
well-planned high-quality preschool education for ail three- and four-year-olds in the poorest
districts. Research reveals a consensus among experts in the field of childhood development
that a high quality preschool that is designed to enhance and promote children's social,
emotional, and academic achievement can produce children who are more likely to graduate
from high school, to continue with higher education, and to avoid anti-social behaviors.
Children who attend high-quality programs achieve higher reading and writing scores than those
who do not attend. These children, the participants, are also less likely to need more expensive
special education programs andfor repeat a grade. The impact of the Abbott Preschool Program
has been measured by the National Institute for Early Education Research (NIEER) through
longitudinal studies. The results of the NIEER study show that substantial gains in learning and
development occurred in language arts, literacy, and mathematics through kindergarten, and that
the gains are largely sustained through the first grade. Therefore, the goal of this study was to
assess the sustainability of the preschool program through third grade in a particular Abbott
district.

The Research Question
The study investigated to what extent academic achievement is influenced by continuous
enrollment in the same school from preschool to third grade, and if there are any differences in
academic outcomes between students who have a history of continuous enrollment in the same
school, as compared to those who have changed schools since preschool or those who have never
attended preschool in the district. In order to answer the aforementioned question, a number of
subsidiary questions were developed and answered using different types of statistical analysis.
Subsidiary Questions
Subsidiary Question 1
What is the difference in language arts literacy and mathematics achievement between
students who participated in an Abbott preschool program at the same school. As well as, those
students who transferred schools within the district, and those who did not attend preschool?
Subsidiary Question 2
When race is controlled for, does academic achievement in language arts literacy and
mathematics persist for students continuously enrolled, as opposed to those who transferred
within the district, or those who did not attend the preschool program within the district?
Subsidiary Question 3
When socioeconomic status, SES, is controlled for, does academic achievement in
language arts literacy and mathematics persist for students continuously enrolled at the same
school, students who transferred within the district, and students who did not attend the Abbott
preschool program.

Subsidiary Question 4
What are the effects in language arts literacy and mathematics achievement associated
with gender for students continuously enrolled at the same school, students who transferred
within the district, and students who did not attend preschool in the district?
Subsidiary Question 5
When absences are controlled for, does preschool participation in an Abbott program
impact students' academic achievement in mathematics and language arts literacy based on their
enrollment at the same school, different schools in the district and lack of participation?
Subsidiary Question 6
How does mobility impact third graders' academic achievement in language arts literacy and
mathematics, based on preschool participation and enrollment status at the same school, different
schools within the district, or lack of participation in an Abbott district?
Subsidiary Question 7
How does the school's NCLB status impact student achievement, based on enrollment for
different groups of students in language arts literacy and mathematics?
These questions were analyzed using the student achievement score in language arts
literacy and mathematics made available through the NJ SMART site. An Analysis of Variance
(ANOVA) was used for each of the questions using students' scores in language arts literacy and
mathematics. The significance was estimated at p<.05, the acceptable level in the social
sciences. The result of the ANOVAs will frame the response to the seven questions.

To answer these questions, the study utilized data accrued through the NJDOE. The data
are available through public domain and provide a detailed record of student achievement in this
particular Abbott district. Included in this data for the 2003 and the 2007 years are as follows:
(a) Early Learning Improvement Consortium (ELIC) Summary Report for 2003, the year third-
grade students possibly attended the district's preschool program. These data are the averages of
34 observed classrooms representative of the district's program. The ELIC report includes data
using the ECERS-R, SELA, and PCMI tools; (b) District- Wide Assessment Results- these data
are reported as the scores from 100-300 and level of proficiency "advanced proficient"
"proficient" and "partially proficient" in language arts and mathematics on the 2007 NJ ASK 3
(NJDOE); (c) student gender information; (d) student name and district identification number;
(e) attendance/continuous enrollment status; (0 date of birth; (g) race as recorded on district
student information system; and (h) socioeconornic status as measured by the eligibility for free
lunch. The study used statewide assessment on the NJ ASK 3 and the quality of the preschool
program in formulating a conclusion on the sustainability of the Abbott Preschool Program in
District A and within specific groups.
Variables
The dependent variable in this study is student achievement in language arts literacy and
mathematics on the NJ ASK3 during the spring of 2007. The sustainability of student
achievement in third grade after participation in an Abbott preschool program was analyzed. To
establish the quality of the preschool program, data was presented using the ELIC Summary
Report data (Appendix I, I1 and 111). The ELIC Summary (Early Learning Improvement
Consortium) provides longitudinal data on the quality of the preschool programs in each Abbott

preschool program in the state of New Jersey. For the purpose of this study, the ELIC data
presented is for schools in District A for the five years prior to the spring of 2007.
The study used the SPSS 14.1 Statistical Analysis software to investigate the
sustainability of the benefits from preschool participation, using a quantitative approach that
analyzes student achievement. The dependent variables, mathematics and language arts literacy,
were used to explain the impact on student achievement. The independent variables (a) race-
dummy coded; (b) socioeconomic status-dummy coded free, reduced, and paid; (c) gender-
dummy coded; (d) school effect; (e) CES participation-dummy coded; and (f) attendance, are
used determine any difference in achievement is the result of preschool participation or the
impact of the before mentioned independent variables.
Table 3.4 Description of Variables Used for SPSS Analyses - - -
Variable Description Status CES Grou~ 1 - Students who attended Independent --
preschool and remained at the same variable school through the third grade Grouv 2- Students who attended Independent preschool and remained within the school Variable district through the third grade Group 3- Students who did not attend the Independent district's Abbott preschool program Variable
Language Arts Scaled score Dependent Literacy Variable Mathematics Scaled score Dependent
~&iable Race Dummy coded Independent
0= white, l = Hispanic, 2= black, 3= variable Asian
Gender Dummy coded Independent 0= male, I = female Variable

Independent Variable
AYP NCLB Status Coded O=meets NCLB mandates, l=year 1 warning, 2= year 2 Choices, 3= year 3 SES, supplemental educational services, 4= year 4 CAPA collaborative assessment and planning for achievement, 5-year 5 restructuring plan, 6= year 6 restructuring implemented, 7= year 7 restructuring implementation continues
SES Dummy coded Independent 1 = eligible for free meals, 2= eligible for Variable reduced meals, 3= eligible for paid meals
Absences scaled amount Independent Variable
Data Collection
Data for this study was collected from the student management system and the New
Jersey Department of Education NJ Smart Website. This data was determined to be of public
domain; therefore, it did not require the permission of any district administrator. The data found
on the student management system and NJ Smart gave a thorough picture of student achievement
in mathematics and language arts literacy during the spring 2007 administration of the NJ ASK
3. The data included the scores in language arts literacy and mathematics of every third-grade
student registered in District A, as well as an array of other pertinent statistical data used in the
statistical analyses as independent variables.
Data Analysis
The research methodology used in this study relied on quantitative evaluative strategies. The
assertion of this study was to examine student achievement to assess the sustainability of
preschool education through the third grade. The quantitative data was obtained through the
state-mandated standards-based assessment of the NJ ASK 3 results for the spring of 2007. The
data was collected through the New Jersey Standards Measurement and Resource for Teaching

(NJ SMART), a comprehensive integrated data warehouse of student level information created
by the NJDOE. The use of EDanalyzer, a web-based tool, allows districts to view, download
and analyze state assessment data and demographic information. The data warehouse allows
staff to access student achievement information.
Summary
This study was designed to investigate the sustainability of the benefits of early
childhood education through the third grade, as measured in student achievement on the NJ ASK
3 for different groups of students, in comparison to students who did attend preschool. The study
was based on the data of a large urban district with a mandated Abbott preschool program. The
sample was all 2,200 registered third-grade students during the spring of 2007.

CHAPTER IV
DATA ANALYSIS AND RESULTS
Introduction
The purpose of this study was to investigate the sustainability of the academic benefits
gained from participation in a mandated Abbott preschool program through the third grade for
different groups of students; and to explore the extent to which academic achievement is
influenced by continuous enrollment in the same school from preschool to third grade and
whether there are differences in academic outcomes between students who have a history of
continuous enrollment in the same school versus those who have changed schools since
preschool or those who have never attended preschool in the district. The data, used to analyze
the sustainability of preschool benefits, consisted of students' scaled scores in language arts
literacy and mathematics on the state-mandated NJ ASK3, during the spring of 2007. The
enrollment data were coded as "students who attended preschool and are continuously enrolled at
the same school" (Group I), "students who attended preschool but moved within the same
district" (Group 2), and, finally, "students who did not participate in District A's preschool
program" (Group 3). The data were compared among the groups based on language arts literacy
and mathematics achievement, enrollment status or mobility, race, gender, socioeconomic status
(SES), attendance, and school effects. The goal of the study is to ascertain the sustainability of
the benefits of preschool on student achievement in mathematics and language arts literacy
through the third grade, based on participation in preschool for different groups of students,
while looking at enrollment status. This research will assist educational leaders in the
implementation of policy, the evaluation of current practices, and the development of

expectations for Abbott preschool programs. Thus, this work adds to the literature on preschool
education and student achievement.
Data Used for the Research
This study used the results of the state-mandated language arts literacy and mathematics
standards-based assessment, the New Jersey Assessment of Skill and Knowledge 3 (NJ ASK 3)
for 2,086 students from 16 schools, during the spring of 2007. The NJ ASK3 is a standards-
based test given to all third-grade students in New Jersey's public and charter schools to
determine the degree of student achievement of the New Jersey Core Curriculum Content
Standards. This study extrapolated through test score analyses and the scores of different groups
of third-grade students to analyze based on the previously mentioned factors, including
participation in District A's mandated Abbott preschool program. The analysis in this chapter
utilized the statistical software package SPSS 14.1.
To determine the school effect, schools were dummy-coded using the NCLB status. The
NCLB status is reported for schools receiving Federal funds to determine their adequate yearly
progress (AYP). Schools are expected to make adequate yearly progress (AYP) toward one
hundred percent proficiency in language arts literacy and mathematics. A school is identified "in
need of improvement" after it has not made AYP for two consecutive school years. Schools
continue to move to the next step or year if the school fails to make AYP. The first year the
school fails to meet AYP, it is labeled year one, a "Warning" under the NCLB regulations. The
second year a school fails to meet AYP, the school is labeled "Choices" and students have the
choice of transfemng to another school without sanctions. The third year a school fails to meet
AYP, the school is labeled "SES" and students are eligible for supplemental educational services
provided by an outside provider. The fourth year a school does not meet AYP, they are labeled

"CAPA" and the school is evaluated by an outside group and a corrective action plan is
developed. The fifth year a school does not meet AYP, a restructuring plan must be developed.
If the school fails to meet AYP for the sixth year in a row alternative governance must be
implemented.
The function of this chapter is to present the results of the statistical analyses conducted
to examine the research question through the use of descriptive statistics and Analysis of
Variance (ANOVA).
Subsidiary Research Questions
Subsidiary Research Question 1
What is the difference in language arts literacy and mathematics achievement between
students who participated in an Abbott preschool program at the same school, those
students who transferred schools within the district, and those who did not attend
preschool?
The Analysis of Variance results on language arts literacy by group is presented in Table 4.1.
The ANOVA results show that a significant difference was found between the groups in
language arts literacy [F(2,2011) = 27.755, p=.000]. The mean and standard deviation for each
group are presented in Table 4.2. Scheffe Post Hoc comparisons were conducted to identify
specific group differences. The Scheffe results presented in Table 4.3 shows that the mean of
2 1 1.02 for group 1, students continuously enrolled at the same school, is significantly higher
than the mean of 202.75 for group 2, students continuously enrolled in the district who moved
within schools. However, no differences were found between groups 1 and 3, students who did
not attend the Abbott preschool program; or groups 2 and 3, the students who moved within the
district and the students who did not attend preschool in District A. Participation in District A's

early childhood Abbott program positively impacts on student achievement in language arts
literacy as measured by the NJASK 3, particularly for students enrolled in the preschool program
that remained at the same school.
Table 4.1 Language Arts Literacy Analysis of Variance NJ ASK 3 Scores
2007
Sum of Squares df Mean Square F Sig.
Between Groups
Within Grou~s 1029482.456 2009 512.435
Total 1057927.270 201 1
Table 4.2 Language Arts Literacy Mean NJ ASK 3 Scores 2007
Std. N Mean Deviation
Continuously Enrolled in the School 1123 211.02 22.149 Continuously Enrolled in the District 635 202.75 23.429 Did not Attend District A's Preschool 254 206.22 22.758 Total 2012 207.80 22.936
Table 4.3 Language Arts Literacy Scheffe
Mean Difference (I-
(I) coded enrollment (J) coded enrollment J) Std. Error Sig.
Continuously Enrolled in Continuously Enrolled in -. 139' ,025 the School the District
.ooo
New No Pre-K in District
Continuously Enrolled in Continuously Enrolled in the District the School

New No Pre-K in ,088 ,038
District ,066
New No Pre-K Continuously Enrolled in ,050 ,035
the School .362
Continuously Enrolled in -.088 ,038 .066
the District
*. The mean difference is significant at the 0.05 level.
The largest group, 1,123, continuously enrolled students, completed the NJASK 3
language arts literacy assessment and was proficient. The average for the group was 21 1.02.
The second largest group of 635 students who attended District A's preschool program but
moved within the district's schools, had a mean of 202.75. The smallest group of 254 students
who did not participate in District A's preschool program, had a mean of 206.22, which was
slightly higher than for the students who were enrolled in a preschool program within the district
but lower by 4.8 points than the language arts literacy mean for students continuously enrolled
within the same school. Results demonstrate a higher average for students who did not
participate in District A's preschool programs than for students who participated in preschool
program and transferred schools within the district. The data on the students who did not
participate in preschool were inconclusive; as the higher average may be attributed to lack of
participation in District's A preschool program, the students' participation in another type of
preschool, or as the result of students remaining at home with parental care in a supportive
environment. The difference in means between the students who participated in a quality
preschool program within the same school, in the same district, or did not participate in District
A's preschool, is significant. The researcher, using an Analysis of Variance (ANOVA), found
that continuous participation in the same school significantly impacts student achievement.
Participation in an Abbott preschool program significantly impacts student achievement.

The mean in language arts literacy for students who attended District A's preschool
program, and have been continuously enrolled at the same schools, is significantly higher than
for students continuously enrolled in the district preschool program but have moved from school
to school. However, the mean for students continuously enrolled at the same school is not
significantly higher than for the students who did not attend the district's preschool program. It
appears that the difference in mean between these groups is not significant.
The Analysis of Variance was conducted to compare the data from the three groups on
mathematics proficiency and these results are presented in Table 4.4. A significant difference
was found [F(2,20777)=24.742,p=.OOO]. The means and standard deviation are presented in
Table 4.5. Scheffe Post Hoc comparisons are presented in Table 4.6, which shows that the mean
of 223.71 for group 1, students continuously enrolled at the same school who attended the
Abbott preschool program, was significantly higher than the means of 213.62 for group 2,
students who attended preschool and moved within the district, and 212.98 for group 3, students
who did not attend the district's Abbott preschool program. The means for groups 2 and 3 were
not statistically significant from each other.
Table 4.4 Mathematics Analysis of Variance NJ ASK 3 Scores
2087
sum of Mean squares df Square F Sig.
Mathematics Between groups 19.453 2 9.726 24.742 0.000 Within Groups 815.686 2075 0.393
Total 835.138 2077 ANOVA

Table 4.5 Mathematics Mean NJ ASK 3 Scores 2007
N Mean Std. Deviation
Continuously Enrolled in the School 1127 223.71 29.008 Continuously Enrolled in the District 646 213.62 30.986 Did not Attend District A's Preschool 305 212.98 30.493 Total 2078 219.00 30.279 * NJ ASK 3
Table 4.6 Mathematics Scheffe NJ ASK 3 Scores 2007
Mean Difference (I-
(I) coded enrollment (J) coded enrollment J) Std. Error Sig.
Continuously Enrolled in Continuously Enrolled in the District
10.11* 1.438 .OOO the School
New No Pre-K in District
Continuously Enrolled in Continuously Enrolled in -10.11' 1.438 ,000
the District the School
New No Pre-K in .21 2.042 ,995
District
New No Pre-K Continuously Enrolled in the School
-10.33' 1.896 ,000
Continuously Enrolled in the District
Based on observed means. The error term is Mean Square (Error) = 834.353.
Mathematics achievement, as measured by the NJASK 3, demonstrates a consistently higher
average for the students who participated in District A's Abbott preschool program. Two
thousand seventy-eight students completed the mathematics assessment. The average score for

the 1,127 students who remained at the same school since preschool is 223.71. The average
score for the 646 students who participated in the Abbott preschool program within the district
but moved around at least once is 213.62. There is a difference in means of a little over 10
points for the two groups enrolled in preschool. Students who did not participate in District A's
Preschool Abbott Program had a slightly lower mean of 212.98, a difference of about half a
point, unlike the difference for the same group of students who did not participate in the
preschool program but scored slightly higher in language arts literacy. The group of students
who attended preschool and remained at the same school had the highest mean in mathematics
and language arts literacy. However, in mathematics the students who did not attend preschool
had the lowest average.
The difference in means between the students who participated in a quality preschool
program in the same school, in the same district, or did not participate in District A's preschool,
is significant. Participation in preschool significantly impacts on student achievement.
Students' participation in District A's preschool program who remained at the same school can
be associated with higher scores in mathematics than those who participated and moved within
the district and group 3, the students who did not attend the district's Abbott preschool program.
The mean in mathematics for students who attended District A's preschool program and
remained at the same school is consistently higher than the other groups. The mean of students
who have been continuously enrolled at the same school is also significantly higher than for
students continuously enrolled in the district preschool program but have moved from school to
school, and for students who did not attend the district's preschool program (Table 4.5).
However, the mean for students continuously enrolled at the same school is significantly higher
than for the students who did not attend the district's preschool program. The difference in

means is not statistically significant between the students who moved within the district and
those that did not attend the district's preschool program. Most of the difference in scores occurs
between the students who remained at the same school and those who moved at least once.
Students' participation in Distiict A's preschool program can be associated with higher scores in
language arts literacy for some groups of students, but with higher means for all students in
mathematics.
Subsidiary Research Question 2
When race is controlled for, does academic achievement in language arts literacy and
mathematics persist for students continuously enrolled, as opposed to those who
transferred within the district or those who did not attend the preschool program within
the district?
An Analysis of Variance (grouped by race) was conducted to analyze how language arts
literacy scores differ among the four racial groups (White, Hispanic, Blacks, Asians) the results
are presented in Table 4.1 1. No significant differences were found by racial groups in language
arts literacy [F(3,1930)=1.105,p=.346]. The means and standard deviation on language arts
literacy by race are presented in Table 4.7.
Hispanic students had the highest mean in language arts literacy, with a mean of 208.32.
Black students had the second highest average with a mean of 207.86. Asian students had the
third highest average with a mean of 207.14. White students had the lowest mean of 204.12. As
stated previously, the difference in mean scores between the groups was not statistically
significant with a p=.346.
A two-way Analysis of Variance (grouped by race and enrollment status) was conducted to
analyze how academic achievement in language arts literacy differs for the various ethnic groups

and their mobility or participation in the program. The results are presented in Table 4.7. The
main effect of CES was significant; differences were found by enrollment status, CES,
[F(2,1922)=11.5 19,p=.000]. No significant differences were found by race
[F(3,1992)=1.649,~=. 1761, or for the interaction of race and enrollment status CES [F(6,
1922)=.896,p=.497]. The means and standard deviations on language arts literacy by CES
(enrollment) and race are presented in Table 4.8. The Scheffe Post Hoc comparison shows that
the mean of 210.85 for students continuously enrolled at the same school was significantly
higher than the mean of 202.92 for continuously enrolled in the district and the mean of 206.22
for students who did not attend preschool Table 4.9,
Table 4.7 Language Arts Literacy Analysis of Variance NJ ASK 3 Scores 2007
Tests of Between-Subjects Effects
Dependent Variable: LAL Scores
Type I11 Sum Source of Squares ' df Mean Square F Sig.
Corrected Model 293 14.132a 11 2664.921 5.161 .OOO
Intercept 2.949E7 1 2.949E7 57108.978 ,000
CES 11895.922 2 5947.961 11.519 ,000
Codedrace 2553.731 3 85 1.244 1.649 ,176
CES * codedrace
2776.100 6 462.683 396 ,497
Error 992443.520 1922 516.360
Total 8.445E7 1934
Corrected Total 1021 757.653 1933
a. R Squared = ,029 (Adjusted R Squared = .023)

Table 4.8 Language Arts Literacy 2007 Descriptive Statistics
Dependent variable: LAL Scores
coded enrollment coded race Mean Std. Deviation N Continuously White 209.24 21.216 29 Enrolled in {he Hispanic 211.24 23.582 365 School Black 211.41 21.597 439
Asian 209.34 21.595 227 Total 2 10.85 22.276 1060
Continuously White 204.00 21.110 Enrolled in the Hispanic 203.56 22.495
62 Table 4.9
District 225 Language
Black 202.40 24.691 260 Arts Literacy Asian 201.85 23.930 73 Total 202.92 23.436 620 Scheffe
New No Pre-K White 193.23 25.541 13 Hispanic 208.37 21.565 136 Black 204.62 22.206 42 Asian 205.32 24.503 63 Total 206.22 22.758 254
Total White 204.12 22.015 104 Hispanic 208.32 23.097 726 Black 207.86 23.136 74 1 Asian 207.14 22.741 363 Total 207.70 22.991 1934
NJ ASK 3 scores
Mean Difference
(I) coded enrollment (J) coded enrollment (I-J) Std. Error Sig.
Continuously Continuously Enrolled in 7.93' 1.149 .OOO
Enrolled in the the District School New No Pre-K in District 4.63' 1.587 ,014
Continuously Continuously Enrolled in -7.93' 1.149 .OOO
Enrolled in the the School District New No Pre-K in District -3.30 1.693 ,150
New No Pre-K Continuously Enrolled in -4.63' 1.587 .014
the School

Continuously Enrolled in 3.30 1.693 ,150
the District
Based on observed means The error term is Mean Square(Error) =
5 16.360. * The mean difference is significant at the .05 level.
Students continuously enrolled in the district who attended more than one school had the
lowest language arts literacy mean. White students had a mean of 204, similar to the average
mean for White students regardless of participation, and the highest for students who moved
within the district. Hispanic students had the second highest mean of 203.56, about five points
lower than the mean for all third grade Hispanics students in the district regardless of mobility.
Black students, who moved within the district, had a mean of 202.4, about five points lower than
the overall average for Black students not considering mobility. Asian students had a mean of
201.85 about five and half points lower than the district average.
Students who did not attend District A's preschool program had a range of mean in
language arts literacy. Hispanic students who did not attend preschool had a mean of 208.37; not
very different from the average mean for all third-grade students in language arts literacy
Hispanic students in the district regardless of participation. The other racial groups did have a
decrease in language arts literacy on the NJ ASK 3 based on participation. White students had a
mean of 193.23, about eleven points lower than the overall average for this racial group when
one does not consider mobility. Black students, who did not participate in the preschool
program, had a mean of 204.62, a decrease of about three and a quarter points from the overall
average. Asian students had a mean score of 205.32 a decrease of about two points.
An Analysis of Variance, ANOVA, was conducted to examine the interaction of CES and
race on mathematics achievement. The data were examined to compare the group of students

who participated in preschool continuously enrolled at the same school, students who
participated in preschool and moved within the district, and students who did not participate in
District A's preschool program based on race. A Scheffe Post Hoc (Table 4.12) was conducted
to examine if a significant difference is evident in mathematics scores by enrollment status or
mobility, race and the interaction of mobility and race.
A two-way Analysis of Variance (CES by race) was conducted to determine if a significant
difference exists in mathematics achievement by race and CES. The ANOVA results in table
4.10 indicate that the independent variable CES had a significant impact on mathematics
achievement. A significant difference was found by CES [F(2,1985)=10.054,p=.OOO]. However,
no significant differences were found on the dependent variable mathematics achievement by the
independent variable race [F(3,1985)=1.171 ,p=.3 191 or for the interaction of CES and race
[F(6,1985)=.727,~=.628] (table 4.14). The means and standard deviation are presented in table
4.11.
Table 4.9 Mathematics Analysis of Variance Tests of Between-Subjects Effects
Denendent Variable: Math Scores
Type 111 Sum of Source Squares df Mean Square F Sig.
Corrected Model 51780.345a 11 4707.304 5.284 ,000
Intercept 3.677E7 1 3.677E7 41277.180 ,000
CES 17912.783 2 8956.391 10.054 ,000
Codedrace 3128.616 3 1042.872 1.171 ,319
CES * codedrace 3887.461 6 647.910 ,727 ,628
Error 1768281.548 1985 890.822
Total 9.744E7 1997
Corrected Total 1820061.893 1996
a. R Squared = ,028 (Adjusted R Squared = ,023)

Table 4.10 Mathematics 2007 Means
Dependent Variable: Math Scores
Std. coded enrollment coded race Mean. Deviation N
Continuously Enrolled in the White 217.17 30.326 29 School Hispanic 224.17 28.832 366
Black 223.90 29.823 440
Asian 221.71 28.121 228
Total 223.34 29.131 1063
Continuously Enrolled in the White 215.13 27.792 62 District Hispanic 214.03 31.120 232
Black 213.18 3 1.626 26 1
Asian 213.86 30.785 76
Total 213.77 30.917 63 1
New No Pre-K White 200.76 26.033 17
Hispanic 214.40 29.899 169
Black 212.89 29.721 46
Asian 214.77 30.804 7 1
Total 213.19 30.321 3 04
Total White 213.42 28.518 108
Hispanic 218.95 30.152 767
Black 219.48 30.876 747
Asian 218.81 29.340 3 75
Total 218.77 30.267 1998 NJ ASK 3
The Scheffe Post Hoc comparisons (Table 4.12)on mathematic achievement by CES
(enrollment status) show that the mean of 223.34 for student continuously enrolled in the same
school is significantly higher than the mean of 213.77 for students continuously enrolled within
the district, and the mean of 213.19 for students who did not participate in the district's Abbott
preschool program.

Table 4.11 Mathematics and CES Scheffe
-
Mean Difference
(I) coded enrollment (J) coded enrollment (1-J) Std. Error Sig.
Continuously Continuously Enrolled 9.57' 1.500 ,000
Enrolled in the in the District School New No Pre-K in
10.15' 1.941 ,000 District
Continuously Continuously Enrolled -9.57' 1 SO0 .OOO
Enrolled in the in the School District New No Pre-K in
.57 2.084 .963 District
New No Pre-K Continuously Enrolled -10.15' 1.941 ,000
in the School
Continuously Enrolled in -.57 2.084 ,963 the District
Based on observed means. The error term is Mean Square (Error) =
890.822.
*. The mean difference is significant at the .05 level.
There is empirical evidence demonstrating the short- and long-term effects and benefits of
participation in quality preschool programs (Barnett & Yarosz ,2007; Barnett and Broocok,
1998; Gorey, 2001; Vandell, Reisner, & Pierce, 2007). In Di'strict A, the average score in
mathematics is about ten points higher than the average language arts literacy scores on the
NJASK 3 was during the spring of 2007. Black students had the highest mean in mathematics on
the NJ ASK 3 in 2007, which was 219.48. The second highest mean was Hispanic students,
218.95; followed by Asians, 218.81, and finally, Whites with a mean of 213.42. When the data
were analyzed in terms of mobility the mean fluctuated. For continuously enrolled students at

the same school, Hispanic students had the highest mean of 224.17, slightly higher than the mean
of Black students, 223.90. Asian students had a mean of 221.71, and White students a mean of
217.17.
Students who moved within the district had a mean of 213.77. As the scores of the students who
were more mobile were separated by race, White students had the highest mean of 215.13.
Hispanic students, who moved within the district, had a mean of 214.03. Black students, who
moved within the district, had a mean of 2 13.18. Asian students had a mean of 2 13.86.
Students new to the district, who did not attend District A's Abbott preschool program,
had an average of 213.19, the lowest mean of the three groups, based on mobility. Of the
students who did not participate in the preschool program, Asians had the highest mean, 214.77.
Hispanic students who did not participate in the district's preschool had the second highest mean,
214.40, followed by Black students with a mean of 212.89, and then White students with a mean
of 200.76.
An Analysis of Variance was conducted to examine the interaction of the independent
variables, mobility and race, on the dependent variable, mathematics achievement. The data
were examined to compare the three groups in terms of students who participated in preschool
continuously enrolled at the same school, students who participated in preschool and moved
within the district, and students who did not participate in District A's preschool program based
on race. The Scheffe Post Hoc (Table 4.12) was conducted to determine if a significant
difference occurred in mathematics scores by enrollment status or mobility and race. As
reported previously, differences were found by enrollment or mobility status (CES); however, no
significant differences were found by race and by the interaction of enrollment (CES) and race.
The study of student achievement in District A demonstrates that language arts literacy and

mathematics scores are impacted by participation in preschool. In language arts literacy and
mathematics, students enrolled at the same school since preschool through third grade achieve
significantly higher than the groups of students who transfer within the district and the students
who did not participate in the Abbott preschool program.
Subsidiary Research Question 3
Based on socioeconomic status (SES), do certain subgroups of students exhibit more
sustainability from the benefits of preschool participation in language arts literacy and
mathematics?
A two-way Analysis of Variance (grouped by CES and SES) was conducted to determine if
a significant difference exists in language arts literacy for the different socioeconomic status
groups and CES (three groups of students), students' continuous enrollment at the same school,
students continuously enrollment in the same district while transferring through various schools,
and students who did not participate in the district's Abbott preschool program, CES. The
ANOVA results in Table 4.13 show that a significant difference was found by the independent
variable CES [F(2,1985)=13.570,p=.000], as previously indicated. However, no significant
differences were found in language arts literacy by the independent variable SES
[F(3,1985)=1.605,p=.186] or for the interaction of CES and SES [F(6,1985)=.370,p=.898]. The
means and standard deviations are presented in table 4.14.
Table 4.12 Language Arts Literacy Scores 2007 Socioeconomic Status and Enrollment Status
Tests of Between-Subiects Effects
Dependent Variable: LAL Scores

Type 111 Sum Source of Squares df Mean Square F Sig.
Corrected 29999.21 7a 11 2727.202
Model 5.285
Intercept 3.966E7 1 3.966E7 76858.1 66 ,000
CES 17390.983 2 8695.491 16.852 ,000
Lunch 3123.201 3 1041.067 2.018 ,109
CES * Lunch 525.1 12 6 87.519 ,170 ,985
Error 991758.435 1922 5 16.003
Total 8.445E7 1934
Corrected Total 1021 757.653 1933
a. R Squared = .029 (Adjusted R Squared = ,024)
Table 4.13 Language Arts Literacy 2007 Socioeconomic Status
Means
Descriptive Statistics
Dependent Variable: LAL Scores
Coded lunch Std. coded enrollment SES Mean Deviation N
Continuously Enrolled in the FREE 209.45 22.523 56 1 School FREE (STATE) 213.78 22.259 87
PAID 212.33 22.189 240
REDUCED 21 1.86 21.437 172
Total 210.85 22.276 1060
Continuously Enrolled in the FREE 201.54 23.058 313 District FREE (STATE) 204.61 26.514 64
PAID 203.39 23.663 157
REDUCED 205.81 2 1.940 86
Total 202.92 23.436 620
New No Pre-K FREE 205.02 22.952 121
FREE (STATE) 210.25 27.046 20
PAID 205.93 2 1.957 72

REDUCED 208.27 21.803 41
Total 206.22 22.758 254
Total FREE 206.42 23.004 995
FREE (STATE) 209.94 24.722 171
PAID 208.36 22.989 469
REDUCED 209.63 21.729 299
Total 207.70 22.991 1934 *NJ ASK 3
Children from low socioeconomic backgrounds, and those whose parents have a limited
education, may benefit the most as they encounter difficulties in school and later in life (Frede,
Jung, Barnett, and Figueras, 2007). In order to investigate this hypothesis, the NJ ASK 3 2007
results were analyzed. Students' scores in language arts literacy were grouped into four groups
based on their socioeconomic status, as measured by eligibility for free meals under the National
School lunch Program. The program provides free, or reduced price, lunch to any child from a
household meeting criteria for eligibility based on household size and income. Students, who do
not qualify for free meals, because their income exceeds the Federal limit, were coded "paid."
Students who receive public assistance were coded "free (state)", students whose income meets
the guideline, as noted by the application, were coded "free," and students whose income
exceeds the cut off for free but fall below the guidelines for paid, were coded "reduced." The
students coded "free" (state) had the highest mean of 209.94, followed by the students coded
"reduced," with a mean of 209.63, followed by the students coded "paid," with a mean of
208.36, and finally, the students coded "free," with a mean of 206.42. The difference in means
between the highest and lowest is barely three and half points and even less within the groups.
The data were also analyzed based on continuous enrollment status, CES (Table 4.14).
Students continuously enrolled at the same school, and coded for SES, had the following means.
For continuously enrolled students, the highest mean was 213.78 for "free (state)", secondly a

mean of 212.33 for "paid" students, followed by a mean of 21 1.86 for students coded "reduced"
lunches, and finally, a mean of 209.45 for students eligible for "free" lunch students. For
students continuously enrolled in the district who moved at least once, the highest mean was
205.81 for students coded "reduced" lunch, second was the mean of 204.61 for "free (state),"
followed by a mean of 203.39 for students coded "paid" lunches, and finally, a mean of 201.54
for students coded "free" lunches. The students who did not participate in the Abbott preschool
program had a mean of 206.22. The students eligible for reduced meals had the highest mean of
208.27. The students coded "free (state)" had a mean of 210.25, students coded "paid" had a
mean of 205.93, and the lowest mean was for students coded "free", with a mean of 205.02.
Scheffe Post Hoc (Table 4.15) was conducted to determine if significant differences occurred
in mathematics scores by enrollment status CES and socioeconomic status SES. As reported in
the previous analysis, differences were found by enrollment or mobility status (CES); however,
no significant differences were found in language arts literacy achievement, as measured by the
NJ ASK 3 in 2007, by SES or by the interaction of enrollment (CES) and SES. The study of
student achievement in District A demonstrates that language arts literacy and mathematics
scores are impacted by participation in preschool and continuous enrollment at the same school.
As indicated previously, differences exist by continuous enrollment status; however, no
significant difference exists in language scores when analyzed by SES (coded lunch status). The
interaction of SES and enrollment does not produce a significant difference (Table 4.13).
Table 4.14 Language Arts Literacy 2007 Socioeconomic Status
Scheffe Language Arts Literacy
Mean Difference (I-
(I) coded enrollment (J) coded enrollment J) Std. Error Sig.

Continuously Enrolled in Continuously Enrolled in 7.93' 1.149 ,000
the School the District
New No Pre-K in District
Continuously Enrolled in Continuously Enrolled in -7.93' 1.149 .OOO
the District the School
New No Pre-K in -3.30 1.693
District ,150
New No Pre-K Continuously Enrolled in -4.63' 1.587 ,014
the school
Continuously Enrolled in the District
Based on observed means. The error term is Mean Square (Error) = 516.360.
*. The mean difference is significant at the .05 level.
A two-way Analysis of Variance (CES by SES) was conducted to determine if a
difference exists in the dependent variable, mathematics achievement, by the independent
variable, socioeconomic status (SES), and the independent variable, CES, in the three enrollment
groups, students continuously enrolled at the same school, students continuously enrolled in the
same district while transferring through various schools at least once, and students with lack of
participation in the district's Abbott preschool program. The ANOVA results in Table 4.16
demonstrates that a significant difference was found in the independent variable, CES
[F(2,1881)=13.570,p=.000], and on the dependent variable, mathematics achievement.
However, no significant differences were found in mathematics achievement by independent
variable socioeconomic status, SES [F(3,1985)=1.605,p=. 1861, or for the interaction of CES and
SES [F(6,1985)=.370,p=.898]. The means and standard deviation are presented in Table 4.17.

Table 4.15 Mathematics Scores 2007 Socioeconomic Status and Enrollment Status
Tests of Between-Subjects Effects
Dependent Variable: Math Scores
Type 111 Sum Source of Squares df Mean Square F Sig.
Corrected Model 52432.138= 11 4766.558 5.353 ,000
Intercept 4.838E7 1 4.838E7 54326.300 ,000
CES 24167.746 2 12083.873 13.570 ,000
Lunch 4288.834 3 1429.611 1.605 ,186
CES * Lunch 1975.698 6 329.283 ,370 ,898
Error 1767629.755 1985 890.494
Total 9.744E7 1997
Corrected Total 1820061.893 1996
a. R Squared = .029 (Adjusted R Squared = .023)
Table 4.16 Mathematics Scores 2007 Socioconomic Status and Enrollment Status
Means
Descriptive Statistics
Dependent Variable: Math SS
Coded lunch coded enrollment SES Mean Std. Deviation N
Continuously Enrolled FREE 222.77 29.293 562 in the School FREE
(STATE) 224.59 29.795 88
PAID 224.81 27.810 ' 240
REDUCED 222.54 30.196 173
Total 223.34 29.131 1063
Continuously Enrolled FREE 211.48 30.925 319

in the District FREE 218.17 3 1 .095
(STATE) 65
PAID 215.00 30.980 159
REDUCED 216.58 30.452 88
Total 213.77 30.917 63 1
New No Pre-K in the FREE 211.63 29.469 146 District
PAID 214.35 31.515 88
REDUCED 215.78 3 1.094 45
Total 213.50 29.913 303
Total FREE 217.68 30.326 1027
FREE 221.26 29.699 177
(STATE)
PAID 219.72 29.924 487
REDUCED 219.83 30.460 306
Total 218.82 30.197 1997 *NJ ASK 3
In District A, students eligible for lunches coded "free (state)" had the highest mean of
221.26 (Table 4.14) in mathematics on the NJ ASK 3 in 2007. The second highest mean was
219.83 for students eligible for "reduced lunches; followed by 219.72 for those coded "paid";
and finally, students eligible for "free" lunches with a mean of 217.68. When the data are
analyzed in terms of mobility, the mean fluctuates slightly. Students continuously enrolled at the
same school, the students' coded "paid," had the highest mean of 224.81, which was slightly
higher than the mean of 224.59 for students eligible for "free (State)." Students continuously
enrolled within the district coded "free (State)" had the highest mean of 21 8.17; followed by the
students coded "reduced," with a mean of 216.58; and students coded "paid," with a mean of
2 15. The lowest mean, by about five points, is for students coded "free," 21 1.48. In
mathematics achievement, the students who did not attend the district's Abbott program had the

lowest mean by less than one point from the students who attended preschool but moved within
the district. The students coded "free (State)" had the highest mean of 217.47; followed by
students coded "reduced," with a mean of 215.78, followed by students coded "paid," with a
mean of 214.35; and, finally, the lowest for students coded "free" with a mean of 21 1.63.
Scheffe Post Hoc (Table 4.1 8) was conducted to determine if significant differences
occurred in mathematics scores by enrollment status CES and socioeconomic status SES. As
reported in the previous analysis, differences were found by enrollment or mobility status (CES);
however, no significant differences were found in mathematics achievement, as measured by the
NJ ASK 3 in 2007 by SES, or by the interaction of enrollment (CES) and SES. The study of
student achievement in District A demonstrates that language arts literacy and mathematics
scores are impacted by participation in preschool and continuous enrollment at the same school.
Table 4.17 Mathematics Scores 2007 Socioeconomic Status and Enrollment Status
Scheffe
Mathematics Scores
Mean Difference (I-
(I) coded enrollment (J) coded enrollment J) Std. Error Sig.
Continuously Enrolled Continuously Enrolled in the District
9.57' 1.500 ,000 in the School
New No Pre-K 9.85' 1.943 .OOO
Continuously Enrolled Continuously Enrolled in -9.57' 1.500
in the District the School ,000
New No Pre-K .27 2.086 ,992
New No Pre-K Continuously Enrolled in -9.85' 1.943 ,000
the School
Continuously Enrolled in - the District

Mathematics Scores
Mean Difference (I-
(I) coded enrollment (J) coded enrollment J) Std. Error Sig.
Continuously Enrolled Continuously Enrolled in 9.57' 1.500
the District .ooo
in the School
New No Pre-K 9.85' 1.943 .OOO
Continuously Enrolled Continuously Enrolled in -9.57' 1.500 ,000
in the District the School
New No Pre-K .27 2.086 ,992
New No Pre-K Continuously Enrolled in -9.85' 1.943 .OOO
the School
Continuously Enrolled in -.27 2.086 ,992
the District
Based on observed means. The error term is Mean Square (Error) = 890.494.
*. The mean difference is significant at the .05 level.
ANOVAs were conducted to determine if significant differences exist when investigating
student achievement in mathematics and the impact of socioeconomic status and the enrollment
status on achievement. As indicated previously, differences exist by enrollment status (CES);
however, no significant difference in mathematics or language arts literacy achievement exists
by socioeconomic status, as measured by lunch eligibility or by the interaction of lunch and CES.
Subsidiary Research Question 4
What are the effects in language arts literacy and mathematics achievement associated with
gender for students continuously enrolled at the same school, students who transferred within
the district, and students who did not attend preschool in the district?
First, Analyses of Variance were conducted to analyze how language arts literacy and
mathematics scores differ for boys and girls based on the NJ ASK 3 in the spring of 2007. Then

the scores were analyzed based on gender and preschool participation and mobility within the
district.
The results of the Analysis of Variance created to determine how language arts literacy
scores differ for boys and girls are presented in Table 4.19. A significant difference was found
for the independent variable of gender, boys and girls [F(2,1951)=24.874,p=.000] in language
arts literacy. The mean for boys in language arts literacy is 205.71, with a standard deviation of
23.555, as presented in Table 4.20.
An Analysis of Variance (grouped by gender and CES) was conducted to analyze how
language arts literacy scores differ for males and females depending on enrollment status. The
enrollment is separated into three groups: students continuously enrolled at the same school since
preschool, students who participated in the district's preschool at different schools within the
same town, and finally students who did not participate in the district's preschool program. The
results are presented in Table 4.2 1. A significant difference was found in the independent
variable, enrollment status, CES, [F(2,1988)=24.233,p=.000]. A significant difference was
found, as well, in the independent variable gender [F(1,1988)=18.520,p=.000], and no significant
results were obtained by the interaction of gender and enrollment status, CES [F(2,
1988)=.980,p=.375]. The means and standard deviations on language arts literacy by enrollment
status, CES, and gender are presented in Table 4.222. Scheffe Post Hoc comparison was
conducted to identify specific statistically significant scores based on CES and gender. A
statistically significant difference was based on enrollment CES and gender, but not on the
interaction of gender and CES status.

Table 4.18 Language Arts Literacy 2007 Analysis of Variance by Gender
ANOVA
Sum of Squares df Mean Square F Sig.
Between Groups
Within Groups 1029991.795 1970 522.838
Total 1039954.189 1971
Table 4.19 Language Arts Literacy 2007 Means by Gender
N Mean Std. Deviation Std. Error
male 1078 205.71 23.555 ,717
female 894 210.22 22.006 ,736
Total 1972 207.76 22.970 ,517
Table 4.20 Language Arts Literacy 2007 Gender Scheffe
Tests of Between-Subjects Effects
Dependent Variable: LAL Scores
Type I11 Sum Source of Squares d f Mean Square F Sig.
Corrected 38193.348" 5 7638.670 14.936
Model ,000
Intercept 5.768E7 1 5.768E7 112788.377 .OOO
CES 24786.770 2 12393.385 24.233 ,000
gender2 9471.844 1 9471.844 18.520 ,000
CES * gender2 1002.878 2 501.439 .980 ,375

Error 965571.054 1888
Total 8.267E7 1894
Corrected Total 1003764.401 1893
a. R Squared = ,038 (Adjusted R Squared = ,036)
Table 4.21 Language Arts Literacy 2007 Gender and Enrollment Status
Means
Descriptive Statistics
Dependent Variable: LAL Score
coded coded enrollment gender Mean Std. Deviation N
Continuously Enrolled male 209.34 22.835 580 in the School female 212.67 2 1.465 480
Total 210.85 22.276 1060
Continuously Enrolled male 199.80 23.762 338 in the District female 206.09 22.697 242
Total 202.42 23.510 580
New No Pre-K male 202.98 23.002 123
female 209.25 22.186 131
Total 206.22 22.758 254
Total male 205.49 23.555 1041
female 210.28 22.096 853
Total 207.65 23.027 1894 *NJ ASK 3
Numerous research studies highlight that boys score higher in science and mathematics,
while girls score higher in language literacy. The data in this study support those findings. Girls
had a higher average by five points in language arts literacy with a mean of 210.28, than boys'
language arts literacy mean of 205.49 significantly different (table 4.19). When the scores were
separated based on enrollment status (CES) and gender the results were as follows: females

continuously enrolled in the district had a mean of 212.67 compared to the males' mean of
209.34; females continuously enrolled in the district had a mean of 206.09, compared to the
males' mean of 199.80; and for the students who did not participate in the Abbott preschool
program, females had a higher score of 209.25, compared with the males' average score of
202.98. In every group, female students scored higher than the males in language arts literacy.
The analysis of variance between the enrollment status CES and gender is significantly different
by gender. However, the interaction of gender and CES is not statistically significant (Table
The results of the Analysis of Variance created to determine how mathematics scores differ
for males and females are presented in Table 4.23. No significant difference was found between
boys and girls [F(1,2036)=.072,p=.789] in mathematics achievement. The mean for males in
mathematics is 219.25, with a standard deviation of 30.691; and the mean for females is 218.89,
with a standard deviation of .985. The means and standard deviations are presented in table 4.24.
Table 4.22 Mathematics Scores 2007 Analysis of Variance by Gender
ANOVA
Sum of Squares df Mean Square F Sig.
Between Groups
Within Groups 1870914.616 2036 918.917
Total 1870980.453 2037
Table 4.23 Language Arts Literacy 2007 Means by Gender
- - -
N Mean Std. Deviation Std. Error

male 11 19 219.25 30.691 ,917
female 919 218.89 29.848 ,985
Total 2038 219.09 30.307 .671
An analysis of variance (grouped by gender and CES) was conducted to analyze how
mathematic scores differ for males and females. As previously indicated, significant differences
were found by enrollment status, CES, [F(2,1951)=24.874,p=.000]. No significant differences
were found by gender [F(1,1951)=.540,p=.473], or for the interaction of gender and enrollment
status CES [F(2, 1951)=.910,p=.403]. The information is represented in Table 4.28. The means
and standard deviation on mathematics, and by enrollment CES and gender, are presented in
Table 4.29. For mathematics, CES is statistically significant, but not for gender and the
interaction of gender and CES status as shown in table 4.28.
Table 4.24 Mathematics Scores 2007 Gender and Enrollment Status
ANOVA Tests of Between-Subiects Effects
Dependent Variable: Math Scores
Type I11 Sum of Source Squares df Mean Square F Sig.
Corrected Model 47340.252a 5 9468.050 10.619 ,000
Intercept 7.057E7 1 7.057E779145.707 ,000
CES 44535.980 2 22267.990 24.974 ,000
gender2 481.235 1 481.235 ' ,540 ,463
CES * gender2 1622.486 2 811.243 ,910 ,403
Error 1739591.455 1951 891.641
Total 9.557E7 1957
Corrected Total 178693 1.707 1956
a. R Squared = ,026 (Adjusted R Squared = ,024)

Table 4.25 Mathematics Scores 2007 Gender and Enrollment Status
Means
Dependent Variable: Math Scores
coded enrollment coded gender Mean Std. Deviation N
Continuously Enrolled in the male 223.20 30.252 581
School female 223.51 27.750 482
Total 223.34 29.131 1063
Continuously Enrolled in the male 213.39 31.149 349
District female 214.20 3 1 .03 1 242
Total 213.72 3 1.077 591
New No Pre-K in the District male 215.79 27.85 1 149
female 211.27 31.713 154
Total 213.50 29.913 303
Total male 219.00 30.549 1079
female 218.80 29.839 878
Total 218.91 30.225 1957
Numerous research studies highlight the fact that boys score higher in science and
mathematics, while girls scored higher in language literacy. The data in this study supports those
findings. Males did not score significantly higher, with a mean of 219, than females with a mean
of 2 18, which is a smaller difference in mathematics achievement than the difference in language
arts literacy. When the data was analyzed based on enrollment (CES), males did not score
higher. For students continuously enrolled at the same school, the mean of 223.51 for females
was slightly higher by less one point than the mean of 223.20 for males. The students who
attended preschool but moved within the district showed similar results, with the female mean of
214.20 being higher by less than a point when compared with the mean of 213.39 for males. The
biggest difference between male and female achievement in mathematics occurred with the

students who did not participate in the district's preschool program. Male students had a mean
of 21 5.79, and female students had a mean of 2 1 1.27 - a difference of almost five points and
consistent with much of the research on the difference in mathematics achievement for males and
females. The analysis of enrollment status, preschool participation and continuously enrolled in
the same school since preschool, preschool participation and enrollment within the same district,
and students who did not participate in the district's preschool program compared with gender, is
significant by CES but not by gender. The interaction between gender and CES is not
significant.
Subsidiary Research Question 5
When absences are controlled for, does preschool participation in an Abbon program
impact students' achievement in mathematics and language arts literacy based on their
enrollment at the same school, different schools in the district and lack of participation?
A Univariate Analysis of Variance was conducted to analyze the impact of the main
effects student attendance, continuous enrollment (CES) and the interaction of attendance and
continuous enrollment on the dependent variable language arts literacy scores on the NJ ASK 3
during the spring of 2007. Absences do not impact on student achievement [F(1,2007)=1.737,
p=.188], as noted on Table 4.27. As noted previously, CES impacts on student achievement in
language arts literacy [F(2,2007)=25.821,=p.000]. The interaction effect of student absences and
CES is significant on student achievement in language arts literacy
[F(1,2007)=57795.241 ,p=.000].

Table 4.26 Language Arts Literacy 2007 Impact of Absences
Between-Subjects Factors
Value Label N
coded 1 Continuouslv Enrolled in the School 1123 enrollment 2 Continuouslv Enrolled in the District 635
Table 4.27
3 New No Pre-K 253
Language Arts Literacy 2007 Impact of Absences
Descriptive Statistics
Dependent Variable: LALSS
coded enrollment Mean Std. Deviation N
Continuously Enrolled in the School 211.02 22.149 1123
Continuously Enrolled in the District
New No Pre-K 206.14 22.769 253
Total 207.79 22.938 201 1
Table 4.28 Language Arts Literacy 2007 Impact of Absences
Tests of Between-Subjects Effects
Dependent Variable: LAL SS
Type 111 Sum of Source Squares df Mean Square F Sig.
Corrected Model 29396,529" 3 9798.843 19.127 ,000
Intercept 2.961E7 1 2.961E7 57795.241 ,000
Absences 890.107 1 890.107 1.737 ,188
CES 28246.196 2 14123.098 27.568 ,000
Error 1028199.417 2007 512.307
Total 8.789E7 2011
Corrected Total 1057595.945 2010
a. R Squared = ,028 (Adjusted R Squared = ,026)

A Univariate Analysis of Variance was conducted to analyze the impact of the main
effects student attendance, continuous enrollment (CES) and the interaction of attendance and
continuous enrollment on the dependent mathematics scores on the NJ ASK 3 during the spring
of 2007. Absences do not impact on student achievement [F(1,2073)=.609, p=.435], as noted on
Table 4.30. As noted previously, CES impacts on student achievement in mathematics scores
[F(2,2073)=30.343,=p.000]. The interaction effect of student absences and CES is significant on
student achievement mathematics scores [F(1,2073)=39485.922,p=.OOO].
Table 4.29 Mathematics 2007 Impact of Absences
Between-Subjects Factors
Value Label N
coded 1 Continuously Enrolled in the School 1127 enrollment 2 Continuously Enrolled in the
District
3 New No Pre-K
Table 4 3 0 Mathematics 2007 Impact of Absences Descriptive Statistics
Dependent Variable: Math SS
coded enrollment Mean Std. Deviation N
Continuously Enrolled in the School
Continuously Enrolled in the District
New No Pre-K 212.93 30.531 3 04
Total 218.99 30.285 2077

Table 4.31 Mathematics 2007 Impact of Absences
Tests of Between-Subiects Effects
Dependent Variable: Math SS
Type 111 Sum of Source Squares df Meansquare F Sig.
Corrected Model 5540 1 .906a 3 18467.302 20.708 ,000
Intercept 3.521E7 1 3.521E7 39485.922 ,000
Absences 542.71 1 1 542.71 1 ,609 ,435
CES 54119.213 2 27059.607 30.343 ,000
Error 1848691.012 2073 891.795
Total 1.015E8 2077
Corrected Total 1904092.919 2076
a. R Squared = .029 (Adjusted R Squared = ,028)
Previous analyses illustrate differences in achievement based on CES, but if we factor out
attendance does the difference remain? As noted above in Tables 4.28 and 4.32, absences had no
significant impact on student achievement in language arts literacy and mathematics,
respectively, for the continuously enrolled students at the same school, for the students enrolled
within the district, or the students who did not participate in the district's Abbott preschool
program. Absences did not have an impact on the different groups in language arts literacy or
mathematics scores. Nevertheless, CES continues to demonstrate a significant impact on student
achievement in language arts literacy and mathematics achievement.
Subsidiary Research Question 6
How does mobility affect third graders' academic achievement in language arts literacy
and mathematics, based on preschool participation and enrollment status at the same
school, different schools within the district, and lack of participation in an Abbott
district?

An Analysis of Variance was conducted to determine if a significant difference exists in
language arts literacy for students who move within the district, therefore exhibiting a higher
mobility rate. In this study, mobility is analyzed in terms of continuous enrollment status (CES).
CES is dummy-coded into three different groups of enrollment, continuous enrollment at the
same school, continuous enrollment in the same district while transferring through various
school, and lack of participation in the district's Abbott preschool program.
Table 432 Language Arts Literacy 2007 Means Based on Enrollment Status
Language Arts Literacy * coded enrollment
LALSS
coded enrollment Mean N Std. Deviation
Continuously Enrolled in the School 211.02 1123 22.149
Continuously Enrolled in the District 202.75 635 23.429
New No Pre-K in the District 206.22 254 22.758
Total 207.80 2012 22.936 *NJ ASK 3
Table 4.33 Language Arts Literacy 2007 Scheffe
Scheffe post hoc comparison
(I) coded enrollment (J) coded enrollment Sig.
Continuously Enrolled in the School Continuously Enrolled in the District ,000
New No Pre-K .362
Continuously Enrolled in the Continuously Enrolled in the School ,000 District New No Pre-K in the District ,066
New No Pre-K in the District Continuously Enrolled in the School ,362
Continuously Enrolled in the District ,066 *NJ ASK 3

Students' moving from one school to another for reasons other than being promoted to
the next school level is widespread in the United States. Studies that do not control for
background characteristics of students consistently find that mobile students have lower
achievement, on average, than stable students. This study supports those findings. The students
continuously enrolled at the same schools since preschool had the highest mean, 21 1.02, in
language arts literacy (Table 4.29). Students who did not attend the district's Abbott preschool
program had the second highest mean of 206.22, and the students who attended preschool but
moved within the district at least once had the lowest mean, or average, in language arts literacy
on the NJ ASK 3 during the spring of 2007. As stated previously, continuous enrollment
significantly impacts on student achievement in language arts literacy.
Table 434 Mathematics Scores 2007 Means Based on Enrollment Status
Descriptive Statistics
Dependent Variable: Math Scores
coded enrollment Mean Std. Deviation N
Continuously Enrolled in the School 223.34 29.131 1063
Continuously Enrolled in the District 213.77 30.917 63 1
New No Pre-K 213.45 29.951 302
Total 218.82 30.204 1996 *NJ ASK 3
Mobility was negatively associated with mathematics achievement for third-grade students
during the spring of 2007. The students continuously enrolled at the same school since preschool
scored the highest mean in mathematics, 223.34. The group with the second highest mean of
213.77, a drop of about ten points, is the group of students who participated in the Abbott
preschool program but moved within the district. The group with the lowest mean is the students
who did not participate in the preschool Abbott program. The difference in means between the
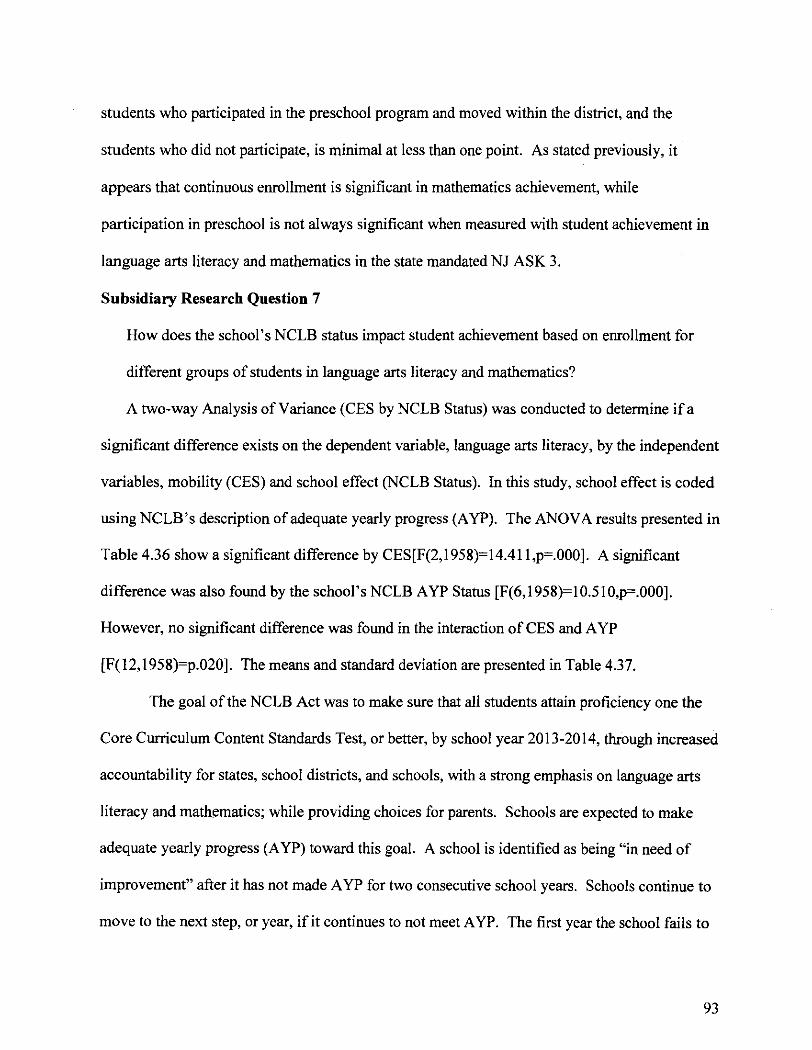
students who participated in the preschool program and moved within the district, and the
students who did not participate, is minimal at less than one point. As stated previously, it
appears that continuous enrollment is significant in mathematics achievement, while
participation in preschool is not always significant when measured with student achievement in
language arts literacy and mathematics in the state mandated NJ ASK 3.
Subsidiary Research Question 7
How does the school's NCLB status impact student achievement based on enrollment for
different groups of students in language arts literacy and mathematics?
A two-way Analysis of Variance (CES by NCLB Status) was conducted to determine if a
significant difference exists on the dependent variable, language arts literacy, by the independent
variables, mobility (CES) and school effect WCLB Status). In this study, school effect is coded
using NCLB's description of adequate yearly progress (AYP). The ANOVA results presented in
Table 4.36 show a significant difference by CES[F(2,1958)=14.41 l,p=.000]. A significant
difference was also found by the school's NCLB AYP Status [F(6,1958)=10.5 1 O,p=.000].
However, no significant difference was found in the interaction of CES and AYP
[F(12,1958)=p.020]. The means and standard deviation are presented in Table 4.37.
The goal of the NCLB Act was to make sure that all students attain proficiency one the
Core Curriculum Content Standards Test, or better, by school year 2013-2014, through increased
accountability for states, school districts, and schools, with a strong emphasis on language arts
literacy and mathematics; while providing choices for parents. Schools are expected to make
adequate yearly progress (AYP) toward this goal. A school is identified as being "in need of
improvement" after it has not made AYP for two consecutive school years. Schools continue to
move to the next step, or year, if it continues to not meet AYP. The first year the school fails to

meet AYP, it is labeled "year one," a "Warning" under the NCLB regulations. The second year
a school fails to meet AYP, the school is labeled "Choices," and students have the choice of
transferring to a school without sanctions. After a school fails to meet AYP for the third year,
the school is labeled "SES" and students are eligible for supplemental educational services
provided by a state-approved provider. The fourth year a school does not meet AYP, it is labeled
"CAPA," and an outside group evaluates the school and a corrective action plan is developed.
The fifth year a school does not meet AYP, a restructuring plan must be developed. If the
school fails to meet AYP for the sixth year in a row, alternative governance must be
implemented.
Table 435 Language Arts Literacy Scores 2007 School Effect and Enrollment Status
ANOVA Tests of Between-Subjects Effects
Dependent Variable: LAL Scores
Type 111 Sum of Source Squares df Mean Square F Sig.
Corrected Model 791 19.742a 20 3955.987 8.094 ,000
Intercept 2.196E7 1 2.196E7 44921.635 ,000
CES 14086.460 2 7043.230 14.411 ,000
CodedAYP 30820.694 6 5136.782 10.510 ,000
CES * CodedAYP
Error 956977.943 1958 488.753
Total 8.662E7 1979
Corrected Total 1036097.685 1978
a. R Squared = .076 (Adjusted R Squared = ,067)
Table 4.36 Language Arts Literacy 2007 Means based on School Effect
LAL * NCLB School status

NCLB School status Mean N Std. Deviation
Meets NCLB mandates 210.91 243 21.321
Year 1 Warning 212.37 647 22.408
Year 2 Choices 21 1.66 177 23.330
Year 3 SES 196.24 50 24.570
Year 4 CAPA 202.10 513 22.108
Year 5 Restructuring Plan 206.72 82 20.992
Year 6 Restructuring Implemented 205.97 267 23.562
Total 207.96 1979 22.887
The Analysis of Variance of the six levels of NCLB school status and the students'
enrollment status was conducted to determine if a significant difference occurs in language arts
literacy scores based on school effect, enrollment status and the interaction of enrollment and
school effect. The mean in language arts literacy for students enrolled in a school that meets
NCLB mandates is 210.91, the third highest average, as presented in Table 4.37. The mean for
students enrolled in a school with a year 1 status, ''warning," is 212.37, the highest average for
any group of schools. The mean for the schools classified as year 2, "choices," was 21 1.66 the
second highest average. The mean for schools in year 3, SES, was 196.24, the lowest score of all
different groups of schools. The mean for year 4 schools, "CAPA," was 202.10, the second
lowest. The mean for schools in year 5, "restructuring plan developed", was 206.72. The mean
for schools classified as year six, "restructuring implemented," the worst level of compliance
with NCLB, was 205.97. The data analysis demonstrates that year 3 schools had the lowest
mean of any group of schools.
Table 4.37 Language Arts Literacy 2007 Means Based on School Effect and Enrollment Status
Descriptive Statistics
Deoendent Variable: LAL Scores

Std. coded enrollment NCLB School status Mean Deviation N
Continuously Enrolled in Meets NCLB mandates 213.97 22.140 134 the School Year 1 Warning 214.50 21.644 377
Year 2 Choices 216.47 22.935 103
Year 3 SES 199.40 20.996 25
Year 4 CAPA 206.86 20.305 273
Year 5 Restructuring Plan
Year 6 Restructuring 207.92 24.093 165
Implemented
Total 211.11 22.163 1114
Continuously Enrolled in Meets NCLB mandates the District Year 1 Warning
Year 2 Choices
Year 3 SES
Year 4 CAPA
Year 5 Restructuring Plan
Year 6 Restructuring Implemented
Total
New No Pre-K in the Meets NCLB mandates District Year 1 Warning
Year 2 Choices
Year 3 SES
Year 4 CAPA
Year 5 Restructuring Plan
Year 6 Restructuring Implemented
Total
Total Meets NCLB mandates 210.91 21.321 243
Year 1 Warning 212.37 22.408 647
Year 2 Choices 211.66 23.330 177

Year 3 SES 196.24 24.570 50
Year 4 CAPA 202.10 22.108 513
Year 5 Restructuring 206.72 20.992
Plan 82
Year 6 Restructuring 205.97
Implemented 23.562 267
Total 207.96 22.887 1979
*NJ ASK 3
The Analysis of Variance demonstrates that a significant difference occurs in language
arts literacy scores by NCLB school status, or school effect, and by CES, enrollment status. A
significant difference was also found in the interaction of NCLB school status and CES,
enrollment status (Table 4.38). The study looked at language arts literacy scores by the school's
NCLB status: the students enrolled at the same school since preschool, the students enrolled in
preschool with attendance at different schools within the district, and the scores of students who
did not participate in the district's Abbott preschool.
When language arts literacy scores were analyzed by school effect (Table 4.38), for
students who participated in preschool and remained enrolled at the same school, the highest
mean was for those students enrolled at schools with a "choices" status, with a mean of 21 6.47.
The second highest mean was for students enrolled at a "warning" school, with a mean of
214.50. The students with the third highest mean of 213.97 were those enrolled in schools that
"meet NCLB mandate." The students with the fourth highest mean of 207.92 were those
enrolled in "restructuring implemented" schools. The students with the fifth highest mean of
206.86 were those enrolled in schools with a "CAPA" status. The students with the sixth highest
mean were those enrolled in ''restructuring plan" schools. The students with the very lowest

average in language arts literacy were those enrolled in ''SES" schools, with a mean of 199.40,
which is below the proficiency level.
The analysis of language arts literacy scores for students enrolled in preschool who
attended different schools within the district demonstrates the following findings: The students
with the highest mean of 209.33 were those enrolled in schools with a "warning" status, but this
mean is about ten points lower than the highest score for students continuously enrolled at the
same school. The second highest mean was for students enrolled at schools with a "restructuring
plan" status. The third highest mean of 204.69 was for students enrolled in schools with a
"meets NCLB mandates" status. The fourth highest mean of 201.10 was for students enrolled in
schools with a "choices" status. The fifth highest mean of 200.52 was for students enrolled in
schools with a "restructuring" status. The next to lowest mean of 197.28 was for students
enrolled in schools with a "CAPA" status. The group of students with the lowest average, when
compared to every other group, were those enrolled at a school with a "SES" status with a mean
of 188.33, almost twelve points below the proficiency level of 200.
The analysis of language arts literacy scores for students who did not attend the district's
Abbott preschool program illustrate the following findings: The students with the highest
average were those enrolled in schools with a "SES" status, with a mean of 218.00, the highest
mean for any group based on school's NCLB status. The second highest mean of 213.00 was for
students enrolled in schools with a "choices" status. The group with the third highest mean of
212.3 1 was for students enrolled in schools with a "meets NCLB mandates" status. The group
with the fourth highest mean of 210.75 was for students enrolled in schools with a "restructuring
plan" status. The group with the fifth highest mean of 209.53 was for students enrolled in
schools with a "warning" status. The group with the second lowest mean of 208.06 was for

students enrolled in schools with a "restructuring implemented" status. The lowest mean for
students who did not attend the district preschool program was for students enrolled in schools
with a "CAPA" status. Those students had a mean of 194.93, the second lowest mean of any
group and below the state's proficiency level.
Table 4.38 Language Arts Literacy2007 School Effect and CES Status
Scheffe
Mean Differenc Std.
(I) coded enrollment (J) coded enrollment e (I-J) Error Sig.
Continuously Enrolled in Continuously Enrolled in the 8.27' 1.107 ,000
the School District
New No Pre-K in District 4.52' 1.563 ,015
Continuously Enrolled in Continuously Enrolled in the -8.27' 1.107 ,000
the District School
New No Pre-K in District -3.75 1.670 .080
New No Pre-K in . Continuously Enrolled in the -4.52' 1.563 ,015 District School
Continuously Enrolled in the 3.75 1.670 ,080
District
Based on observed means The error term is Mean Square (Error) = 488.753.
*. The mean difference is significant at the .05 level.
Differences exist in language arts literacy scores by participation in preschool, mobility
within the district, and lacking preschool in the district's Abbott program. The data were
examined to analyze the groups of students who participated in preschool continuously enrolled
at the same school, students who participated in preschool and moved within the district, and
students who did participate in District A's preschool program, based on the school they
attended, to investigate the possibility of a school effect for students enrolled in schools that do

not meet NCLB's requirements of AYP. The Analysis of Variance (Table 4.36) and Post Hoc
Scheffe (Table 4.39) were used to determine if a significant difference occurs on the dependent
variable, language arts literacy, by the independent variables, enrollment status or mobility, and
school effect, coded with NCLB status; and the interaction of school effect and enrollment status.
A significant difference was found by enrollment or mobility status, and a significant difference
was also found by school's AYP status, and a significant difference was found for the interaction
of school effect and enrollment, as well.
Mathematics Achievement
A two-way Analysis of Variance (CES by NCLB Status) was conducted to determine if a
significant difference exists for the dependent variable, mathematics achievement, when
analyzed by the independent variables, enrollment status (CES), participation in preschool and
continuous enrollment at the same school, participation in preschool within different schools in
the district, and no participation in preschool, as well as the school effect based on NCLB Status
(AYP). The ANOVA results presented in Table 4.40 show a significant impact by CES
[F(2,2022),=8.070] as indicated previously. The data shows a significant difference in
achievement by school's effect based on N CLB A W Status [F(6,2022)=9.597,p=.OOO]. A
significant difference was found in the interaction of CES and AYP on mathematics achievement
[F(12,2022),=p.000]. Preschool participation and the school's AYP status significantly impact
on student achievement in mathematics as measured by the NJ ASK 3. The means and standard
deviation are presented in Table 4.41.
Table 4.39 Mathematics Scores 2007 ANOVA
Tests of Between-Subiects Effects
Dependent Variable: Math Scores

Type 111 Sum of Source Squares df Mean Square F Sig.
Corrected Model
Intercept
CES
CodedAYP
CES * CodedAYP
Error
Total
Corrected Total
a. R Squared = ,091 (Adjusted R Squared = ,082)
Table 4.40 Mathematic Scores 2007 Means Based on Enrollment Status and School Effect
Descriptive Statistics
De~endent Variable: Math Score
coded enrollment NCLB School status Mean Std. Deviation N
Continuously Enrolled Meets NCLB mandates in the School Year 1 Warning
Year 2 Choices
Year 3 SES
Year 4 CAPA
Year 5 Restructuring Plan
Year 6 Restructuring Implemented
Total
Continuously Enrolled in the District
Meets NCLB mandates 218.13 30.108 75
Year 1 Warning 222.42 30.731 185
Year 2 Choices 213.78 27.001 50
Year 3 SES 203.90 33.357 2 1
Year 4 CAPA 209.89 29.584 183
Year 5 Restructuring Plan 204.34 27.224 44

Year 6 Restructuring 205.51 34.056
Implemented 74
Total 213.75 30.930 632
New No Pre-K Meets NCLB mandates 223.72 26.143 36
Year 1 Warning 213.52 30.835 106
Year 2 Choices 217.83 29.634 24
Year 3 SES 232.83 19.333 6
Year 4 CAPA 199.38 27.965 78
Year 5 Restructuring Plan 220.50 14.271 4
Year 6 Restructuring 226.13 26.365
Implemented 39
Total 213.53 29.924 293
Total Meets NCLB mandates 226.60 27.194 245
Year 1 Warning 224.16 29.504 668
Year 2 Choices 223.32 30.291 177
Year 3 SES 203.06 31.164 53
Year 4 CAPA 213.02 29.655 536
Year 5 Restructuring Plan 205.62 27.378 85
Year 6 Restructuring 2 17.66
Implemented 30.978 279
Total 219.25 30.154 2043
Table 4.41 Mathematic Scores 2007 Enrollment Status and School Effect
Scheffe Scheffe
Mean Differenc
(I) coded enrollment (J) coded enrollment e (I-J) Std. Error Sig.
Continuously Enrolled in Continuously Enrolled in the the School District
10.11' 1.438 ,000
New No Pre-K in the District 10.33' 1.896 ,000
Continuously Enrolled in Continuously Enrolled in the -10.11'
the District School 1.438 ,000
New No Pre-K in the District .2 1 2.042 ,995

New No Pre-K in the Continuously Enrolled in the District School
-10.33' 1.896 ,000
Continuously Enrolled in the - District
Based on observed means. The error term is Mean Square (Error) = 834.353.
*. The mean difference is significant at the .05 level.
The analysis demonstrates that a significant difference occurs in mathematics scores
when analyzed by the independent factor, school effect, using NCBLB's criteria for adequate
yearly progress (AYP) as well as enrollment status, as stated earlier. A significant difference
was also found between the interaction of enrollment status and school effect (Table 4.40). The
study analyzed mathematics scores by school status, the students' enrollment at the same school
since preschool, the students' enrollment in preschool who attended different schools within the
district, and the scores of students who did not participate in the district's Abbott preschool.
When mathematics scores were analyzed (Table 4.41) by school status, the group with the
highest mean of 226.6 were the students enrolled in school that meet NCLB mandates. The
second highest average was for the students enrolled in schools with a year 1 "warning" status
with a mean of 224.16. The third highest average was for the students enrolled in schools with a
year 2 "choices" status. The group with the fourth highest average were those enrolled in
schools with a year 6 "restructuring" status. The fifth highest average belonged to the students
enrolled in schools with a year 4 "CAPA" status. The second lowest average was for the
students enrolled in schools with a year 5 "restructuring plan" status. The students with the
lowest average in mathematic scores were those enrolled in schools with a year 3 "SES" status.
As with language arts literacy, the students enrolled in schools with a year 3 " S E status had the
lowest overall average.

When mathematics scores were analyzed for students continuously enrolled who
participated in preschool (Table 4.26), and remaining at the same school, the NCLB status the
group with the highest average were those enrolled in schools that meet NCLB mandates with a
mean of 232.1 1. The second highest average was for the students enrolled in schools with a year
1 "warning" status. The third highest average was for students enrolled in schools with a year 2
"choices" status, with a mean of 229.22. The fourth highest average was for the group of
students enrolled in schools with a year 6 "restructuring plan" status. The fifth highest average
was for the students enrolled in schools with a year 4 "CAPA" status. The sixth highest average
was for the students enrolled in schools with a year 5 "restructuring plan" status. The lowest
average was for students enrolled in schools with a year 3 "SES" status.
The scores of students continuously enrolled, who attended preschool and changed
schools within the district, were analyzed with the school's NCLB status to determine if there
was an impact on mathematics scores. The group with the highest average, who moved within
the district, were the students enrolled in schools with a year 1 "warning" status. The students
with the second highest average of 222.42 were those enrolled in schools that meet NCLB
mandates. The third highest average belonged to students enrolled in schools with a year 2,
"choices," status. The group with the fourth highest mean of 209.89 were the students enrolled
in schools with a year 4 "CAPA" status. The group with the fifth highest average of 204.34 were
the students enrolled in schools with a year 6, "restructuring implemented," status. The group
with the sixth highest mean of 204.34 were the students enrolled in schools with a year 5
"restructuring plan" status. The lowest mathematics mean, of all groups, was for the students
enrolled in schools with a year 3 "SES" status.

When the scores of students who did not attend preschool in the district's Abbott program
were analyzed, the following means were obtained: The group of students with the highest mean
of 232.83 was the students enrolled in schools with a year 3 "SES status. The students enrolled
in schools with "SES status attained the highest average only when they had not attended
preschool in the district; otherwise, the students enrolled in "SES" schools had the lowest mean
in language arts literacy and mathematics. The faction of students with the second highest
average was the students enrolled in schools with a year 6 "restructuring plan" status. The third
highest mean of 223.72 was for the students enrolled in schools that meet NCLB mandates. The
fourth highest mean of 220.50 was for the students enrolled in schools with a year 5
"restructuring plan" status. The group with the fifth highest mean of 217.83 was the students
enrolled in schools with a year 2 "choices" status. The group with the sixth highest mean of
213.52 was the students enrolled in schools with a year 1 "warning" status. The group of
students with the lowest mean of 199.38 was the children who did not attend preschool and were
enrolled in schools with a year 4, "CAPA," status.
As indicated in the prior analysis, differences exist in mathematic scores by participation
in preschool, mobility within the district, and lack of participation in preschool in the district's
Abbott program. The data were examined to compare the groups of students who participated in
preschool continuously enrolled at the same school, students who participated in preschool and
moved within the district, and students who did participate in District A's preschool program,
based on the school they attended, to investigate the possibility of a school effect for students
enrolled in schools that did not meet NCLB's requirements of AYP. The analysis of variance
with Scheffe (Table 4.42) was conducted to determine if a significant difference is evident in
mathematic scores by enrollment status or mobility and school effect. A significant difference

was found by enrollment or mobility status, as well as by school effect, based on NCLB's
school's AYP status and the interaction of enrollment and the school effect.

CHAPTER V
SUMMARY
Introduction
"From neuroscientists to economists, a range of researchers have focused attention on the
importance of children's early years" (Isaacs, 2008). Children are born with the capacity to learn
and succeed academically and socially but too many economic circumstances placed them at risk
beyond their control. The factors which negatively affect academic achievement and
postsecondary success for at risk students are: living below the poverty level, a primary home
language other than English, a mother's highest education being less than a high school diploma,
and living in a single parent home. Students with more risk factors attain lower levels of
academic achievement. For years, policymakers have advocated for quality preschool programs
as a noteworthy type of reform to improve the lives of at-risk students. Research conducted
during the last four decades has found that regular participation in high-quality preschool
programs is associated with significant gains in standardized tests and academic achievement,
better work habits, and a reduction in negative social behaviors well into adulthood. The
positive impact of the benefits of quality preschool are still being reported with results of
longitudinal studies of programs that have been in existence since the 1960's, 1970's and
1980's. These results indicate positive sustained benefits after twenty or thirty years of
participation.
Numerous states have implemented different programs to provide early childhood
education as a means of closing the achievement gap in the United States. In New Jersey, the
Abbott v. Burke decision, a court case that spanned over twenty-five years, provided free quality

preschool for the children in the state's 31 poorest districts. With the Abbott VII ruling, the court
asserted that a well-planned high-quality preschool program would have a significant and
substantial impact on student academic achievement. The Court not only ruled in support of
early childhood education, but also delineated the essential components for a high-quality
preschool program and provided the economic resources to implement and sustain the mandate.
The preschool programs in the Abbott Districts must be designed to take into account the
children's academic needs, health, social development, possible disabilities, and home language
other than English. The programs must have a developmentally appropriate curriculum based on
interactive exchange between the caregivers and the students. Class size must be no more than
fifteen students with two adults - small enough to assure personal exchange between the adults
and child. Certified highly skilled teachers and paraprofessionals with adequate salaries, as well
as sensitivity to the emotional development of children and families in non-educational issues of
a social nature, must teach the classes. Researchers consistently agree on the components that
constitute a high-quality preschool program.
All Abbott preschool programs are continuously monitored for implementation by the
New Jersey Department of Education and while quality cannot be measured, "where regulations
are strict, quality is enhanced and outcomes for children are better" (Isaacs, 2008). According to
the National Institute for Early Education Research's annual report and the Abbott Preschool
Program Longitudinal Effects Study (APPLES), the state-mandated Abbott program in New
Jersey ranks as one of the highest-quality programs in the nation. The APPLES Study reveals
that classroom quality in the Abbott early childhood program continues to improve as a whole,
and that children who attend the program are improving in language arts literacy and
mathematics.

Long-term studies of the benefits of preschool in the United States (Abecedarian
Program, Chicago-Parent Child Program, and High-Scope Perry Program) illustrate the value of
implementing high-quality preschool programs. This study, of the sustainability of preschool
participation in Abbott districts, investigated the impact on student achievement of the New
Jersey Core Curriculum Content Standards for students who participated in the Abbott program
and remained continuously enrolled at the same school, compared to students who participated in
the Abbott preschool program and moved within the district and students who did not attend this
Abbott preschool program. The study used the scores in language arts literacy and mathematics
for the spring of 2OO70n the mandated NJ ASK3. The analysis of scores was based on
participation, enrollment status (CES), socioeconomic status (SES), racelethnicity, absences,
gender, and school environment. To measure the effect of CES, for the purpose of this study,
three groups were created to categorize the subjects. Group One was comprised of students who
attended preschool in the Abbott district and remained at the same school. Group Two was
comprised of students who attended Abbott preschool and transferred within the district due to
family choice or lack of facilities at their neighborhood schools. Finally, Group Three included
students who did not attend the district's Abbott preschool program for a variety of reasons. The
NJ ASK 3 is an assessment that measures students' attainment of the New Jersey Core
Curriculum Content Standards. All New Jersey public and charter school students must
complete the NJ ASK 3 during the spring of third grade.
Summary of the Study
This study utilized data from the public domain accrued through the New Jersey
Department of Education (NJDOE) and District A's student management system. The
information consisted of standards-based NJ ASK 3 test scores in language arts literacy and

mathematics, as reported in the Cycle I1 report delivered to the schools. Students'
socioeconomic status (SES) was determined based on eligibility for Federal Lunch Program. All
families must complete applications every year. District A's student management system was
used to track enrollment or mobility status within the district's schools. The school effect used
in the study is the rating established by the NJDOE, using NCLB criteria and requirements to
determine the school's AYP (adequate yearly progress) status. The student management system
was used to track students' absences. The study also used the multiyear Early Learning
Improvement Consortium (ELIC) results from 2003, the year the subjects were in preschool as 4-
year-olds, to establish the quality of the early childhood program.
District A, the school district used in the study, is the second largest city in the State with
a population of close to 250, 000 people. District A has had a fully implemented Abbon
preschool program since 1999. The population sample used in the study consisted of 2,086
students who attended third grade in 16 different schools during the spring of 2007. The data
were analyzed using a series of analysis of variance, ANOVAs, to ascertain if the benefits of
preschool education made a significant impact or was sustained through the third grade, and if
the students' mobility within the district impacted on student achievement.
The debate about the impact of quality preschool program will continue for the next few
years as policymakers lobby for government-funded preschool programs to equip our children
with the necessary tools for the workforce of the twenty-first century in a declining economy.
One way for school leaders and policymakers to demonstrate the success children can achieve on
high-stakes testing mandated by NCLB is by analyzing the available data to show how the
implementation of quality preschool programs can narrow, or eradicate, the achievement gap for

students at risk. The purpose of this study was to determine the sustainability of early childhood
education on student achievement in language arts literacy and mathematics.
Summary of the Findings
The benefits of preschool, as measured through academic achievement in mathematics
and language arts literacy, are sustained through the third grade. The data confirm that students
who participated in the Abbott program, and remained at the same school, attained higher scores
on the NJ ASK 3 in language arts literacy and mathematics, the mandated assessment of all
public school students in New Jersey. A disparity exists in language arts and mathematics
achievement, as measured by the NJ ASK 3, between students who participated in an Abbott
preschool program. Students who attended preschool and remained at the same school had the
highest mean for language arts literacy and mathematics. The difference in mean was
statistically significant between those who remained at the same school and those who did not
attend preschool. However, the difference in mean was not statistically significant between the
students who attended preschool and moved within the district and those who did not attend the
Abbott preschool program. The findings demonstrate that the benefits of preschool participation
are sustained through the third grade for students who remained at the same school.
In language arts literacy, the highest mean of 21 1.02 was obtained by the students who
remained at the same school, followed by the students who did not participate in the program
with a mean of 206.22, and finally, the mean of 202.75 for the group of students who
participated in the preschool program but attended different schools in the district. According to
the data, it appears that, in language arts literacy, achievement was impacted significantly by
participation as well as mobility. The students who participated in preschool and remained at the
same school had the highest academic achievement, as measured by the NJ ASK in 2007. The

students who did not participate in preschool had a higher language arts literacy average than the
students who moved within the district. Therefore, at this time, a preliminary finding suggests
that keeping students in one school is as effective in improving student achievement as
participation in preschool.
Preschool participation had a significant impact on student achievement in mathematics,
but the achievement fluctuates when analyzed by mobility. The students who remained at the
same school had the highest average of 223.71. The students who moved within the district had
a mean of 212.98, significantly lower than the students who remained at the same school but less
than one point higher than the students who did attend preschool. Therefore, the difference
between the students who moved within the district and the students who did attend preschool is
not statistically significant in mathematics achievement. Again, the preliminary research
suggests that remaining at one school makes an impact on student achievement.
Existing research indicates that students can suffer psychologically, socially, and
academically from mobility. This study demonstrates that mobility, students' moving from one
school to another within the district, negatively impacts on academic achievement in language
arts literacy and mathematics. The students who participated in the Abbott program but moved
and attended more than one school scored the lowest in language arts literacy. The average
scores, or means, in language arts literacy for the group of students who remained at the same
school since preschool had the highest average, compared with the other groups of the students,
even those who did not participate in preschool. In mathematics, the students who remained at
the school had the highest average, followed by the students who moved within the district, and
lastly, those that did not attend the Abbott preschool program. A plausible explanation of the
closeness in mean in language arts literacy and mathematics between the students who moved

within the district and those who did not attend preschool might be that both groups moved. One
group moved within the district, and the other group might have moved from another city, or
even country, therefore not attending preschool because they did not reside in the city. Mobile
students may have a number of other problems that contribute to the lower achievement. In
addition, students who did not attend preschool might remain home with a nonworking parent
that provides many opportunities for development.
Therefore, it is easy to blame mobility as the cause of lower achievement, but a
correlation exists between mobility and lower achievement, as shown in this study. According to
the large amount of research supported by this study, moving from one school to another is a
contributing factor, or risk, for lower academic achievement in mathematics and language arts
literacy. For example, a national study of third-grade students by the U.S. General Accounting
Office (1994) found that frequent school changes is associated with other problems; such as,
poor health and nutrition, students' reading below grade level, and grade retention. The analysis
of academic achievement, based on the interaction of mobility and race, gender, SES, and
attendance, indicated that the difference was statistically significant based on enrollment status
or mobility, but not based on gender, race, or SES or the interaction of enrollment and these
variables.
The achievement gap between certain racial groups is evident and documented by
decades of data. Every year, Black and Hispanic students perform significantly lower than
White students do. The analysis of language arts literacy and mathematics scores based on
mobility and race indicated scores that were statistically significant based on mobility or
continuous enrollment but not based on race or the interaction of both variables. The difference
in average scores in language arts literacy among White, Hispanic, Black, and Asian students in

District A are so small that the findings are not statistically significant. Similarly, student
achievement in mathematics demonstrates an insignificant difference by race. It must be noted
that in District A is predominantly Black and Hispanic. The number of White student is small.
The socioeconomic status of a family is linked to the cognitive development and behavior
of children. The students' family background accounts for the greatest amount of variance in
academic achievement, according to research. Affluent neighborhoods have a concentration of
children with higher IQ's than neighborhoods with lower income. However, in less affluent
communities the incidence of behavioral and health problems increases. According to research,
a connection exists between literacy and oral language development. For example, the ratio of
affirmative words, compared to negative words, a child hears is closely connected to the
families' income. In homes with higher incomes, children listen to more affirmative words,
while the number is a third lower for working families and one-sixth lower for families on public
assistance. Characteristics such as income and parental education tend to be correlated
negatively with race. These different speech patterns between parents and children are part of
the difference observed between racial and ethnic groups.
Based on socioeconomic status, SES, and mobility, students continuously enrolled had a
significant variance in language arts literacy and mathematics when examined based on mobility,
but not based on the variable of SES. As indicated previously, a significant difference occurs
with the impact of preschool participation for students who remain at the same school always.
However, the impact of SES was not statistically significant for the groups of students who
moved within the district and the students who did not participate in preschool. According to
research, children from low socioeconomic backgrounds, and those whose parents have a limited
education, may benefit the most from preschool as they encounter difficulties later in life. This

study found that student achievement in language arts literacy and mathematics, when analyzed
based on SES, did show significant differences. It also found a significant difference based on
mobility, but not based on the interaction of SES and mobility.
An increasing volume of evidence indicates that gender is a significant factor in reading
achievement for boys and girls, as well as in the type of materials studied. Boys typically score
lower than girls do in reading and writing assignments, and on standardized language arts tests.
Boys are more likely to show more success than girls in mathematics and science. As males get
older, they increasingly describe themselves as nonreaders. Boys' underachievement is a major
concern for educators. Nationally, boys fall behind girls in early literacy skills, and this gap in
attainment widens with age. Even though the achievement gap between boys and girls in
language arts and mathematics continues to lessen for Black and Hispanic boys, the difference is
from two to five times as big. The study found a significant difference in achievement between
boys and girls in language arts literacy. The means for females were higher than the means for
males in language arts literacy. In mathematics achievement, gender did not make a significant
difference. Males' and females' achievement scores were so close that it did not make a
significant difference.
The variables, gender and mobility, were used to analyze student achievement in language
arts literacy and mathematics. In language arts literacy, a significant difference was found based
on gender and enrollment status or stability at the same school since preschool. Males and
females who remained at the same school had the highest mean, while students who transferred
between schools and those that did not participate in preschool had lower scores. When
mathematics achievement was analyzed based on gender and mobility, no significant differences
were found. The data from this research indicate that third-grade students did not achieve

significantly different means based on gender, but did achieve significantly higher means based
on mobility within the district. In mathematics, where males traditionally outperform females,
participation in preschool alone was not significant on academic achievement. Only the
interaction between participation and mobility was significant. The difference on achievement
based on gender needs should be studied further to determine if the gap in mathematics
achievement has disappeared for all groups, if preschool participation has closed the gap for
females, or if preschool participation is not meeting the needs of males in developing literacy.
Research has established a correlation between student attendance and academic
achievement. Students who go to class regularly do better in school and maximize their
opportunities for future success. Congress introduced a bill in their 11 0" Session to amend the
Elementary and Secondary Education Act of 1965 to establish grants to increase student
attendance. The goal of the bill was to award grants to local educational agencies for the
implementation of innovative measures to increase school attendance and prevent student
truancy, suspension, and expulsion. However, in this study the number of days students were
absent from school did not have an effect on student achievement. The ANOVAs conducted to
analyze the impact of student attendance on language arts literacy and mathematics found no
significant difference. This study found no correlation between student attendance and
achievement on the NJ ASK3 during the spring of 2007.
The consistent finding of this research study is that mobility negatively impacts student
achievement, regardless of the existence of any other variable. Students who remained at the
same school since preschool outperformed their counterparts who transferred within the district
and those that do not attend preschool. Research shows that regardless of the level or pattern of
mobility, young single mothers have the highest vulnerability of elevated levels of moving. The

evidence suggests that high rates of residential mobility are associated with low income, and the
urban poor, renters, and unmarried people are prone to making multiple moves in one year. The
typical population in an urban Abbott Preschool program is poor, in a minority group, and less
educated.
Under the No Child Left Behind Act (NCLB), all schools receive an annual yearly
progress (AYP) report. Those schools that fail to demonstrate progress are penalized in various
ways. The expectation of the NCLB Legislation is that, by the year 2014, all students will be
performing at or above grade level. AYP measures 40 different progress indicators for different
groups of students at the school, district, and state levels against yearly targets in
readingllanguage arts and mathematics. When schools fail to make AYP for two consecutive
years they are identified as in need of improvement.
In order to rate schools in a consistent manner that would illustrate the effectiveness of
the school in meeting the educational needs of the students, the researcher used the school's
NCLB status report. All public schools in the state are rated on a scale from 0-6, with zero
depicting schools that attain AYP and meet the mandates of NCLB to school in category six
where a restructuring plan has been implemented in the school because it failed to achieve AYP
for a number of years. If a school goes beyond year six, the Department of Education imposes
severe sanctions, including the principal's dismissal, replacement of 50% of the staff, and the
possibility of turning the school into a private entity for administration.
The analysis of data demonstrates that a significant difference exists in student
achievement in language arts literacy and mathematics, when scores are analyzed based on the
school effect (NCLB Status) and mobility (CES). A two-way analysis of variance ANOVA (by
CES and NCLB Status) showed that schools who meet AYP have consistently higher scores in
117

language arts literacy and mathematics within all three mobility categories (Appendix IV). The
students who participated in preschool and remained at the same school had the highest mean in
language and mathematics, demonstrating that the benefits of preschool participation are
sustained through the third grade and that achievement is also impacted by remaining at the same
school. A correlation exists between student achievement and school effect. Students who
attend schools that meet AYP score significantly higher than students who attend schools in year
3. Schools that fail to meet AYP for three years in a row and are eligible for supplemental
educational services (SES) have the lowest scores in mathematics and language arts literacy
within all three categories of enrollment (Appendix IV).
The students who were continuously enrolled, and those who attended preschool and
remained at the same school, have the highest mean in both language arts literacy and
mathematics. Participation in preschool significantly influences student achievement. Students'
participation in District A's preschool program can be associated with higher scores in language
arts literacy for students who remained at the same school. In mathematics, higher average
scores are associated with all students who participated in preschool, including those who
transferred.
Recommendations
At a time when economic resources are limited and the cost of preschool dificult to
sustain, it is the recommendation of this researcher that additional investigation explore the
possibility of keeping students at the same school as a more cost-effective way of improving
student achievement. School districts need to create plans that provide for its students'
education during all the years, fourteen in Abbott districts, necessary to prepare students for
higher education. Schools and districts need to limit policies such as redistricting, and eliminate

neighborhood schools that contribute to unnecessary mobility. The most general, and potentially
most effective, strategy to reduce mobility is to change school culture to keep students during
their elementary years at the same school, and therefore eliminating transfemng of students.
This study suggests that substantial and meaninghl school reforms can dramatically reduce a
school's student mobility rate. District "A" needs to formulate a long-range plan that allows
students to remain at one school from preschool on and receive the benefit of a lower mobility
rate. Flexible school boundaries can provide assistance in diminishing the negative impact of
mobility. For example,
District A should continue to routinely monitor the delivery and implementation
of a high-quality preschool program.
District A should not depart from the HighIScope Curriculum that has produced a
significant impact on student achievement.
Continue to provide the Abbott program in order to minimize the risk factors for
at risk children;
Ongoing formative assessment should be conducted to accurately gauge the
strengths and weaknesses of the program and use the information to make
informed decisions;
Develop flexible attendance and transportation policies that allow students who
change residencies to remain at the same school;
Develop parent and school partnerships that include social services as a way to
support and decrease the need of families to move;

0 School districts should also be flexible with school boundaries, and provide
much-needed relief with courtesy accommodations. Changing the current district
policies can alleviate some of the impact and assist families.
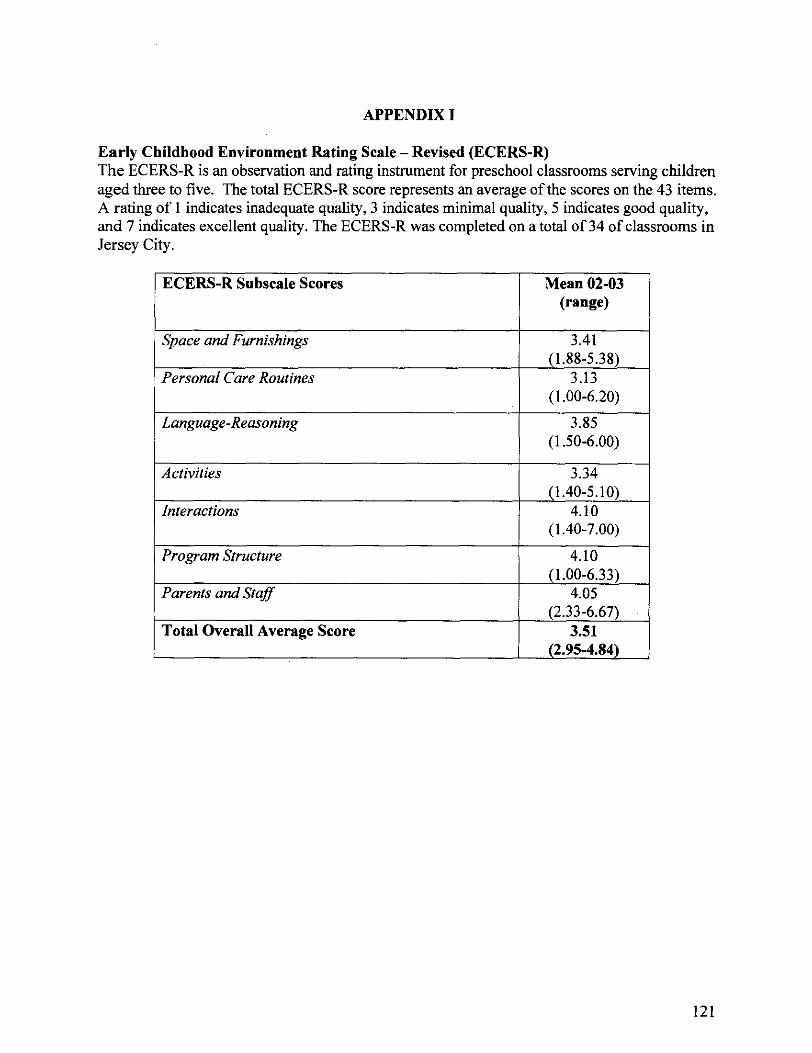
APPENDIX I
Early Childhood Environment Rating Scale - Revised (ECERS-R) The ECERS-R is an observation and rating instrument for preschool classrooms serving children aged three to five. The total ECERS-R score represents an average of the scores on the 43 items. A rating of 1 indicates inadequate quality, 3 indicates minimal quality, 5 indicates good quality, and 7 indicates excellent quality. The ECERS-R was completed on a total of 34 of classrooms in Jersey City.
ECERS-R Subscale Scores Mean 02-03 (range)
Space and Furnishinns 3.41 - (1.88-5.38)
Language-Reasoning
(1 .OO-6.20)
3.85 (1 .SO-6.00)
Interactions
..
(2.33-6.67) Total Overall Average Score 3.51
Personal Care Routines
(1.40-5.10) 4.10
(1.40-7.00)
Program Structure
Parents and Staff
3.13
4.10 (1 .OO-6.33)
4.05

APPENDIX I1
The SELA examines classroom materials and activities used to support children's emerging
literacy skills. The scale includes 16 items scored on a 5-point Likert scale, from 1 (minimal
evidence) to 5 (all features evident). The SELA looks closely at classroom practices associated
with children's literacy development. Table 2 below represents the average scores and ranges for
each item, and the total average for all the classrooms observed for each year.
SELA Item Mean 02-03 (range)
1. Using print in the environment for a 3.44 -.
purpose (2.00-5.00) 2. Creating inviting places to look at 3.41
~ -
books ( 1 .oo-5.00) 3. Inviting interest in a wide variety of 2.87 books in the classroom (1 .OO-5.00) 4. Writing materials are available and 3.16 easy to use. (1 .OO-5.00) 5. A variety of literacy items and props 2.84 . . are used in /he play area. ( I .OO-5.00) 6. Teuchers encourage and extend orul 3.16 language. (1 .OO-5.00) 7. Using language that introduces new 2.59 words, concepts and linguistic structures (1.00-5.00) 8. Organizing activities that uromote 3.13 - - language development ( I .OO-5.00) 9. Sharing books to build lanwage, 3.47 knowledge, and a love of book reading. (1.00-5.00) 10. Calling attention to the functions and 2.75
features ofprint (1 .OO-5.00) 11. Drawing children's attention to the 1.31 sounds rhey hear in words. ( I .OO-5.00) 1 . Helping children recognize ler~ers 2.19
\ , lrltLllie5 (1 .oo-5.00)
13. Promoting children 3 interest in 2.38 - writing (1 .OO-5.00)
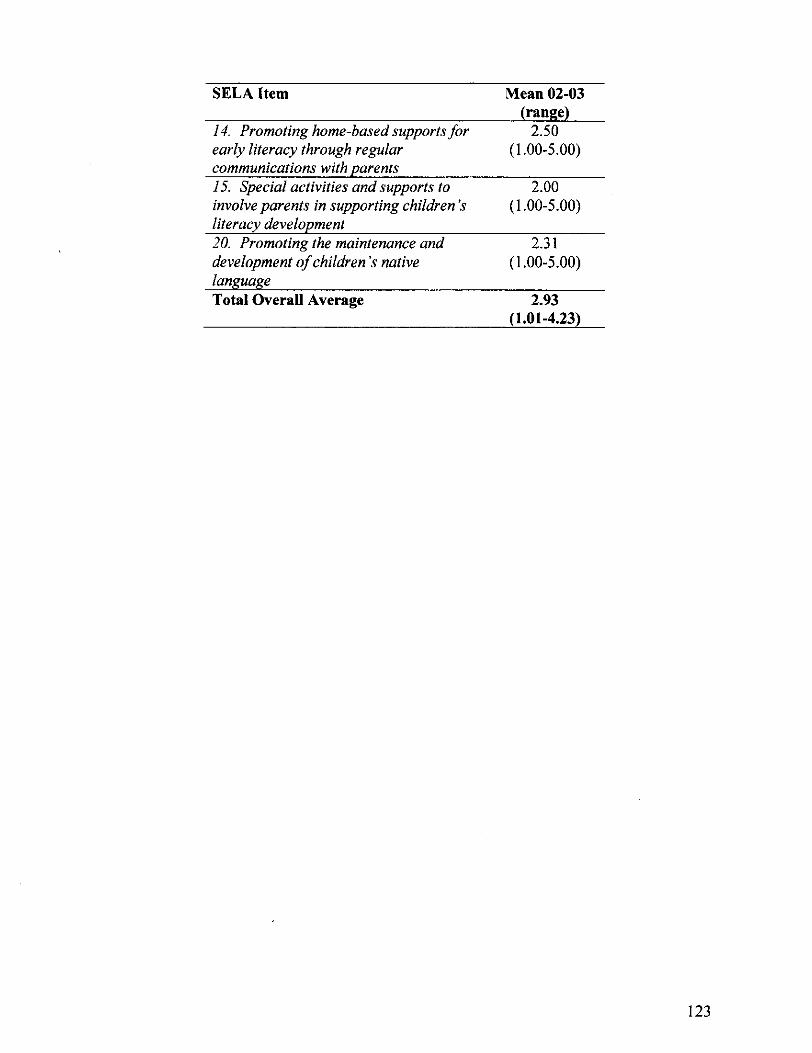
SELA Item Mean 02-03 (range)
14. Promoting home-based supportsfor 2.50 early literacy through regular (1 .OO-5.00) communications with parents 15. Special activities and supports to 2.00 involve parents in supportin~>hildren S (1 .OO-5.00) literacy development 20. Promoting the maintenance and 2.3 1 development of children's native (1 .OO-5.00) language Total Overall Average 2.93
(1.01-4.23)

APPENDIX I11
Early Learning Improvement Consortium Spring 2007
Summary Report - Year Five Preschool Classroom Mathematics Inventory (PCMI) The PCMI assesses the classroom's materials and teaching practices in relation to mathematics. The concepts in this 1 1-item scale are based on the standards from the National Council of Teachers of Mathematics and the National Association for the Education of Young Children. Like the SELA, items are scored on a 5-point Likert scale, f?om 1 (minimal evidence) to 5 (all features evident). The PCMI assesses both the materials in the classroom, and the extent to which teachers support early math concepts. Table 3 shows average scores for each PCMI item.
PCMI Item Mean 02-03 for
(range) eacn
I . Materialsfor counting, comparing, estimating, and recognizing 3.00 year.
number symbols (1 .OO-5.00) 2. Materials for measuring and comnarina amount: volume, 2.38 - weight, length, height, distance, area (1 .OO-5.00) 3. Materials for classl&ing and seriating 2.34
~~ - -
(1.00-5.00) I. Materials for geometry and spatial positions/relations 2.84
(1 .OO-5.00) 5. Teachers encourage one-to-one correspondence. 1.75 A P P ~
(1 .OO-4.00) ndix
6. Teachers encourage children to count andl or write numbers 2.31 IV
- for apurpose. (1.00-5.00) Lang 7. Teachers encourage children to estimate and compare numbers. 2.47
(1 .OO-5.00) uage 8. Teachers encourage children's use of mathematical 2.16 terminology und reflection on ma~hemu~icul problems. ( 1 .OO-5.00) Arts 9. Teachers encourage children to measure and comnure umounr: 1 .3 1 - volume, weight, length, height, distance, area. (1 .OO-3.00) Liter 10. Teachers encourage children to classif$ and seriate. 1.16 - . .
(1 .OO-3.00) 1 I . Teachers encourage concepts of geometry and spatial 1 .OO
ac3'
positions/relations. (1.00-1.00) Score Total Overall Average 1.72

Based on Enrollment and School Effect
LAL
1 -Students who attended preschool and remained at the same school 2-Students who attended preschool and moved within
the district 3- Students who did not participate in preschool
Mathematic Scores Based on Enrollment and School Effect
Mathematies
CES
z n
SES
CAPA Restructuring Plan Restructuring Implemented
1
232.1 1
228.01
229.22
Meets NCLB
Warning
Choices
1-Students who attended preschool and remained at the same school 2-Students who attended preschool and moved within the district
3- Students who did not participate in preschool
195.50
218.96
205.54
22 1.08
2
218.13
222.42
213.78
3
223.72
213.52
217.83
203.90
209.89
204.34
205.51
232.83
199.38
220.50
226.13

REFERENCES
Abadiano, H. R.; &Turner, J. (2005). Early literacy and developmentally appropriate practice: Closing the achievement gap. New England Reading Association Journal, 41(2), 60-67.
Ackerman, D. J.; & Barnett, S. Increasing the effectiveness ofpreschool programs (Preschool policy facts). New Brunswick, NJ: Rutgers University, The Pew Charitable Trusts.
Adams, G. R.; & Summers, M. (1993, January 1). Age and gender differences in preschool children's identification of the emotions of others: A brief report. Canadian Journal of Behavioural Science, 25(15), 97-108.
Applewhite, E.; & Hirsch, L. (2003, October 1). The Abbott preschool program: Fifth year report on enrollment and budget [Electronic version]. In (Education Law Center, Ed.) A report of the Abbott indicators project. Educational Law Center.
Archibald, S. (2006). Narrowing in on educational resources that do affect student achievement. Peabody Journal of Education, 81(4), 23-42.
Baader, M. S. (2004, September 1). Froebel and the rise of educational theory in the United States. Studies in Philosophy and Education, 23(5), 427-444.
Balfaz, R.; Legters (CRESPAR). (2004, April). Impact of the talent development in ninth grade insbuctional reading and mathematics in high poverty high schools. Baltimore, MD: The John Hopkins University No.69, pp.1-24).
Bamett, S. (2002). School reform proposals: The research evidence. Greenwich, CT: Information Age Publishing.
Barnett, S.; & Boocock, S. (1998). Early care and education for children in poverty: Promises, programs, and long-term results. Albany, N Y : State University of New York Press.
Bamett, S.; & Yarosz, D. J. (Preschool Policy Brief). (2007). NIEER (National Institute for Early Education Research No. 15). New Brunswick, NJ: Rutgers University, The Pew Charitable Trusts.
Bennett, A., Bridglall; B. L., Cauce, A. M., Everson, H. T., Gordon, E. W., Lee, C. E. et al. (2004, Fall). All students reaching the top strategies for closing academic achievement gap. Learning Point Associates, pp. 1-4 1.
Berliner, D. (2005, August). 1-60. (Teachers College Record, Ed.) Our impoverished view of educational reform.
Blank, R. M. (2008). Why the United States needs an improved measure of poverty [Electronic version]. Retrieved August 17,2008 from U. S. Poverty, Cost of Living, Economic Mobility.
Block, S. G. (2002). Comparing the adequacy ofNew Jersey and Kentucky court mandates, statutes and regulations to remedy unconstitutional public education. Unpublished doctoral dissertation, Seton Hall University, Executive Ed.D. Program.
Bodrova, E.; & Leong, D. J. (2003, April 1). The importance of being playful. Educational Leadership, 60(7), 50-53.
Bowman, B. T.; Donovan, S. M.; & Bums, S. M. (2001). Eager to learn: Educating our preschoolers. Washington, D.C.: National Academy Press.
Boyd, J., Barnett, W. S., Leong, D. J., Bodrova, E., & Gomby, D. Promoting children's social and emotional development through preschool education (NIEER). New Brunswick, NJ: National Institute for Early Education Research (January 1,2000).
Boyd, J.; Barnett, W. S., Leong; D. J.; Bodrova, E.; & Gomby, D. (Preschool Policy Facts). (2007-08). Promoting children's social and emotional development through high-quality preschool (NIEER). New Brunswick, NJ: National Institute for Early Education Research (January 1,2000).
Brooks-Gunn, J.; Duncan, G. J.; & Aber, J. L. (1997). Neighborhoodpoverty: Context and consequences for children. New York, NY: Russell Sage Foundation.
Brooks-Gunn, J.; Fuligni, A.S.; Berlin, L.J. (2003) Early development in the 21" Century: Profiles of current research initiatives. Commissioned by Eunice Kennedy Shriver. New York, NY: Teachers College Press. Retrieved from National Institute of Child Health and Human Development (NICHD), July 18,2008. www.nichd.nih.gov/about~rneetings/2007/050807.cfm
Cardiff, C. F.; & Stringham, E. (2006, May 1). Is Universal preschool beneficial? An assessment of RAND Corporation's analysis and proposals for California [Electronic version] (Reason Foundation, Ed.). Reason Foundation.

Center on the Developing Child, Harvard University. (2006, August 1). A science-based framework for early childhoodpolicy (Using Evidence to Improve Outcomes in Learning, Behavior, and Health for Vulnerable Children). Retrieved July 17,2008, fiom http:lidevelopingchiId.harvard.edu.
Craig, H.; Connor, C.; & Washington, J. (2003, January 1). Early predictors of later reading comprehension for African American students: A preliminary investigation. Psychology Journal, 34(1), 3 1-43.
Cunie, J.; & Thomas, D. (1997, Fall). Does Head Start help Hispanic children? Investing in our children, 19(1).
Currie, J.; & Thomas, D. (1997, January 1). Does Head Start help Hispanic children? Focus, 19(1), 22-26.
Dale, P. S.; Jenkins, J. R.; Mills, P. E.; & Cole, K. N. (2005, Spring). Follow-up of children from academic and cognitive preschool curricular at 12 and 16. Exceptional Children, 71(3), 301-317.
Davis, J.; & Martin, D. B. (2008, December 1). Racism, assessment, and instructional practices: Implications for mathematics teachers of African American students. Journal of Urban Mathematics Education, 1(1), 10-34.
Denton, K.; & West, J. (2002, March 1). Children's reading and mathematics achievement in kindergarten and first grade [Statistical analysis report] [Electronic version]. In (ies National Center for Educational Statistics, Ed.) Early Childhood Longitudinal Study (ECLS). March 2002 (NCES 2002125). Institute of Education Services U. S. Department ofEducation. .
DiBello; L. C., & Neuharth-Pritchett, S. (2008). Perspectives on school readiness and pre- kindergarten programs. Childhood Education, 84(5), 256-259.
Duncan, G. J.; & Brooks-Gum, J. (1997). Poorfamiliespoor outcomes: The well-being of children and youths. Princeton University.
Education Law Center. (2007-08). ELC news page. In Abbott decisions (History of Abbott).
Espinosa, L. M. (Preschool Policy Matters). (2002). High-qualitypreschool: Why we need it and what it looks like (National Institute for Early Education Research No. 1). New Brunswick, NJ: Rutgers University.

Esposito-Lamy; C., Frede, E.; Seplocha, H.; Jambunatham, S.,;& Wolock, E. (2005, May 18). Giant steps for the litttlest children: Progress in the sixth year of the Abbottpreschool program (Center for early education research, Ed.).
Flaxman, E.; Schwartz, W.; Weiler, J.; & Lahey, M. (1998). Trends and issues in urban education. ERIC Publications.
Frede, E.; Jung, K.; Barnett, W. S.; & Figueras, A. (2009, June I). The APPLES Blossom: Abbott Preschol Program longitudinal effects study (APPLES) Preliminary results through 2nd Grade. Rutgers, June 2009 (National Institute for Early Education Research) (Graduate School of Education, Ed.). Retrieved from http:l/nieer.ore/docs/?DocID=270.
Gelberg, D. (2008, April 10). June 17 [Electronic version]. In Closing the achievement gap: schools alone cannot succeed. Teachers College Record.
Genishi, C., & Goodwin, A. L. (2007). Diversities in early childhood education: Rethinking and doing. New York: NY: Routledge.
Golbeck, S. L. (2002, September 1). Instructional models for early childhood education. ERIC Digest Clearinghouse on Elementary and Early Childhood Education, EDO-PS-02-10.
Gorey, K. M. (2001, Spring). Early childhood education: A meta-analytic affirmation of the short- and long-term benefits of educational opportunity. School Psychologv Quarterly, 16(1), 9-30.
Gormley, W. T. (2008, November 8). The effects of Oklahoma'spre-kprogram on Hispanic children. Public Policy Institute presented at the Annual Meeting Association for Public Policy Analysis and Management, Washington, D.C.: Georgetown University.
Greene, W. (200612007, October 1). Universal preschool: A costly but worthy goal. Journal of Law and Education, 35(4), 555-563.
Gmnewald, R.; & Rolnick, A. (200612007, March 1). A proposal for achieving high returns on early childhood development [Electronic version]. In (Federal Reserve Bank, Ed.) Building the economic case for investments in preschool (Comittee for economic develpment). The Pew Charitable Trusts and PNC Financial Services Group.
Hakins, R.; & Rouse, C. (2005, Spring). School readiness: Closing achievement gaps. The Future of Children, 15(1), 169-195.

Hart, B.; & Risley, T. (2003, Spring). The early catastrophe: The 30 million wordgap by age 3. Retrieved from www.afi.org/pubs-reports/americaneducator/spring2003ca~~ophe.htm1.
Haynes, M. (2008, June 1). Building state early learning systems: Lessons and results from NASBE's early childhood network. The State ofEducation Standard, pp. 13-17.
High/Scope Educational Foundation. Research. In Wide range andfar-reachingjndings. . High/Scope Educational Foundation. (2008). The Highiscope Preschool Educational Approach:
A Prospectus for Pre-Kindergarten Programs (Haque-Director, G.). Ypelamti, MI: HigWScope Research Foundation.
HigWScope Educational Foundation. (2008, July 16). Preschool curriculum. In Adults and children-Partners in learning.
Hispanic school achievement: Catching up requires running faster than white youth. (2004, January 1) (A project of the Southern California, A. s. f. c., Ed.). Pew Hispanic fact sheet. Retrieved from ww.pewshipanic.org/files/factsheets/7.2pdf.
Isaacs, J. B. (2008, September 1). Impacts of early childhood programs. In Firstfocus (Making Children and Families the Priority). Retrieved July 18,2008, from Brookings: \ww.brookings.edu/ccf.
Jacobson, L. (2008, June 11). Long-term economic payoff seen from early-childhood education. Education Week.
Jacobson, L. (2008, July 16). States eye research to shape pre-k priorities science, policy viewed as tightly linked in era of shrinking resources. Education Week, pp. 1-3.
Jacobson, L., Denton, K., McPhee, C., & Park, J. (2007-08, October 1). Preschool: First findings from the third follow-up of the early childhood longitudinal study, birth cohort (ECLS-B) [First Look/ ED TAB] [Electronic version]. In (ies National Center for Educational Statistics, Ed.) Early Childhood Longitudinal Study (ECLS). October 30,2007 (NCES 2008025). Institute of Education Services U. S. Department of Education.
Jones, J. (Policy Information Perspective). (2003, June 1). Early literacy assessment systems: Essential elements (Educational Testing Service, pp. 1-28) (ETS, Ed.).
Kagan, S. L.; & Garcia, E. (1991, September I). Educating culturally and linguistically diverse preschoolers: Moving the agenda. Early Childhood Research Quarterly, 64(3), 427-443.

Karoly, L. A,; Ghosh-Dastidar; B., Zellman; G. L., Perlman, M.; & Fernyhough, L. (2008). Prepared to learn: The nature and quality of early care and education for preschool-age children in California [Electronic version]. In RAND Labor and Population (Http://www.rand.org). RAND Corporation.
Kartal, H. (2007, January 1). Investments for future: Early childhood development and education. Educational Sciences: Theory & Practice, 7(1), 544-554.
Keating, D. P.; & Hetman, C. (2000). Developmental health and the wealth of nations: Social, biological, educational dynamics. New York: NY: Guilford Press.
Kerbow, D. (1996, October 1). Patterns of urban student mobility and local school reform. Center for Research on the Education of Students placed at risk (CRESPAR), US. Department of Education. Retrieved from hnp:/lwwwljstor.org/pss/IO85729.
Kilpatrick, S. J. (2001). Adding it up: Helping children learn mathematics. Washington, D.C.: National Academy Press.
Kim, J. J.; & Crasco, L. M. (2006). Best policies and practices in urban educational reform: A summary of empirical analysis focusing on student achievements and equity. Journal of Education for Students Placed at Risk, 1 l(l5), 19-37.
Klein, L.; & Knitzer, J. (2007). Promoting effective early literacy. In What everypolicymaker and educator should know.
Knudsen, E. I.; Hechan , J. J.; Cameron, J. L.; & Shonkoff, J. (2006, July 1). Economic neurobiological and behavioral perspectives on building America's future workforce [Electronic version]. In (National scientific council center on the developing child, Ed.) 101 55: 103. Harvard University.
Knudsen, E. I.; Hechan , J. J.; Cameron, J. L.; & Shonkoff, J. (2006, July 1). Econonmic, neurobiological and behavioral perspectives on building America's future workjorce.
Lamy, C.; Barnen, S.; & Jung, K. (2005, December 1). The effects of the Michigan school readinessprogram on young children's abilities at kindergarten entry (Joyce Foundation and The Pew Charitable Trusts) (The Effects of MSRP) (Organization, N. I. E. E. R., Ed.).
Langford, R. (2008). Making a difference in the lives of young children: A critical analysis of a pedagogical discourse for motivating young women to become early childhood educators. Canadian Journal of Education, 31(1), 78-101.

Lee, V. E.; & Burkman, D. T. (2002, November 1). Inequalities at the starting gate: Social background differences in achievement as children begin school [Electronic version]. In (Economic Policy Institute, Ed.) Research for broadly sharedprosperity. University of Michigan, September 2002.
Levine, B. (1995). Educational response to poverty. Canadian Journal of Education, 20(2). Liu, K. (2007-08, Winter). Ensure education equality and school success for young children.
Childhood Education, 84(2), 94-A-E.
Lutkus, A. D.; Weiner, A. W.; Dame, M. C.; & Jin, Y. (2002). The Nation's Report Card: Reading 2002, Trial Urban District Assessment. In The Nation's Report Card (National Center for Education Statistics).
Lynch, R. G. (2004). Exceptional returns: Economic, fiscal, and social benefits of investment in early childhood development. San Diego, CA: EPI Books.
Malleo, C. (2007). The impact ofAbbott v. Burke on community basedpreschool teacher's education employability, andpedagogical competencies. Unpublished doctoral dissertation, Seton Hall University, School of Education.
Manning, M.; & Patterson, J. (200612007, Winter). Lifetime effects: The HighIScope Perry Preschool study through age 40. Childhood Education, 83(2), 121.
Mathews, K. A. (2004, April 29). How does childhood socioeconomic status impact health across the life span? (University of Pittsburgh, Ed.).
Mattmiller, B. (2001, May 8). Study: Early intervention cuts crime, dropout rates. University of Wisconsin-Madison News.
McCardle, P.; Scarborough, H.; & Cans, H. (2001). Predicting, explaining and preventing children's reading difficulties. Learning Disabilities Research and Practice, 16(4), 230- 239.
McDermott, K. (2003, April 1). What causes variation in state's accountability policies? Peabody Journal ofEducation, 78(4), 153- 177.
McLoyd, V. C. (1998). Socioeconomic disadvantage and child development. American Psycholgist, 53, 185-204.

McMillan, J. H. (2000). Fundamental assessment principles for teachers and school administrators. In Practical assessment, research and evaluation. Retrieved April 8, 2008, from Virginia Commonwealth University: http:/lpareonline.netlgetvn.asp?v=7&n=8.
Meehan, R. C. (2004). The impact of an intensive literacyprogram on the sustained reading achievement of second grade students. Unpublished doctoral dissertation, Seton Hall University (pp. 13-33).
Mehaffie, K. E.; & McCall, R. (Office of Child Development). (2002, April 1). Readiness for kindergarten: A brief report (Office of Child Development University of Pittsburgh).
Mendez-Perez, A. (2000, Summer). Mexican American mothers' perceptions and beliefs about language acquisition in infants and toddlers with disabilities. Bilingual Research Journal, 24(3), 277-293.
Mersky, J., & Reynolds, A. (2007, January 1). Predictors of early childbearing: Evidence from the Chicago Longitudinal Study. Children and Youth Services Review, 29(1), 35-52.
National Association of State Boards of Education. (2008). Early childhood education. In The Early Childhood Project.
National Literacy Trust. Literacy changes lives. In Good Early Years Give a Head Start - New Study (http://www.literacytrust.org.uk~literacynews/earl~e~s.html#heads~).
National Scientific Council on the Developing Child. (2007-08, January 1). The science of early childhood development (Center on the Developing Child, Ed.). Retrieved from www.developingchild.net.
Network, P. P. Programs that work. In Carolina Abecederian Project.
New Jersey Department of Education Office of Early Childhood Educatiohn (Abbon Preschool program implementation guidelines). (2003). Abbott Preschool Program Implementation Guidelines. New Jersey Department of Education.
Orland, M. E. (1990). Demographics of disadvantage: Intensity of childhoodpoverty and its relationship to educational achievement. New York: NY: The College Board.
Paris, U. S. (2000, May 1). Policies and practices of high-stakes testing that influence teachers and schools. Issues in Education, 6(112).

Peebles-Wilkins, W. (2007, January I). Why early intervention? Children & Schools, 29(1), 45- 46.
Pekow, C. (School Law Bulletin). (2007). Head Start House authorizes changes to Head Start. Thomson West: Quinlan.
Perkins-Gough, D. (2006, September I). Do we really have a "boy crisis?" Educational Leadership, 64(1), 93-94.
Pew Hispanic Center. (2004, January 1). Hispanic school achievement: Catching up requires running faster than white youth. In Fact sheet (1-2).
Pianta, R.; Howes, C.; Burchinal; M., Bryant, D.; Clifford, R.; Early, D. et al. (2005). Features of pre-kindergarten programs, classrooms, and teachers: Do they predict observed classroom quality and child-teacher interactions? Applied Developmental Science, 9(3), 144-159.
Planty, M.; Provasnik, S.; Hussar, W.; Kena, G.; Hampden-Thompson, G.; Dinkes, R., et al. (2007-08, June 1). The condition of education 2007 [Compendium] [Electronic version]. In (ies National Center for Educational Statistics, Ed.) Annual Reports Program (Annual) (NCES 2007064). Institute ofEducation Services U. S. Department ofEducation.
Prince, D. L.; Pepper, K.; & Brocato, K. (2006, August I). The importance of making the well- being of children in poverty a priority. Early Childhood Educational Journal, 34(1), 2 1- 28.
Quaal, M.; Lichtenstein, A,; Srivastava, A,; Rice, S.; Taylor-Jones, M.; Mateo, K., et al. (2007, January 1). Poor in the garden state: Beginning to assess New Jersey's progress in addressing poverty. In North Central Regional Education Laboratory (Ed.), The Initial PoverQ Benchmarks Report (Legal Services of New Jersey Poverty Research Institute, pp. 1-76).
Renzulli, J. S. (2008, July 16). Engagement is the answer. Education Week, 27, Issue 43, 30-31.
Research Brief. (2004, July 20). Academic and communal classroom influences on minority student achievement. ASCD, 2(2).
Reynolds, A. J. (1999). Schooling and high-risk populations: The Chicago Longitudinal Study. Journal of School Psychology, 37(4), Special Issue.

Reynolds, A. J. (2004, January 1). Promoting Well Being in Children and Youth: Findings from the Chicago Longitudinal Study. Children and Youth Services Review, 26(1), 15-38.
Reynolds, A. J.; Mann, E., Neidel; W.; & Smokowski, P. (1997, January 1). Early intervention, cognition, and school achievement: Findings from two generations of model programs. Focus, 19(15), 12-17.
Reynolds, A. J.; Mann, E.; Neidel, W.; & Smokowski, P. (1997, Fall). The state of early childhood intervention: Effectiveness, myths and realities new directions. Investing in Our Children, 19(1), 5-1 1 .
Reynolds, A. J., Mann, E., Neidel, W., & Smokowski, P. (1997, January 1). The state of early childhood intervention: Effectiveness, myths and realities, new directions. Focus, 19(1), 5-11.
Reynolds, A. J., & Ou, S.-R. (2004, February 25). Preschool education and school completion. Encyclopedia on Early Childhood Development.
Reynolds, A. J.; & Ou, S.-R. (2005, January 1). Alterable predictors of child well-being in the Chicago Longitudinal Study [Early Childhood]. Children and Youth Services Review, 26(1), 1-14. Retrieved August 15,2008, from http://www.sciencedirect.com/science?~o~=A~icleU~&~udi=B6V984BD5GNO- I &-user=15 154.55~9-coverDate=O Ioh2F3 1%2F2004&-rdoc= I&-fmt=high&-orig=search&~so~d&-doc anchor=&view=c&-searchStTId= 130 1529923&~rerunOrigin=google&~acct=COOOO53262&~version= I&- urlVersion=O&-userid=I 5 15455&md5=d7e93a791db58573~64a8afcd59e2d7t%sec 1 .
Reynolds, A. J., & Temple, J. A. (2005, April 1). Priorities for a new century of early childhood programs. Urban Education, 35(1), 31-56.
Reynolds, A. J., & Wolfe, B. (1997, Fall). Early intervention cognition and school achievement: Findings from two model programs. Investing in Our Children, l9(l).
Reynolds, A. J., & Wolfe, B. (1997, January 1). School achievement, early intervention and special education: New evidence from the Chicago Longitudinal Study. Focus, 19(1), 18- 21.
Rice, C. (2007, January 1). Building strong rungs to buildstudy ladders: The status ofpreschool- 3rd grade systems in New Jersey (1 -10).

Rice, C.; & McLaughlin, J. (Association for Children of New Jersey). (2007). Providing the tools towards quality: The status of P-3 teacher preparation programs in New Jersey (ACNJ policy brief).
Roderick, C. M. (1999, September 1). Risk and recovery from course failure in the early years of high school. American Educational Research Journal, 37(5), 525-559.
Roebuck, K. (2007, December 30). Early education may pay lifelong dividends [Review]. Pittsburgh Tribune-Review, 1-5.
Rumberger, R. W. (2002). Student mobility and academic achievement [Electronic version]. In (Elementary, E. R. I. C. C. O., & Education, E. C., Eds.) ERIC digest. ERIC Digest.
Ryan, D. 0. (2005). The impact of reading insbuctiona~processes on literacy acquisition. Unpublished doctoral dissertation, Seton Hall University (Vol. AAT3192840, p. 96).
Ryan, S., & Grieshaber, S. (2004, November 1). It's more than child development: Critical theories, research, and teaching young children. Young Children, 59(6), 44-52.
Sadowski, M. (2006, January 1). What does effective pre-k teaching look like? Harvard Education Letter, 22(1).
Sarnuelsson, I. P.; & Sheridan, S. (2004). Recent issues in the Sweish preschool. International Journal ofEarly Childhood, 36(1), 7-22.
Schmidt, H. W. (2005, September 1). Curriculum coherence: An examination of US mathematics and science content standards from an international perspective. Journal of Curriculum Studies, 37(5), 525-559.
Schweinhart, L. (2002, June 1). Historical narrative. In HIGHISCOPE (32) (Perryschool Study). Retrieved September 16,2008, from Phi Delta Kappa Center for Evaluation, Development and Research: http:/ihighscope.org/Content.asp?ContentId+232.
Schweinhart, L. (2002, June 1). How the HighfScope Perry preschool program study grew: A researcher's tale. Phi Delta Kappa, 1-5.
Sheets, H., & Rosa. (2006, Summer). Ethnic identity and its relationship with school achievement. Multicultural Education, 13(4), 58-60.

Shonkoff, J. P., Boyce, T., & McEwen, B. (2009). Neuroscience, molecular biology, and the childhood roots of health disparities building a new framework for health promotion and disease prevention. J A M , 301(21), 2252-2259.
Shonkoff, J. P.; Meisels, S. J.; & Zigler, E. F. (2000). Handbook of early childhood intervention. New York: NY: Cambridge University Press.
Shonkoff, J. P.; & Phillips, D. A. (2000). From neurons to neighborhoods the science of early childhood development. Washington, D.C.: National Academy Press.
Shonkoff, J. P.; & Phillips, D. A. (2000). From neurons to neighborhoods: The science of early childhood development. Washington, D.C.: National Academy Press.
Slaby, R.; Loucks, S.; & Stelwagon, P. (2005, Fall). Why is preschool essential in closing the achievement gap? Educational Leadership and Administration, 17, 47-57.
Smith, E. (2005, July 1). Raising standards in American schools: The case for No Child Left Behind. Journal of Education Policy, 20(4), 5-8.
State of New Jersey Department of Education. (2006). Assessment. In New Jersey Assessment of Skills and Knowledge.
Stipeck, D. (2006, June 1). Accountability comes to preschool: Can we make it work for young children? Phi Delta Kappa, 87(1 O), 740-746.
Stoll, M. A. (2001, September 1). Race, neighborhood poverty and participation in voluntary associations. Sociological Forum, 16(3), 529-557.
Strickland, D. S., & Riley-Ayers, S. Early literacy: Policy andpractice in the preschool years (Preschool policy facts). Rutgers: The Pew Charitable Trusts.
Takanishi, R., & Kauerz, K. (2008, March 1). PK inclusion: Getting serious about a P-16 education system. Phi Delta Kappa, 89(7), 480-488.
Tanner, D. (1997, Spring). Standards, standards: High and low. Educational Horizons, 75(3), 115-120.
Teachers College Columbia University. (2008). Institute for urban and minorig education.

Temple, J., Reynolds, A,, & Miedel, W. (2000). Can early intervention prevent high school dropout? Evidence from the Chicago Child-Parent Centers. Chicago, Michigan: University of Wisconsin-Madison.
The Carolina Abecedarian Project. (2007, May 24). Can child care impact risk for depression? The Carolina Abecedarian Project. (2007-08, May 22). Good daycare boostspoor kids' later
mental health.
The Education Trust. (2008). Latino achievement in America.
The National Task Force on Early Childhood Education for Hispanics. (2008, June 1). Early education and Hispanics in the United States. The State of Education Standard, pp. 48- 51.
U.S. Department of Health and Human Services. (2003). Strengthening Head Start: What the evidence shows [Electronic version].
Vandell, D. L.; Reisner, E. R.; & Pierce, K. M. (2007, October 1). Outcomes linked to high- quality ajierschool programs: Longitudinal findings ?om the study ofpromising ajierschool programs [Electronic version] (University of California, Ed.). Charles Stewart Mott Foundation.
Walker, E., Achilles, C., & Frances, C. (2005). The impact of the 1998 Abbott v. Burke decision on education progress in NewJjersey high poverty districts: What have we learned? University of California (Ed.), Earl Warren Institute on Race, Ethnicity, and Diversity. Berkeley: Boalt Hall School of Law.
Walker, M. A. (2007, June 28). Black men and education focus of Urban League report. Diverse Issues in Higher Education, 24(10), 9.
Wat, A. (2007-08, May 1). Dollar and sense: A review of economic analyses of pre-k. Prep) now, 1-28. Retrieved June 17,2008, from www.preknow.org.
Whelm, R. B. (2008). Understanding children's mathematical learning: The relationship to instruction in preschool classrooms. Unpublished doctoral dissertation, Seton Hall University, Executive Ed.D. Program (pp. 1-35).
Xue, X., & Meisel, S. (2004, Spring). Inequality in preschool education and school readiness. American Educational Research Journal, 11(1).

Zaman, A. (2006, Fall). Parental roles in the acquisition of primary level skills: An exploratory view on the low-income Hispanic-American families with 3- and 4-year-old children. Educational Sciences: Theory & Practice, 127(15), 73-83.


