KINGDOM OF CAMBODIA Nation- Religion- King
Economic Census of Cambodia 2011
Analysis of the Census Results Report No.7
Textile Industry
National Institute of Statistics, Ministry of Planning Phnom Penh, Cambodia
Supported by: Government of Japan and
Japan International Cooperation Agency (JICA)
February 2013

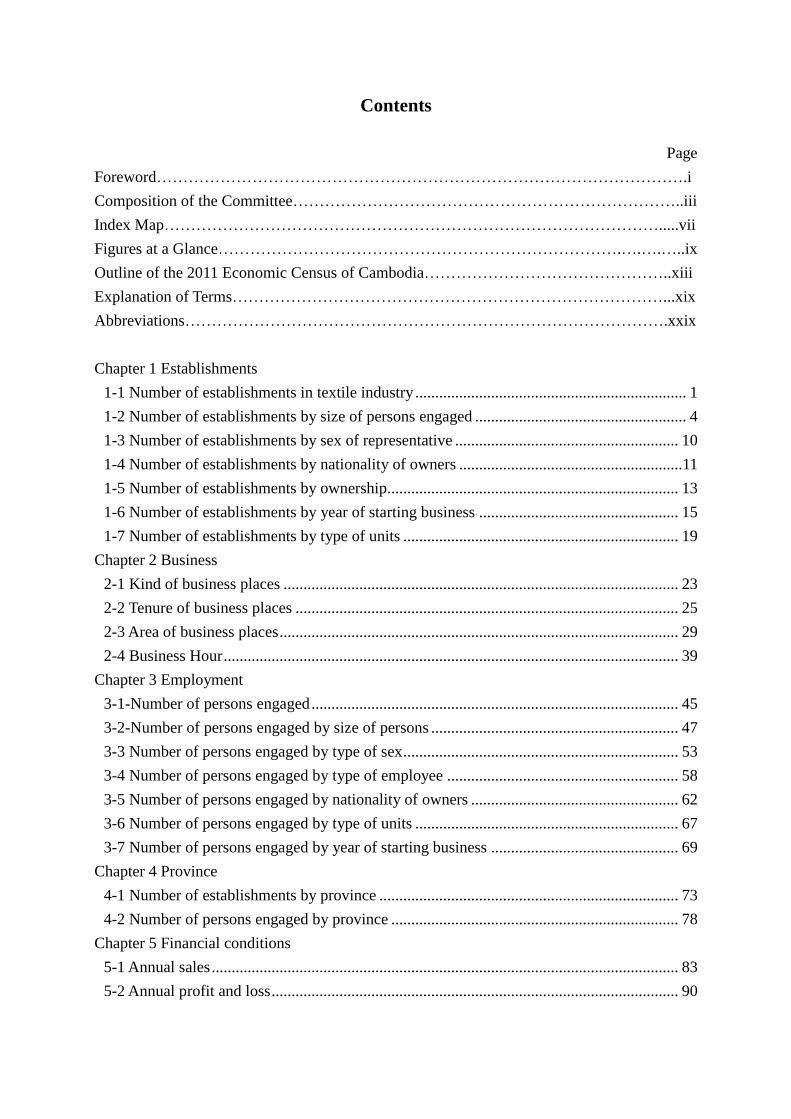
Contents
Page
Foreword……………………………………………………………………………………….i
Composition of the Committee………………………………………………………………..iii
Index Map………………………………………………………………………………….....vii
Figures at a Glance………………………………………………………………….….….…..ix
Outline of the 2011 Economic Census of Cambodia………………………………………..xiii
Explanation of Terms………………………………………………………………………...xix
Abbreviations……………………………………………………………………………….xxix
Chapter 1 Establishments
1-1 Number of establishments in textile industry .................................................................... 1
1-2 Number of establishments by size of persons engaged ..................................................... 4
1-3 Number of establishments by sex of representative ........................................................ 10
1-4 Number of establishments by nationality of owners ........................................................11
1-5 Number of establishments by ownership......................................................................... 13
1-6 Number of establishments by year of starting business .................................................. 15
1-7 Number of establishments by type of units ..................................................................... 19
Chapter 2 Business
2-1 Kind of business places ................................................................................................... 23
2-2 Tenure of business places ................................................................................................ 25
2-3 Area of business places .................................................................................................... 29
2-4 Business Hour .................................................................................................................. 39
Chapter 3 Employment
3-1-Number of persons engaged ............................................................................................ 45
3-2-Number of persons engaged by size of persons .............................................................. 47
3-3 Number of persons engaged by type of sex ..................................................................... 53
3-4 Number of persons engaged by type of employee .......................................................... 58
3-5 Number of persons engaged by nationality of owners .................................................... 62
3-6 Number of persons engaged by type of units .................................................................. 67
3-7 Number of persons engaged by year of starting business ............................................... 69
Chapter 4 Province
4-1 Number of establishments by province ........................................................................... 73
4-2 Number of persons engaged by province ........................................................................ 78
Chapter 5 Financial conditions
5-1 Annual sales ..................................................................................................................... 83
5-2 Annual profit and loss ...................................................................................................... 90

Tables
Table1-1-1 Number of Establishments in Manufacturing Industry by Division of ISIC
Table1-1-2 Number of Establishments in Textile Industry by Class of ISIC
Table1-2-1 Number of Establishments in Textile Industry by Size of Persons engaged
Table1-2-2 Number of Establishments in Textile Industry by Size of Persons engaged and by
Class of ISIC
Table1-3 Number of Establishments by Sex of Representative
Table1-4-1 Number of Establishments by Nationality of the Owners
Table1-4-2 Number of Establishments by Nationality of the Foreign Owners
Table1-5-1 Number of Establishments by Ownership
Table1-5-2 Number of Establishments in Textile Industry by Ownership and by Nationality
of Owners
Table1-6-1 Number of Establishments by Year of Starting Business
Table1-6-2 Number of Establishments in Textile Industry by Year of Starting Business and
by Nationality of Owners
Table1-6-3 Number of Establishments in Textile Industry by Year of Starting Business and
by Nationality of Foreign Owners
Table1-7-1 Number of Establishments by Type of Unit
Table1-7-2 Number of Establishments in Textile Industry by Type of Unit and by Nationality
of the Owners
Table1-7-3 Number of Establishments in Textile Industry by Type of Unit and by Type of
Ownership (Legal Status)
Table2-1-1 Number of Establishments by Kind of Business Place
Table2-1-2 Number of Establishments in Textile Industry by Kind of Business Place and by
Ownership (Legal Status)
Table2-2-1 Number of Establishments by Tenure of Business Place
Table2-2-2 Number of Establishments in Textile Industry by Tenure of Business Place and
by Kind of Business Place
Table2-2-3 Number of Establishments in Textile Industry by Tenure of Business Place and
by Ownership (Legal Status)
Table2-3-1 Number of Establishments by Area of Business Place
Table2-3-2 Number of Establishments in Textile Industry by Area of Business Places and by
Nationality of the Owners
Table2-3-3 Number of Establishments in Textile Industry by Area of Business Place and by
Kind of Business Places
Table2-3-4 Number of Establishments by Area of Business Place and by Ownership (Legal
Status)
Table2-4-1 Number of Establishments by Hours of Operating Business -Opening and
Closing Time

Table2-4-2 Number of Establishments by Hours of Operating Business -Total Hours-
Table3-1-1 Number of persons engaged
Table3-1-2 Number of Persons engaged by Size of Person
Table3-2-1 Number of Persons engaged in Textile Industry by Class of ISIC
Table3-2-2 Number of Persons engaged in Textile Industry by Size of Person and by Class of
ISIC
Table 3-2-3 Number of Persons engaged in Textile Industry by Ownership (Legal Status)
Table 3-3-1 Number of Persons engaged by Type of Sex
Table 3-3-2 Number of Persons engaged in Textile Industry by Type of Sex and by Class of
ISIC
Table 3-3-3 Numbers of Persons engaged by Type of Sex and by Type of Employee
(including Voluntarily-engaged Persons)
Table3-4-1 Numbers of Persons engaged by Type of Employee (including
Voluntarily-engaged Persons)
Table3-4-2 Numbers of Persons engaged in Textile Industry by Type of Employee and by
Ownership (Legal Status)
Table3-5-1 Numbers of Persons engaged by Nationality of Owners
Table3-5-2 Number of persons engaged in Textile Industry by Size of Person engaged and by
Nationality of Owners
Table3-6-1 Numbers of Persons engaged by Type of Units
Table3-6-2 Numbers of Persons engaged in Textile Industry by Type of Unit and by Size of
Persons engaged
Table3-7-1 Numbers of Persons engaged in Textile Industry by Year of Starting Business
Table3-7-2 Average Number of Persons engaged in Textile Industry by Year of Starting
Business
Table4-1-1 Number of Establishments by Province
Table4-1-2 Number of Establishments in Textile Industry by Province by Class of ISIC
Table4-2-1 Number of Person engaged by Province
Table4-2-2 Number of Persons engaged in Textile Industry by Province and by Class of ISIC
Table5-1-1 Annual Sales
Table5-1-2 Annual Sales in Textile Industry by Class of ISIC
Table5-1-3 Number of Entities by Size of Annual Sales
Table5-1-4 Number of Entities in Textile Industry by Size of Annual Sales and by Class of
ISIC
Table5-2-1 Annual Profit and Loss
Table5-2-2 Annual Profit and Loss in Textile Industry
Table5-2-3 Number of Entities by Size of Profit and Loss
Table5-2-4 Number of Entities in Textile Industry by Size of Profit and Loss and by Class of
ISIC
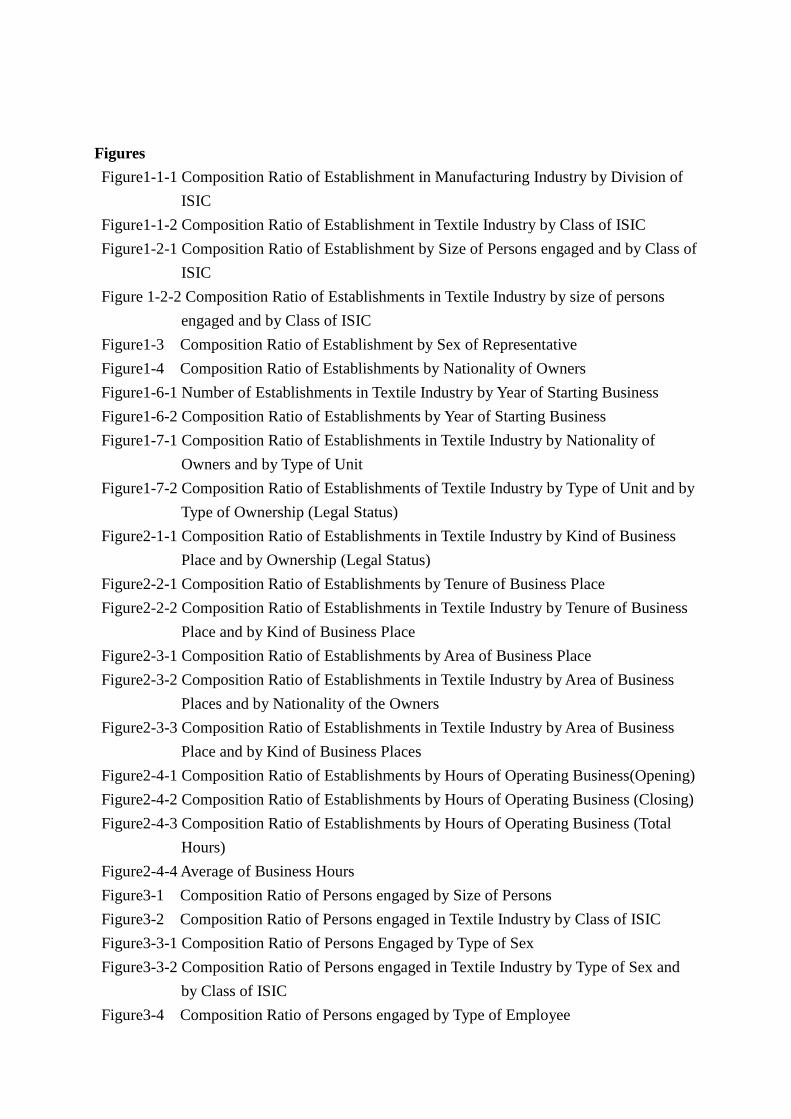
Figures
Figure1-1-1 Composition Ratio of Establishment in Manufacturing Industry by Division of
ISIC
Figure1-1-2 Composition Ratio of Establishment in Textile Industry by Class of ISIC
Figure1-2-1 Composition Ratio of Establishment by Size of Persons engaged and by Class of
ISIC
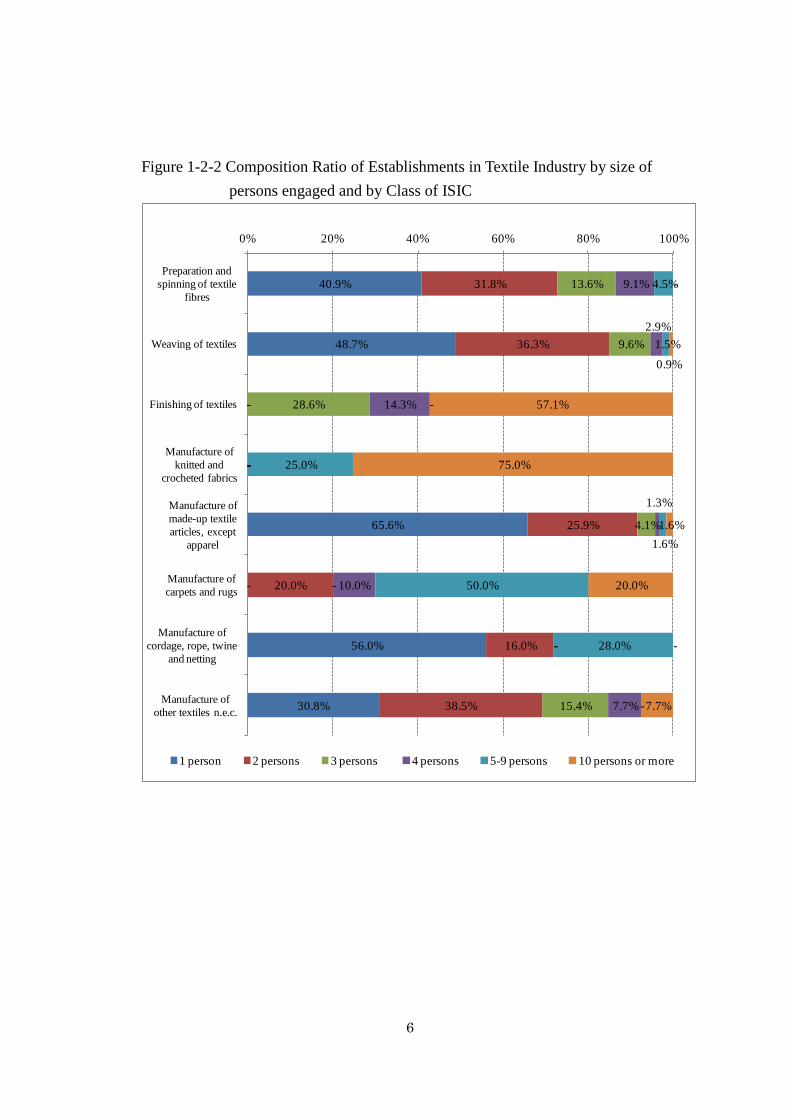
Figure 1-2-2 Composition Ratio of Establishments in Textile Industry by size of persons
engaged and by Class of ISIC
Figure1-3 Composition Ratio of Establishment by Sex of Representative
Figure1-4 Composition Ratio of Establishments by Nationality of Owners
Figure1-6-1 Number of Establishments in Textile Industry by Year of Starting Business
Figure1-6-2 Composition Ratio of Establishments by Year of Starting Business
Figure1-7-1 Composition Ratio of Establishments in Textile Industry by Nationality of
Owners and by Type of Unit
Figure1-7-2 Composition Ratio of Establishments of Textile Industry by Type of Unit and by
Type of Ownership (Legal Status)
Figure2-1-1 Composition Ratio of Establishments in Textile Industry by Kind of Business
Place and by Ownership (Legal Status)
Figure2-2-1 Composition Ratio of Establishments by Tenure of Business Place
Figure2-2-2 Composition Ratio of Establishments in Textile Industry by Tenure of Business
Place and by Kind of Business Place
Figure2-3-1 Composition Ratio of Establishments by Area of Business Place
Figure2-3-2 Composition Ratio of Establishments in Textile Industry by Area of Business
Places and by Nationality of the Owners
Figure2-3-3 Composition Ratio of Establishments in Textile Industry by Area of Business
Place and by Kind of Business Places
Figure2-4-1 Composition Ratio of Establishments by Hours of Operating Business(Opening)
Figure2-4-2 Composition Ratio of Establishments by Hours of Operating Business (Closing)
Figure2-4-3 Composition Ratio of Establishments by Hours of Operating Business (Total
Hours)
Figure2-4-4 Average of Business Hours
Figure3-1 Composition Ratio of Persons engaged by Size of Persons
Figure3-2 Composition Ratio of Persons engaged in Textile Industry by Class of ISIC
Figure3-3-1 Composition Ratio of Persons Engaged by Type of Sex
Figure3-3-2 Composition Ratio of Persons engaged in Textile Industry by Type of Sex and
by Class of ISIC
Figure3-4 Composition Ratio of Persons engaged by Type of Employee

Figure3-5 Composition Ratio of Persons engaged by Nationality of Owner
Figure3-6 Composition Ratio of Persons engaged by Type of Units
Figure4-2 Composition Ratio of Establishment and Person engaged in Textile Industry by
Provinces


i
FOREWORD
It is our great pleasure to officially release the analysis of the census results of the 2011
Economic Census of Cambodia (EC2011) which was conducted from 1 to 31 March 2011 with 1
March 2011 as the reference date, covering the entire territory of the Kingdom of Cambodia.
Historically, it was the first Economic Census in Cambodia as a complete count of all establishments.
Under the legal basis of the Statistics Law, the EC2011 aims at compiling basic statistics on
establishments and enterprises in the whole Cambodia’s territory. The analysis of the census results
provide information on the current situation of establishments in Cambodia and serve for various users
such as policy makers, government officials at both national and local levels, international
organizations, NGOs, private sectors, researchers, and development partners. The analysis of the
census results will contribute to achieving the socio-economic development goals of the Royal
Government in supporting evidence-based planning. I am sure that the public will be very much
benefitted to use the EC2011 results to the full extent possible.
We express our deep sense of gratitude to the Royal Government of Cambodia led by
Samdech Akka Moha Sena Padei Techo HUN SEN, Prime Minister of the Kingdom of Cambodia
for his constant support to the statistical activities, especially to the EC2011 which enabled very
successful completion of the census. Our thanks are due to the Ministry of Planning (MOP), the
National Institute of Statistics (NIS) and line ministries such as the Ministry of Economy and Finance,
the Ministry of Industry, Mines and Energy, the Ministry of Commerce, the Ministry of Interior and
other relevant government ministries and institutions which facilitated our activities and led to the
success of the EC2011.
I gratefully acknowledge funding and technical assistance provided by the Government of
Japan and Japan International Cooperation Agency (JICA). Our deep thanks are due to Mr. Fumihiko
Nishi, Chief Adviser of the JICA Project on Improving Official Statistics in Cambodia, Mr. Akihiko
Itoh, and other JICA experts of this project, who made all the best efforts in the complete success of
the implementation of the EC2011.
We thank Governors of Phnom Penh Capital, provinces, and chiefs of districts as well as
Chiefs of commune and village, who provided administrative facilitation for the implementation of the
EC2011.

ii
The EC2011 was one of the greatest statistical exercises, and its successful completion was
possible with the total help and cooperation received from one and all. The major share of the credit
for the success of the EC2011 should go to the entrepreneurs of small, medium and large enterprises
who paid busy and valuable time of their daily business to provide information to the EC2011 Forms.
Deep thanks are also given to enumerators, supervisors, and the staff of the NIS and the MOP
who were devoted, hard work, and loyal. H.E. San Sy Than, Director General of the NIS ably led the
EC2011 operations, being assisted by Mr. Khin Sovorlak, Deputy Director General, personnel
associated with this report by Mr. Pick Pothy, Deputy Director, Economic Statistics Department, Mr.
Chan Samrith, Bureau Chief, Statistics Standard and Analysis Department, Mr. Try Ritthear, Deputy
Director, Economic Statistics Department, Mr. Hisatsugu Furukawa, Chief Consultant, Mr. Koh
Sakano, Senior Consultant of Japan Economic Research Institute Inc. and other NIS staff.
This report on the organization and administration on the 2011 Economic Census keeps a
comprehensive set of records and documents compiled for various procedures, and lessons learned,
from the planning stage to the data processing stage of EC2011.
It is hoped that this report will be utilized as a useful reference document when understanding
the results of the 2011 Economic Census and undertaking future economic censuses and surveys.
Ministry of Planning
Phnom Penh
February 2013
CHHAY THAN
Senior Minister
Minister of Planning

iii
Composition of the National Census Committee
for the 2011 Economic Census of Cambodia (NCC)
1. Minister of Planning Chairman
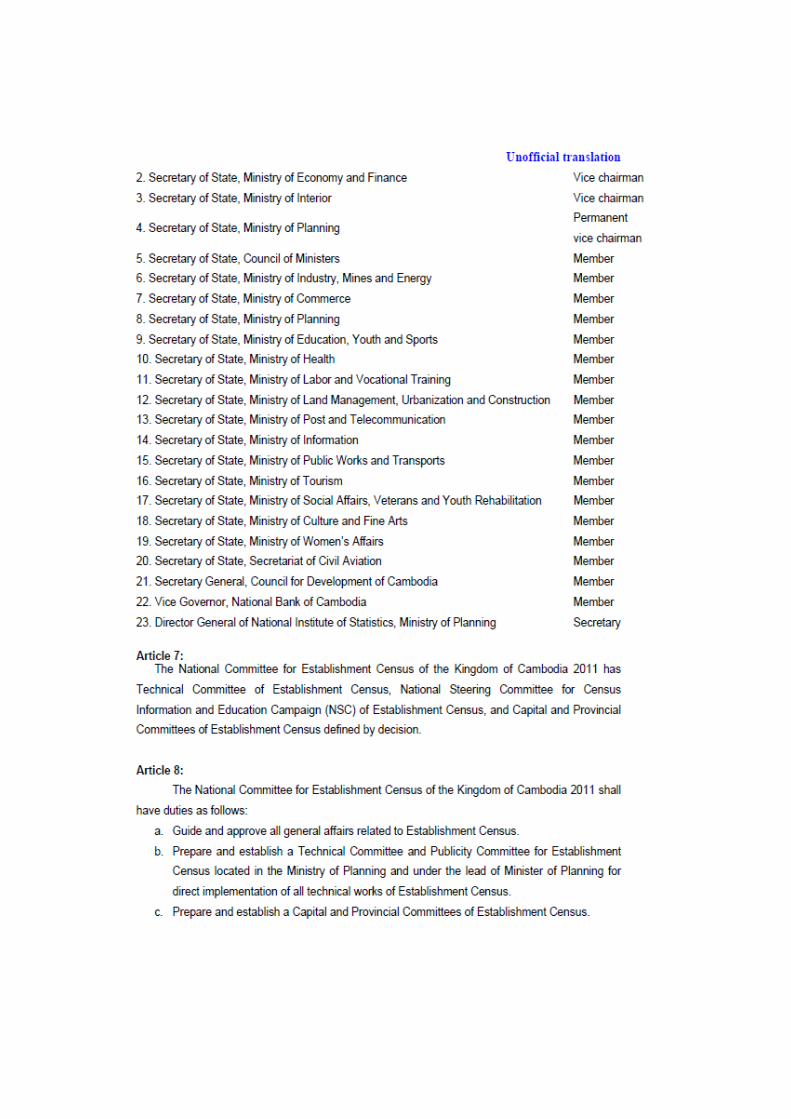
2.Secretary of State, Ministry of Economy and Finance Vice chairman
3. Secretary of State, Ministry of Interior Vice chairman
4. Secretary of State, Ministry of Planning Permanent
vice chairman
5. Secretary of State, Council of Ministers Member
6. Secretary of State, Ministry of Industry, Mines and Energy Member
7. Secretary of State, Ministry of Commerce Member
8. Secretary of State, Ministry of Education, Youth and Sports Member
9. Secretary of State, Ministry of Health Member
10. Secretary of State, Ministry of Labor and Vocational Training Member
11. Secretary of State, Ministry of Land Management, Urbanization Member
and Construction
12. Secretary of State, Ministry of Post and Telecommunication Member
13. Secretary of State, Ministry of Information Member
14. Secretary of State, Ministry of Public Works and Transports Member
15. Secretary of State, Ministry of Tourism Member
16. Secretary of State, Ministry of Social Affairs, Veterans Member
and Youth Rehabilitation
17. Secretary of State, Ministry of Culture and Fine Arts Member
18. Secretary of State, Ministry of Women’s Affairs Member
19. Secretary of State, Secretariat of Civil Aviation Member
20. Secretary General, Council for Development of Cambodia Member
21. Vice Governor, National Bank of Cambodia Member
22. Director General, National Institute of Statistics, Secretary
Ministry of Planning

iv
Composition of the Census Technical Committee
for the 2011 Economic Census of Cambodia (CTC)
1. Secretary of State, Ministry of Planning Chairman
2. Under Secretary of State, Ministry of Planning Vice chairman
3. Director General, NIS, Ministry of Planning Permanent Member
4. Chief of Cabinet, Ministry of Planning Member
5. Deputy Director General, Taxation Department, Member
Ministry of Economy and Finance
6. Director of Department, Ministry of Industry, Mines and Energy Member
7. Director of Department, Ministry of Commerce Member
8. Deputy Director General, Ministry of Tourism Member
9. Director of Department, Cambodia Development Council Member
10. Deputy Director General, NIS, Ministry of Planning Member
11. Director, Economic Statistics Department, NIS Secretary
Composition of the Provincial Census Committee
for the 2011 Economic Census of Cambodia (PCC)
1. Governor of Capital/Province Chairman
2. Deputy Governor of Capital/Province Vice-Chairman
3. Director of Planning Office of Capital/Province Permanent Member
4. Director of Economy and Finance Office of Capital/Province Member
5. Police Commissioner of Capital/Province Member
6. Director of Industry, Mines and Energy Office of Capital/Province Member
7. Director of Tourism Office of Capital/Province Member
8. Director of Commerce Office of Capital/Province Member
9. Director of Tax Office of Province Member
10. Chief Cabinet of Capital/Provincial Hall Member
11. One Representative from NIS Member
12. Deputy Director of Capital/Provincial Planning Office, Secretary
responsible for Statistics or Bureau Chief of Statistics
v
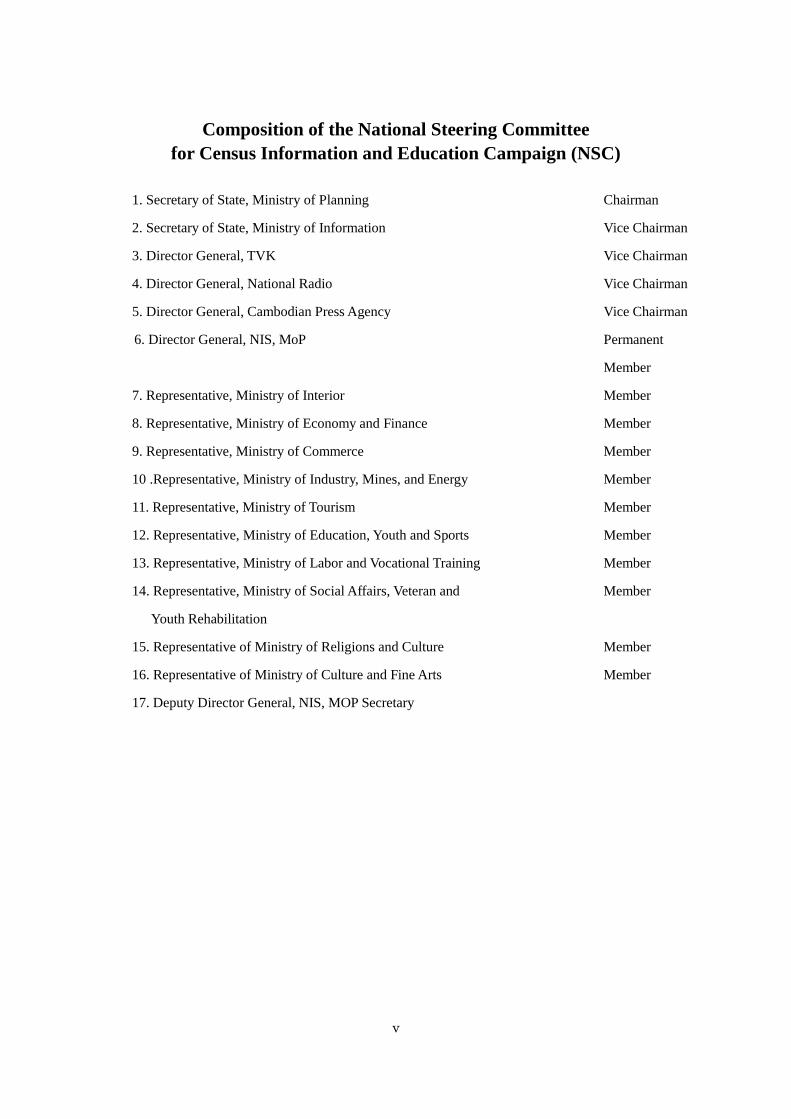
Composition of the National Steering Committee
for Census Information and Education Campaign (NSC)
1. Secretary of State, Ministry of Planning Chairman
2. Secretary of State, Ministry of Information Vice Chairman
3. Director General, TVK Vice Chairman
4. Director General, National Radio Vice Chairman
5. Director General, Cambodian Press Agency Vice Chairman
6. Director General, NIS, MoP Permanent
Member
7. Representative, Ministry of Interior Member
8. Representative, Ministry of Economy and Finance Member
9. Representative, Ministry of Commerce Member
10 .Representative, Ministry of Industry, Mines, and Energy Member
11. Representative, Ministry of Tourism Member
12. Representative, Ministry of Education, Youth and Sports Member
13. Representative, Ministry of Labor and Vocational Training Member
14. Representative, Ministry of Social Affairs, Veteran and Member
Youth Rehabilitation
15. Representative of Ministry of Religions and Culture Member
16. Representative of Ministry of Culture and Fine Arts Member
17. Deputy Director General, NIS, MOP Secretary


vii


ix
Figures at a Glance for Cambodia
Number of Provinces 1)
including 1 Municipality
24
Number of Districts 1)
including 9 Khans and 26 Cities
194
Number of Communes 1)
including 204 Sangkats
1,621
Number of Villages 1), 2) 14,041
Number of Establishments
5 persons engaged and over
10 persons engaged and over
100 persons engaged and over
1,000 persons engaged and over
505,134
39,496
13,135
786
119
One person engaged (%)
Two persons engaged
44.0
34.9
Female Representative (%) 65.1
Cambodian Owner (%) 98.9
Tenure of Business Place (%)
Owned
Rented
68.7
24.1
Kind of Business Place (%)
Home Business
Street Business
64.7
8.3
Area of Business Place (%)
Less than 10m2
100m2 and over
52.5
7.2
Number of Persons Engaged
Male
Female
1,673,390
649,358
1,024,032
Number of Persons Engaged per Establishment
3.3

x
Number of Establishments per km2 2.8
Area in 2010 (km2) 3)
181,035
Number of Establishments per 1,000 Persons 34.8
Projected Population in 2011 4)
14,521,275
Population per Establishment 28.7
Number of Establishments per 1,000 Households 163.2
Estimated Number of Households in 2011 4)
3,095,242
Number of Households per Establishment
6.1
Number of New Establishments 5)
182,439
Number of Entities
496,355
Number of Enterprises
1,008
Annual Sales (million USD)
12,678
Annual Sales per Entity (USD) 6)
25,548
Annual Expenses (million USD)
10,979
Annual Expenses per Entity (USD) 7)
22,125
Annual Profit and Loss (million USD)
1,699
Annual Profit and Loss per Entity (USD) 8)
3,440
1) The final results herein are based on the new administrative areas promulgated on 5
November 2010. In addition, a change on 18 May 2011 in Phnom Penh also is reflected:
Dangkao District (05) was divided into Dangkao District (05) and Pou Senchey District
(09).
2) The number of villages is based on the 2011 Economic Census enumeration. Villages
where have at least one establishment are counted, that is, if there is no establishment
in a village, the village is not counted.
3) Area includes area of Tonle Sap Lake (3,000km2).
4) Population and the number of households in March 2011 are estimated from the final
results of General Population Census of Cambodia 2008.
5) "New Establishments" means establishments which started business between 1
January 2009 and 1 March 2011.

xi
6) Excludes entities whose amount of sales is zero or “Not reported”.
7) Excludes entities whose amount of expenses is zero or “Not reported”.
8) Excludes entities whose amount of sales or expenses is zero or “Not reported”.


xiii
Outline of the 2011 Economic Census of Cambodia
1. Purpose of the Census
The Census aimed:
a) to provide the fundamental statistics on the current status of the business activities of the
establishments and enterprises including the financial aspects, which central and local
governments require for profiling the nation, policy-making, calculating national accounts
etc., and which academic researchers and other users need for their own study,
b) to provide the directories of establishments and enterprises as the master sampling frame
of various sample surveys on businesses.
2. Reference date of the Census
The Census was taken as of 1st March 2011.
3. Period of the Census enumeration
The census enumeration was conducted within one month period from 1st March to 31
March 2011.
4. Legal basis of the Census
The Census was taken on the basis of the following legislation:
a) Statistics Law, Article 6 and 7
b) Sub-Decree on 2011 Establishment Census of the Kingdom of Cambodia
5. Coverage of the Census
The Census covered all establishments which existed at the reference date in the territory of
the Kingdom of Cambodia.
The following establishments, however, were excluded:
a) Establishments classified into “Section A, Agriculture, forestry and fishing” specified in
the United Nations International Standard Industrial Classification of Economic Activities,
Revision 4 (hereinafter, quoted as the ISIC);
b) Establishments classified into “Section O, Public administration and defense;
compulsory social security” specified in the ISIC;
c) Establishments classified into “Section T, Activities of households as employers;
undifferentiated goods-and services-producing activities of households for own use”
specified in the ISIC;
d) Establishments classified into “Section U, Activities of extraterritorial organizations and
bodies” specified in the ISIC.

xiv
6. Enumeration unit
The establishment as an enumeration unit for the Census is defined as follows, according to
UN definition:
The establishment can be defined as an economic unit that engages, under a single
ownership or control - that is, under a single legal entity - in one, or predominantly one,
kind of economic activity at a single physical location – for example, a mine, factory or
workshop.
7. Organization
1) Chain of Command
[Administrative line]
Director General of the National Institute of Statistics, the Ministry of Planning(Director
General of GECC)Senior Census Officer Provincial Director(Provincial Census
Officer) District Chief(District Census Officer) Commune Chief(Commune Census
Officer)
[Census Line]
Director General of the National Institute of Statistics, the Ministry of Planning(Director
General of GECC)Senior Census Officers (6 persons) Regional Officers (24 persons)
Assistant Regional Officers (84 persons) Supervisors (484 persons) Enumerators
(4,030 persons)
2) ROs and AROs
RO (Regional Officer) and ARO (Assistant Regional Officer), which were appointed
from among the staff of the NIS, were allocated to each province.
3) Main Duties of ROs and AROs
a) coordinating Census work with NIS and Provincial government;
b) ensuring exact implementation of training sessions held in every stage;
c) guiding or assisting Provincial Directors, District and Commune Census Officers
regarding implementation of the Census.
8. Method of the Census enumeration
1) The Census enumeration was carried out through a method in which an enumerator
visited each establishment within a certain enumeration area, interviewed the owner or
manager of the establishment or his/her substitute who was entitled to represent the
establishment, and filled in the Census Form.
2) In addition to this, a self-enumeration method was applied to the establishment, which
requested to fill in the form by themselves.
3) In case that the enumeration did not finish due to reasons of establishments until 20th
March 2011, “Special Survey Team” carried out the enumeration.

xv
9. Enumerator
4,030 enumerators were employed temporarily for the Census. Each enumerator was
assigned to one or two more villages, or one enumeration area which had been demarcated
to accomplish their duties which were described in Enumerator’s Manual.
10. Supervisor
484 supervisors were employed temporarily for the Census. Each supervisor was assigned
several enumerators to accomplish their duties which were described in Supervisor’s
Manual.
11. Training of local staff, supervisors and enumerators
1) The training of provincial staff was done twice in the NIS: the first one was for two days
on 14 and 15 December 2010; the second one was for five days from 17 to 21 January
2011.
2) The training of district and commune chiefs was done for a half day on 18 or 25 February
2011 in each province.
3) The training of supervisors and enumerators was done for five days between 14 and 25
February 2011 in each province.
4) Core Staff of NIS and the trainers of trainees (hereinafter, it refer to as TOT), which were
assigned from among the staff of NIS were charged with the training of the
above-mentioned seminars.
5) TOTs carried out the duties as ROs and AROs at the stage of the Census-conducting.
12. Submission of documents to the superior organizations
1) The enumerators submitted the documents including the Census Forms which were
scrutinized completely to their supervisors by 1st April 2011.
2) Finally, the Provincial Census Officers submitted the documents to NIS Census officer
by the prescribed date of April 2011 after checking them.
13. Topics Studied
1) Name of establishment, Address of establishment and Telephone number of
establishment, Contact person
2) Sex of representative of establishment and Nationality of owner of establishment
3) Registration at Ministry of Commerce or Provincial Department of Commerce
4) Names of ministries or agencies which have issued a license or an approval for operating
the businesses
5) Ownership of establishment (Legal status)
6) Single unit, head or branch office
xvi
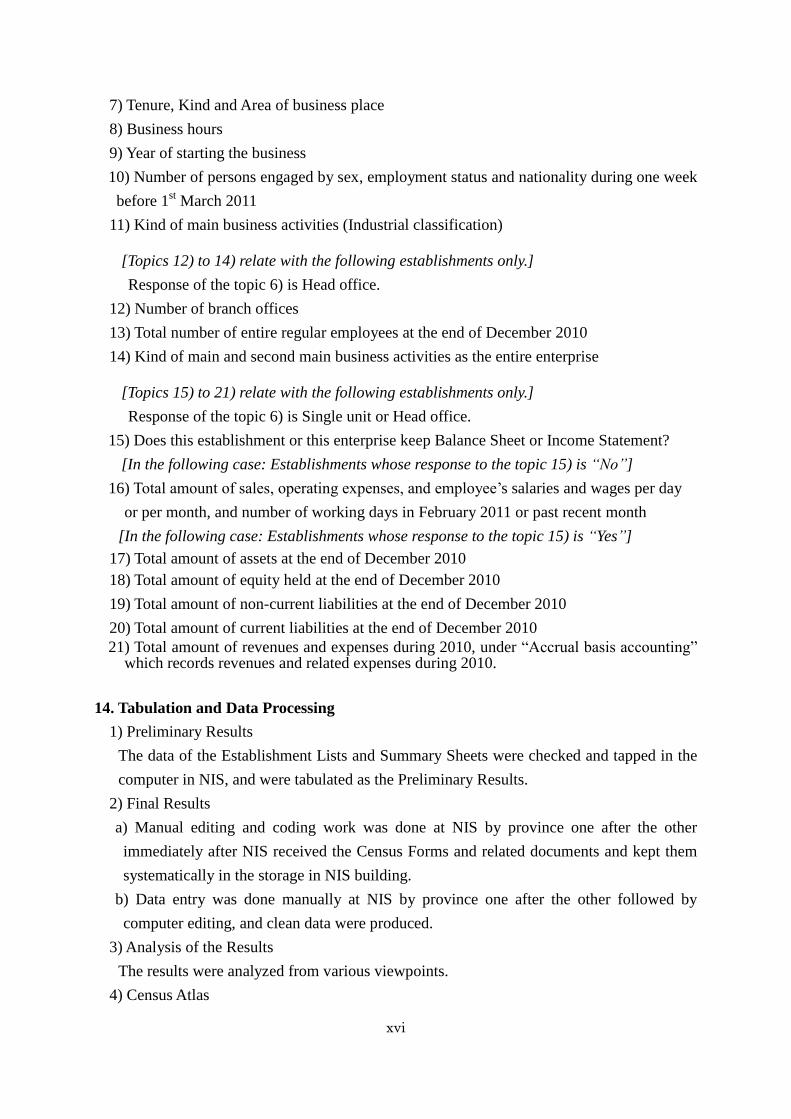
7) Tenure, Kind and Area of business place
8) Business hours
9) Year of starting the business
10) Number of persons engaged by sex, employment status and nationality during one week
before 1st March 2011
11) Kind of main business activities (Industrial classification)
[Topics 12) to 14) relate with the following establishments only.]
Response of the topic 6) is Head office.
12) Number of branch offices
13) Total number of entire regular employees at the end of December 2010
14) Kind of main and second main business activities as the entire enterprise
[Topics 15) to 21) relate with the following establishments only.]
Response of the topic 6) is Single unit or Head office.
15) Does this establishment or this enterprise keep Balance Sheet or Income Statement?
[In the following case: Establishments whose response to the topic 15) is “No”]
16) Total amount of sales, operating expenses, and employee’s salaries and wages per day
or per month, and number of working days in February 2011 or past recent month
[In the following case: Establishments whose response to the topic 15) is “Yes”]
17) Total amount of assets at the end of December 2010
18) Total amount of equity held at the end of December 2010
19) Total amount of non-current liabilities at the end of December 2010
20) Total amount of current liabilities at the end of December 2010
21) Total amount of revenues and expenses during 2010, under “Accrual basis accounting” which records revenues and related expenses during 2010.
14. Tabulation and Data Processing
1) Preliminary Results
The data of the Establishment Lists and Summary Sheets were checked and tapped in the
computer in NIS, and were tabulated as the Preliminary Results.
2) Final Results
a) Manual editing and coding work was done at NIS by province one after the other
immediately after NIS received the Census Forms and related documents and kept them
systematically in the storage in NIS building.
b) Data entry was done manually at NIS by province one after the other followed by
computer editing, and clean data were produced.
3) Analysis of the Results
The results were analyzed from various viewpoints.
4) Census Atlas

xvii
Statistical maps for the whole country and for each province were drawn.
5) Directory of Establishments
An ACCESS database containing establishments, entities, administrative area codes, etc.
was constructed as the sampling frame for various economic sample surveys, and for other
various uses.
15. Dissemination
The results of the Census were released through various media such as publications, CD,
Internet on the following schedule.
1) Preliminary results were released on 8 August 2011
2) Final Results were released in March 2012
3) National and Provincial Profiles will be released in March 2013
4) Results of analysis will be released in March 2013
5) Census Atlas was published in November 2012
6) Use of Directory of Establishments will be released in March 2013.
16. Statistical Tables Produced
The following statistics were produced by national, province, district, commune and
village:
1) Distributional statistics cross-tabulated for various topics
2) Average number of persons engaged per establishment, average amount of sales,
expenses etc. per entity or enterprise classified for selected topics.
17. Safekeeping of the Census Forms and Other Related Documents
The Census Forms and other related documents were kept in an appropriate way at every
stage of enumerators, supervisors, local government offices and NIS so that the Statistics
Law, Article 22 may not be violated.
18. Mapping
Village Boundary Maps were drawn on the basis of Village Maps of 2008 Population
Census in order to instruct enumeration areas to enumerators. Villages with a large number
of establishments were divided into Enumeration Areas. The Enumeration Area Maps were
drawn in order to instruct enumeration area to enumerators.
19. Pretest and Pilot Surveys
1) Pretest
a) A pretest was carried out in around 15 Villages in Phnom Penh City as of 15 December
xviii
2009 for two weeks.
b) The pretest aimed to test form-designing, enumeration methods, instructions to be
included in the enumerators’ manual and so on, and the results were utilized for making
appropriate plans for the 2011 Economic Census.
2) Pilot Survey
a) A survey was carried out as of 1st March 2010 (one year before the Census date) during
one month of March 2010 in around 200 Villages/Enumeration Areas selected based on
sampling theory from among all provinces.
b) In addition to this, all large-scaled establishments with 100 persons engaged and more
were enumerated.
c) The Pilot Survey aimed:
(a) to test the final draft of the Census Form and other documents;
(b) to test work procedures of every stage of enumerators, supervisors, local government
offices and NIS;
(c) to test tabulation methods to be adopted, and
(d) to gain statistical data on large-scaled enterprises and others.
d) The results were released in October 2010.
20. Post-census stage Work
1) A Post Enumeration Survey was carried out in July 2011 in 60 Villages/Enumeration
Areas based on sampling theory in order to analyze coverage errors and content errors of
the Census.
2) The Cambodia Inter-censal Economic Survey (CIES) is planned to be carried out in
March 2014 on the basis of the Directory of Establishments constructed from the Census
data in order to provide updated statistics on economic activities of establishments and
enterprises of the country, and to maintain capability of conducting economic censuses and
surveys.

xix
Explanation of Terms
Numbers in parentheses are those of related questions in the Census Form.
Establishment
An establishment refers to a unit of the place where economic activities are performed and
fulfill the following conditions in principle:
(1) An establishment is a unit of place which occupies a certain space (1 plot) and in which
economic activities are performed under a single management.
(2) An establishment has (a) person(s) engaged and equipment, and produces and/or sells
goods, or provides services on a continuous basis.
Entity
An entity is a generic name to express a single unit establishment (Single unit Entity) or a
group of establishments which consists of a head office in Cambodia and its branch offices
within or outside Cambodia (Multi-unit Entity).
Enterprise
An enterprise is a single unit establishment or a group of establishments whose Ownership of
Establishment (Legal Status; Q5) is one of the following categories:
3. General Partnership, 4. Limited Partnership, 5. Private Limited Company, 6. Public Limited
Company or 7.Subsidiary of a Foreign Company.
Single unit Enterprise and Multi-unit Enterprise are defined in a similar way as for the entity.
Sex of Representative of Establishment (Q3-1)
A person who actually manages its activities; not always its owner.
Nationality of Owner of Establishment (Q3-2)
The owner of an establishment is a person who owns it.
In case of joint ownership, the nationality of the largest shareholder prevails; in case of equal
shares between a Cambodian and a foreigner, the nationality is set to be Cambodian.
Whether Registered or not at Ministry of Commerce or Provincial Department of Commerce
(Q4-1): Self-explanatory; based on the Law on Commercial Rules and Register.
Ministries or Agencies regarding Official License or Approval for the Business Operation of
this Establishment (Q4-2): Self-explanatory
Ownership of Establishment (Legal Status; Q5)
1. Individual proprietor (with no registration)
This refers to individual proprietors other than “Sole proprietor” shown below.
2. Sole Proprietor (with registration)
This refers to an individual proprietor who has been registered at the Ministry of Commerce or
Provincial Departments of Commerce in accordance with the Law on Taxation (or the Law on
Commercial Rules and Register).

xx
3. General Partnership
This refers to an economic organization which is operated under a contract between two or
more persons to combine their property, knowledge or activities in common to carry on
business with a view to pursue profits as prescribed in Article 8 of the Law on Commercial
Enterprise.
4. Limited Partnership
This refers to an economic organization which is operated under a contract between one or
more general partners who are authorized to administer and bind the partnership, as well as one
or more limited partners who are bound to contribute capital to the partnership as prescribed in
Article 64 of the Law on Commercial Enterprise.
5. Private Limited Company
This is a form of a limited company that meets basically the following requirements as
prescribed in Article 85 of the Law on Commercial Enterprise:
a. The company has 2 to 30 shareholders. However, one person may form a company called a
single member private limited company.
b. The company may not offer its shares or other securities to the public generally, but may
offer them to shareholders, family members and managers.
6. Public Limited Company
This is a form of a limited company that is authorized to issue securities to the public by the
Law on Commercial Enterprise as prescribed in Article 87.
7. Subsidiary of a Foreign Company
a. This is a company that is incorporated by a foreign company in the Kingdom of Cambodia
with at least fifty-one (51) percent of its capital held by the foreign company.
b. In addition, a subsidiary of a foreign company may be incorporated in the form of
partnership or limited company.
c. A subsidiary has a legal personality separate from its principal from the date of registration
pursuant to the law on Commercial rules and Register.
d. A subsidiary may regularly carry on business in the same way as local companies except for
any acts that are prohibited for natural or legal foreign persons.
e. These are prescribed in Articles 283 and 286 of the Law on Commercial Enterprise.
8. Branch of a Foreign Company
a. This is a branch office of a foreign company. The name should consist of the name of the
company and "Branch".
b. The branch may perform not only the following activities but also regularly buy, sell or
provide goods and services and engage in manufacturing, processing and construction in the
same way as local companies except for those prohibited for natural or legal foreign persons as
prescribed in Articles 278 and 282 of the Law on Commercial Enterprise.
a) Contact customers for the purpose of introducing customers to its principals; b) Research

xxi
commercial information and provide the information to its principal office; c) Conduct market
research; d) Market goods at trade fairs, and exhibit samples and goods in its office or at trade
fairs, etc.; e) Purchase and keep a quantity of goods for the purpose of trade fairs; f) Rent an
office and employ local staff; g) Enter into contracts with local customers on behalf of its
principal.
9. Commercial Representative Office of a Foreign Company
a. This category includes “Commercial relations offices” of foreign companies.
b. The name should consist of the name of the foreign company and such a term as
"Commercial Representative Office” or “Commercial Relations Office".
c. This office performs the following activities in the Kingdom of Cambodia, but may not
regularly buy. sell or provide goods or services, or engage in manufacturing, processing or
construction as prescribed Articles 274 and 277 of the Law on Commercial Enterprise:
a) Contact customers for the purpose of introducing customers to its principal; b) Research
commercial information and provide the information to its principal office; c) Conduct market
research; d) Market goods at trade fairs, and exhibit samples and goods in its office or at trade
fairs, etc.; e) Purchase and keep a quantity of goods for the purpose of trade fairs; f) Rent an
office and employ local staff; g) Enter into contracts with local customers on behalf of its
principal.
10. Cooperative
This is a non-profit making business organization owned and operated by a group of
individuals for their mutual benefit. It may also be defined as a business owned and controlled
equally by the people who use its services or who work for it.
11. State-owned Organization
(1) Public corporation owned and operated by the central government including
financial institutions like the National Bank of Cambodia and all other State-controlled
institutions such as CAMINTEL, Cambodian Pharmaceutical Company, Electricite du
Cambodge, State rubber plantations, State construction enterprises, State fishery enterprises,
State printing house, State utilities, State courier and mail enterprises, national hospitals,
national schools, etc.
(2) Such organizations as autonomy-owned organizations or local government-owned
organizations whose fund is shared by the state are included in this category.
(3)Public corporations such as provincial hospitals, district schools and so on which are owned
and operated by local governments.
12. NGO (Non-governmental Organization)
This is a non-profit making business organization other than “10. Cooperative”, “11.
State-owned organizations”.
This category includes all Cambodian and foreign NGOs providing goods and services free or
at a nominal fee that are not controlled and financed by the government. Also included are

xxii
trade unions, professional associations, political parties, charities, pagodas and other religious
institutions, and aid organizations financed by voluntary transfer.
13. Others
Whether Single unit, Head or Branch office (Q6)
1. Single unit
This refers to a single establishment which has no head office or branch office under the same
management in different places.
2. Head office
This refers to an establishment which controls all branch offices under the same management in
other places.
3. Branch office
This refers to an establishment under supervision of the head office located in a different place.
Tenure of Business Place (Q7-1)
In accordance with the situation in which the establishment owns, rents or uses the business
place with approval from an authority or another organization etc.
Kind of Business Place (Q7-2)
1.Street business
An establishment such as a stall, a booth etc. that runs at a fixed location on the sidewalk or the
roadside, or around but outside a market.
2.Home business
An establishment that runs in a part of the residence where the owner resides actually.
3. Business in apartment building
An establishment that runs in a part of an apartment building, but the business place and the
owner’s residence are separate.
4. Business in traditional market
An establishment that runs in a corner or a block inside a so-called market, regardless of having
an approval or a license from the superintendent of the market.
5. Business in modern shopping mall
A business that runs in a shopping mall of high-rise building where a number of establishments
are operating
6. Business that is occupying exclusively one block or one building
A factory, a bank, a hospital, a school, a pagoda etc. occupying a block or a building.
7. Others
Shops, restaurants, massage rooms etc. under separate management in a premise or building of
a hotel, factory or university etc.
Area of Business Place (Q7-3): Self-explanatory
Business Hours (Q8-1, 2)
xxiii
This refers to the time when the business is opened and closed daily.
Type of Business Hours
1. Morning operation from 0am to 12am:
Is opened and closed between 0am to 12am; no matter how short the duration is
2. Afternoon operation from 0pm to 6pm:
Is opened and closed between 0pm to 6pm; no matter how short the duration is
3. Full day operation from 2am to 12pm: Is opened between 2am and noon, and closed between
noon and 12pm; should be 8 hours or longer
4. Evening operation from 2pm to 12pm: Is opened between 2pm and 12pm, and closed
between 6pm and 12pm; no matter how short the duration is
5. Night operation from 3pm to 3am: Is opened between 3pm and 12pm and closed between
0am and 3am; no matter how short the duration is
6. 24-hour operation: Is open 24 hours; never closed
7. Others
Year of Starting the Business (Q-9): Self-explanatory
Number of Persons Engaged (Q10)
Number of persons engaged in the establishment during one week before 1st March 2012. If the
number changes daily, the average was taken.
Included are all the persons who are hired by this establishment and earn salaries or wages even if
dispatched to other establishments.
Excluded are those persons who are dispatched from other establishments to work in this
establishment. In case of a head office, persons engaged in branch offices are excluded.
Individual proprietors or sole proprietors themselves are counted as persons engaged, but
chairmen or executives who are in a position of employing the workers are excluded.
(1) Self-employed Proprietors (Individual Proprietors) or Sole Proprietors (Q10-A1)
The individual proprietor or sole proprietor, and the chief or director etc. who actually manages
and owns the establishment concerned.
(2) Unpaid Family Workers (Q10-A2)
This refers to a person who is a family member of the owner and helps the business of the
establishment under no payment contract.
(3) Regular Employees (Q10-A3)
This refers to those who are employed on a continuous basis with more than one month period.
(4) Other Employees than Regular Employees (Q10-A4) : Self-explanatory
(5) Voluntarily-engaged Persons (Q10-B)
This refers to persons engaged voluntarily in the establishment without any employment contract,
and without any reward for work such as wage or salary. They include monks, clergymen, nuns,
sisters and so on. They may receive a reward or a gratuity.

xxiv
Number of Entire Persons Engaged: (Q10-A1+Q10-A2+Q10-A4) in the head office plus Q13
which is the number of the entire regular employees.
Number of Entire Employees: Q10-A4 in the head office plus Q13 which is the number of the
entire regular employees.
Kind of Main Business Activities (Q11)
In case of plural activities, it is the main activity in terms of value added or manpower inputted.
In case of Head office, activities of its branch offices are not taken into account.
Number of Branch Offices (Q12)
Total number of branch offices that the head office supervises.
Warehouses or dormitories where the employees of the entity are stationed are included.
Number of Entire Regular Employees (Q13)
Total number of regular employees who are engaged both in the head office and in the branch
office(s) at the end of December of 2010.
Kind of Main Business Activities of the Entire Entity (Q14-1)
In case of plural activities, it is the main activity in terms of value added or manpower inputted.
Kind of Second Main Business Activities of the Entire Entity (Q14-2)
The second main activity is determined in terms of the second largest value added or the second
largest manpower inputted.
Whether or not Keeping Balance Sheet or Income Statement (Q15): Self-Explanatory
The information is obtained from single unit establishments (single unit entities) and head offices
of multi-unit entities.
Number of Working Days in February 2011 (Q16-3)
Number of days the establishment opens for its business in February 2011.
The information is obtained from entities not having Balance Sheet or Income Statement.
Annual Sales, Expenses, and Profit and Loss (Q16 and 21)
The information is obtained from single unit establishments (single unit entities) and head offices
of multi-unit entities.
Annual Sales (Q16 and 21)
(1) For entities having Balance Sheet or Income Statement:
The amount is for 2010, and is the sum of operating revenues (Q21-1) and other revenues
(Q21-3) in the Census Form.
(2) For entities not having Balance Sheet or Income Statement:
The amount is estimated from a daily or monthly figure in February 2011, that is, the month
preceding the Census month immediately, or the most recent month. The estimation method is
multiplying the daily figure by 365 days or the monthly figure by 12 months, depending on the

xxv
response to the Census Form. The daily figure is the response answered as “per day” in Q16-1
(sales), while the monthly figure is the one answered as “per month”.
Annual Expenses (Q16 and 21)
(1) For entities having Balance Sheet or Income Statement:
The amount is for 2010, and is the sum of operating costs (Q21-2), operating expenses (Q21-4),
interest expenses paid to residents (Q21-5), interest expenses paid to non-residents (Q21-6), and
profit tax (Q21-7) in the Census Form.
(2) For entities not having Balance Sheet or Income Statement:
The amount is estimated from a daily or monthly figure in February 2011, that is, the month
preceding the Census month immediately, or the most recent month. The estimation method is
multiplying the daily figure by 365 days or the monthly figure by 12 months depending on the
response to the Census Form. The daily figure is the response answered as “per day” in Q16-2
(expenses), while the monthly figure is the one answered as “per month”.
Annual Employee’s Salaries and Wages (Q16 and 21)
(1) For entities having Balance Sheet or Income Statement:
The amount is for 2010, and is the response to Q21-4-1(employee’s salaries and wages) in the
Census Form.
However, Q21-4-1 excludes salaries and wages for managers and workers in the production
section. Those salaries and wages are included in Q21-2-1.
(2) For entities not having Balance Sheet or Income Statement: The above description for
“Annual Expenses” applies with Q16-2 (expenses) being replaced with Q16-2-1(employee’s
salaries and wages).
Annual Profit and Loss
Annual Profit and Loss = Annual Sales - Annual Expenses
Ratio of Labor Costs to Sales
Ratio of Labor Cost = Annual Salaries and Wages / Annual Sales × 100;
Gross Margin
The gross margin is the difference between operating revenue (Q21-1) and operating costs
(Q21-2).
Non-current Assets (Fixed Assets; Q17-1)
Total amount of the following items at the end of December 2010:
1) Freehold land, 2) Improvement and preparation of land, 3) Freehold building, 4) Freehold
building on leasehold land, 5) Non-current assets in progress, 6) Plants and equipment, 7)
Goodwill, 8) Preliminary formation expenses, 9) Leasehold assets and lease premiums, 10)
Investment in other enterprises, 11) Other fixed assets.
Current Assets (Q17-2)
Sum of sock of raw materials and supplies, goods in storage for sale, stock of finished goods, and
products in progress, plus the following items at the end of December 2010:

xxvi
1) Trade debtors accounts receivable, 2) Other accounts receivable, 3) Prepaid expenses, 4) Cash
on hand and at bank, 5) Prepayment of profit tax credit,6) Value added tax credit, 7) Other taxes
credit, 8) Other current assets, 9) Differences arising from exchanging currency
Equity (Q18)
Total amount of the following items held at the end of December 2010:
1) Capital/share capital, 2) Share premium, 3)Legal capital reserved, 4)Reserves revaluation
surplus of assets, 5) Other reserved capital, 6) Profit and loss brought forward, and 7) that for
the period
Non-current Liabilities (Q19)
Total amount of the following items at the end of December 2010:
1) Loan from related parties, 2) Loan from banks and other external parties, 3) Provision for
charges and contingencies, 4) Other long-term liabilities.
Current Liabilities (Q20)
Total amount of the following items at the end of December 2010:
1) Bank overdraft, 2) Short-term borrowing-current portion of interest bearing borrowing, 3)
Account payable to related parties, 4) Other accounts payable, 5) Unearned revenue, accrual and
other current liabilities, 6) Provision for charges and contingencies, 7) Profit tax payable, 8) Other
taxes payable, 9) Differences arising from currency exchange in liabilities.
Revenues and Expenses in a year 2010 under “Accrual basis accounting” (Q21)
Operating Revenues (Q21-1):
1) Sales of manufactured products, 2) Sales of goods, 3) Sales/provision of services.
Operating Costs (Q21-2): 1) Costs of products sold of production enterprises, 2) Costs of goods
sold of non-production enterprises, 3) Costs of services provided.
Other Revenues (Q21-3): 1) Subsidy/grant, 2) Dividend received or receivable, 3) Interest
received or receivable, 4) Royalty received or receivable, 5) Rental received or receivable, 6) Gain
from disposal of fixed assets (capital gained), 7) Gain from disposal of securities, 8) Share of profit
from joint venture, 9) Realized exchange gain, 10) Unrealized exchange gain, 11) Other revenues.
Operating Expenses (Q21-4): 1) Salaries and wages, 2) Fuel, gas, electricity and water expenses,
3) Travelling and accommodation expenses, 4) Transportation expenses, 5) Rents, 6) Repair and
maintenance expenses, 7) Entertainment expenses, 8) Commission, advertising, and selling
expenses, 9) Other tax expenses, 10) Donation expenses, 11) Management, consultant, other
technical, and other similar services expenses, 12) Royalty expenses, 13) Bad debts written off
expenses, 14) Amortization/depletion and depreciation expenses, 15) Increase/decrease in
provisions, 16) Loss on disposal of fixed assets, 17) Realized exchange loss, 18) Unrealized
exchange loss, 19) Other expenses.
Expenses incurred in the production section are not included in the above listed items if any, but
included in Q21-2-1.
Interest Expenses paid to residents (Q21-5) : Self-Explanatory

xxvii
Interest Expenses paid to non-residents (Q21-6) : Self-Explanatory
Profit Tax (Q21-7) : Self-Explanatory
Industrial classification of establishments/entities (Q11/ Q14)
The main industry of an establishment is determined based on the kind of its main business
activities. Basically, the industrial classification is based on United Nations ISIC Rev.4
(International Standard Industrial Classification, Revision 4).
The main industry of an entity is determined based on the kind of its main economic activities
basically according to ISIC Rev.4.
The second main industry of an entity is determined based on the kind of its second main
economic activities basically according to ISIC Rev.4.


xxix
Abbreviations:
ADB Asian Development Bank
B/S Balance sheet
CDC Council for Development of Cambodia
Dept. Department
DOC Department of Commerce
ECS-2011 Economic Census Survey 2011
FDI Foreign direct investment
GDP Gross Domestic Products
I/S Income statement
ISIC International Standard for Industrial Classification
M & S Medium and Small
MOC Ministry of Commerce
MOI Ministry of Investment
NGO Non Government Organization
Rev. 4 Revised version 4
RGC Royal Government Council
ROA Return on assets
ROE Return on equity
SME small and medium enterprises
SOO State-owned organization
US United States (of America)
USD united states dollar; $


1
Chapter 1 Establishments
1-1 Number of establishments in textile industry
The number of establishments in Textile Industry1 is 8,919 and it accounts
for 1.8% of the whole 505,134 establishments in Cambodia. It also covers 12.5% of
establishments in the manufacturing industry in Cambodia.
(See Figure 1-1-1 and Table1-1-1)
Among class of ISIC in textile industry, the number of establishments in
“weaving of textile” is 8,504, and it accounts for 95.5% of the textile industry and
overwhelming majority. Although “manufacture of made-up textile articles, except
apparel” follows this, its number of establishments is 322 and it accounts for only
3.6% of total number of establishment in textiles industry.
(See Table1-1-2 and Figure 1-2)
Figure 1-1-1 Composition Ratio of Establishment in Manufacturing Industry by
Division of ISIC
1 In this report, classification of industry is based on ISIC (The International
Standard Industrial Classification of All Economic Activities) rev.4. Therefore,
Textile Industry is defined as Division “13 Manufacture of Textiles” in Section C,
“Manufacturing”, in ISIC rev.4.
In addition, ISIC rev.4 consists of classification structure with levels and is
subdivided in hierarchical. Division “13 Manufacture of Textiles” in ISIC rev.4
consists of Class which is numerically coded from 1311 to 1399. Thus, Textile
Industry has break- downs into 8 categories in this report. In principle, numerical
codes of divisions and classes are not indicated in each cases.
Food products
38.7%
Wearing apparel
22.3%
Textiles
12.5%
Fabricated metal
products, except
machinery and
equipment
6.6%
Beverages6.2%
Total of Rest of Others
13.6%

2
Table 1-1-1 Number of Establishments in Manufacturing Industry by Division of
ISIC
Number of
Establishments
Composition
Ratio of All
Industry (%)
Composition
Ratio of
Manufacturing
Industry (%)
All Industry 505,134 100.0 -
Manufacturing Industry 71,416 14.1 100.0
- Food products 27,639 5.5 38.7
- Beverages 4,436 0.9 6.2
- Tobacco products 33 0.0 0.0
- Textiles 8,919 1.8 12.5
- Wearing apparel 15,958 3.2 22.3
- Leather and related products 278 0.1 0.4
- Wood and of products of wood and
cork, except furniture; manufacture
of articles of straw and plaiting
materials
1,955 0.4 2.7
- Paper and paper products 35 0.0 0.0
- Printing and reproduction of
recorded media 284 0.1 0.4
- Coke and refined petroleum products 2 0.0 0.0
- Chemicals and chemical products 144 0.0 0.2
- Basic pharmaceutical products and
pharmaceutical preparations 10 0.0 0.0
- Rubber and plastics products 46 0.0 0.1
- Other non-metallic mineral products 2,826 0.6 4.0
- Basic metals 38 0.0 0.1
- Fabricated metal products, except
machinery and equipment 4,728 0.9 6.6
- Computer, electronic and optical
products 4 0.0 0.0
- Electrical equipment 8 0.0 0.0
- Machinery and equipment n.e.c. 20 0.0 0.0
- Motor vehicles, trailers and
semi-trailers 3 0.0 0.0
- Other transport equipment 81 0.0 0.1
- Furniture 1,196 0.2 1.7
- Other manufacturing 1,835 0.4 2.6
- Repair and installation of machinery
and equipment 938 0.2 1.3

3
Table1-1-2 Number of Establishments in Textile Industry by Class of ISIC
Number of
Establishments
Composition Ratio of
Textile Industry (%)
13-Manufacture of textiles 8,919 100.0
1311-Preparation and spinning of
textile fibers 26 0.3
1312-Weaving of textiles 8,504 95.3
1313-Finishing of textiles 14 0.2
1391-Manufacture of knitted and
crocheted fabrics 5 0.2
1392-Manufacture of made-up textile
articles, except apparel 322 3.6
1393-Manufacture of carpets and rugs 10 0.1
1394-Manufacture of cordage, rope,
twine and netting 25 0.3
1399-Manufacture of other textiles
n.e.c. 13 0.1
Figure 1-1-2 Composition Ratio of Establishment in Textile Industry by Class of
ISIC
Weaving of textiles
95.3%
Manufacture of made-up
textile articles, except apparel3.6%
Total of Rest
1.0%

4
1-2-Number of establishments by size of persons engaged
Approximately 97% of establishments in the textile industry are run by a
few persons. Nearly a half number of establishments in textile industry are run by
only 1 person and 35.5% of the establishments are run by 2 persons.
(See Figure1-2-1 and Table 1-2-1)
This is caused by the composition of overwhelming majority, “weaving of
textiles”. Although several establishments with 100 persons engaged or more are
standing, its share is very small.
(See Figure1-2-2 and Table 1-2-2)
Figure 1-2-1 Composition Ratio of Establishment by Size of Persons engaged and
by Class of ISIC
44.0%
33.4%
48.8%
34.9%
40.2%
35.5%
9.2%
12.0%
9.4%
4.1%
5.6%
2.9%
5.2%
6.0%
1.7%
2.6%
2.8%
1.7%
0% 20% 40% 60% 80% 100%
All Industry
Manufacturing
Industry
Textile Industry
1 person 2 persons 3 persons 4 persons 5-9 persons 10 persons or more

5
Table1-2-1 Number of Establishments in Textile Industry by Size of Persons
engaged
All Industry Manufacturing Industry Textile Industry
Number Composition
Ratio (%) Number
Composition
Ratio (%) Number
Composition
Ratio (%)
1 person 222,167 44.0 23,877 33.4 4,355 48.8
2 persons 176,214 34.9 28,709 40.2 3,167 35.5
3 persons 46,380 9.2 8,542 12.0 834 9.4
4 persons 20,877 4.1 3,988 5.6 258 2.9
5-9 persons 26,361 5.2 4,281 6.0 155 1.7
10-19
persons 8,055 1.6 1,002 1.4 52 0.6
20-49
persons 3,461 0.7 446 0.6 59 0.7
50-99
persons 833 0.2 159 0.2 18 0.2
100-499
persons 544 0.1 218 0.3 11 0.1
500-999
persons 123 0.0 90 0.1 5 0.1
1,000
persons or
more 119 0.0 104 0.1 5 0.1
Total 505,134 100.0 71,416 100.0 8,919 100.0
6
Figure 1-2-2 Composition Ratio of Establishments in Textile Industry by size of
persons engaged and by Class of ISIC
40.9%
48.7%
-
-
65.6%
-
56.0%
30.8%
31.8%
36.3%
-
-
25.9%
20.0%
16.0%
38.5%
13.6%
9.6%
28.6%
-
4.1%
-
-
15.4%
9.1%
2.9%
14.3%
-
1.3%
10.0%
-
7.7%
4.5%
1.5%
-
25.0%
1.6%
50.0%
28.0%
-
-
0.9%
57.1%
75.0%
1.6%
20.0%
-
7.7%
0% 20% 40% 60% 80% 100%
Preparation and
spinning of textile
fibres
Weaving of textiles
Finishing of textiles
Manufacture of
knitted and
crocheted fabrics
Manufacture of
made-up textile
articles, except
apparel
Manufacture of
carpets and rugs
Manufacture of
cordage, rope, twine
and netting
Manufacture of
other textiles n.e.c.
1 person 2 persons 3 persons 4 persons 5-9 persons 10 persons or more
7
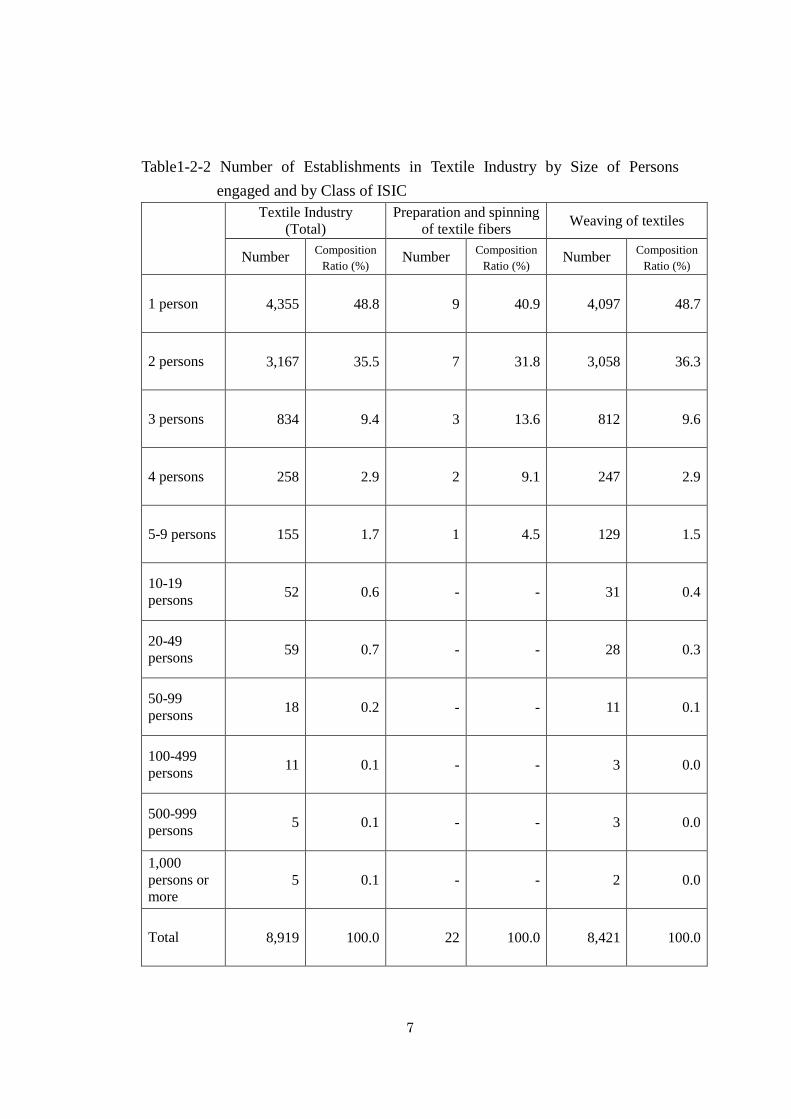
Table1-2-2 Number of Establishments in Textile Industry by Size of Persons
engaged and by Class of ISIC
Textile Industry
(Total)
Preparation and spinning
of textile fibers Weaving of textiles
Number Composition
Ratio (%) Number
Composition
Ratio (%) Number
Composition
Ratio (%)
1 person 4,355 48.8 9 40.9 4,097 48.7
2 persons 3,167 35.5 7 31.8 3,058 36.3
3 persons 834 9.4 3 13.6 812 9.6
4 persons 258 2.9 2 9.1 247 2.9
5-9 persons 155 1.7 1 4.5 129 1.5
10-19
persons 52 0.6 - - 31 0.4
20-49
persons 59 0.7 - - 28 0.3
50-99
persons 18 0.2 - - 11 0.1
100-499
persons 11 0.1 - - 3 0.0
500-999
persons 5 0.1 - - 3 0.0
1,000
persons or
more 5 0.1 - - 2 0.0
Total 8,919 100.0 22 100.0 8,421 100.0
8
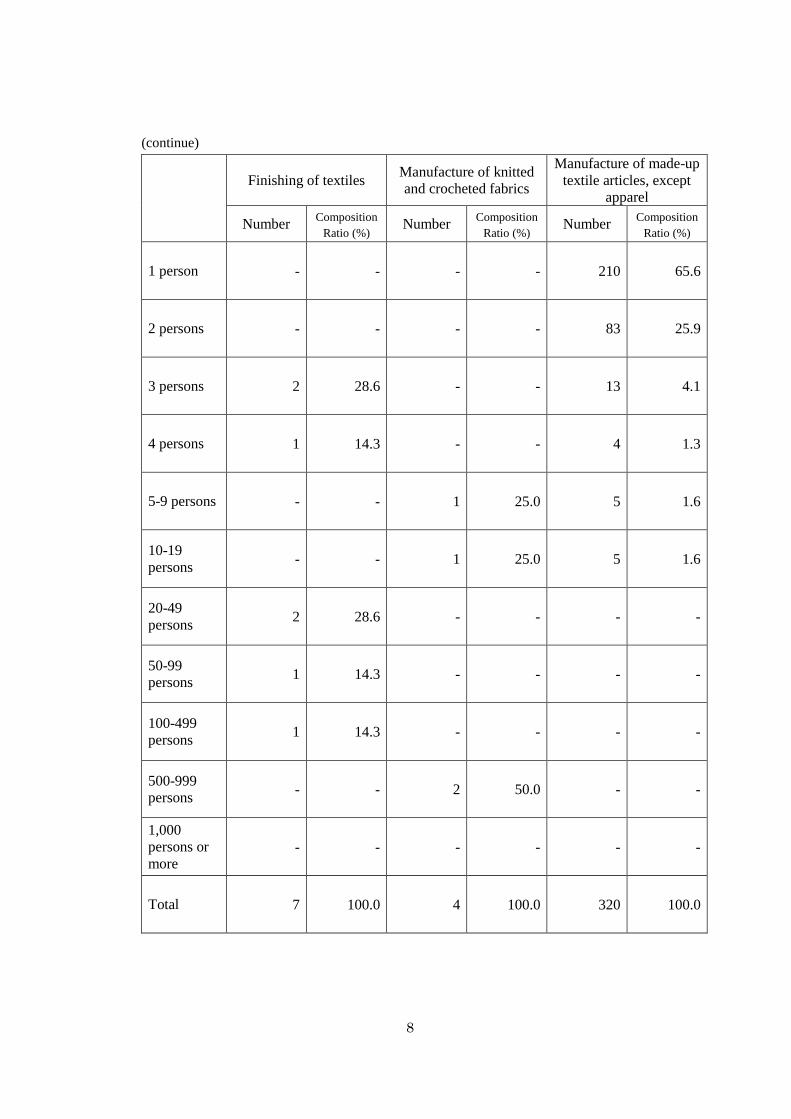
(continue)
Finishing of textiles Manufacture of knitted
and crocheted fabrics
Manufacture of made-up
textile articles, except
apparel
Number Composition
Ratio (%) Number
Composition
Ratio (%) Number
Composition
Ratio (%)
1 person - - - - 210 65.6
2 persons - - - - 83 25.9
3 persons 2 28.6 - - 13 4.1
4 persons 1 14.3 - - 4 1.3
5-9 persons - - 1 25.0 5 1.6
10-19
persons - - 1 25.0 5 1.6
20-49
persons 2 28.6 - - - -
50-99
persons 1 14.3 - - - -
100-499
persons 1 14.3 - - - -
500-999
persons - - 2 50.0 - -
1,000
persons or
more - - - - - -
Total 7 100.0 4 100.0 320 100.0

9
(continue)
Manufacture of carpets
and rugs
Manufacture of cordage,
rope, twine and netting
Manufacture of other
textiles n.e.c.
Number Composition
Ratio (%) Number
Composition
Ratio (%) Number
Composition
Ratio (%)
1 person - - 14 56.0 4 30.8
2 persons 2 20.0 4 16.0 5 38.5
3 persons - - - - 2 15.4
4 persons 1 10.0 - - 1 7.7
5-9 persons 5 50.0 7 28.0 - -
10-19
persons 2 20.0 - - - -
20-49
persons - - - - - -
50-99
persons - - - - 1 7.7
100-499
persons - - - - - -
500-999
persons - - - - - -
1,000
persons or
more - - - - - -
Total 10 100.0 25 100.0 13 100.0
10
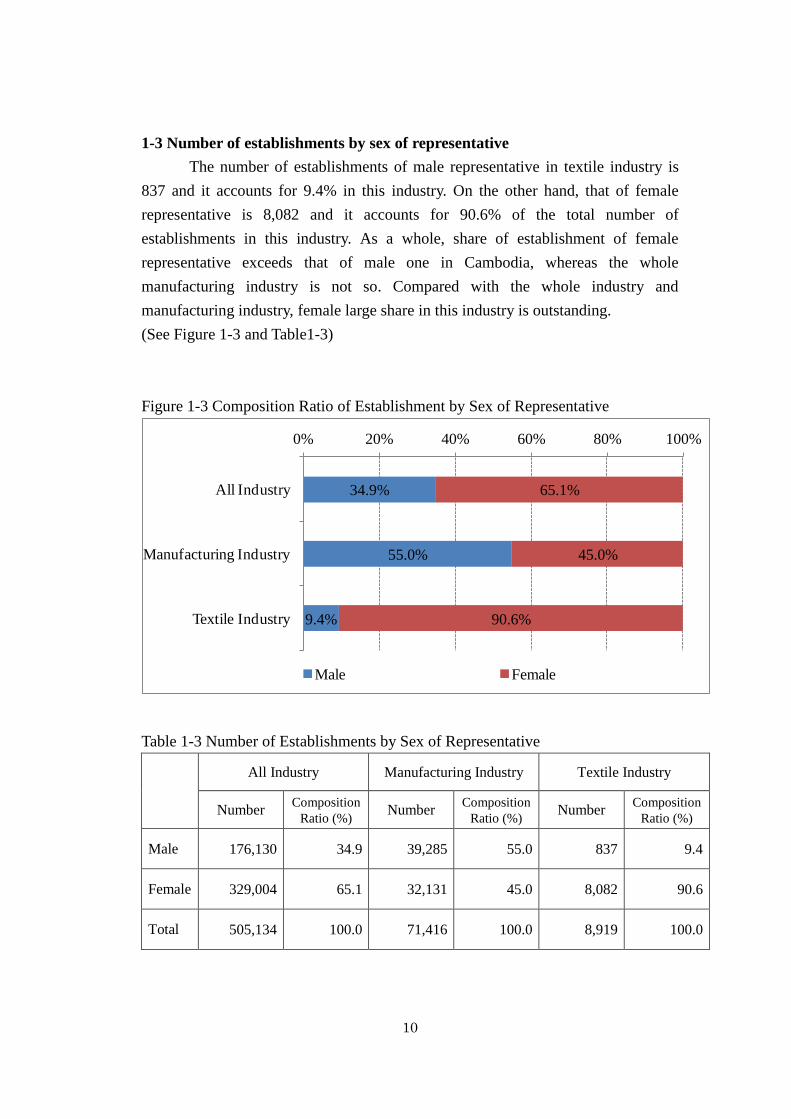
1-3 Number of establishments by sex of representative
The number of establishments of male representative in textile industry is
837 and it accounts for 9.4% in this industry. On the other hand, that of female
representative is 8,082 and it accounts for 90.6% of the total number of
establishments in this industry. As a whole, share of establishment of female
representative exceeds that of male one in Cambodia, whereas the whole
manufacturing industry is not so. Compared with the whole industry and
manufacturing industry, female large share in this industry is outstanding.
(See Figure 1-3 and Table1-3)
Figure 1-3 Composition Ratio of Establishment by Sex of Representative
Table 1-3 Number of Establishments by Sex of Representative
All Industry Manufacturing Industry Textile Industry
Number Composition
Ratio (%) Number
Composition
Ratio (%) Number
Composition
Ratio (%)
Male 176,130 34.9 39,285 55.0 837 9.4
Female 329,004 65.1 32,131 45.0 8,082 90.6
Total 505,134 100.0 71,416 100.0 8,919 100.0
34.9%
55.0%
9.4%
65.1%
45.0%
90.6%
0% 20% 40% 60% 80% 100%
All Industry
Manufacturing Industry
Textile Industry
Male Female
11
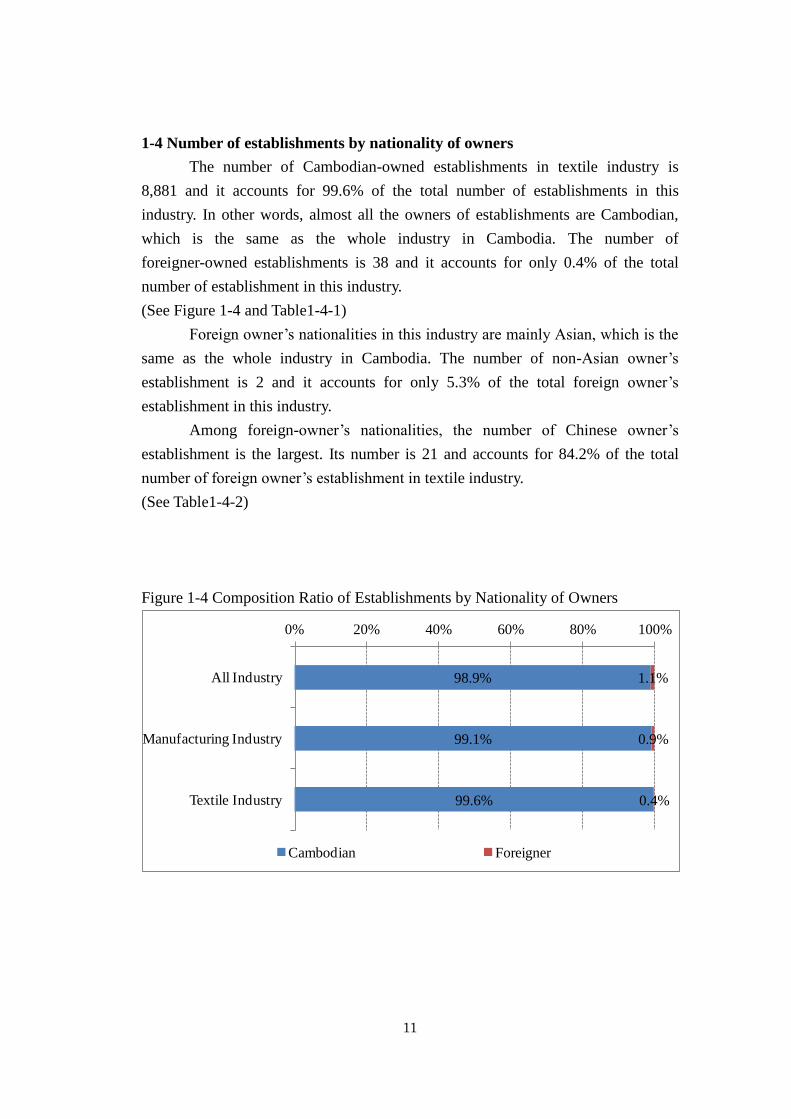
1-4 Number of establishments by nationality of owners
The number of Cambodian-owned establishments in textile industry is
8,881 and it accounts for 99.6% of the total number of establishments in this
industry. In other words, almost all the owners of establishments are Cambodian,
which is the same as the whole industry in Cambodia. The number of
foreigner-owned establishments is 38 and it accounts for only 0.4% of the total
number of establishment in this industry.
(See Figure 1-4 and Table1-4-1)
Foreign owner’s nationalities in this industry are mainly Asian, which is the
same as the whole industry in Cambodia. The number of non-Asian owner’s
establishment is 2 and it accounts for only 5.3% of the total foreign owner’s
establishment in this industry.
Among foreign-owner’s nationalities, the number of Chinese owner’s
establishment is the largest. Its number is 21 and accounts for 84.2% of the total
number of foreign owner’s establishment in textile industry.
(See Table1-4-2)
Figure 1-4 Composition Ratio of Establishments by Nationality of Owners
98.9%
99.1%
99.6%
1.1%
0.9%
0.4%
0% 20% 40% 60% 80% 100%
All Industry
Manufacturing Industry
Textile Industry
Cambodian Foreigner

12
Table1-4-1 Number of Establishments by Nationality of the Owners
All Industry Manufacturing Industry Textile Industry
Number Composition
Ratio (%) Number
Composition
Ratio (%) Number
Composition
Ratio (%)
Cambodian 499,497 98.9 70,739 99.1 8,881 99.6
Foreigner 5,637 1.1 677 0.9 38 0.4
Total 505,134 100.0 71,416 100.0 8,919 100.0
Table1-4-2 Number of Establishments by Nationality of the Foreign Owners
All Industry Manufacturing Industry Textile Industry
Number Composition
Ratio (%) Number
Composition
Ratio (%) Number
Composition
Ratio (%)
Chinese 2,134 37.9 470 69.4 32 84.2
Korean 175 3.1 26 3.8 - -
Vietnamese 2,521 44.7 120 17.7 3 7.9
Other Asian
Countries 374 6.6 39 5.8 1 2.6
American
and European 379 6.7 18 2.7 2 5.3
Others 54 1.0 4 0.6 - -
Total 5,637 100.0 677 100.0 38 100.0

13
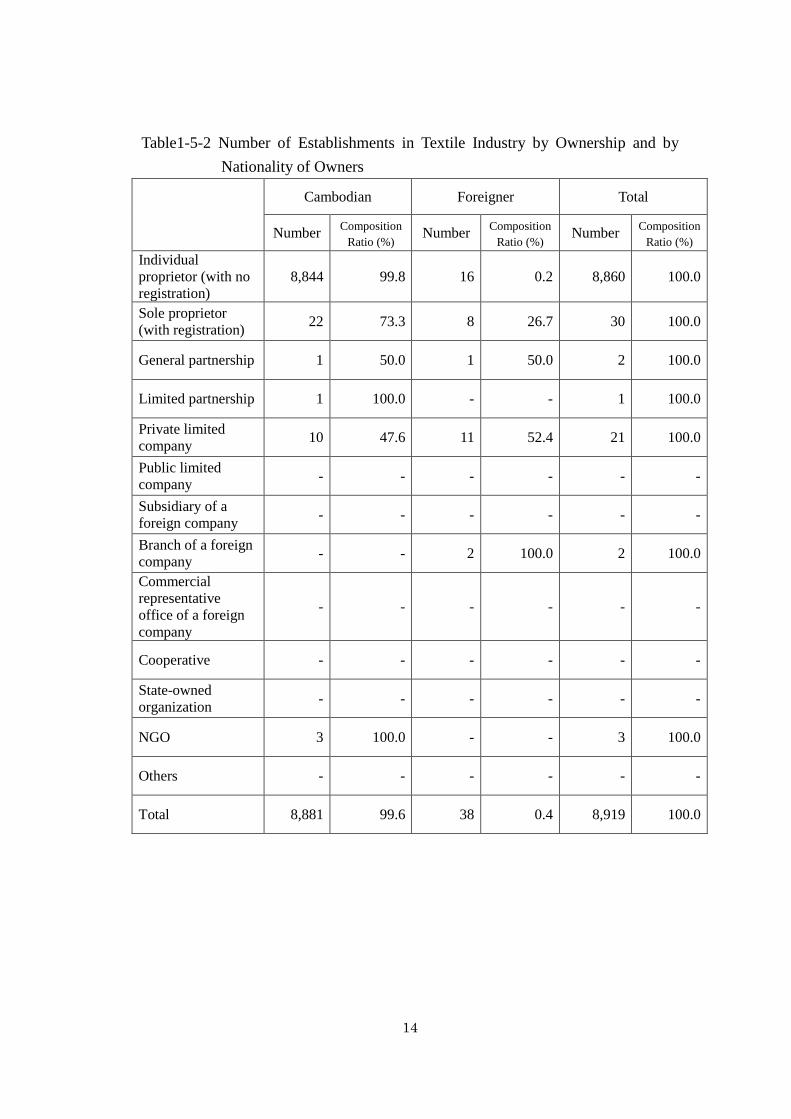
1-5 Number of establishments by ownership
Most of all establishments in textile industry are individual proprietor (with
no registration). Its number is 8,860 and accounts for 99.3% of the total number of
establishments in this industry.
Other type of ownership is few in number. The number of typed company is
only 23, and 13 of it owned by foreigner.
Table1-5-1 Number of Establishments by Ownership
All Industry Manufacturing
Industry Textile Industry
Number Composition
Ratio (%) Number
Composition
Ratio (%) Number
Composition
Ratio (%)
Individual
proprietor (with no
registration) 473,197 93.7 69,676 97.6 8,860 99.3
Sole proprietor
(with registration) 12,027 2.4 1,321 1.8 30 0.3
General partnership 204 0.0 30 0.0 2 0.0
Limited partnership 160 0.0 20 0.0 1 0.0
Private limited
company 3,518 0.7 325 0.5 21 0.2
Public limited
company 390 0.1 9 0.0 - -
Subsidiary of a
foreign company 8 0.0 - - - -
Branch of a foreign
company 64 0.0 15 0.0 2 0.0
Commercial
representative
office of a foreign
company
20 0.0 - - - -
Cooperative 41 0.0 - - - -
State-owned
organization 9,119 1.8 3 0.0 - -
NGO 1,114 0.2 12 0.0 3 0.0
Others 5,272 1.0 5 0.0 - -
Total 505,134 100.0 71,416 100.0 8,919 100.0
14
Table1-5-2 Number of Establishments in Textile Industry by Ownership and by
Nationality of Owners
Cambodian Foreigner Total
Number Composition
Ratio (%) Number
Composition
Ratio (%) Number
Composition
Ratio (%)
Individual
proprietor (with no
registration)
8,844 99.8 16 0.2 8,860 100.0
Sole proprietor
(with registration) 22 73.3 8 26.7 30 100.0
General partnership 1 50.0 1 50.0 2 100.0
Limited partnership 1 100.0 - - 1 100.0
Private limited
company 10 47.6 11 52.4 21 100.0
Public limited
company - - - - - -
Subsidiary of a
foreign company - - - - - -
Branch of a foreign
company - - 2 100.0 2 100.0
Commercial
representative
office of a foreign
company
- - - - - -
Cooperative - - - - - -
State-owned
organization - - - - - -
NGO 3 100.0 - - 3 100.0
Others - - - - - -
Total 8,881 99.6 38 0.4 8,919 100.0
15
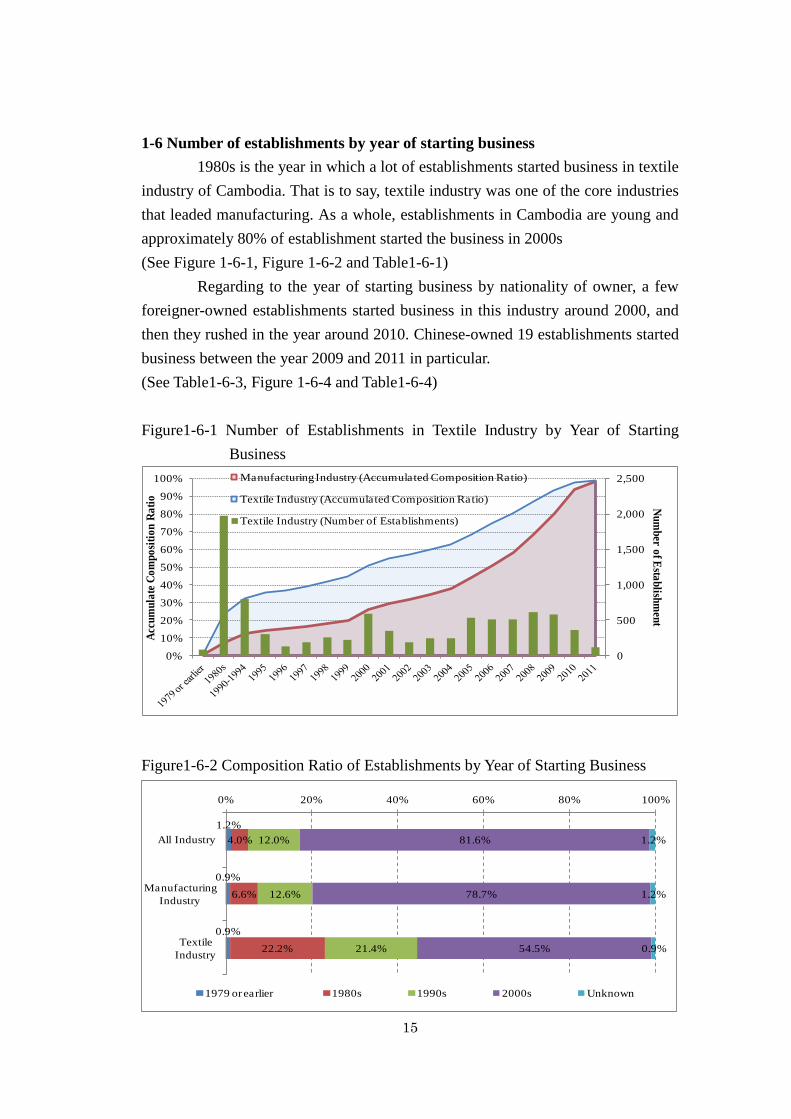
1-6 Number of establishments by year of starting business
1980s is the year in which a lot of establishments started business in textile
industry of Cambodia. That is to say, textile industry was one of the core industries
that leaded manufacturing. As a whole, establishments in Cambodia are young and
approximately 80% of establishment started the business in 2000s
(See Figure 1-6-1, Figure 1-6-2 and Table1-6-1)
Regarding to the year of starting business by nationality of owner, a few
foreigner-owned establishments started business in this industry around 2000, and
then they rushed in the year around 2010. Chinese-owned 19 establishments started
business between the year 2009 and 2011 in particular.
(See Table1-6-3, Figure 1-6-4 and Table1-6-4)
Figure1-6-1 Number of Establishments in Textile Industry by Year of Starting
Business
Figure1-6-2 Composition Ratio of Establishments by Year of Starting Business
1.2%
0.9%
0.9%
4.0%
6.6%
22.2%
12.0%
12.6%
21.4%
81.6%
78.7%
54.5%
1.2%
1.2%
0.9%
0% 20% 40% 60% 80% 100%
All Industry
Manufacturing
Industry
Textile
Industry
1979 or earlier 1980s 1990s 2000s Unknown
0
500
1,000
1,500
2,000
2,500
0%
10%
20%
30%
40%
50%
60%
70%
80%
90%
100%
Nu
mb
er of E
stab
lishm
ent
Acc
um
ula
te C
om
po
siti
on
Ra
tio
Manufacturing Industry (Accumulated Composition Ratio)
Textile Industry (Accumulated Composition Ratio)
Textile Industry (Number of Establishments)

16
Table1-6-1 Number of Establishments by Year of Starting Business
All Industry Manufacturing Industry Textile Industry
Number Composition
Ratio (%) Number
Composition
Ratio (%) Number
Composition
Ratio (%)
1979 or
earlier 6,039 1.2 643 0.9 82 0.9
1980s 20,431 4.0 4,712 6.6 1,982 22.2
1990-1994 23,809 4.7 3,547 5.0 801 9.0
1995 8,606 1.7 1,232 1.7 304 3.4
1996 5,315 1.1 707 1.0 134 1.5
1997 6,117 1.2 852 1.2 191 2.1
1998 8,966 1.8 1,429 2.0 258 2.9
1999 7,648 1.5 1,258 1.8 223 2.5
2000 32,559 6.4 4,485 6.3 593 6.6
2001 15,374 3.0 2,409 3.4 354 4.0
2002 10,867 2.2 1,568 2.2 193 2.2
2003 12,364 2.4 1,973 2.8 248 2.8
2004 13,817 2.7 2,242 3.1 244 2.7
2005 30,488 6.0 4,750 6.7 529 5.9
2006 28,159 5.6 4,481 6.3 510 5.7
2007 35,022 6.9 5,337 7.5 517 5.8
2008 50,961 10.1 7,291 10.2 615 6.9
2009 62,855 12.4 8,356 11.7 576 6.5
2010 87,138 17.3 10,065 14.1 365 4.1
2011 32,446 6.4 3,255 4.6 119 1.3
Unknown 6,153 1.2 824 1.2 81 0.9
Total 505,134 100.0 71,416 100.0 8,919 100.0

17
Table1-6-2 Number of Establishments in Textile Industry by Year of Starting
Business and by Nationality of Owners
Cambodian Foreigner Total
Number Composition
Ratio (%) Number
Composition
Ratio (%) Number
Composition
Ratio (%)
1979 or
earlier 82 0.9 - - 82 0.9
1980s 1,981 22.3 1 2.6 1,982 22.2
1990-1994 801 9.0 - - 801 9.0
1995 304 3.4 - - 304 3.4
1996 134 1.5 - - 134 1.5
1997 191 2.2 - - 191 2.1
1998 258 2.9 - - 258 2.9
1999 221 2.5 2 5.3 223 2.5
2000 591 6.7 2 5.3 593 6.6
2001 351 4.0 3 7.9 354 4.0
2002 193 2.2 - - 193 2.2
2003 248 2.8 - - 248 2.8
2004 244 2.7 - - 244 2.7
2005 528 5.9 1 2.6 529 5.9
2006 509 5.7 1 2.6 510 5.7
2007 513 5.8 4 10.5 517 5.8
2008 612 6.9 3 7.9 615 6.9
2009 571 6.4 5 13.2 576 6.5
2010 354 4.0 11 28.9 365 4.1
2011 115 1.3 4 10.5 119 1.3
Unknown 80 0.9 1 2.6 81 0.9
Total 8,881 100.0 38 100.0 8,919 100.0
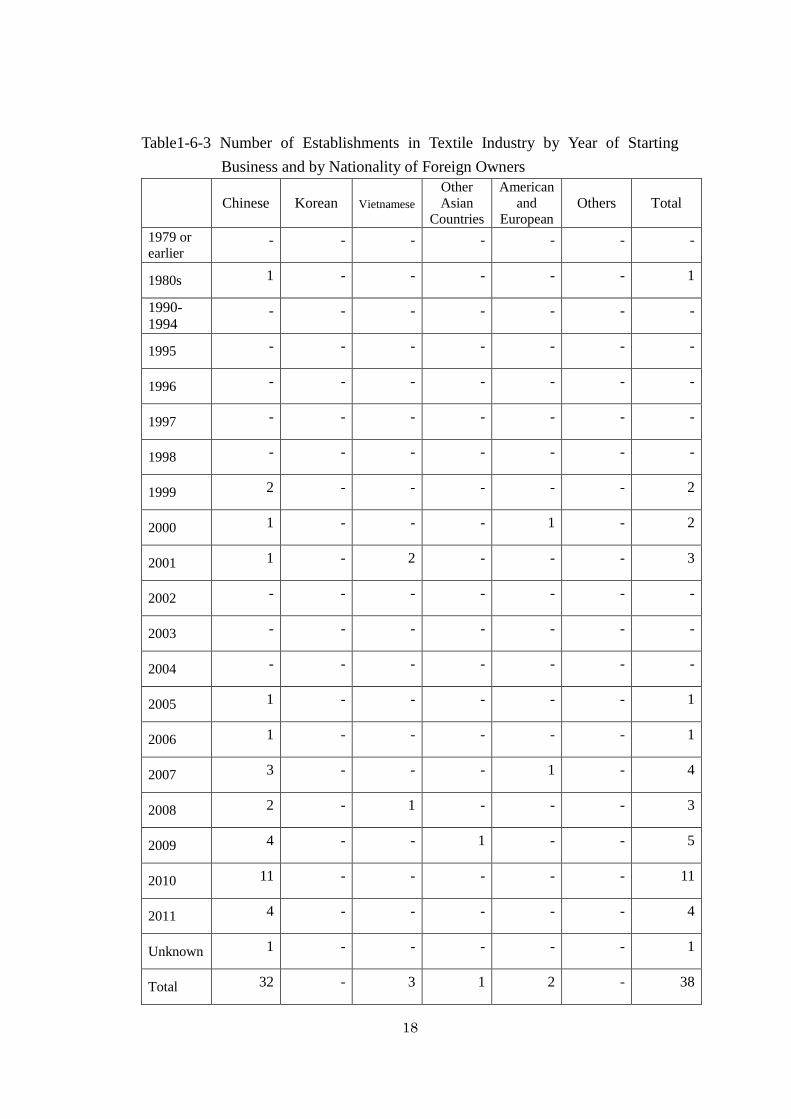
18
Table1-6-3 Number of Establishments in Textile Industry by Year of Starting
Business and by Nationality of Foreign Owners
Chinese Korean Vietnamese
Other
Asian
Countries
American
and
European Others Total
1979 or
earlier - - - - - - -
1980s 1 - - - - - 1
1990-
1994 - - - - - - -
1995 - - - - - - -
1996 - - - - - - -
1997 - - - - - - -
1998 - - - - - - -
1999 2 - - - - - 2
2000 1 - - - 1 - 2
2001 1 - 2 - - - 3
2002 - - - - - - -
2003 - - - - - - -
2004 - - - - - - -
2005 1 - - - - - 1
2006 1 - - - - - 1
2007 3 - - - 1 - 4
2008 2 - 1 - - - 3
2009 4 - - 1 - - 5
2010 11 - - - - - 11
2011 4 - - - - - 4
Unknown 1 - - - - - 1
Total 32 - 3 1 2 - 38

19
1-7 Number of establishments by type of units
The number of establishments typed as single unit is 8,822 and it accounts
for 98.9% of the total number of establishments in textile industry. The number of
establishments typed as branch office is 97 and it accounts for only 1.1% of the
total number of establishments in textile industry. Head offices did not be reported
by themselves in this industry.
(See Figure 1-7-1 and Table1-7-1)
Among Cambodian-owned establishments, majority are single unit
establishments. Its number of establishments is 8,795 and it accounts for 99.0% of
the total number of Cambodian-owned establishments in textile industry. The
number of Foreigner-owned single unit establishments is 27 and it accounts for
71.1% of the total number of foreign-owned establishments. In other words, the
share of branch office is 28.9% and larger than that of Cambodian. The number of
Cambodian-owned branch office is 86 and it accounts for only 1.0% of the total
number of Cambodian-owned establishments.
(See Table 1-7-2)
In the light of ownership of establishment (legal status), individual
proprietor (with no registration) is consisted of single unit which covers 99.3% of
the total number of establishments in individual proprietor (with no registration).
(See Figure 1-7-2 and Table 1-7-3)
Figure1-7-1 Composition Ratio of Establishments in Textile Industry by Nationality
of Owners and by Type of Unit
99.0%
71.1%
98.9%
0.0%
0.0%
0.0%
1.0%
28.9%
1.1%
0% 20% 40% 60% 80% 100%
Cambodian
Foreigner
Total of Textile Industry
Single unit Head office Branch office

20
Figure1-7-2 Composition Ratio of Establishments of Textile Industry by Type of
Unit and by Type of Ownership (Legal Status)
Table1-7-1 Number of Establishments by Type of Unit
All Industry Manufacturing Industry Textile Industry
Number Composition
Ratio (%) Number
Composition
Ratio (%) Number
Composition
Ratio (%)
Single unit 495,969 98.2 70,870 99.2 8,822 98.9
Head office 386 0.1 41 0.1 - -
Branch office 8,779 1.7 505 0.7 97 1.1
Total 505,134 100.0 71,416 100.0 8,919 100.0
99.3%
60.0%
-
-
38.1%
-
-
-
-
-
-
33.3%
-
-
-
-
-
-
-
-
-
-
-
-
-
-
0.7%
40.0%
100.0%
100.0%
61.9%
-
-
100.0%
-
-
-
66.7%
-
0% 20% 40% 60% 80% 100%
Individual proprietor (with no
registration)
Sole proprietor (with registration)
General partnership
Limited partnership
Private limited company
Public limited company
Subsidiary of a foreign company
Branch of a foreign company
Commer-cial represent-tative
office of a foreign company
Cooperative
State-owned organization
NGO
Others
Single unit Head office Branch office

21
Table1-7-2 Number of Establishments in Textile Industry by Type of Unit and by
Nationality of the Owners
Cambodian Foreigner Total of Textile
Industry
Number Composition
Ratio (%) Number
Composition
Ratio (%) Number
Composition
Ratio (%)
Single unit 8,795 99.0 27 71.1 8,822 98.9
Head office - - - - - -
Branch office 86 1.0 11 28.9 97 1.1
Total 8,881 100.0 38 100.0 8,919 100.0
Table1-7-3 Number of Establishments in Textile Industry by Type of Unit and by
Type of Ownership (Legal Status)
-1 by type of proprietor
Individual proprietor
(with no registration)
Sole proprietor (with
registration)
Total
Number Composition
Ratio (%) Number
Composition
Ratio (%) Number
Composition
Ratio (%)
Single unit 8,795 99.3 18 60.0 8,813 99.1
Head office - - - - - -
Branch office 65 0.7 12 40.0 77 0.9
Total 8,860 100.0 30 100.0 8,890 100.0
-2 by type of partnership
General partnership Limited partnership Total
Number Composition
Ratio (%) Number
Composition
Ratio (%) Number
Composition
Ratio (%)
Single unit - - - - - -
Head office - - - - - -
Branch office 2 100.0 1 100.0 3 100.0
Total 2 100.0 1 100.0 3 100.0
-3 by type of limited company
Private limited
company
Public limited company Total
Number Composition
Ratio (%) Number
Composition
Ratio (%) Number
Composition
Ratio (%)
Single unit 8 38.1 - - 8 38.1
Head office - - - - - -
Branch office 13 61.9 - - 13 61.9
Total 21 100.0 - - 21 100.0

22
-4 by type of foreign company
Subsidiary of a foreign
company
Branch of a foreign
company
Commercial
representative office of
a foreign company
Number Composition
Ratio (%) Number
Composition
Ratio (%) Number
Composition
Ratio (%)
Single unit - - - - - -
Head office - - - - - -
Branch office - - 2 100.0 - -
Total - - 2 100.0 - -
(continue)
Total
Number Composition
Ratio (%)
Single unit - -
Head office - -
Branch office 2 100.0
Total 2 100.0
-5 by type of other legal status
Cooperative State-owned
organization
NGO
Number Composition
Ratio (%) Number
Composition
Ratio (%) Number
Composition
Ratio (%)
Single unit - - - - 1 33.3
Head office - - - - - 0.0
Branch office - - - - - 66.7
Total - - - - 3 100.0
(continue)
Others Total
Number Composition
Ratio (%) Number
Composition
Ratio (%)
Single unit - - 1 33.3
Head office - - - -
Branch office - - 2 66.7
Total - - 3 100.0

23
Chapter 2-Business
2-1-Kind of business places
Majority of kind of business place is “home business” in textile industry.
The number of establishments is 8,829 and it accounts for 99.0% of total number of
establishments in this industry. Although the second largest kind of business place
is “business that is occupying exclusively one block or one building”, its number of
establishments is 56 and it accounts for only 0.6% of total number of
establishments in this industry. The third largest one is “Business in apartment
building” whose number of establishments is 27 and it accounts for 0.3% of total
number of establishments in this industry.
(See Table2-1-1)
This is caused by the overwhelming majority of individual proprietor (with
no registration) and its number of establishments is 8,860. Other types of ownership
(legal status) such as partnership, limited company and foreign company prefer to select
building or exclusive block.
(See Figure2-1-1 and Table2-1-2)
Table2-1-1 Number of Establishments by Kind of Business Places
All Industry Manufacturing Industry Textile Industry
Number Composition
Ratio (%) Number
Composition
Ratio (%) Number
Composition
Ratio (%)
Street
business 41,771 8.3 90 0.1 - -
Home
business 327,054 64.7 62,970 88.2 8,829 99.0
Business in
apartment
building 13,688 2.7 1,907 2.7 27 0.3
Business in
traditional
market 93,139 18.4 5,018 7.0 2 0.0
Business in
modern
shopping
moll
815 0.2 1 0.0 - -
Business that
is occupying
exclusively
one block or
one building
21,254 4.2 1,339 1.9 56 0.6
Others 7,413 1.5 91 0.1 5 0.1
Total 505,134 100.0 71,416 100.0 8,919 100.0
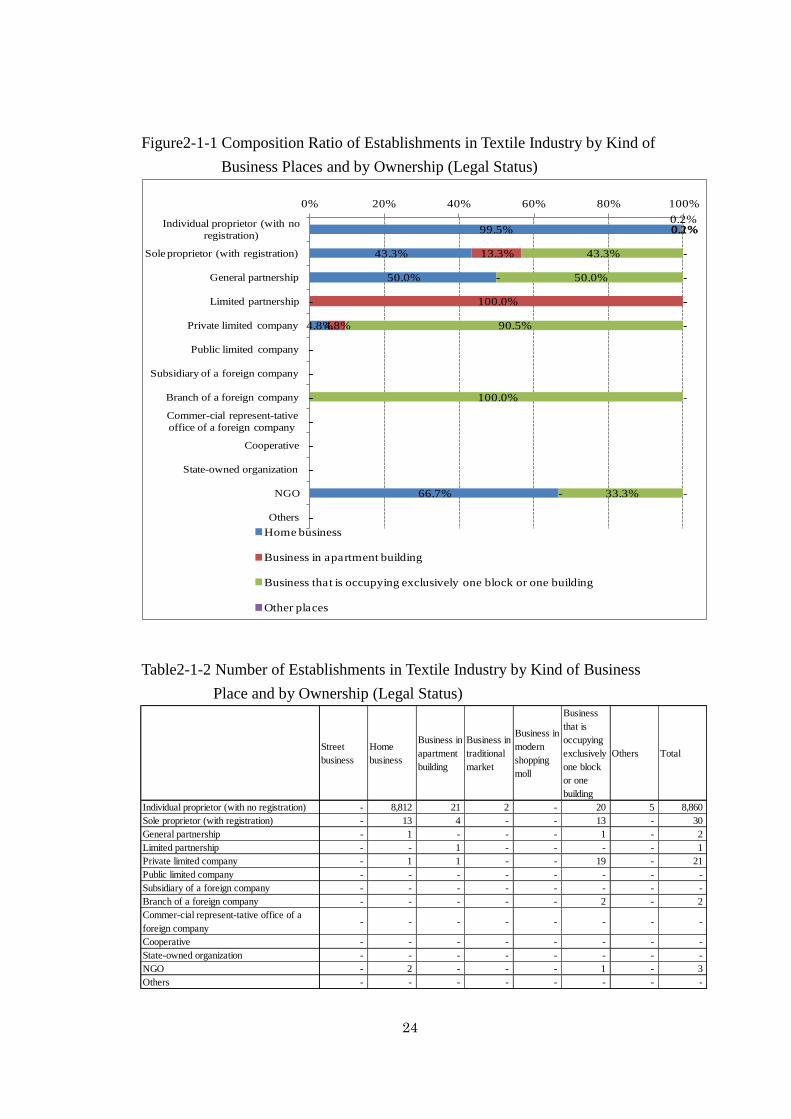
24
Figure2-1-1 Composition Ratio of Establishments in Textile Industry by Kind of
Business Places and by Ownership (Legal Status)
Table2-1-2 Number of Establishments in Textile Industry by Kind of Business
Place and by Ownership (Legal Status)
99.5%
43.3%
50.0%
-
4.8%
-
-
-
-
-
-
66.7%
-
0.2%
13.3%
-
100.0%
4.8%
-
-
-
-
-
-
-
-
0.2%
43.3%
50.0%
-
90.5%
-
-
100.0%
-
-
-
33.3%
-
0.1%
-
-
-
-
-
-
-
-
-
-
-
-
0% 20% 40% 60% 80% 100%
Individual proprietor (with no
registration)
Sole proprietor (with registration)
General partnership
Limited partnership
Private limited company
Public limited company
Subsidiary of a foreign company
Branch of a foreign company
Commer-cial represent-tative
office of a foreign company
Cooperative
State-owned organization
NGO
Others
Home business
Business in apartment building
Business that is occupying exclusively one block or one building
Other places
Street
business
Home
business
Business in
apartment
building
Business in
traditional
market
Business in
modern
shopping
moll
Business
that is
occupying
exclusively
one block
or one
building
Others Total
Individual proprietor (with no registration) - 8,812 21 2 - 20 5 8,860
Sole proprietor (with registration) - 13 4 - - 13 - 30
General partnership - 1 - - - 1 - 2
Limited partnership - - 1 - - - - 1
Private limited company - 1 1 - - 19 - 21
Public limited company - - - - - - - -
Subsidiary of a foreign company - - - - - - - -
Branch of a foreign company - - - - - 2 - 2
Commer-cial represent-tative office of a
foreign company- - - - - - - -
Cooperative - - - - - - - -
State-owned organization - - - - - - - -
NGO - 2 - - - 1 - 3
Others - - - - - - - -
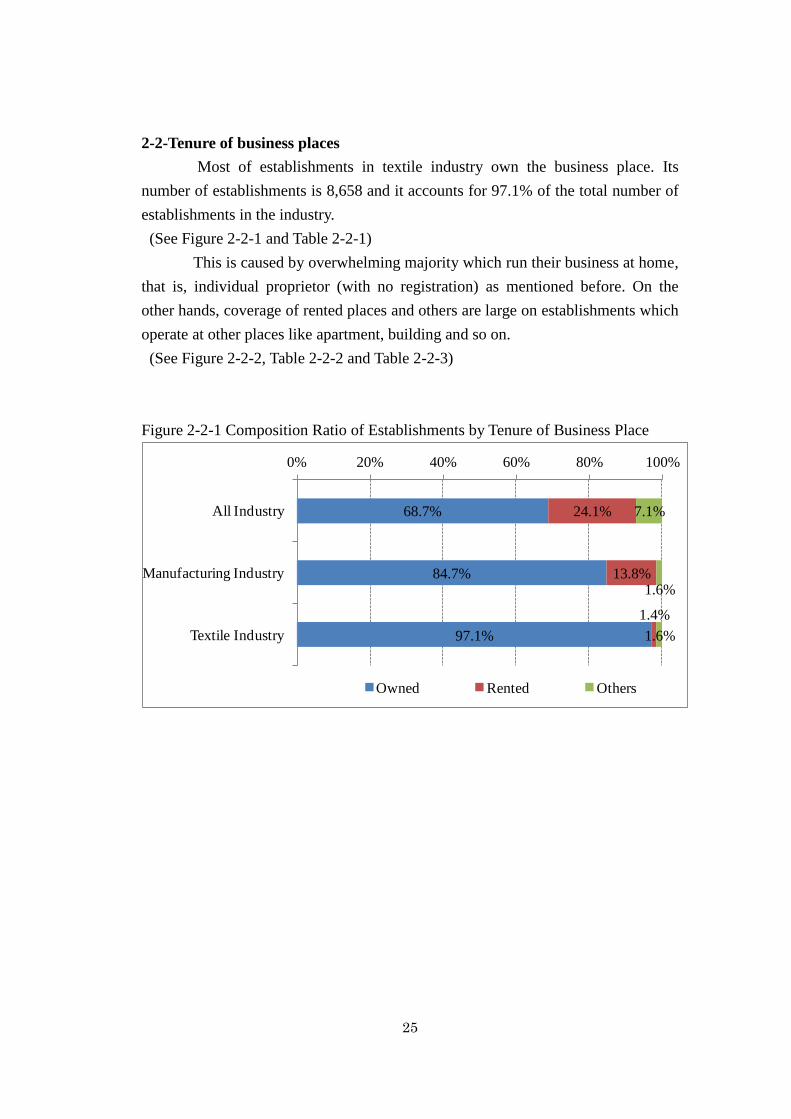
25
2-2-Tenure of business places
Most of establishments in textile industry own the business place. Its
number of establishments is 8,658 and it accounts for 97.1% of the total number of
establishments in the industry.
(See Figure 2-2-1 and Table 2-2-1)
This is caused by overwhelming majority which run their business at home,
that is, individual proprietor (with no registration) as mentioned before. On the
other hands, coverage of rented places and others are large on establishments which
operate at other places like apartment, building and so on.
(See Figure 2-2-2, Table 2-2-2 and Table 2-2-3)
Figure 2-2-1 Composition Ratio of Establishments by Tenure of Business Place
68.7%
84.7%
97.1%
24.1%
13.8%
1.4%
7.1%
1.6%
1.6%
0% 20% 40% 60% 80% 100%
All Industry
Manufacturing Industry
Textile Industry
Owned Rented Others

26
Table2-2-1 Number of Establishments by Tenure of Business Place
All Industry Manufacturing Industry Textile Industry
Number Composition
Ratio (%) Number
Composition
Ratio (%) Number
Composition
Ratio (%)
Owned 347,170 68.7 60,461 84.7 8,658 97.1
Rented 121,852 24.1 9,834 13.8 121 1.4
Others 36,112 7.1 1,121 1.6 140 1.6
Total 505,134 100.0 71,416 100.0 8,919 100.0
Figure 2-2-2 Composition Ratio of Establishments in Textile Industry by Tenure of
Business Place and by Kind of Business Place
-
97.7%
51.9%
-
-
33.9%
40.0%
-
0.8%
48.1%
100.0%
-
64.3%
-
-
1.5%
-
-
-
1.8%
60.0%
0% 20% 40% 60% 80% 100%
Street business
Home business
Business in apartment building
Business in traditional market
Business in modern shopping mall
Business that is occupying exclusively one block or one
building
Others
Owned Rented Others

27
Table2-2-2 Number of Establishments in Textile Industry by Tenure of Business
Place and by Kind of Business Place
Owned Rented Others Total of Textile
Industry
Number
Com-
position
Ratio
(%)
Number
Com-
position
Ratio
(%)
Number
Com-
position
Ratio
(%)
Number
Com-
position
Ratio
(%)
Street business - - - - - - - -
Home business 8,623 97.7 70 0.8 136 1.5 8,829 100.0
Business in
apartment
building 14 51.9 13 48.1 - - 27 100.0
Business in
traditional
market - - 2 100.0 - - 2 100.0
Business in
modern
shopping mall - - - - - - -
Business that is
occupying
exclusively one
block or one
building
19 33.9 36 64.3 1 1.8 56 100.0
Others 2 40.0 - - 3 60.0 5 100.0
Total 8,658 97.1 121 1.4 140 1.6 8,919 100.0

28
Table2-2-3 Number of Establishments in Textile Industry by Tenure of Business
Place and by Ownership (Legal Status)
Owned Rented Others Total of Textile
Industry
Number
Com-
position
Ratio
(%)
Number
Com-
position
Ratio
(%)
Number
Com-
position
Ratio
(%)
Number
Com-
position
Ratio
(%)
Individual
proprietor (with
no registration) 8,634 97.4 88 1.0 138 1.6 8,860 100.0
Sole proprietor
(with
registration) 14 46.7 16 53.3 - - 30 100.0
General
partnership - - 2 100.0 - - 2 100.0
Limited
partnership - - 1 100.0 - - 1 100.0
Private limited
company 10 47.6 11 52.4 - - 21 100.0
Public limited
company - - - - - - - -
Subsidiary of a
foreign
company - - - - - - - -
Branch of a
foreign
company - - 2 100.0 - - 2 100.0
Commercial
representative
office of a
foreign
company
- - - - - - - -
Cooperative - - - - - - - -
State-
owned
organization - - - - - - - -
NGO - - 1 33.3 2 66.7 3 100.0
Others - - - - - - - -
Total 8,658 97.1 121 1.4 140 1.6 8,919 100.0

29
2-3 Area of business places
Area of business place on most of establishments is very small in textile
industry. Approximately 40% of the total number of establishments in this industry
runs their business in area under 5m2. Most part of the rests operates in area of 5 m
2
– under10 m2 and 10 m
2– under 30 m
2. The number of establishments running their
business in area of 100 m2 or more is 136 and it accounts for only 1.5% of the total
establishment in this industry. This coverage is also the small and it is less than that
of the whole establishment and manufacturing industry, 7.2% and 5.5%
respectively.
(See Figure 2-3-1 and Table 2-3-1)
Compared with Cambodian-owned establishments, foreign-owned
establishment prefer to run their business in more spatial area. The number of
establishments running their business in the area of 100 m2 or more is 23 and it
accounts for 60.5% of the total number of foreign-owned establishments in this
industry.
(See Figure 2-3-2 and Table 2-3-2)
As mentioned before, this caused by the majority running businesses in home and
typed individual proprietor.
(See Figure 2-3-3 and Table 2-3-3)
Figure2-3-1 Composition Ratio of Establishments by Area of Business Place
26.1%
18.1%
40.2%
26.4%
29.0%
34.9%
24.0%
28.6%
13.1%
10.7%
12.5%
6.9%
5.7%
6.3%
3.4%
7.2%
5.5%
1.5%
0% 20% 40% 60% 80% 100%
All Industry
Manufacturing Industry
Textile Industry
Under 5㎡ 5㎡- under 10㎡ 10㎡- under 30㎡30㎡- under 50㎡ 50㎡- under 100㎡ 100㎡ or more

30
Table2-3-1 Number of Establishments by Area of Business Place
All Industry Manufacturing Industry Textile Industry
Number Composition
Ratio (%) Number
Composition
Ratio (%) Number
Composition
Ratio (%)
Under 5 ㎡ 131,758 26.1 12,894 18.1 3,588 40.2
5 ㎡- under
10 ㎡ 133,405 26.4 20,708 29.0 3,110 34.9
10 ㎡- under
30 ㎡ 121,055 24.0 20,441 28.6 1,169 13.1
30 ㎡- under
50 ㎡ 53,903 10.7 8,935 12.5 611 6.9
50 ㎡- under
100 ㎡ 28,877 5.7 4,517 6.3 305 3.4
100㎡- under
200 ㎡ 16,135 3.2 2,568 3.6 95 1.1
200㎡- under
500 ㎡ 4,649 0.9 396 0.6 12 0.1
500㎡- under
1000 ㎡ 1,886 0.4 161 0.2 5 0.1
1000 ㎡ or
more 13,466 2.7 796 1.1 24 0.3
Total 505,134 100.0 71,416 100.0 8,919 100.0
Figure2-3-2 Composition Ratio of Establishments in Textile Industry by Area of
Business Places and by Nationality of the Owners
40.4%
2.6%
40.2%
35.0%
5.3%
34.9%
13.2%
2.6%
13.1%
6.8%
10.5%
6.9%
3.4%
18.4%
3.4%
1.3%
60.5%
1.5%
0% 20% 40% 60% 80% 100%
Cambodian
Foreigner
Total
Under 5㎡ 5㎡- under 10㎡ 10㎡- under 30㎡30㎡- under 50㎡ 50㎡- under 100㎡ 100㎡ or more

31
Table2-3-2 Number of Establishments in Textile Industry by Area of Business
Places and by Nationality of the Owners
Cambodian Foreigner Total of Textile
Industry
Number Composition
Ratio (%) Number
Composition
Ratio (%) Number
Composition
Ratio (%)
Under 5 ㎡ 3,587 40.4 1 2.6 3,588 40.2
5 ㎡- under
10 ㎡ 3,108 35.0 2 5.3 3,110 34.9
10 ㎡- under
30 ㎡ 1,168 13.2 1 2.6 1,169 13.1
30 ㎡- under
50 ㎡ 607 6.8 4 10.5 611 6.9
50 ㎡-under
100 ㎡ 298 3.4 7 18.4 305 3.4
100㎡- under
200 ㎡ 89 1.0 6 15.8 95 1.1
200㎡- under
500 ㎡ 8 0.1 4 10.5 12 0.1
500㎡- under
1000 ㎡ 5 0.1 - - 5 0.1
1000 ㎡ or
more 11 0.1 13 34.2 24 0.3
Total 8,881 100.0 38 100.0 8,919 100.0

32
Figure2-3-3 Composition Ratio of Establishments in Textile Industry by Area of
Business Place and by Kind of Business Places
Table2-3-3 Number of Establishments in Textile Industry by Area of Business Place
and by Kind of Business Places
-
40.5%
22.2%
-
-
-
60.0%
-
35.2%
11.1%
-
-
-
20.0%
-
13.2%
11.1%
100.0%
-
-
20.0%
-
6.9%
14.8%
-
-
-
-
-
3.3%
14.8%
-
-
16.1%
-
-
0.9%
25.9%
-
-
83.9%
-
0% 20% 40% 60% 80% 100%
Street business
Home business
Business in apartment building
Business in traditional market
Business in modern shopping mall
Business that is occupying exclusively one block or one
building
Others
Under 5㎡ 5㎡- under 10㎡ 10㎡- under 30㎡
30㎡- under 50㎡ 50㎡- under 100㎡ 100㎡ or more
Street
business
Home
business
Business
in
apartment
building
Business
in
traditional
market
Business
in modern
shopping
mall
Business
that is
occupying
exclusively
one block or
one building
Others
Under 5㎡ - 3,579 6 - - - 3
5㎡- under 10㎡ - 3,106 3 - - - 1
10㎡- under 30㎡ - 1,163 3 2 - - 1
30㎡- under 50㎡ - 607 4 - - - -
50㎡- under 100㎡ - 292 4 - - 9 -
100㎡- under 200㎡ - 82 1 - - 12 -
200㎡- under 500㎡ - - 3 - - 9 -
500㎡- under 1000㎡ - - - - - 5 -
1000㎡ or more - - 3 - - 21 -
Total - 8,829 27 2 - 56 5

33
Table2-3-4 Number of Establishments by Area of Business Place and by Ownership
(Legal Status)
-1 by type of proprietor
Individual proprietor
(with no registration)
Sole proprietor (with
registration) Total
Number Composition
Ratio (%) Number
Composition
Ratio (%) Number
Composition
Ratio (%)
Under 5 ㎡ 3,588 40.5% - - 3,588 40.4
5 ㎡- under
10 ㎡ 3,109 35.1% 1 3.3% 3,110 35.0
10 ㎡- under
30 ㎡ 1,168 13.2% - - 1,168 13.1
30 ㎡- under
50 ㎡ 603 6.8% 7 23.3% 610 6.9
50 ㎡- under
100 ㎡ 296 3.3% 5 16.7% 301 3.4
100㎡- under
200 ㎡ 85 1.0% 6 20.0% 91 1.0
200㎡- under
500 ㎡ 6 0.1% 1 3.3% 7 0.1
500㎡- under
1000 ㎡ 3 0.0% 2 6.7% 5 0.1
1000 ㎡ or
more 2 0.0% 8 26.7% 10 0.1
Total 8,860 100.0% 30 100.0% 8,890 100.0

34
-2 by type of partnership
General partnership Limited partnership Total
Number Composition
Ratio (%) Number
Composition
Ratio (%) Number
Composition
Ratio (%)
Under 5 ㎡ - - - - - -
5 ㎡- under
10 ㎡ - - - - - -
10 ㎡- under
30 ㎡ - - - - - -
30 ㎡- under
50 ㎡ - - - - - -
50 ㎡- under
100 ㎡ 1 50.0% 1 100.0% 2 66.7
100㎡- under
200 ㎡ 1 50.0% - - 1 33.3
200㎡- under
500 ㎡ - - - - - -
500㎡- under
1000 ㎡ - - - - - -
1000 ㎡ or
more - - - - - -
Total 2 100.0% 1 100.0% 3 100.0
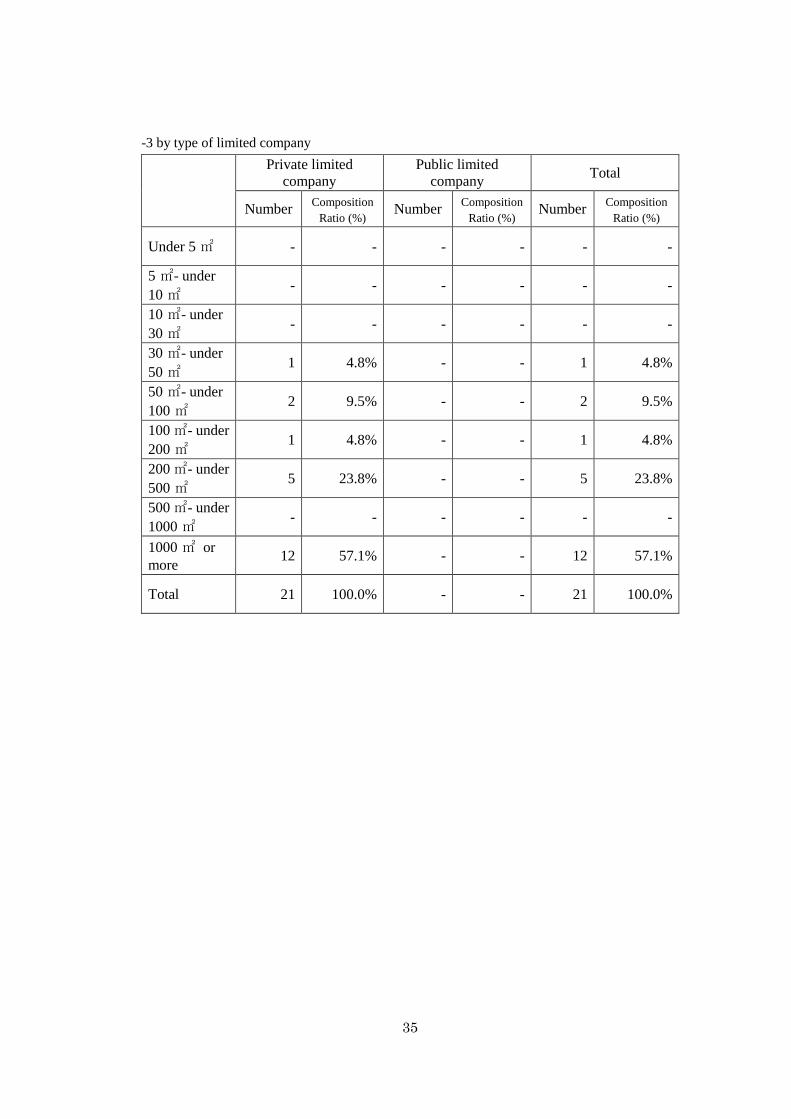
35
-3 by type of limited company
Private limited
company
Public limited
company Total
Number Composition
Ratio (%) Number
Composition
Ratio (%) Number
Composition
Ratio (%)
Under 5 ㎡ - - - - - -
5 ㎡- under
10 ㎡ - - - - - -
10 ㎡- under
30 ㎡ - - - - - -
30 ㎡- under
50 ㎡ 1 4.8% - - 1 4.8%
50 ㎡- under
100 ㎡ 2 9.5% - - 2 9.5%
100㎡- under
200 ㎡ 1 4.8% - - 1 4.8%
200㎡- under
500 ㎡ 5 23.8% - - 5 23.8%
500㎡- under
1000 ㎡ - - - - - -
1000 ㎡ or
more 12 57.1% - - 12 57.1%
Total 21 100.0% - - 21 100.0%
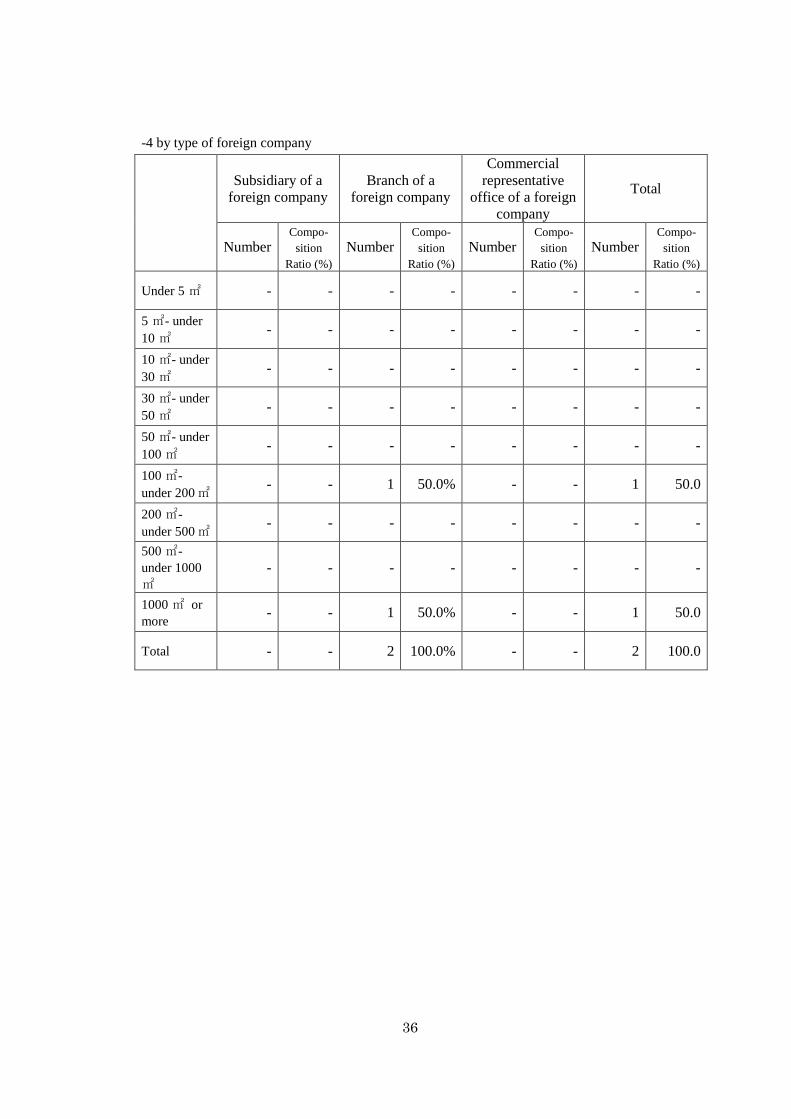
36
-4 by type of foreign company
Subsidiary of a
foreign company
Branch of a
foreign company
Commercial
representative
office of a foreign
company
Total
Number Compo-
sition
Ratio (%)
Number Compo-
sition
Ratio (%)
Number Compo-
sition
Ratio (%)
Number Compo-
sition
Ratio (%)
Under 5 ㎡ - - - - - - - -
5 ㎡- under
10 ㎡ - - - - - - - -
10 ㎡- under
30 ㎡ - - - - - - - -
30 ㎡- under
50 ㎡ - - - - - - - -
50 ㎡- under
100 ㎡ - - - - - - - -
100 ㎡-
under 200㎡ - - 1 50.0% - - 1 50.0
200 ㎡-
under 500㎡ - - - - - - - -
500 ㎡-
under 1000
㎡
- - - - - - - -
1000 ㎡ or
more - - 1 50.0% - - 1 50.0
Total - - 2 100.0% - - 2 100.0

37
-5 by type of other legal status
Cooperative State-owned
organization NGO
Number Composition
Ratio (%) Number
Composition
Ratio (%) Number
Composition
Ratio (%)
Under 5 ㎡ - - - - - -
5 ㎡- under
10 ㎡ - - - - - -
10 ㎡- under
30 ㎡ - - - - 1 33.3
30 ㎡- under
50 ㎡ - - - - - -
50 ㎡- under
100 ㎡ - - - - - -
100㎡- under
200 ㎡ - - - - 1 33.3
200㎡- under
500 ㎡ - - - - - -
500㎡- under
1000 ㎡ - - - - - -
1000 ㎡ or
more - - - - 1 33.3
Total - - - - 3 100.0

38
(continue)
Others Total
Number Composition
Ratio (%) Number
Composition
Ratio (%)
Under 5 ㎡ - - - -
5㎡- under 10
㎡ - - - -
10 ㎡- under
30 ㎡ - - 1 33.3
30 ㎡- under
50 ㎡ - - - -
50 ㎡- under
100 ㎡ - - - -
100 ㎡- under
200 ㎡ - - 1 33.3
200 ㎡- under
500 ㎡ - - - -
500 ㎡- under
1000 ㎡ - - - -
1000 ㎡ or
more - - 1 33.3
Total - - 3 100.0

39
2-4-Business Hour
Approximately 90% of the total establishment in textile industry has been
opened their office and shop until 8 o’clock in the morning, which is the same as
the whole industry in Cambodia.
A lot of establishments in this industry open their office and shop between 7
and 8 o’clock. Those numbers account for 74.3% of the total establishment in this
industry.
(See Figure 2-4-1)
Then, approximately 80% of the total establishments in this industry close
their office and shop between 17 and 19 o’clock. Rush time of closing hours in this
industry comes between 17 and 18 o’clock. Those numbers account for 70.7% of
the total establishment in this industry.
(See Figure 2-4-2 and Table 2-4-1)
Although zones of opening and closing time are different from that of the
whole industry and manufacturing industry, there are no huge differences on
operating hours among them. The average of business hours in this industry is 10.1
hours. This is slightly shorter than that of the whole industry, 30 minutes, and
slightly longer than that of the whole manufacturing industry, 30 minutes.
(See Figure 2-4-3, Figure 2-4-4 and Table 2-4-2)
Figure2-4-1 Composition Ratio of Establishments by Hours of Operating Business
(Opening)
8.0%
7.4%
2.6%
34.1%
18.1%
11.5%
45.8%
53.9%
74.3%
11.0%
20.4%
11.5%
1.1%
0.1%
0.0%
0% 20% 40% 60% 80% 100%
All Industry
Manufacturing Industry
Textile Industry
Before 6 o'clock Between 6 o'clock and 7 o'clockBetween 7 o'clock and 8 o'clock 8 o'clock or later24 hour operation

40
Figure2-4-2 Composition Ratio of Establishments by Hours of Operating Business
(Closing)
Figure2-4-3 Composition Ratio of Establishments by Hours of Operating Business
(Total Hours)
Figure2-4-4 Average of Business Hours
18.1%
21.0%
13.5%
36.9%
50.6%
70.7%
21.7%
17.6%
11.2%
10.5%
4.8%
1.4%
11.7%
5.8%
3.1%
1.1%
0.1%
0.0%
0% 20% 40% 60% 80% 100%
All Industry
Manufacturing Industry
Textile Industry
Before 17 o'clock Between 17 o'clock and 18 o'clockBetween 18 o'clock and 19 o'clock Between 19 o'clock and 20 o'clock20 o'clock or later 24 hour operation
3.8%
3.9%
0.9%
92.5%
87.6%
98.4%
2.3%
4.2%
0.7%
1.5%
4.3%
0.0%
0% 20% 40% 60% 80% 100%
All Industry
Manufacturing Industry
Textile Industry
less than 5 hours 5h00m - 9h59m 10h00m - 14h59m 15h00m or more
10.6
9.6
10.1
0 2 4 6 8 10 12
All Industry
Manufacturing Industry
Textile Industry
(Hours)

41
Table2-4-1 Number of Establishments by Hours of Operating Business -Opening
and Closing Time
-1 Opening Time
All Industry Manufacturing Industry Textile Industry
Number Composition
Ratio (%) Number
Composition
Ratio (%) Number
Composition
Ratio (%)
0 o’clock 76 0.0 13 0.0 - -
1 162 0.0 43 0.1 2 0.0
2 627 0.1 202 0.3 3 0.0
3 1,909 0.4 851 1.2 9 0.1
4 10,839 2.1 1,623 2.3 62 0.7
5 26,711 5.3 2,550 3.6 156 1.7
6 172,343 34.1 12,939 18.1 1,029 11.5
7 231,171 45.8 38,517 53.9 6,627 74.3
8 29,734 5.9 6,946 9.7 882 9.9
9 7,018 1.4 1,604 2.2 86 1.0
10 3,577 0.7 675 0.9 24 0.3
11 2,188 0.4 262 0.4 15 0.2
12 864 0.2 119 0.2 6 0.1
13 1,935 0.4 551 0.8 7 0.1
14 3,038 0.6 1,359 1.9 7 0.1
15 3,669 0.7 2,108 3.0 1 0.0
16 1,925 0.4 837 1.2 - -
17 1,156 0.2 91 0.1 - -
18 410 0.1 19 0.0 - -
19 116 0.0 8 0.0 - -
20 32 0.0 5 0.0 - -
21 11 0.0 4 0.0 - -
22 4 0.0 2 0.0 - -
23 6 0.0 4 0.0 - -
24 hours 5,613 1.1 84 0.1 3 0.0
Total 505,134 100.0 71,416 100.0 8,919 100.0
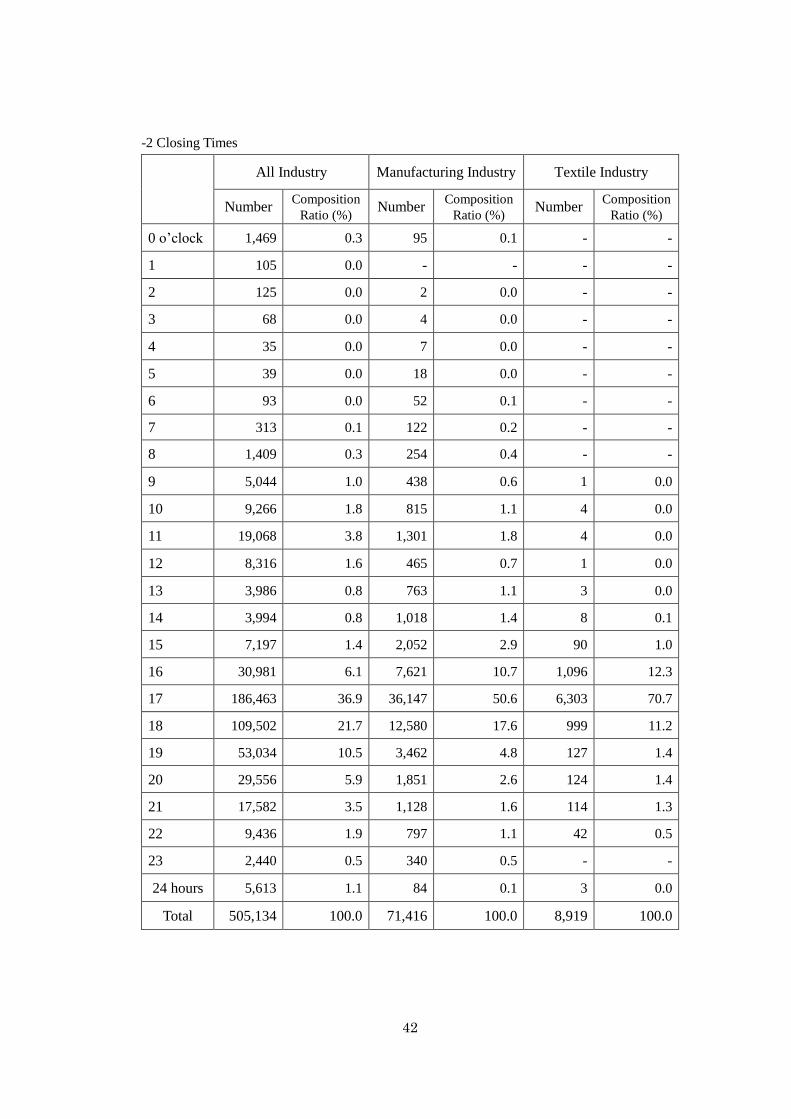
42
-2 Closing Times
All Industry Manufacturing Industry Textile Industry
Number Composition
Ratio (%) Number
Composition
Ratio (%) Number
Composition
Ratio (%)
0 o’clock 1,469 0.3 95 0.1 - -
1 105 0.0 - - - -
2 125 0.0 2 0.0 - -
3 68 0.0 4 0.0 - -
4 35 0.0 7 0.0 - -
5 39 0.0 18 0.0 - -
6 93 0.0 52 0.1 - -
7 313 0.1 122 0.2 - -
8 1,409 0.3 254 0.4 - -
9 5,044 1.0 438 0.6 1 0.0
10 9,266 1.8 815 1.1 4 0.0
11 19,068 3.8 1,301 1.8 4 0.0
12 8,316 1.6 465 0.7 1 0.0
13 3,986 0.8 763 1.1 3 0.0
14 3,994 0.8 1,018 1.4 8 0.1
15 7,197 1.4 2,052 2.9 90 1.0
16 30,981 6.1 7,621 10.7 1,096 12.3
17 186,463 36.9 36,147 50.6 6,303 70.7
18 109,502 21.7 12,580 17.6 999 11.2
19 53,034 10.5 3,462 4.8 127 1.4
20 29,556 5.9 1,851 2.6 124 1.4
21 17,582 3.5 1,128 1.6 114 1.3
22 9,436 1.9 797 1.1 42 0.5
23 2,440 0.5 340 0.5 - -
24 hours 5,613 1.1 84 0.1 3 0.0
Total 505,134 100.0 71,416 100.0 8,919 100.0

43
Table 2-4-2 Number of Establishments by Hours of Operating Business -Total
Hours-
All Industry Manufacturing Industry Textile Industry
Number Composition
Ratio (%) Number
Composition
Ratio (%) Number
Composition
Ratio (%)
less than 5
hours 19,100 3.8 2,812 3.9 79 0.9
5h00m -
9h59m 467,057 92.5 62,559 87.6 8,780 98.4
10h00m -
14h59m 11,646 2.3 2,966 4.2 59 0.7
15h00m -
19h59m 7,278 1.4 3,064 4.3 1 0.0
20 hours or
more 53 0.0 15 0.0 - -
Total 505,134 100.0 71,416 100.0 8,919 100.0
Average of
Business
Hours 10.6 hours 9.6 hours 10.1 hours


45
Chapter 3 Employment
3-1-Number of persons engaged
The number of persons engaged in Textile Industry is 39,041. It accounts for
1.8% of total number of the person engaged in whole industry and 7.4% of that of
manufacturing industry.
(See Table 3-1-1)
In textile industry, persons engaged in huge establishments with 1,000
persons or more cover 34.5% of their total number. Compared with the whole
industry and manufacturing industry, this coverage on small-scaled establishment
with a few persons engaged is small.
(See Figure 3-1-2 and Table3-1-2)
Table 3-1-1 Number of persons engaged
Number of
Establishments
Number of
Persons
engaged
Composition
Ratio of All
Industry (%)
Composition
Ratio of
Manufacturing
Industry (%)
All Industry 505,134 1,673,390 100.0 -
Manufacturing
Industry 71,416 530,341 14.1 100.0
Textile Industry 8,919 39,041 1.8 7.4
Figure3-1 Composition Ratio of Persons engaged by Size of Persons
47.6%
23.2%
11.2%
9.8%
4.9%
2.4%
15.6%
6.9%
9.4%
6.6%
9.5%
7.5%
5.2%
12.3%
9.7%
15.2%
43.2%
34.5%
0% 20% 40% 60% 80% 100%
All Industry
Manufacturing Industry
Textile Industry
1-4 persons 5-9 persons 10-99 persons
100-499 persons 500-999 persons 1,000 persons or more
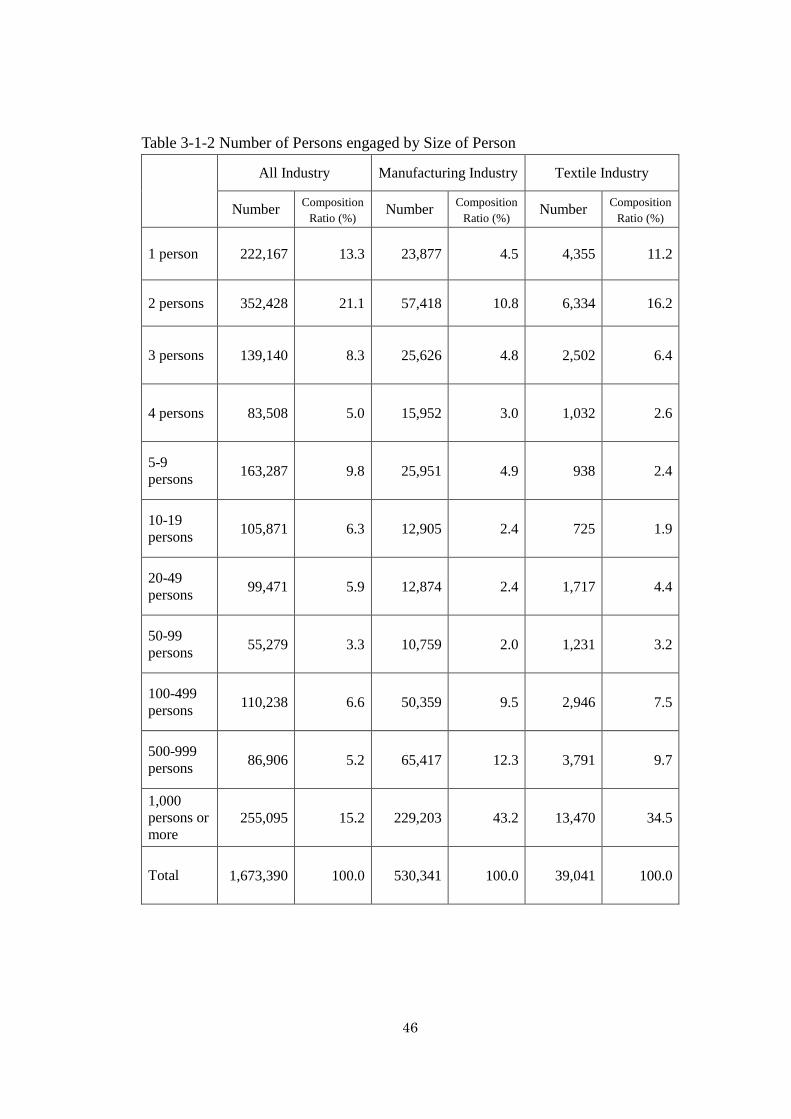
46
Table 3-1-2 Number of Persons engaged by Size of Person
All Industry Manufacturing Industry Textile Industry
Number Composition
Ratio (%) Number
Composition
Ratio (%) Number
Composition
Ratio (%)
1 person 222,167 13.3 23,877 4.5 4,355 11.2
2 persons 352,428 21.1 57,418 10.8 6,334 16.2
3 persons 139,140 8.3 25,626 4.8 2,502 6.4
4 persons 83,508 5.0 15,952 3.0 1,032 2.6
5-9
persons 163,287 9.8 25,951 4.9 938 2.4
10-19
persons 105,871 6.3 12,905 2.4 725 1.9
20-49
persons 99,471 5.9 12,874 2.4 1,717 4.4
50-99
persons 55,279 3.3 10,759 2.0 1,231 3.2
100-499
persons 110,238 6.6 50,359 9.5 2,946 7.5
500-999
persons 86,906 5.2 65,417 12.3 3,791 9.7
1,000
persons or
more 255,095 15.2 229,203 43.2 13,470 34.5
Total 1,673,390 100.0 530,341 100.0 39,041 100.0
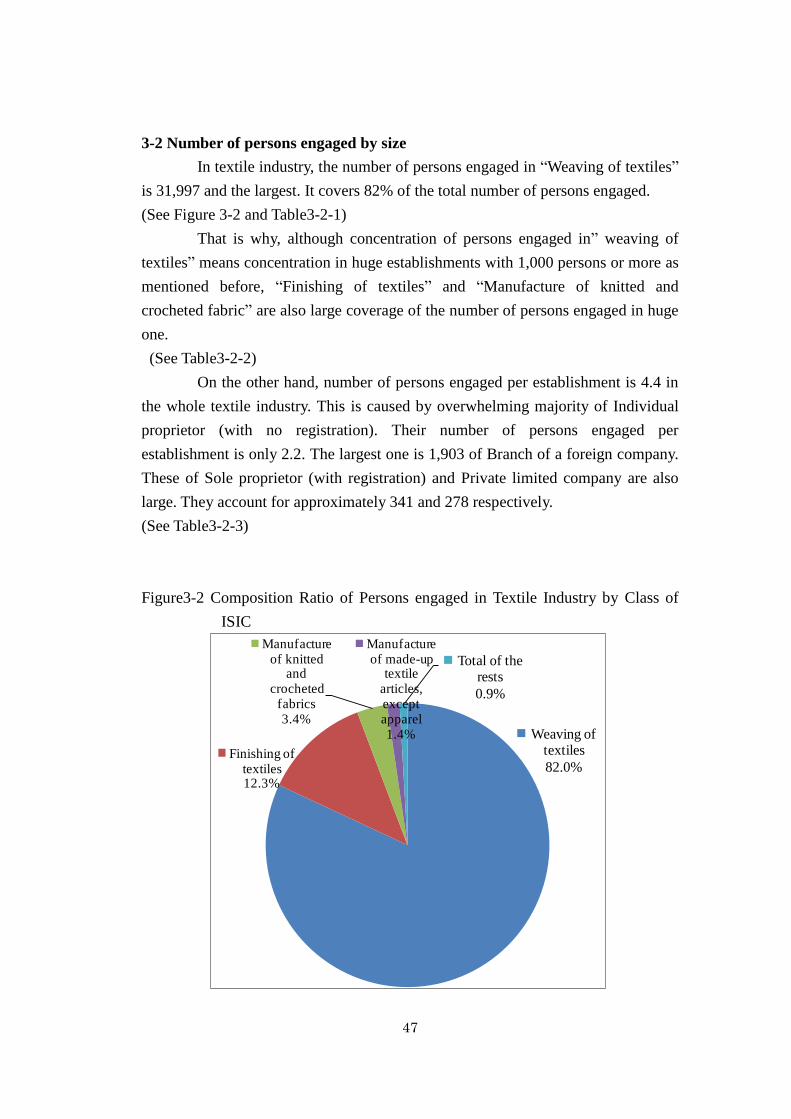
47
3-2 Number of persons engaged by size
In textile industry, the number of persons engaged in “Weaving of textiles”
is 31,997 and the largest. It covers 82% of the total number of persons engaged.
(See Figure 3-2 and Table3-2-1)
That is why, although concentration of persons engaged in” weaving of
textiles” means concentration in huge establishments with 1,000 persons or more as
mentioned before, “Finishing of textiles” and “Manufacture of knitted and
crocheted fabric” are also large coverage of the number of persons engaged in huge
one.
(See Table3-2-2)
On the other hand, number of persons engaged per establishment is 4.4 in
the whole textile industry. This is caused by overwhelming majority of Individual
proprietor (with no registration). Their number of persons engaged per
establishment is only 2.2. The largest one is 1,903 of Branch of a foreign company.
These of Sole proprietor (with registration) and Private limited company are also
large. They account for approximately 341 and 278 respectively.
(See Table3-2-3)
Figure3-2 Composition Ratio of Persons engaged in Textile Industry by Class of
ISIC
Weaving of textiles
82.0%Finishing of
textiles12.3%
Manufacture of knitted
and crocheted
fabrics3.4%
Manufacture of made-up
textile articles, except apparel1.4%
Total of the rests
0.9%

48
Table 3-2-1 Number of Persons engaged in Textile Industry by Class of ISIC
Number of
Persons
Engaged
Composition
Ratio of Textile
Industry (%)
Total of Textile Industry 39,041 100.0
Preparation and spinning of textile fibers 124 0.3
Weaving of textiles 31,997 82.0
Finishing of textiles 4,795 12.3
Manufacture of knitted and crocheted
fabrics 1,343 3.4
Manufacture of made-up textile articles,
except apparel 558 1.4
Manufacture of carpets and rugs 73 0.2
Manufacture of cordage, rope, twine and
netting 69 0.2
Manufacture of other textiles n.e.c 82 0.2

49
Table3-2-2 Number of Persons engaged in Textile Industry by Size of Person and
by Class of ISIC
Preparation and
spinning of textile
fibers
Weaving of textiles Finishing of textiles
Number Composition
Ratio (%) Number
Composition
Ratio (%) Number
Composition
Ratio (%)
1 person 10 8.1 4,117 12.9 - -
2 persons 14 11.3 6,132 19.2 - -
3 persons 9 7.3 2,442 7.6 6 0.1
4 persons 8 6.5 996 3.1 4 0.1
5-9
persons 5 4.0 808 2.5 - -
10-19
persons 13 10.5 594 1.9 - -
20-49
persons 65 52.4 1,522 4.8 110 2.3
50-99
persons - - 990 3.1 183 3.8
100-499
persons - - 2,119 6.6 726 15.1
500-999
persons - - 2,573 8.0 - -
1,000
persons or
more - - 9,704 30.3 3,766 78.5
Total 124 100.0 31,997 100.0 4,795 100.0
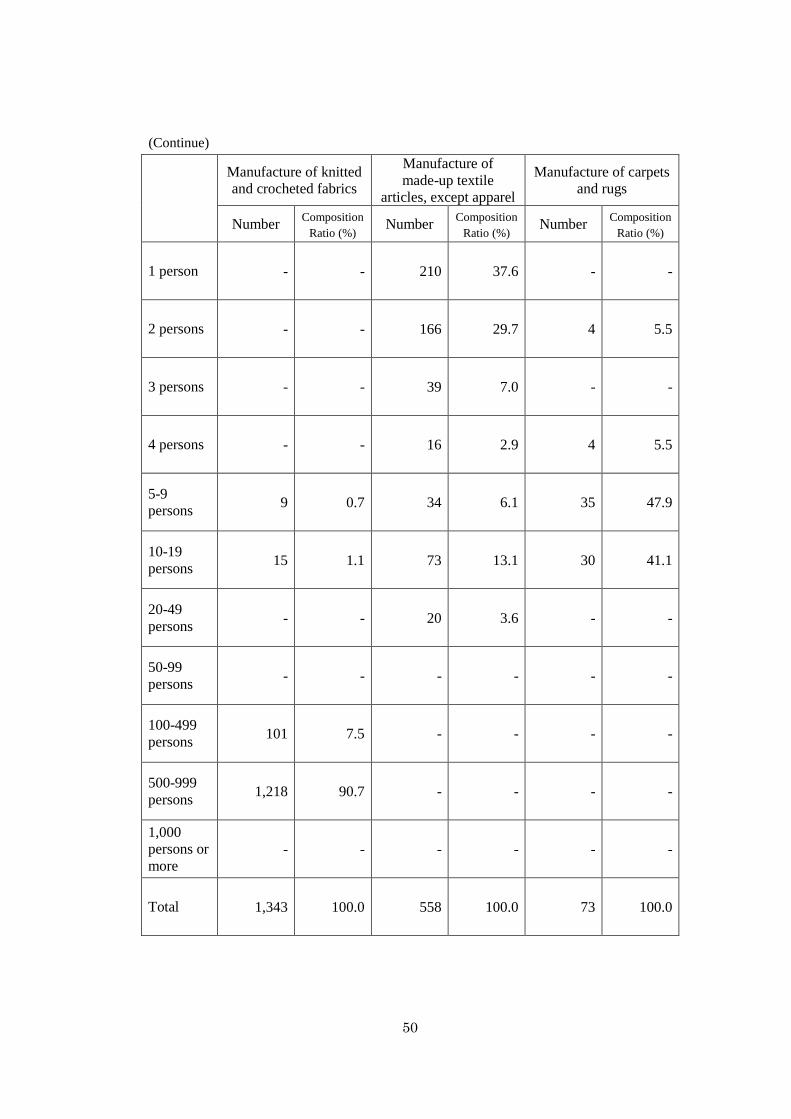
50
(Continue)
Manufacture of knitted
and crocheted fabrics
Manufacture of
made-up textile
articles, except apparel
Manufacture of carpets
and rugs
Number Composition
Ratio (%) Number
Composition
Ratio (%) Number
Composition
Ratio (%)
1 person - - 210 37.6 - -
2 persons - - 166 29.7 4 5.5
3 persons - - 39 7.0 - -
4 persons - - 16 2.9 4 5.5
5-9
persons 9 0.7 34 6.1 35 47.9
10-19
persons 15 1.1 73 13.1 30 41.1
20-49
persons - - 20 3.6 - -
50-99
persons - - - - - -
100-499
persons 101 7.5 - - - -
500-999
persons 1,218 90.7 - - - -
1,000
persons or
more - - - - - -
Total 1,343 100.0 558 100.0 73 100.0

51
(Continue)
Manufacture of
cordage, rope, twine
and netting
Manufacture of other
textiles n.e.c.
Total of Textile
Industry
Number Composition
Ratio (%) Number
Composition
Ratio (%) Number
Composition
Ratio (%)
1 person 14 20.3 4 4.9 4,355 11.2
2 persons 8 11.6 10 12.2 6,334 16.2
3 persons - - 6 7.3 2,502 6.4
4 persons - - 4 4.9 1,032 2.6
5-9
persons 47 68.1 - - 938 2.4
10-19
persons - - - - 725 1.9
20-49
persons - - - - 1,717 4.4
50-99
persons - - 58 70.7 1,231 3.2
100-499
persons - - - - 2,946 7.5
500-999
persons - - - - 3,791 9.7
1,000
persons or
more - - - - 13,470 34.5
Total 69 100.0 82 100.0 39,041 100.0

52
Table 3-2-3 Number of Persons engaged in Textile Industry by Ownership (Legal
Status)
Number of
persons
engaged
Composition
Ratio (%)
Number of
persons
engaged per
establishment
(Number of
applicable
establishment)
Individual proprietor (with
no registration) 19,059 48.8 2.2 8,860
Sole proprietor (with
registration) 10,243 26.2 341.4 30
General partnership 43 0.1 21.5 2
Limited partnership 20 0.1 20 1
Private limited company 5,833 14.9 277.8 21
Public limited company - - - -
Subsidiary of a foreign
company - - - -
Branch of a foreign
company 3,806 9.7 1,903.0 2
Commercial representative
office of a foreign company - - - -
Cooperative - - - -
State-owned organization - - - -
NGO 37 0.1 12.3 3
Others - - - -
Total (Textile Industry ) 39,041 100.0 4.4 8,919

53
3-3 Number of persons engaged by type of sex
Although the share of persons engaged of female exceeds that of male in
Cambodia, coverage of female is 81.5% and larger in textile industry, and there are
no huge difference of female coverage between class of ISIC in this industry except
Manufacture of carpets and rugs with 73 persons engaged.
(See Figure 3-3-1, Table3-3-1, Figure 3-3-2 and Table3-3-2)
Compared with the whole industry and manufacturing industry, shares of
female in each type of employee are large in textile industry.
(See Table3-3-3)
Figure3-3-1 Composition Ratio of Persons engaged by Type of Sex
Table 3-3-1 Number of Persons engaged by Type of Sex
Male Female Total
Number Composition
Ratio (%) Number
Composition
Ratio (%) Number
Composition
Ratio (%)
All Industry 649,358 38.8 1,024,032 61.2 1,673,390 100.0
Manufacturing
Industry 141,755 26.7 388,586 73.3 530,341 100.0
Textile
Industry 7,219 18.5 31,822 81.5 39,041 100.0
38.8%
26.7%
18.5%
61.2%
73.3%
81.5%
0% 20% 40% 60% 80% 100%
All Industry
Manufacturing Industry
Textile Industry
Male Female

54
Figure3-3-2 Composition Ratio of Persons engaged in Textile Industry by Type of
Sex and by Class of ISIC
18.5%
25.8%
19.1%
11.6%
26.6%
11.5%
75.3%
26.1%
18.3%
81.5%
74.2%
80.9%
88.4%
73.4%
88.5%
24.7%
73.9%
81.7%
0% 20% 40% 60% 80% 100%
Textile Industry
Preparation and spinning of textile fibers
Weaving of textiles
Finishing of textiles
Manufacture of knitted and crocheted fabrics
Manufacture of made-up textile articles, except apparel
Manufacture of carpets and rugs
Manufacture of cordage, rope, twine and netting
Manufacture of other textiles n.e.c.
Male Female
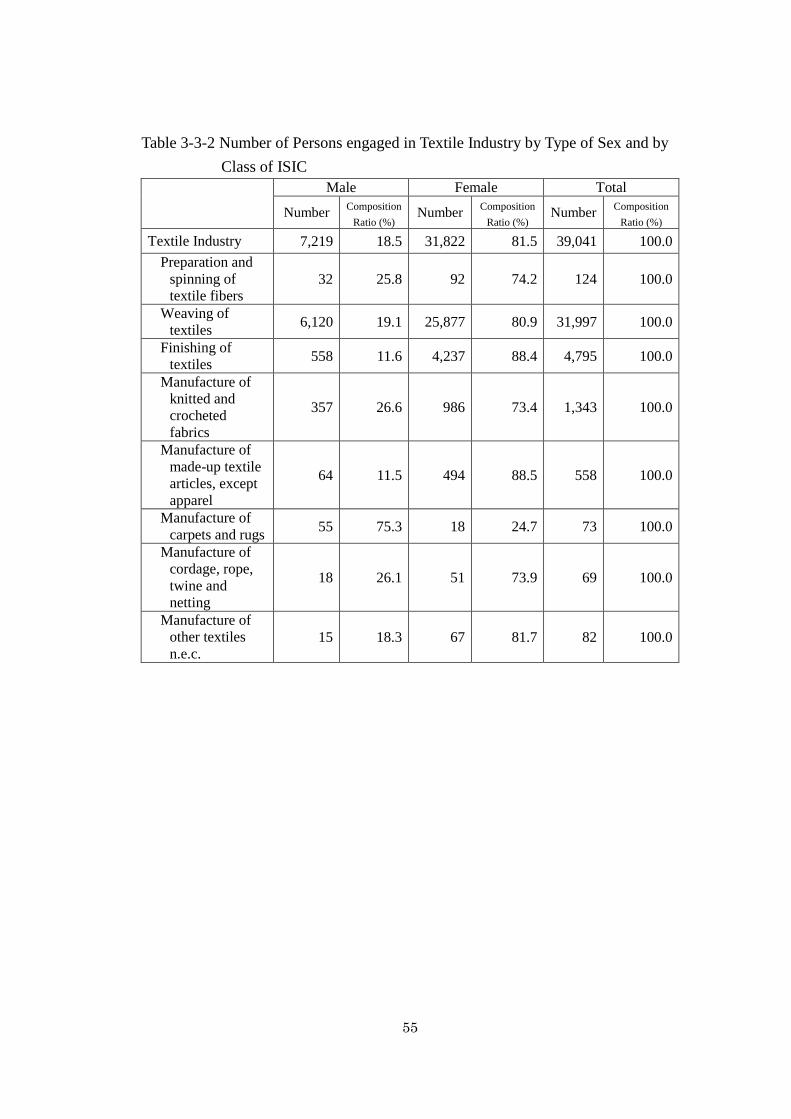
55
Table 3-3-2 Number of Persons engaged in Textile Industry by Type of Sex and by
Class of ISIC
Male Female Total
Number Composition
Ratio (%) Number
Composition
Ratio (%) Number
Composition
Ratio (%)
Textile Industry 7,219 18.5 31,822 81.5 39,041 100.0
Preparation and
spinning of
textile fibers 32 25.8 92 74.2 124 100.0
Weaving of
textiles 6,120 19.1 25,877 80.9 31,997 100.0
Finishing of
textiles 558 11.6 4,237 88.4 4,795 100.0
Manufacture of
knitted and
crocheted
fabrics
357 26.6 986 73.4 1,343 100.0
Manufacture of
made-up textile
articles, except
apparel
64 11.5 494 88.5 558 100.0
Manufacture of
carpets and rugs 55 75.3 18 24.7 73 100.0
Manufacture of
cordage, rope,
twine and
netting
18 26.1 51 73.9 69 100.0
Manufacture of
other textiles
n.e.c. 15 18.3 67 81.7 82 100.0
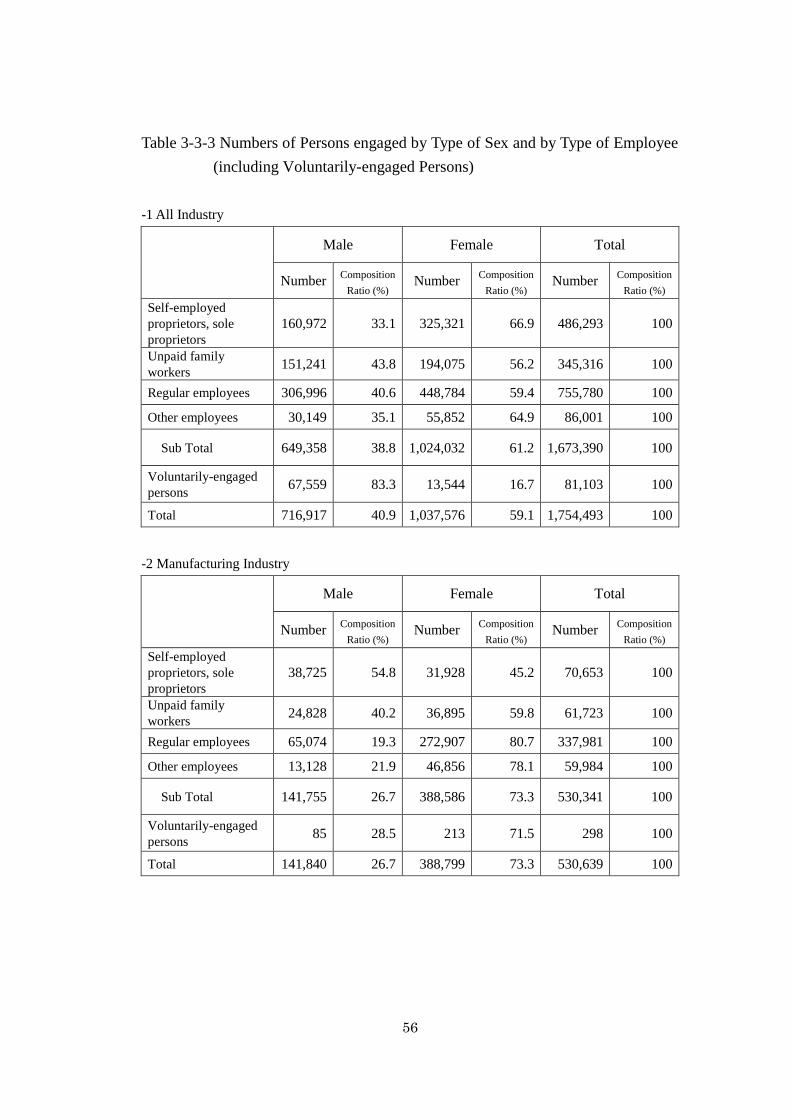
56
Table 3-3-3 Numbers of Persons engaged by Type of Sex and by Type of Employee
(including Voluntarily-engaged Persons)
-1 All Industry
Male Female Total
Number Composition
Ratio (%) Number
Composition
Ratio (%) Number
Composition
Ratio (%)
Self-employed
proprietors, sole
proprietors
160,972 33.1 325,321 66.9 486,293 100
Unpaid family
workers 151,241 43.8 194,075 56.2 345,316 100
Regular employees 306,996 40.6 448,784 59.4 755,780 100
Other employees 30,149 35.1 55,852 64.9 86,001 100
Sub Total 649,358 38.8 1,024,032 61.2 1,673,390 100
Voluntarily-engaged
persons 67,559 83.3 13,544 16.7 81,103 100
Total 716,917 40.9 1,037,576 59.1 1,754,493 100
-2 Manufacturing Industry
Male Female Total
Number Composition
Ratio (%) Number
Composition
Ratio (%) Number
Composition
Ratio (%)
Self-employed
proprietors, sole
proprietors
38,725 54.8 31,928 45.2 70,653 100
Unpaid family
workers 24,828 40.2 36,895 59.8 61,723 100
Regular employees 65,074 19.3 272,907 80.7 337,981 100
Other employees 13,128 21.9 46,856 78.1 59,984 100
Sub Total 141,755 26.7 388,586 73.3 530,341 100
Voluntarily-engaged
persons 85 28.5 213 71.5 298 100
Total 141,840 26.7 388,799 73.3 530,639 100

57
-3 Textile Industry
Male Female Total
Number Composition
Ratio (%) Number
Composition
Ratio (%) Number
Composition
Ratio (%)
Self-employed
proprietors, sole
proprietors
774 8.8 8,040 91.2 8,814 100
Unpaid family
workers 2,002 34.2 3,846 65.8 5,848 100
Regular employees 3,707 19.8 15,049 80.2 18,756 100
Other employees 736 13.1 4,887 86.9 5,623 100
Sub Total 7,219 18.5 31,822 81.5 39,041 100
Voluntarily-engaged
persons - - 1 100 1 100
Total 7,219 18.5 31,822 81.5 39,042 100

58
3-4 Number of persons engaged by type of employee
In textile industry, share of regular employee is approximately a half and
large. This ratio is larger than that of the whole industry but smaller than that of
manufacturing industry. Composition of type of employee in textile industry is not
similar to manufacturing industry but the whole industry.
(See Figure3-4 and Table3-4-1)
Number of Self-employed proprietors, sole proprietors and Unpaid family
workers are large in Individual proprietor (with no registration), 8,795 and 5,841
respectively, and number of regular employee is large in Sole proprietor (with
registration) and Private limited company, 10,161 and 5,518 respectively.
(See Table3-4-2)
Figure3-4 Composition Ratio of Persons engaged by Type of Employee
27.7%
13.3%
22.6%
19.7%
11.6%
15.0%
43.1%
63.7%
48.0%
4.9%
11.3%
14.4%
4.6%
0.1%
0.0%
0% 20% 40% 60% 80% 100%
All Industry
Manufacturing Industry
Textile Industry
Self-employed proprietors, sole proprietorsUnpaid family workersRegular employeesOther employeesVoluntarily-engaged persons

59
Table3-4-1 Numbers of Persons engaged by Type of Employee (including
Voluntarily-engaged Persons)
All Industry Manufacturing
Industry Textile Industry
Number Composition
Ratio (%) Number
Composition
Ratio (%) Number
Composition
Ratio (%)
Self-employed
proprietors, sole
proprietors 486,293 27.7 70,653 13.3 8,814 22.6
Unpaid family
workers 345,316 19.7 61,723 11.6 5,848 15.0
Regular
employees 755,780 43.1 337,981 63.7 18,756 48.0
Other
employees 86,001 4.9 59,984 11.3 5,623 14.4
Sub Total 1,673,390 95.4 530,341 99.9 39,041 100.0
Voluntarily
-engaged
persons 81,103 4.6 298 0.1 1 0.0
Total 1,754,493 100.0 530,639 100.0 39,042 100.0
Table3-4-2 Numbers of Persons engaged in Textile Industry by Type of Employee
and by Ownership (Legal Status)
-1 by type of proprietor
Individual proprietor
(with no registration)
Sole proprietor (with
registration) Total
Number Composition
Ratio (%) Number
Composition
Ratio (%) Number
Composition
Ratio (%)
Self-employed
proprietors, sole
proprietors
8,795 46.1 18 0.2 8,813 30.1
Unpaid family
workers 5,841 30.6 7 0.1 5,848 20.0
Regular employees 2,941 15.4 10,161 99.2 13,102 44.7
Other employees 1,482 7.8 57 0.6 1,539 5.3
Voluntarily-engaged
persons 1 0.0 - - 1 0.0
Total 19,060 100.0 10,243 100.0 29,303 100.0

60
-2 by type of partnership
General partnership Limited partnership Total
Number Composition
Ratio (%) Number
Composition
Ratio (%) Number
Composition
Ratio (%)
Self-employed
proprietors, sole
proprietors
- - - - - -
Unpaid family
workers - - - - - -
Regular employees 14 32.6 20 100.0 34 54.0
Other employees 29 67.4 - - 29 46.0
Voluntarily-engaged
persons - - - - - -
Total 43 100.0 20 100.0 63 100.0
-3 by type of limited company
Private limited
company Total
Number Composition
Ratio (%) Number
Composition
Ratio (%)
Self-employed
proprietors, sole
proprietors
- - - -
Unpaid family
workers - - - -
Regular employees 5,518 94.6 5,518 94.6
Other employees 315 5.4 315 5.4
Voluntarily-engaged
persons - - - -
Total 5,833 100.0 5,833 100.0
(note) In textile industry, number of persons engaged in Public limited company is
nothing, and then omitting in this table.

61
-4 by type of foreign company
Branch of a foreign
company Total
Number Composition
Ratio (%) Number
Composition
Ratio (%)
Self-
employed proprietors,
sole proprietors
- - - -
Unpaid family
workers - - - -
Regular employees 66 1.7 66 1.7
Other employees 3,740 98.3 3,740 98.3
Voluntarily-engaged
persons - - - -
Total 3,806 100.0 3,806 100.0
(note) In textile industry, number of persons engaged in Subsidiary of a foreign
company and Commercial representative office of a foreign company are nothing, and
then omitting in this table.
-5 by type of other legal status
NGO Total
Number Composition
Ratio (%) Number
Composition
Ratio (%)
Self-employed
proprietors, sole
proprietors
1 2.7 1 2.7
Unpaid family
workers - - - -
Regular employees 36 97.3 36 97.3
Other employees - - - -
Voluntarily-engaged
persons - - - -
Total 37 100.0 37 100.0
(note) In textile industry, number of persons engaged in Cooperative, State-owned organization
and others are nothing, and then omitting in this table.
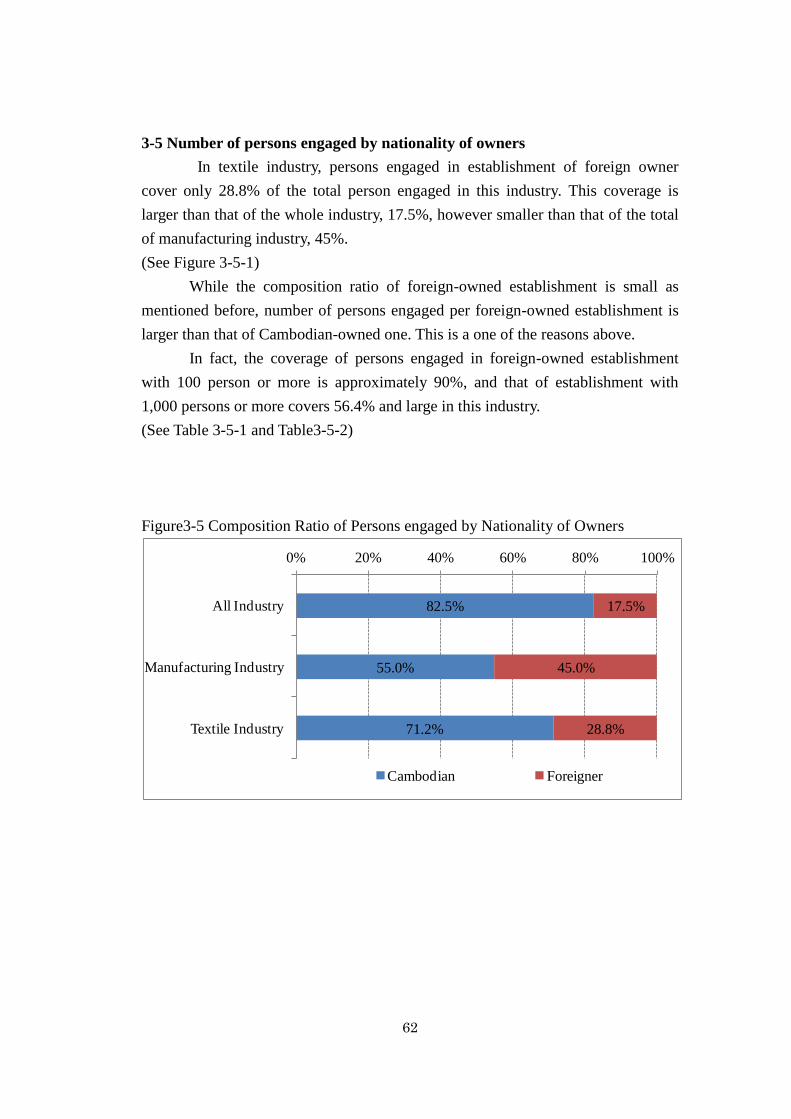
62
3-5 Number of persons engaged by nationality of owners
In textile industry, persons engaged in establishment of foreign owner
cover only 28.8% of the total person engaged in this industry. This coverage is
larger than that of the whole industry, 17.5%, however smaller than that of the total
of manufacturing industry, 45%.
(See Figure 3-5-1)
While the composition ratio of foreign-owned establishment is small as
mentioned before, number of persons engaged per foreign-owned establishment is
larger than that of Cambodian-owned one. This is a one of the reasons above.
In fact, the coverage of persons engaged in foreign-owned establishment
with 100 person or more is approximately 90%, and that of establishment with
1,000 persons or more covers 56.4% and large in this industry.
(See Table 3-5-1 and Table3-5-2)
Figure3-5 Composition Ratio of Persons engaged by Nationality of Owners
82.5%
55.0%
71.2%
17.5%
45.0%
28.8%
0% 20% 40% 60% 80% 100%
All Industry
Manufacturing Industry
Textile Industry
Cambodian Foreigner
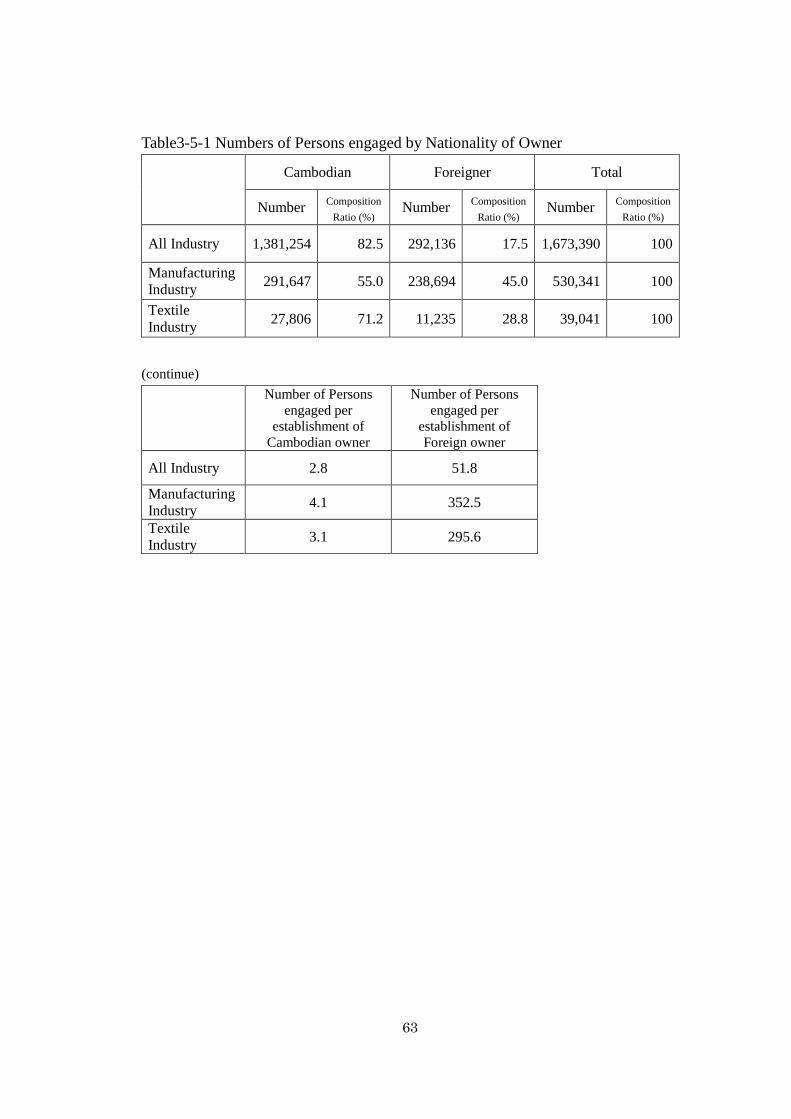
63
Table3-5-1 Numbers of Persons engaged by Nationality of Owner
Cambodian Foreigner Total
Number Composition
Ratio (%) Number
Composition
Ratio (%) Number
Composition
Ratio (%)
All Industry 1,381,254 82.5 292,136 17.5 1,673,390 100
Manufacturing
Industry 291,647 55.0 238,694 45.0 530,341 100
Textile
Industry 27,806 71.2 11,235 28.8 39,041 100
(continue)
Number of Persons
engaged per
establishment of
Cambodian owner
Number of Persons
engaged per
establishment of
Foreign owner
All Industry 2.8 51.8
Manufacturing
Industry 4.1 352.5
Textile
Industry 3.1 295.6

64
Table 3-5-2 Number of persons engaged in Textile Industry by Size of Person
engaged and by Nationality of Owners
-1 All Industry
Cambodian Foreigner Total
Number Composition
Ratio (%) Number
Composition
Ratio (%) Number
Composition
Ratio (%)
1 person 220,596 16.0 1,571 0.5 222,167 13.3
2 persons 349,774 25.3 2,654 0.9 352,428 21.1
3 persons 137,547 10.0 1,593 0.5 139,140 8.3
4 persons 81,968 5.9 1,540 0.5 83,508 5.0
5-9
persons 158,402 11.5 4,885 1.7 163,287 9.8
10-19
persons 101,248 7.3 4,623 1.6 105,871 6.3
20-49
persons 91,620 6.6 7,851 2.7 99,471 5.9
50-99
persons 46,404 3.4 8,875 3.0 55,279 3.3
100-499
persons 67,020 4.9 43,218 14.8 110,238 6.6
500-999
persons 40,272 2.9 46,634 16.0 86,906 5.2
1,000
persons
or more 86,403 6.3 168,692 57.7 255,095 15.2
Total 1,381,254 100 292,136 100 1,673,390 100

65
-2 Manufacturing
Cambodian Foreigner Total
Number Composition
Ratio (%) Number
Composition
Ratio (%) Number
Composition
Ratio (%)
1 person 23,812 8.2 65 0.0 23,877 4.5
2 persons 57,248 19.6 170 0.1 57,418 10.8
3 persons 25,473 8.7 153 0.1 25,626 4.8
4 persons 15,844 5.4 108 0.0 15,952 3.0
5-9
persons 25,642 8.8 309 0.1 25,951 4.9
10-19
persons 12,468 4.3 437 0.2 12,905 2.4
20-49
persons 11,483 3.9 1,391 0.6 12,874 2.4
50-99
persons 6,384 2.2 4,375 1.8 10,759 2.0%
100-499
persons 16,713 5.7 33,646 14.1 50,359 9.5
500-999
persons 23,420 8.0 41,997 17.6 65,417 12.3
1,000
persons
or more 73,160 25.1 156,043 65.4 229,203 43.2
Total 291,647 100 238,694 100 530,341 100

66
-3 Textile Industry
Cambodian Foreigner Total
Number Composition
Ratio (%) Number
Composition
Ratio (%) Number
Composition
Ratio (%)
1 person 4,354 15.7 1 0.0 4,355 11.2
2 persons 6,334 22.8 - - 6,334 16.2
3 persons 2,496 9.0 6 0.1 2,502 6.4
4 persons 1,024 3.7 8 0.1 1,032 2.6
5-9
persons 930 3.3 8 0.1 938 2.4
10-19
persons 654 2.4 71 0.6 725 1.9
20-49
persons 1,522 5.5 195 1.7 1,717 4.4
50-99
persons 550 2.0 681 6.1 1,231 3.2
100-499
persons 1,355 4.9 1,591 14.2 2,946 7.5
500-999
persons 1,453 5.2 2,338 20.8 3,791 9.7
1,000
persons
or more 7,134 25.7 6,336 56.4 13,470 34.5
Total 27,806 100 11,235 100 39,041 100

67
3-6 Number of persons engaged by type of units
As mentioned before, the number of establishments typed as head office is
not reported in EC2011, and branch office is few in number. Despite this, share of
person engaged in branch office accounts for 34.4% of the total number of persons
engaged in textile industry. One of the reasons is as follows: number of persons
engaged in foreign-branch office is large as mentioned before. In fact, the number
of persons engaged in branch office with 1,000 persons or more is 10,348 and large.
(See Figure3-6, Table 3-6-1 and Table3-6-2)
Figure3-6 Composition Ratio of Persons engaged by Type of Units
Table3-6-1 Numbers of Persons engaged by Type of Units
All Industry Manufacturing
Industry Textile Industry
Number Composition
Ratio (%) Number
Composition
Ratio (%) Number
Composition
Ratio (%)
Single Unit 1,420,346 84.9 393,755 74.2 25,623 65.6
Head Office 57,428 3.4 28,338 5.3 - -
Branch Office 195,616 11.7 108,248 20.4 13,418 34.4
Total 1,673,390 100 530,341 100 39,041 100
84.9%
74.2%
65.6%
3.4%
5.3%
-
11.7%
20.4%
34.4%
0% 20% 40% 60% 80% 100%
All Industry
Manufacturing Industry
Textile Industry
Single Unit Head Office Branch Office
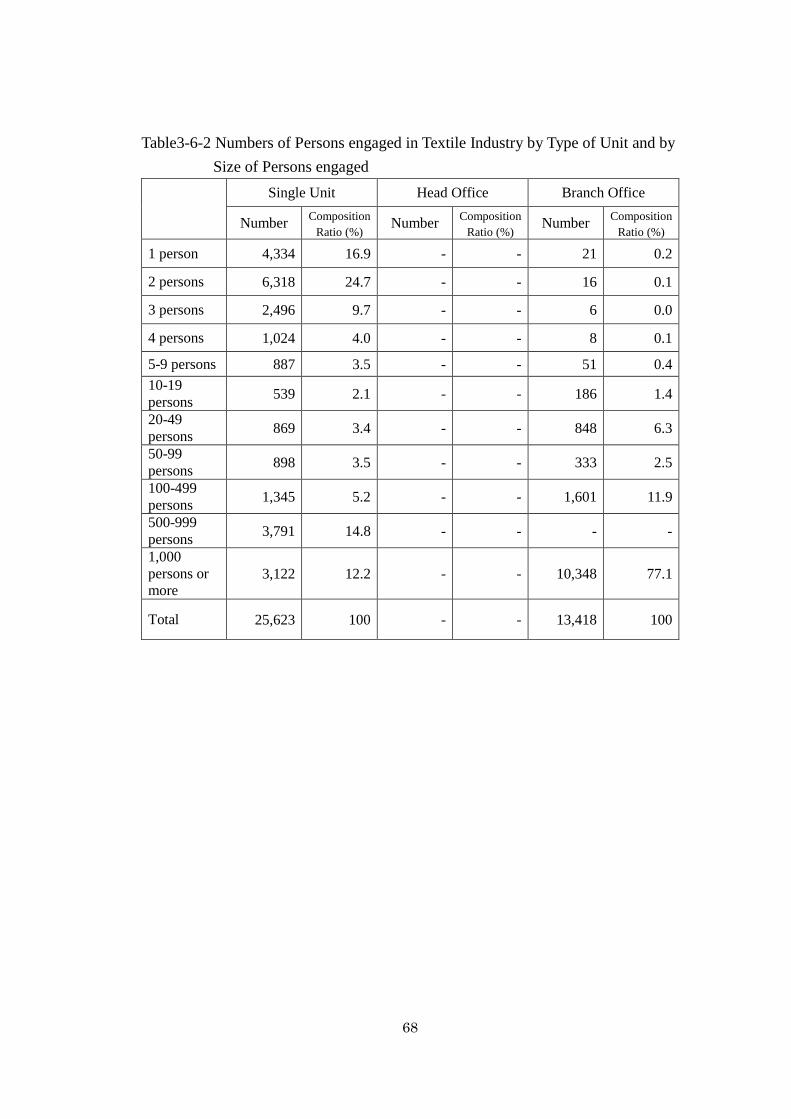
68
Table3-6-2 Numbers of Persons engaged in Textile Industry by Type of Unit and by
Size of Persons engaged
Single Unit Head Office Branch Office
Number Composition
Ratio (%) Number
Composition
Ratio (%) Number
Composition
Ratio (%)
1 person 4,334 16.9 - - 21 0.2
2 persons 6,318 24.7 - - 16 0.1
3 persons 2,496 9.7 - - 6 0.0
4 persons 1,024 4.0 - - 8 0.1
5-9 persons 887 3.5 - - 51 0.4
10-19
persons 539 2.1 - - 186 1.4
20-49
persons 869 3.4 - - 848 6.3
50-99
persons 898 3.5 - - 333 2.5
100-499
persons 1,345 5.2 - - 1,601 11.9
500-999
persons 3,791 14.8 - - - -
1,000
persons or
more 3,122 12.2 - - 10,348 77.1
Total 25,623 100 - - 13,418 100
69
3-7 Number of persons engaged by year of starting business
In textile industry, approximately 70% of the persons engaged belong to
young establishments which start the business among first decades of the year
2000.
In the light of changing number of person engaged per establishment by
year, it is proper to say that establishments in textile industry did not develop
gradually but larger establishment appeared and stood year by year: the old
establishments remain running with a (few) person(s) engaged, and young
establishments start their business with a lot of persons engaged, especially in
foreign-owned one.
(See Table3-7-1 and Table3-7-2)
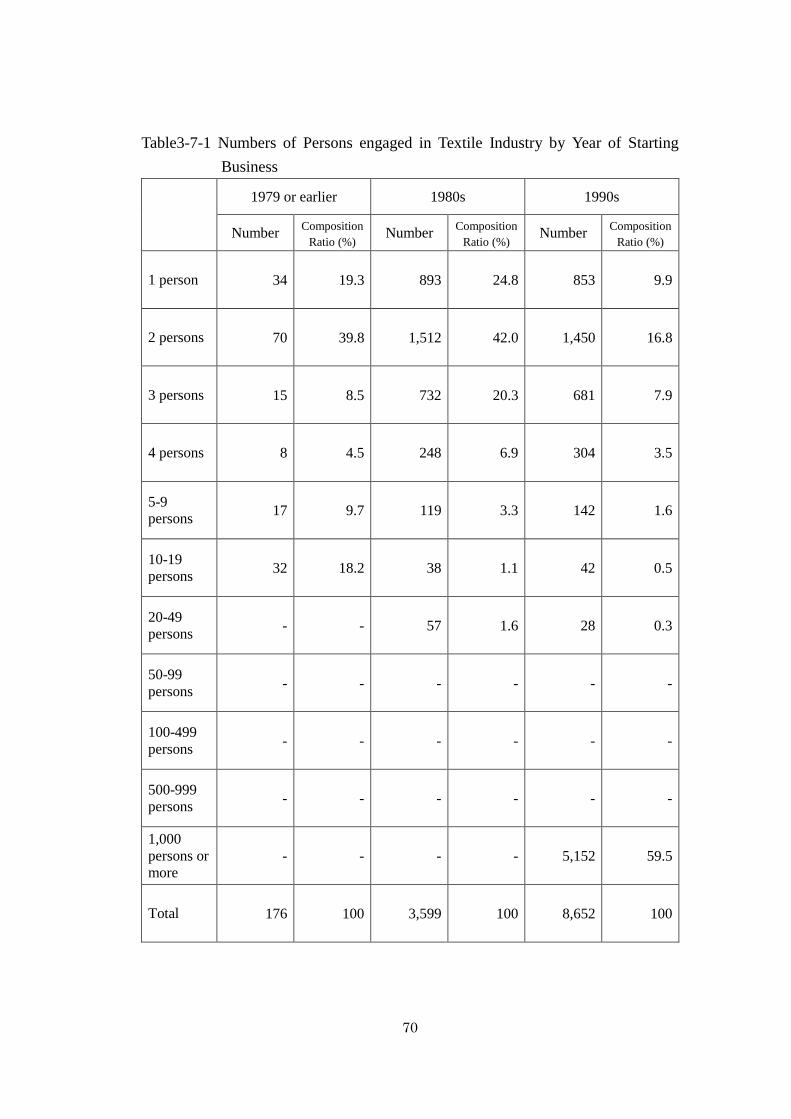
70
Table3-7-1 Numbers of Persons engaged in Textile Industry by Year of Starting
Business
1979 or earlier 1980s 1990s
Number Composition
Ratio (%) Number
Composition
Ratio (%) Number
Composition
Ratio (%)
1 person 34 19.3 893 24.8 853 9.9
2 persons 70 39.8 1,512 42.0 1,450 16.8
3 persons 15 8.5 732 20.3 681 7.9
4 persons 8 4.5 248 6.9 304 3.5
5-9
persons 17 9.7 119 3.3 142 1.6
10-19
persons 32 18.2 38 1.1 42 0.5
20-49
persons - - 57 1.6 28 0.3
50-99
persons - - - - - -
100-499
persons - - - - - -
500-999
persons - - - - - -
1,000
persons or
more - - - - 5,152 59.5
Total 176 100 3,599 100 8,652 100

71
(continue)
2000-2004 2005-2010 2011
Number Composition
Ratio (%) Number
Composition
Ratio (%) Number
Composition
Ratio (%)
1 person 805 8.0 1,637 11.0 78 4.9
2 persons 1,204 12.0 2,038 13.7 26 1.6
3 persons 378 3.8 672 4.5 6 0.4
4 persons 168 1.7 292 2.0 8 0.5
5-9
persons 213 2.1 405 2.7 42 2.6
10-19
persons 67 0.7 425 2.9 109 6.9
20-49
persons 197 2.0 1,128 7.6 276 17.4
50-99
persons 189 1.9 1,042 7.0 - -
100-499
persons 384 3.8 2,237 15.0 325 20.5
500-999
persons 1,202 12.0 1,872 12.6 717 45.2
1,000
persons or
more 5,196 51.9 3,122 21.0 - -
Total 10,003 100.0 14,870 100.0 1,587 100.0
(Note) Excluding “unknown” (in total 154).
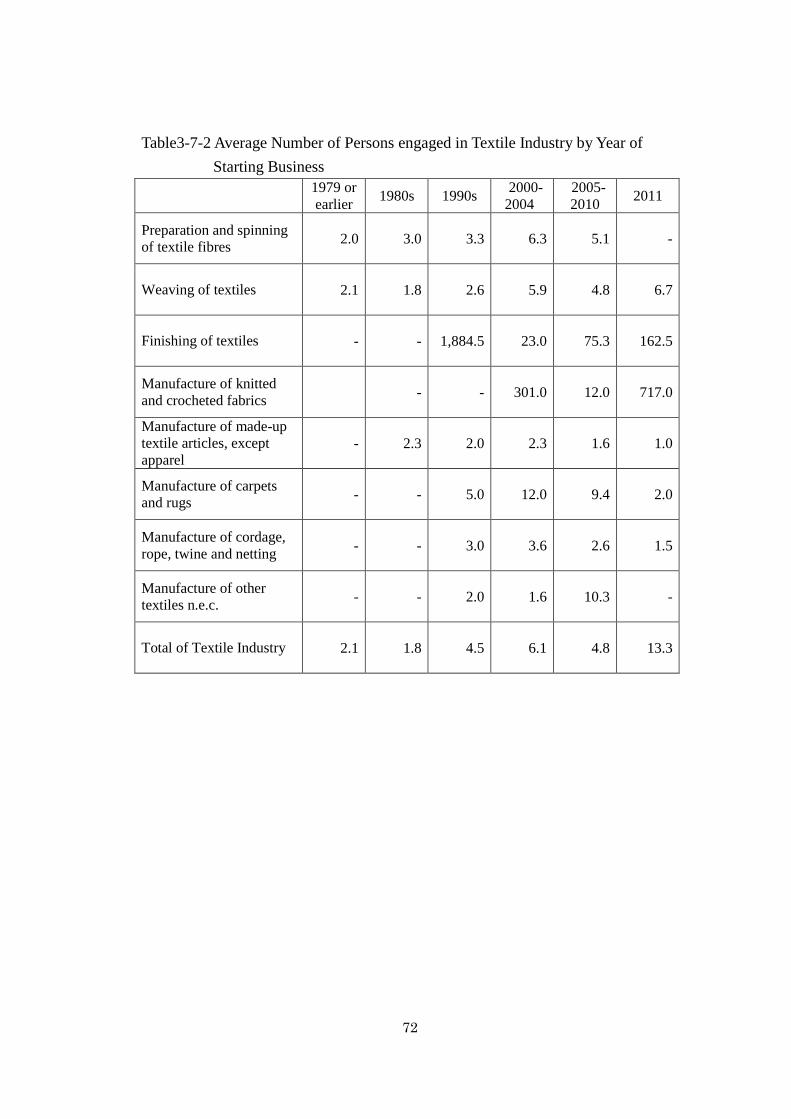
72
Table3-7-2 Average Number of Persons engaged in Textile Industry by Year of
Starting Business
1979 or
earlier 1980s 1990s
2000-
2004
2005-
2010 2011
Preparation and spinning
of textile fibres 2.0 3.0 3.3 6.3 5.1 -
Weaving of textiles 2.1 1.8 2.6 5.9 4.8 6.7
Finishing of textiles - - 1,884.5 23.0 75.3 162.5
Manufacture of knitted
and crocheted fabrics - - 301.0 12.0 717.0
Manufacture of made-up
textile articles, except
apparel - 2.3 2.0 2.3 1.6 1.0
Manufacture of carpets
and rugs - - 5.0 12.0 9.4 2.0
Manufacture of cordage,
rope, twine and netting - - 3.0 3.6 2.6 1.5
Manufacture of other
textiles n.e.c. - - 2.0 1.6 10.3 -
Total of Textile Industry 2.1 1.8 4.5 6.1 4.8 13.3

73
Chapter 4 Province
4-1 Number of establishments by province
Generally speaking, establishments in Cambodia stand across the country
and tend to concentrate in Phnom Penh, the capital of Cambodia and demographic
and economically big city. However, they in textile industry gather excessively in
Takeo. The number of establishments standing at Takeo is 5,872 and it accounts for
65.8% of the total number of establishments in textile industry. Takeo is the mecca
of textile industry, especially Weaving of textiles gathering 68.7% of the total its
number of establishments.
On the other hand, establishments in textile industry do not exist in Koh
Kong, Kratie, Mondul Kiri, Preah Vihear, Stung Treng, Otdar Meanchey, Kep and
Pailin. That is why establishments are mal-distributed in textile industry.
(See Table4-1-1 and Table4-1-2)

74
Table4-1-1 Number of Establishments by Province
All Industry Manufacturing
Industry Textile Industry
Number Composition
Ratio (%) Number
Composition
Ratio (%) Number
Composition
Ratio (%)
Banteay
Meanchey 21,541 4.3 2,664 3.7 6 0.1
Battambang 34,097 6.8 2,913 4.1 3 0.0
Kampong
Cham 56,263 11.1 7,403 10.4 730 8.2
Kampong
Chhnang 19,690 3.9 5,560 7.8 10 0.1
Kampong
Speu 22,541 4.5 6,003 8.4 12 0.1
Kampong
Thom 22,284 4.4 4,120 5.8 8 0.1
Kampot 17,042 3.4 1,499 2.1 1 0.0
Kandal 40,531 8.0 5,314 7.4 575 6.4
Koh Kong 5,051 1.0 241 0.3 - -
Kratie 11,046 2.2 1,029 1.4 - -
Mondul
Kiri 2,222 0.4 131 0.2 - -
Phnom
Penh 95,848 19.0 8,705 12.2 1,240 13.9
Preah
Vihear 5,317 1.1 1,432 2.0 - -
Prey Veng 29,933 5.9 4,475 6.3 436 4.9
Pursat 12,075 2.4 1,489 2.1 1 0.0
Ratanak Kiri 5,480 1.1 415 0.6 3 0.0
Siem Reap 32,120 6.4 3,570 5.0 17 0.2
Preah
Sihanouk 10,728 2.1 726 1.0 2 0.0
Stung
Treng 4,665 0.9 749 1.0 - -
Svay Rieng 15,245 3.0 2,391 3.3 3 0.0
Takeo 31,997 6.3 9,879 13.8 5,872 65.8
Otdar
Meanchey 4,912 1.0 367 0.5 - -
Kep 1,635 0.3 144 0.2 - -
Pailin 2,871 0.6 197 0.3 - -
Total 505,134 100.0 71,416 100.0 8,919 100.0

75
Table4-1-2 Number of Establishments in Textile Industry by Province by Class of
ISIC
Preparation and
spinning of textile fibres Weaving of textiles Finishing of textiles
Number Composition
Ratio (%) Number
Composition
Ratio (%) Number
Composition
Ratio (%)
Banteay
Meanchey 2 7.7 1 0.0 - -
Battambang 1 3.8 - - - -
Kampong
Cham 7 26.9 715 8.4 4 28.6
Kampong
Chhnang - - 8 0.1 1 14.3
Kampong
Speu - - 11 0.1 - -
Kampong
Thom - - 5 0.1 - -
Kampot - - 1 0.0 - -
Kandal - - 251 3.0 4 28.6
Koh Kong - - - - - -
Kratie - - - - - -
Mondul
Kiri - - - - - -
Phnom
Penh 5 19.2 1,213 14.3 4 28.6
Preah
Vihear - - - - - -
Prey Veng - - 436 5.1 - -
Pursat - - 1 0.0 - -
Ratanak Kiri - - 3 0.0 - -
Siem Reap - - 17 0.2 - -
Preah
Sihanouk - - 1 0.0 1 0.0
Stung
Treng - - - - - -
Svay Rieng - - 2 0.0 - -
Takeo 11 42.3 5,839 68.7 - -
Otdar
Meanchey - - - - - -
Kep - - - - - -
Pailin - - - - - -
Total 26 100.0 8,504 100.0 14 100.0

76
(continue)
Manufacture
of knitted
and crocheted fabrics
Manufacture of
made-up textile articles,
except apparel
Manufacture of carpets
and rugs
Number Composition
Ratio (%) Number
Composition
Ratio (%) Number
Composition
Ratio (%)
Banteay
Meanchey - - - - - -
Battambang - - - - 1 10.0
Kampong
Cham - - 2 0.6 - -
Kampong
Chhnang - - - - - -
Kampong
Speu 1 20.0 - - - -
Kampong
Thom - - 2 0.6 - -
Kampot - - - - - -
Kandal 1 20.0 312 96.9 - -
Koh Kong - - - - - -
Kratie - - - - - -
Mondul
Kiri - - - - - -
Phnom
Penh 3 60.0 6 1.9 5 50.0
Preah
Vihear - - - - - -
Prey Veng - - - - - -
Pursat - - - - - -
Ratanak Kiri - - - - - -
Siem Reap - - - - - -
Preah
Sihanouk - - - - - -
Stung
Treng - - - - - -
Svay Rieng - - - - 1 10.0
Takeo - - - - 3 30.0
Otdar
Meanchey - - - - - -
Kep - - - - - -
Pailin - - - - - -
Total 5 100.0 322 100.0 10 100.0
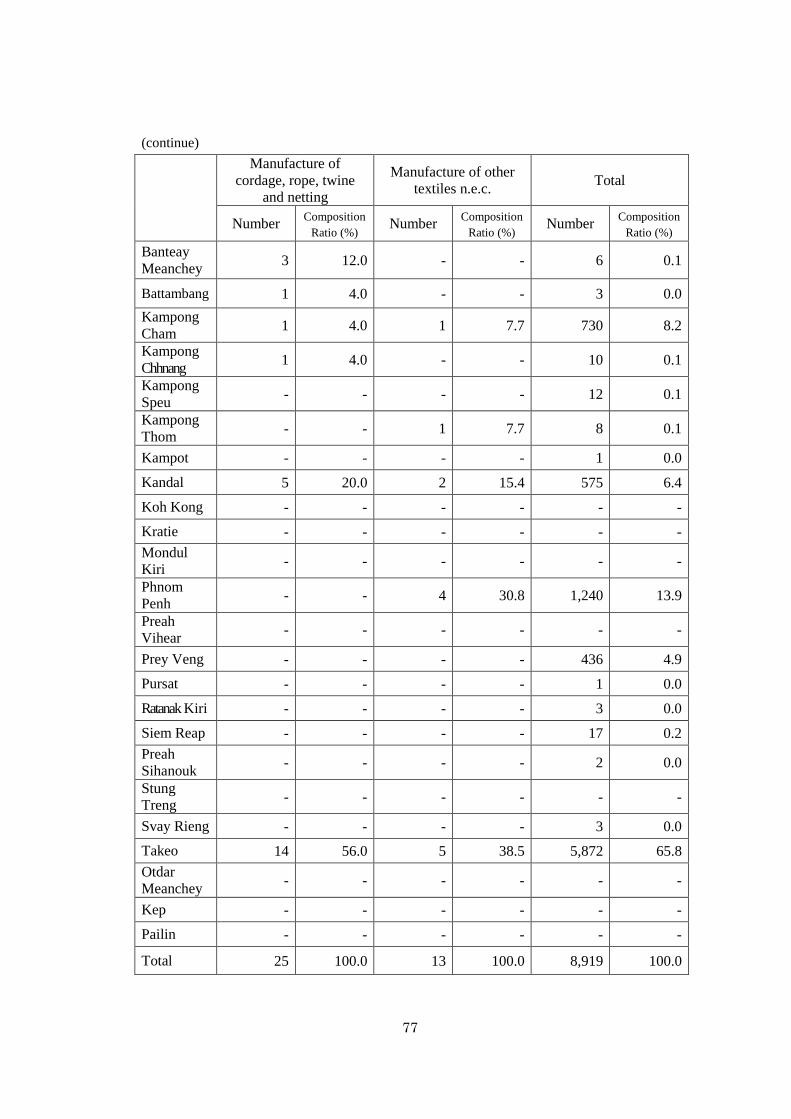
77
(continue)
Manufacture of
cordage, rope, twine
and netting
Manufacture of other
textiles n.e.c. Total
Number Composition
Ratio (%) Number
Composition
Ratio (%) Number
Composition
Ratio (%)
Banteay
Meanchey 3 12.0 - - 6 0.1
Battambang 1 4.0 - - 3 0.0
Kampong
Cham 1 4.0 1 7.7 730 8.2
Kampong
Chhnang 1 4.0 - - 10 0.1
Kampong
Speu - - - - 12 0.1
Kampong
Thom - - 1 7.7 8 0.1
Kampot - - - - 1 0.0
Kandal 5 20.0 2 15.4 575 6.4
Koh Kong - - - - - -
Kratie - - - - - -
Mondul
Kiri - - - - - -
Phnom
Penh - - 4 30.8 1,240 13.9
Preah
Vihear - - - - - -
Prey Veng - - - - 436 4.9
Pursat - - - - 1 0.0
Ratanak Kiri - - - - 3 0.0
Siem Reap - - - - 17 0.2
Preah
Sihanouk - - - - 2 0.0
Stung
Treng - - - - - -
Svay Rieng - - - - 3 0.0
Takeo 14 56.0 5 38.5 5,872 65.8
Otdar
Meanchey - - - - - -
Kep - - - - - -
Pailin - - - - - -
Total 25 100.0 13 100.0 8,919 100.0
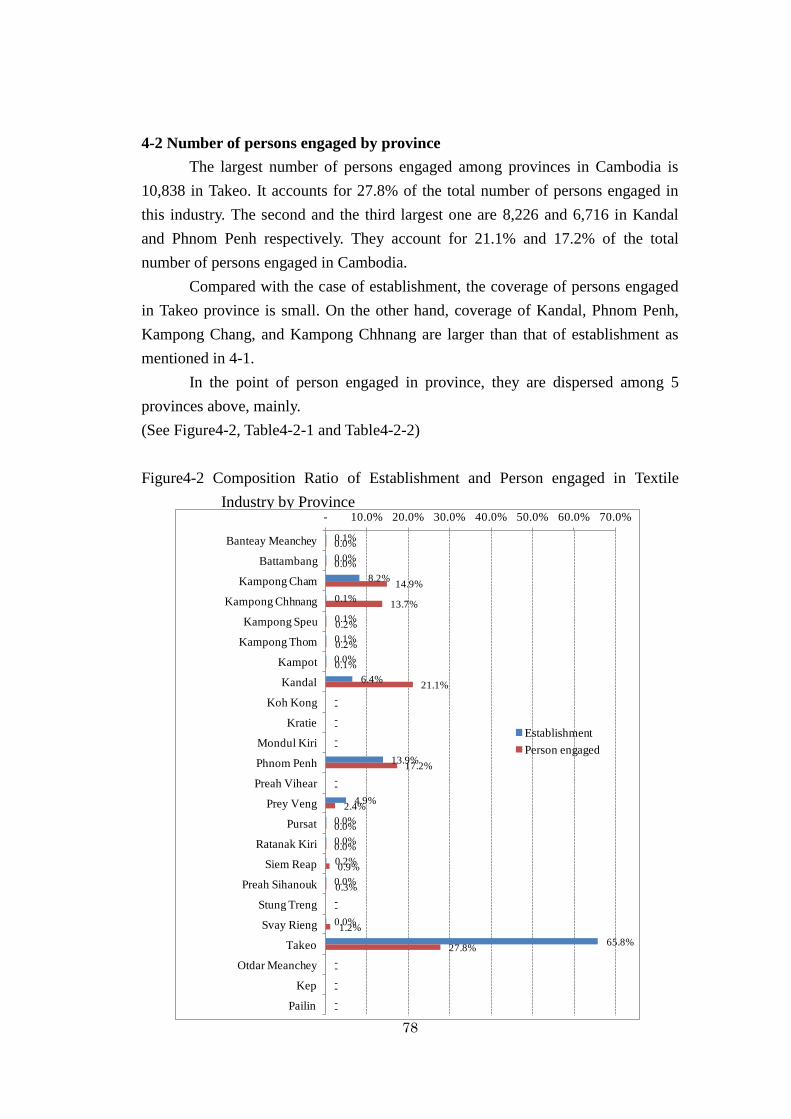
78
4-2 Number of persons engaged by province
The largest number of persons engaged among provinces in Cambodia is
10,838 in Takeo. It accounts for 27.8% of the total number of persons engaged in
this industry. The second and the third largest one are 8,226 and 6,716 in Kandal
and Phnom Penh respectively. They account for 21.1% and 17.2% of the total
number of persons engaged in Cambodia.
Compared with the case of establishment, the coverage of persons engaged
in Takeo province is small. On the other hand, coverage of Kandal, Phnom Penh,
Kampong Chang, and Kampong Chhnang are larger than that of establishment as
mentioned in 4-1.
In the point of person engaged in province, they are dispersed among 5
provinces above, mainly.
(See Figure4-2, Table4-2-1 and Table4-2-2)
Figure4-2 Composition Ratio of Establishment and Person engaged in Textile
Industry by Province
0.1%
0.0%
8.2%
0.1%
0.1%
0.1%
0.0%
6.4%
-
-
-
13.9%
-
4.9%
0.0%
0.0%
0.2%
0.0%
-
0.0%
65.8%
-
-
-
0.0%
0.0%
14.9%
13.7%
0.2%
0.2%
0.1%
21.1%
-
-
-
17.2%
-
2.4%
0.0%
0.0%
0.9%
0.3%
-
1.2%
27.8%
-
-
-
- 10.0% 20.0% 30.0% 40.0% 50.0% 60.0% 70.0%
Banteay Meanchey
Battambang
Kampong Cham
Kampong Chhnang
Kampong Speu
Kampong Thom
Kampot
Kandal
Koh Kong
Kratie
Mondul Kiri
Phnom Penh
Preah Vihear
Prey Veng
Pursat
Ratanak Kiri
Siem Reap
Preah Sihanouk
Stung Treng
Svay Rieng
Takeo
Otdar Meanchey
Kep
Pailin
Establishment
Person engaged

79
Table4-2-1 Number of Person engaged by Province
All Industry Manufacturing
Industry Textile Industry
Number Composition
Ratio (%) Number
Composition
Ratio (%) Number
Composition
Ratio (%)
Banteay
Meanchey 67,370 4.0 7,798 1.5 15 0.0
Battambang 84,790 5.1 8,285 1.6 11 0.0
Kampong
Cham 143,044 8.5 35,606 6.7 5,810 14.9
Kampong
Chhnang 57,575 3.4 27,166 5.1 5,342 13.7
Kampong
Speu 72,341 4.3 31,162 5.9 95 0.2
Kampong
Thom 48,147 2.9 9,344 1.8 97 0.2
Kampot 41,623 2.5 5,196 1.0 49 0.1
Kandal 151,146 9.0 76,703 14.5 8,226 21.1
Koh Kong 13,039 0.8 824 0.2 - -
Kratie 22,835 1.4 2,894 0.5 - -
Mondul
Kiri 6,018 0.4 353 0.1 - -
Phnom
Penh 556,865 33.3 247,630 46.7 6,716 17.2
Preah
Vihear 10,577 0.6 2,414 0.5 - -
Prey Veng 64,335 3.8 10,220 1.9 921 2.4
Pursat 26,617 1.6 3,246 0.6 1 0.0
Ratanak Kiri 12,619 0.8 1,125 0.2 3 0.0
Siem Reap 94,326 5.6 9,724 1.8 339 0.9
Preah
Sihanouk 39,475 2.4 11,085 2.1 106 0.3
Stung
Treng 11,046 0.7 1,736 0.3 - -
Svay Rieng 53,202 3.2 14,804 2.8 472 1.2
Takeo 70,796 4.2 21,188 4.0 10,838 27.8
Otdar
Meanchey 13,465 0.8 937 0.2 - -
Kep 3,937 0.2 241 0.0 - -
Pailin 67,370 4.0 660 0.1 - -
Total 1,673,390 100.0 530,341 100.0 39,041 100.0

80
Table 4-2-2 Number of Persons engaged in Textile Industry by Province and by
Class of ISIC
Preparation and
spinning of textile fibres Weaving of textiles Finishing of textiles
Number Composition
Ratio (%) Number
Composition
Ratio (%) Number
Composition
Ratio (%)
Banteay
Meanchey 6 4.8 4 0.0 - -
Battambang 2 1.6 - - - -
Kampong
Cham 50 40.3 1,777 5.6 3,967 82.7
Kampong
Chhnang - - 5,317 16.6 24 0.5
Kampong
Speu - - 80 0.3 - -
Kampong
Thom - - 66 0.2 - -
Kampot - - 49 0.2 - -
Kandal - - 6,550 20.5 460 9.6
Koh Kong - - - - - -
Kratie - - - - - -
Mondul
Kiri - - - - - -
Phnom
Penh 53 42.7 5,616 17.6 289 6.0
Preah
Vihear - - - - - -
Prey Veng - - 921 2.9 - -
Pursat - - 1 0.0 - -
Ratanak Kiri - - 3 0.0 - -
Siem Reap - - 339 1.1 - -
Preah
Sihanouk - - 51 0.2 55 1.1
Stung
Treng - - - - - -
Svay Rieng - - 464 1.5 - -
Takeo 13 10.5 10,759 33.6 - -
Otdar
Meanchey - - - - - -
Kep - - - - - -
Pailin - - - - - -
Total 124 100 31,997 100 4,795 100
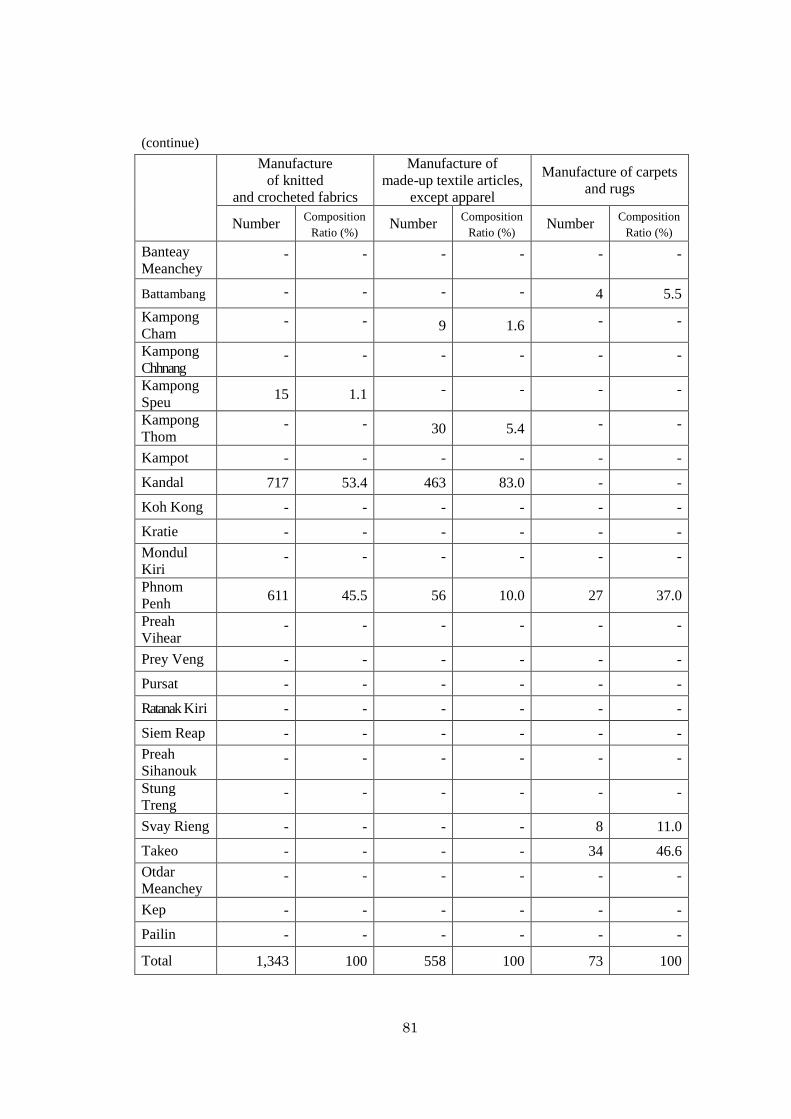
81
(continue)
Manufacture
of knitted
and crocheted fabrics
Manufacture of
made-up textile articles,
except apparel
Manufacture of carpets
and rugs
Number Composition
Ratio (%) Number
Composition
Ratio (%) Number
Composition
Ratio (%)
Banteay
Meanchey - - - - - -
Battambang - - - - 4 5.5
Kampong
Cham - - 9 1.6 - -
Kampong
Chhnang - - - - - -
Kampong
Speu 15 1.1 - - - -
Kampong
Thom - - 30 5.4 - -
Kampot - - - - - -
Kandal 717 53.4 463 83.0 - -
Koh Kong - - - - - -
Kratie - - - - - -
Mondul
Kiri - - - - - -
Phnom
Penh 611 45.5 56 10.0 27 37.0
Preah
Vihear - - - - - -
Prey Veng - - - - - -
Pursat - - - - - -
Ratanak Kiri - - - - - -
Siem Reap - - - - - -
Preah
Sihanouk - - - - - -
Stung
Treng - - - - - -
Svay Rieng - - - - 8 11.0
Takeo - - - - 34 46.6
Otdar
Meanchey - - - - - -
Kep - - - - - -
Pailin - - - - - -
Total 1,343 100 558 100 73 100

82
(continue)
Manufacture of
cordage, rope, twine
and netting
Manufacture of other
textiles n.e.c. Total
Number Composition
Ratio (%) Number
Composition
Ratio (%) Number
Composition
Ratio (%)
Banteay
Meanchey 5 7.2
- - 15 0.0
Battambang 5 7.2 - - 11 0.0
Kampong
Cham 6 8.7 1 1.2 5,810 14.9
Kampong
Chhnang 1 1.4 - - 5,342 13.7
Kampong
Speu - - - - 95 0.2
Kampong
Thom - - 1 1.2 97 0.2
Kampot - - - - 49 0.1
Kandal 31 44.9 5 6.1 8,226 21.1
Koh Kong - - - - - -
Kratie - - - - - -
Mondul
Kiri - - - - - -
Phnom
Penh - - 64 78.0 6,716 17.2
Preah
Vihear - - - - - -
Prey Veng - - - - 921 2.4
Pursat - - - - 1 0.0
Ratanak Kiri - - - - 3 0.0
Siem Reap - - - - 339 0.9
Preah
Sihanouk - - - - 106 0.3
Stung
Treng - - - - - -
Svay Rieng - - - - 472 1.2
Takeo 21 30.4 11 13.4 10,838 27.8
Otdar
Meanchey - - - - - -
Kep - - - - - -
Pailin - - - - - -
Total 69 100 82 100 39,041 100

83
Chapter 5 Financial conditions
5-1 Annual Sales
The total amount of annual sales in textile industry is approximately 81
million US dollars. It accounts for 2% and 0.6% of the total amount of annual sales
in manufacturing industry and the whole industry in Cambodia, respectively.
Amount of annual sales per entity in textile industry is 9,166 US dollars.
This is one third of that of the whole industry, and a quarter of that of
manufacturing industry. The reason of low annual sales per entity is simple: It
reflects the overwhelming majority of individual proprietor (with no registration).
Their annual sales amount per entity is as low as 2,208 US dollars. On the other
hand, that of sole proprietor (with registration) is 1,887,845 US dollars and of
private limited company is 3,641,904 US dollars and high, although they are
minority in the point of ownership (legal status). In other words, the difference
between majority and minorities comes from the scale of establishment.
(See Table5-1-1)
Table5-1-1 Annual Sales
-1 Amount of annual sales
Annual sales
(USD)
Composition
Ratio (%)
Annual sales
per entity
(USD)
(Number of
applicable
entity)
All Industry 12,678,385,624 100.0 25,548 496,261
Manufacturing 2,819,848,003 22.2 39,780 70,886
Textile Industry 80,851,079 0.6 9,166 8,821
(Note) Annual sales exclude entities whose amount of annual sales is zero or “Not reported” in this
table.

84
-2 Annual sales in Textile Industry by Ownership (Legal Status)
Annual
sales
(USD)
Composition
Ratio (%)
Annual
sales per
entity
(USD)
(Number of
applicable
entity)
Individual proprietor (with no
registration) 19,423,236 24.0 2,208 8,795
Sole proprietor (with
registration) 32,093,360 39.7 1,887,845 17
General partnership - - - -
Limited partnership - - - -
Private limited company 29,135,234 36.0 3,641,904 8
Public limited company - - - -
Subsidiary of a foreign company - - - -
Branch of a foreign company - - - -
Commercial representative
office of a foreign company - - - -
Cooperative - - - -
State-owned organization - - - -
NGO 199,248 0.2 199,248 1
Others - - - -
Total 80,851,079 100.0 9,166 8,821
(Note) Annual sales exclude entities whose amount of annual sales is zero or “Not reported” in this
table.
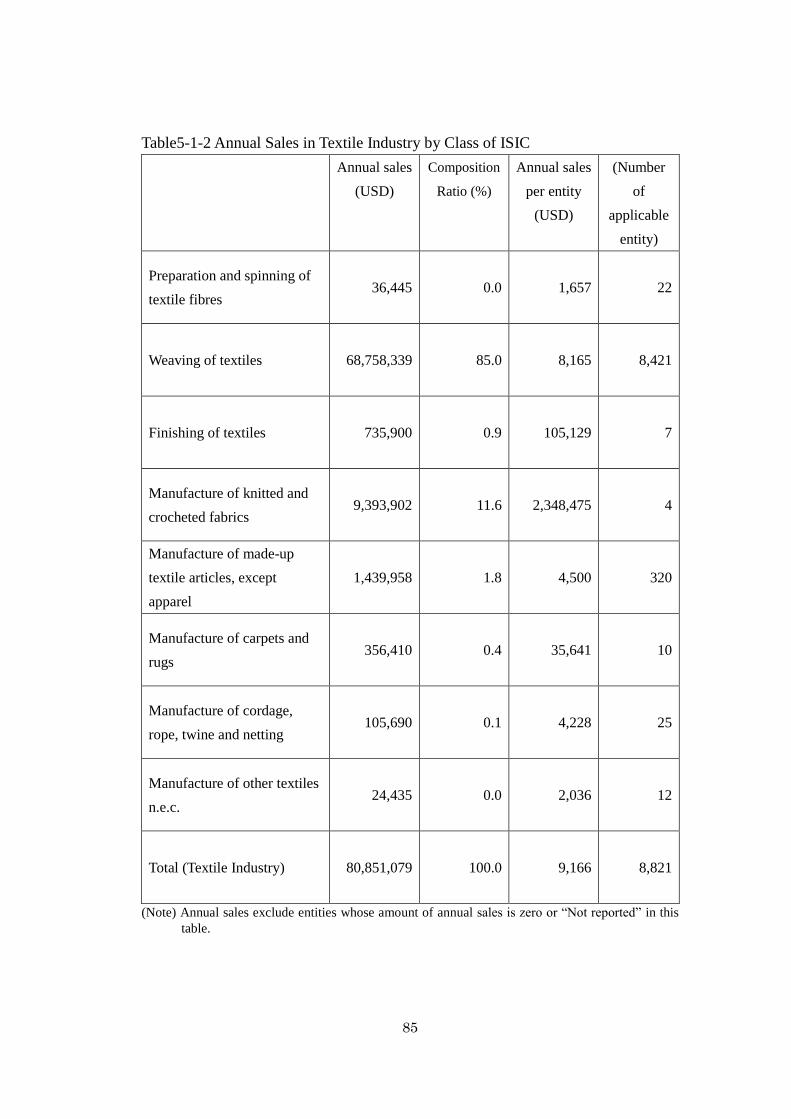
85
Table5-1-2 Annual Sales in Textile Industry by Class of ISIC
Annual sales
(USD)
Composition
Ratio (%)
Annual sales
per entity
(USD)
(Number
of
applicable
entity)
Preparation and spinning of
textile fibres 36,445 0.0 1,657 22
Weaving of textiles 68,758,339 85.0 8,165 8,421
Finishing of textiles 735,900 0.9 105,129 7
Manufacture of knitted and
crocheted fabrics 9,393,902 11.6 2,348,475 4
Manufacture of made-up
textile articles, except
apparel
1,439,958 1.8 4,500 320
Manufacture of carpets and
rugs 356,410 0.4 35,641 10
Manufacture of cordage,
rope, twine and netting 105,690 0.1 4,228 25
Manufacture of other textiles
n.e.c. 24,435 0.0 2,036 12
Total (Textile Industry) 80,851,079 100.0 9,166 8,821
(Note) Annual sales exclude entities whose amount of annual sales is zero or “Not reported” in this
table.

86
Table5-1-3 Number of Entities by Size of Annual Sales
All Industry Manufacturing
Industry Textile Industry
Number Composition
Ratio (%) Number
Composition
Ratio (%) Number
Composition
Ratio (%)
0 94 0.0 27 0.0 1 0.0
Under 500
dollars 14,106 2.8 7,229 10.2 459 5.2
500 - under
1,000 dollars 30,217 6.1 10,565 14.9 2,341 26.5
1,000 - under
2,000 dollars 73,476 14.8 18,817 26.5 4,186 47.5
2,000 - under
3,000 dollars 46,349 9.3 8,041 11.3 966 11.0
3,000 - under
5,000 dollars 86,330 17.4 10,510 14.8 481 5.5
5,000 - under
7,500 dollars 72,657 14.6 5,963 8.4 140 1.6
7,500 - under
10,000 dollars 46,768 9.4 2,363 3.3 74 0.8
10,000 - under
25,000 dollars 74,406 15.0 4,176 5.9 106 1.2
25,000 - under
50,000 dollars 30,110 6.1% 1,571 2.2 34 0.4
50,000 dollars
or more 21,842 4.4 1,651 2.3 34 0.4
Total 496,355 100.0 70,913 100.0 8,822 100.0

87
Table5-1-4 Number of Entities in Textile Industry by Size of Annual Sales and by
Class of ISIC
Preparation and
spinning of textile
fibres
Weaving
of textiles
Finishing
of textiles
Number Composition
Ratio (%) Number
Composition
Ratio (%) Number
Composition
Ratio (%)
0 - - - - - -
under 500
dollars 2 9.1 330 3.9 - -
500 - under
1,000 dollars 8 36.4 2,297 27.3 - -
1,000 - under
2,000 dollars 5 22.7 4,162 49.4 2 28.6
2,000 - under
3,000 dollars 3 13.6 949 11.3 1 14.3
3,000 - under
5,000 dollars 3 13.6 433 5.1 - -
5,000 - under
7,500 dollars 1 4.5 109 1.3 - -
7,500 - under
10,000 dollars - - 27 0.3 - -
10,000 - under
25,000 dollars - - 60 0.7 1 14.3
25,000 - under
50,000 dollars - - 26 0.3 1 14.3
50,000 dollars
or more - - 28 0.3 2 28.6
Total 22 100.0 8,421 100.0 7 100.0

88
(continue)
Manufacture of knitted
and crocheted fabrics
Manufacture
of made-up textile
articles, except apparel
Manufacture
of carpets
and rugs
Number Composition
Ratio (%) Number
Composition
Ratio (%) Number
Composition
Ratio (%)
0 - - - - - -
under 500
dollars - - 124 38.8 - -
500 - under
1,000 dollars - - 23 7.2 - -
1,000 - under
2,000 dollars - - 8 2.5 - -
2,000 - under
3,000 dollars - - 9 2.8 1 10.0
3,000 - under
5,000 dollars - - 42 13.1 1 10.0
5,000 - under
7,500 dollars 1 25.0 26 8.1 1 10.0
7,500 - under
10,000 dollars - - 43 13.4 1 10.0
10,000 - under
25,000 dollars 1 25.0 42 13.1 2 20.0
25,000 - under
50,000 dollars - - 3 0.9 2 20.0
50,000 dollars
or more 2 50.0 - - 2 20.0
Total 4 100.0 320 100.0 10 100.0

89
(continue)
Manufacture
of cordage, rope, twine
and netting
Manufacture
of other textiles n.e.c. Total
Number Composition
Ratio (%) Number
Composition
Ratio (%) Number
Composition
Ratio (%)
0 - - 1
1
under 500
dollars 3 12.0 - - 459 5.2
500 - under
1,000 dollars 9 36.0 4 30.8 2,341 26.5
1,000 - under
2,000 dollars 5 20.0 4 30.8 4,186 47.5
2,000 - under
3,000 dollars 2 8.0 1 7.7 966 11.
3,000 - under
5,000 dollars - - 2 15.4 481 5.5
5,000 - under
7,500 dollars 1 4.0 1 7.7 140 1.6
7,500 - under
10,000 dollars 3 12.0 - - 74 0.8
10,000 - under
25,000 dollars - - - - 106 1.2
25,000 - under
50,000 dollars 2 8.0 - - 34 0.4
50,000 dollars
or more - - - - 34 0.4
Total 25 100.0 13 100.0 8,822 100.0

90
5-2 Annual profit and loss
Amount of annual profit and loss in textile industry is approximately 6
million US dollars. It accounts for 0.3% and 4.1% of the total amount of the whole
industry, 1,700 million US dollars and manufacturing industry, 144 million US
dollars in Cambodia, respectively. Annual profit and loss per entity in this industry
is 674 US dollars which is one fifth of that of the whole industry and one third of
that of manufacturing industry.
(See Table 5-2-1)
In the light of number of entities in profit or in loss, almost all entities in
Cambodia make profit. Compared with other industries, annual profit per entity in
textile industry is 1,693 US dollars and is one third of that of the whole industry
and manufacturing industry, 4,730 US dollars and 5,039 US dollars respectively.
On the other hand, annual loss per entity in this industry is -86,863 US dollars and
is smaller than that of manufacturing industry however larger than that of the whole
industry.
Among the class of ISIC in this industry, weaving of textiles covers 43.1%
of the total amount of annual sales in this industry and the largest, however annual
profit and loss per entity is 305 US dollars and small. On the other hands, profit and
loss of manufacture of knitted and crocheted fabrics is approximately 2.23 million
US dollars which was made by only 4 entities, and it accounts for 37.7% of the
total amount of annual profit and loss in this industry.
(See Table 5-2-2 and Table 5-2-3)

91
Table5-2-1 Annual Profit and Loss
-1 Amount of Annual profit and loss
Amount of Annual
Profit and Loss (USD)
Amount of Annual
Profit and Loss per
entity (USD)
(Number of
applicable entity )
All Industry 1,699,473,752 3,575 475,376
Manufacturing
Industry 143,841,303 2,071 69,451
Textile Industry 5,918,272 674 8,779
(Note) Tables of annual profit and/or loss exclude entities whose amount of profit and/or loss is zero
or “Not reported”.
-2 Number of entity in profit or loss
Entity in profit Entity in loss Total
Number
of entity Composition
Ratio (%)
Number
of entity Composition
Ratio (%)
Number
of entity Composition
Ratio (%)
All Industry 462,981 97.4 12,395 2.6 475,376 100.0
Manufacturing
Industry 67,994 97.9 1,457 2.1 69,451 100.0
Textile Industry 8,678 98.8 101 1.2 8,779 100.0
-3 Profit or loss per entity
Profit (USD) Loss (USD)
Amount of
Profit
Profit per
entity
Amount of
Loss Loss per entity
All Industry 2,189,757,653 4,730 -490,283,902 -39,555
Manufacturing
Industry 342,627,166 5,039 -198,785,863 -136,435
Textile Industry 14,691,484 1,693 -8,773,213 -86,863

92
Table5-2-2 Annual Profit and Loss in Textile Industry
-1 Amount of Annual profit and loss (net)
Amount of
Annual Profit
and Loss
(USD)
Composition
ratio (%)
Amount of
Annual Profit
and Loss per
entity (USD)
( Number of
applicable
entity )
Preparation and
spinning of textile
fibres
15,675 0.3 746 21
Weaving of textiles 2,552,548 43.1 305 8,379
Finishing of textiles 40,740 0.7 5,820 7
Manufacture of knitted
and crocheted fabrics 2,232,303 37.7 558,076 4
Manufacture of
made-up textile
articles, except apparel
947,311 16.0 2,960 320
Manufacture of carpets
and rugs 106,450 1.8 10,645 10
Manufacture of
cordage, rope, twine
and netting
41,943 0.7 1,678 25
Manufacture of other
textiles n.e.c. -18,698 -0.3 -1,438 13
Total (Textile Industry) 5,918,272 100.0 674 8,779
(Note) Tables of annual profit and/or loss exclude entities whose amount of profit and/or loss is zero
or “Not reported”.

93
-2 Number of entity in profit or loss (number, Composition Ratio (%))
Entity
in profit
Entity
in loss Total
Number
of entity
Composition
ratio (%)
Number
of entity
Composition
ratio (%)
Number
of entity
Composition
ratio (%)
Preparation and
spinning of
textile fibres
21 100.0 - - 21 100.0
Weaving of
textiles 8280 98.8 99 1.2 8379 100.0
Finishing of
textiles 7 100.0 - - 7 100.0
Manufacture of
knitted and
crocheted fabrics
4 100.0 - - 4 100.0
Manufacture of
made-up textile
articles, except
apparel
319 99.7 1 0.3 320 100.0
Manufacture of
carpets and rugs 10 100.0 - - 10 100.0
Manufacture of
cordage, rope,
twine and
netting
25 100.0 - - 25 100.0
Manufacture of
other textiles
n.e.c.
12 92.3 1 7.7 13 100.0
Total (Textile
Industry) 8678 98.8 101 1.2 8779 100.0

94
-3 Profit or loss per entity (gross)
Profit (USD) Loss (USD)
Amount of
Profit
Profit per
entity
Amount of
Loss Loss per entity
Preparation and
spinning of textile
fibres
15,675 746 - -
Weaving of textiles 11,296,248 1,364 -8,743,700 -88,320
Finishing of textiles 40,740 5,820 - -
Manufacture of
knitted and
crocheted fabrics
2,232,303 558,076 - -
Manufacture of
made-up textile
articles, except
apparel
948,224 2,972 -913 -913
Manufacture of
carpets and rugs 106,450 10,645 - -
Manufacture of
cordage, rope,
twine and netting
41,943 1,678 - -
Manufacture of
other textiles n.e.c. 9,902 825 -28,600 -28,600
Total
(Textile Industry) 14,691,484 1,693 -8,773,213 -86,863
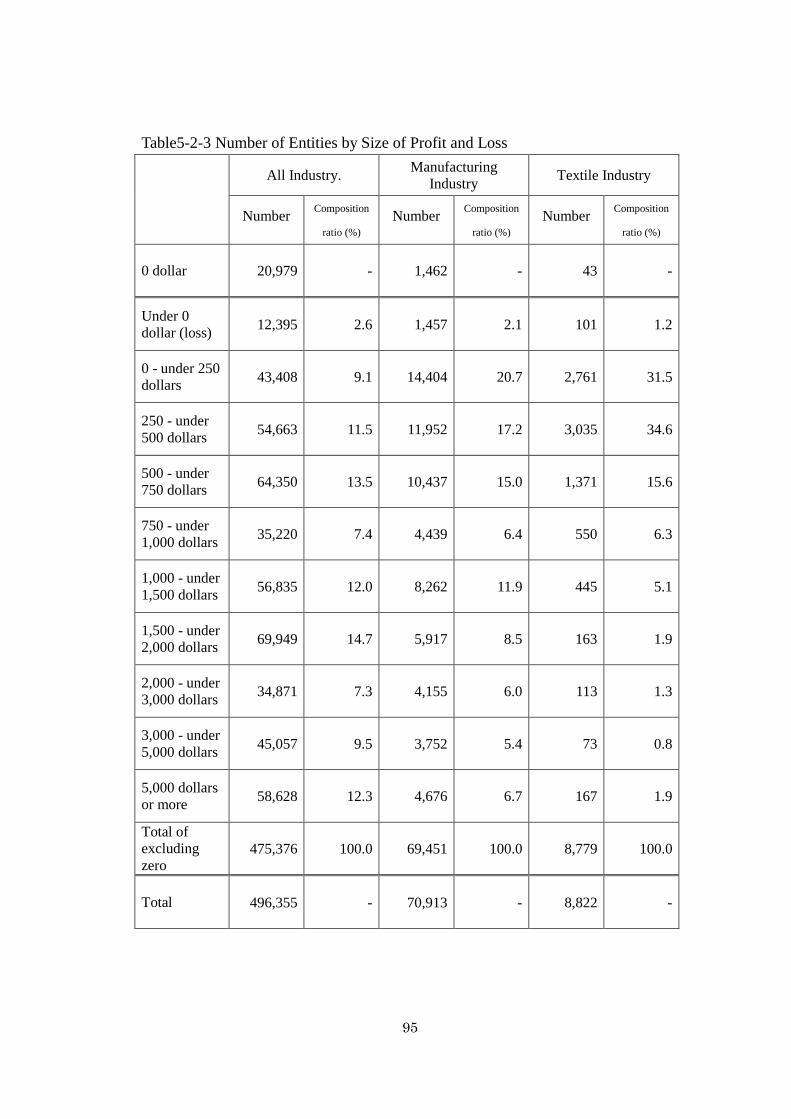
95
Table5-2-3 Number of Entities by Size of Profit and Loss
All Industry. Manufacturing
Industry Textile Industry
Number Composition
ratio (%)
Number Composition
ratio (%)
Number Composition
ratio (%)
0 dollar 20,979 - 1,462 - 43 -
Under 0
dollar (loss) 12,395 2.6 1,457 2.1 101 1.2
0 - under 250
dollars 43,408 9.1 14,404 20.7 2,761 31.5
250 - under
500 dollars 54,663 11.5 11,952 17.2 3,035 34.6
500 - under
750 dollars 64,350 13.5 10,437 15.0 1,371 15.6
750 - under
1,000 dollars 35,220 7.4 4,439 6.4 550 6.3
1,000 - under
1,500 dollars 56,835 12.0 8,262 11.9 445 5.1
1,500 - under
2,000 dollars 69,949 14.7 5,917 8.5 163 1.9
2,000 - under
3,000 dollars 34,871 7.3 4,155 6.0 113 1.3
3,000 - under
5,000 dollars 45,057 9.5 3,752 5.4 73 0.8
5,000 dollars
or more 58,628 12.3 4,676 6.7 167 1.9
Total of
excluding
zero 475,376 100.0 69,451 100.0 8,779 100.0
Total 496,355 - 70,913 - 8,822 -

96
Table5-2-4 Number of Entities in Textile Industry by Size of Profit and Loss and by
Class of ISIC
Preparation and
spinning of textile
fibres
Weaving
of textiles
Finishing
of textiles
Number Composition
ratio (%)
Number Composition
ratio (%)
Number Composition
ratio (%)
0 dollar 1 - 42 - - -
Under 0
dollar (loss) - - 99 1.2 - -
0 - under
250 dollars 5 23.8 2,614 31.2 1 14.3
250 - under
500 dollars 7 33.3 3,001 35.8 1 14.3
500 - under
750 dollars 1 4.8 1,360 16.2 - -
750 - under
1,000 dollars 1 4.8 542 6.5 1 14.3
1,000 -
under 1,500
dollars 3 14.3 431 5.1 - -
1,500 -
under 2,000
dollars 3 14.3 154 1.8 - -
2,000 -
under 3,000
dollars 1 4.8 83 1.0 - -
3,000 -
under 5,000
dollars - - 34 0.4 1 14.3
5,000 dollars
or more - - 61 0.7 3 42.9
Total of
excluding
zero 21 100.0 8,379 100.0 7 100.0
Total 22 - 8,421 - 7 -

97
(continue)
Manufacture of knitted
and crocheted fabrics
Manufacture of
made-up textile
articles, except apparel
Manufacture of carpets
and rugs
Number Composition
ratio (%)
Number Composition
ratio (%)
Number Composition
ratio (%)
0 dollar - - - - - -
Under 0
dollar (loss) - - 1 0.3 - -
0 - under
250 dollars - - 127 39.7 1 10.0
250 - under
500 dollars - - 18 5.6 1 10.0
500 - under
750 dollars - - 8 2.5
-
-
750 - under
1,000 dollars - - 4 1.3 1 10.0
1,000 -
under 1,500
dollars - - 3 0.9 1 10.0
1,500 -
under 2,000
dollars - - 5 1.6 - -
2,000 -
under 3,000
dollars - - 28 8.8 - -
3,000 -
under 5,000
dollars 1 25.0 35 10.9 1 10.0
5,000 dollars
or more 3 75.0 91 28.4 5 50.0
Total of
excluding
zero 4 100.0 320 100.0 10 100.0
Total 4 - 320 - 10 -

98
(continue)
Manufacture of
cordage, rope, twine
and netting
Manufacture of other
textiles n.e.c. Total
Number Composition
ratio (%)
Number Composition
ratio (%)
Number Composition
ratio (%)
0 dollar - - - - 43 -
Under 0
dollar (loss) - - 1 7. 101 1.2
0 - under
250 dollars 12 48.0 1 7.7 2,761 31.5
250 - under
500 dollars 3 12.0 4 30.8 3,035 34.6
500 - under
750 dollars - - 2 15.4 1,371 15.6
750 - under
1,000 dollars 1 4.0 - - 550 6.3
1,000 -
under 1,500
dollars 3 12.0 4 30.8 445 5.1
1,500 -
under 2,000
dollars - - 1 7.7 163 1.9
2,000 -
under 3,000
dollars 1 4.0 - - 113 1.3
3,000 -
under 5,000
dollars 1 4.0 - - 73 0.8
5,000 dollars
or more 4 16.0 - - 167 1.9
Total of
excluding
zero 25 100.0 13 100.0 8,779 100.0
Total 25 - 13 - 8,822 -

Attachments

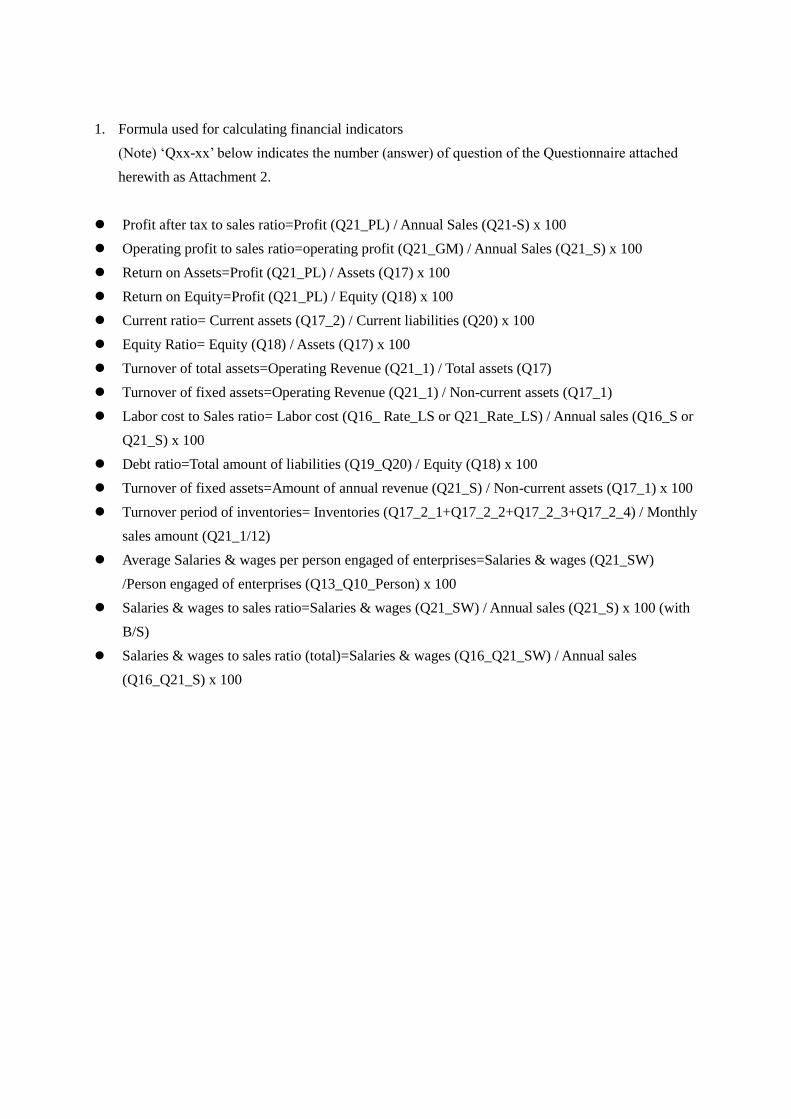
1. Formula used for calculating financial indicators
(Note) ‘Qxx-xx’ below indicates the number (answer) of question of the Questionnaire attached
herewith as Attachment 2.
Profit after tax to sales ratio=Profit (Q21_PL) / Annual Sales (Q21-S) x 100
Operating profit to sales ratio=operating profit (Q21_GM) / Annual Sales (Q21_S) x 100
Return on Assets=Profit (Q21_PL) / Assets (Q17) x 100
Return on Equity=Profit (Q21_PL) / Equity (Q18) x 100
Current ratio= Current assets (Q17_2) / Current liabilities (Q20) x 100
Equity Ratio= Equity (Q18) / Assets (Q17) x 100
Turnover of total assets=Operating Revenue (Q21_1) / Total assets (Q17)
Turnover of fixed assets=Operating Revenue (Q21_1) / Non-current assets (Q17_1)
Labor cost to Sales ratio= Labor cost (Q16_ Rate_LS or Q21_Rate_LS) / Annual sales (Q16_S or
Q21_S) x 100
Debt ratio=Total amount of liabilities (Q19_Q20) / Equity (Q18) x 100
Turnover of fixed assets=Amount of annual revenue (Q21_S) / Non-current assets (Q17_1) x 100
Turnover period of inventories= Inventories (Q17_2_1+Q17_2_2+Q17_2_3+Q17_2_4) / Monthly
sales amount (Q21_1/12)
Average Salaries & wages per person engaged of enterprises=Salaries & wages (Q21_SW)
/Person engaged of enterprises (Q13_Q10_Person) x 100
Salaries & wages to sales ratio=Salaries & wages (Q21_SW) / Annual sales (Q21_S) x 100 (with
B/S)
Salaries & wages to sales ratio (total)=Salaries & wages (Q16_Q21_SW) / Annual sales
(Q16_Q21_S) x 100

2. Form of Questionnaire