
ECONOMIC EFFECTS OF RED TIDE, KARENIA BREVIS, ON THE TOURISM
INDUSTRY ALONG THE GULF OF MEXICO COAST OF CENTRAL FLORIDA
A Thesis
by
JAYTON LEWIS RAINEY
Submitted to the Office of Graduate and Professional Studies of
Texas A&M University
in partial fulfillment of the requirements for the degree of
MASTER OF SCIENCE
Chair of Committee, Samuel Brody
Committee Members, Wesley Highfield
Antonietta Quigg
Head of Department, Kyeong Park
August 2017
Major Subject: Marine Resources Management
Copyright 2017 Jayton Lewis Rainey

ii
ABSTRACT
This study examines the impacts of red tide, Karenia brevis, cell intensity on collected
tourism tax revenues by municipality along the central Gulf of Mexico coast of Florida. The
study area consists of 27 municipalities within 3 separate Florida counties that rely heavily on
tourism dollars to maintain the quality and profitability of tourist amenities. Descriptive and
spatial-temporal statistical methods are used to identify the economic impacts created by K.
brevis between 2000 and 2015.
Analysis of tourism tax revenue for these coastal municipalities indicated that increased
cell intensities of K. brevis decrease these revenues significantly. Only red tide samplings that
were within range of affecting the selected coastal municipalities were analyzed for this study.
Although the economic impacts resulting from K. brevis exposure was minimal, it was
statistically significant throughout the study period. Previous studies used smaller areas and
shorter time frames, where this study expanded the study area across three counties and
throughout 15 years of recorded tax revenues. Control variables used, the presence of tropical
storms or hurricanes and the total lodging facilities by municipality, resulted in a statistically
significant decrease and increase in tourism tax revenue, respectively. The significant decrease
in tourism tax revenue resulting from the presence of a tropical storm or hurricane would be a
more accurate variable to address economic impacts from these coastal communities. The use
of a cross-sectional time-series regression model was used for this study to ensure that the
spatial and temporal scales of measurement were optimized.

iii
CONTRIBUTORS AND FUNDING SOURCES
Contributors
This work was supported by a thesis committee consisting of Professors Samuel Brody
and Wesley Highfield of the Department of Marine Resources Management and Professor
Antonietta Quigg of the Department of Marine Biology at Texas A&M University at
Galveston.
The data analyzed for this thesis was collected and provided by the Pinellas County
Tax Collector, Sarasota Tax Collection Office and Manatee County Resort Tax Collection
Office.
All other work conducted for the thesis was completed by the student independently.
Funding Sources
There are no outside funding contributions to acknowledge related to the research and
compilation of this document.

iv
TABLE OF CONTENTS
Page
ABSTRACT .............................................................................................................................. ii
CONTRIBUTORS AND FUNDING SOURCES ................................................................... iii
TABLE OF CONTENTS ......................................................................................................... iv
LIST OF FIGURES ................................................................................................................. vi
LIST OF TABLES .................................................................................................................. vii
1. INTRODUCTION ..............................................................................................................1
1.1. Problem Statement ..................................................................................................... 1
1.2. Research Question and Objectives ............................................................................. 3
2. LITERATURE REVIEW ...................................................................................................6
2.1. “Red Tide” Overview ................................................................................................. 6
2.2. Commercial Fishery Impacts ..................................................................................... 7
2.3. Human Health Costs................................................................................................... 9
2.4. Tourism Impacts ....................................................................................................... 11
3. CONCEPTUAL MODEL.................................................................................................13
3.1. Hypothesis ................................................................................................................ 14
4. RESEARCH METHODS .................................................................................................15
4.1. Study Area ................................................................................................................ 15
4.2. Concept Measurement .............................................................................................. 18
4.2.1. Dependent Variable .......................................................................................... 18
4.2.2. Independent Variable ........................................................................................ 19
4.2.3. Physical Control Variables ............................................................................... 23
4.3. Data Analysis ........................................................................................................... 24
5. RESULTS .........................................................................................................................27
5.1. Modeled Results of Individual K. brevis Cell Intensity ........................................... 27
6. DISCUSSION ...................................................................................................................29
6.1. Discussion of Model Results .................................................................................... 29
6.2. Policy Recommendations ......................................................................................... 30
6.2.1. Federal Policy Recommendations..................................................................... 30

v
6.2.2. State Policy Recommendations......................................................................... 30
6.2.3. Local Policy Recommendations ....................................................................... 31
6.2.4. Summary of Policy Recommendations ............................................................. 32
7. CONCLUSIONS ..............................................................................................................33
7.1. Research Summary ................................................................................................... 33
7.2. Limitations and Future Research.............................................................................. 33
REFERENCES ........................................................................................................................35
APPENDIX ..............................................................................................................................38

vi
LIST OF FIGURES
Figure Page
1 Conceptual model of study……...................................................................................14
2 The 3-county study area (Pinellas, Manatee, and Sarasota)…………..........................16
3 The municipalities located within the 3-county study area…………...........................17
4 Individual municipality 4-mile buffer with K. brevis sample location……………......21
5 Municipality 4-mile buffer with K. brevis samples greater than 10,000 cells/liter........22
vii
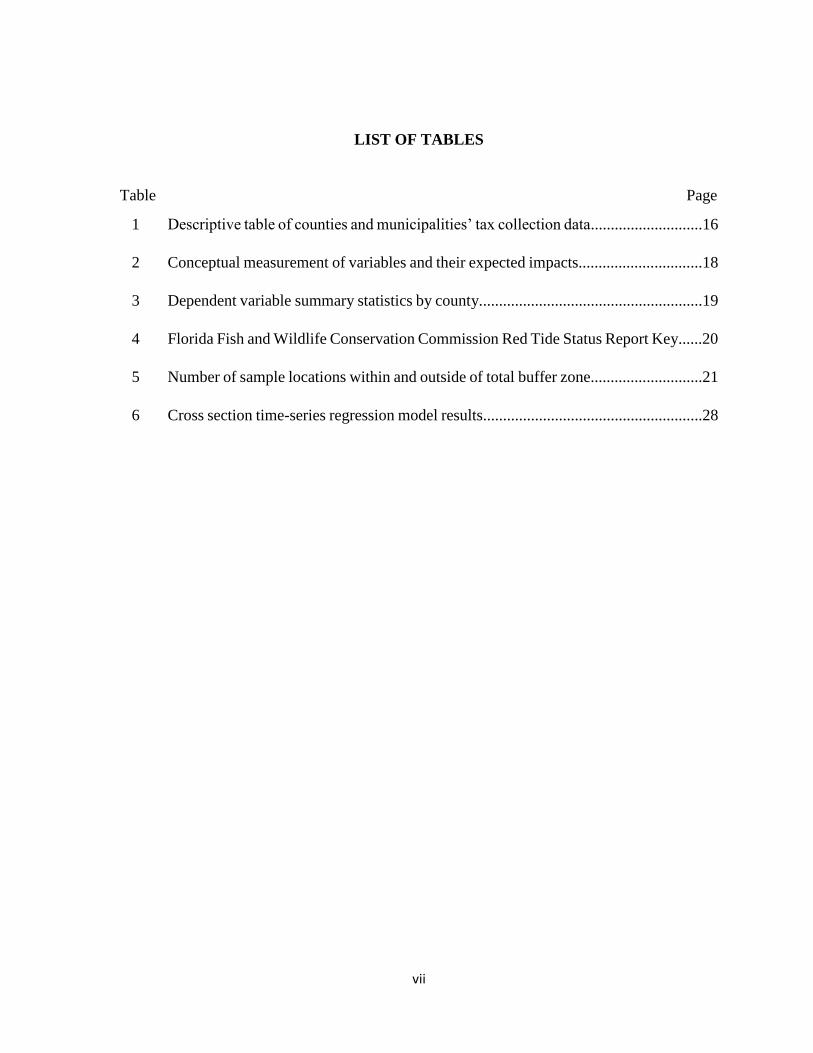
LIST OF TABLES
Table Page
1 Descriptive table of counties and municipalities’ tax collection data............................16
2 Conceptual measurement of variables and their expected impacts...............................18
3 Dependent variable summary statistics by county........................................................19
4 Florida Fish and Wildlife Conservation Commission Red Tide Status Report Key......20
5 Number of sample locations within and outside of total buffer zone............................21
6 Cross section time-series regression model results.......................................................28
1
1. INTRODUCTION
1.1. Problem Statement
Florida red tide, a harmful algal bloom produced by an excess of the dinoflagellate,
Karenia brevis, occurs in the Gulf of Mexico from Florida to Mexico, and has been
documented along the mid-Atlantic coast. The coastal communities of the Florida Gulf have
been experiencing and documenting red tide events since the early 1840’s (Pierce and Henry,
2008). The area in which this microorganism resides depends greatly on the oceanic currents
and water quality conditions (Henrichs et al., 2015). This microorganism is transported by
oceanic currents to coastal bays and estuaries, nutrient-rich areas, where it can thrive for longer
periods of time (Tester et al., 1997). When the abundance of K. brevis increases, it changes the
color of the coastal waters due to its pigmentation anywhere from brown to red, depending on
the intensity of the cell population (Anderson, 1997). This specific species located throughout
the Gulf of Mexico travels by way of the Gulf Loop Current, the Florida Current, and the Gulf
Stream, which can even allow K. brevis to form along the Atlantic Coast of the United States
(Tester et al., 1997). The phrases “harmful algal bloom” and “red tide” does not directly
insinuate K. brevis is the corresponding species, in fact, there are many different species of
algae that produce a harmful algal bloom or even a red tide event when concentrations become
hazardous to the surrounding environments. Harmful algal blooms and red tides caused by
entirely different algal species have been documented in the Bible and identified through fossil
records due to their location differences (Anderson, 1997). Formerly known as Gymnodinium
breve, K. brevis is the most predominant dinoflagellate species that produces brevetoxins
capable of causing ecological and human effects primarily in the Gulf of Mexico and along the
Florida Gulf coast (Pierce and Henry, 2008).
Specifically, K. brevis produces neurotoxins, collectively known as brevetoxins, which
create environmental threats to marine species and can affect human health. This
microorganism releases these brevetoxins into the water where it is consumed or absorbed by
fish, which can paralyze the central nervous system preventing them from breathing
(Kirkpatrick et al., 2004). It is common to identify a red tide is in effect when there is a large
fish kill in the observed area (Kirkpatrick et al., 2004). Further, a Florida red tide incident in
the spring of 2002 and spring of 2004 was responsible for the death of 34 endangered Florida
2
manatees (Trichechus manatus latirostris) and 107 bottlenose dolphins (Tursiops truncates),
respectively (Flewelling et al., 2005). In this case, it was more likely that there was ingestion
of the aerosols produced by K. brevis which caused the deaths. The presence of red tide along
coastal communities creates health complications for the residing individuals. These
brevetoxins can also be released when this microorganism dies from crashing waves and
creates an airborne disturbance that cause eye and respiratory irritation to human in the affected
area. The effects of these toxins can produce stronger adverse reactions to people with
preexisting respiratory conditions, such as asthma or chronic lung disease (Fleming et al.,
2007).
The coastal communities of Florida rely heavily on fishing opportunities for anglers all
over the world to enjoy. Recreational fishing brings a large portion of annual revenues for these
coastal counties and communities, which are adversely impacted by potential environmental
hazards and human health risks associated with red tides. Tourism revenues for the state and
its counties increase with the large number of anglers resorting to the coastline of Florida
(Greene et al., 1997).
One of the largest offshore industries in Florida is the harvesting of shellfish. Shellfish
harvesting thrives in this area due to Florida’s unique coastal location and environmental
contributions. An active harmful algal bloom may render unmarketable products that have
become toxic (Shumway, 1990). Closures to the shellfish industry for any amount of time
creates an economic loss for the fishing industry, the coastal community, and the entire state
(Flewelling et al., 2005). Shellfish may filter K. brevis from the water column exposing their
muscles to become contaminated with the brevetoxins making them poisonous for human
consumption, known as neurotoxic shellfish poisoning (Poli et al., 2000). Neurotoxic shellfish
poisoning can even hospitalize individuals who consume contaminated shellfish (Flewelling
et al., 2005).
While the adverse impacts of red tide are well documented, little empirical research has
been conducted on its effects on the coastal tourism economy. Tourism revenue along multiple
coastal counties and municipalities in the Central Gulf of Florida will be analyzed to determine
the economic impacts associated to red tide events. Better understanding of these economic
impacts will inform policy makers and coastal communities on how much tourism revenue is

3
potentially lost due to the presence of red tide. This information will assist these communities
by identifying heavily impacted areas (areas experiencing most tourism revenue loss) and
provide recommendations mitigation measures to prevent red tide exposure in the future.
1.2. Research Question and Objectives
Considering Florida’s long-term exposure to K. brevis and the associated health risks
to the coastal communities and tourist groups, my research question is: what are the economic
impacts of red tide, K. brevis, on tourism industry tax revenues for coastal communities in
Florida along the Gulf of Mexico?
Tourism is a vital source of income for the state of Florida and its coastal communities
year-round along the Gulf of Mexico (Backer, 2009). This region brings people from all over
the world for its pristine beaches and coastal attractions. Hotels, restaurants, beaches, and other
popular tourist attractions are negatively impacted by the occurrence of red tides as they are
becoming more predominate (Anderson et al., 2000). Red tides are capable of developing and
thriving with the increase in coastal pollution each year resulting in higher nutrient levels that
provide suitable conditions for K. brevis. Tourists may seek alternate destinations that are not
presently being affected by red tide to avoid respiratory irritation and the sight of dead fish
washed up on shore. This response may impact Florida and its coastal communities and
ecosystems by obtaining less income used to provide assistance and management practices
towards these impacted areas (Larkin et al., 2007).
Just as in any other state in the United States, Florida imposes many types of taxes on
its citizens and incoming tourist groups. Taxes that directly affect tourist activity are enforced
by Sales and Use Taxes Kind Code and their related Standard Industrial Classification (SIC)
codes. “Transient accommodations” are stated, by Florida law, as any rental charge to the use
of items or services required to living or sleeping accommodations. Examples of transient
accommodations in the state of Florida are hotel, motel, condominium, apartment house,
mobile home, timeshare resort, beach house or cottage (Florida Department of Revenue, 2016).
Local option taxes, authorized by Florida law under the Florida Statute 125.0104, are revenues
each county retains to administer on locally authorized projects. These taxes may be termed
tourist development taxes, bed tax, tourist impact taxes, municipal resort taxes, or convention
development taxes. Tourist development taxes are local sales taxes on temporary rentals of
4
living quarters or accommodations for a term of six months or less (Florida Department of
Revenue, 2016). In addition to the fee each county administers on local option taxes, they must
also charge the 6% Florida Sales Tax (Florida Department of Revenue, 2016). These local
option taxes are important sources of revenues to support various local environmental,
shoreline improvement and clean-up activities. Lee County, for example, uses percentages of
the tourist development tax they collect to improve their local environment for increased
tourism activity. Beach and shoreline improvements and maintenance uses 26.4% of the total
tourism development tax income, advertising and promotion uses 53.6%, and stadium debt
services uses the remaining 20% (Lee County Clerk of Court, 2015).
Large amounts of research have investigated the impacts that harmful algal blooms
have on public health costs, fishery industry revenue losses, and business revenue losses in the
state of Florida, the United States, and around the world. All these studies (detailed below)
show that red tide and other harmful algal bloom events have a negative impact on various
economic sectors. However, these impacts were studied over a short time horizon or
assumptions and estimations were administered to calculate economic losses which may
produce inaccurate results that do not account for time varying controls. In addition, most data
used in prior studies were collected via surveys for affected industries and qualitative analysis
were employed. Studies using surveys did not capture the dollar effects on the tourism industry
for these coastal communities’ due to the presence and various intensity of a red tide event.
This research extends and adds to prior literature in that it quantitatively pairs tax
revenue data from recreational and tourism industries with the intensity of red tide events along
the western central coast of Florida. This study seeks to understand and quantify the welfare
losses in terms of forgone gross tax revenues from tourism and related recreational industries
attributed to red tide events. Data on monthly municipality gross tourism tax revenue for three
coastal counties along the western central coast of Florida varying from 2000-2015 will be
used with the data that displays the specific location and intensity of red tide events for the
selected time frame.
The ongoing threat of harmful algal blooms worldwide and along the coastline of
Florida remain significant. Investigating and reporting human health costs, economic impacts,
and social impacts are stepping stones to provide sufficient information to policy and decision

5
makers for local, state, national, and global entities to understand, manage, and mitigate coastal
communities from harmful algal bloom events (Backer, 2009).

6
2. LITERATURE REVIEW
Extant literature related to the natural occurrence of harmful algal blooms and red tide
impacts can be separated into four main themes for the direction of this research: diverse
species of harmful algal blooms and their geographic location (Jin et al., 2008; Glibert et al.,
2005; Granéli et al., 1999; Villarino et al., 1995), impacts on commercial fisheries (Jin et al.,
2008; Flewelling et al., 2005; Hoagland et al., 2002; Evans and Jones, 2001; Anderson et al.,
2000; Poli et al., 2000; Shumway, 1990; Habas and Gilbert, 1974), impacts on human health
(Hoagland et al., 2009; Fleming et al., 2007; Flewelling et al., 2005; Hoagland et al., 2002;
Anderson et al., 2000), and, ultimately, impacts on tourism and recreation (Backer, 2009;
Larkin and Adams, 2007, Anderson et al., 2000). The sections from this review will assist in
the proposed direction of this research by determining specifically why the species K. brevis
is studied and why the selected western coastline of Florida within the Gulf of Mexico is the
focus for this study.
2.1. “Red Tide” Overview
As previously mentioned, the term “red tide” does not directly insinuate that K. brevis
is the corresponding species. In fact, there are numerous species of algae that form into a
harmful algal bloom and, more specifically, a red tide event throughout the world, for example,
Alexandrium fundyense along the northeast coast of the United States (Jin et al., 2008). Another
example includes Villarino et al. (1995) studying the diel vertical migration of five common
species capable of causing red tides located in the northwest region of Spain in Ría de Vigo.
Diel vertical migration is the study of how phytoplankton migrate through the water column
to take up nutrients. Their study involved Ceratium furca, Scrippsiella trochoidea, Dinophysis
acuminate, Mesodinium rubrum, and Eutreptiella spp. Diel vertical migration is beneficial to
the survival of phytoplankton and dinoflagellate species by enabling them to obtain light at the
surface during the day and then take up nutrients in deeper waters at night, increasing
encounters for sexual reproduction, and protection from scavenging predators (Glibert et al.,
2005; Villarino et al., 1995). This process has the ability to stimulate blooming instances in
nutrient-poor surface layers of coastal regions and in the open ocean (Villarino et al., 1995).

7
2.2. Commercial Fishery Impacts
Commercial fisheries are highly susceptible to any harmful algal bloom event in the
United States and throughout the world. As stated earlier, during a harmful algal bloom event
harvested shellfish and coastal aquaculture may act as a host transporting various poisoning
effects when consumed by humans or may even become decease from exposure (Poli et al.,
2000). This, in turn, creates unmarketable harvests and economic losses by designating
closures to contaminated shellfish industries until the toxin can be filtered from the muscles of
the shellfish (Shumway, 1990; Flewelling et al., 2005). Contaminated shellfish consumption
can hospitalize individuals with syndromes such as neurotoxic (NSP), paralytic (PSP),
diarrheic (DSP), and amnesic shellfish poisoning (ASP) (Flewelling et al., 2005; Hoagland et
al., 2002). This section of the review identifies previous research addressing the generated
economic revenue loss from shellfish and aquaculture closures and restrictions during harmful
algal bloom events throughout the United States as well as K. brevis induced events in Florida.
Economic losses from hospitalization will be reviewed in the following “Human health costs”
review section. The importance of this section to this research can be described by a technical
report from Anderson et al. (2000) that estimated the economic impacts of various harmful
algal blooms’ poisoning effects on wild harvest and loss of fish and shellfish resources from
1987 to 1992 throughout the United States. Annual impacts of the United States commercial
fishery industry were estimated anywhere from $13.82 million to $25.88 million with an
average of $18.95 million per year (2000 dollars) during the five-year time frame.
A case study prepared for Texas Parks and Wildlife by Evans and Jones (2001) reported
the red tide economic impact within Galveston County, Texas in 2000. Commercial oyster
fishery closures were addressed in this report to calculate the total direct losses associated with
the occurrence of Karenia brevis breve, formally known as Gymnodinium breve, from
September to December. Galveston bay has seven areas for the harvesting of molluscan
shellfish: North Approved Area (NAA), Central Approved Area (CAA), East Approved Area
(EAA), West Approved Area (WAA) and Conditionally Approved Areas One (CAA1), Two
(CAA2), and Three (CAA3). These harvesting areas are normally opened on November 1, then
beginning of the commercial oyster fishing season, and closed April 30. Closing of any area
during the harvesting season results in decreased harvesting amounts and negatively affecting
the oyster industry (Evans and Jones, 2001). The Texas Department of Health (TDH) closed

8
five of these areas prior to the harvesting season opening day. Three of the five, NAA, WAA,
and CAA1, extended the closure past opening day resulting in a total of 85 lost days. The
affected areas average monthly landings (barrels) and prices (2000 dollars) from 1990-1999
were compared to the monthly landings from September to December in 2000. The total direct
losses from this G. breve event in Galveston Bay resulted in an estimated $167,588 with
Galveston oysters priced at 39.21 per barrel in November and $39.24 per barrel in December.
The report exposes limitations that should be further investigated in future research findings,
such as localizing the severity, distribution, and persistence of the harmful algal species, along
with accurate local level data.
Alexandrium fundyense, a species of red tide that blooms along the north-east coast of
the United States, contaminated and closed shellfish harvesting beds throughout
Massachusetts, Maine, New Hampshire, and 15,000 square miles of federal waters from April
to August in 2005. The widespread intensity of this particular blooming incident was declared
a “commercial fisheries failure” by the United States National Oceanic and Atmospheric
Administration (NOAA) allowing fisherman to receive federal emergency assistance. Jin et al.
(2008) examined the economic effects (net revenue from fishing) by comparing and calculating
monthly shellfish value and harvest quantities from this specific red tide incident to a baseline
of preceding years not affected by a harmful algal bloom event. For this investigation, shellfish
value and harvest quantity data from 1990 to 2005 were collected from the National Marine
Fisheries Service along the affected northeast region of the United States. Time series
regression models were created to quantify the economic effects on shellfish supply and
harvest across the selected time frame for this study. The direct impacts in Maine resulted in a
revenue loss of $2.4 million and $400 thousand to the softshell clam and mussel fishery
industries respectively. Due to data limitations, Massachusetts direct impact revenue losses of
the commercial shellfish industry are estimated to be upward of $18 million producing evident
commercial shellfish harvest declines from April to July, including a near complete harvest
loss in June. Further limitations to this study include the increase in shellfish imports from
alternative markets mitigating the local harvest losses and shellfish price changes locally and
nationally due to the shellfish closures in Maine and Massachusetts (Jin et al., 2008).

9
Habas and Gilbert (1974) reported that the Florida red tide of 1971 presented
commercial and recreational fishing losses estimated at $20 million across seven coastal
counties. Some coastal counties and cities performed beach cleanups of dead fish and debris
resulting in lost costs such as St. Petersburg, Florida spending over $200,000. Fortunately, all
affected counties were experiencing economic and population growth which offset the
economic impacts from the red tide event. Future blooming incidents impacting areas not
undergoing economic and population growth may result in greater blooming severity and
increased economic damage (Habas and Gilbert, 1974).
2.3. Human Health Costs
Extensive literature and research examine the health effects from different poisonings
caused by harmful algal blooms throughout the world, but the costs associated with those
effects are scarcely studied. As mentioned previously, K. brevis, creates health complications
for individuals along the coastal communities of Florida by way of releasing brevetoxins that
create an aerosol disturbance causing eye and respiratory irritation with stronger adverse
reactions toward individuals with asthma or chronic lung disease and by contaminating
shellfish creating poisoning effects from human consumption (Fleming et al., 2007; Flewelling
et al., 2005). Although understanding the effects humans are capable of contracting during a
red tide event are important, investigating the economic and health costs associated with those
effects should be equally significant in order to make future recommendations towards
mitigation strategies. For example, the report written by Anderson et al. (2000) estimated that
public health costs to various harmful algal bloom species throughout the United States
averaged $22 million from the study period of 1987 to 1992.
According to research conducted by Hoagland et al. (2002), the overall cost of medical
treatment increases for the individual experiencing the effects associated with harmful algal
blooms in the United States. The research conducted by Hoagland et al. (2002) examined
multiple species of harmful algal blooms and their accompanying poisoning consequence
located throughout the United States from 1987 to 1992. Economic effects were calculated
using the gross revenues lost from production, medical costs, and costs connected with
environmental monitoring and management. Data collected from surveying experts along
coastal states provided means for an economic analysis by examining health related costs from

10
reported and unreported events during a harmful algal bloom event nationally. At the time this
study was conducted Hoagland et al. (2002) states, “…the type and amount of available data
were limited. Most coastal states have neither conducted economic studies of the effects of
harmful algal blooms nor collected data that can be used to generate reliable quantitative
estimates of such effects.” Calculations from this investigation report that an estimated $1,400
per reported illness and $1,100 per unreported illness were lost due to paralytic shellfish
poisoning (PSP) and amnesiac shellfish poisoning (ASP) in the United States. Effects from
PSP and ASP during this time frame presented public health costs at an annual average of $400
thousand lost. Hoagland et al. (2002) then examined the public health costs associated to
ciguatera fish poisoning (CFP), another previously mentioned poisoning caused by toxic algae,
and reported that approximately $1,000 per reported case and $700 per unreported case were
lost. Total economic effect estimates that CFP causes $15 to $22 million per year, averaging
$19 million, lost annually. Hoagland et al. (2002) explains that most of public health costs are
due to CFP within tropical jurisdictions. While important, this publication does not investigate
the health or economic costs caused by K. brevis bloom, specifically, along the gulf coast of
Florida.
Hoagland et al. (2009) returned to the subject of harmful algal blooms health costs with
an investigation directly toward K. brevis and the Florida Gulf coast from October 2001 to
September 2006 in Sarasota, Florida. Hoagland et al. (2009) collected data that reflected
respiratory visits to Sarasota Memorial Hospital, the closest coastal hospital in Sarasota
County, emergency departments with conditions such as rhinorrhea, a condition where mucus
fluid fills the naval cavity, nonproductive coughing, severe bronchoconstriction, upper and
lower respiratory illnesses, and significant changes in lung function for asthmatics during and
without a red tide event. The model used in this investigation expresses the relationship
between the number of respiratory illness visits to the hospital, K. brevis cell count, and
explanatory variables such as, environmental and weather conditions and number of tourists
visiting Sarasota County. Two sample locations in Sarasota Bay were analyzed daily during a
blooming event and weekly when there were no blooms in effect. The sample locations
collected data pertaining to cell counts of K. brevis in order to quantify aerosolized brevetoxin
amounts in the local atmosphere. Cell count levels were further designated levels of low,
medium, and high severity. Tourism visitation, as an explanatory variable, were estimated by

11
monthly hotel, motel, mobile home, campsite, apartments, condominium, and house
occupancy rates assuming two people per hotel/motel, condominium, or apartment and four
people per campsite, mobile home, or house. The results from the model show that emergency
department visits were correlated with K. brevis cell counts and Sarasota County tourist visits.
The model predicted that during a low level red tide bloom there was an annual estimate of 39
visits to the hospital, a medium level bloom estimated 76 visits and a high bloom event
estimated 218 visits throughout the five-year period. An economic impact assessment was then
made by Hoagland et al. (2009) to measure the health costs from aerosolized brevetoxins in
Sarasota County. Using the predicted emergency department visits due to low, medium, and
high-level bloom events and capitalized costs, which are lost productivity wages and expenses
for medical treatment and care, ranged from $0.5 to $4 million in Sarasota County alone from
October 2001 to September 2006. Hoagland et al. (2009) states, “We expect that the costs of
illness should be much greater for the entire Florida Gulf Coast… it will become increasingly
necessary to understand the full scale of the economic losses associated with K. brevis blooms
in order to make rational choices about appropriate mitigation” (Hoagland et al., 2009).
2.4. Tourism Impacts
As previously stated, tourism is a vital source of income for the state of Florida and its
coastal communities year-round along the Gulf of Mexico (Backer, 2009). This region brings
people from all over the world for its pristine beaches and coastal attractions. Hotels,
restaurants, beaches, and other popular tourist attractions are negatively impacted by the
occurrence of red tides as they are becoming more predominate (Anderson et al., 2000). The
report written by Anderson et al. (2000) addresses that there are relatively few available data
to describe the impacts on the economically important tourism and recreation industries, but
estimates that recreation and tourism impacts from various harmful algal bloom species
throughout the United States ranged from zero to $29.30 million with an average of $6.63
million (2000 dollars) from the study period of 1987 to 1992.
More recently, Larkin and Adams (2007) analyzed red tide effects on the lodging and
restaurant industries by focusing their research study area towards two ZIP codes in Okaloosa
County, Florida. Destin (32541) and Ft. Myers Beach (32548) were selected due to their
proximity to the coastal waters where red tide has the ability to influence the local businesses
12
in these areas. Monthly gross tax revenues from each industry were acquired for the selected
ZIP codes from the Florida Department of Revenue through January 1995 to December 1999.
Increases in real revenue for both industries throughout the five-year period most likely reflects
a growth in the number of reporting establishments rather than increase in revenues for
businesses initially from early 1995 (Larkin and Adams, 2007).
Red Tide Status Reports compiled by the Florida Marine Research Institute contained
red tide occurrence data that was used for this research. Monthly red tide collections of 10,000
cells per liter or more were valued as 1 and 0 otherwise for the Destin and Ft. Myers Beach
locations. Larkin and Adams (2007) used a multiple regression time-series model to assess the
economic impacts of monthly red tide events and the controlling variables in these two regions.
The Durbin-Watson (DW) statistic was utilized to correct autocorrelation to ensure the
model properly accounted for the time variable. Findings from the article by Larkin and Adams
(2007) show that the presence of a hurricane or tropical storm reduced restaurant revenues by
$532,000 for each affected month, and, although negative, was not statistically significant on
the lodging sector. The presence of red tide, low and strong intensities, resulted in a statistically
significant decline in both the restaurant and lodging sector revenues. Larkin and Adams
(2007) show that average monthly revenues from restaurants and the lodging sectors reduced
by 29.3% and 34.6%, respectively, with the presence of red tide. The total revenue losses from
these two tourism-dependent sectors results in approximately $6.5 million, or 32.3%, for each
month that experienced at least a low intensity red tide level event. The lodging sector in this
study by Larkin and Adams (2007) had larger revenue losses from red tide events and was
statistically significant where the control variables, precipitation levels and tropical storm
identification, has no adverse effects. Larkin and Adams (2007) propose that additional data,
such as in-depth revenue losses in a more refined area, cleanup costs, and red tide-related
promotions, would improve the economic impact assessment estimates in future research
models.

13
3. CONCEPTUAL MODEL
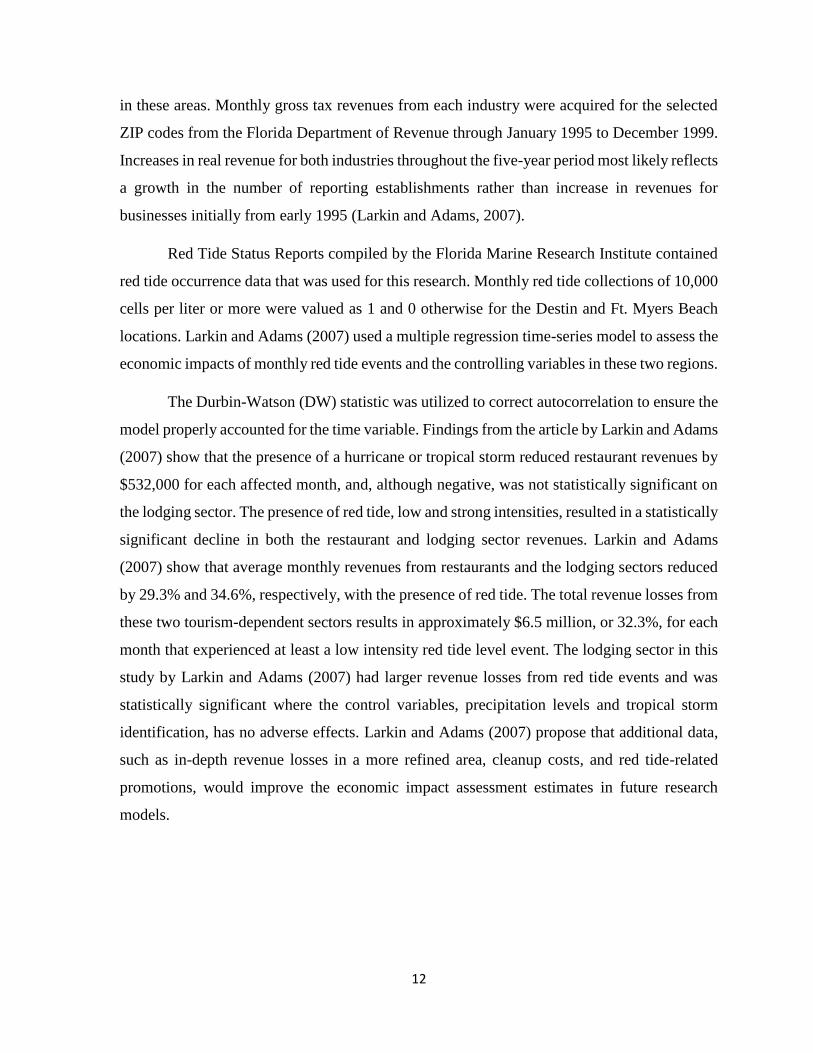
An overall conceptual model of the study is displayed in Figure 1. Red tide data
(independent variable) were analyzed within the study area along with the physical controls to
predict the effects on tourism tax revenue (dependent variable). The previously stated literature
review assists the reasoning for selected variables and the connections between the dependent
and control variables to the independent variable. The independent variable controls for the
collected cells/liter at a given location along the coast of Florida. The independent variable will
be related to tourism tax revenue for each county and their associated municipalities for the
varying years and months. The physical controls are hurricane/tropical storm presence, lodging
businesses total, and the individual months as dummy variables. The study by Larkin and
Adams (2007) identified the presence of hurricanes and tropical storms in their study area to
be statistically significant to the loss in tourism revenue. Tourists may be inclined to avoid
traveling to an area that has is experiencing a hurricane or tropical storm creating a loss in
tourism tax revenue. The literature review conducted was not able to identify any studies that
accounted for the total amount of lodging facilities in their study areas where tourism tax
revenues were examined. Municipalities vary in size and in the total amount of lodging
facilities capable of collecting the studied tourism tax revenue. Monthly control variables were
generated due to the seasonality differences of tourism tax revenue. These physical control
variables are most common throughout the selected study area and are needed to determine the
main cause of any impacted tourism revenue.
14
Figure 1: Conceptual model of study
3.1. Hypothesis
It is hypothesized that:
Individual Intensity: A unit increase in cell intensity (cells/liter) by month of a red tide
event will result in significantly greater tourism tax revenue losses.
15
4. RESEARCH METHODS
4.1. Study Area
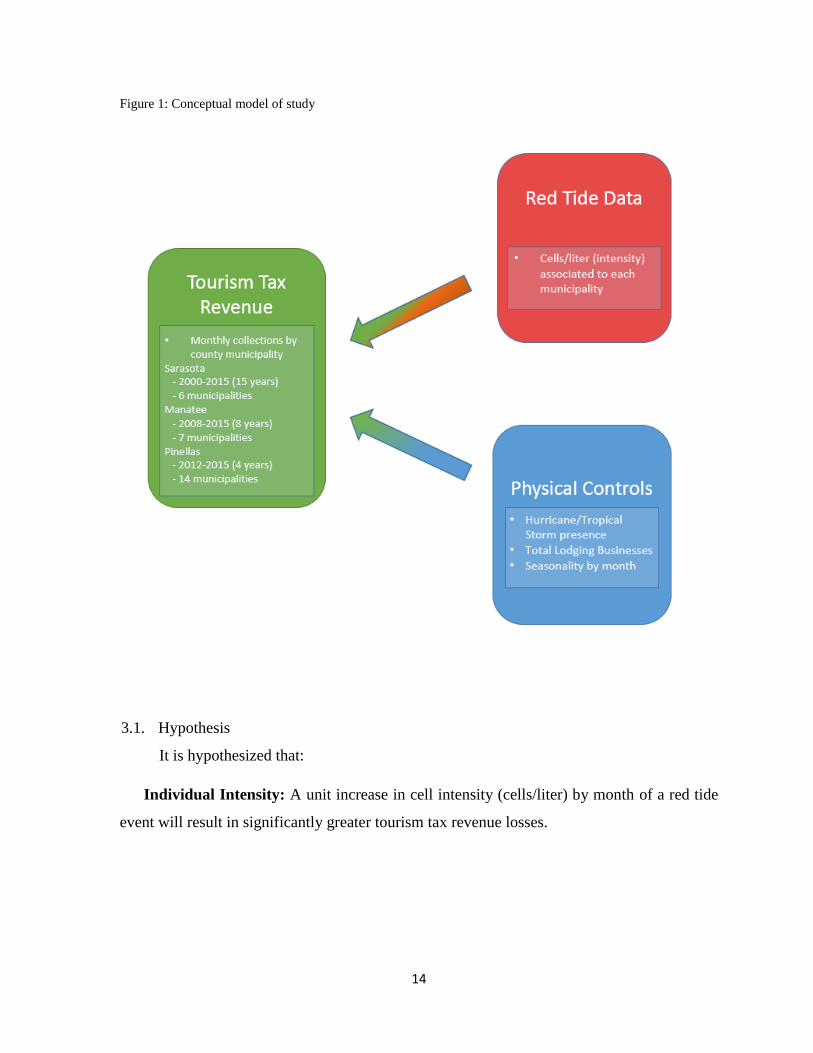
In this study, total tourism tax revenues collected from the counties of Pinellas,
Manatee, and Sarasota along the central Gulf of Mexico coast of Florida (Figure 2) over the
study period should accurately reflect the effect red tide incidents have on the tourism industry
directly. This 3-county area is selected specifically for this study due to their attractive tourism
accommodations, increased exposure and proximity to the coastline where red tide events are
most common. These counties experience most red tide events and visitors may not fully
understand the economic impacts caused by these events. The study area for this proposed
research are the municipalities that make up the 3 central Florida counties (Pinellas, Sarasota,
and Manatee) along the Gulf of Mexico coast (Figure 3). Municipalities allow for a more
accurate analysis to understand the economic impacts by specific community. Boundary
shapefiles for individual municipalities that are formatted for use in ArcMap are downloaded
from each County’s GIS Portal available online. Tourism tax revenue data will be collected
from each county tax collection office. As mentioned previously, these taxes include all
generated revenues associated with hotel/motel, apartment/condominium, and mobile home
sites. Pinellas County describes these taxes as “Local Option Tax Reports”, Sarasota County
terms it “Tourist Development Taxes”, and Manatee County uses “Resort Taxes”. The data
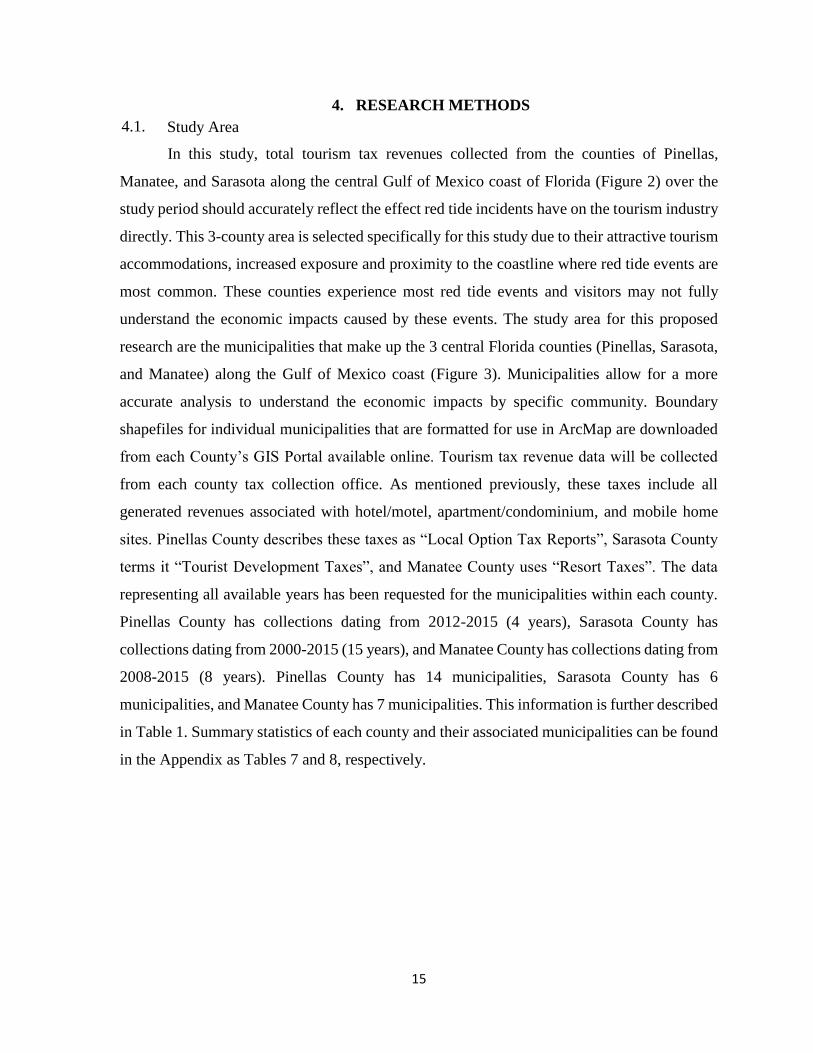
representing all available years has been requested for the municipalities within each county.
Pinellas County has collections dating from 2012-2015 (4 years), Sarasota County has
collections dating from 2000-2015 (15 years), and Manatee County has collections dating from
2008-2015 (8 years). Pinellas County has 14 municipalities, Sarasota County has 6
municipalities, and Manatee County has 7 municipalities. This information is further described
in Table 1. Summary statistics of each county and their associated municipalities can be found
in the Appendix as Tables 7 and 8, respectively.
16
Table 1: Descriptive table of counties and municipalities’ tax collection data
Florida
Counties
County Tax
Description
Total
Municipalities
Years of Months
Available
Source
Pinellas Local Option Tax
Reports
14 2012-2015 (4
years)
Pinellas County Tax
Collector – Tourist
Development Taxes
Sarasota Tourist
Development Tax
6 2000-2015 (15
years)
Sarasota Tax
Collection Office
Manatee Resort Tax 7 2008-2015 (8
years)
Manatee County
Resort Tax
Collection Office
Figure 2: The 3-county study area (Pinellas, Manatee, and Sarasota)

17
Figure 3: The municipalities located within the 3-county study area
18
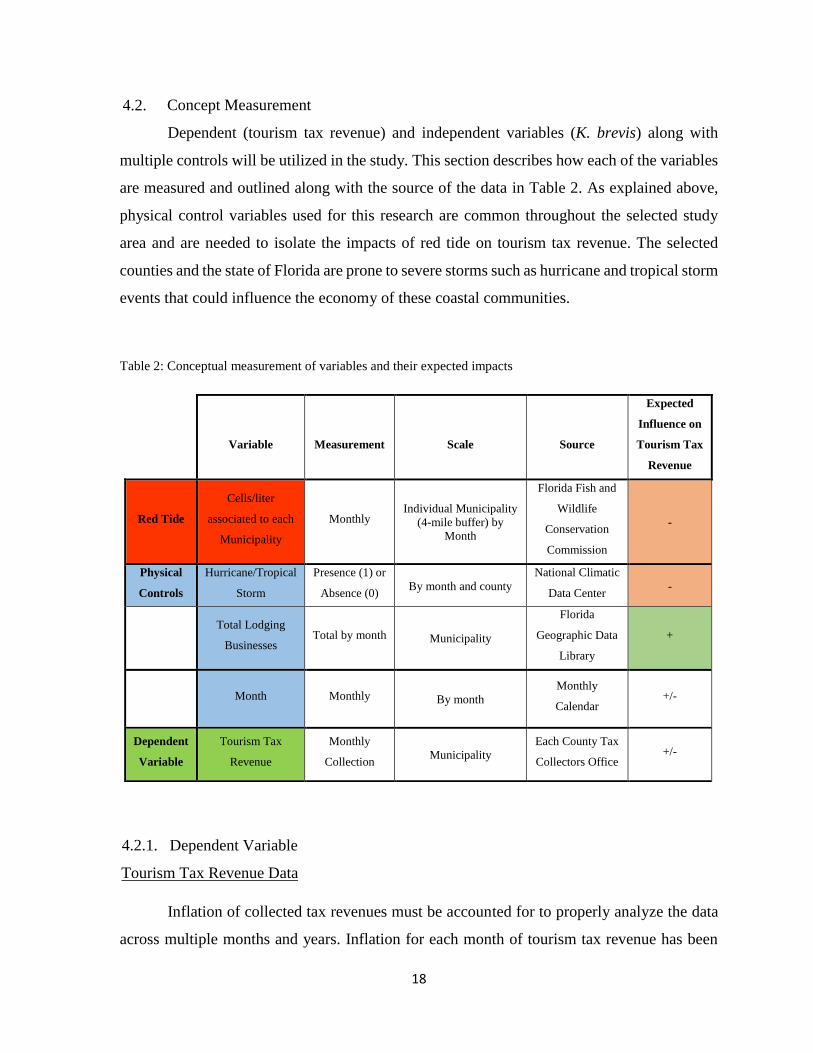
4.2. Concept Measurement
Dependent (tourism tax revenue) and independent variables (K. brevis) along with
multiple controls will be utilized in the study. This section describes how each of the variables
are measured and outlined along with the source of the data in Table 2. As explained above,
physical control variables used for this research are common throughout the selected study
area and are needed to isolate the impacts of red tide on tourism tax revenue. The selected
counties and the state of Florida are prone to severe storms such as hurricane and tropical storm
events that could influence the economy of these coastal communities.
Table 2: Conceptual measurement of variables and their expected impacts
4.2.1. Dependent Variable
Tourism Tax Revenue Data
Inflation of collected tax revenues must be accounted for to properly analyze the data
across multiple months and years. Inflation for each month of tourism tax revenue has been
Variable Measurement Scale Source
Expected
Influence on
Tourism Tax
Revenue
Red Tide
Cells/liter
associated to each
Municipality
Monthly Individual Municipality
(4-mile buffer) by
Month
Florida Fish and
Wildlife
Conservation
Commission
-
Physical
Controls
Hurricane/Tropical
Storm
Presence (1) or
Absence (0) By month and county
National Climatic
Data Center -
Total Lodging
Businesses Total by month Municipality
Florida
Geographic Data
Library
+
Month Monthly By month
Monthly
Calendar +/-
Dependent
Variable
Tourism Tax
Revenue
Monthly
Collection Municipality
Each County Tax
Collectors Office +/-
19
calculated to the Consumer Price Index (CPI) of the last recorded month, December of 2015.
The resulting inflated tax revenue data, known as real prices (Appendix: Figure 4), will be
further transformed by calculating the natural log to ensure a normal distribution across the
recorded months. This normal distribution from calculating the natural log of the real prices is
needed to properly analyze the results from the regression model used in this study. Histograms
of the real prices compared to the natural log of revenue histogram can be found in the
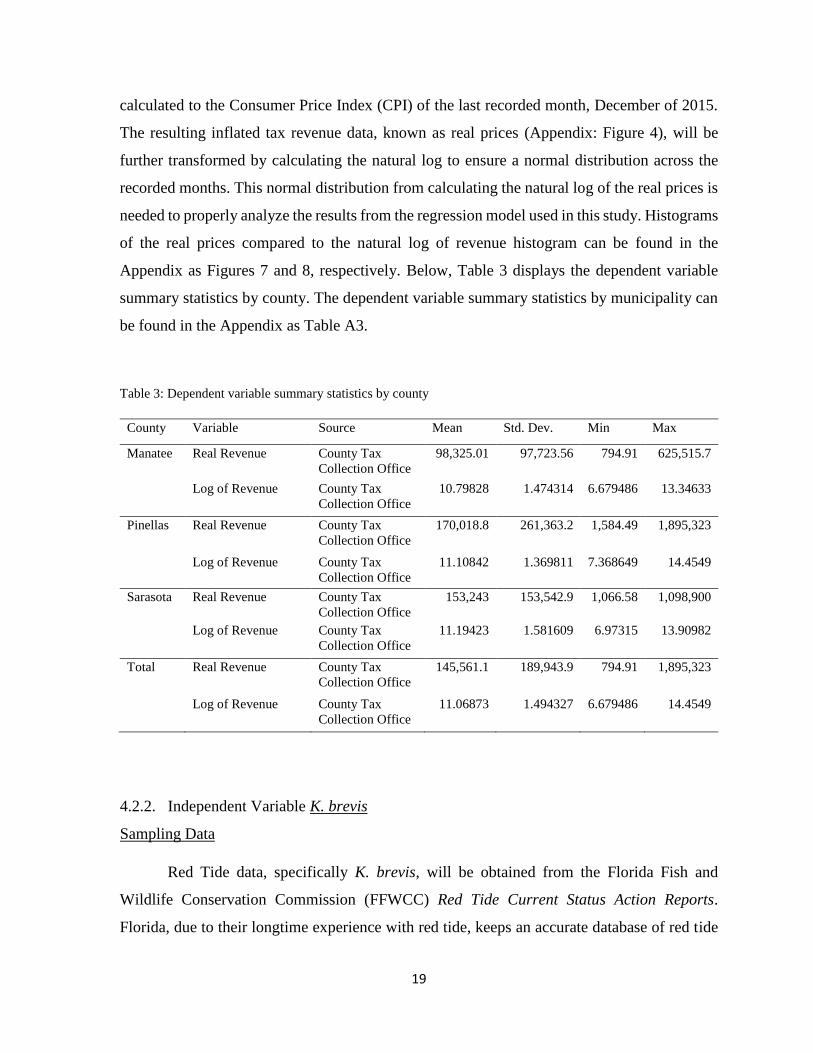
Appendix as Figures 7 and 8, respectively. Below, Table 3 displays the dependent variable
summary statistics by county. The dependent variable summary statistics by municipality can
be found in the Appendix as Table A3.
Table 3: Dependent variable summary statistics by county
County Variable Source Mean Std. Dev. Min Max
Manatee Real Revenue County Tax
Collection Office
98,325.01 97,723.56 794.91 625,515.7
Log of Revenue County Tax
Collection Office
10.79828 1.474314 6.679486 13.34633
Pinellas Real Revenue County Tax
Collection Office
170,018.8 261,363.2 1,584.49 1,895,323
Log of Revenue County Tax
Collection Office
11.10842 1.369811 7.368649 14.4549
Sarasota Real Revenue County Tax
Collection Office
153,243 153,542.9 1,066.58 1,098,900
Log of Revenue County Tax
Collection Office
11.19423 1.581609 6.97315 13.90982
Total Real Revenue County Tax
Collection Office
145,561.1 189,943.9 794.91 1,895,323
Log of Revenue County Tax
Collection Office
11.06873 1.494327 6.679486 14.4549
4.2.2. Independent Variable K. brevis
Sampling Data
Red Tide data, specifically K. brevis, will be obtained from the Florida Fish and
Wildlife Conservation Commission (FFWCC) Red Tide Current Status Action Reports.
Florida, due to their longtime experience with red tide, keeps an accurate database of red tide
20
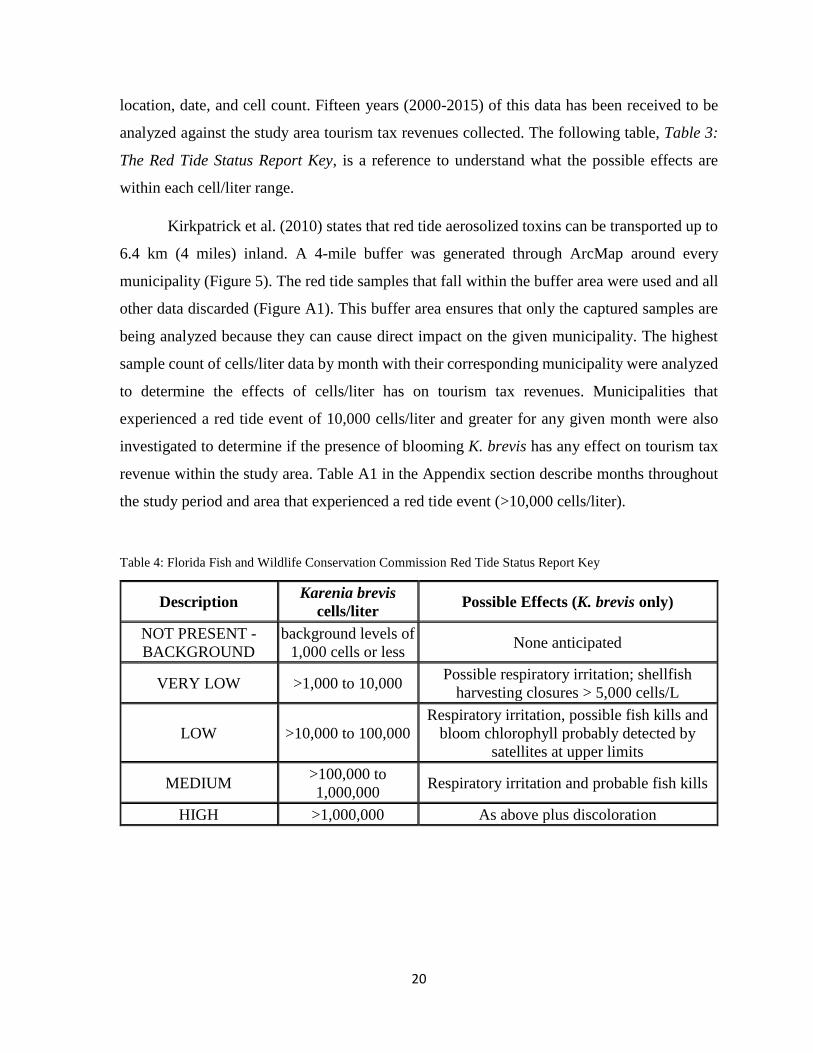
location, date, and cell count. Fifteen years (2000-2015) of this data has been received to be
analyzed against the study area tourism tax revenues collected. The following table, Table 3:
The Red Tide Status Report Key, is a reference to understand what the possible effects are
within each cell/liter range.
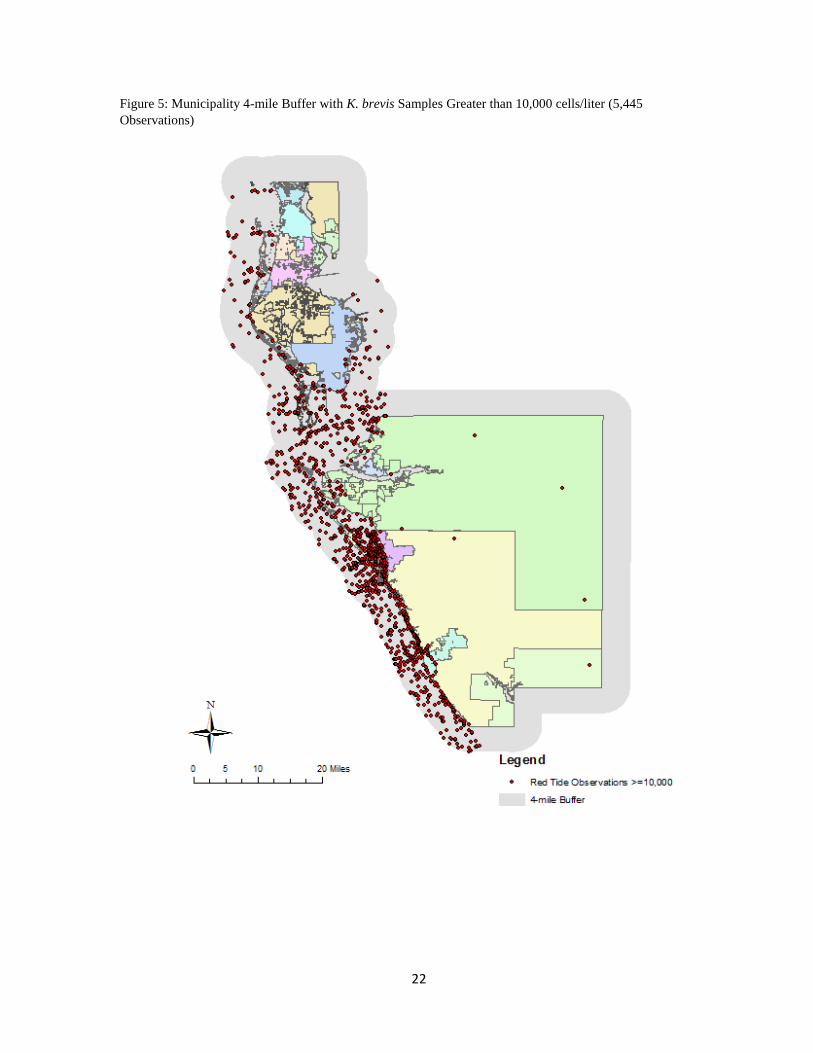
Kirkpatrick et al. (2010) states that red tide aerosolized toxins can be transported up to
6.4 km (4 miles) inland. A 4-mile buffer was generated through ArcMap around every
municipality (Figure 5). The red tide samples that fall within the buffer area were used and all
other data discarded (Figure A1). This buffer area ensures that only the captured samples are
being analyzed because they can cause direct impact on the given municipality. The highest
sample count of cells/liter data by month with their corresponding municipality were analyzed
to determine the effects of cells/liter has on tourism tax revenues. Municipalities that
experienced a red tide event of 10,000 cells/liter and greater for any given month were also
investigated to determine if the presence of blooming K. brevis has any effect on tourism tax
revenue within the study area. Table A1 in the Appendix section describe months throughout
the study period and area that experienced a red tide event (>10,000 cells/liter).
Table 4: Florida Fish and Wildlife Conservation Commission Red Tide Status Report Key
Description Karenia brevis
cells/liter Possible Effects (K. brevis only)
NOT PRESENT -
BACKGROUND
background levels of
1,000 cells or less None anticipated
VERY LOW >1,000 to 10,000 Possible respiratory irritation; shellfish
harvesting closures > 5,000 cells/L
LOW >10,000 to 100,000
Respiratory irritation, possible fish kills and
bloom chlorophyll probably detected by
satellites at upper limits
MEDIUM >100,000 to
1,000,000 Respiratory irritation and probable fish kills
HIGH >1,000,000 As above plus discoloration

21
Figure 4: Individual municipality 4-mile buffer with K. brevis sample location
Table 5: Number of sample locations within and outside of total buffer zone
Number of Observed Samples Percentage of Total
Within 4-mile Buffer 32,490 42.02%
Outside 4-mile Buffer 44,816 57.97%
FFWCC Total 77,306 100%
22
Figure 5: Municipality 4-mile Buffer with K. brevis Samples Greater than 10,000 cells/liter (5,445
Observations)

23
4.2.3. Physical Control Variables
Hurricane/Tropical Storm Data
Larkin and Adams (2007) used precipitation, hurricane and tropical storm data obtained
from the National Climatic Data Center Storm Events Database as controls for their study. This
research used physical controls, specifically hurricane and tropical storm presence, following
closely with the study structure by Larkin and Adams (2007). Larkin and Adams (2007) created
a binary variable with a value of 1 for the presence of red tide (>10,000 cells/liter) and 0 with
no presence (<10,000 cells/liter) to indicate a red tide event in the study area. Control variables
on tropical storms, hurricanes and precipitation values were collected from the closest
precipitation reporting station from the National Climatic Data Center (NCDC). Binary
variables were created with a value of 1 for the presence of a tropical storm or hurricane and 0
with no presence for each month. Larkin and Adams (2007) concluded that precipitation input
was not statistically significant in tourism revenue loss from hotels and motels, but was
statistically significant in revenue loss from restaurants. Using Larkin and Adams (2007) as an
example, precipitation data will not be used as a control variable for this study because only
lodging revenues are being analyzed.
This study identifies the monthly presence or absence of storms that reached at least a
tropical storm categorization (including hurricanes) that made landfall in Florida and will be
given a value of 1 or 0, respectively. Although a hurricane or tropical storm may not have been
present in the study area, the presence and potential of one of these impacting the state of
Florida may influence the lodging sector throughout the entire state.
Lodging Data
Previous studies examining the economic impacts from red tide events have not taken
into consideration the total amount of lodging facilities in their study areas. This data is used
as a control variable because some municipalities generate greater tourism tax revenues due to
having more lodging businesses than other municipalities. Tourism tax revenue is collected
from multiple types of lodging facilities, such as hotels, motels, condominiums, apartments,
and mobile home sites. The Florida Geographic Data Library (FGDL) manages state-wide data
on these facility types recording when each business was built and how many units are
associated with each facility.

24
The total facility count for each lodging type has been aggregated by month at the
municipality scale using the dates that each business began. This data is used as a control
variable because some municipalities generate greater tourism tax revenues due to having more
lodging businesses than other municipalities.
Monthly Control
Florida, as a major tourist destination, has seasonality differences in terms of economic
revenue between months throughout the year. Dummy variables are assigned to each month to
ensure that seasonal effects are considered when using a panel-data regression model.
4.3. Data Analysis
Analysis of this data, statistically and visually, takes the form of descriptive statistics
and regression diagnostics, such as testing for serial correlation, cross-sectional dependence,
heteroskedasticity, and multicollinearity. These multivariate statistical tests will determine
what type of model to implement, and will describe how to properly adjust the model based on
the provided data measurements. Summary statistics are further described in the Appendix
section by the variable name, data source, mean, standard deviation, minimum value, and
maximum value for the county- and municipality-level in Table A2 and Table A3, respectively.
An unbalanced model is generated due to the differing availability of yearly and monthly
municipality revenue data. All months within unaccountable municipalities are created but
given no value.
Regression Diagnostics
As mentioned previously, the data for this study is longitudinal in nature, often referred
to as panel data, cross-section time-series (CSTS) data or pooled data. The design of this data
is advantageous due to its ability to study multiple locations over a given period. In this case,
twenty-seven municipalities over a total of fifteen years are included in the structure of this
research. Yearly and monthly data collections of red tide sampling locations, paired with the
monthly control variables and the monthly municipality tourism tax collection data will
appropriately test each hypothesis stated for this research. Although CSTS data can be
advantageous in terms of statistical analysis, testing for violated assumptions in the dataset

25
must be conducted to ensure the most efficient CSTS regression model is selected. Violated
assumptions within the dataset were detected by testing for serial correlation, cross-sectional
dependence, heteroskedasticity, and multicollinearity.
Serial Correlation
When dealing with repeated observations over various time intervals, CSTS data are
often biased toward the standard errors and causes results to be less efficient (Drukker, 2003).
The stated biases are termed “serial correlation” and are determined using the Wooldridge
(2002) test through Stata statistical software. The Wooldridge (2002) test was conducted on
the proposed CSTS model, and the results indicated serial correlation was not present in the
dataset. Results from this test can be found in the Appendix as Figure A4.
Cross-sectional Dependence
Cross-sectional dependence is another potential violation of the assumptions for the
regression model used and occurs when there are correlations in the error term that may be
caused by the unobserved observations within the study period. The presence of cross-sectional
dependence in the CSTS dataset may result in biases towards the stand errors (Driscoll and
Kraay, 1998). The Pesaran’s (2004) test, Friedman’s (1937) test, and Frees’ (1995) test have
been proposed using Stata statistical software by Hoyos and Sarafidis (2006) to determine if
cross-sectional dependence exists in the CSTS dataset. Results from these three tests show that
cross-sectional dependence in the proposed model is present leading to the use of robust
standard errors in the CSTS regression model, see Appendix Figure A5.
Heteroskedasticity
The assumption of constant variance in the error terms is violated if there is
heteroskedasticity present in the data. CSTS datasets may have non-constant variance across
observations over time (Baltagi, Song and Kwon, 2009). The use of the Stata statistical
software and the Breusch-Pagan/Cook-Weisberg test for heteroskedasticity show that the error
terms in the model do not support constant variance across the observations, supporting the
use of robust standard errors in the final regression model, see Appendix Figure A6.

26
Multicollinearity
Variables of different measurements that are highly correlated, becoming unstable and
having inflated standard errors, can reduce the statistical power of the regression model
(Graham, 2003). Variance inflation factor (VIF) tests the collinearity of the variables within
the regression model. Diagnostics of variable collinearity on the CSTS regression model shows
that there are no multicollinearity issues with the measured data, see Appendix Figure A7.
Model Selection
Based on the results from the multivariate statistical tests, the hypothesis that the
individual K. brevis intensity (cells/liter) by month of a red tide event creating significantly
greater tourism tax revenue loss will be analyzed using a CSTS regression model with robust
standard errors. Using robust standard errors in the CSTS regression model is assumed because
of the results from the multivariant tests; serial correlation was not present, presence of cross-
sectional dependence, constant variance is not supported, and there are no multicollinearity
issues with the variables within the dataset.
27
5. RESULTS
The statistical models selected for this study helps to explain the effects of K. brevis
presence and individual cell intensity on tourism tax revenue collected by coastal
municipalities along the central gulf of Florida. Results of the model are addressed further for
a more descriptive analysis of the influences made by the independent and control variables on
the dependent variable throughout the study period.
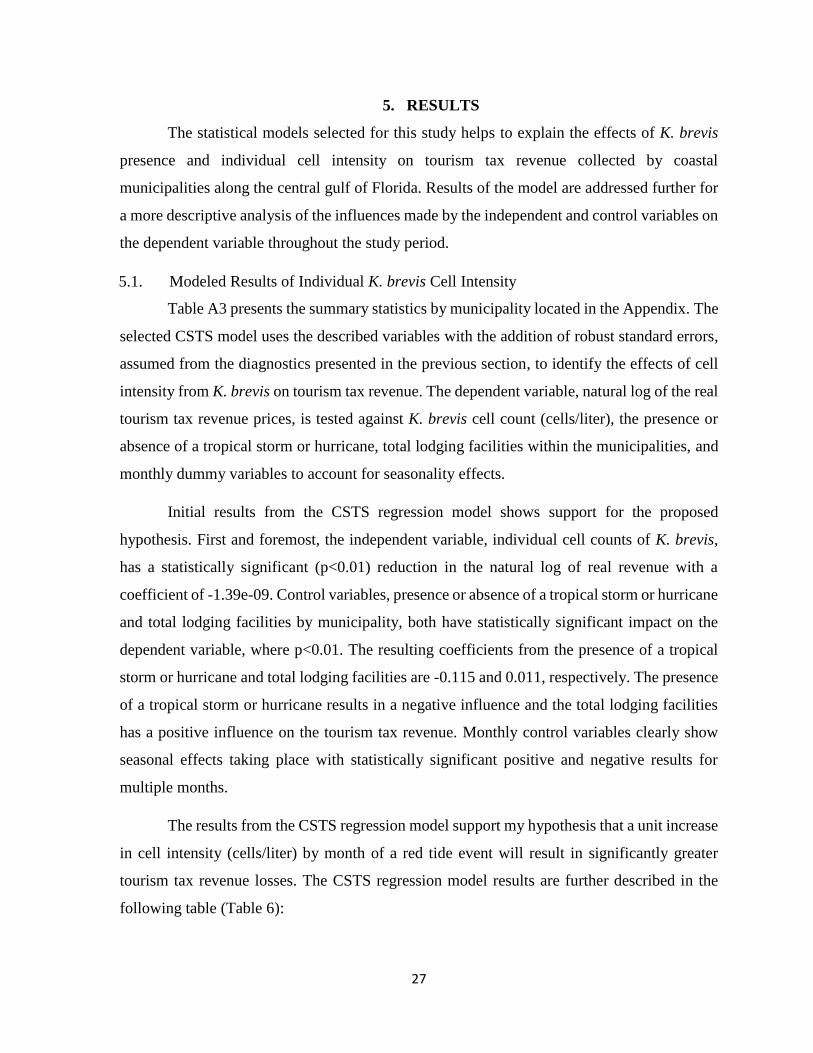
5.1. Modeled Results of Individual K. brevis Cell Intensity
Table A3 presents the summary statistics by municipality located in the Appendix. The
selected CSTS model uses the described variables with the addition of robust standard errors,
assumed from the diagnostics presented in the previous section, to identify the effects of cell
intensity from K. brevis on tourism tax revenue. The dependent variable, natural log of the real
tourism tax revenue prices, is tested against K. brevis cell count (cells/liter), the presence or
absence of a tropical storm or hurricane, total lodging facilities within the municipalities, and
monthly dummy variables to account for seasonality effects.
Initial results from the CSTS regression model shows support for the proposed
hypothesis. First and foremost, the independent variable, individual cell counts of K. brevis,
has a statistically significant (p<0.01) reduction in the natural log of real revenue with a
coefficient of -1.39e-09. Control variables, presence or absence of a tropical storm or hurricane
and total lodging facilities by municipality, both have statistically significant impact on the
dependent variable, where p<0.01. The resulting coefficients from the presence of a tropical
storm or hurricane and total lodging facilities are -0.115 and 0.011, respectively. The presence
of a tropical storm or hurricane results in a negative influence and the total lodging facilities
has a positive influence on the tourism tax revenue. Monthly control variables clearly show
seasonal effects taking place with statistically significant positive and negative results for
multiple months.
The results from the CSTS regression model support my hypothesis that a unit increase
in cell intensity (cells/liter) by month of a red tide event will result in significantly greater
tourism tax revenue losses. The CSTS regression model results are further described in the
following table (Table 6):

28
Table 6: Cross section time-series regression model results
Natural Log of Real Revenue
Individual K. brevis (cells/liter) -1.39e-09
(3.40)**
Tropical Storm/Hurricane Presence -0.115
(6.37)**
Total Lodging Facilities 0.011
(3.35)**
January 0.304
(3.93)**
February 0.581
(12.96)**
March 0.906
(27.63)**
April 0.515
(6.36)**
May 0.123
(1.65)
June 0.145
(1.86)
July 0.145
(1.66)
August -0.070
(0.77)
September -0.293
(3.58)**
October -0.218
(4.70)**
November -0.214
(5.05)**
Constant 9.460
(25.81)**
R-Squared .3214
Observations 2760
Number of Municipalities 26
Notes: ** p<0.01; * p<0.05

29
6. DISCUSSION
6.1. Discussion of Model Results
Results from the CSTS regression model supports the hypothesis that a unit increase in
cell intensity (cells/liter) by month of a red tide event will lead to significantly greater tourism
tax revenue losses. There are several important findings from the model that warrant further
discussion.
First, when the real prices of tourism tax revenues were naturally logged to obtain a
normal distribution, the independent variable, K. brevis intensity, results in a statistically
significant (p<0.01) negative coefficient of -1.39e-09. This finding clearly represents that, as
K. brevis cell intensity increases, the natural log of tourism tax revenue in the lodging sector
decreases significantly. When a blooming event occurs, where the K. brevis cell count per liter
increases exponentially, it can be expected that the lodging sector along the selected coastal
communities will have a reduced revenue from the county-wide tourism tax than if there had
been no red tide influence. The research findings from this study assist the recommendation of
policies at three levels of government; federal, state and local.
Secondly, the presence of a harmful storm being categorized as a tropical storm or
hurricane impacts the coastal lodging industry with a statistical significant (p<0.01) coefficient
of -0.115. This negative coefficient, like K. brevis intensity, addresses the fact that these coastal
municipalities experience a statistically significant decrease in tourism tax revenue. Findings
from Larkin and Adams (2007) and this study show that the presence of tropical storms or
hurricanes has a negative influence on the selected study areas. Although these potentially
hazardous storms are unavoidable, it is interesting to note that the lodging industry collecting
this tourism tax are negatively influenced. The findings from this research can inform these
coastal municipalities on exactly how much tourism tax revenue is potentially being taken
away due to the presence of a tropical storm or hurricanes.
Lastly, as these coastal communities experience higher tourism traffic, it is inevitable
that more lodging facilities will be built. Findings from this study show that the total lodging
facilities for a municipality increase the natural logged tourism tax revenue with the
statistically significant (p<0.01) coefficient of 0.011. It can be assumed that municipalities with
higher lodging facility totals will have an increase in tourism tax revenue. This research
30
supports this assumption and can provide city planners with an estimate of how much tourism
tax revenue can be generated with the building of more lodging facilities.
6.2. Policy Recommendations
After examining the effects of red tide occurrences on the tourism revenue along the
western central coast of Florida, this research provides important insights into better informed
harmful algal bloom precaution policies. Initial results of this study show that the intensity of
a red tide bloom causes significant losses in the tourism industry, specifically the lodging
sector, throughout the study area. As harmful algal bloom occurrences increase in size,
intensity, and persistence along most the United States coastline, policy recommendations can
be implemented across the federal, state and local levels of government to reduce further
adverse economic impacts. All three of these levels of government would benefit from policies
that help reduce harmful algal bloom, specifically K. brevis, impacts on the lodging sector in
coastal communities.
6.2.1. Federal Policy Recommendations
Research investigating the life cycle of K. brevis along the Florida coastline addresses
the dependence this microorganism has on oceanic currents and water quality conditions
(Henrichs et al., 2015). The organism is transported to coastal bays and estuaries, nutrient-rich
areas, where it can thrive for longer periods of time (Tester et al., 1997). Records from the
FFWCC identify months with a medium-level, 100,000 cells/liter, and greater presence of red
tide. Most months that meet this criterion are seasonal, January to April and September to
December. Reducing nutrient-rich runoff towards bays and estuaries during months when red
tides are most severe is an avenue to pursue to reduce the sustained development of K. brevis
and economic impacts associated to its presence. Reducing nutrient-rich runoff can be
accomplished by establishing buffers around transport systems to the bays and estuaries, such
as rivers and streams. Buffers limit the amount of nutrient-rich substances, manure from
animals and chemical runoff, that could potentially come in contact with the transport systems.
6.2.2. State Policy Recommendations
The results from this research should influence the state of Florida to implement
policies that are geared towards monitoring when and where red tide occurs on a more
consistent schedule than what is currently in place by the FFWCC. The current monitoring

31
program reaches a small proportion of the Florida coastline and becomes more accurate in
response to an active red tide blooming event. Rather than becoming more accurate as a
response, policies that ensure accurate monitoring across a larger area and shorter timeframes
can benefit coastal communities in terms of resilience. Having the capacity to accurately record
when and where red tide, and other harmful algal blooms and water conditions, occurs will be
an advantage towards future research and economic planning initiatives.
A second policy recommendation at the state level of government would be mandating
all counties to record their tourism tax collections at the site-level, which would be aggregated
to the municipality level and, finally, the county level total. As a limitation to generating a
more accurate study, some coastal counties admit that they do not keep track of these records,
and they leave it for the state to aggregate to whatever spatial and temporal scale they deem
necessary. It would benefit the state of Florida to have a unified name for this tax collection,
such as “Tourist Development Tax” by county so there would be no confusion as to what this
tax collection entails. While most tax records are highly sensitive to the public, the state of
Florida can benefit from this data to make better informed policy decisions and proper planning
techniques to reduce the economic impacts that red tide events create.
6.2.3. Local Policy Recommendations
With the state of Florida enforcing a state-wide policy for localities to develop and
record a tourism tax by the recommended state policies, it would be beneficial to keep accurate
recordings of this tax collection at the site level. Site level tax records for future research can
assist community planners and business owners understand how impactful any disturbance
may be towards the revenue of the lodging sector. Every locality throughout the state of Florida
should adopt this method so that community and economic resiliency can be properly measured
by researches and local politicians.
Kirkpatrick et al. (2010) state that red tide aerosolized toxins can be transported up to
6.4 km (4 miles) inland. Communities can provide potential tourists with alternative lodging
that are not within the contaminated area with the accurate recording of red tide location and
severity during a blooming event. Lodging businesses closer to the coastline will be impacted
differently during a red tide when compared to those at a farther distance.
32
Using Lee County as an example, this county uses percentages of the tourist
development tax they collect to improve their local environment for increased tourism activity.
As stated previously, beach and shoreline improvements and maintenance uses 26.4% of the
total tourism development tax income, advertising and promotion uses 53.6%, and stadium
debt services uses the remaining 20% (Lee County Clerk of Court, 2015). The revenues
generated by this tax should be viewed as a mutual benefit for an entire community rather than
competition between businesses. Dedicating percentages of the collected tax can assist the
county, local community, and individual businesses by providing beach cleanup and marketing
funding, the development of red tide warning systems, and the education of harmful algal
blooms to the public.
6.2.4. Summary of Policy Recommendations
Successful policy changes to ensure community resiliency, in terms of tourism tax
revenue, against red tide presence and severity will not result from a single policy change at
one level of government. Policy changes at all levels of government are important for this
study’s findings, but changes made at the local and state level can be stronger and more site
specific than that of federal policy changes, which are typically broad and not well defined.
Although, federal policies enforcing a seasonal nutrient-rich runoff restriction, depending on
K. brevis presence, would certainly be in the right direction.
State and local policy changes that monitor red tide, among other harmful algal blooms,
on a consistent basis along the entire Florida coastline would create a more resilient
community, county, and state by determining the exact localities that will become affected.
Having the capacity to determine where a harmful algal bloom event will take place and its
potential damage area, these communities can provide alternative tourism lodging in
unaffected areas keeping tourism tax dollars local while making their local regions more
resilient. Obtaining public tax records at a smaller spatial scale, particularly the site level, is
the most accurate way to address which community and what types of tourism lodging
businesses are higher risk of red tide impacting tourism tax revenue.

33
7. CONCLUSIONS
7.1. Research Summary
As mentioned previously, Larkin and Adams (2007) identified K. brevis presence, low
and strong intensities, resulted in a statistically significant decline in both the restaurant and
lodging sector revenues within their small study area of two zip codes along the Florida
coastline. Their report identifies the presence of tropical storms and hurricanes as not being
statistically significant to their study. This research extends on prior literature by identifying
the effects K. brevis can implement at individual cell intensities on tourism tax revenue
generated through the lodging sector. This study, conducted over multiple county
municipalities and a span of 15 years, addresses K. brevis implications on tourism tax revenue.
Collecting K. brevis samples with a 6.4 km (4-mile) buffer (Kirkpatrick et al., 2010) around
each studied municipality allows for a systematic, empirical investigation of the effects red
tide can inflict. The study results indicate that as the cell intensity of K. brevis increases the
amount of tourism tax revenue will decrease. Of course, limitations are experienced throughout
this research and future research is needed to address the impacts caused by red tide, but this
study is a step forward for future research to properly understand these impacts.
7.2. Limitations and Future Research
While this study provides a greater understanding of red tide and its influence on the
coastal tourism economy along the central Gulf of Mexico in Florida, there are limitations to
generating a more robust study. Future research is necessary to provide policy makers, local
business owners, and tourists more specific insights into red tide impacts on the tourism
industry and how they can become more resilient in the face of ecologically-induced economic
disturbances.
FFWCC is the primary monitoring database that collects and records sampling location
(latitude and longitude), date, and cell count/liter of K. brevis and other harmful algal blooms
along the Florida coast. Although routine samplings at over 70 inshore and offshore stations
throughout the southwest Florida gulf have been in place since 1998 (FFWCC, 2017), many
areas of the Florida gulf do not collect or record red tide data on a consistent basis. For a more
accurate county- and state-wide study, red tide samplings should be consistent throughout the
entire Florida coastline and not just conducted in response to a reported bloom.

34
Due to confidentiality, obtaining tax records, specifically transient accommodation
taxes, becomes highly sensitive pertaining to research case studies such as this. Most coastal
counties collect and record this tourism tax, which are not all named equally, for public use at
the municipality level monthly. Some coastal counties admit that they do not keep track of
these records, and they leave it for the state to aggregate to whatever spatial and temporal scale
they deem necessary. This research would benefit from knowing specific tax collections at the
individual site level daily. As mentioned previously, most tax records are highly sensitive
meaning a suitable approach to this research would be having a more detailed spatial and
temporal scale than what is presently being used in this research. More specifically, Kind Code
39 are these “transient accommodations” listed by the Sales and Use Taxes. Categorized as
hotel and tourism, Kind Code 39 encompasses unique SIC Codes for apartment building
operators (6513), dwelling operators except apartments (6514), mobile home site operators
(6515), hotels, motels, and tourist courts (7011), rooming and boarding houses (7021), sporting
and recreation camps (7032), trailering parks for transients (7033), and membership basis
organization hotels (7041). Tax revenues for each SIC Code are recorded by the Florida
Department of Revenue, and they can collectively be calculated to determine monthly county
revenue by Kind Code (Florida Legislature, 2001, Florida Department of Revenue, 2016).
Pairing the results from this study with those conducted in commercial fisheries, human
health issues and other tourism-based industries is essential to identify the effects red tide
causes along the Florida coastline. The findings and policy recommendations from these
studies should be applied in areas that experience harmful algal blooms, including
microorganisms such as K. brevis. Future research to address problems associated with reduced
tourism tax revenue can benefit by knowing specific tax collections at the individual site level
daily. Expanding the geographic area and including longer time periods while controlling for
socioeconomic controls, such as gas prices and recent natural or manmade disasters that may
prevent or convince people to not travel, can improve the modeled results to have a more
accurate description of variable impacts on tourism tax revenue for these coastal communities
that rely heavily on tourism activity.
35
REFERENCES
Anderson, D.M., Kaoru, Y., and White, A.W. 2000. Estimated annual economic impacts from
harmful algal blooms (HABs) in the United States. Technical Report WHOI-2000-11.
Woods Hole Oceanographic Institute, Woods Hole, MA.
Anderson, D.M. 1997. Turning back the harmful red tide. Nature 388, 513-514.
Backer, L.C. 2009. Impacts of Florida red tides on coastal communities. Harmful Algae 8, 618-
622.
Backer, L.C., Fleming, L.E., and Rowan, A. 2003. Recreational exposure to aerosolized
brevetoxins during Florida red tide events. Harmful Algae 2, 19-28.
Baltagi, B.H., Song, S.H., and Kwon, J.H. 2009. Testing for heteroskedasticity and spatial
correlation in a random effects panel data model. Computational Statistics & Data
Analysis 53, 2897-2922.
Driscoll, J. and Kraay, A. 1998. Consistent covariance matrix estimation with spatially
dependent panel data. The Review of Economics and Statistics 80, 549-560.
Drukker, D.M. 2003. Testing for serial correlation in linear panel-data models. The Stata
Journal 3, 168-177.
Evans, G., Jones, L. 2001. Economic impact of the 2000 red tide on Galveston County, Texas:
A Case Study. State of Texas, Texas Parks and Wildlife, Report No. 666226.
Fleming, L.E., Kirkpatrick, B., Backer, L.C. 2007. Aerosolized red tide toxins (brevetoxins)
and asthma. Chest 131:1, 187-194.
Flewelling, L.J., Naar, J.P., Abbott, J.P. 2005. Brevetoxicosis: red tides and marine mammal
mortalities. Nature 435, 755-756.
Florida Department of Revenue. “County Local Option Transient Rental Tax Rates Grouped
by Administration.” 2016. Tourist Development Tax Rates. Local Government
Financial Information Handbook, DR-15TDT. January 2016.
Florida Department of Revenue. 2015. Sales and Use Tax on rental of living or sleeping
accomodations, 1-3.
Florida Fish and Wildlife Conservation Commission (FFWCC). 2017. Harmful Algal Bloom
Monitoring Database. Web. Retrieved April 23, 2016 from
http://myfwc.com/research/redtide/monitoring/database/.
Florida Legislature. “Retail Sales and Use Tax Business.” 2001. Overview of Florida Sales
Taxes related to tourism and recreation, Table 6 - Listing of Tourism and Recreation Kind Codes. January 2001.
36
Glibert, P.M., Anderson, D.M., Gentien, P., Granéli, E., Sellner, K. 2005. The global, complex
phenomena of harmful algal blooms. Oceanography 18, 130-141.
Graham, M.H. 2003. Confronting multicollinearity in ecological multiple regression. Ecology
84, 459-463.
Granéli, E., Carlsson, P., Tester, P., Turner, J.T., Bechemin, C., Dawson, R., Azam, F. 1999.
Effects of N: P: Si ratios and zooplankton grazing on phytoplankton communities in
the northern Adriatic Sea. I. Nutrients, phytoplankton, biomass, and polysaccharide
production. Aquatic Microbial Ecology 18, 37-54.
Greene, G., Moss, C.B., and Spreen, T.H. 1997. Demand for recreational fishing in Tampa
Bay, Florida: A random utility approach. Marine Resource Economics 12, 293-305.
Habas, E.J., Gilbert, C.K. 1974. The economic effects of the 1971 Florida red tide and the
damage it presages for future occurrences. Environmental Literature 6, 139-147.
Heil, C.A., Glibert, P.M., Fan, C. 2005. Prorocentrum minimum (Pavillard) Schiller–A review
of a harmful algal bloom species of growing world-wide importance. Harmful Algae
4, 449-470.
Henrichs, D. W., Hetland, R.D., and Campbell, L. 2015. Identifying bloom origins of the toxic
dinoflagellate Karenia brevis in the western Gulf of Mexico using a spatially explicit
individual-based model. Ecological modelling 313, 251-258.
Hoagland, P., Jun, D., Polansky, L.Y., Kirkpatrick, B. 2009. The costs of respiratory illnesses
arising from Florida gulf coast Karenia brevis blooms. Environmental Health
Perspectives 117:8, 1239-1244.
Hoagland, P., Anderson, D.M., Kaoru, Y., and White, A.W. 2002. The economic effects of
harmful algal blooms in the United States: Estimates, assessment issues, and
information needs. Estuaries 25, 819-837.
Houston, J.R. 1996. International tourism and U.S. beaches. Coastal Engineering Research
Center. CERC-96-2.
Kim, H.G. 2006. Mitigation and controls of harmful algal blooms. Ecology of Harmful Algae
189, 327-338.
Kirkpatrick, B., Fleming, L.E., and Squicciarini, D. 2004. Literature review of Florida red tide:
Implications for human health effects. Harmful Algae 3, 99-115.
Kirkpatrick, B., Pierce, R., Cheng, Y.S., et al. 2010. Inland transport of aerosolized Florida red
tide toxins. Harmful Algae 9, 186-189.

37
Jin, D., Thunberg, E., Hoagland, P. 2008. Economic impact of the 2005 red tide event on
commercial shellfish fisheries in New England. Ocean and Coastal Management 51,
420-429.
Larkin, S.L., and Adams, C.M. 2007. Harmful algal blooms and coastal business: economic
consequences in Florida, Society and Natural Resources, 20:9, 849-859.
Lee County Clerk of Court. “Tourist Development Tax.” July 14, 2015. Web. Retrieved April
23, 2016 from http://www.leeclerk.org/touristdevelopmenttax/.
Parsons, M.L., Q. Dortch, and R.E. Turner. 2002. Sedimentological evidence of an increase in
Pseudo-nitzschia (Bacillariophyceae) abundance in response to coastal eutrophication.
Limnology and Oceanography 47,551-558.
Pierce, R.H., Henry, M.S. 2008. Harmful algal toxins of the Florida red tide (Karenia brevis):
natural chemical stressors in South Florida coastal ecosystems. Ecotoxicology 17, 623
– 631.
Poli, M.A., Musser, S.M., and Dickey, R.W. 2000. Neurotoxic Shellfish Poisoning and
brevetoxin metabolites: A Case Study from Florida. Toxicon 38:7, 981-993.
Rose, J.C. 1987. Scallops transplanted to algae-damaged beds. Oceans 20:1, 6.
Shumway, S.E. 1990. A review of the effects of algal blooms on shellfish and aquaculture.
Journal of the World Aquaculture Society 21, 65-104.
Tester, P.A., Stumpf, R.P., Vukovich, F.M., Fowler, P.K., Turner, J.T. 1991. An expatriate red
tide bloom: transport, distribution, and persistence. Limnology and Oceanography 36,
1053-1061.
Tester, P.A., Steidinger, K.A. 1997. Gymnodinium breve red tide blooms: Initiation, transport,
and consequences of surface circulation. Limnology and Oceanography 42, 1039-1051.
Trainer, V., B.-T.L. Eberhart, J.C. Wekell, N.G. Adams, L. Hanson, F. Cox, and J. Dowell.
2003. Paralytic shellfish toxins in Puget Sound, Washington State. Journal of Shellfish
Research 22, 213-223.
Villarino, M.L., Figueiras, F.G., Jones, K.J., Alvarez-Salgado, X.A., Richard, J., Edwards, A.
1995. Evidence of in situ diel vertical migration of a red tide microplankton species in
Ria de Vigo (NW Spain). Marine Biology 123, 607-617.
Wooldridge, J.M. 2002. Econometric analysis of cross section and panel data. Cambridge, MA:
MIT Press.

38
APPENDIX
Table A1: Months where K. brevis exceeded a cell count of 10,000 cells/liter
Jan Feb Mar Apr May Jun Jul Aug Sep Oct Nov Dec
2000
2001
2002
2003
2004
2005
2006
2007
2008
2009
2010
2011
2012
2013
2014
2015
Table A2: Summary statistics by county
County Variable Source Mean Std. Dev. Min Max
Manatee Real Revenue County Tax
Collection
Office
98,325.01 97,723.56 794.91 625,515.7
Log of Revenue County Tax
Collection
Office
10.79828 1.474314 6.679486 13.34633
K. brevis
(cells/liter)
FFWCC 62,598.41 375,419.3 0 6,240,000
Lodging Total FGDL 117.9851 118.4862 6 392
Pinellas Real Revenue County Tax
Collection
Office
170,018.8 261,363.2 1,584.49 1,895,323
Log of Revenue County Tax
Collection
Office
11.10842 1.369811 7.368649 14.4549
K. brevis
(cells/liter)
FFWCC 199,749 2,634,769 0 36,120,000
Lodging Total FGDL 132.5235 109.2484 31 374
Sarasota Real Revenue County Tax
Collection
Office
153,243 153,542.9 1,066.58 1,098,900
No Presence
Low Presence (10,000 – 100,000
cells/liter)
Medium Presence and Higher
(>100,000 cells/liter)
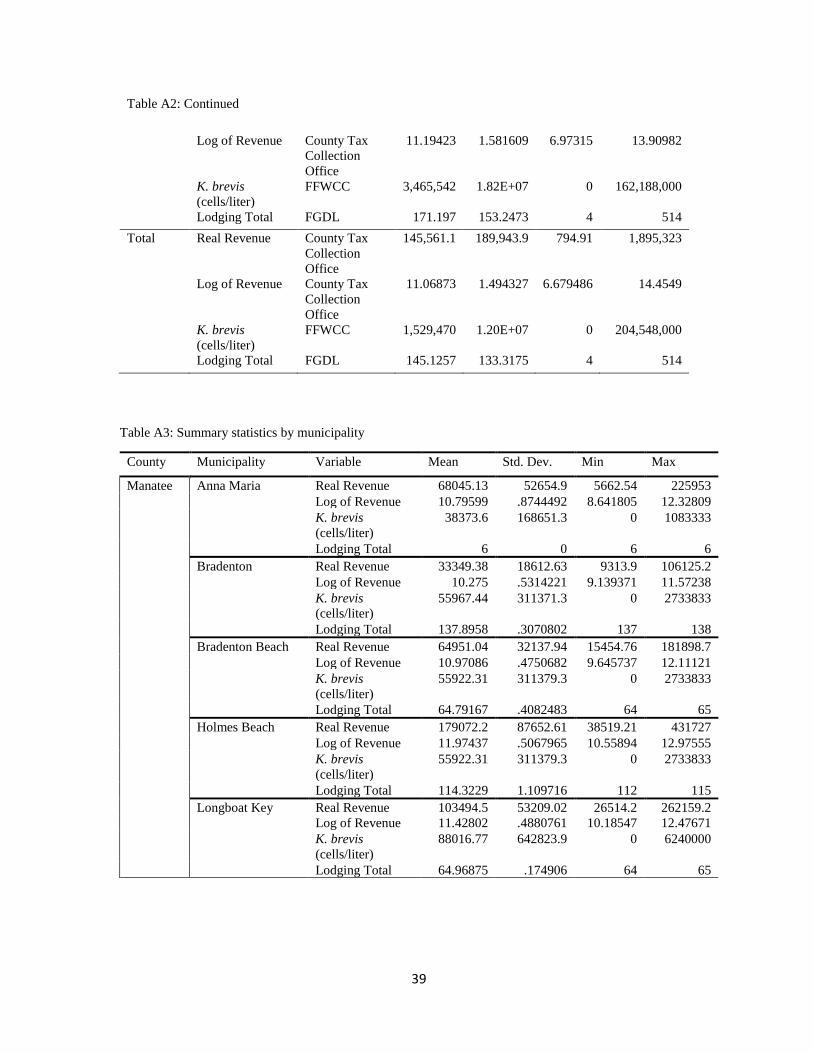
39
Table A2: Continued
Log of Revenue County Tax
Collection
Office
11.19423 1.581609 6.97315 13.90982
K. brevis
(cells/liter)
FFWCC 3,465,542 1.82E+07 0 162,188,000
Lodging Total FGDL 171.197 153.2473 4 514
Total Real Revenue County Tax
Collection
Office
145,561.1 189,943.9 794.91 1,895,323
Log of Revenue County Tax
Collection
Office
11.06873 1.494327 6.679486 14.4549
K. brevis
(cells/liter)
FFWCC 1,529,470 1.20E+07 0 204,548,000
Lodging Total FGDL 145.1257 133.3175 4 514
Table A3: Summary statistics by municipality
County Municipality Variable Mean Std. Dev. Min Max
Manatee Anna Maria Real Revenue 68045.13 52654.9 5662.54 225953
Log of Revenue 10.79599 .8744492 8.641805 12.32809
K. brevis
(cells/liter)
38373.6 168651.3 0 1083333
Lodging Total 6 0 6 6
Bradenton Real Revenue 33349.38 18612.63 9313.9 106125.2
Log of Revenue 10.275 .5314221 9.139371 11.57238
K. brevis
(cells/liter)
55967.44 311371.3 0 2733833
Lodging Total 137.8958 .3070802 137 138
Bradenton Beach Real Revenue 64951.04 32137.94 15454.76 181898.7
Log of Revenue 10.97086 .4750682 9.645737 12.11121
K. brevis
(cells/liter)
55922.31 311379.3 0 2733833
Lodging Total 64.79167 .4082483 64 65
Holmes Beach Real Revenue 179072.2 87652.61 38519.21 431727
Log of Revenue 11.97437 .5067965 10.55894 12.97555
K. brevis
(cells/liter)
55922.31 311379.3 0 2733833
Lodging Total 114.3229 1.109716 112 115
Longboat Key Real Revenue 103494.5 53209.02 26514.2 262159.2
Log of Revenue 11.42802 .4880761 10.18547 12.47671
K. brevis
(cells/liter)
88016.77 642823.9 0 6240000
Lodging Total 64.96875 .174906 64 65

40
Table A3: Continued
Unincorporated Real Revenue 236268.9 107029.7 92636.98 625515.7
Log of Revenue 12.28274 .4194034 11.43645 13.34633
K. brevis
(cells/liter)
105130.2 458960.6 0 3203833
Lodging Total 390.9167 1.939434 386 392
Palmetto Real Revenue 3093.897 1929.465 794.91 11363.73
Log of Revenue 7.861 .598524 6.679486 9.33827
K. brevis
(cells/liter)
38856.23 220282.4 0 1685833
Lodging Total 47 0 47 47
Pinellas Belleair Real Revenue 8983.482 5852.049 1584.49 32783.36
Log of Revenue 8.914641 .6262866 7.368649 10.39771
K. brevis
(cells/liter)
1249.972 8176.844 0 67667
Lodging Total 46 0 46 46
Clearwater Real Revenue 839076.2 299046.7 456954.4 1895323
Log of Revenue 13.5849 .3273817 13.03234 14.4549
K. brevis
(cells/liter)
1491.778 8393.903 0 67667
Lodging Total 373.9306 .3061063 372 374
Dunedin Real Revenue 24918.77 9715.788 11572.81 58356.46
Log of Revenue 10.061 .3454528 9.3565 10.97434
K. brevis
(cells/liter)
1249.972 8176.844 0 67667
Lodging Total 149 0 149 149
Indian Rocks
Beach
Real Revenue 50681.44 25713.49 22328.7 147986.7
Log of Revenue 10.73262 .4334186 10.01367 11.90488
K. brevis
(cells/liter)
2936.403 15417.41 0 106458
Lodging Total 97 0 97 97
Indian Shores Real Revenue 36608.38 24754.78 10683.5 125391.5
Log of Revenue 10.32928 .5826669 9.276549 11.7392
K. brevis
(cells/liter)
2899.375 15423.71 0 106458
Lodging Total 71 0 71 71
Madeira Beach Real Revenue 47738.64 27117.06 16152.99 159190.3
Log of Revenue 10.64343 .498919 9.689922 11.97786
K. brevis
(cells/liter)
511948.6 4256384 0 3.61e+07
Lodging Total 60 0 60 60
Oldsmar Safety
Beach
Real Revenue 60921.7 20032.09 28361.67 124214.3
Log of Revenue 10.96754 .3163899 10.25283 11.72977
K. brevis
(cells/liter)
0 0 0 0
Lodging Total 31 0 31 31

41
Table A3: Continued
Palm Harbor Real Revenue 62839.25 33975.62 18323.21 184835.2
Log of Revenue 10.92939 .4784472 9.815978 12.12722
K. brevis
(cells/liter)
4.625 39.24443 0 333
Lodging Total 131 0 131 131
Redington Beach Real Revenue 60441.18 26481.04 14234.88 152949.8
Log of Revenue 10.91894 .4366651 9.56352 11.93787
K. brevis
(cells/liter)
503519.8 4256581 0 3.61e+07
Lodging Total 57 0 57 57
St. Pete
Beach/Tierra
Verde
Real Revenue 504235.1 191791.4 220830.6 1086256
Log of Revenue 13.06273 .3704982 12.30516 13.89825
K. brevis
(cells/liter)
521976.4 4256538 0 3.61e+07
Lodging Total 144.9583 .2012286 144 145
St. Petersburg Real Revenue 349376.5 101822.9 198903.2 762329.9
Log of Revenue 12.72763 .2643707 12.20058 13.54414
K. brevis
(cells/liter)
531970.5 4255792 0 3.61e+07
Lodging Total 364.9167 .278325 364 365
Tarpon Springs Real Revenue 17767.82 7539.263 6207.44 44118.63
Log of Revenue 9.711789 .3750211 8.733665 10.69466
K. brevis
(cells/liter)
9.25 55.10777 0 333
Lodging Total 43 0 43 43
Treasure Island Real Revenue 146655.6 58785.97 73185.4 349082.1
Log of Revenue 11.82561 .3695847 11.20076 12.76307
K. brevis
(cells/liter)
517489.8 4256973 0 3.61e+07
Lodging Total 154 0 154 154
Sarasota Longboat Key Real Revenue 128376.3 65875.88 31735.25 354631
Log of Revenue 11.63218 .5248847 10.36522 12.77884
K. brevis
(cells/liter)
4308493 2.16e+07 0 1.62e+08
Lodging Total 74.34896 2.116527 70 76
Northport Real Revenue 4006.086 2865.657 1066.58 19838.41
Log of Revenue 8.109119 .5848846 6.97315 9.895426
K. brevis
(cells/liter)
530417.5 2590742 0 2.27e+07
Lodging Total 4.505208 .50128 4 5
Sarasota Real Revenue 274041.2 133237.3 86583.71 885520.1
Log of Revenue 12.41598 .4562437 11.36888 13.69393
K. brevis
(cells/liter)
4779665 2.22e+07 0 1.62e+08
Lodging Total 170.9583 13.51316 145 182
Unincorporated Real Revenue 146255.3 96804.35 42208.84 591478.6
Log of Revenue 11.71475 .5812672 10.65041 13.29038
K. brevis
(cells/liter)
5378209 2.24e+07 0 1.62e+08
Lodging Total 488.6146 30.43416 427 514

42
Table A3: Continued
Siesta Key Real Revenue 298142.9 204610.5 44437.75 1098900
Log of Revenue 12.37991 .6918361 10.70187 13.90982
K. brevis
(cells/liter)
5096981 2.23e+07 0 1.62e+08
Lodging Total 149.8385 13.00141 126 161
Venice Real Revenue 68640.15 52005.3 18304.25 305282.3
Log of Revenue 10.91344 .637402 9.814943 12.629
K. brevis
(cells/liter)
699486.5 3389036 0 2.89e+07
Lodging Total 138.9167 9.63487 122 147
Figure A1: Graphs of monthly tourism tax revenue by county
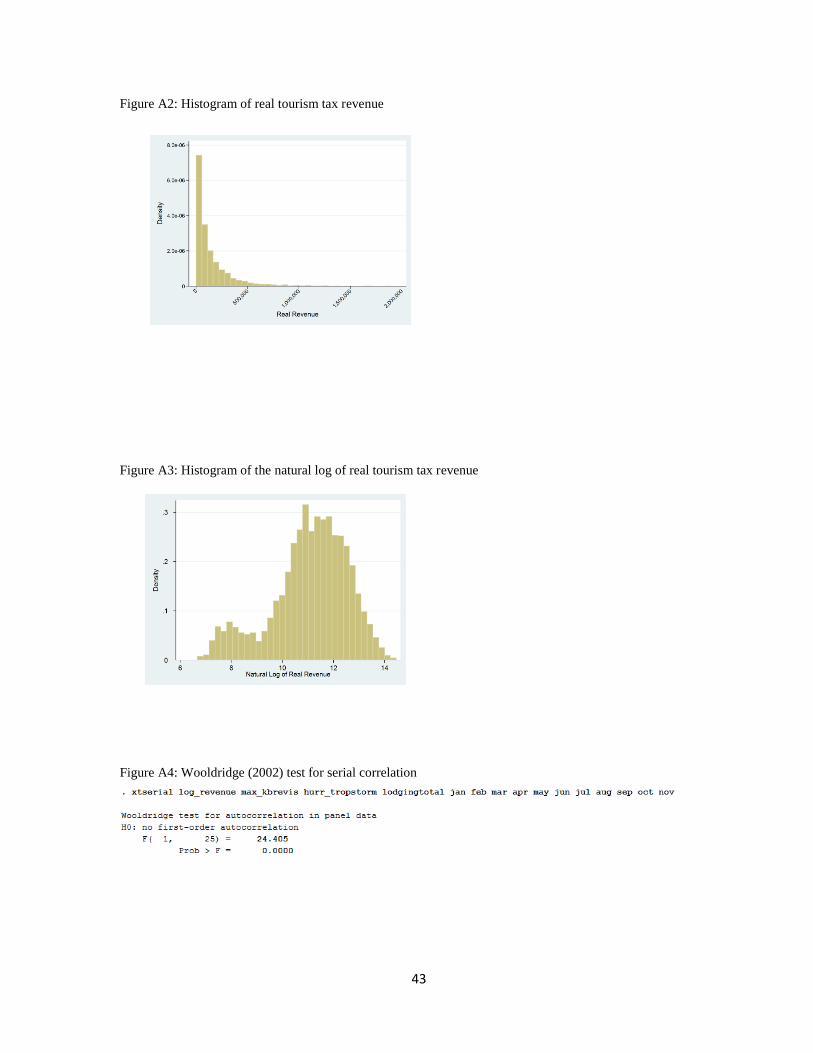
43
Figure A2: Histogram of real tourism tax revenue
Figure A3: Histogram of the natural log of real tourism tax revenue
Figure A4: Wooldridge (2002) test for serial correlation

44
Figure A5: Pesaran (2004), Friedman (1937), and Frees’ (1995) test; cross-sectional dependence
Figure A6: Breusch-Pagan/Cook-Weisberg test for heteroskedasticity

45
Figure A7: Variance Inflation Factor (VIF) test for multicollinearity


