Edit this text for your title Edit this text for your sub-title Presenter name, location, date etc.
MEK 4450 Marine Operations 2-2 Kværner ASA / DNV, Fall 2014

Numerical Tools / Analysis Software
Why numerical tools? More accurate and detailed description
Why comercial tools:
Time consuming to produce inhouse Better quality checks (?) Clients acceptance

Numerical models
Hydrostatic / stability models (e.g. AutoHydro, Hydro D) Basic hydrodynamic analyses (e.g. WADAM, WAMIT) Time domain coupeled analyses (e.g. SIMO) CFD Beam theory (e.g. Orcaflex, Riflex) FEM

Hydrostatic Analysis

Hydrostatic model
INPUT Wet hull
shape Mass COG
OUTPUT Floating condition Stability margins
MODEL Geometry: stripes Mass and COG Archimedes Buoyancy and
moments
Use with care for non- standard
aplications
Quick and simple to use
Purpose made For normal ship Hull and normal
operations
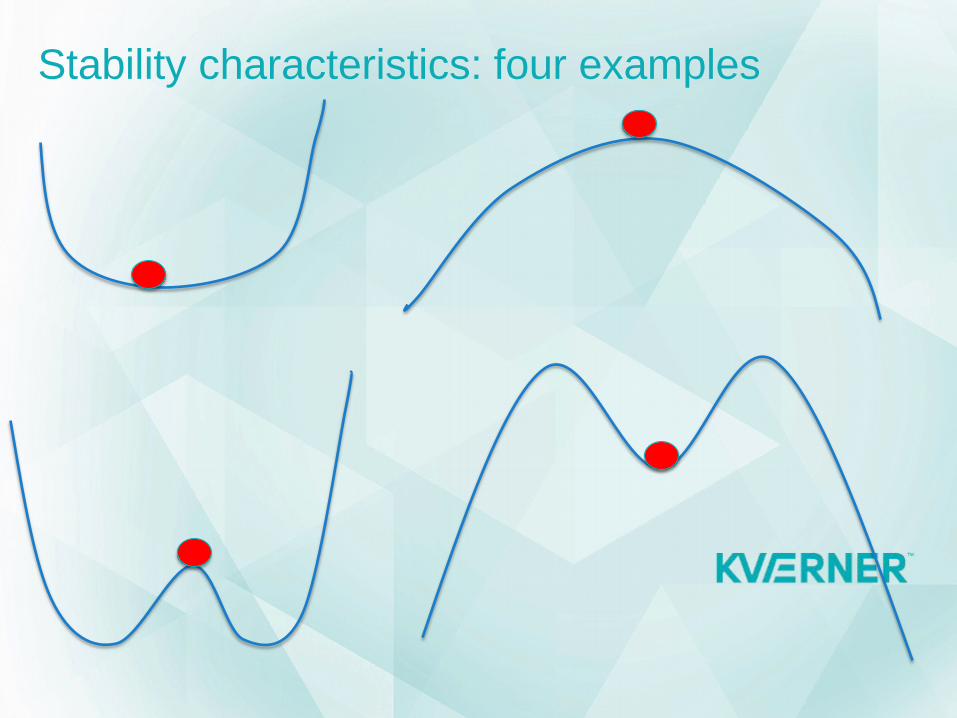
Stability characteristics: four examples

Hydrodynamic Analysis

Floating object in waves - standard theory
INPUT Wet hull
shape Mass
distribution
OUTPUT Motion, pressure ++ Transfer function Postprocessing
MODEL Geometry: panels Mass matrix Inviscid
Incompressible Vessel: rigid body Incident waves
Viscous damping neglected
Couplings and nonlinearity
neglected
Quick and accurate solutions when
relevant
Purpose made For normal ship Hull and normal
operations
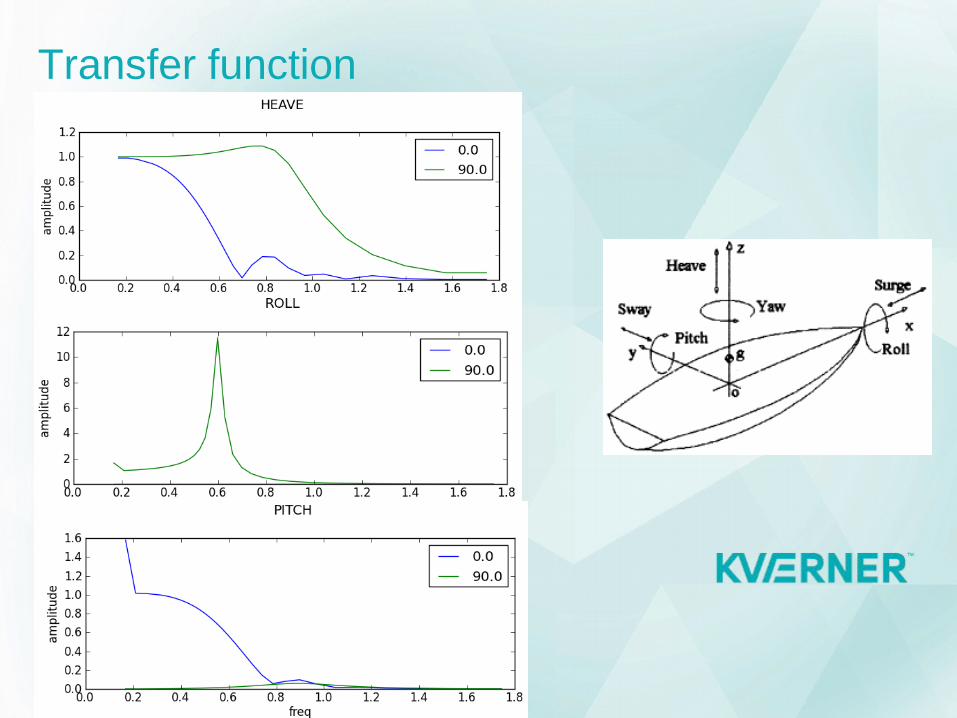
Transfer function

Time Domain Analysis

Time domain simulation program
INPUT (Hydro)dynamic
characteristics Links, wires,
beams etc Environment
OUTPUT Time series for
motions, forces etc Design values: post processing
MODEL Rigid body
motions Forces from
environments and links
Quality of coefficients?
Time consuming
Realistic modeling of marine operations
Stepping forward in time.
Runge Kutta etc
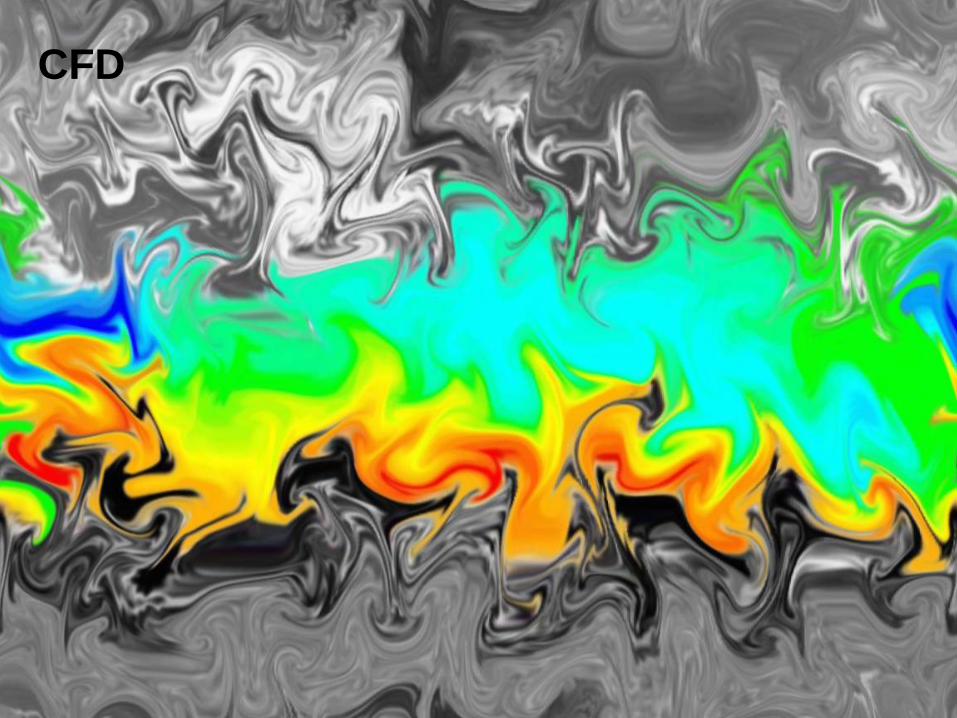
CFD
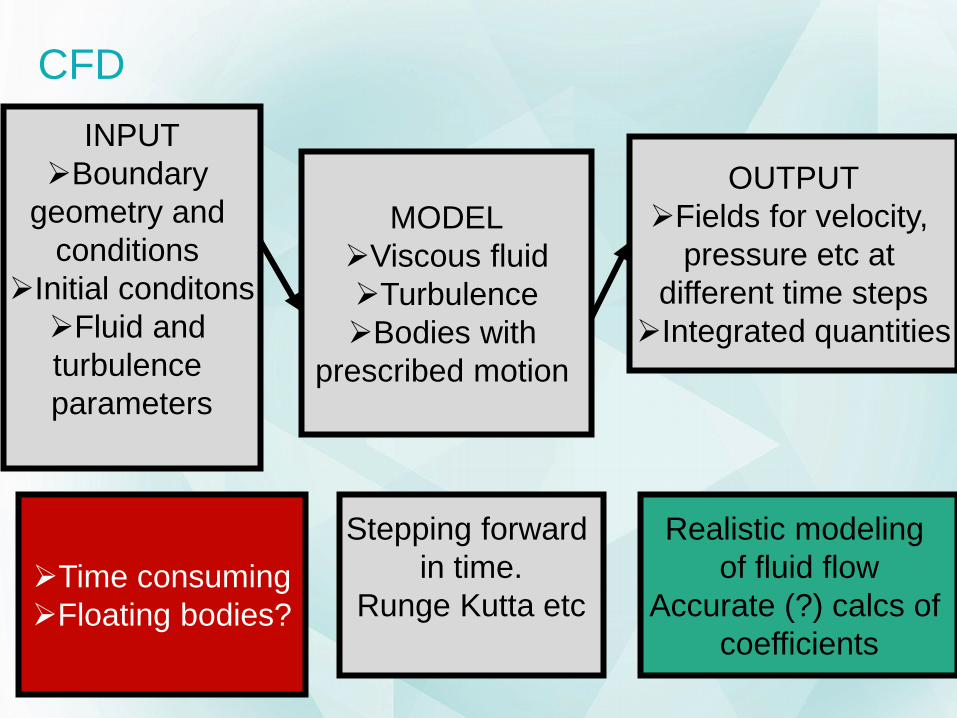
CFD INPUT
Boundary geometry and
conditions Initial conditons Fluid and turbulence parameters
OUTPUT Fields for velocity,
pressure etc at different time steps Integrated quantities
MODEL Viscous fluid Turbulence Bodies with
prescribed motion
Time consuming Floating bodies?
Realistic modeling of fluid flow
Accurate (?) calcs of coefficients
Stepping forward in time.
Runge Kutta etc
16.10.2014 © Kvaerner 2011 15
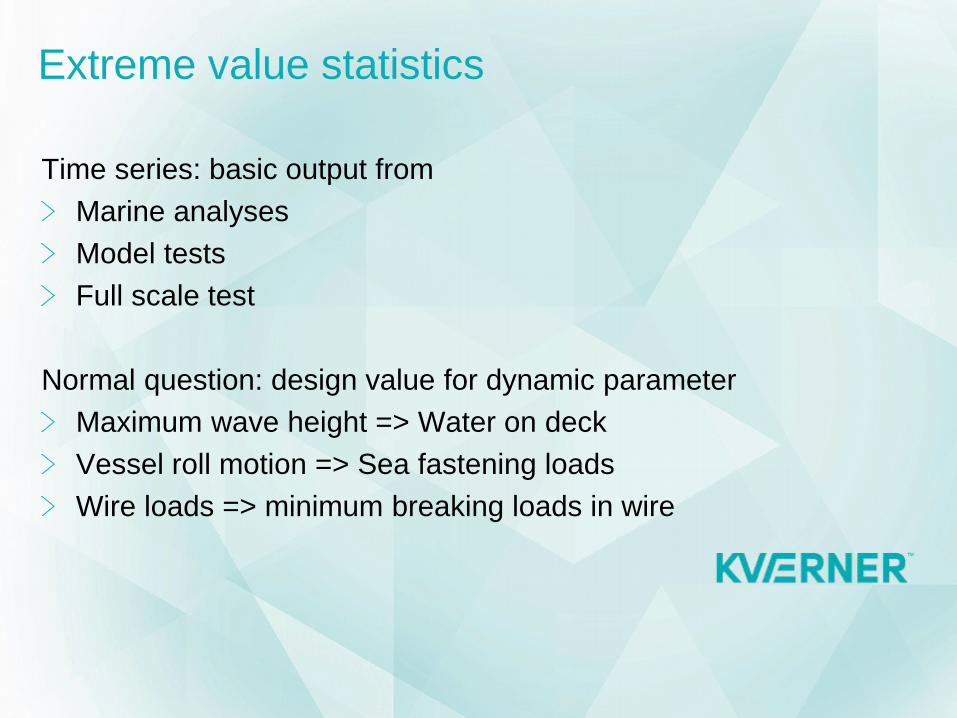
Extreme value statistics
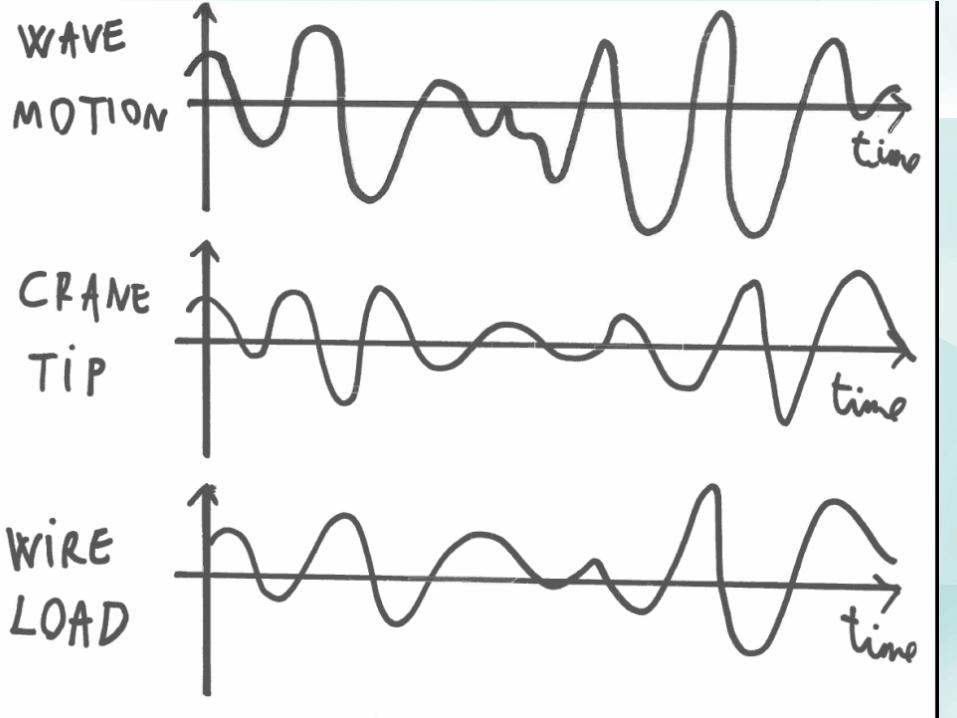
Time series: basic output from Marine analyses Model tests Full scale test
Normal question: design value for dynamic parameter Maximum wave height => Water on deck Vessel roll motion => Sea fastening loads Wire loads => minimum breaking loads in wire

How to link time series to design value Maximum observed value Not robust with respect to repititions
Create the time series many times Series of observed maxima Calculate: Maximum of the maxima: very conservative Mean value of maxima Median of maxima Given procentile

How to link time series to design value Establish empirical distribution of maxima Fit an apropriate diostribution to the values
Gumbel is normaly used
0
0.2
0.4
0.6
0.8
1
1.2
250000 260000 270000 280000 290000 300000 310000 320000 330000 340000 350000
Empirical distribution
Empirical distribution
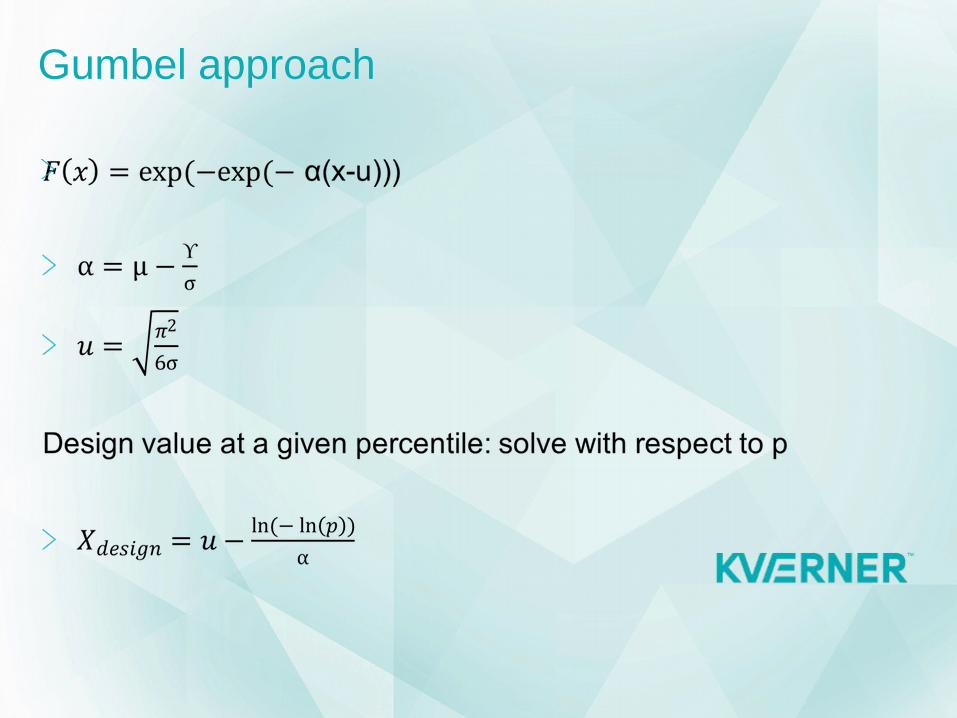
Gumbel approach

How to link time series to design value
-0.2
0
0.2
0.4
0.6
0.8
1
1.2
250000 260000 270000 280000 290000 300000 310000 320000 330000 340000 350000
Fitted gumbel distributionEmpirical distribution

Alternative approach for stationary processes For each series one single value used only
Costly and time consuming Robust approach, fits all types of processes
Alternative: use one long time series
Identify individual tops Fit to these values Extract statistical max
Shortcomings Distribution type unknown,- may jepardize the whole strategy Long time series needed Stationary process required

Stationary and non- stationary processes
Stationary process: constant statistical properties Wind gusts at constant average wind Waves generated by this type of wind Wave induced responses to stationary waves
Non- stationary Wind or wave picking up (storm build-up) Dynamic responses when objects hits free surface Operational induced responses


