
EFFECT OF TEMPERATURE ON STREAM FISH ENERGETICS AND TOLERANCE TO
INCREASING URBANIZATION Marylou Moore
Thesis Masters of Science in Integrative Biology (MSIB)
Department of Biology and Physics
Committee Chair: Dr. Scott Reese
Committee Members: Dr. Bill Ensign, Dr. Lisa Ganser, and Dr. Thomas McElroy

Urbanization: A Brief Overview
US Census Bureau identifies1
Urban Areas (UAs) ˃50,000 people
Urban Clusters (UCs) ˃ 2,500 but ˂50,000 people
Population density ≥ 1,000 people / sq mile
Increasing human population living in urban areas In US, 81% or people live in UAs or UCs 2/3 people worldwide by 20502

Impervious Surface Cover (ISC)
Consistent and prevalent product of urbanization3
Buildings, roads, and parking lots account for 80% ISC4
Surfaces can be up to 50 °C warmer than air5
As little as 0.1 in rainfall shown to generate significant volumes of runoff6
% ISC has become an accurate predictor of urban impacts on streams7
10-20% ISC frequently associated with stream degradation

The Urban Stream Syndrome
Summarizes stream degradation in urban streams8
A flashier hydrograph Altered channel stability and morphology Increased heat retention and temperature surges Reduced biotic richness

The Urban Stream Syndrome: Flow Alterations

The Urban Stream Syndrome: Riparian / Channel Alteration
From Paul & Meyer, 20013

Urban Stream Syndrome: Thermal Impacts
Urbanization alters river and stream temperatures9
Chemical and biological characteristics affected by stream temperature dissolved O2 with temperature
Stream temperatures due to Loss of riparian shading Heated runoff from warm impervious surfaces Widened stream channels – shallower water depths
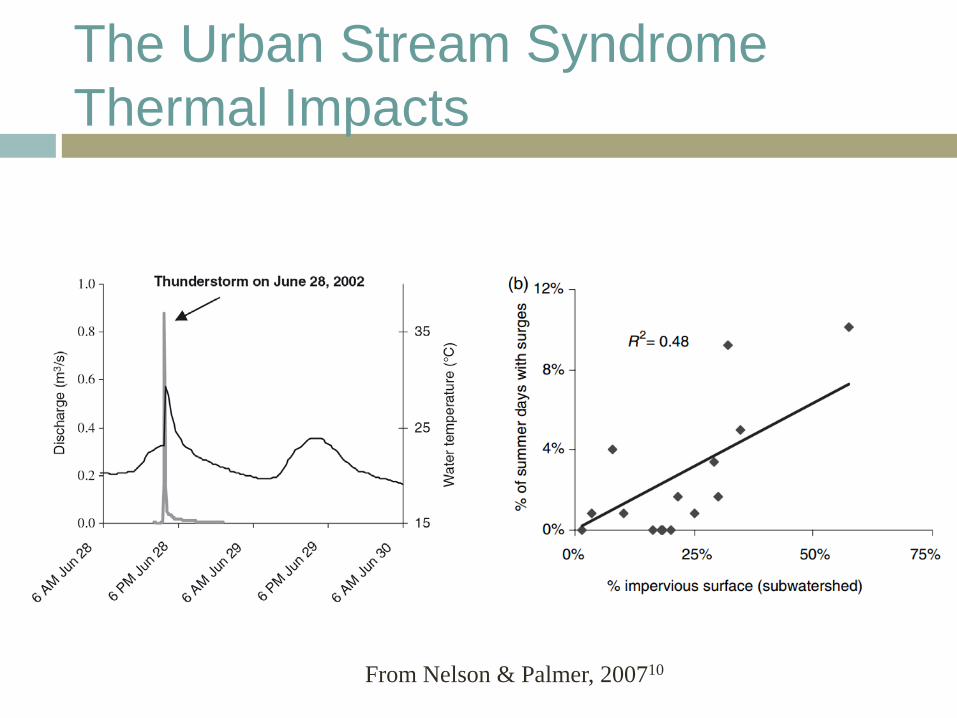
The Urban Stream Syndrome Thermal Impacts
From Nelson & Palmer, 200710

Tricolor Shiner
Freckled Madtom
Etowah Darter
Bronze Darter
Tricolor Shiner Speckled Madtom
Etowah Darter Bronze Darter
The Urban Stream Syndrome: Reduced Biotic Richness
From Wenger, et al, 200811

Problem Statement
Urbanization causes changes in ecosystem structure and function
Fish assemblages respond to a gradient of urbanization
Intraspecific mechanisms unknown

Influence of Temperature on Fish Energetics
Abiotic master factor for fishes12
Obligate poikilotherms Metabolic rate Quantitative measure of how fast energy & O2 are
being converted/used Metabolic scope Energetic potential to fuel all activities as temperature 13
Varies across species and populations

Research Objectives
Evaluate metabolic capacity Fish drawn from urban and non-urban streams Measure SMR and MMR at 20 and 25 °C Calculate Q10
Hypotheses/predictions Fish collected from urban site expected to:
demonstrate greater thermal tolerance through lower Q10
exhibit a greater metabolic scope

Etowah River System, Georgia
Begins in the Blue Ridge mountains of Northern GA Hotspot of stream diversity and endemism Considered “high priority” for preservation &
restoration14

Etowah Study Sites
Noonday creek Urban site ~ 10 km NW of
Atlanta, GA 26.3% ISC
Raccoon Creek Non-urban site ~ 30 km W of
Noonday 0.69% ISC

Study Sites: Land Use

Etowah Study Sites Noonday Creek Raccoon Creek

Study Sites
17
19
21
23
25
27
29
Tem
pera
ture
(°C
)
Date
Raccoon Creek Noonday Creek
20
21
22
23
24
25
26
27
May June July August
Aver
age
Mon
thly
Tem
pera
ture
(°C
)
Raccoon Creek Noonday Creek

Redbreast Sunfish
Lepomis auritus Member of the Centrarchid family Widely distributed and tolerant15
Significant game fish May tolerate temperatures
up to 35 °C16
No known metabolic data reported for the species

Redbreast Sunfish Range
Native Introduced
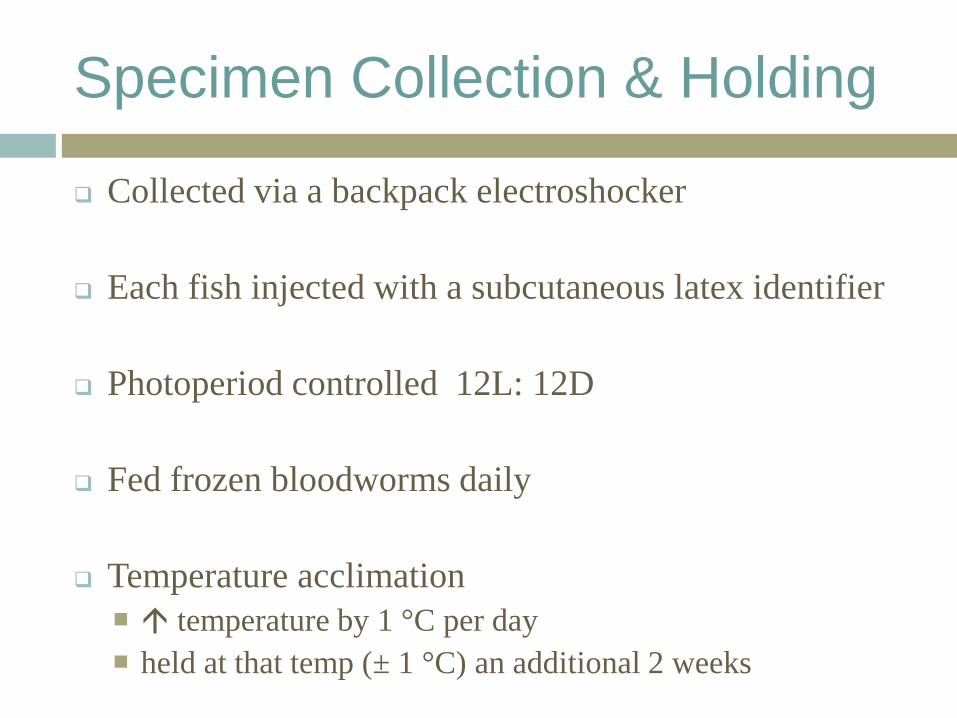
Specimen Collection & Holding
Collected via a backpack electroshocker
Each fish injected with a subcutaneous latex identifier
Photoperiod controlled 12L: 12D
Fed frozen bloodworms daily
Temperature acclimation temperature by 1 °C per day held at that temp (± 1 °C) an additional 2 weeks

Measurements of Metabolic Rate
Indirect calorimetry
Standard metabolic rate (SMR)
Maximum or active metabolic rate (MMR) Metabolic scope (MS) MMR – SMR
Temperature coefficient (Q10)
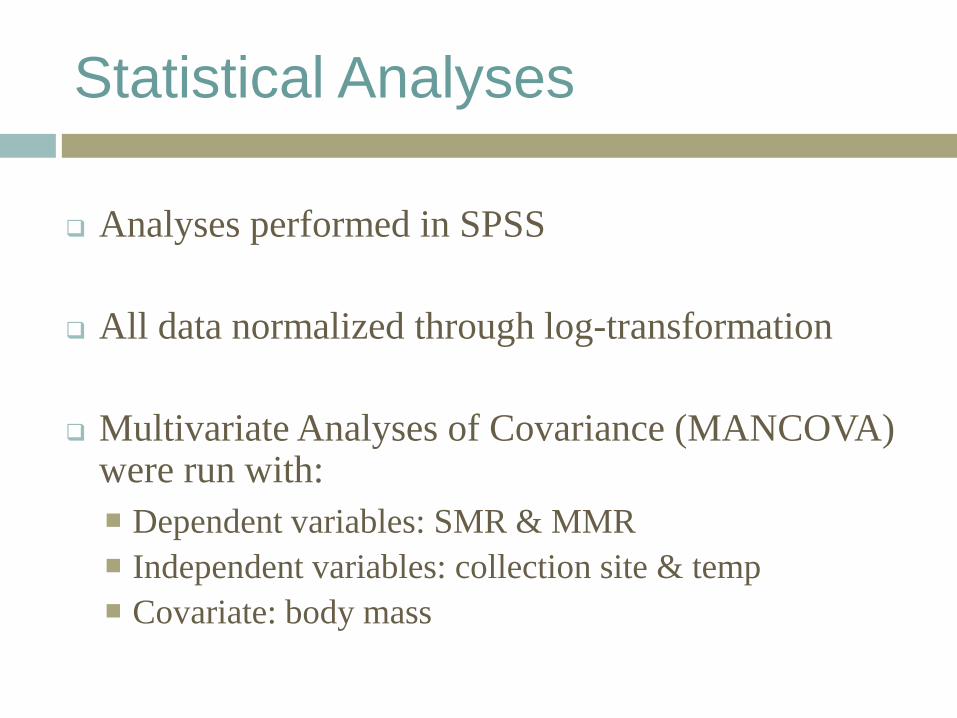
Statistical Analyses
Analyses performed in SPSS
All data normalized through log-transformation
Multivariate Analyses of Covariance (MANCOVA) were run with: Dependent variables: SMR & MMR Independent variables: collection site & temp Covariate: body mass

y = 0.8307x - 0.5657 R² = 0.9313
y = 0.8586x - 0.4288 R² = 0.9343
-0.4
0.0
0.4
0.8
1.2
0.0 0.4 0.8 1.2 1.6 2.0
Oxy
gen
Cons
umpt
ion
Rate
(m
g O
2 h
-1)
Body Mass (g)
SMR
MMR
y = 0.6825x - 0.5621 R² = 0.8499
y = 0.7871x - 0.4357 R² = 0.9117
-0.4
0.0
0.4
0.8
1.2
0.0 0.4 0.8 1.2 1.6 2.0
Oxy
gen
Cons
umpt
ion
Rate
(m
g O
2 h
-1)
Body Mass (g)
SMR
MMR
20 °C 25 °C
Results: Noonday Creek

y = 0.7974x - 0.4674 R² = 0.9082
y = 0.7563x - 0.3222 R² = 0.8916
-0.4
-0.2
0.0
0.2
0.4
0.6
0.8
0.2 0.6 1.0 1.4
Oxy
gen
Cons
umpt
ion
Rate
(m
g O
2 h
-1)
Body Mass (g)
SMR
MMR
y = 0.7524x - 0.5459 R² = 0.8259
y = 0.7157x - 0.3422 R² = 0.7739
-0.4
-0.2
0.0
0.2
0.4
0.6
0.8
0.2 0.6 1.0 1.4
Oxy
gen
Cons
umpt
ion
Rate
(m
g O
2 h
-1)
Body Mass (g)
SMR
MMR
Results: Raccoon Creek 20 °C 25 °C

y = 0.6825x - 0.5621 R² = 0.8499
y = 0.7871x - 0.4357 R² = 0.9117
-0.4
0.0
0.4
0.8
1.2
0.0 0.4 0.8 1.2 1.6 2.0
Oxy
gen
Cons
umpt
ion
Rate
(m
g O
2 h
-1)
Body Mass (g)
Noonday
Raccoon
y = 0.8307x - 0.5657 R² = 0.9313
y = 0.7974x - 0.4674 R² = 0.9082
-0.4
0.0
0.4
0.8
1.2
0.0 0.4 0.8 1.2 1.6 2.0
Oxy
gen
Cons
umpt
ion
Rate
(m
g O
2 h
-1)
Body Mass (g)
Noonday
Raccoon
*p = 0.022
Results: SMR 25 °C 20 °C
*p = 0.018

y = 0.8586x - 0.4288 R² = 0.9343
y = 0.7563x – 0.3222
R² = 0.8916
-0.4
-0.2
0.0
0.2
0.4
0.6
0.8
0.2 0.6 1.0 1.4
Oxy
gen
Cons
umpt
ion
Rate
(m
g O
2 h
-1)
Body Mass (g)
Noonday
Raccoon
y = 0.7871x - 0.4357 R² = 0.9117
y = 0.7157x - 0.3422 R² = 0.7739
-0.4
0.0
0.4
0.8
1.2
0.0 0.4 0.8 1.2 1.6 2.0
Oxy
gen
Cons
umpt
ion
Rate
(m
g O
2 h
-1)
Body Mass (g)
Noonday
Raccoon
Results: MMR
20 °C 25 °C

Results: Metabolic Scope
*p = 0.043

Summary of Research Findings
Intraspecific metabolic differences detected Noonday – lower SMR at 20 and 25 °C
Difference in MMR in fish collected from urban stream between temperatures
Q10 values similar for Noonday and Raccoon, with Noonday showing slightly lower values
Collection Site Standard Maximum Noonday 2.05 1.47 Raccoon 2.10 1.58
Q10 Values

Discussion
Other studies have found metabolic differences in both intra- and interspecific populations17-18
Local adaptation possible in L. auritus from Noonday
High thermal variation may select for individuals that are able to maintain metabolic activity despite largescale variation
L. auritus may have greater ability to adjust thermal tolerance than other species in urban streams

Relatively small sample sizes Inconsistent range of body sizes between groups
Discussion
Collection Site Temp (°C) n Body Mass Range (g)
Noonday Creek 20 17 1.76 - 74.2 Raccoon Creek 20 18 2.73 - 26.98 Noonday Creek 25 17 1.89 - 72.5 Raccoon Creek 25 16 2.44 - 15.1

Future Directions
Critical thermal max measurements Temperature preference studies Metabolic measurements of less tolerant species
that still exists across the urban gradient Scope expected to be higher in abundant species
Integration of physiology and ecological genomics mRNA levels show rapid response to temperature
change19-21
Evaluate transcription-level expression of genes involved in plasticity

Management Implications
Freshwater fishes experiencing rapid rates of extinction 39% imperiled to some degree in US22
Species-level responses to urbanization will be
essential to develop conservation strategies
Integration of physiological indices into management implications

Acknowledgements
KSU College of Science & Mathematics, Department of Biology & Physics
My advisor Dr. Scott Reese
My committee members Dr. Bill Ensign, Dr. Lisa Ganser, and Dr. Thomas McElroy
Dr. Dirnberger
Undergraduate assistants Joseph, Nancy, and Phillip
Fellow graduate students
Nanette Reese
Dr. Davis, Dr. Golubski, Dr. Hudson, Dr. Jackson, Dr. McGarey, Dr. McNeal, Dr. Mutchler, Dr. Nowak, and Dr. Taglialatela

References 1. US Census Bureau. State and County QuickFacts, 2004. http://quickfacts.census.gov/qfd/states/01000.html 2. United Nations Population Division. 2008. World urbanization prospects: the 2007 revision. United Nations,
New York. 3. Paul, M. J., & Meyer, J. L. (2001). Streams in the urban landscape. Annual Review of Ecology and Systematics,
, 333-365. 4. Slonecker, E. T., & Tilley, J. S. (2004). An evaluation of the individual components and accuracies associated
with the determination of impervious area. GIScience & Remote Sensing, 41(2), 165-184. 5. Berdahl, P., & Bretz, S. E. (1997). Preliminary survey of the solar reflectance of cool roofing materials. Energy
and Buildings, 25(2), 149-158. 6. Galli, J. (1990). Thermal impacts associated with urbanization and stormwater management best management
practices Department of Environmental Programs, Metropolitan Washington Council of Governments. 7. Arnold Jr, C. L., & Gibbons, C. J. (1996). Impervious surface coverage: The emergence of a key environmental
indicator. Journal of the American Planning Association, 62(2), 243-258. 8. Meyer, J. L., Paul, M. J., & Taulbee, W. K. (2005). Stream ecosystem function in urbanizing landscapes. Journal
of the North American Benthological Society, 24(3), 602-612. 9. Caissie, D. (2006). The thermal regime of rivers: A review. Freshwater Biology, 51(8), 1389-1406. 10. Nelson, Kären C., and Margaret A. Palmer. "Stream Temperature Surges Under Urbanization and Climate
Change: Data, Models, and Responses1." (2007): 440-452. 11. Wenger, S. J., Peterson, J. T., Freeman, M. C., Freeman, B. J., & Homans, D. D. (2008). Stream fish occurrence
in response to impervious cover, historic land use, and hydrogeomorphic factors. Canadian Journal of Fisheries and Aquatic Sciences, 65(7), 1250-1264.
12. Brett, J. R. (1971). Energetic responses of salmon to temperature. A study of some thermal relations in the physiology and freshwater ecology of sockeye salmon (Oncorhynchus nerkd). American zoologist, 11(1), 99-113.Walsh, C. J., Roy, A. H., Feminella, J. W., Cottingham, P. D., Groffman, P. M., & Morgan, R. P. (2005). The urban stream syndrome: Current knowledge and the search for a cure. Journal of the North American Benthological Society, 24(3), 706-723.
References
Questions?
13. Beitinger, T. L., & Fitzpatrick, L. C. (1979). Physiological and ecological correlates of preferred temperature in fish. American Zoologist, 19(1), 319-329.
14. Warren Jr, M. L., Burr, B. M., Walsh, S. J., Bart Jr, H. L., Cashner, R. C., Etnier, D. A., et al. (2000). Diversity, distribution, and conservation status of the native freshwater fishes of the southern united states. Fisheries, 25(10), 7-31.
15. Walters, D. M., Freeman, M. C., Leigh, D. S., Freeman, B. J., & Pringle, C. M. (2005). Urbanization effects on fishes and habitat quality in a southern piedmont river basin. American Fisheries Society Symposium, , 47. pp. 69.
16. Aho, J. M., Anderson, C. S., & Terrell, J. W. (1986). Habitat suitability index models and instream flow suitability curves: Redbreast sunfish Fish and Wildlife Service, US Department of the Interior.
17. Sumner, F. B., & Lanham, U. N. (1942). Studies of the respiratory metabolism of warm and cool spring fishes. The Biological Bulletin, 82(2), 313-327.
18. Ultsch, G. R., Boschung, H., & Ross, M. J. (1978). Metabolism, critical oxygen tension, and habitat selection in darters (etheostoma). Ecology, , 99-107.
19. Xue, Y., Haas, S. A., Brino, L., Gusnanto, A., Reimers, M., Talibi, D., Vingron, M., Ekwall, K., & Wright, A. P. (2004). A DNA microarray for fission yeast: minimal changes in global gene expression after temperature shift. Yeast, 21(1): 25-39.
20. GuhaThakurta, D., Palomar, L., Stormo, G. D., Tedesco, P., Johnson, T. E., Walker, D. W., Lithgow, G., Kim, S., & Link, C. D. (2002). Identification of a novel cis-regulatory element involved in the heat shock response in Caenorhabditis elegans using microarray gene expression and computational methods. Genome research, 12(5): 701-712.
21. Kraus, P. R., Boily, M. J., Giles, S. S., Stajich, J. E., Allen, A., Cox, G. M, et al. (2004). Identification of Cryptococcus neoformans temperature-regulated genes with a genomic-DNA microarray. Eukaryotic cell, 3(5), 1249-1260.
22. Burkhead, N. M. (2012). Extinction rates in North American freshwater fishes, 1900–2010. Bioscience, 62(9), 798-808.

THANK YOU!


