
EFFECTS OF AN ACUTE BOUT OF AEROBIC EXERCISE ON COGNITION AND ACADEMIC PERFORMANCE IN COLLEGE-AGED INDIVIDUALS
WITH DIFFERING TRAIT ANXIETY LEVELS
BY
TINA A. MATTILA
THESIS
Submitted in partial fulfillment of the requirements for the degree of Master of Science in Kinesiology
in the Graduate College of the University of Illinois at Urbana-Champaign, 2011
Urbana, Illinois
Master’s Committee: Associate Professor Steven J. Petruzzello, Chair Associate Professor Charles H. Hillman

ii
ABSTRACT
Anxiety is a prevalent issue on college campuses, and is associated with impaired
cognition. Finding an affordable behavioral therapy that could enhance cognitive performance in
the academic setting would be valuable. Acute exercise has been associated with both reduced
anxiety and improved cognition. Purpose: The purpose of this experiment was to investigate the
effects of 30 minutes of aerobic exercise on state anxiety (SA), cognition, and academic
performance in college-aged individuals. Participants: Thirty college students, with high- (n=9)
or low-trait (n=21) anxiety, were solicited for this experiment. Fourteen were females and
sixteen were males. Methods: Participation required three lab visits, lasting 1-2 hours each.
Demographic questionnaires and baseline assessments of cognitive function, academic
achievement, trait anxiety, and fitness were performed during visit one. The latter two visits were
counterbalanced between experimental and control conditions. The control condition involved
sitting quietly for 34 minutes on a treadmill, while the experimental condition involved 34
minutes of aerobic treadmill exercise, 20% below Ventilatory Threshold. Measures of state
anxiety, academic achievement, and inhibition were assessed at multiple time points afterward.
Results: Reductions in SA were seen in high-trait anxious individuals for both conditions. High-
trait anxious individuals had decreased SA immediately post-condition, increased SA during the
cognitive tests, and decreased SA at the end of the session. As hypothesized, SA of the high-trait
anxious group decreased significantly more from baseline to immediately post-exercise than it
did for the low-trait anxious group (as the low-trait group had a very slight increase). Low-trait
anxious individuals had less profound fluctuations in SA over time than high-trait anxious
individuals. Overall, accuracy was fairly high for all tasks except for the N2-back task. RT was
slower for tasks that were more difficult (i.e., incongruent and nontarget trials). Findings
revealed generally greater accuracy, faster RT, and greater response variability for high-trait

iii
anxious individuals than low-trait anxious individuals on all tasks. However, these responses
varied greatly depending on the condition and time of assessment. Exercise did seem to show a
trend towards facilitating cognitive performance, but failed to reach significance on many
accounts. However, this trend was not seen for N1-back and N2-back RT, because these were
slower post-exercise for both groups. Thus, results are very inconclusive. Math SAT scores were
higher after exercise than rest, for both groups. A similar trend was seen for Reading SAT
scores.

iv
DEDICATION
To Aunt Joan.
She was in my thoughts throughout this entire process.
Before losing her battle with cancer she told me that deciding to pursue my Ph.D. at Illinois was
a “no-brainer”.

v
ACKNOWLEDGEMENTS
This project was made possible through the help and support of others. First and
foremost, I would like to thank my advisor, Dr. Petruzzello, for all of his guidance as the
Responsible Project Investigator, provision of laboratory space, and support throughout this
research process.
Thank you to the Department of Kinesiology and Community Health for offering me a
teaching assistantship during my studies here. The financial support made this entire opportunity
to learn and perform research possible.
I would like to thank all of the Exercise Psychophysiology Lab volunteers for putting in
numerous hours as assistants in the lab during both data collection and input. I would especially
like to thank Annie Neckoliczak for her willingness to help me whenever possible, while
completing her own undergraduate study, simultaneously. Dr. Matt Pontifex was also very
helpful in developing the program used to export cognitive behavioral data into an Excel
spreadsheet format.
I would like to thank my fiancée, Camden Greenlee, for tolerating my crazy schedule,
walking me to and from lab, and for being my at-home support system. Special thanks also go
out to my parents for their love and genuine enthusiasm for my endeavors.

vi
TABLE OF CONTENTS
CHAPTER 1: INTRODUCTION. . . . . . . . . . . . . . . . . . . . . . . . . . . . . . . . . . . . . . . 1
CHAPTER 2: LITERATURE REVIEW. . . . . . . . . . . . . . . . . . . . . . . . . . . . . . . . . .5
CHAPTER 3: METHODS. . . . . . . . . . . . . . . . . . . . . . . . . . . . . . . . . . . . . . . . . . . .21
CHAPTER 4: RESULTS. . . . . . . . . . . . . . . . . . . . . . . . . . . . . . . . . . . . . . . . . . . . .45
CHAPTER 5: DISCUSSION. . . . . . . . . . . . . . . . . . . . . . . . . . . . . . . . . . . . . . . . 101
CHAPTER 6: CONCLUSIONS. . . . . . . . . . . . . . . . . . . . . . . . . . . . . . . . . . . . . . 120
REFERENCES. . . . . . . . . . . . . . . . . . . . . . . . . . . . . . . . . . . . . . . . . . . . . . . . . . . 126
APPENDIX A: INFORMED CONSENT DOCUMENT. . . . . . . . . . . . . . . . . . .136
APPENDIX B: FLYER. . . . . . . . . . . . . . . . . . . . . . . . . . . . . . . . . . . . . . . . . . . . .137
APPENDIX C: MASS E-MAIL. . . . . . . . . . . . . . . . . . . . . . . . . . . . . . . . . . . . . . 138
APPENDIX D: PHYSICAL ACTIVITY READINESS-QUESTIONNAIRE. . .139
APPENDIX E: HEALTH & PHYSICAL ACTIVITY HISTORY
INVENTORY. . . . . . . . . . . . . . . . . . . . . . . . . . . . . . . . . . . . . . . . . . . . . . . 140
APPENDIX F: FEELING SCALE. . . . . . . . . . . . . . . . . . . . . . . . . . . . . . . . . . . . 141
APPENDIX G: FELT AROUSAL SCALE. . . . . . . . . . . . . . . . . . . . . . . . . . . . . 142
APPENDIX H: PREFERENCE AND TOLERANCE FOR INTENSITY OF
EXERCISE QUESTIONNAIRE. . . . . . . . . . . . . . . . . . . . . . . . . . . . . . . . 143
APPENDIX I: RATING OF PERCEIVED EXERTION SCALE. . . . . . . . . . . . 144

vii
APPENDIX J: STATE ANXIETY INVENTORY. . . . . . . . . . . . . . . . . . . . . . . .145
APPENDIX K: TRAIT ANXIETY INVENTORY. . . . . . . . . . . . . . . . . . . . . . . .146
APPENDIX L: MODIFIED FLANKER TASK (IMAGE & INSTRUCTIONS).147
APPENDIX M: N-BACK TASK (IMAGE & INSTRUCTIONS). . . . . . . . . . . .148
APPENDIX N: PRACTICE READING SCHOLASTIC APTITUDE TEST
(VERSIONS 1 & 2). . . . . . . . . . . . . . . . . . . . . . . . . . . . . . . . . . . . . . . . . . .149
APPENDIX O: PRACTICE MATH SCHOLASTIC APTITUDE TEST
(VERSIONS 1 & 2). . . . . . . . . . . . . . . . . . . . . . . . . . . . . . . . . . . . . . . . . . .150

1
CHAPTER 1
INTRODUCTION
Anxiety is a prevalent issue on college campuses, and is associated with, among other
things, impaired cognition (National Institute of Mental Health, 2008). Finding a practical
behavior that could enhance cognitive performance in the academic setting would be valuable to
individuals distressed by anxiety. Acute bouts of exercise have been associated with a small 0.24
SD reduction in state anxiety (SA) levels (Petruzzello, Landers, Hatfield, Kubitz, & Salazar
1991). It is a major goal of this study to extend knowledge of benefits of acute aerobic exercise
in the literature. Improvements in cognitive function (for a review see Tomporowski, 2003), and
enhanced academic achievement (Hillman et al., 2009) may also result from participation in
acute bouts of aerobic exercise. However, others have found that exercise does not elicit
reductions in anxiety symptoms (DeMoor, Boomsma, Stubbe, Willemsen, & de Gues, 2008). It
is important to gain a better understanding of the relationships between cognition, exercise, and
emotion, specifically anxiety. Such knowledge will allow researchers to investigate the use of
exercise to both enhance cognitive function and alleviate anxiety.
A large population, 15-35% of students, is affected by high-test anxiety, negatively
affecting their academic performance (Driscoll, 2007). Anxiety-reduction has been correlated
with academic performance enhancement “(r=0.49, df = 23, p < .01)” (Driscoll, 2007, p. 3).
Although this correlation is between a specific “test anxiety” and academic performance, it is a
moderate correlation and should be further investigated in terms of general state anxiety. This
specific clinical population (i.e., test anxious) will not be addressed in the following research
study, but it is the hope of the author that the acknowledgement of a possible treatment for
individuals living with anxiety may spark future interest in this area.

2
RATIONALE
Anxiety is the most prevalent mental disorder in the United States, affecting over 18.1% of
the population, and is often accompanied by cognitive impairment, with specific deficits in
working memory and reasoning [Surgeon General, 2000; National Institute of Mental Health
(NIMH), 2008]. This equates to 40 million Americans over 18 years of age (NIMH, 2008).
Anxiety is also associated with increased mistakes and lower test scores. “Students with high
anxiety perform around 12 percentile points below their low anxiety peers…”
(http://www.amtaa.org/index.html). Test anxiety, in particular, distresses 15-35% of students,
negatively affecting their academic performance, and possibly preventing them from pursuing
higher education or careers (Driscoll, 2007; Ross & Driscoll, 2006). Since this type of research
could not be found in previous literature, it was decided that instead of narrowing the study down
to the specific test anxious population, a broader sample of high- versus low-trait anxious
individuals would be solicited, in order to examine more general state anxiety changes first.
Students deal with daily academic pressures of homework, exams, quizzes, papers, and
time management. On top of that, society places an important emphasis on academic
achievement for means of superior job placement, scholarship, and acceptance to advanced
degree programs. Lower educational attainment and socioeconomic status are associated with
higher morbidity and mortality, and are major determinants of health disparities in this country
(PAR-10-37, 2006). It is logical that students might want to participate in behaviors that facilitate
academic performance; therefore, identification of ways to attenuate test anxiety and enhance
cognition is of high importance. Exercise is one potential strategy.
3
HYPOTHESES
1) An acute bout of aerobic exercise will be associated with reductions in state anxiety levels in
both high- and low-trait anxious individuals, with significantly greater reductions seen in the
high-trait anxious group.
a) This reduction will be greater than any reduction seen following the same amount of time
spent in a control condition.
b) State anxiety will begin to return to baseline sometime after the initial decrease (i.e., the
effect will be transient).
2) An acute bout of aerobic exercise will be associated with enhanced cognitive performance, as
compared to performance after rest, measured by a working memory paradigm and an
inhibition paradigm.
a) Accuracy will increase; reaction time and variability in response times will both decrease
for both the flanker and n-back tasks. Such responses will be more pronounced for high-
trait anxious individuals than low-trait anxious individuals, as compared to their baseline
scores.
3) Changes in state anxiety will be inversely associated with academic performance. Those
individuals with high-trait anxiety, who experience reductions in state anxiety levels
following an acute bout of exercise, will see significant improvements in cognition, and
subsequently perform better on an academic achievement exam.
a) SAT math and reading scores will be better following the acute bout of exercise than
following rest.
4) Better changes in cognitive function [increased accuracy, decreased reaction time (RT), and
decreased variability in RT will be associated with better academic achievement scores.

4
DEFINITIONS
Academic Performance: For the purposes of this study, academic performance is considered to
be the numeric score earned on a Scholastic Aptitude Test covering math and reading
material deemed important by a national governing body, the College Board (2009).
Aerobic Exercise: Physical activity involving repetitive movement of large muscle groups for
prolonged periods of time (Kennedy & Yoke, 2005, p. 123) requiring “processes in which
energy (ATP) is supplied when oxygen is utilized” (Howley & Franks, 2003, p. 546).
Anxiety: The Merriam-Webster Dictionary defines this as “an abnormal and overwhelming
sense of apprehension and fear often marked by physiological signs (as sweating, tension,
and increased pulse), by doubt concerning the reality and nature of the threat and by self-
doubt about one's capacity to cope with it” (anxiety, 2010). “Anxiety results when an
individual doubts his or her ability to cope with the situation that causes him or her
stress” (Hardy et al., 1996 as cited in Humara, 1999, p. 2).
Inhibition: Cognitive inhibition is defined as “the stopping or overriding of a mental process, in
whole or in part, with or without intention” (Gorfein, & MacLeod, 2007, p. 5).
State anxiety (SA): SA is compared to trait anxiety as being “more situational in nature and is
often associated with arousal of the autonomic nervous system”(Spielberger, 1996 as
cited in Humara, 1999, p. 2).
Trait anxiety (TA): Trait anxiety is as “a characteristic of personality that endures over time and
is manifest across a variety of situations” (Donner, 2009, p. 1).
Working Memory: Working memory is an aspect of cognition that “enables a human to retrieve
stored information” and allows that information to be used and “manipulated” to
“influence current behavior” (Goldman-Rakic, 1992).
5
CHAPTER 2
LITERATURE REVIEW
ACUTE AEROBIC EXERCISE & COGNITION
It is important to make the distinction between fitness effects and the effects of an acute
bout of exercise on cognition. A study by Themanson and Hillman (2006) serves as an
exemplary difference between these two effects. The purpose of this experiment was to
determine effects of caridorespiratory fitness and acute aerobic exercise, separately, on cognitive
functioning during the Eriksen flanker task (Eriksen & Eriksen, 1974, as cited in Davranche,
Halll, & McMorris, 2009). Researchers measured event-related brain potentials (ERPs) and
analyzed components related to action monitoring: error-related negativity (ERN), error-
positivity (Pe), and N2. Response speed, accuracy, and response time following errors were also
recorded. Kinesiology undergraduate students (N=28, 50% female) were split into two groups,
high-fit (VO2max above the ACSM 80th percentile) or low-fit (everyone else). Participants came
to the lab two different days at the same time, with conditions counterbalanced. One day they
rested or read quietly for 30 minutes (min), and the other day they exercised for 30 min on a
treadmill, prior to performing five blocks of 144 trials of the incongruent and neutral conditions
of the flanker task. Results indicated that high-fit had smaller ERN and larger Pe amplitudes than
low-fit; they also exhibited more response slowing following errors compared with correct trials.
This was interpreted as an increase in top-down attentional control abilities in higher fit
individuals. There was no relationship between the acute bout of exercise and cognitive
performance nor any of the neuroelectrical indices related to action monitoring. These findings
indicate that fitness and acute bouts of exercise are associated with differential cognitive effects
and should be considered separately.

6
Executive control has been examined as a dependent variable in acute exercise studies
(Hillman, Snook, & Jerome, 2003). Executive control is an aspect of cognition “responsible for
planning and controlling sequences of action to attain a specified goal” and is “associated with
frontal lobe activity” (Colcombe & Kramer, 2003, as cited in Spirduso, 2009). The aim of the
present study was to examine what effect acute cardiovascular exercise had on the P3 component
of the ERP during an executive control task performed after exercise. A within subjects design
was used to study 20, moderately to high fit undergraduate students. Subjects came to the lab
twice. In one session, a graded exercise test was performed, and baseline ERP measurements and
flanker test scores were obtained. The other session involved 30 min of self-paced, somewhat
hard-to-hard treadmill exercise, followed by a rest period to bring HR back down within 10% of
baseline. Subjects then completed the incompatible and neutral conditions of the letter/modified
version of the Eriksen flanker task. Conditions were counterbalanced. Results indicated
significantly increased P3 amplitudes for exercise compared to baseline, and longer P3 latency in
the incompatible condition compared to the neutral condition in at baseline only. Increased P3
amplitude may suggest enhanced cognitive recruitment abilities in response to exercise (p. 312).
There was no significant difference in P3 latency in the exercise condition between incompatible
and neutral task conditions, but shorter P3 latency in the exercise conditions suggests that acute
exercise has an effect on cognitive control at this neuroelectrical level (p. 313). This could
possibly suggest increased attentional resource allocation and cognitive processing speeds
following acute aerobic exercise. This is just another example of the cited impact of acute
exercise on cognition.
Some evidence suggests that no improvement in cognitive function is seen following
aerobic exercise (Audiffren, Tomporowski, & Zagrodnik, 2009). The purpose of this study was

7
to examine performance on executive control, before, during, and after cycling at 90% of their
ventilatory threshold (VT). Adults ages 18-25 (N=19) completed three sessions, with at least two
days in between. The first session involved paperwork, practice on the Random Number
Generation (RNG) task, and a graded exercise test. The exercise session involved a 5 min warm-
up, then doing the RNG task before, during (multiple times), and after 35 min of exercise. The
rest session involved sitting on a bike while performing an identical series of RNG tasks. Results
found that participants’ mental strategy to complete the RNG task changed to a less effortful one,
during exercise. No significant effects were present immediately after exercise. This may support
the idea that the human body is distracted by the physiological requirements of exercise to such
an extent that cognitive ability is compromised during this activity.
There is evidence to suggest that working memory may be affected by aerobic exercise
(Pontifex, Hillman, Fernhall, Thompson, & Valentini, 2009). Pontifex and colleagues attempted
to expand the literature base, by examining both aerobic and resistance effects on an executive
control process. The aim of this experiment was to examine what effects aerobic or resistance
exercise, separately, have on working memory. Undergraduate students (N=21, 9 females)
completed VO2 max and 1- repetition max (1- RM) tests for seven exercises on day one. Days two,
three and four were counterbalanced. Sessions involved completion of the Sternberg working
memory task prior to, immediately following, and 30 min after taking part in one of the
experimental conditions (aerobic exercise, resistance exercise, seated rest) (Pontifex et al., 2009,
p. 930). Results indicated that for absolute reaction time (RT), the aerobic condition was
associated with shorter RT latency during both post- assessments, relative to baseline. Further,
there was a greater reduction in relative RT for aerobic exercise than resistance exercise.
Evidence from this study suggests that there is a larger benefit of acute exercise on cognitive

8
tasks requiring more executive control (p. 932). It appears that aerobic exercise was more
facilitative for cognitive performance on a working memory task, when compared to resistance
exercise.
Some have placed high importance on the search for a dose-response relationship
between exercise and cognitive function. Chang and Etnier (2009) explored the presence of such
a relationship in regards to resistance exercise intensity. Men and women with a mean age of
25.95 years (N=68) were randomly placed into: control (watched a lifting video), 40% 10-RM,
70% 10-RM, or 100% 10-RM conditions. After completing a day of baseline measures and
demographic questionnaires, participants returned to the lab to sit quietly for 15 min prior to
doing a pre-test for both the Stroop Color-Word Test (SCWT) and the Paced Auditory Serial
Addition Task (PASAT). Next, they completed the resistance exercise session, consisting of two
sets of 10 repetitions for six muscle groups. They completed SCWT and PASAT post-condition.
Results found a significant linear relationship between exercise intensity and performance on
SCT and a significant quadratic trend between intensity and SCWT. Exercise intensity
significantly predicted performance on the PASAT for trials two, three, and four. Authors
concluded that acute resistance exercise may have positive effects on processing speed and
executive functioning. Future research should further explore this relationship in experienced
lifters and different age groups. Results may appear promising, but many have documented the
relationship as being an inverted-U shape, or possibly of different shapes specific to individual
cognitive processes (Chang & Etnier, 2009, p. 641).
A meta-analysis performed by Etnier et al. (1997) analyzed moderator variables and
calculated effect sizes for 134 studies involving physical fitness or exercise and cognitive
function. Findings suggested that acute exercise has a small, insignificant mean effect (M=0.16)

9
on cognition; however, this relationship is moderated by multiple variables within the designs.
After further analysis, it was determined that random sampling, studying of intact groups, high
experimental rigor, and increasing size of the exercise group all showed greater effect sizes.
Further, studies that involved cognitive tests of perception, academic achievement, and motor
skills appeared to have significant effect sizes in relation to acute exercise. However, caution
must be taken when interpreting this last statement, as many of these effect sizes were derived
from only a small total number of studies. By revealing many of the shortcomings of earlier
research, this meta-analysis has hopefully prompted the development of better-designed studies
of exercise and cognition in this field.
ACUTE AEROBIC EXERCISE & ACADEMIC PERFORMANCE
Academic achievement may be another realm where acute exercise exerts its apparent
effects. In a study done by Hillman et al. (2009) children were studied to see if walking for a
short period on a treadmill could influence changes in cognitive control or academic
achievement. Children around 9.5 years old (N=20) were asked to complete the Brief Kaufman
Intelligence Test (KBIT) to assess intelligence; RHR and VO2 max were assessed, and guardians
completed demographic questionnaires. All children participated in counterbalanced 20-min
conditions of exercise at 60% MHR or rest. Following the condition, children were fitted with
electrode caps and each completed a modified flanker task involving a row of five arrows, with
incongruent and congruent conditions. The Wide Range Achievement Test 3rd edition (WRAT3)
with spelling, reading, and math sections was completed after removal of the cap. Findings
indicated only significantly higher scores on reading, following exercise; however, a time issue
may have been in play as the testing did not occur until 55-60 min post-exercise. There was also
an increase in response accuracy following exercise, in comparison to rest, for incongruent trials.

10
Neuroelectrical findings indicated increased P3 amplitude following acute exercise in
comparison to after rest, with general effects over the central-parietal brain regions.
The following study represents a piece of observational literature that demonstrates the
potential indirect effect of exercise on academic achievement. Mahar et al. (2006), observed
how implementing a physical activity program during the school day might affect children’s on-
task behavior in class. Participants included students grades K-4 from 15 classrooms in North
Carolina. All participated in a classroom-based Energizers program in which they were led by
their teachers in one short, 10-min bout of physical activity during each day of school, for 12
weeks. Observers were trained to observe and quantify on-task behavior of the students 30 min
before and after these Energizers. On-task behavior was convincingly manipulated as there was
no difference between mean on-task time pre- or post-break during the baseline assessments,
but there was a significant 8% mean increase in on-task behavior during the intervention period
from pre- to post-Energizers. On-task behavior was improved by acute bouts of exercise.
Improvements in on-task behavior could be the embodiment of obscure cognitive changes
taking place in response to this exercise, i.e.: attention. It is plausible that even short 10-minute
bouts of exercise could enhance academic achievement via this facilitated learning state.
ACUTE AEROBIC EXERCISE & EMOTION (ANXIETY)
Some exercise activities appear to be more susceptible to anxiety issues, which co-exist
with cognitive impairment; therefore making them prime candidates for study. Scuba diving has
been associated with panic-related fatalities, decreased memory and visual attention, and greater
prevalence of abnormal brain images (Slosman et al., 2004). Koltyn and Morgan (1997)
examined the influence of wet suit attire on anxiety, confronting the temperature hypothesis,
which contributes reductions in anxiety after exercise to body temperature increases. This is one

11
potential mechanism by which exercise may cause changes in mood state. However, they did not
find this mechanism to be plausible as mood changes still occurred in the absence of body
temperature change. Male divers (N=13) performed 20 min of moderate aerobic finning in a
pool, in a bathing suit and a wet suit, on separate days. The State Trait Anxiety Inventory
(STAI) and Body Awareness Scale were proctored on land, pre- and post-exercise, and
underwater, pre- and post-exercise. Core temperature (Tc), subjective breathing and RPE were
measured every 5 min. Perceptions of warmth, body awareness, Tc, and SA were significantly
higher post-exercise, when a wet suit was worn. A significant decrease in SA was seen 15 min
post-exercise in the bathing suit condition. Anxiety decreased, even when body temperature
failed to increase, and increased in response to increased body temperature, refuting the
temperature hypothesis. Other researchers have investigated the intensity of exercise as the
variable source of anxiety reduction.
Raglin and Wilson (1996) examined the effects of varying intensities of cycling exercise
on state anxiety levels. Male (n=10) and female (n=5) participants cycled for 20 min at 40%,
60%, and 70% VO2 peak intensities, in a non-consecutive day, counterbalanced fashion. The
STAI was administered prior to each exercise session, and 5 min, one hour, and two hours
following exercise. Results indicated decreases in SA from pre- to post-exercise for all time
points following 40% and 60% VO2 peak; state anxiety only decreased significantly from baseline
one and two hours following exercise at 70% VO2 peak. These findings are very important for
research involving acute aerobic exercise and anxiety, because the effects appear to endure for at
least two hours.
Motl, O’Connor, and Dishman (2003) examined the effects of varying intensities of
cycling exercise on SA levels in high- and low- trait anxious men, as well as the Hoffman (H)

12
Reflex reactions. This was done, because some have suggested that the H-Reflex is a
physiological marker related to anxiety. Participants (N=40, half high trait-anxious) completed a
health questionnaire, physical activity recall, and an exercise test to determine VO2 peak on day
one. SA was then assessed before and after electrical stimulation of soleus muscle and recording
of the H-Reflex. Participants completed three counterbalanced sessions, separated by a couple
days, which involved 20 min of quiet rest, and cycling at both 40% and 70% VO2 peak. SA and H-
reflex scores were assessed before and after each condition. There were significant reductions in
the H-Reflex following exercise sessions, and in SA, with larger reductions for high-trait anxious
individuals, from pre- to post- for both exercise conditions and rest. The changes that occurred
for anxiety and the H-Reflex did not appear to be related to each other. Results from this study
implicate that the H-Reflex may not be an acceptable physiological indicator of self-reported SA
changes as was once thought.
Temporal arrangement of a study is critical, and separates naïve designs from rigorous
ones. Knowing when to perform psychological assessments in relation to exercise depends on
what exactly is being measured, and how long the exercise effects seem to endure. One study
demonstrates the lasting effects of changes in anxiety levels in response to an acute bout of
exercise (Bahrke & Morgan, 1978). The aim of this study was to compare the anxiolytic effects
of meditation to those of an acute bout of exercise. Active male participants (N=75) completed
the state and trait versions of the STAI, and then were randomly assigned to a group: exercise,
meditation, or control. The exercise group ran on a treadmill for 20 min at 70% MHR, the
meditation group followed a tape recording relaxation protocol while seated, and the control
group sat quietly. The STAI-state version was completed immediately after, and 10 min
following the condition. Findings indicated significant decreases in state anxiety for all groups,
13
regardless of trait anxiety levels, but those who had higher SA levels to begin with were more
responsive to change. This demonstrates that exercise was as effective in reducing SA as the
other two conditions, and that SA continued to decrease 30 min post-exercise.
In a meta-analysis of affect regulation strategies done by Augustine and Hemenover
(2009), exercise is categorized an active/constructive distraction strategy, which appears to be
effective in moderate, but not high, intensity situations. It also appears to work better in non-
competitive sports and tends to give more energy to those people who do not exercise on a
regular basis (Augustine & Hemenover, 2009, p. 1187). Exercise was further categorized as a
behavioral avoidance strategy, as opposed to a cognitive avoidance strategy. Exercise had a
moderate effect size of d=0.47, which ranks it in the top five affect regulation strategies in this
meta-analysis (Augustine & Hemenover, 2009, p. 1202).
COGNTION & EMOTION (ANXIETY)
There appears to be a critical link between emotion and cognition that should not be
dismissed as a mere separation between two distinct areas of research (Miller, 1995). This
connection has been explored be a few researchers in attempt to close this gap and explain more
thoroughly what it is that is going on in the human body. Whether cognitive impairment is a
separate trait of the individual, a result of an emotional disorder, or the root of mental distress is
unknown; however, research in this realm can help individuals who face both of these issues.
Moriya and Tanno (2009) investigated cognitive impairments in individuals experiencing
anxiety and depression. They examined cognitive tasks void of emotion-provoking stimuli.
Previously, when emotional tasks have been used, attention was impaired in these populations.
The aim of the study was to determine whether or not impaired attention occurred similarly in
non-emotional processing, and which parts of the attentional system are specifically affected.

14
Participants included 43 undergraduates (20 women); all completed self-reports of the STAI.
Participants completed the attention network test (ANT) designed by Fan et al. 2002 (as cited in
Moriya & Tanno, 2009). This test combines a flanking and a cue task (central, spatial, or no cue)
and measures three parts of the attentional system: alerting, orienting, and executive attention
(Fan, McCandliss, Sommer, Raz, & Posner, 2002 as cited in Moriya & Tanno, 2009). Subjects
had a fixation cross to look at on the computer screen at which the target stimuli appeared. A
total of 144 trials were completed in which they were to press the left or right button in response
to a cue or target. RT was shorter and error rates were lower in congruent conditions than
incongruent, as expected. RT was shortest for spatial cue trials, and longest for no-cue trials.
Error rate in the spatial cue trials was lower than the other two conditions. Scores on the STAI
were negatively correlated with orienting attention, representing impairment in this network in
individuals with more negative affect. Further, this impairment was seen in non-emotional
cognitive processing. Alerting and executive attentions appeared to be unaffected. Future
research should explore the orienting attentional network to pinpoint specific deficits.
Dennis and Chen (2008) presented participants with threat-related and non-threat-related
emotional faces during the ANT task. Their purpose was to measure N2 amplitudes of these
individuals as they performed congruent and incongruent trials cued by these facial images.
Subject varied in levels of trait anxiety, because the investigators wanted to see what kind of N2
responses would result during ANT task performance in higher trait anxious individuals,
following such pictures. Adults (N=36) completed the STAI, and were split into high- and low-
trait anxious groups. While wearing EEG electrodes, participants completed the ANT task as
described above. Results indicated that N2 amplitudes were normally larger following
incongruent trials, compared to congruent. However, N2 amplitudes at frontal sites were

15
significantly increased during these trials, for high-trait anxious individuals, following threat-
related faces. When N2 amplitude increased, it appeared that the alerting network of the
attentional system was compromised. Authors declared themselves pioneers in research showing
an ERP component to be influenced by the emotional reaction of an individual.
A recent review of cognitive impairments in young adults with depression and anxiety
was done in effort to highlight the co-existence of these potentially detrimental issues
(Castaneda, Tuulio-Henriksson, Marttunen, Suvisaari, & Lönnqvist, 2008). In all, 36 studies
involving an array of different affective disorders were reviewed. As the focus of this paper is on
anxiety-related affective states, it is most appropriate to only summarize findings from anxiety
and cognition studies. In regards to cognition, obsessive-compulsive disorder (OCD) has been
studied the most, to date, and virtually no studies have been done on specific phobias or
generalized anxiety disorder. Researchers have associated impaired executive function, long- and
short-term visual memory, attention, and processing speed with OCD (Castaneda et al., 2008, p.
23). Impaired divided attention, short- and long-term verbal memory, short-term verbal learning,
visual memory, and visual learning have all been cited in adults with panic disorder. Social
phobia has been associated with debilitated executive function, attention, visuo-spatial ability,
and short-term verbal memory and learning (Castaneda et al., 2008, p. 22). Post-traumatic stress
disorder has been linked to impaired attention, short- and long-term visual memory, and
executive functioning (Castaneda et al., 2008, p. 23). One must keep in mind that medications
and co-morbid diseases also play a role in which of the impairments are seen in specific studies,
and these things must be accounted for in order to properly interpret the results of each study.

16
SUMMARY
Numerous research studies have investigated the relationship between acute bouts of
exercise and cognition (for a review see Tomporowski, 2003). Combined aerobic and strength
methods or yoga may also improve cognition; however, these studies are still new and do not
have enough documented success in the literature (Kramer, Erickson, & Colcombe, 2006;
Kyizom, Singh, Singh, Tandon, & Kumar, 2010). Therefore, aerobic exercise seemed to be the
appropriate choice for the present study. In choosing which cognitive tasks to assess performance
by, it was necessary to consider tasks that measured aspects of cognition also consistent with
taking academic exams. The most commonly studied executive control process in the acute
exercise literature is inhibition (Hillman, 2009). Since trait anxiety, specifically, has not been
studied extensively in regards to its relationship with cognitive performance, studying inhibition
as one of the dependent variables in this study should provide a solid measure to compare with
other studies of acute exercise. Making working memory one of the other dependent variables
was done to include another aspect of cognition closely related to academic performance.
The relationship between acute exercise and emotion has also been examined, and it is
evident that there is some relationship between exercise and anxiety. Some have attempted to
explain the association between cognition and emotion and others have looked at the relationship
between fitness and academic achievement; however, a crucial piece of the puzzle appears to be
missing. After review of the literature, it appears that the next step would be to investigate the
potential role of aerobic exercise in regulating anxiety, cognition, and academic performance.
Thus, it is the intention of this study to investigate effects of an acute bout of aerobic exercise on
dependent variables of SA, academic-related cognition, and academic performance in individuals
with high- and low-trait anxiety. It is necessary to approach this problem using current

17
theoretical frameworks that already have strong foundation in this area to develop a new
hypothetical model. Multi-dimensional Anxiety Theory (Post, 2003) and the Catastrophe Model
(Fazey & Hardy, 1988, as cited in Humara, 1999) will be used to formulate this new model.
THEORETICAL FOUNDATIONS
Multi-dimensional Anxiety Theory
This theory splits anxiety into cognitive and somatic portions. The somatic portion relates
to physiological symptoms of anxiety, noticed by the individual (Post, 2003). This can also be
thought of as arousal, which draws ideas from the Inverted-U Hypothesis, which will be
described in the next section. The cognitive anxiety portion relates to expected performance,
inability to concentrate, and disrupted attention (Post, 2003). The more cognitive anxiety one
has, the lower their subsequent performance will be (Post, 2003).
Catastrophe Model of Anxiety & Performance
The Catastrophe Model of Anxiety & Performance is originally from the sport
psychology literature and has combined ideas from the Multi-dimensional Anxiety Theory, and
the Inverted-U Hypothesis (Humara, 1999). The Inverted-U Hypothesis suggests that people
cannot perform to their best abilities at extreme low or high arousal levels. However, for each
individual there is some optimal arousal level that will elicit optimal performance (Williams,
Landers, & Boutcher, 1993, as cited in Pellegrini, Hicks, & Lopez, 2008). The Catastrophe
Model suggests that maybe there is a different type of relationship for those who have high-trait
anxiety and subsequently deal with high levels of state anxiety all of the time (Humara, 1999).
The original article by Fazey and Hardy (1988) was inaccessible; however, the
Catastrophe Model of Anxiety and Performance could potentially explain the discrepancies in
athletic performance between high- and low-trait anxious individuals, through means of state

18
anxiety levels (Humara, 1999). When low-trait anxious individuals have increased SA, it appears
to positive influence their athletic performance, whereas when high-trait anxious individuals
experience increased state anxiety, the result is diminished athletic performance (Humara, 1999).
It is posited that when cognitive anxiety is low, physiological changes in arousal do not
tend to affect the individuals’ performance as much, but when cognitive anxiety is high, low
physiological arousal levels exert an effect (Hardy et al., 1996 as cited in Humara, 1999).
Although this model is meant for athletic performance, it could relate to a cognitive testing
situation. It is thus conjectured by this author that the catastrophe model of anxiety and
performance can be applied to academic performance, as well. Cognitive behavioral
interventions have been used previously to try and alleviate both cognitive and somatic anxiety
states (Humara, 1999); this study was designed to test this same paradigm using exercise as an
intervention.
Exercise Cognition Model
Figure 1: Exercise-cognition Model Note: Figure 1 comes from (Spirduso, 2009, p. 196) which cites it as “Modified with permission” from: Spirduso, Poon, & Chodzko-Zajko, 2008, p. 4.

19
This model postulates that exercise has indirect effects on cognition as well as a direct
effect. Exercise may enhance cognition indirectly through its preventative effects on chronic
disease, and maintenance of the body’s physical and mental resources (Spirduso, 2009). Exercise
affects chronic disease status, which has its own influence on cognition. Spirduso notes that
chronic respiratory disorders, such as Chronic Obstructive Pulmonary Disease (COPD), can
severely impact cognition by creating a brain state lacking in oxygen (2009, p. 197). Anxiety
disorders have been associated with greater risks for chronic diseases such as heart disease,
gastrointestinal disorders, and chronic respiratory disorders, like COPD (“Anxiety linked…”,
2008). Anxiety could find a place in this model as a cause for chronic disease. In this model,
exercise also influences physical resources by means of promoting healthy blood flow and
proper sleep, and reducing chronic pain and mental fatigue. Mental resources are influenced by
exercise by means of improved neurotransmission and blood circulation in the brain.
Although this model represents the chronic relationship that habitual exercise has with
these variables, it does provide some insight as to how acute exercise might influence cognition.
By directly influencing state anxiety in the individual, the body’s mental and physical resources
may be enhanced, ultimately leading to improvements in cognitive function and performance.
The authors state that mental resources mediate depression and stress levels, which may also
contribute to the state of an individual’s cognitive functioning (Spirduso, 2009, p. 197).
Depressive symptoms can be improved acutely by exercise participation, just as anxiety
symptoms can be. As anxiety is a mental disorder similar to depression, it is plausible that it
could fit into this model in the same way. However, the current study and newly created
hypothetical model below, attempt to specify emotion (anxiety level) as a moderator of the direct
relationships between exercise and cognition and exercise and academic performance.

20
Figure 2: Hypothetical Model
Figure 2 demonstrates the hypothetical model for how exercise may directly, and
indirectly, affect academic performance. The indirect pathway would be through human
emotional states, namely anxiety. In this theory the solid arrows depict relationships that have
previously been investigated and were discussed in the literature review above. The dotted arrow
depicts a pathway through a moderator (anxiety). This cumulative hypothetical model brings
together present theoretical frameworks and integrates indirect (dashed lines) relationships that
need to be further explored. Exercise appears to be indirectly related to academic performance
through cognitive enhancement (Hillman et al., 2009; Mahar et al., 2006). However, there may
be an indirect effect of exercise on academic achievement through emotional pathways (mainly
by alleviating state anxiety levels, specifically in those with high-trait anxiety). This relationship
will be explored in the proposed experimental study. Hypothetical model conjectured by Tina
Mattila.
EMOTION
ACADEMIC PERFORMANCE
COGNITION
ACUTE
EXERCISE

21
CHAPTER 3
METHODS
The objectives of this research study were to collect data on state anxiety changes,
cognitive abilities, and academic achievement following a 30-minute bout of aerobic exercise on
a treadmill. Participation required three separate laboratory visits. Approximate total time
commitment for the participants in this study was between four and six hours. All meetings were
scheduled at the convenience of the participants, not to interefere with class time. Participants
completed a baseline assessment, an exercise condition, and a control condition. The exercise
and control conditions were completed in random order for all subjects, stratified by group (high-
trait anxious or low-trait anxious). All research activities took place in laboratories within Louise
Freer Hall on the University of Illinois at Urbana-Champaign campus. The Exercise
Psychophysiology Laboratory and the Freer Teaching Laboratory were used for the test
conditions and the graded exercise test, respectively. This study was conducted from January
2011 to May 2011. All subjects were given the option of receiving results from their
participation in this study.
PURPOSE/RESEARCH QUESTIONS
The purpose of this experiment was to investigate the effects of 30 minutes of aerobic
exercise on state anxiety (SA), cognition, and academic performance in college-aged individuals.
Two groups of individuals were studied: those with high-trait anxiety and those with low-trait
anxiety. The proposed study had four specific aims: (1) Determine if aerobic exercise can reduce
SA in college-aged individuals, (2) Determine if SA reductions and/or aerobic exercise are
associated with enhanced cognitive functioning, specifically inhibition and working memory, (3)
Determine if SA reduction and/or aerobic exercise are associated with enhanced academic

22
performance, and (4) Determine if post-condition changes in cognitive function are associated
with similar changes in academic performance. Within these aims, the specific focus was to
investigate the individual difference of trait anxiety. The overall goals were to create a better
understanding of the relationship between cognition, exercise, and anxiety, and ultimately, to
determine whether or not acute aerobic exercise can help alleviate anxiety and improve
performance in academic testing situations.
PARTICIPANTS
Participant Selection
Sixty college-aged individuals (18-30 years, both male and female) from the Champaign-
Urbana, Illinois area were anticipated to be included in this study. Information about the study
was distributed about the Champaign-Urbana area and the University of Illinois campus. This
was done by means of flyers (Appendix B), mass e-mails (Appendix C), and verbal
communications with academic advisors in various campus departments and the Psychological
Services Center in Champaign. The Psychological Services Center is located at 505 E. Green
Street, 3rd floor, in Champaign, Illinois. They offer numerous psychological services to people
in the community, provide outreach programs, serve as a clinical psychology program training
site, and perform related research. E-mails and flyers were given to the Center to hang and pass
out to potential participants. These messages explained the opportunity to participate in the study
and provided information to contact the Exercise Psychophysiology Laboratory, at which time
further determination of eligibility for testing could be determined. Scores from the Trait Anxiety
Inventory (TAI; Spielberger, 1983) were used to determine eligibility for the study.
Those with TAI scores of 40 or above were considered high trait-anxious, and those with
scores of 26(males)/27(females) or below were considered as low trait-anxious. The cut-off for

23
the high-trait anxious groups was determined by using the Spielberger manual (1983) to choose
the scores that fell 0.51 SD above the average for college-aged females (36.15 +/- 9.53) and 0.50
SD above the average for college-aged males (35.55 +/- 9.76). The cut-offs for the low-trait
anxious groups were determined by choosing the scores that fell 1SD above and below the
average for college-aged females and males. Participants meeting eligibility criteria were
accepted continuously until numbers were fulfilled. The local Institutional Review Board
approved the study (IRB#11156), and informed consent (Appendix A) was obtained from all
potential participants.
As this study required working with human participants, attrition was anticipated. The
following plan was developed on the assumption that individuals would inevitably drop out of
the study: over-recruit individuals from each targeted enrollment stratification, turn no
individuals meeting the study criteria away until numbers are fulfilled, contact participants by e-
mail if they do not return for an unknown reason, and follow-up email contact by calling
participants if they do not respond.
Participants were scheduled for testing sessions via e-mail. E-mails contained a list of all
available 2-hour timeslots (although testing sessions did not always take this full amount of
time). Participants were asked to choose which time slot(s) worked best for them to come into
the lab. Sessions were not to interfere with participants’ class schedules. E-mail reminders were
sent either the night before, or early in the morning on the day of testing. If an individual was 15
minutes late or did not show up to their appointment, a member of the lab team called them at the
phone number they had provided for contact purposes. If the individual answered the call, and
was able to still come into the lab (time permitting), they were still tested that day. If the

24
individual did not answer, a phone message was left and an e-mail was sent to schedule a make-
up appointment. Such a series of events was only necessary for a handful of circumstances.
POTENTIAL RISKS AND BENEFITS
Risks
This study required that the participants engage in moderate-to-vigorous physical activity
during the incremental exercise test to volitional exhaustion and the two subsequent exercise
trials. Acute consequences associated with exercise are possible muscle soreness and fatigue.
These symptoms usually dissipate within a few days (approximately 2-4 days). As with any kind
of physical activity, there was a small possibility of heart attack and sudden death. Risks were
minimized by the exclusion criteria being utilized (i.e., age limit of 30, any contraindications to
exercise). Participants were screened for good health and potential for minimal risk prior to study
participation via the Physical Activity Readiness-Questionnaire (PAR-Q) (Chisholm, Collis,
Kulak, Davenport, Gruber, & Stewart, 1978) and Health and PA History form (modified from
Health & PA History Form, Department of Kinesiology & Community Health, University of
Illinois at Urbana-Champaign, 2010). The computerized testing sections were brief, and should
not have caused any additional harm to participants’ eyes than is regularly incurred during their
own daily computer and television time. Laboratory staff was trained to watch for any signs that
an individual may have been in danger of fainting and spoke with participants throughout study
duration to confirm that they were feeling healthy and capable of completing the study.
Benefits
Participants benefited from learning their fitness level from the graded exercise test.
Additionally, participants were provided with the opportunity to ask for a summary of what was
found from the study. A handful of participants were eager to learn of the findings. The greatest

25
benefit to science was the help that their participation provided in gaining a better understanding
of how exercise may be associated with anxiety reduction and enhanced cognition. Participants
in this study were part of a research project that could potentially provide insight to enhance
cognitive functioning, especially in those individuals whose cognition may be compromised
daily by their high trait anxiety levels. The benefits of exercise are well known and well
documented. The findings of this study were hoped to provide evidence to support the potential
benefit of using exercise to control anxiety and/or facilitate processing of cognitive information.
Because participants were healthy individuals, and potential risks associated with the methods to
be employed were minimal relative to the information to be gained, this research study seemed to
outweigh the risks. Ultimately, this could have important implications for the prescription of
exercise for individuals suffering from high anxiety levels and/or test anxiety.
DATA COLLECTION
The following will describe where, with what equipment, and how data from this
experiment were collected. All data were collected and recorded using a subject ID not traceable
to the subject's identity by the investigator involved.
Exercise Psychophysiology Laboratory (room 357 Freer Hall):
The ExPPL is primarily used for research, but also provides a venue for hands-on
instruction. It is a 550 square foot laboratory located in Room 357 of Louise Freer Hall on the
UIUC campus, a building dedicated to the Department of Kinesiology and Community Health.
The ExPPL has a large conference space, surrounded by three smaller rooms equipped for
distinct functions. The first room has walls covered with sound proofing foam, for noise
reduction. The second room serves as a computer lab with three computers, printer, a shelving
unit, and sink. The computers are loaded with SPSS 12.0 software for data organization,

26
collection of self-report data, and statistical analysis. The third room is used for exercise
interventions, containing a Quinton ClubTrack Treadmill and a computer. This computer is used
for data storage and cognitive testing, as it has been loaded with STIM2 software. The STIM2
software contains the flanker task to be used to test participants’ inhibition, and will also run an
external file of the N-back working memory task that was shared by a cooperating lab in the
department. All ExPPL computers are inter-connected through the Department of Kinesiology &
Community Health Local Area Network (LAN), and thus have all data automatically backed up
onto the secure network server monitored by the department staff and the faculty uploading the
information, to ensure that data is protected. Files can always be recovered from the last time
they were saved to the server. The computers are also connected to the Internet via fast Ethernet
links. The lab has also recently acquired a metabolic system to be used for functional and
instructional purposes. Desks, a bulletin board, and a wipe board are available to graduate and
undergraduate students in the laboratory. Multiple outlets are located around the room for laptop
computer plug-ins. The conference room has plenty of artificial and natural lighting, with two
large single-paned, functional windows on the west wall. Designated members of the ExPPL,
including the Primary Investigator, have 24-hour access to the facility. The laboratory is also
stocked with Polar Heart Rate monitors and watches for use in tracking participant heart rate
during exercise participation. Locked filing cabinets are used for written questionnaire data,
coded only by participant ID, and not by name, ensuring that participants are not identifiable, nor
is their personal information.
Freer Teaching Laboratory (room 19 Freer Hall):
Room 19 of Louise Freer Hall is an 850 square foot facility consisting of the
Undergraduate Teaching Laboratory and Human Performance Lab. It is equipped with one

27
Ametek metabolic cart, two new Parvomedics metabolic cart systems (Parvomedics TrueOne
2400 Sandy, UT, USA), two Tissot tanks, a Quinton elevated motorized treadmill, a newer
standard treadmill, EKG equipment, and two Monarch cycle ergometers. The protocol used for
the incremental exercise test was programmed into the Parvomedics system.
Other Equipment
The treadmills (Quinton) used for the incremental exercise test were located in room 19
of Freer Hall. Standard plastic mouthpieces and nose clips were used in order to collect accurate
values for the incremental exercise test. A disinfectant (Cidex©) was used along with soap and
water to maintain proper sanitation of reusable equipment. Oxygen and carbon dioxide (inspired
and expired) data from the incremental exercise test was collected and measured by a metabolic
cart (Ametek) and corresponding computer software (Parvomedics metabolic cart system). The
treadmill (Quinton ClubTrack) used for conditional testing had adjustable speed and grade
capacity and was in the Exercise Psychophysiology Laboratory in room 357 Freer Hall. Heart
rates were monitored by the Polar Electro© T31 transmitter and recorded on a wrist
electrocardiogram (Polar Electro). Cognitive assessments of inhibition and working memory
were performed using computer software (Stim2); results were exported into an Excel data file.
Paper/pencil tests were administered for all other measures.
MEASURES
PAR-Q (Appendix D):
The Physical Activity Readiness Questionnaire (PAR-Q; Chisholm et al., 1978) was used
to determine if it was physically safe for a participant to partake in this study, as it involved
moderate aerobic exercise. The PAR-Q is made up of seven yes or no questions and was
completed prior to any involvement in the study. If the answer to any of the seven questions was

28
"yes" the participant was considered to be at too high of a risk for their own health to be included
in the study, and were excluded.
Health & PA History Inventory (Appendix E):
This questionnaire (modified from Health & PA History Form, Department of
Kinesiology & Community Health, University of Illinois at Urbana-Champaign, 2010) asks basic
demographic and personal information questions (sex, age, year in school, height, weight,
physical activity, and academic information.). SAT/ACT score and college cumulative GPA
were also documented. Such information will be available for use as covariate items in analyses.
Incremental Exercise Test to Volitional Exhaustion
Aerobic Capacity (VO2 max) fitness will be determined by means of maximal aerobic
capacity measured during the incremental exercise test to volitional exhaustion on the treadmill.
After data collection VO2 peak values were more accurate, and subsequently used for VT
calculations. Computer software connected to the metabolic cart was used to determine the point
at which the amount of oxygen inhaled no longer increased even when the participant continued
to exercise at a higher grade or speed. The specific equipment used was described above, and the
process of data collection is described more thoroughly in the “Procedures” section.
Ventilatory Threshold (VT):
Historically, percentage of VO2 max has been used to achieve relative exercise intensities
across subjects; however, 65% VO2 max for one person could denote an entirely different absolute
metabolic level for another. It appears VT may be a more efficient marker for obtaining the same
relative aerobic exercise intensity across subjects, since VT is near the points at which metabolic
crossover occurs and lactate threshold is reached (Ekkekakis, Hall, & Petruzzello, 2008). The VT
was determined using the protocol from Ekkekakis, Hall, & Petruzzello (2008, p. 140) and

29
software created for determining the intersection of expired VO and VCO. Participants
exercising aerobically should be below this threshold. During instances in which this protocol
did not work, the VT was determined automatically using the Parvomedics software. The
computer printout provided a time at which VT was reached, VO2 in L/min, and a heart rate
(HR). With this information in hand, laboratory staff went through the breath-by-breath
metabolic text report to find the noted time and VO2. Next, the corresponding VO2 mL/kg/min
was determined. The VO2 mL/kg/min value 20% below the one corresponding with VT was
circled and the HR at this time point was used as the target HR for the exercise condition. If there
were any discrepancies, values were charted to get an accurate visual extrapolation of the data.
Feeling Scale (FS) (Appendix F):
This is a scale developed by Hardy and Rejeski (1989) that measures how someone is
feeling from +5 (very good) to -5 (very bad) (Backhouse, Ekkekakis, Biddle, Foskett, &
Williams, 2007). The FS was used during the incremental exercise test and both conditions to
determine how an individual was feeling and was used during conditions, to serve as a
comparison between how they were feeling during the condition versus during aerobic exercise
portion of the incremental exercise test.
Felt Arousal Scale (FAS) (Appendix G):
This is a scale developed by Svebak and Murgatroyd in 1985 (Backhouse et al., 2007).
This scale ranges from 1 to 6, and assesses from low to high arousal levels in participants. This
was used during the incremental exercise test and during both conditions to check participant
arousal levels. “Both the FS and FAS have been used in several previous exercise studies
conducted by various laboratories around the world and have exhibited satisfactory convergent
and discriminant validity” (Backhouse et al., 2007, p. 507).

30
Preference for and Tolerance of Exercise Intensity Questionnaire (PRETIE-Q) (Appendix H):
The PRETIE-Q is a 16-item Likert scale questionnaire that takes inventory of an
individual’s exercise habits by having them select whether they agree or disagree, on a
continuum, with a statement about their exercise habits (Ekkekakis, Hall, & Petruzzello, 2005).
Half of the questionnaires represent the idea of exercise preference, while the other half
represents exercise tolerance.
Rating of Perceived Exertion (RPE) Scale (Appendix I):
This scale ranges from 6 to 20, with 6 being low exertion, and 20 being exhaustion (Borg,
1998). Participants pointed to numbers on this continuum during the incremental exercise test
and each condition, in order to check their exertion levels in relation to heart rate measures.
State Anxiety Inventory (SAI) (Appendix J)
State anxiety (SA) is compared to trait anxiety as being “more situational in nature and is
often associated with arousal of the autonomic nervous system” (Spielberger,1996, as cited in
Humara, 1999, p. 2). SA was assessed using the 10-item State Anxiety Inventory (SAI). This
survey contains 10 statements about how the individual is feeling at that moment in time.
Participants chose the response that best fit how they felt at the time, using a 4-point Likert scale
ranging from “Not at all” to “Very much so”. The STAI has been questioned as a valid outcome
measure, so SA results should be interpreted with caution. The scale does not appear capable of
discriminating increased positive activation from anxiety, nor decreased positive activation from
decreased anxiety, resulting in indefinite outcome scores (Ekkekakis, Hall, & Petruzzello, 1999).
Yet, this measure is used often in the literature, and produces consistent results across similar
studies. Participants completed the 10-item SAI (r=0.95 with full 20-item inventory) at four time
points: immediately prior to condition, 0, 35, and 70 minutes post-condition.

31
Trait Anxiety Inventory (TAI) (Appendix K):
Individual trait anxiety levels were determined using the TAI (Spielberger, 1983). The TAI
consists of 20 items that assess how that person feels in general, on average, or all of the time,
and is taken in paper pencil format. Participants choose the response that
best reflects how they feel. Based on norms for college-aged women and men, low-trait anxiety
is reflected by scores <28 for females and <27 for males; high-trait anxiety is reflected by TAI
scores >40 for females and >40 for males (Spielberger, 1983).
Modified Flanker Task (Appendix L):
This task involves inhibition of irrelevant stimuli surrounding the relevant stimulus.
Specifically, the Flanker task targets selective response inhibition, a subset of executive control.
For this experiment, the task involved a series of images with five congruent or four congruent
and one incongruent stimuli presented on the screen. In general, such stimuli can be in the form
of shapes, arrows, or letters. Arrows were used as stimuli for this study, and the participant was
asked to choose the direction in which the middle arrow (either congruent or incongruent to the
two arrows on each side of it) is pointing by pushing an assigned key on the computer (Eriksen
& Eriksen, 1974, as cited in Davranche, Halll, & McMorris, 2009). Participants looked at a
series of five symbols in a horizontal row (e.g., >>>>>, >><>>, <<<<<, <<><<), and pressed a
specific key on the keyboard in relation to the orientation of the center symbol. The center
symbol was similar (i.e., congruent) or dissimilar (i.e., incongruent) to the four (2 per side)
symbols flanking it on both the right and left sides. Participants performed two blocks of 100
trials, with each trial lasting 80-100 milliseconds. The inter-trial interval was between 1000-1200
milliseconds. Reaction time and correctness of answers were assessed. On visit 1, one practice
block of 64 was performed as an orientation to the task.

32
N-back Task (Appendix M):
In this task, the participant was asked to both recognize a non-verbal stimulus, and to
determine whether or not the current stimulus was the same or different from a prior stimulus, N
items back (Gevins & Cutillo, 1993, as cited in Owen, McMillan, Laird, & Bullmore, 2005). The
individual was prompted visually as to when they should make this decision (as soon as they saw
the shape). This task was meant to test working memory through behavioral performance.
Working memory is an aspect of cognition that “enables a human to retrieve stored information”
and allows that information to be used and “manipulated” to “influence current behavior”
(Goldman-Rakic, 1992). This task involves three consecutive phases called the N0-back, the N1-
back, and the N2-back. Each phase requires participants to discriminate between 5 different
stimuli. The stimuli are shapes represented by a specific color (blue triangles, red circles, orange
crosses, purple stars, and green squares). Each shape is presented, one at a time, in the center of a
computer screen for duration of 2900ms with a 100ms inter-stimulus interval (ISI) and 80 trials
of equally probable presentation of each stimulus (16 trials for each shape). Stimuli, ISI, total
trials, and probability are the same in all three phases with the exception of shape presentation
order. Participants were asked to compare the shape they previously saw, 0, 1, or 2 shapes back
in the series, to that which appeared on the screen. The first phase, or N0-back, requires
participants to only pay attention to the presentation of the cross shape. The participant makes a
right hand response if the current stimulus shape is a cross, or makes a left hand response if the
current stimulus shape is not a cross. The second phase, or N1-back, follows immediately after
the N0-back and requires participants to remember the shape presented immediately before the
current shape. The participant makes a right hand response if the current stimulus shape is the
same as the previous shape, or makes a left hand response if the current stimulus shape is not the

33
same as the previous shape. The N2-back phase follows immediately after the N1-back. This
phase requires the participant to remember the shape presented two shapes back and make a right
hand response if the current stimuli shape is the same as the second stimuli previous (i.e., Target
stimulus), and a left hand response if the current stimuli shape is not the same shape as the
second stimuli previous (i.e., Nontarget stimulus). Reaction time and correctness of answers
were assessed. The total time to complete all three phases is about 12 minutes. [Description
adopted from protocol belonging to the Neurocognitive Kinesiology Laboratory at the University
of Illinois]
Practice Reading Scholastic Aptitude Test (SAT) & Practice Math SAT (Appendices N, O):
The SAT tests involved shortened forms of critical reading (12 questions) and math (10
questions) sections from January and May, year 2000 practice exams (Claman, 2003). These
tests were used to assess academic achievement. Scores from these standardized tests have been
used nationally and accepted as valid predictors of scholastic aptitude (College Board, 2009).
Scores on the reading exam could range from 0 to 12, and scores on the math exam could range
from 0 to 10. Scores were calculated using the formula provided in the testing book (Claman,
2003). SAT tests were hand-scored by two individuals, one undergraduate laboratory student and
one graduate student. The number of incorrect answers was divided by four; this total was then
subtracted from the number of correct answers. No test material was given to participants to take
out of the laboratory, and test copies were only used within the bounds of this research study.

34
RESEARCH DESIGN
The study was partially cross-sectional in nature, as it investigated the individual
differences of trait anxiety and aerobic fitness levels. The rest of the study followed a within-
subjects experimental design, involving the performance of an acute bout of aerobic exercise
(main independent variable) and a sitting at rest condition (control). The main dependent
variables were state anxiety levels, inhibition, working memory, and academic achievement
scores.
Figure 3: Visit 1: Baseline Assessments & Orientation

35
Figure 4: Control Condition-Rest (Visit 2 or 3)
Figure 5: Experimental Condition (Visit 2 or 3)

36
PROCEDURES
Visit 1
Upon arrival to the Exercise Psychophysiology Laboratory (room 357 Freer) participants
were greeted and asked to sit down to fill out paperwork. Prior to any baseline assessments,
participants completed a PAR-Q and were given an informed consent form to read over and sign,
if they chose to participate in the study. Additional paperwork included the Trait Anxiety
Inventory (TAI), the Preference for and Tolerance of the Intensity of Exercise Questionnaire
(PRETIE-Q), and the Health & PA History Form (Spielberger, 1983; Ekkekakis, Hall, &
Petruzzello, 2005; modified from Health & PA History Form, Department of Kinesiology &
Community Health, University of Illinois at Urbana-Champaign). Individual characteristics of
regular physical activity behavior, age, height, weight, gender, SES, education level,
standardized college entrance test score, GPA (semester and cumulative), and medication use
was also recorded at this time. The standardized test scores and GPA were chosen as measures of
baseline academic achievement, because similar measures have been used in previous work in
this field (Coe, Pivarnik, Womack, Reeves, & Malina, 2006; Grissom, 2005).
Baseline cognitive assessments of working memory and inhibition were also completed
on visit one. The N-back task and Flanker task were completed using a computer monitor and
keyboard (Gevins & Cutillo, 1993, as cited in Owen, McMillan, Laird, & Bullmore, 2005;
Eriksen & Eriksen, 1974, as cited in Davranche, Hall, & McMorris, 2009). There were 3 separate
parts of versions A, B, and C of the N-back task, proctored in one of six random-balanced orders.
These tasks were described in detail in the measures section. The Flanker task only had one part,
and was proctored in one of two random versions, A or B. Each test was described to the
participant (refer to Appendices M & L, respectively), and they were allowed to complete a

37
practice version of each test prior to actual data collection. Lights were turned off for all
computer tests to allow for easy viewing of the visual stimuli on the screen. A member of the
research team remained in the room for the practice session to ensure that the participant
understood the instructions for the task. After each practice session, the assessor asked if the
participant felt comfortable, set up the actual test, and left the room.
Ventilatory threshold (VT) and fitness were also determined on this day. Fitness level
was determined by means of peak aerobic capacity measured during a graded exercise test. Thus,
following the computer tests, participants were asked to step on the treadmill in the Exercise
Psychophysiology Laboratory. Participants were allowed to orient themselves with a treadmill,
for as long as needed, prior to performing the graded exercise test. They were shown how to turn
on and start the treadmill and then asked to increase the speed until they had reached a
comfortable jogging pace. They were asked to choose a “jogging pace, that they felt comfortable
maintaining for an extended period of time”. They were also allowed to choose a warm-up speed
at this time. These speeds were recorded for use during the graded exercise test. After this was
ascertained, the treadmill was stopped and the participant was instructed to collect all of their
belongings.
The rest of Visit 1 testing took place in the Freer Teaching Laboratory. The metabolic
cart was calibrated and all equipment was set up earlier in the day. Upon arriving to the room,
the participant was asked to set their things down and go to the fitting room to put on a Polar©
HR monitor (Polar Electro). Next, the participant was asked to sit on a chair in the testing room.
A member of the research team explained what all of the equipment was, what the graded
exercise test would be like, and how to signal that they would like to stop. To signal exhaustion,
participants were instructed to grab onto the side rails and jump their feet off of the belt. A foam

38
board displaying the Feeling Scale (FS; Hardy & Rejeski, 1989 as cited in Backhouse,
Ekkekakis, Biddle, Foskett, & Williams, 2007) and Borg’s Rating of Perceived Exertion (RPE;
Borg, 1998) scale were used to assess how participants were feeling and how hard they were
working, respectively, during the test. Both scales were explained to them prior to test start.
Next, the research team member in charge of the computer input the participant’s age, height,
weight, sex, warm-up speed, and jogging speed. After asking the participant if they had any
questions, the testing session began.
Participants began in a seated position in a wooden chair, placed on the treadmill belt.
The researcher fitted the headgear to the individual’s head, and then allowed them to place the
mouthpiece in their mouth. While the researcher tightened the apparatus, participants were
instructed to press firmly against the mouthpiece in order to ensure a proper seal. A
demonstration was given on how to wear the nose clips, and participants were allowed to put
these on themselves. After the researcher confirmed that no air was coming in or out of the
nostrils, the start button was clicked on the computer screen. A baseline period of 3 minutes was
spent at rest. At the end of the 3 minutes, a research team member asked the participant to stand
and straddle the belt as they removed the chair from the treadmill. Once the belt started,
participants were asked to step on and begin walking or jogging for their 2-min warm-up. Thirty
seconds before the end of each 2-min stage of the graded exercise test, the research team placed
the board with the Feeling Scale and RPE scale in front of the participant and asked them to
point to a number indicating their current state. The participant was notified 10-15 seconds
before the grade was to increase for the next stage. Once the participant had reached a point of
volitional exhaustion they stopped and jumped off of the belt, while holding the railings. A
gloved member of the research team stepped behind them and removed the headgear and

39
mouthpiece so that they could breathe freely. Participants then stepped back on the treadmill and
continued to walk for a cool-down. After the cool-down, participants were walked to a water
fountain and back to the testing room to rest until their HR was 100 b•min-1 or less. Then,
participants were allowed to go back to the changing room to remove their HR monitor. They
were told that they would receive an e-mail about Day 2 testing and were walked to the front
door of Freer Hall.
Visits 2 & 3
On the latter two visits, a control condition and an experimental condition were counter-
balanced. Upon arrival, they were seated at a table in the lab and asked to fill out the 10-item
State Anxiety Inventory (SAI) (Spielberger, 1983). Next, they were fitted with a Polar© HR
monitor and the day’s events were explained to them. Participants were also familiarized with
the Feeling Scale (FS), RPE scale, and an additional Felt Arousal Scale (FAS; Svebak &
Murgatroyd, 1985 as cited in Backhouse, Ekkekakis, Biddle, Foskett, & Williams, 2007) at this
time. The control condition involved sitting quietly in a chair on a treadmill for 34 minutes. The
experimental condition involved 30 minutes of aerobic exercise on a treadmill, with a 2-minute
warm-up and a 2-minute cool-down. Aerobic exercise was performed and monitored at 20%
below each individual’s Ventilatory Threshold (VT) (according to their target HR range
calculated from the results of their graded exercise test), in order to guarantee that the individual
did not begin using anaerobic systems to complete the bout. In a meta-analysis done by
Petruzzello et al. (1991), the mode, intensity, and duration of exercise associated with the most
significant improvements in anxiety was aerobic exercise, of moderate to high intensity, lasting
21-30 min. Colcombe and Kramer (2003) did a meta-analysis involving older individuals,
showing that 31-45 min was most effective for improving cognitive performance. Though the

40
participants in this study were not old, the aim was to improve cognitive function. Therefore, in
this study, 30 min of aerobic treadmill exercise was chosen as the exercise manipulation.
Following the warm-up, testing began and the participant was asked about their current
state (using the FS, RPE, and FAS scales) every four minutes until 25:30. From 25:30 to the end
of the cool-down, the participant was asked about their state every two minutes, in addition to
one final time when the treadmill was stopped. Grade and speed were adjusted throughout the
test by the research team. This was necessary in order to maintain the participant’s exercise
target HR. Participants were given the option to share their preference of more grade or speed
with the researcher, and sincere efforts were made to acknowledge their wishes when possible.
Immediately after the treadmill stopped, participants were asked to complete another 10-item
SAI. They were then instructed to remove their HR monitor, drink desired water, and wipe away
any sweat. After this short period (no more than 5 minutes, usually fewer) cognitive testing
began. Computer tests (Flanker, N-back) were completed first, in random order. Each portion
was explained to them as it was on Visit 1, and they were offered an opportunity to practice.
Once they felt comfortable, the researcher left the room. Lights were turned off for both practice
and actual tests. The participant alerted the researcher at the end of each test by stating “I’m
done”.
After the participant completed all four computer tests, they were given a Scholastic
Aptitude Test (SAT) practice test. The SAT Critical Reading and Math sections of practice tests
were used to assess academic achievement (Claman, 2003). Participants were instructed to
complete Part 1 (reading or math) depending which of the two versions they were given that day.
There were two separate versions of the SAT exam. One had a reading portion first and math
second, and the other was a completely different version with reading and math parts in the

41
reverse order. Participants were instructed to read the instructions and to try to complete the test
to the best of their abilities. They were told that they would have a maximum of 15 minutes to
complete the test, but if they finished early they could say, “I’m done”. The researcher then
closed the door and set the timer for 15 minutes. Following completion of Part 1, participants
were asked to complete a third 10-item SAI. Next, they were given similar instructions to
complete Part 2 of the SAT exam. Once they had finished the exam, or time had run out, they
were asked to take the four computerized cognitive tasks one more time. The session ended with
the participant completing one final 10-item SAI. State anxiety was assessed pre-condition,
immediately post-condition, 35 minutes post-condition, and 70 post-condition. Previous work
had shown that the effects of acute exercise on state anxiety appear to last up to 30, 60, or 120
minutes (Bahrke & Morgan, 1978; Cox, Thomas, & Davis, 2000; Raglin & Wilson, 1996). The
entire testing period, including the experimental condition, lasted less than 120 minutes. They
were either told that they would receive an e-mail about Visit 3 or thanked for their time and
asked if they would like to be added to the list of individuals interested in seeing general results
of the study.
DATA ANALYSIS
The Statistical Package for the Social Sciences (SPSS) 12.0, was used for all data
analysis. Data was input into an SPSS spreadsheet with proper variable coding. A 2 (Group) x 2
(Condition) x 4 (Time) Repeated Measures Analysis of Variance (RM-ANOVA) was used to
examine Condition x Time (within-subjects factors) and Trait Anxiety (as a between subjects
“Group” variable). If interactions existed, post-hoc analyses were performed. When the
sphericity assumption was violated the Huynh-Feldt (H-F) ε was used to adjust the degrees of
freedom. Univariate analyses were performed to calculate descriptive statistics of all participants.

42
Independent samples t-tests were run on individual differences of sex, age, height, weight, trait
anxiety, years of education, GPA, ACT Score, VO2peak, and Ventilatory Threshold (VT) to
determine any group differences for the beginning sample, the final sample, and between those
who dropped out and those who completed the study. Change scores were computed for SA,
SAT score, accuracy, RT, and StdRT for all Flanker and N-back trials.
To determine whether an acute bout of aerobic exercise was associated with reductions in
state anxiety levels in both high- and low-trait anxious individuals, with significantly greater
reductions seen in the high-trait anxious group (Hypothesis 1), RM-ANOVA was performed on
state anxiety levels in relation to Group, Condition, and Time. State anxiety changes between
four time points (pre-condition, immediately post-condition, 35 min post-condition, and 70 min
post-condition) were analyzed to determine if a significant decrease was seen after exercise
(Hypothesis 1). These change scores were compared with change scores from the cognitive
measures, using the Pearson product moment correlation. This was done to determine whether or
not state anxiety seemed to be moderating this relationship. To determine if state anxiety would
begin to return to baseline sometime after any initial decrease (Hypothesis 1), RM-ANOVA was
performed to look at mean state anxiety over time.
To determine if an acute bout of aerobic exercise was associated with enhanced cognitive
performance, as compared to performance after rest (Hypothesis 2), RM-ANOVA was
performed on all measures of performance for both Flanker and N-back tasks. Flanker analyses
were separated by responses to congruent and incongruent stimuli. RM-ANOVA was performed
for accuracy, reaction time (RT), and standard deviations of RT (StdRT) for Congruent,
Incongruent, and Overall Flanker trials. N-back analyses were separated by responses to
nontarget, versus target stimuli. RM-ANOVA was performed for accuracy, reaction time (RT),

43
and StdRT for Target, Nontarget, and Overall and N-back (0, 1, and 2) trials. Baseline and post-
condition scores on N-back and Flanker tasks were examined to determine if an acute bout of
aerobic exercise was associated with enhanced cognitive performance, as compared to
performance after rest (Hypothesis 2). RM-ANOVA was also used to investigate whether or not
enhanced cognitive performance was significantly greater in high-trait anxious, relative to low-
trait anxious (Hypothesis 2), whether or not accuracy would increase, and whether or not RT and
variability in response times would decrease for both the Flanker and N-back tasks. This also
helped in the determining whether such responses were more pronounced for high-trait anxious
individuals than low-trait anxious individuals, compared to their baseline scores (Hypothesis 2).
To determine whether or not changes in state anxiety were inversely associated with
academic performance (Hypothesis 3), RM-ANOVA was performed to determine whether or not
individuals performed better on academic achievement exams after exercise, more so than after
rest (Hypothesis 3). Pearson product moment correlations between the changes in state anxiety
on the exercise day and changes on SAT reading and math scores from the resting day to the
exercise day were determined. The differences in performance between high-trait anxious and
low-trait anxious individuals were also investigated (Hypothesis 3).
To determine whether or not improvements in cognitive function (increased accuracy,
decreased RT, and decreased StdRT) were associated with better academic achievement scores,
Pearson product moment correlations were investigated to see if reductions in state anxiety
and/or improvements in cognition were significantly correlated with improvements in academic
achievement (Hypothesis 3).
Some participants had incomplete data due to unintentional losses that occurred
throughout the data collection process. For each relationship investigated, only participants with

44
full data sets were included, and this is noted under each table. Therefore, if an individual who
dropped out still had complete data for one of the variables, their information was still included
in analysis. All tests of significance were performed at an alpha level=.05. Bar graphs were used
instead of line graphs, as it is unknown how variables may or may not have fluctuated in between
the time points at which they were assessed.

45
CHAPTER 4
RESULTS
The purpose of this experiment was to investigate the effects of 30 minutes of aerobic
exercise on SA, cognition, and academic performance in college-aged individuals with high-trait
anxiety or low-trait anxiety. The first aim was to determine if aerobic exercise could reduce SA
in college-aged individuals. The second aim was to determine if SA reductions and/or aerobic
exercise were associated with enhanced cognitive functioning. The third aim was to determine if
SA reduction and/or aerobic exercise were associated with enhanced academic performance. The
fourth aim was to determine if post-condition changes in cognitive function were associated with
similar changes in academic performance. Within these aims, the specific focus was to
investigate the individual cognitive responses that individuals with differing levels of trait
anxiety had following exercise versus rest.
PARTICIPANTS
Participants were recruited from Champaign-Urbana, IL and the surrounding areas, and
were accepted continuously in hopes that desired numbers would eventually be fulfilled, and no
individuals were turned away. All participants were offered the experience and given the
opportunity to volunteer with full right to decline. They were given an informed consent form to
read and to determine whether or not they would like to participate. Those who met study criteria
were randomized to a condition order and stratified into high- and low-trait anxious groups. If at
anytime the participant felt uncomfortable with the research or no longer wanted to participate,
they were informed that they could ask to stop, with no penalty or negative judgements towards
them. Data collection lasted for a period five months.

46
Table 1. Preliminary sample descriptive statistics of participants. Participant Characteristics Males
(n=17) Females (n=18)
Total Sample (N=35)
M SD M SD M SD Trait Anxiety Inventory (TAI) score 27.88 10.61 31.32 11.19 30.14 11.08 Age (years) 21.00 1.73 21.28 2.49 21.14 2.13 Height (inches) 70.85 2.13 65.11 2.14 67.90 3.59 Weight (pounds) 169.19 16.96 133.94 18.20 150.53 24.90 Education (years) 15.07 1.39 15.11 1.18 15.09 1.26 ACT Score 27.56 1.75 27.88 2.98 27.88 2.98 GPA (4.0 scale) 3.32 0.48 3.57 0.38 3.45 0.44 VO2 peak (mL•kg-1•min-1) 56.15 7.20 44.59 7.52 50.21 9.33 Ventilatory Threshold (VO L• min-1) 3.38 0.86 2.01 0.47 2.70 0.97 Note: The information above includes all participants who attended at least one of the three laboratory visits. Two individuals took the SAT instead of the ACT, and were excluded from the average ACT score calculation. One of these individuals dropped out of the study prior to completion. Thirty-five college-aged individuals, 9 high-trait anxious, and 26 low-trait anxious, were
solicited for this experimental study (17 males, 18 females). Characteristics of these individuals
are described in Table 1 above. Numbers were unequal due to continuous inclusion of
volunteers, fewer being high-trait anxious.
Table 2. Preliminary sample descriptive statistics by group. Participant Characteristics Low-trait (n=26)
14 Male, 12 Female High-trait (n=9) 3 Male, 6 Female
M SD M SD Trait Anxiety Inventory (TAI) score 23.42 1.89 47.67 4.80 Age (years) 20.73 1.69 22.33 2.87 Height (inches) 68.56 3.38 66.00 3.71 Weight (pounds) 152.52 22.96 145.00 30.49 Education (years) 14.78 1.17 15.56 1.01 ACT Score 27.65 2.82 28.44 3.47 GPA (4.0 scale) 3.49 0.30 3.35 0.57 VO2 peak (mL•kg-1•min-1) 52.33 8.53 44.06 9.23 Ventilatory Threshold (VO L• min-1) 2.90 1.00 2.18 0.72 Note: The information above includes all participants who attended at least one of the three laboratory visits. Two individuals took the SAT instead of the ACT, and were excluded from the average ACT score calculation. One of these individuals dropped out of the study prior to completion. Characteristics of the individuals who participated long enough to be placed into a group
are described in Table 2 above. An independent samples t-test showed significant group
differences in Trait Anxiety (p< .001), VO2peak (p = .034), and VT (p = .033), when equality of
variances was not assumed.

47
An independent samples t-test showed significant group differences between those
individuals who did not complete the study (n=5) and those who did (n=30). Average Trait
Anxiety was significantly lower (p= .002) in those who did not complete the study (M=23.60,
SE=0.51) than those who did (M=30.87, SE=2.12), when equality of variance was not assumed.
Average VO2peak was significantly lower (p= .036) in those who did not complete the study
(M=45.08, SE=1.85) than those who did (M=51.06, SE=1.77).
Table 3. Final sample descriptive statistics by group. Participant Characteristics Low-trait
(n=21) High-trait
(n=9) Male 13 3 Female 8 6
M SD M SD Trait Anxiety Inventory (TAI) score 23.67 2.13 47.67 4.80 Age (years) 20.95 1.66 22.33 2.87 Height (inches) 68.93 3.32 66.00 3.71 Weight (pounds) 154.10 23.04 145.00 30.49 Education (years) 14.84 1.17 15.56 1.01 ACT Score 27.68 2.94 28.44 3.47 GPA (4.0 scale) 3.49 0.39 3.35 0.57 VO2 peak (mL•kg-1•min-1) 54.06 8.44 44.06 9.23 Ventilatory Threshold (VO L• min-1) 2.97 1.00 2.18 0.72 Note: This table includes averages for all participants who attended all three laboratory visits. One low-trait anxious individual took the SAT instead of the ACT, and was excluded from the average ACT score calculation. This left the final sample size at 30 individuals (9 high-trait anxious, 21 low-trait anxious;
16 males, 14 females). Participant characteristics for the final sample of individuals who
completed the study in its entirety are described in Table 3 above. An independent samples t-test
showed significant group differences in Trait Anxiety (p< .001), VO2peak (p= .014), and VT (p=
.023), when equal variance was not assumed. As designed, the high-trait anxious group had
higher Trait Anxiety than the low-trait anxious group. The high-trait anxious group had a lower
average VO2peak and a lower average VT than the low-trait anxious group.

48
STATE ANXIETY Table 4. State anxiety.
CONDITION GROUP TIME M SD Low-trait Baseline 13.38 3.67 High-trait 19.11 6.55 Low-trait Immediately Post-Rest 10.81 1.03 High-trait 16.11 5.80 Low-trait 35 minutes Post-Rest 13.29 4.38 High-trait 18.22 5.61 Low-trait 70 minutes Post-rest 13.57 4.03
REST
High-trait 17.22 3.99 Low-trait Baseline 12.52 2.36 High-trait 20.44 6.75 Low-trait Immediately Post-Exercise 13.38 2.94 High-trait 14.44 2.74 Low-trait 35 minutes Post-Exercise 14.00 4.09 High-trait 19.22 4.84 Low-trait 70 minutes Post-Exercise 12.67 3.12
EXERCISE
High-trait 16.44 4.80 Note: (Low-trait anxious n=21, High-trait anxious n=9) Average state anxiety over time for both groups is displayed in Table 4 above. Average
state anxiety for the high-trait anxious group (M=17.65, SE=0.87) was higher than the low-trait
anxious group (M=12.95, SE=0.57). Tests of within-subjects effects showed a significant main
effect of Time [H-F ε=0.97, F(2.92,81.85)=10.40, p< .001, partial η2=.27] and significant Time
x Group [H-F ε=0.97, F(2.92,81.85)=4.47, p= .006, partial η2=.14] and Condition x Time x
Group interactions [H-F ε=0.82, F(2.47,69.03)=3.22, p= .036, partial η2=.10]. An independent
samples t-test (2-tailed sig.) showed that the reduction in SA from baseline to immediately post-
exercise was significantly greater in high-trait anxious individuals than low-trait anxious
individuals (Mean difference=-6.86, SE=2.13, t(10.17)=-3.21, p= .009, when equality of variance
was not assumed). This t-test also showed that the reduction in SA from 35 minutes post-exercise
to 70 minutes post-exercise was also significantly greater in high-trait anxious individuals (Mean
difference=-4.14, SE=1.81, t(9.32)=-2.29, p= .047, when equality of variances was not assumed).
No such relationships existed for changes in SA following the rest condition.

49
Figure 6: State Anxiety Change Over Time Across Condition

50
FLANKER RESULTS FLANKER ACCURACY Table 5. Flanker accuracy on congruent trials. CONDITION GROUP TIME M SD
Low-trait Baseline 97.20 3.37 High-trait 97.67 2.65 Low-trait Immediately Post-Exercise 97.60 4.68 High-trait 97.56 3.68 Low-trait 50 minutes Post-Exercise 96.90 4.89
EXERCISE
High-trait 97.00 3.04 Low-trait Baseline 97.20 3.37 High-trait 97.67 2.65 Low-trait Immediately Post-Rest 96.60 4.65 High-trait 97.56 4.10 Low-trait 50 minutes Post-Rest 95.10 5.55
REST
High-trait 97.89 2.26 Note: (Low-trait anxious n=20, High-trait anxious n=9) Average accuracy for congruent trials are displayed in Table 5 above. Average accuracy
for congruent trials for the high-trait anxious group (M=97.56, SE=1.13) was greater than the
low-trait anxious group (M=96.77, SE=0.76), but this difference was not statistically significant.
Tests of within-subjects effects showed a significant Group x Condition interaction [H-F ε=1.00
F(1,27)=5.21, p= .31, partial η2=.16. The high-trait group had increased accuracy from 0 to 50
minutes post-rest (mean change= +0.33%), while the low trait group became less accurate
between 0 and 50 minutes post-rest (mean change= -1.5%), but this difference was not
statistically significant.

51
Table 6. Flanker accuracy on incongruent trials. CONDITION GROUP TIME M SD
Low-trait Baseline 87.15 8.85 High-trait 89.89 7.56 Low-trait Immediately Post-Exercise 87.15 13.32 High-trait 88.89 7.94 Low-trait 50 minutes Post-Exercise 87.70 11.94
EXERCISE
High-trait 90.22 6.74 Low-trait Baseline 87.15 8.85 High-trait 89.89 7.56 Low-trait Immediately Post-Rest 86.00 11.76 High-trait 87.11 6.72 Low-trait 50 minutes Post-Rest 85.90 13.29
REST
High-trait 87.11 8.87 Note: (Low-trait anxious n=20, High-trait anxious n=9) Average accuracy on incongruent trials is displayed in Table 6 above. Average accuracy
for incongruent trials for the high-trait anxious group (M=88.85, SE=3.27) was greater than the
low-trait anxious group (M=86.84, SE=2.19), but this difference was not statistically significant.
No significant effects or interactions were found for accuracy on incongruent trials. Overall,
average accuracy for the high-trait anxious group was greater (M=88.85, SE=3.27) than the low-
trait anxious group (M=86.84, SE=2.19, but this difference was not statistically significant. Post-
hoc analysis revealed that the accuracy on incongruent trials was greater for exercise (M=88.50,
SE=2.01) than rest; this relationship approached significance (M=87.19, SE=1.98, p= .065). The
high-trait anxious group had greater post-exercise accuracy on incongruent trials 50 minutes
post-exercise (M=90.22, SD=6.74) than baseline (M=89.89, SD=7.56), but this difference was
not statistically significant. The low-trait anxious group had no change in accuracy on
incongruent trials from baseline (M=87.15, SD=8.85) to immediately post-exercise (M=87.15,
SD=13.32).

52
Table 7. Flanker accuracy on all trials. CONDITION GROUP TIME M SD
Low-trait Baseline 92.18 5.20 High-trait 93.78 4.87 Low-trait Immediately Post-Exercise 92.38 8.38 High-trait 93.22 5.69 Low-trait 50 minutes Post-Exercise 92.30 8.00
EXERCISE
High-trait 93.61 4.62 Low-trait Baseline 92.18 5.20 High-trait 93.78 4.87 Low-trait Immediately Post-Rest 91.30 7.69 High-trait 92.33 5.14 Low-trait 50 minutes Post-Rest 90.50 8.99
REST
High-trait 92.50 5.07 Note: (Low-trait anxious n=20, High-trait anxious n=9)
Average Accuracy for all trials are displayed in Table 7 above. Average accuracy for all
Flanker trials for the high-trait anxious group (M=93.20, SE=2.09) was greater than the low-trait
anxious group (M=91.80, SE=1.40), but this difference was not statistically significant. No
significant effects or interactions were found for accuracy on all trials. Post-exercise accuracy for
the high-trait anxious group (M=93.22, SE=2.56) was greater than post-rest (M=92.33, SE=2.34)
and than post-exercise and post-rest accuracies for the low-trait anxious group (M=92.38,
SE=1.72; M=91.30, SE=1.57), but these differences were not statistically significant.

53
FLANKER REACTION TIME Table 8. Flanker reaction time on congruent trials. CONDITION GROUP TIME M (ms) SD
Low-trait Baseline 386.55 61.42 High-trait 388.67 36.12 Low-trait Immediately Post-Exercise 374.87 49.07 High-trait 367.22 19.15 Low-trait 50 minutes Post-Exercise 371.94 44.66
EXERCISE
High-trait 360.17 17.46 Low-trait Baseline 386.55 61.42 High-trait 388.67 36.12 Low-trait Immediately Post-Rest 376.49 47.50 High-trait 374.50 31.70 Low-trait 50 minutes Post-Rest 363.68 41.19
REST
High-trait 369.23 29.01 Note: (Low-trait anxious n=20, High-trait anxious n=9); (ms)=milliseconds Average RT for congruent trials are displayed in Table 8 above. Average RT for
congruent trials for the high-trait anxious group (M=374.74, SE=14.19) was faster than the low-
trait anxious group (M=376.68, SE=9.52), but this difference was not statistically significant.
Tests of within-subjects effects showed a significant main effect of Time for RT on congruent
trials [H-F ε=0.62, F(1.24,33.58)=10.19, p= .002, partial η2=.27], but there were no main effects
of Condition or Group. There were no interaction effects. Average RT for congruent trials was
significantly faster than baseline (M=387.61, SE= 11.07) at both post-condition time points,
immediately post- (M=373.27, SE=8.15, p= .008) and 50 minutes post-condition (M=366.25,
SE=7.30, p= .002), respectively. Average RT for congruent trials was significantly faster
immediately post-condition than 50 minutes post-condition (p= .006). RT for congruent trials
post-exercise in the high-trait anxious group (M=367.22, SE=14.15) was smaller than post-rest
(M=374.50, SE=14.48) and than post-exercise and post-rest RT for congruent trials in the low-
trait anxious group (M=374.87, SE=9.50; M=376.49, SE=9.71), but these differences were not
statistically significant.

54
Figure 7: RT to Congruent Trials in the Flanker Task Over Time Note: ** denotes significant differences from RT at all other time points Table 9. Flanker reaction time on incongruent trials. CONDITION GROUP TIME M (ms) SD
Low-trait Baseline 441.28 60.65 High-trait 438.64 40.34 Low-trait Immediately Post-Exercise 419.10 55.47 High-trait 411.56 22.73 Low-trait 50 minutes Post-Exercise 415.32 48.09
EXERCISE
High-trait 403.29 24.87 Low-trait Baseline 441.28 60.65 High-trait 438.64 40.34 Low-trait Immediately Post-Rest 424.88 54.28 High-trait 427.90 40.00 Low-trait 50 minutes Post-Rest 406.95 46.30
REST
High-trait 408.88 34.56 Note: (Low-trait anxious n=20, High-trait anxious n=9); (ms)=milliseconds Average RT for incongruent trials are displayed in Table 9 above. Average RT for
incongruent trials for the high-trait anxious group (M=421.49, SE=15.30) was faster than the
low-trait anxious group (M=424.80, SE=10.26), but this difference was not statistically
significant. Tests of within-subjects effects showed a significant main effect of Time for RT on
incongruent trials [H-F ε=0.64, F(1.28,34.67)=20.14, p< .001, partial η2=.43], and a Condition x
Time interaction effect [H-F ε=0.96, F(1.91,51.65)=3.22, p= .050, partial η2=.11]. Overall,
average RT for incongruent trials in the high-trait anxious group was faster (M=421.49,

55
SE=15.30) than in the low-trait anxious group (M=424.80, SE=10.26), but this difference was not
statistically significant. RT for incongruent trials decreased significantly more from baseline
(M=439.96, SE=11.12) immediately post-exercise (M=415.33, SE=9.66) than immediately post-
rest (M=426.39, SE=10.13). Post-hoc analysis revealed RT on incongruent trials to be
significantly different from each other at all time points (p< .001).
Figure 8: RT to Incongruent Trials in the Flanker Task Over Time Note: ** denotes significant differences from RT at all other time points

56
Table 10. Flanker reaction time on all trials. CONDITION GROUP TIME M (ms) SD
Low-trait Baseline 412.24 60.63 High-trait 412.69 38.15 Low-trait Immediately Post-Exercise 395.76 52.12 High-trait 388.36 19.47 Low-trait 50 minutes Post-Exercise 392.49 46.39
EXERCISE
High-trait 380.96 20.42 Low-trait Baseline 412.24 60.63 High-trait 412.69 38.15 Low-trait Immediately Post-Rest 399.22 50.58 High-trait 399.66 35.45 Low-trait 50 minutes Post-Rest 384.21 43.42
REST
High-trait 387.98 31.87 Note: (Low-trait anxious n=20, High-trait anxious n=9); (ms)=milliseconds Average RT for all Flanker trials are displayed in Table 10 above. Average overall RT for
Flanker trials for the high-trait anxious group (M=397.05, SE=14.69) was faster than the low-
trait anxious group (M=399.36, SE=9.86), but this difference was not statistically significant.
Tests of within-subjects effects showed a significant main effect of Time for RT for all Flanker
trials [H-F ε=0.61, F (1.23,33.11)=15.46, p< .001, partial η2=.36]. Post-hoc analysis revealed that
RT was faster immediately post-condition (M=395.75, SE=8.72, p= .001) and 50 minutes post-
condition (M=386.41, SE=7.73, p< .001) than at baseline (M=412.46, SE=11.03). After exercise,
high-trait anxious individuals’ RT continuously decreased over time, while low-trait individuals’
RT began returning to baseline 50 minutes post-condition, but this difference was not statistically
significant. Overall, the high-trait anxious group had faster average RT (M=397.05, SE=14.69)
than in the low-trait anxious group (M=399.36, SE=9.86), but this difference was not statistically
significant.

57
Figure 9: Reaction Time to All Flanker Trials Note: * denotes significant difference from baseline FLANKER STANDARD DEVIATION OF REACTION TIME (StdRT) Table 11. Flanker standard deviation of RT on congruent trials. CONDITION GROUP TIME M (ms) SD
Low-trait Baseline 56.70 20.95 High-trait 68.01 24.76 Low-trait Immediately Post-Exercise 50.82 17.28 High-trait 54.02 10.30 Low-trait 50 minutes Post-Exercise 51.50 19.30
EXERCISE
High-trait 50.27 11.41 Low-trait Baseline 56.70 20.95 High-trait 68.01 24.76 Low-trait Immediately Post-Rest 52.48 18.81 High-trait 61.42 20.73 Low-trait 50 minutes Post-Rest 54.71 23.95
REST
High-trait 60.62 21.14 Note: (Low-trait anxious n=20, High-trait anxious n=9); (ms)=milliseconds Average StdRT for congruent Flanker trials are displayed in Table 11 above. Average
StdRT for congruent trials for the high-trait anxious group (M=60.39, SE=5.68) was greater than
the low-trait anxious group (M=53.82, SE=3.81), but this difference was not statistically
significant. Tests of within-subjects effects showed a significant main effect of Time for standard
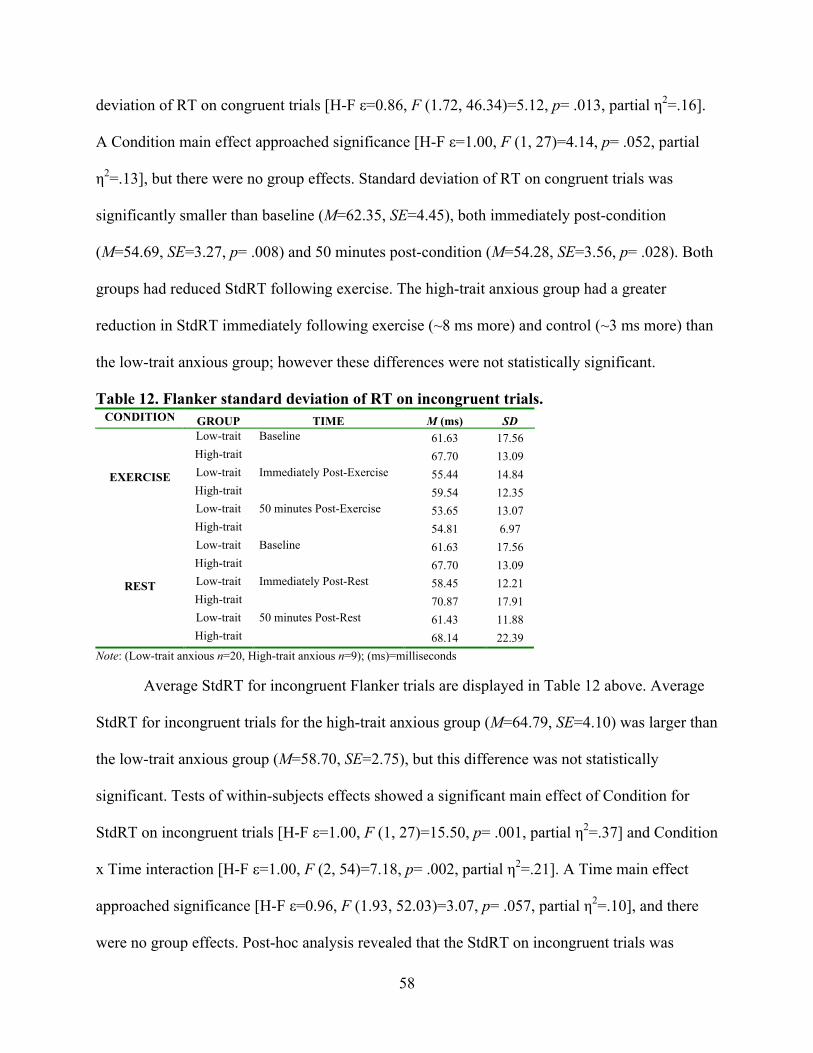
58
deviation of RT on congruent trials [H-F ε=0.86, F (1.72, 46.34)=5.12, p= .013, partial η2=.16].
A Condition main effect approached significance [H-F ε=1.00, F (1, 27)=4.14, p= .052, partial
η2=.13], but there were no group effects. Standard deviation of RT on congruent trials was
significantly smaller than baseline (M=62.35, SE=4.45), both immediately post-condition
(M=54.69, SE=3.27, p= .008) and 50 minutes post-condition (M=54.28, SE=3.56, p= .028). Both
groups had reduced StdRT following exercise. The high-trait anxious group had a greater
reduction in StdRT immediately following exercise (~8 ms more) and control (~3 ms more) than
the low-trait anxious group; however these differences were not statistically significant.
Table 12. Flanker standard deviation of RT on incongruent trials. CONDITION GROUP TIME M (ms) SD
Low-trait Baseline 61.63 17.56 High-trait 67.70 13.09 Low-trait Immediately Post-Exercise 55.44 14.84 High-trait 59.54 12.35 Low-trait 50 minutes Post-Exercise 53.65 13.07
EXERCISE
High-trait 54.81 6.97 Low-trait Baseline 61.63 17.56 High-trait 67.70 13.09 Low-trait Immediately Post-Rest 58.45 12.21 High-trait 70.87 17.91 Low-trait 50 minutes Post-Rest 61.43 11.88
REST
High-trait 68.14 22.39 Note: (Low-trait anxious n=20, High-trait anxious n=9); (ms)=milliseconds Average StdRT for incongruent Flanker trials are displayed in Table 12 above. Average
StdRT for incongruent trials for the high-trait anxious group (M=64.79, SE=4.10) was larger than
the low-trait anxious group (M=58.70, SE=2.75), but this difference was not statistically
significant. Tests of within-subjects effects showed a significant main effect of Condition for
StdRT on incongruent trials [H-F ε=1.00, F (1, 27)=15.50, p= .001, partial η2=.37] and Condition
x Time interaction [H-F ε=1.00, F (2, 54)=7.18, p= .002, partial η2=.21]. A Time main effect
approached significance [H-F ε=0.96, F (1.93, 52.03)=3.07, p= .057, partial η2=.10], and there
were no group effects. Post-hoc analysis revealed that the StdRT on incongruent trials was

59
significantly smaller for exercise (M=58.80, SE=2.55) than rest (M=64.70, SE=2.62, p=.001).
The high-trait anxious group had a slight increase in StdRT immediately following rest (~3 ms)
while the low-trait anxious group had a slight decrease (~3 ms); however, this difference was not
statistically significant.
Table 13. Flanker standard deviation of RT on all trials. CONDITION GROUP TIME M (ms) SD
Low-trait Baseline 66.53 16.45 High-trait 72.90 17.32 Low-trait Immediately Post-Exercise 58.54 13.44 High-trait 61.53 8.69 Low-trait 50 minutes Post-Exercise 57.73 13.91
EXERCISE
High-trait 57.42 7.12 Low-trait Baseline 66.53 16.45 High-trait 72.90 17.32 Low-trait Immediately Post-Rest 61.48 13.54 High-trait 71.93 16.66 Low-trait 50 minutes Post-Rest 63.12 15.70
REST
High-trait 68.41 17.06 Note: (Low-trait anxious n=20, High-trait anxious n=9); (ms)=milliseconds
Average StdRT for all Flanker trials is displayed in Table 13 above. Average overall
StdRT for Flanker trials for the high-trait anxious group (M=67.52, SE=4.24) was larger than the
low-trait anxious group (M=62.32, SE=2.84), but this difference was not statistically significant.
Tests of within-subjects effects showed significant main effects of Condition [H-F ε=1.00, F (1,
27)=12.61, p= .001, partial η2=.318] and Time [H-F ε=0.87, F (1.73, 46.8)=8.32, p= .001, partial
η2=.24] and a significant Condition x Time interaction [H-F ε=1.00, F (2, 54)=6.36, p= .003,
partial η2=.19] for StdRT across all Flanker trials. Post-hoc analysis revealed that StdRT was
significantly lower following exercise (M=62.44, SE=2.49) than rest (M=67.39, SE=2.79, p=
.001). Overall StdRT at baseline (M=69.71, SE=3.36) was significantly greater than StdRT
immediately post-condition (M=63.37, SE=2.42, p= .003) and StdRT 50 minutes post-condition
(M=61.67, SE=2.59, p= .004).

60
N-BACK RESULTS N-BACK ACCURACY Table 14. N0-back accuracy on target stimuli.
CONDITION GROUP TIME M SD Low-trait Baseline 94.39 5.70 High-trait 89.60 7.68 Low-trait Immediately Post-Exercise 93.14 8.58 High-trait 95.86 4.41 Low-trait 50 minutes Post-Exercise 91.26 13.66
EXERCISE
High-trait 90.28 7.09 Low-trait Baseline 94.39 5.70 High-trait 89.60 7.68 Low-trait Immediately Post-Rest 94.08 8.23 High-trait 90.30 7.75 Low-trait 50 minutes Post-Rest 90.33 12.42
REST
High-trait 89.58 12.89 Note: (Low-trait anxious n=20, High-trait anxious n=9)
Average accuracy for all Target trials of the N0-back task are displayed in Table 14
above. Average accuracy for Target trials on the N0-back task for the high-trait anxious group
(M=90.87, SE=2.45) was lower than the low-trait anxious group (M=92.93, SE=1.64), but this
difference was not statistically significant. No significant main effects or interactions were
revealed for accuracy on Target Stimuli on the N0-back task. Overall, accuracy on Target trials
of the N0-back task increased from baseline (M=92.00, SE=1.28) to immediately post-condition
(M=93.34, SE=1.41) and decreased below baseline at 50 minutes post-condition (M=90.36,
SE=2.30), but after sphericity was adjusted for, this difference was not significant. Accuracy
scores on the N0-back task to Target Stimuli immediately post-exercise seem to demonstrate that
high-trait individuals had improved performance following exercise, more so than the
immediately post-rest and low-trait individuals (refer to Table 14 for means). However, this
difference was not statistically significant.

61
Table 15. N0-back accuracy on nontarget stimuli. CONDITION GROUP TIME M SD
Low-trait Baseline 99.77 0.76 High-trait 99.66 1.03 Low-trait Immediately Post-Exercise 99.84 0.49 High-trait 99.47 0.80 Low-trait 50 minutes Post-Exercise 99.22 1.56
EXERCISE
High-trait 99.30 1.59 Low-trait Baseline 99.77 0.76 High-trait 99.66 1.03 Low-trait Immediately Post-Rest 99.92 0.36 High-trait 99.64 0.71 Low-trait 50 minutes Post-Rest 99.69 0.82
REST
High-trait 99.12 1.14 Note: (Low-trait anxious n=20, High-trait anxious n=9)
Average accuracy for all nontarget trials of the N0-back task are displayed in Table 15
above. Average accuracy for nontarget trials on the N0-back task for the high-trait anxious group
(M=99.47, SE=0.16) was lower than the low-trait anxious group (M=99.70, SE=0.11), but this
difference was not statistically significant. (p= .257). No significant main effects or interactions
were revealed for accuracy on Nontarget Stimuli on the N0-back task.
Table 16. N1-back accuracy on target stimuli. CONDITION GROUP TIME M SD
Low-trait Baseline 93.81 4.15 High-trait 91.11 4.86 Low-trait Immediately Post-Exercise 92.86 4.35 High-trait 92.22 8.70 Low-trait 50 minutes Post-Exercise 83.33 23.84
EXERCISE
High-trait 91.11 9.28 Low-trait Baseline 93.81 4.15 High-trait 91.11 4.86 Low-trait Immediately Post-Rest 93.81 4.15 High-trait 86.67 9.35 Low-trait 50 minutes Post-Rest 89.76 7.33
REST
High-trait 88.33 10.31 Note: (Low-trait anxious n=21, High-trait anxious n=9)
Average accuracy for all Target trials of the N1-back task are displayed in Table 16
above. Average accuracy for Target trials on the N1-back task for the high-trait anxious group
(M=90.09, SE=1.79) was lower than the low-trait anxious group (M=91.23, SE=1.17), but this

62
difference was not statistically significant (p= .598). No significant main effects or interactions
were revealed for accuracy on Target Stimuli on the N1-back task. A Condition x Group
interaction approached significance [H-F ε=1.00, F(1, 28)=3.33, p= .079, partial η2=.11]. Post-
hoc analysis showed that high-trait anxious individuals had lesser accuracy after rest (M=88.70,
SE=1.61) than exercise (M=91.48, SE=2.58), while low-trait anxious individuals had greater
accuracy after rest (M=92.46, SE=1.05) than exercise (M=90.00, SE=1.69).
Figure 10: N1-back Accuracy on Target Stimuli Note: High- and low-trait individuals appeared to have inverse responses to exercise and rest. Average scores for high-trait individuals were higher after exercise and lower after rest. Average scores for low-trait individuals were lower after exercise and higher after rest. However, no significant group effects were found.

63
Table 17. N1-back accuracy on nontarget stimuli. CONDITION GROUP TIME M SD
Low-trait Baseline 99.19 1.16 High-trait 99.06 0.90 Low-trait Immediately Post-Exercise 98.79 1.87 High-trait 97.92 1.86 Low-trait 50 minutes Post-Exercise 93.21 18.16
EXERCISE
High-trait 98.87 1.70 Low-trait Baseline 99.19 1.16 High-trait 99.06 0.90 Low-trait Immediately Post-Rest 98.95 1.37 High-trait 98.11 2.16 Low-trait 50 minutes Post-Rest 98.79 1.53
REST
High-trait 97.73 1.90 Note: (Low-trait anxious n=21, High-trait anxious n=9)
Average accuracy for all nontarget trials of the N1-back task are displayed in Table 17
above. Average accuracy for nontarget trials on the N1-back task for the high-trait anxious group
(M=98.46, SE=0.89) was the same as the low-trait anxious group (M=98.02, SE=0.59). No
significant main effects or interactions were revealed for accuracy on Nontarget Stimuli on the
N1-back task. In general, accuracy on Nontarget Stimuli on the N1-back task decreased over
time. Accuracy at baseline (M=99.12, SE=0.22) was greater than accuracy immediately post-
condition (M=98.44, SE=0.30), which was greater than accuracy 50 minutes post-condition
(M=97.15, SE=1.57).

64
Table 18. N2-back accuracy on target stimuli. CONDITION GROUP TIME M SD
Low-trait Baseline 91.90 9.42 High-trait 92.22 7.55 Low-trait Immediately Post-Exercise 87.86 15.78 High-trait 91.11 6.97 Low-trait 50 minutes Post-Exercise 88.81 15.64
EXERCISE
High-trait 87.22 9.05 Low-trait Baseline 91.90 9.42 High-trait 92.22 7.55 Low-trait Immediately Post-Rest 93.81 6.10 High-trait 93.89 4.17 Low-trait 50 minutes Post-Rest 91.43 8.82
REST
High-trait 89.44 10.74 Note: (Low-trait anxious n=21, High-trait anxious n=9)
Average accuracy for all Target trials of the N2-back task are displayed in Table 18
above. Average accuracy on Target Stimuli on the N2-back task for the high-trait anxious group
(M=91.02, SE=2.29) was higher than the low-trait anxious group (M=90.95, SE=1.50), but this
difference was not statistically significant (p=.981). No significant main effects or interactions
were revealed for accuracy on Target Stimuli on the N2-back task. In general, accuracy on
Target Stimuli on the N2-back task decreased over time. Accuracy at baseline (M=92.06,
SE=1.78) was greater than accuracy immediately post-condition (M=91.67, SE=1.54), which was
greater than accuracy 50 minutes post-condition (M=89.23, SE=1.82). On average, accuracy was
higher after rest (M=92.12, SE=1.08) than after exercise (M=89.85, SE=2.01).

65
Figure 11: Accuracy on Flanker Task Over Time

66
Table 19. N2-back accuracy on nontarget stimuli. CONDITION GROUP TIME M SD
Low-trait Baseline 96.16 3.74 High-trait 94.08 4.73 Low-trait Immediately Post-Exercise 94.59 14.53 High-trait 96.56 4.24 Low-trait 50 minutes Post-Exercise 94.84 15.56
EXERCISE
High-trait 97.70 2.74 Low-trait Baseline 96.16 3.74 High-trait 94.08 4.73 Low-trait Immediately Post-Rest 98.29 1.63 High-trait 97.33 1.95 Low-trait 50 minutes Post-Rest 98.20 2.14
REST
High-trait 97.52 2.31 Note: (Low-trait anxious n=20, High-trait anxious n=9)
Average accuracy for all nontarget trials of the N2-back task are displayed in Table 19
above. Average accuracy on Nontarget Stimuli on the N2-back task for the high-trait anxious
group (M=96.21 SE=1.63) was the same as the low-trait anxious group (M=96.37, SE=1.07). No
significant main effects or interactions were revealed for accuracy on Nontarget Stimuli on the
N2-back task. In general, accuracy on Nontarget Stimuli on the N2-back task increased over
time. Accuracy at baseline (M=95.11, SE=0.81) was lower than accuracy immediately post-
condition (M=96.69, SE=1.26), which was lower than accuracy 50 minutes post-condition
(M=97.07, SE=1.37). On average, accuracy was higher after rest (M=96.93, SE=0.37) than after
exercise (M=95.65, SE=1.78). High-trait anxious individuals became more accurate over time,
for both conditions, and low-trait anxious individuals performed better post-rest than post-
exercise.

67
N-BACK REACTION TIME (RT) Table 20. N0-back RT to target stimuli.
CONDITION GROUP TIME M (ms) SD Low-trait Baseline 436.35 54.26 High-trait 416.12 33.05 Low-trait Immediately Post-Exercise 451.19 64.45 High-trait 439.00 43.48 Low-trait 50 minutes Post-Exercise 462.97 82.59
EXERCISE
High-trait 472.07 76.40 Low-trait Baseline 436.35 54.26 High-trait 416.12 33.05 Low-trait Immediately Post-Rest 462.82 90.17 High-trait 455.07 39.45 Low-trait 50 minutes Post-Rest 475.99 76.51
REST
High-trait 461.17 79.68 Note: (Low-trait anxious n=20, High-trait anxious n=9); (ms)=milliseconds
Average RT for all Target trials of the N0-back task are displayed in Table 20 above. On
average, high trait individuals (M=443.26, SE=19.40) had faster RT to Target Stimuli on the N0-
back task than low-trait individuals (M=454.28, SE=13.01), but the difference was not
statistically significant (p= .641). Test of within-subjects effects showed a main effect of Time
for RT on Target Stimuli on the N0-back task [H-F ε=0.93, F (1.87, 50.39)=12.92, p< .001,
partial η2=.32]. In general, RT on Target Stimuli on the N0-back task slowed over time. Post-hoc
analysis showed that RT at baseline (M=426.24, SE=9.82) was significantly faster than
immediately post-condition (M=452.02, SE=12.70, p= .003) and 50 minutes post-condition
(M=468.05, SE=14.85, p< .001), and both post-condition reaction times were significantly
different from each other (p= .030). On average, RT was slower after rest (M=451.25, SE=12.61)
than after exercise (M=446.28, SE=11.30).

68
Table 21. N0-back reaction time to nontarget stimuli. CONDITION GROUP TIME M (ms) SD
Low-trait Baseline 416.79 52.48 High-trait 392.03 44.64 Low-trait Immediately Post-Exercise 418.68 75.23 High-trait 395.98 31.60 Low-trait 50 minutes Post-Exercise 411.74 81.97
EXERCISE
High-trait 377.97 34.16 Low-trait Baseline 416.79 52.48 High-trait 392.03 44.64 Low-trait Immediately Post-Rest 425.61 82.67 High-trait 388.06 40.12 Low-trait 50 minutes Post-Rest 412.79 78.77
REST
High-trait 396.14 67.67 Note: (Low-trait anxious n=20, High-trait anxious n=9); (ms)=milliseconds
Average RT for all nontarget trials of the N0-back task are displayed in Table 21 above.
Average RT to Nontarget Stimuli on the N0-back task for the high-trait anxious group
(M=390.37, SE=19.52) was faster the low-trait anxious group (M=417.07, SE=13.10), but the
difference was not statistically significant (p= .266). No significant main effects or interactions
were revealed for RT to Nontarget Stimuli on the N0-back task. RT to Nontarget Stimuli on the
N0-back task remained relatively the same (~400 ms) over time. On average, RT was slower
after rest (M=405.24, SE=12.42) than after exercise (M=402.20, SE=11.64).

69
Table 22. N1-back reaction time to target stimuli. CONDITION GROUP TIME M (ms) SD
Low-trait Baseline 528.47 100.18 High-trait 493.02 73.15 Low-trait Immediately Post-Exercise 517.35 133.67 High-trait 494.27 115.99 Low-trait 50 minutes Post-Exercise 516.89 166.81
EXERCISE
High-trait 481.13 72.59 Low-trait Baseline 528.47 100.18 High-trait 493.02 73.15 Low-trait Immediately Post-Rest 528.23 119.09 High-trait 505.78 83.78 Low-trait 50 minutes Post-Rest 475.60 97.81
REST
High-trait 478.50 101.63 Note: (Low-trait anxious n=21, High-trait anxious n=9); (ms)=milliseconds
Average RT for all Target trials of the N1-back task are displayed in Table 22 above. On
average, high trait individuals (M=490.95, SE=32.98) had faster RT to Target Stimuli on the N1-
back task than low-trait individuals (M=515.83, SE=21.59), but the difference was not
statistically significant (p= .533). No significant main effects or interactions were revealed for
RT to Target Stimuli on the N1-back task. Average RT to Target Stimuli on the N1-back task
decreased over time. RT at baseline (M=559.35, SE=23.51) was slower than RT immediately
post-condition (M=530.48, SE=27.43), which was slower than RT 50 minutes post-condition
(M=472.76, SE=23.86). Unexpectedly, average RT to Target Stimuli on the N1-back task was
slower after exercise (M=523.29, SE=27.89) than after rest (M=518.44, SE=21.34), but this
difference was not statistically significant (p= .720).
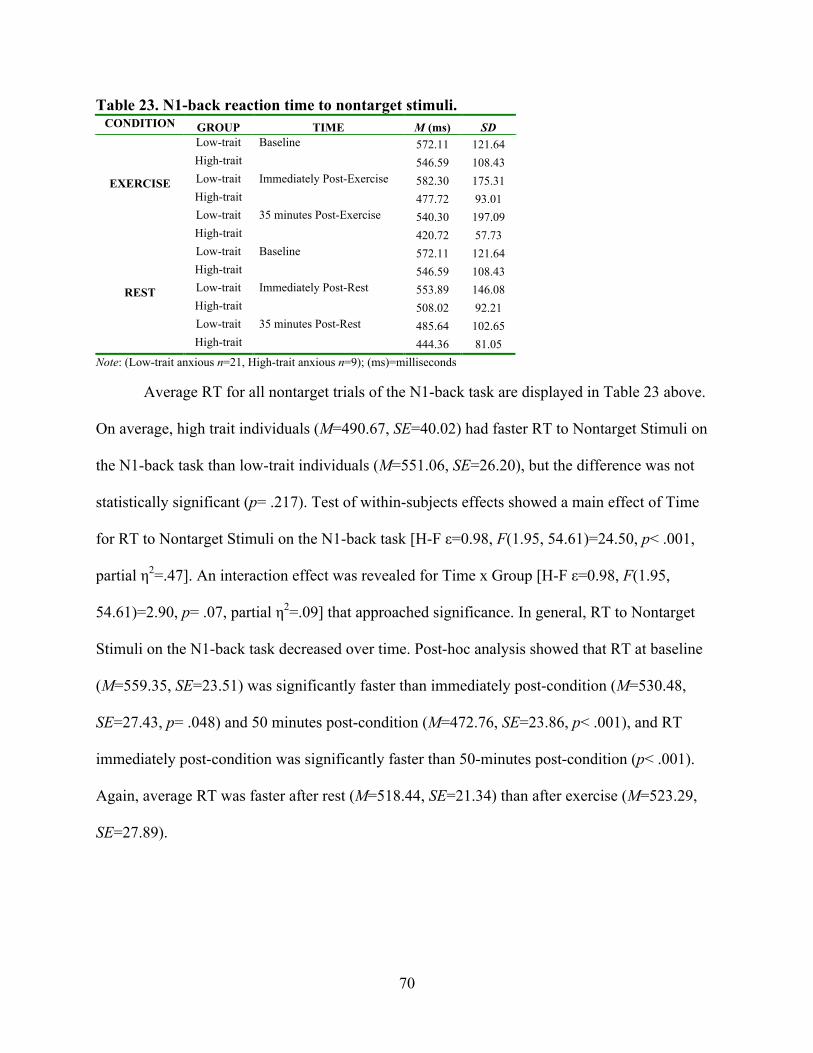
70
Table 23. N1-back reaction time to nontarget stimuli. CONDITION GROUP TIME M (ms) SD
Low-trait Baseline 572.11 121.64 High-trait 546.59 108.43 Low-trait Immediately Post-Exercise 582.30 175.31 High-trait 477.72 93.01 Low-trait 35 minutes Post-Exercise 540.30 197.09
EXERCISE
High-trait 420.72 57.73 Low-trait Baseline 572.11 121.64 High-trait 546.59 108.43 Low-trait Immediately Post-Rest 553.89 146.08 High-trait 508.02 92.21 Low-trait 35 minutes Post-Rest 485.64 102.65
REST
High-trait 444.36 81.05 Note: (Low-trait anxious n=21, High-trait anxious n=9); (ms)=milliseconds
Average RT for all nontarget trials of the N1-back task are displayed in Table 23 above.
On average, high trait individuals (M=490.67, SE=40.02) had faster RT to Nontarget Stimuli on
the N1-back task than low-trait individuals (M=551.06, SE=26.20), but the difference was not
statistically significant (p= .217). Test of within-subjects effects showed a main effect of Time
for RT to Nontarget Stimuli on the N1-back task [H-F ε=0.98, F(1.95, 54.61)=24.50, p< .001,
partial η2=.47]. An interaction effect was revealed for Time x Group [H-F ε=0.98, F(1.95,
54.61)=2.90, p= .07, partial η2=.09] that approached significance. In general, RT to Nontarget
Stimuli on the N1-back task decreased over time. Post-hoc analysis showed that RT at baseline
(M=559.35, SE=23.51) was significantly faster than immediately post-condition (M=530.48,
SE=27.43, p= .048) and 50 minutes post-condition (M=472.76, SE=23.86, p< .001), and RT
immediately post-condition was significantly faster than 50-minutes post-condition (p< .001).
Again, average RT was faster after rest (M=518.44, SE=21.34) than after exercise (M=523.29,
SE=27.89).

71
Table 24. N2-back reaction time to target stimuli.
CONDITION GROUP TIME M (ms) SD Low-trait Baseline 831.04 288.98 High-trait 739.54 212.52 Low-trait Immediately Post-Exercise 687.64 220.28 High-trait 599.31 170.14 Low-trait 35 minutes Post-Exercise 631.64 224.84
EXERCISE
High-trait 545.33 114.05 Low-trait Baseline 831.04 288.98 High-trait 739.54 212.52 Low-trait Immediately Post-Rest 649.90 200.19 High-trait 598.02 176.82 Low-trait 35 minutes Post-Rest 610.87 213.24
REST
High-trait 556.52 180.69 Note: (Low-trait anxious n=21, High-trait anxious n=9); (ms)=milliseconds
Average RT for all Target trials of the N2-back task are displayed in Table 24 above. On
average, high trait individuals (M=629.71, SE=66.702) had faster RT to Target Stimuli on the
N2-back task than low-trait individuals (M=707.02, SE=43.67), but the difference was not
statistically significant (p= .340). Tests of within-subjects effects showed a significant main
effect of Time for RT to Target Stimuli on the N2-back task [H-F ε=0.63, F(1.26, 35.31)=24.62,
p< .001, partial η2=.47]. In general, RT decreased over time. RT at baseline (M=785.29,
SE=53.66) was significantly slower than immediately post-condition (M=633.72, SE=37.31, p<
.001) and 50 minutes post-condition (M=586.09, SE=37.08, p< .001), and RT immediately post-
condition was significantly slower than 50-minutes post-condition (p= .001). Average RT was
faster after rest (M=664.32, SE=39.84) than after exercise (M=672.42, SE=41.90).

72
Table 25. N2-back reaction time to nontarget stimuli.
CONDITION GROUP TIME M (ms) SD Low-trait Baseline 1025.83 343.30 High-trait 902.96 256.62 Low-trait Immediately Post-Exercise 771.06 264.59 High-trait 695.64 207.13 Low-trait 35 minutes Post-Exercise 717.58 235.78
EXERCISE
High-trait 576.87 124.20 Low-trait Baseline 1025.83 343.30 High-trait 902.96 256.62 Low-trait Immediately Post-Rest 769.81 278.91 High-trait 659.43 175.90 Low-trait 35 minutes Post-Rest 684.00 256.55
REST
High-trait 571.23 192.43 Note: (Low-trait anxious n=21, High-trait anxious n=9); (ms)=milliseconds
Average RT for all nontarget trials of the N2-back task are displayed in Table 25 above.
On average, high trait individuals (M=718.18, SE=79.10) had much faster RT to Target Stimuli
on the N2-back task than low-trait individuals (M=832.35, SE=51.79), but the difference was not
statistically significant (p= .237). Tests of within-subjects effects revealed a significant main
effect of Time for RT to Non-target Stimuli on the N2-back task [H-F ε=0.59, F(1.18,
32.95)=43.00, p< .001, partial η2=.61]. RT at baseline (M=964.39, SE=63.93) was significantly
slower than immediately post-condition (M=723.99, SE=46.69, p< .001) and 50 minutes post-
condition (M=637.42, SE=42.09, p< .001). RT immediately post-condition was significantly
slower than 50-minutes post-condition (p< .001). Average RT was faster after rest (M=768.88,
SE=48.90) than after exercise (M=781.66, SE=47.94).

73
N-BACK STANDARD DEVIATION OF REACTION TIME (StdRT) Table 26. N0-back standard deviation of RT to target stimuli.
CONDITION GROUP TIME M (ms) SD Low-trait Baseline 63.37 17.34 High-trait 76.32 52.09 Low-trait Immediately Post-Exercise 74.62 39.59 High-trait 62.41 17.96 Low-trait 50 minutes Post-Exercise 73.47 41.77
EXERCISE
High-trait 88.58 62.97 Low-trait Baseline 63.37 17.34 High-trait 76.32 52.09 Low-trait Immediately Post-Rest 88.54 52.89 High-trait 92.14 47.85 Low-trait 50 minutes Post-Rest 96.61 60.18
REST
High-trait 75.99 43.04 Note: (Low-trait anxious n=20, High-trait anxious n=9); (ms)=milliseconds
Average StdRT for all Target trials of the N0-back task are displayed in Table 26 above.
On average, high trait individuals (M=78.63, SE=8.64) had greater StdRT to Target Stimuli on
the N0-back task than low-trait individuals (M=76.66, SE=5.80), but the difference was not
statistically significant (p= .852). No significant main effects or interactions were revealed for
StdRT to Target Stimuli on the N0-back task. A condition main effect approached significance
[H-F ε=1.00, F(1, 27)=3.61, p= .068, partial η2=.12]. Average StdRT to Target Stimuli on the
N0-back task increased over time. StdRT at baseline (M=69.85, SE=6.40) was smaller than
StdRT immediately post-condition (M=79.43, SE=7.20), which was smaller than StdRT 50
minutes post-condition (M=83.66, SE=8.46). Average StdRT to Target Stimuli on the N0-back
task was smaller after exercise (M=73.13, SE=5.22) than after rest (M=82.16, SE=6.18), but this
difference was not statistically significant (p=.068). High-trait and low-trait anxious individuals
had different StdRT responses to the different conditions; see Figure 12 below.

74
Figure 12: N0-back Standard Deviation of RT to Target Stimuli

75
Table 27. N0-back standard deviation of RT to nontarget stimuli. CONDITION GROUP TIME M (ms) SD
Low-trait Baseline 71.17 24.89 High-trait 75.48 31.23 Low-trait Immediately Post-Exercise 77.74 31.20 High-trait 84.46 35.86 Low-trait 35 minutes Post-Exercise 117.75 88.84
EXERCISE
High-trait 102.86 61.39 Low-trait Baseline 71.17 24.89 High-trait 75.48 31.23 Low-trait Immediately Post-Rest 99.82 50.19 High-trait 79.41 20.51 Low-trait 35 minutes Post-Rest 101.23 62.40
REST
High-trait 122.33 99.60 Note: (Low-trait anxious n=20, High-trait anxious n=9); (ms)=milliseconds
Average StdRT for all nontarget trials of the N0-back task are displayed in Table 27
above. On average, high trait individuals (M=90.00, SE=12.43) had about the same StdRT to
Nontarget Stimuli on the N0-back task as low-trait individuals (M=89.811, SE=8.34, p= .990).
Tests of within-subjects effects showed a significant main effect of Time for StdRT to Nontarget
Stimuli on the N0-back task [H-F ε=0.69, F(1.38, 37.14)=6.59, p= .008, partial η2=.20]. In
general, StdRT increased over time. StdRT at baseline (M=73.32, SE=5.40) was significantly
smaller than immediately post-condition (M=85.36, SE=6.84, p=.034) and 50 minutes post-
condition (M=11.04, SE=14.30, p= .005), and StdRT immediately post-condition was
significantly smaller than 50-minutes post-condition (p= .047).

76
Table 28. N1-back standard deviation of RT to target stimuli. CONDITION GROUP TIME M (ms) SD
Low-trait Baseline 124.47 44.41 High-trait 109.89 47.28 Low-trait Immediately Post-Exercise 132.17 98.72 High-trait 138.29 116.15 Low-trait 50 minutes Post-Exercise 114.49 104.37
EXERCISE
High-trait 132.08 70.14 Low-trait Baseline 124.47 44.41 High-trait 109.89 47.28 Low-trait Immediately Post-Rest 127.56 61.87 High-trait 144.08 77.87 Low-trait 50 minutes Post-Rest 114.02 61.65
REST
High-trait 107.80 52.30 Note: (Low-trait anxious n=21, High-trait anxious n=9); (ms)=milliseconds
Average StdRT for all Target trials of the N1-back task are displayed in Table 28 above.
On average, high trait individuals (M=123.67, SE=16.50) had similar StdRT to Target Stimuli on
the N1-back task to low-trait individuals (M=122.86, SE=10.80, p= .968). No significant main
effects or interactions were revealed for StdRT to Target Stimuli on the N1-back task. A
Condition x Group interaction approached significance [H-F ε=1.00, F(1, 28)=0.07, p= .079,
partial η2=.003]. Average StdRT to Target Stimuli on the N1-back task increased then decreased
over time. StdRT at baseline (M=117.18, SE=9.01) increased to StdRT immediately post-
condition (M=135.52, SE=14.23), and then returned to baseline StdRT 50 minutes post-condition
(M=117.10, SE=14.48). Average StdRT to Target Stimuli on the N1-back task was greater after
exercise (M=125.23, SE=12.65) than after rest (M=121.30, SE=8.28), but this difference was not
statistically significant (p= .638).

77
Table 29. N1-back standard deviation of RT to nontarget stimuli. CONDITION GROUP TIME M (ms) SD
Low-trait Baseline 157.40 72.51 High-trait 150.22 62.59 Low-trait Immediately Post-Exercise 192.16 108.19 High-trait 160.20 70.25 Low-trait 35 minutes Post-Exercise 172.38 131.49
EXERCISE
High-trait 103.64 32.09 Low-trait Baseline 157.40 72.51 High-trait 150.22 62.59 Low-trait Immediately Post-Rest 172.93 86.31 High-trait 181.12 104.92 Low-trait 35 minutes Post-Rest 153.58 65.04
REST
High-trait 138.42 59.77 Note: (Low-trait anxious n=21, High-trait anxious n=9); (ms)=milliseconds
Average StdRT for all nontarget trials of the N1-back task are displayed in Table 29
above. On average, high trait individuals (M=78.63, SE=8.64) had slighter larger StdRT to
Nontarget Stimuli on the N1-back task than low-trait individuals (M=76.66, SE=5.80 p= .852).
No significant main effects or interactions were revealed for StdRT to Nontarget Stimuli on the
N1-back task. Tests of within-subjects effects revealed a main effect of Condition for StdRT to
Nontarget Stimuli on the N1-back task that approached significance [H-F ε=1.00, F(1, 27)=3.61
p= .068, partial η2=.12]. Average StdRT to Nontarget Stimuli on the N1-back task increased over
time. StdRT at baseline (M=69.85, SE=6.40) was smaller than StdRT immediately post-condition
(M=79.43, SE=7.20, p= .267), which was smaller than StdRT 50 minutes post-condition
(M=83.66, SE=8.46, p= .628). Average StdRT to Nontarget Stimuli on the N1-back task was
smaller after exercise (M=73.13, SE=5.22) than after rest (M=82.16, SE=6.18), but this
difference only approached significance (p= .068).

78
Figure 13: N1-back Standard Deviation of Reaction Time to Nontarget Stimuli

79
Table 30. N2-back standard deviation of RT to target stimuli. CONDITION GROUP TIME M (ms) SD
Low-trait Baseline 337.00 189.69 High-trait 236.50 125.49 Low-trait Immediately Post-Exercise 268.29 152.09 High-trait 179.27 90.81 Low-trait 35 minutes Post-Exercise 222.54 126.11
EXERCISE
High-trait 163.84 35.13 Low-trait Baseline 3367.00 189.69 High-trait 236.50 125.49 Low-trait Immediately Post-Rest 229.54 129.11 High-trait 166.34 77.53 Low-trait 35 minutes Post-Rest 264.39 159.64
REST
High-trait 171.10 86.02 Note: (Low-trait anxious n=21, High-trait anxious n=9); (ms)=milliseconds
Average StdRT for all Target trials of the N2-back task are displayed in Table 30 above.
On average, high trait individuals (M=276.46, SE=25.66) had larger StdRT to Target Stimuli on
the N2-back task than low-trait individuals (M=192.26, SE=39.20), but this difference only
approached significance (p= .083). Tests of within-subjects effects showed a significant main
effect of Time for StdRT to Target Stimuli on the N2-back task [H-F ε=0.74, F(1.48,
41.36)=8.30, p= .002, partial η2=.23]. Post-hoc analysis revealed that StdRT at baseline
(M=286.75, SE=34.62) was significantly larger than immediately post-condition (M=210.86,
SE=21.17, p= .005) and 50 minutes post-condition (M=205.47, SE=22.29, p= .005). Average
StdRT to Target Stimuli on the N2-back task was the same after exercise (M=234.57, SE=24.34)
as after rest (M=234.15, SE=24.19, p= .973).

80
Table 31. N2-back standard deviation of RT to nontarget stimuli. CONDITION GROUP TIME M (ms) SD
Low-trait Baseline 369.96 157.33 High-trait 318.13 82.15 Low-trait Immediately Post-Exercise 286.03 137.60 High-trait 224.59 88.67 Low-trait 35 minutes Post-Exercise 271.08 125.60
EXERCISE
High-trait 221.11 70.52 Low-trait Baseline 369.96 157.33 High-trait 318.13 82.15 Low-trait Immediately Post-Rest 284.23 138.06 High-trait 213.79 82.81 Low-trait 35 minutes Post-Rest 260.68 106.53
REST
High-trait 189.58 98.98 Note: (Low-trait anxious n=21, High-trait anxious n=9); (ms)=milliseconds
Average StdRT for all nontarget trials of the N2-back task are displayed in Table 31
above. On average, high-trait individuals (M=306.99, SE=23.16) had larger StdRT to Nontarget
Stimuli on the N2-back task than low-trait individuals (M=247.56, SE=35.37, p= .171). Tests of
within-subjects effects revealed a significant main effect of Time for StdRT to Nontarget Stimuli
on the N2-back task [H-F ε=0.83, F(1.66, 46.37)=22.62 p< .001, partial η2=.45]. Average StdRT
to Nontarget Stimuli on the N2-back task decreased over time. StdRT at baseline (M=344.05,
SE=27.90) was significantly larger than immediately post-condition (M=252.16, SE=22.18, p<
.001) and 50 minutes post-condition (M=235.61, SE=19.29, p< .001). Average StdRT to
Nontarget Stimuli on the N1-back task was slightly larger after exercise (M=281.82, SE=22.30)
than after rest (M=272.73, SE=21.45, p= .429).

81
SCHOLASTIC APTITUDE TEST (SAT) Table 32. Post-condition math SAT scores.
CONDITION GROUP M SD Low-trait 6.98 2.32
Exercise High-trait 6.53 2.23 Low-trait 6.47 2.13
Rest High-trait 5.42 1.98
Note: (Low-trait anxious n=21, High-trait anxious n=9)
Average math SAT scores for each condition are displayed in Table 32 above. On
average, high-trait individuals (M=5.97, SE=0.67) had lower math scores than low-trait
individuals (M=6.76, SE=0.44), but this difference was not statistically significant (p= .337).
Tests of within-subjects effects revealed a significant main effect of Condition [H-F ε=1.00, F(1,
28)=4.73, p= .038, partial η2=.14]. Average math scores following rest (M=5.98, SE=0.42) were
lower than after exercise (M=6.75, SE=0.46, p= .038). An independent samples t-test showed
that the change in Math SAT score from rest to exercise for high-trait individuals (mean
difference=1.11) was greater than the change seen for low-trait individuals (mean
difference=0.44), but this was not statistically significant [t(9.57)=-0.72, p= .491].
Table 33.Post-condition reading SAT scores. CONDITION GROUP M SD
Low-trait 7.30 3.08 Exercise High-trait 9.22 1.95
Low-trait 7.42 2.51 Rest High-trait 8.67 2.58
Note: (Low-trait anxious n=21, High-trait anxious n=9)
Average reading SAT scores for each condition are displayed in Table 33 above. On
average, high-trait individuals (M=8.94, SE=0.77) had higher reading scores than low-trait
individuals (M=7.36, SE=0.50), but this difference only approached significance (p= .094). Tests
of within-subjects effects revealed a no significant main effects or interactions. An independent
samples t-test showed that the change in Reading SAT score from rest to exercise for high-trait

82
individuals (mean difference=0.56) was greater than the change seen for low-trait individuals
(mean difference=-0.12), but this was not statistically significant [t(13.34)=-0.59, p= .567].
Figure 14: Math and Reading SAT Scores Across Conditions CORRELATIONS
Correlational analysis was run on changes in SA in relation to changes in accuracy, RT,
and StdRT, on all cognitive tasks. Correlational analysis was also run on post-exercise changes
in SA post-exercise in relation to differences in reading and math SAT scores from the rest to the
exercise condition. Correlational analysis was run on changes in all post-exercise cognitive
behavioral measures of accuracy, RT, and StdRT in relation to changes in reading and math SAT
scores from the rest to the exercise condition.
Please keep the following in mind while viewing the tables in this section:
For Changes in SA: Time 1=Baseline to Immediately Post, Time 2=Immediately Post to 35
minutes Post, Time 3=35 minutes Post to 70 minutes Post
For Changes in Cognitive Variables: Time 1=Baseline to Immediately Post, Time
2=Immediately Post to 50 minutes Post

83
RELATIONSHIPS BETWEEN CHANGES IN STATE ANXIETY (SA) & ACCURACY Table 34. Changes in state anxiety and accuracy on Flanker task after rest.
CONGRUENT ACCURACY INCONGRUENT ACCURACY
CHANGE SCORES Time 1 Time 2 Time 1 Time 2 STATE ANXIETY Time 1
Pearson Correlation -.135 -.060 -.260 -.171
p-value (.469) (.748) (.158) (.357) STATE ANXIETY Time 2
Pearson Correlation -.237 -.253 -.118 -.215
p-value (.200) (.169) (.526) (.246) STATE ANXIETY Time 3
Pearson Correlation -.058 -.181 -.065 -.137
p-value (.757) (.330) (.730) (.461) Note: N=31; p-values are 2-tailed tests
No significant correlations were found between changes in SA and changes in Accuracy
on the Flanker Task after rest, for congruent or incongruent stimuli.
Table 35. Changes in state anxiety and accuracy on Flanker task after exercise. CONGRUENT ACCURACY INCONGRUENT ACCURACY
CHANGE SCORES Time 1 Time 2 Time 1 Time 2 STATE ANXIETY Time 1
Pearson Correlation .167 .264 .253 .192
p-value (.378) (.167) (.177) (.317) STATE ANXIETY Time 2
Pearson Correlation .169 -.016 .070 -.105
p-value (.371) (.935) (.712) (.586) STATE ANXIETY Time 3
Pearson Correlation .106 .098 .173 .037
p-value (.579) (.612) (.362) (.848) Note: N=30 (Accuracy Time 1), N=29 (Accuracy Time 2); p-values are 2-tailed tests
No significant correlations were found between changes in SA and changes in Accuracy
on the Flanker Task after exercise, for congruent or incongruent stimuli.

84
Table 36. Changes in state anxiety and accuracy on N0-back task after rest. NONTARGET ACCURACY TARGET ACCURACY
CHANGE SCORES Time 1 Time 2 Time 1 Time 2 STATE ANXIETY Time 1
Pearson Correlation .028 .005 -.088 -.230
p-value (.883) (.978) (.639) (.221) STATE ANXIETY Time 2
Pearson Correlation .367 .265 -.032 -.058
p-value (.042) (.156) (.865) (.762) STATE ANXIETY Time 3
Pearson Correlation .318 .257 -.033 -.124
p-value (.081) (.171) (.861) (.513) Note: N=31 (Accuracy Time 1), N=30 (Accuracy Time 2); p-values are 2-tailed tests
After rest, a significant low positive correlation was found between change in SA at Time
2 and change in N0-back nontarget accuracy at Time 1 (r= .37, p= .042). Thus, greater increases
in SA from immediately post-rest to 35 minutes post-exercise were associated with greater
increases in N0-back accuracy on nontarget stimuli from immediately post-rest to 50 minutes
post-exercise. In other words, accuracy on nontarget trials of the N0-back task, during the first
round of cognitive testing, was greater when SA increased from immediately post-rest to 35
minutes post-rest.

85
Table 37. Changes in state anxiety and accuracy on N0-back task after exercise. NONTARGET ACCURACY TARGET ACCURACY
CHANGE SCORES Time 1 Time 2 Time 1 Time 2 STATE ANXIETY Time 1
Pearson Correlation .358 .123 -.378 -.184
p-value (.052) (.518) (.039) (.329) STATE ANXIETY Time 2
Pearson Correlation .273 -.091 -.199 .076
p-value (.144) (.631) (.293) (.688) STATE ANXIETY Time 3
Pearson Correlation .286 -.065 -.351 -.025
p-value (.126) (.733) (.057) (.895) Note: N=30; p-values are 2-tailed tests
After exercise, a significant low negative correlation was found between change in SA at
Time 1 and change in N0-back Target Accuracy at Time 1 (r= -.38, p= .039). Thus, greater
decreases in SA from baseline to immediately post-exercise were associated with greater
increases in N0-back accuracy on target stimuli from immediately post-exercise to 50 minutes
post-exercise. In other words, accuracy on target trials of the N0-back task, during the first round
of cognitive testing, was greater when SA decreased from baseline to immediately post-exercise.

86
Table 38. Changes in state anxiety and accuracy on N1-back task after rest.
NONTARGET ACCURACY TARGET ACCURACY
CHANGE SCORES Time 1 Time 2 Time 1 Time 2 STATE ANXIETY Time 1
Pearson Correlation -.247 .206 -.191 .001
p-value (.180) (.267) (.305) (.996) STATE ANXIETY Time 2
Pearson Correlation -.077 .161 -.099 .234
p-value (.682) (.387) (.595) (.206) STATE ANXIETY Time 3
Pearson Correlation .108 .521 .113 .403
p-value (.565) (.003) (.547) (.024) Note: N=31; p-values are 2-tailed tests
After rest, significant moderate positive correlations were found between change in SA at
Time 3 and changes in N1-back Nontarget Accuracy (r= .52, p= .003) and N1-back Target
Accuracy (r= .40 p= .024) at Time 2. Thus, greater increases in SA from 35 minutes post-rest to
70 minutes post-rest were associated with greater increases in N1-back accuracy on nontarget
and target stimuli from immediately post-rest to 50 minutes post-rest. In other words, accuracy
on target and nontarget trials of the N1-back task, during the second round of cognitive testing,
was greater when SA increased from 35 minutes post-exercise to 70 minutes post-rest.
Table 39. Changes in state anxiety and accuracy on N1-back task after exercise. NONTARGET ACCURACY TARGET ACCURACY
CHANGE SCORES Time 1 Time 2 Time 1 Time 2 STATE ANXIETY Time 1
Pearson Correlation .064 -.190 .017 -.124
p-value (.737) (.314) (.929) (.514) STATE ANXIETY Time 2
Pearson Correlation -.036 -.150 -.161 -.288
p-value (.849) (.430) (.396) (.122) STATE ANXIETY Time 3
Pearson Correlation .116 -.142 -.124 -.224
p-value (.542) (.455) (.514) (.234) Note: N=30; p-values are 2-tailed tests
No significant correlations were found between changes in SA and changes in Accuracy
on the N1-back Task after exercise, for Target or Nontarget stimuli.

87
Table 40. Changes in state anxiety and accuracy on N2-back task after rest.
NONTARGET ACCURACY TARGET ACCURACY
CHANGE SCORES Time 1 Time 2 Time 1 Time 2 STATE ANXIETY Time 1
Pearson Correlation -.018 -.039 -.121 -.369
p-value (.925) (.834) (.516) (.041) STATE ANXIETY Time 2
Pearson Correlation .260 .259 -.066 -.020
p-value (.157) (.159) (.724) (.915) STATE ANXIETY Time 3
Pearson Correlation .057 .093 -.063 -.069
p-value (.762) (.619) (.737) (.713) Note: N=31; p-values are 2-tailed tests
After rest, a significant low negative correlation was found between change in SA at
Time 1 and change in N2-back Target Accuracy at Time 2 (r= -.37, p= .041). Thus, greater
decreases in SA from baseline to immediately post-rest were associated with greater increases in
N2-back accuracy on target stimuli from baseline to immediately post-rest. In other words,
accuracy on the N2-back task, during the second round of cognitive testing, was better when SA
decreased from baseline to immediately post-rest.
Table 41. Changes in state anxiety and accuracy on N2-back task after exercise. NONTARGET ACCURACY TARGET ACCURACY
CHANGE SCORES Time 1 Time 2 Time 1 Time 2 STATE ANXIETY Time 1
Pearson Correlation -.254 -.247 -.219 -.170
p-value (.175) (.188) (.244) (.368) STATE ANXIETY Time 2
Pearson Correlation -.108 -.075 -.039 -.242
p-value (.571) (.693) (.839) (.198) STATE ANXIETY Time 3
Pearson Correlation -.113 -.124 -.177 -.267
p-value (.553) (.514) (.349) (.154) Note: N=30; p-values are 2-tailed tests
No significant correlations were found between changes in SA and changes in Accuracy
on the N2-back Task after exercise, for Target or Nontarget stimuli.

88
RELATIONSHIPS BETWEEN CHANGES IN SA & REACTION TIME (RT) Table 42. Changes in state anxiety and RT on Flanker task after rest.
CONGRUENT RT INCONGRUENT RT CHANGE SCORES Time 1 Time 2 Time 1 Time 2 STATE ANXIETY Time 1
Pearson Correlation .186 .114 .131 .166
p-value (.316) (.541) (.481) (.371) STATE ANXIETY Time 2
Pearson Correlation .125 .020 .129 .069
p-value (.503) (.914) (.490) (.714) STATE ANXIETY Time 3
Pearson Correlation .045 -.046 .006 -.016
p-value (.808) (.807) (.975) (.932) Note: N=31; p-values are 2-tailed tests
No significant correlations were found between changes in SA and changes in RT on the
Flanker Task after rest, for Congruent or Incongruent stimuli.
Table 43. Changes in state anxiety and RT on Flanker task after exercise. CONGRUENT RT INCONGRUENT RT
CHANGE SCORES Time 1 Time 2 Time 1 Time 2 STATE ANXIETY Time 1
Pearson Correlation .296 .338 .323 .398
p-value (.113) (.073) (.081) (.032) STATE ANXIETY Time 2
Pearson Correlation .269 .249 .330 .308
p-value (.150) (.193) (.075) (.104) STATE ANXIETY Time 3
Pearson Correlation .127 .188 .202 .252
p-value (.505) (.328) (.284) (.187) Note: N=30 (Accuracy Time 1), N=29 (Accuracy Time 2); p-values are 2-tailed tests
After exercise, a significant moderate positive correlation was found between change in
SA at Time 1 and change in Flanker RT to Incongruent trials at Time 1 (r= .40, p= .032). Thus,
greater increases in SA from baseline to immediately post-exercise were associated with greater
increases in Flanker RT to incongruent stimuli from baseline to immediately post-exercise. In
other words, RT on the incongruent trials of the Flanker task, during the second round of
cognitive testing, was faster when SA decreased from baseline to immediately post-exercise.

89
Table 44. Changes in state anxiety and RT on N0-back task after rest.
NONTARGET RT TARGET RT
CHANGE SCORES Time 1 Time 2 Time 1 Time 2 STATE ANXIETY Time 1
Pearson Correlation -.082 -.096 -.101 .035
p-value (.661) (.613) (.587) (.853) STATE ANXIETY Time 2
Pearson Correlation -.064 -.131 -.211 .059
p-value (.732) (.489) (.255) (.755) STATE ANXIETY Time 3
Pearson Correlation -.079 -.278 -.202 -.094
p-value (.672) (.137) (.276) (.620) Note: N=31 (Accuracy Time 1), N=30 (Accuracy Time 2); p-values are 2-tailed tests
No significant correlations were found between changes in SA and changes in RT on the
N0-back Task after rest, for Target or Nontarget stimuli.
Table 45. Changes in state anxiety and RT on N0-back task after exercise.
NONTARGET RT TARGET RT CHANGE SCORES Time 1 Time 2 Time 1 Time 2 STATE ANXIETY Time 1
Pearson Correlation -.116 .162 -.189 -.310
p-value (.540) (.393) (.318) (.096) STATE ANXIETY Time 2
Pearson Correlation .198 .384 .089 -.273
p-value (.294) (.036) (.642) (.144) STATE ANXIETY Time 3
Pearson Correlation .051 .261 .033 -.289
p-value (.788) (.164) (.863) (.122) Note: N=30; p-values are 2-tailed tests
After exercise, a significant low positive correlation was found between change in SA at
Time 2 and change in N0-back RT to Nontarget stimuli at Time 2 (r= .38, p= .036). Thus, greater
increases in SA from immediately post-exercise to 35 minutes post-exercise were associated with
greater increases in N0-back RT to Nontarget stimuli from immediately post-exercise to 50
minutes post-exercise. In other words, RT on the N0-Back task during the second round of
cognitive testing was faster when SA decreased following exercise.

90
Table 46. Changes in state anxiety and RT on N1-back task after rest. NONTARGET RT TARGET RT
CHANGE SCORES Time 1 Time 2 Time 1 Time 2 STATE ANXIETY Time 1
Pearson Correlation -.067 .025 .120 .178
p-value (.722) (.896) (.520) (.337) STATE ANXIETY Time 2
Pearson Correlation .113 .094 .197 .223
p-value (.543) (.613) (.288) (.229) STATE ANXIETY Time 3
Pearson Correlation .058 .030 .046 .058
p-value (.756) (.875) (.807) (.758) Note: N=31; p-values are 2-tailed tests
No significant correlations were found between changes in SA and changes in RT on the
N1-back Task after rest, for Target or Nontarget stimuli.
Table 47. Changes in state anxiety and RT on N1-back task after exercise.
NONTARGET RT TARGET RT CHANGE SCORES Time 1 Time 2 Time 1 Time 2 STATE ANXIETY Time 1
Pearson Correlation .534 .504 .170 .205
p-value (.002) (.005) (.369) (.278) STATE ANXIETY Time 2
Pearson Correlation .629 .346 .230 -.003
p-value (.000) (.061) (.221) (.989) STATE ANXIETY Time 3
Pearson Correlation .545 .379 .063 .000
p-value (.002) (.039) (.741) (1.00) Note: N=30; p-values are 2-tailed tests
After exercise, significant moderate positive correlations were found between changes in
SA at Times 1 and 3 and change in N1-back Nontarget RT at Time 1 (r= .53, p= .002; r= .55, p=
.002). A significant moderately high positive correlation was found between changes in SA at
Time 2 and change in N1-back Nontarget RT at Time 1 (r= .63, p< .001). A significant moderate
positive correlation was also found between change in SA at Time 1 and change in N1-back
Nontarget RT at Time 2 (r= .50, p= .005). A significant low positive correlation was found
between change in SA at Time 3 and change in N1-back Nontarget RT at Time 2 (r= .38, p=
.039). Thus, greater increases in SA at each time point were associated with greater increases in
N1-back RT to Nontarget stimuli post-exercise between most time points. In other words, RT on

91
the N1-Back task, during both rounds of cognitive testing, was faster when SA decreased
following exercise.
Table 48. Changes in state anxiety and RT on N2-back task after rest. NONTARGET RT TARGET RT
CHANGE SCORES Time 1 Time 2 Time 1 Time 2 STATE ANXIETY Time 1
Pearson Correlation -.199 -.229 -.148 -.181
p-value (.282) (.216) (.428) (.330) STATE ANXIETY Time 2
Pearson Correlation -.243 -.291 -.164 -.145
p-value (.187) (.112) (.379) (.438) STATE ANXIETY Time 3
Pearson Correlation -.190 -.174 -.162 -.109
p-value (.305) (.349) (.383) (.560) Note: N=31; p-values are 2-tailed tests
No significant correlations were found between changes in SA and changes in RT on the
N2-back Task after rest, for Target or Nontarget stimuli.
Table 49. Changes in state anxiety and RT on N2-back task after exercise.
NONTARGET RT TARGET RT CHANGE SCORES Time 1 Time 2 Time 1 Time 2 STATE ANXIETY Time 1
Pearson Correlation .021 .215 .199 .098
p-value (.912) (.254) (.291) (.605) STATE ANXIETY Time 2
Pearson Correlation .242 .315 .297 .354
p-value (.197) (.090) (.111) (.055) STATE ANXIETY Time 3
Pearson Correlation .230 .371 .300 .341
p-value (.222) (.043) (.107) (.065) Note: N=30; p-values are 2-tailed tests
After exercise, a significant low positive correlation was found between change in SA at
Time 3 and change in N2-back RT to Nontarget stimuli at Time 2 (r= .37, p= .043). Thus, greater
increases in SA from 35 minutes post-exercise to 70 minutes post-exercise were associated with
greater increases in N2-back RT to Nontarget stimuli from immediately post-exercise to 50
minutes post-exercise. In other words, RT was faster when SA decreased following exercise,
during the second round of cognitive testing.

92
RELATIONSHIPS BETWEEN CHANGES IN SA & STANDARD DEVIATION OF RT Table 50. Changes in state anxiety and StdRT on Flanker task after rest.
CONGRUENT StdRT INCONGRUENT StdRT CHANGE SCORES Time 1 Time 2 Time 1 Time 2 STATE ANXIETY Time 1
Pearson Correlation .049 .021 .181 .256
p-value (.795) (.909) (.329) (.165) STATE ANXIETY Time 2
Pearson Correlation -.065 -.011 .031 .160
p-value (.730) (.952) (.867) (.389) STATE ANXIETY Time 3
Pearson Correlation -.089 -.061 .113 .215
p-value (.636) (.744) (.546) (.246) Note: N=31; p-values are 2-tailed tests
No significant correlations were found between changes in SA and changes in StdRT on
the Flanker Task after rest, for Congruent or Incongruent stimuli.
Table 51. Changes in state anxiety and StdRT on Flanker task after exercise. CONGRUENT StdRT INCONGRUENT StdRT
CHANGE SCORES Time 1 Time 2 Time 1 Time 2 STATE ANXIETY Time 1
Pearson Correlation .164 .275 -.092 .155
p-value (.386) (.149) (.628) (.423) STATE ANXIETY Time 2
Pearson Correlation .351 .309 .023 .037
p-value (.057) (.103) (.902) (.848) STATE ANXIETY Time 3
Pearson Correlation .167 .229 -.063 .055
p-value (.379) (.233) (.739) (.778) Note: N=30 (Accuracy Time 1), N=29 (Accuracy Time 2); p-values are 2-tailed tests
No significant correlations were found between changes in SA and changes in StdRT on
the Flanker Task after exercise, for Congruent or Incongruent stimuli.

93
Table 52. Changes in state anxiety and StdRT on N0-back task after rest. NONTARGET StdRT TARGET StdRT
CHANGE SCORES Time 1 Time 2 Time 1 Time 2 STATE ANXIETY Time 1
Pearson Correlation -.162 -.102 -.080 .137
p-value (.384) (.593) (.669) (.471) STATE ANXIETY Time 2
Pearson Correlation -.151 -.163 -.070 .205
p-value (.418) (.390) (.707) (.276) STATE ANXIETY Time 3
Pearson Correlation -.080 -.331 -.287 -.053
p-value (.668) (.074) (.117) (.781) Note: N=31 (Accuracy Time 1), N=30 (Accuracy Time 2); p-values are 2-tailed tests No significant correlations were found between changes in SA and changes in StdRT on
the N0-back Task after rest, for Target or Nontarget stimuli.
Table 53. Changes in state anxiety and StdRT on N0-back task after exercise. NONTARGET StdRT TARGET StdRT
CHANGE SCORES Time 1 Time 2 Time 1 Time 2 STATE ANXIETY Time 1
Pearson Correlation -.281 .271 .044 -.158
p-value (.133) (.148) (.817) (.404) STATE ANXIETY Time 2
Pearson Correlation .173 .293 .230 -.057
p-value (.362) (.116) (.222) (.764) STATE ANXIETY Time 3
Pearson Correlation .031 .150 .075 -.051
p-value (.870) (.427) (.692) (.788) Note: N=30; p-values are 2-tailed tests No significant correlations were found between changes in SA and changes in StdRT on
the N0-back Task after exercise, for Target or Nontarget stimuli.
Table 54. Changes in state anxiety and StdRT on N1-back task after rest. NONTARGET StdRT TARGET StdRT
CHANGE SCORES Time 1 Time 2 Time 1 Time 2 STATE ANXIETY Time 1
Pearson Correlation -.311 -.197 -.014 .163
p-value (.088) (.287) (.939) (.381) STATE ANXIETY Time 2
Pearson Correlation -.062 -.175 .182 .033
p-value (.741) (.346) (.328) (.860) STATE ANXIETY Time 3
Pearson Correlation -.134 -.168 -.112 -.046
p-value (.474) (.365) (.548) (.808) Note: N=31; p-values are 2-tailed tests No significant correlations were found between changes in SA and changes in StdRT on
the N1-back Task after rest, for Target or Nontarget stimuli.

94
Table 55. Changes in state anxiety and StdRT on N1-back task after exercise. NONTARGET StdRT TARGET StdRT
CHANGE SCORES Time 1 Time 2 Time 1 Time 2 STATE ANXIETY Time 1
Pearson Correlation .377 .321 .190 .108
p-value (.040) (.084) (.315) (.571) STATE ANXIETY Time 2
Pearson Correlation .431 .153 .390 .173
p-value (.017) (.420) (.033) (.361) STATE ANXIETY Time 3
Pearson Correlation .276 .168 .197 .135
p-value (.140) (.375) (.297) (.477) Note: N=30; p-values are 2-tailed tests
After exercise, a significant low positive correlation was found between change in SA at
Time 1 and change in N1-back StdRT to Nontarget stimuli at Time 1 (r= .38, p= .040). After
exercise, significant moderate positive and low positive correlations were also found between the
change in SA at Time 2 and changes in N1-back StdRT to Nontarget stimuli at Time 1 (r= .43,
p= .017) and N1-back StdRT to Target stimuli at Time 2 (r= .39, p= .033), respectively. Thus,
greater increases in SA from baseline to immediately post-exercise or immediately post-exercise
to 35 minutes post-exercise were associated with greater increases in N1-back StdRT to
Nontarget stimuli from baseline to immediately post-exercise. Greater increases in SA from
immediately post-exercise to 35 minutes post-exercise were associated with greater increases in
N1-back StdRT to Target stimuli from baseline to immediately post-exercise. In other words,
response time variability on the N1-Back task during the first round of cognitive testing was
smaller when SA decreased following exercise.

95
Table 56. Changes in state anxiety and StdRT on N2-back task after rest. NONTARGET StdRT TARGET StdRT
CHANGE SCORES Time 1 Time 2 Time 1 Time 2 STATE ANXIETY Time 1
Pearson Correlation -.175 -.253 -.175 -.215
p-value (.348) (.170) (.345) (.245) STATE ANXIETY Time 2
Pearson Correlation -.092 -.340 -.041 -.102
p-value (.624) (.061) (.827) (.586) STATE ANXIETY Time 3
Pearson Correlation .118 -.112 -.081 -.089
p-value (.528) (.548) (.666) (.634) Note: N=31; p-values are 2-tailed tests
No significant correlations were found between changes in SA and changes in StdRT on
the N2-back Task after rest, for Target or Nontarget stimuli.
Table 57. Changes in state anxiety and StdRT on N2-back task after exercise. NONTARGET StdRT TARGET StdRT
CHANGE SCORES Time 1 Time 2 Time 1 Time 2 STATE ANXIETY Time 1
Pearson Correlation .010 .072 .196 .031
p-value (.958) (.704) (.299) (.872) STATE ANXIETY Time 2
Pearson Correlation -.031 .236 .215 .315
p-value (.870) (.210) (.254) (.090) STATE ANXIETY Time 3
Pearson Correlation -.011 .189 .173 .255
p-value (.955) (.318) (.361) (.173) Note: N=30; p-values are 2-tailed tests
No significant correlations were found between changes in SA and changes in StdRT on
the N2-back Task after exercise, for Target or Nontarget stimuli.

96
RELATIONSHIPS BETWEEN CHANGES IN SA & SCHOLASTIC APTITUDE TEST Table 58. Changes in state anxiety post-exercise and SAT scores from rest to exercise.
CHANGE SCORES READING MATH STATE ANXIETY Time 1
Pearson Correlation .019 .348
p-value (.919) (.059) STATE ANXIETY Time 2
Pearson Correlation .100 .386
p-value (.599) (.035) STATE ANXIETY Time 3
Pearson Correlation .212 .425
p-value (.260) (.019) Note: N=30; p-values are 2-tailed tests
After exercise, significant low positive correlation was found between change in SA at
Time 2 and change in Math SAT score from the resting day to the exercise day (r= .39, p= .035).
A significant moderate positive correlation was found between change in SA at Time 3 and
change in Math SAT score from the resting day to the exercise day (r= .43, p= .019). Thus,
greater increases in SA from immediately post-exercise to 35 minutes post-exercise and 35
minutes post-exercise to 70 minutes post-exercise were associated with greater increases in SAT
Math scores from rest to exercise days. In other words, Math SAT scores were greater when SA
increased from immediately post-exercise to 35 minutes post-exercise and 35 minutes post-
exercise to 70 minutes post-exercise.
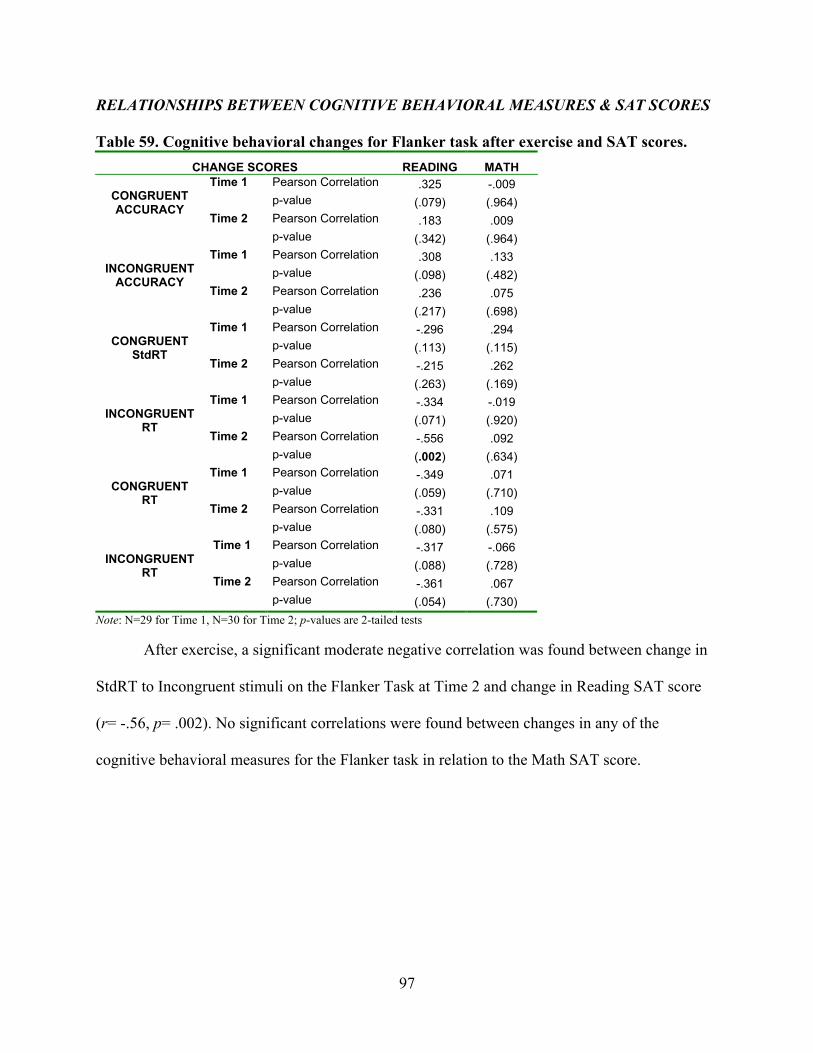
97
RELATIONSHIPS BETWEEN COGNITIVE BEHAVIORAL MEASURES & SAT SCORES Table 59. Cognitive behavioral changes for Flanker task after exercise and SAT scores.
CHANGE SCORES READING MATH Time 1 Pearson Correlation .325 -.009 p-value (.079) (.964) Time 2 Pearson Correlation .183 .009
CONGRUENT ACCURACY
p-value (.342) (.964) Time 1 Pearson Correlation .308 .133 p-value (.098) (.482) Time 2 Pearson Correlation .236 .075
INCONGRUENT
ACCURACY
p-value (.217) (.698) Time 1 Pearson Correlation -.296 .294 p-value (.113) (.115) Time 2 Pearson Correlation -.215 .262
CONGRUENT
StdRT
p-value (.263) (.169) Time 1 Pearson Correlation -.334 -.019 p-value (.071) (.920) Time 2 Pearson Correlation -.556 .092
INCONGRUENT
RT
p-value (.002) (.634) Time 1 Pearson Correlation -.349 .071 p-value (.059) (.710) Time 2 Pearson Correlation -.331 .109
CONGRUENT
RT
p-value (.080) (.575) Time 1 Pearson Correlation -.317 -.066 p-value (.088) (.728) Time 2 Pearson Correlation -.361 .067
INCONGRUENT
RT
p-value (.054) (.730) Note: N=29 for Time 1, N=30 for Time 2; p-values are 2-tailed tests
After exercise, a significant moderate negative correlation was found between change in
StdRT to Incongruent stimuli on the Flanker Task at Time 2 and change in Reading SAT score
(r= -.56, p= .002). No significant correlations were found between changes in any of the
cognitive behavioral measures for the Flanker task in relation to the Math SAT score.

98
Table 60. Cognitive behavioral changes for N0-back task after exercise and SAT scores. CHANGE SCORES READING MATH
Time 1 Pearson Correlation -.014 .029 p-value (.943) (.879) Time 2 Pearson Correlation .345 -.002
NONTARGET ACCURACY
p-value (.062) (.990) Time 1 Pearson Correlation -.020 -.035 p-value (.915) (.853) Time 2 Pearson Correlation .096 .150
TARGET
ACCURACY
p-value (.615) (.429) Time 1 Pearson Correlation .091 -.054 p-value (.632) (.775) Time 2 Pearson Correlation .238 .303
NONTARGET
StdRT
p-value (.205) (.103) Time 1 Pearson Correlation -.001 .067 p-value (.995) (.726) Time 2 Pearson Correlation .404 -.103
TARGET
StdRT
p-value (.027) (.589) Time 1 Pearson Correlation .237 -.106 p-value (.207) (.578) Time 2 Pearson Correlation .394 .216
NONTARGET
RT
p-value (.031) (.252) Time 1 Pearson Correlation .263 .097 p-value (.161) (.609) Time 2 Pearson Correlation .363 -.084
TARGET
RT
p-value (.049) (.658) Note: N=30; p-values are 2-tailed tests
After exercise, a significant moderate positive correlation was found between change in
N0-back StdRT to Target stimuli at Time 2 and change in Reading SAT score (r= .40, p= .027).
Significant low positive correlations were found between change in N0-back RT to Target
stimuli at Time 2 and change in Reading SAT score (r= .39, p= .031) and change in N0-back RT
to Nontarget RT at Time 2 and change in Reading SAT score (r= .36, p= .049). No significant
correlations were found between changes in accuracy for the N0-back task in relation to the
Math SAT score.

99
Table 61. Cognitive behavioral changes for N1-back task after exercise and SAT scores. CHANGE SCORES READING MATH
Time 1 Pearson Correlation -.070 -.156 p-value (.714) (.412) Time 2 Pearson Correlation -.227 .028
NONTARGET ACCURACY
p-value (.227) (.884) Time 1 Pearson Correlation -.073 -.091 p-value (.700) (.633) Time 2 Pearson Correlation -.269 -.020
TARGET
ACCURACY
p-value (.150) (.915) Time 1 Pearson Correlation .210 .140 p-value (.266) (.460) Time 2 Pearson Correlation .150 -.046
NONTARGET
StdRT
p-value (.428) (.808) Time 1 Pearson Correlation .217 .175 p-value (.249) (.354) Time 2 Pearson Correlation .244 .143
TARGET
StdRT
p-value (.194) (.452) Time 1 Pearson Correlation .305 .358 p-value (.101) (.052) Time 2 Pearson Correlation .274 .131
NONTARGET
RT
p-value (.143) (.491) Time 1 Pearson Correlation .356 .171 p-value (.053) (.366) Time 2 Pearson Correlation .474 -.035
TARGET
RT
p-value (.008) (.855) Note: N=30; p-values are 2-tailed tests
After exercise, a significant moderate positive correlation was found between change in
N1-back RT to Target stimuli at Time 2 and change in Reading SAT score (r= .47, p= .008). No
significant correlations were found between changes in any of the cognitive behavioral measures
for the N1-back task in relation to the Math SAT score.

100
Table 62. Cognitive behavioral changes for N2-back task post-exercise and SAT scores. CHANGE SCORES READING MATH
Time 1 Pearson Correlation -.142 -.041 p-value (.454) (.831) Time 2 Pearson Correlation -.153 -.044
NONTARGET ACCURACY
p-value (.420) (.819) Time 1 Pearson Correlation .007 -.120 p-value (.969) (.527) Time 2 Pearson Correlation -.178 .013
TARGET
ACCURACY
p-value (.347) (.945) Time 1 Pearson Correlation .253 -.233 p-value (.177) (.216) Time 2 Pearson Correlation .117 -.041
NONTARGET
StdRT
p-value (.537) (.828) Time 1 Pearson Correlation .252 .155 p-value (.179) (.413) Time 2 Pearson Correlation -.024 .213
TARGET
StdRT
p-value (.901) (.258) Time 1 Pearson Correlation .255 .182 p-value (.174) (.335) Time 2 Pearson Correlation .210 .286
NONTARGET
RT
p-value (.265) (.125) Time 1 Pearson Correlation .306 .192 p-value (.100) (.309) Time 2 Pearson Correlation .230 .320
TARGET
RT
p-value (.221) (.085) Note: N=30; p-values are 2-tailed tests
No significant correlations were found between changes in any of the cognitive
behavioral measures for the N2-back task in relation to either Reading or Math SAT scores.

101
CHAPTER 5
DISCUSSION
The broad goals of this study were to create a better understanding of the relationship
between cognition, exercise, and anxiety, expand the literature base, and benefit the general
public. The study was specifically designed to investigate whether or not aerobic exercise has the
ability to reduce anxiety levels associated with testing situations, and whether or not such
reductions are associated with acute enhancements in cognitive functioning. Results from this
experiment can hopefully provide knowledge necessary for establishing behavioral strategies for
students with anxiety to help them perform to their greatest academic abilities.
PARTICIPANTS
Originally, 35 individuals wanted to participate in the study. Unfortunately, five dropped
out of the study before completing all three visits (all were low-trait anxious). These five had
significantly lower fitness levels [VO2peak was significantly lower (p=0.036) in those who did
not complete the study (Mean=45.08, SE=1.85) than those who did (Mean=51.06, SE=1.77)].
Thus, it is possible that these individuals may have left the study due to negative feelings
towards exercise following the incremental exercise test to volitional exhaustion. It is also
suspected that high-trait individuals both did not drop out and did not join as often, because of
their personalities. Mathews and Mackintosh described anxious individuals as ones who have a
greater likelihood of reaching a pessimistic interpretation of ambiguous events (1998). Although
fewer high-trait anxious individuals decided to partake in the study at all, it is possible that those
who did felt personal motivations to complete something that they had dedicated themselves to,
more so than low-trait anxious individuals. High-trait anxious individuals have also been
described as people who are able to perform well when they know what is expected of them in an

102
academic setting (Peterson, 1977). The uneven sample sizes for the two groups, high- and low-
trait anxious individuals, were not desirable; however, it was not unexpected. An inverse
relationship was found between trait anxiety scores and willingness to participate in phase I
clinical trials (Almeida et al., 2008) and could also explain why high trait anxious individuals
were less likely to want to exercise in this study.
Participants were college-aged (M=21.14, SD=2.13) individuals, many who were
kinesiology majors and/or exercised on a regular basis, which may have resulted in a biased
sample. Overall, the individuals who participated in this study had VO2 peaks averaging (M=54.06,
SD=8.44) and (M=44.06, SD=9.23), for low-trait and high-trait anxious individuals, respectively.
The participants in this study placed in the 90th percentile based on normative VO2max values for
men (51.4 mL•kg-1•min-1) and women (44.2 mL•kg-1•min-1) between the ages of 20 and 29 (The
Physical Fitness Specialist Certification Manual as cited in “Predicting your…”, 2007; refer to
Table 1). Through talking with participants before and after their testing sessions, it became
apparent that many enjoyed exercising (many were kinesiology majors, had friends in
kinesiology, or played sports). Thus, these individuals were mostly regular exercisers with high
levels of aerobic fitness. It is possible that acute aerobic exercise would have greater capacity for
enhancing cognitive function in individuals who do not perform regular aerobic exercise and/or
have lower fitness levels. This concern is diminished by previous research, which has shown that
fitness level does not mediate the way in which trait anxiety influences physical responses (i.e.,
HR) to cognitive stressors post-exercise (Sedlock & Duda, 1994). Thus, inherent anxiety levels
may also be responsible for an individual’s psychological responses to a cognitive stressor post-
exercise.
There were a few group-specific differences between those considered high-trait anxious

103
and those considered low-trait anxious. Of all participants (N=30) who completed the study. 53%
were male (n=16) and 47% were female (n=14), but the percentage of females in the high-trait
anxious group (67%) was slightly greater than in the low-trait anxious group (62%) (refer to
Table 3). This was expected, as a prior meta-analysis of gender differences in personality found
that females report slightly higher scores on anxiety scales than men (Feingold, 1994). The high-
trait group was also less fit (in terms of VO2peak and VT) than the low-trait anxious group. This
was expected, as those with higher trait anxiety tend to report less physical activity (Kavussanu
& McAuley, 1995) than low-trait anxious individuals, and would most likely be less fit.
High-trait anxious individuals had lower average GPAs than the low-trait anxious
individuals (refer to Table 3); yet, both average GPAs were above 3.0, and representative of
above average college students, who characteristically have had to hold and maintain high
academic achievement levels to attain such a level of education. It is possible that a subset of the
high-trait anxious group may have test anxiety, as high-trait anxious individuals had the two
lowest and two highest GPAs of the entire sample, but this is merely speculation. It is interesting
that although high-trait anxious individuals had lower GPAs, they did have higher average ACT
scores (refer to Table 3).
STATE ANXIETY
Exercise did seem to effectively reduce SA for high-trait anxious individuals. As
hypothesized, SA of the high-trait anxious group decreased significantly more from baseline to
immediately post-exercise than it did for the low-trait anxious group (as the low-trait group had a
very slight increase). Similar results have been shown in intervention studies of aerobic exercise
and anxiety. Steptoe, Edwards, Moses, and Mathews (1989) found greater reductions in SA in
high-trait individuals following an aerobic training program than following a strength and

104
flexibility program for the same amount of time. Cronin (2005) found that high-trait anxious
women had lower SA following weeks in which they participated in more aerobic exercise,
while low-trait anxious women did not seem to show any significant pattern for SA change in
relation to their aerobic exercise participation; their SA was relatively low on average. Overall,
the high-trait anxious group had higher average SA than the low-trait anxious group. This makes
sense, because “trait anxiety can be described as a susceptibility to respond to situations
perceived as threatening with an increased level of state anxiety” (Bowers, Weaver, & Morgan,
1996, p. 173).
Not too surprisingly, SA in both groups increased during the cognitive testing portions of
the testing sessions. It is interesting to note that on exercise days, SA in the high-trait anxious
group dropped significantly more than it did for the low-trait anxious group between the 35
minute post-condition assessment and the end of the lab visit. It is possible that the anxiolytic
effect of exercise was still present 70 minutes post-exercise, as it has been shown to last 120
minutes in previous studies (Raglin & WIlson, 1996). By introducing stressors such as the
cognitive tests and SAT exams, anxiety reduction due to participation in exercise may have been
blunted at the 35-minute post-exercise assessment. Testing them too early post-exercise could
have been counterproductive to the anxiety-reduction process. Future research in this area may
want to consider postponing any cognitive testing until this 70-minute post-exercise time point to
see if SA still increases as much during testing, or if it remains at lower levels similar to low-trait
anxious controls. This decrease in SA at the end of the testing session could also be contributed
to participants’ relief that testing was over for the day. Although this feeling of “relief” may or
may not be the basis for the reductions seen at the end of the testing sessions, it is most likely not
the cause for anxiety reductions seen immediately post-exercise (Petruzzello, 1995). Subjective

105
responses from the participants reinforced this speculation. Regardless of group, most
participants mentioned that they were relieved that testing was done for the day. This same
relationship was not as profound for the low-trait anxious group, but that is mainly because their
SA levels did not fluctuate much from assessment to assessment (refer to Figure 6). On the
exercise days, SA showed a trend for being lower 70 minutes post-activity than on rest days. SA
levels fluctuated much more for the high-trait anxious group than the low-trait anxious group.
It is possible that the 20-item SAI would have been more sensitive to subtle changes in
SA for both groups, but due to the already lengthy testing sessions, it was in the best interests of
both the participants and researchers to keep the assessments short, thus preventing negative
attitudes from the participants and subsequent careless completion of the tasks due to loss of
interest. As mentioned in the “Results” section, SA changes could have varied for individuals
based on their experience with exercise on a treadmill (increased or decreased SA depending) or
with how taking exams and doing computer tests affected them emotionally.
FLANKER TASK AND INHIBITION
FLANKER ACCURACY
Average accuracy on all trials combined was around 93%, for all participants. Accuracy
on incongruent tasks was around 87% for low-trait anxious and 90% for high-trait anxious.
Accuracy on congruent tasks was around 97% for all. On both congruent and incongruent trials,
high-trait anxious individuals were slightly, but not significantly, more accurate than low-trait
anxious individuals. On rest days, there was a trend for the low-trait anxious group to become
less accurate from 0 to 50 minutes post-rest, while the high-trait anxious group showed a very
slight increase. Accuracy showed an increasing trend from baseline to post-condition for both
groups on exercise days.

106
FLANKER REACTION TIME
As expected, RT to incongruent stimuli was relatively slower than to congruent stimuli
for both groups, presumably because incongruent flankers distract the individual from the task at
hand resulting in decreased performance (Hommel, 2003). There was a trend for the high-trait
anxious group to have faster average RT to both congruent and incongruent trials than the low-
trait anxious group, but this occurred without respect to the exercise manipulation. Regardless of
condition, both groups responded more quickly over time and average RT for congruent trials
was significantly faster immediately post-condition than 50 minutes post-condition (refer to
Figure 7; p=.006). Post-exercise, there was a trend for the high-trait anxious group to respond
faster than post-rest on congruent trials, while the low-trait anxious group responded at about the
same speed after both conditions. This reached significance for incongruent trials. In this case,
exercise appeared to facilitate only the performance of high-trait, but not low-trait, anxious
individuals. This could lend support to the idea that anxious individuals are cognitively impaired
by their higher levels of anxiety (Gualtieri & Morgan, 2008) and that exercise may be the
behavior that could diminish this impairment. RT on incongruent trials decreased significantly
over time, as well (refer to Figure 8). This increase in speed could be explained by either a
practice/learning effect or a desire to quickly finish the testing session. Although arousal has
been postulated as one of the reasons for decreased RT post-exercise (Davranche, Hall, &
McMorris, 2009), it did not appear to be the case here, as RT still decreased following rest. RT
was faster for all individuals post-condition as compared to baseline (refer to Figure 9),
suggesting that even though participants were given practice sessions prior to baseline
assessment, they still were not performing to their best abilities on Day 1. High-trait anxious
individuals showed a trend for having faster average RT for all Flanker trials. There was a trend

107
for high-trait anxious individuals’ RT to continuously decrease over time post-exercise, while
low-trait individuals’ RT began to return to baseline 50 minutes post.
FLANKER STANDARD DEVIATION OF REACTION TIME
There was a trend for high-trait anxious individuals to have slightly greater variability in
response time than low-trait anxious individuals for all Flanker trials. In general, StdRT on
congruent trials was significantly smaller post-condition and this same general pattern
approached significance on incongruent trials. For incongruent trials, StdRT was smaller,
especially after exercise as compared to rest, and this same trend appeared for congruent trials.
The high-trait anxious group had a greater reduction in StdRT to congruent trials immediately
following exercise (~8 ms more) and rest (~3 ms more) than the low-trait anxious group. The
high-trait anxious group also had a slight increase in StdRT to incongruent trials immediately
following rest (~3 ms) while the low-trait anxious group had a slight decrease (~3 ms); however,
these differences were not statistically significant. Overall StdRT (a) decreased from baseline
and was significantly different at all time points, and (b) was significantly lower after exercise
than rest. Thus, exercise did appear to reduce response variability. This decrease in response
variability following exercise could be attributed to increases in attentional control as this has
been posited to be impaired by anxiety (Eysenck, Derakshan, Santos, & Calvo, 2007), and
attentional resources appera to be enhanced through acute aerobic exercise (Tomporowski,
2003).
INHIBITION
Processing speed, attention, memory, and executive control processes have been
examined in relation to acute exercise, and the most commonly studied executive control process
in the acute exercise literature is inhibition (Hillman et al., 2009). Basten, Steizel, and Fiebach

108
(2011) found high-trait anxious individuals to have generally impaired attentional control and
neural processing efficiency in relation to their low-anxious counterparts when performing a
Stroop inhibition task. The Flanker task was chosen for this study to see how individuals could
handle conflict created by the presence of distracters (incongruent stimuli). Previous work has
shown the incongruent stimuli influence response inhibition in an unfavorable manner,
ultimately making the response more difficult for the individual under such conditions
(Takezawa & Miyatani, 2005). Researchers studying emotion and cognition have also discovered
an additional level of conflict, that which arises from a person’s anxiety levels (i.e., more
anxiety, more conflict). It was thought that participation in a bout of acute aerobic exercise prior
to confronting such a situation would help the individual to clear their mind, preparing them to
handle the conflict more easily and enhance response performance (i.e., reduce RT without
sacrificing accuracy).
Takezawa and Miyatani (2005) had similar results, as they found that RT to incongruent
stimuli was longer than for congruent stimuli. They also found that RT to congruent trials was
slower following incongruent trials and that incongruent trials were faster if they were following
other incongruent trials, as the individual had become aware that conflict was present (Takezawa
& Miyatani, 2005). The multiple choice questions of the SAT exams were meant to act as
practical assessments of response inhibition, as each of these provided multiple distracting
responses, as well as a correct answer. It would seem that multiple-choice questions with
responses that are more alike would present greater conflict and result in worse response
inhibition by the individual trying to answer that question. This was not analyzed in the current
study, but would be a fruitful avenue for future research.

109
N-BACK TASK AND WORKING MEMORY
N-BACK ACCURACY
No differences in N0-back accuracy for target or nontarget trials were present in either
group, and accuracy for target stimuli was worse than for nontarget stimuli. Based on the present
results, it seemed as if the N0-back and N1-back tasks were too easy, resulting in a ceiling effect
for performance on the nontarget trials, and was not sensitive enough to induce group differences
in performance. Regarding N1-back target accuracy, high-trait anxious individuals performed
worse after rest than exercise, while the opposite was seen in low-trait anxious individuals (but
this relationship only approached significance; refer to Figure 10). For N2-back target trials,
accuracy was worse than for N0-back and N1-back trials, and seemed to be worse over time
post-condition, especially after exercise. Subjective responses from the participants suggested
that the N2-back task was very difficult, to the point that some participants feared task
completion. It is possible that the 2 shape N-back test was too difficult for both groups (high and
low-trait anxious individuals); therefore, it was so difficult that it was impossible to see any
significant differences in performance between the two. However, this seems unlikely, as
accuracy was still in the upper 90th percentile for both groups and for N2-back nontarget trials,
accuracy seemed to increase over time post-condition.
N-BACK REACTION TIME (RT)
In general, high trait anxious individuals had faster RTs to target and nontarget stimuli on
the N0-back, N1-back, and N2-back tasks than low-trait anxious individuals, but the differences
were not statistically significant. In general, RTs on target stimuli on the N0-back task increased
(slowed) significantly over time from baseline at all time points, whereas, RTs to nontarget
stimuli on the N0-back task remained relatively constant over time. The faster RT suggests that

110
high-trait anxious individuals may have had greater motivation to complete the task or had
experienced increased arousal, provoked by increased anxiety during the task, leading to the
tendency for faster RTs. Conversely, there was a trend for average RT to both nontarget and
target stimuli on the N1-back and N2-back tasks to become faster over time, although only
significantly in some instances. Unexpectedly, average RT to both target and nontarget stimuli
on the N1-back and N2-back tasks was slower after exercise than after rest, but these differences
were not statistically significant.
N-BACK STANDARD DEVIATION OF REACTION TIME (StdRT)
In regards to response variability, the two anxiety groups had very different temporal
responses to target stimuli on the N0-back task, (refer to Figure 12). Low-trait anxious
individuals had increased response variability post-condition. Response variability was
especially larger than baseline after the rest condition. High-trait anxious individuals also had
increased response variability immediately post-rest, but this returned to baseline 50 minutes
post-rest. Their response variability dropped below baseline (~15 ms) following exercise and
then increased above baseline (~15 ms) at 50 minutes post-exercise.
On average, high trait anxious individuals had similar StdRT to target and nontarget
stimuli on the N1-back task compared to low-trait anxious individuals. Average StdRT to target
and nontarget stimuli on the N1-back task became larger immediately post-condition and then
decreased 50 minutes post-condition. This decrease took the low-trait anxious individuals back
towards baseline after both rest and exercise, while the decrease took high-trait anxious
individuals down below baseline post-exercise (refer to Figure 13).
There was a trend for high-trait anxious individuals to have greater response variability to
target and nontarget stimuli on the N2-back task than low-trait anxious individuals. Average

111
response variability to target and nontarget stimuli on the N2-back task was significantly smaller
post-condition than at baseline. The greater response variability could suggest that high-trait
anxious individuals may have been distracted by conflicting thoughts during the task about
issues completely unrelated to the task at hand or possible worries about how their ultimate
performance would turn out (Wine, 1971).
WORKING MEMORY
Working memory deals with one’s ability to use and manipulate available information to
make needed decisions and both men and women with higher levels of anxiety seem to have
decision-making impairments that may manifest differently (de Visser, van der Knaap, van de
Loo, van der Weerd, & van den Bos, 2010). It is believed that performance on the N-back task
will be better if working memory is functioning well because the individual will be able to hold
information in short term memory for quick recall and be able to apply that knowledge reserve to
make the appropriate choice. A meta-analysis of acute exercise and cognitive performance found
exercise to be associated with generally improved performance, with larger weighted effect sizes
for tasks involving memory than either executive function or information-processing time tasks
(Lambourne & Tomporowski, 2010). These positive effects seem to occur for response speed but
not accuracy on working memory tasks (for a meta-analytic review see McMorris, Sproule,
Turner, & Hale, 2011).
In the current study, the N-back task relied on a simple right or left click on a keypad to
demonstrate the much more profound cognitive paradigm of working memory. An impromptu
essay about a video shown to a participant X minutes in the past may have been able to more
thoroughly test differences in working memory between groups; however, such a test would also
be much more difficult to assess.

112
The effects of trait anxiety may be fairly complicated. It appears that high trait-anxious
individuals have differential working memory capacity depending on the stress level of the
condition (Sorg & Whitney, 2004). Sorg and Whitney (2004) used a reading span task requiring
memory storage and manipulation to assess performance in high- and low-trait anxious
individuals. In the high-stress condition, high-trait anxious individuals performed worse than
low-trait anxious individuals; however, the opposite occurred for the low-stress condition. Thus,
it is plausible that the high-trait anxious individuals in the present study were experiencing
transient levels of stress during the cognitive and academic assessments. Furthermore, these
stress levels could have varied at the individual level. Since stress levels were not measured
during this study, it is difficult to know how this may have played a role in the current
experiment. The increased SA levels seen between round 1 and round 2 of cognitive testing do
seem to reflect a worsening of mood, which could have been attributable to stress. With test
anxiety, specifically, working memory capacity appears to be diminished on more difficult
problems, as these individuals are distracted by thoughts unrelated to the task at hand, such as
worrying about their final test grade (Shobe, Brewin, & Carmack, 2005).
SAT (MATH & READING)
Although many have looked at the relationships between fitness and academic achievement
(Castelli, Hillman, Buck, & Erwin, 2007; Grissom, 2005) and physical activity patterns and
academic achievement (for a review see Trudeau & Shephard, 2008), only a few studies have
looked at the relationship between acute exercise and academic achievement (Mahar et al., 2006;
Hillman et al., 2009). It was anticipated that students coming into the lab with higher state
anxiety levels would receive higher scores on the academic achievement test following exercise,
relative to their post-rest scores. Math scores were significantly higher after exercise than after

113
rest for both groups. This result replicates other within-subjects studies of children in which
academic math scores were higher post-physical activity than after no activity (Gabbard &
Barton, 1979, McNaughten & Gabbard, 1993). Although not statistically significant, the mean
difference in math score from post-rest to post-exercise was greater for high-trait anxious
individuals than low-trait anxious individuals. There was a trend for high-trait anxious
individuals to score higher on the reading exams than low-trait anxious individuals and previous
research in children has associated acute aerobic treadmill walking with enhanced performance
on a reading achievement test (Hillman et al., 2009). Although not statistically significant, the
mean difference in reading score from post-rest to post-exercise was also greater for high-trait
anxious individuals than low-trait anxious individuals. If there had been a more sensitive reading
test or more participants, the current study may have also had significant results.
On average, most individuals performed well on the exams (better than chance). There
are many possible explanations for why no significant group differences were seen. As all of the
individuals had already taken collegiate entrance exams, these practice tests may have been
familiar to them and they may have studied or recently taken courses on how to perform well on
such exams. The practice tests were taken from year 2000 to avoid this problem (all but one or
two of the participants would have been young enough that most would not have taken these
exact exams for real, or in preparation for their own exams). Yet, there is always a possibility
that these individuals had either seen these questions, or very similar ones, previously. If this is
the case, the SAT practice tests may not have been sensitive enough to determine whether or not
acute exercise could influence academic performance. The SAT practice exams were also very
short and had a small range of scores, with many individuals receiving the same score for
missing different types of questions. It may have been more practical to test these individuals on

114
subject matter that they were currently studying. However, this would have complicated the
comparison of results, as most participants had different areas of focus. It would have been quite
difficult to normalize the scores across different participants and different tests, although z-scores
could have been created.
It is possible that the SAT exams may have been too easy, as both groups were college
students who had to perform well on such standardized exams in order to be accepted into the
university in the first place, which could have led to a ceiling effect. An exercise session may
have proven more effective in a group of younger individuals who had not yet been subjected to
any college entrance exams. Subjective accounts by participants suggested that one of the
versions of the SAT reading test was more interesting than the other. Maybe “how interesting”
the SAT reading portion is helps or hinders performance on the questions. Katchmar, Ross, and
Andrews (1958) found that high-trait anxious individuals took longer to complete a verbal
coding task when under pressure; accuracy was also poorer for high-trait anxious individuals (as
cited in Bowers, Weaver, & Morgan, 1996). In the present study, it would have been interesting
to examine the length of time that it took individuals to complete the SAT exams to see if there
were any group differences and to see if there was an inverse relationship between accuracy and
completion time (they were given a maximum completion time of 15 minutes, with no
minimum). It would also have been interesting to determine any differences in completion time
in relation to condition. An important question to answer is what would happen in a test anxious
population..
CORRELATIONS
Pearson product moment correlations were examined to see if reductions in state anxiety
and/or improvements in cognition were significantly correlated with improvements in academic

115
achievement. The whole premise on which this study was set was that by using exercise, one
could reduce state anxiety and that if state anxiety was blocking people from being able to think
clearly, it would make sense to see strong correlations between reduced SA and improved
cognitive function (measures and SAT). However, it would have been beneficial to also analyze
whether or not the relationships that were found were even stronger for high-trait anxious
individuals than low-trait anxious individuals (meaning that this relationship would be more
important for those individuals with high anxiety; exercise would be more effective for them
because they would theoretically have more room for improvement due to anxiety-driven
impairments). Since SA did not change much over time for the low-trait anxious group, one
could assume that the significant relationships seen did relate more to high-trait anxious
individuals (as their SA did change after exercise). Only significant relationships will be
discussed in this section.
RELATIONSHIPS BETWEEN CHANGES IN STATE ANXIETY (SA) & ACCURACY
Accuracy on nontarget trials of the N0-back task, during the first round of cognitive
testing was greater when SA increased from immediately post-rest to 35 minutes post-rest (r=
.37, p=.042; refer to Table 36). Accuracy on target trials of the N0-back task, during the first
round of cognitive testing, was greater when SA decreased from baseline to immediately post-
exercise (r= -.38, p=.039; refer to Table 37). After rest, accuracy on target and nontarget (r= .40
p=.024; r= .52, p=.003; refer to Table 38) trials of the N1-back task was better during the second
round of cognitive testing, when SA increased from 35 minutes post- to 70 minutes post-rest.
Thus, when SA was at a relatively lower point on the continuum and this corresponded to the
time at which an individual was completing the N-back task, performance was better. Accuracy
on the N2-back task, during the second round of cognitive testing, was better when SA decreased

116
from baseline to immediately post-rest (r= -.37, p=.041; refer to Table 40). It is plausible that if
there was a large enough decrease in SA immediately post-condition, SA may have gradually
approached an optimal level for N2-back task performance by the second round of cognitive
testing.
RELATIONSHIPS BETWEEN CHANGES IN SA & REACTION TIME (RT)
RT on the incongruent trials of the Flanker task, during the second round of cognitive
testing, was faster when SA decreased from baseline to immediately post-exercise (r=0.40,
p=.032; refer to Table 43). RT on the N0-Back task during the second round of cognitive testing
was faster when SA decreased following exercise (r=0.38, p=.036; refer to Table 45). RT to
nontarget stimuli on the N1-Back task, during both rounds of cognitive testing, was faster when
SA decreased following exercise (refer to Table 47 for Pearson product moment correlations and
p-values). After exercise, RT to nontarget stimuli on the N2-back task was faster when SA
decreased during the second round of cognitive testing (r=0.37, p=.043; refer to Table 49).
Overall, RT appeared to be facilitated when SA decreased prior to cognitive testing. However,
these correlations were not high strength, possibly because both decreased RT and decreased SA
were artifacts of aerobic exercise participation. It is possible that decreases in RT were a result of
increased movement time and closely associated to increases in arousal following exercise
(Chang, Etnier, & Barella, 2009), possibly creating the illusion that SA changes contributed to
changes in RT.
RELATIONSHIPS BETWEEN CHANGES IN SA & STANDARD DEVIATION OF RT
As SA decreased immediately post-exercise, N1-back StdRT to Nontarget stimuli
decreased during the first round of cognitive tests (r=0.38, p=.040; refer to Table 55).

117
As SA decreased from immediately post-exercise to 35 minutes post-exercise, N1-back StdRT to
nontarget stimuli also decreased during the first round of cognitive tests (r=0.43, p=.017; refer to
Table 55) and N1-back StdRT to target stimuli during the second round of cognitive tests
(r=0.39, p=.033; refer to Table 55). Thus, greater decreases in SA post-exercise were associated
with greater decreases in N1-back response variability.
RELATIONSHIPS BETWEEN CHANGES IN SA & SCHOLASTIC APTITUDE TEST
When SA increased from immediately post-exercise to 35 minutes post-exercise, Math
SAT scores improved, (r=0.39, p=.035; refer to Table 58). When SA increased from 35- minutes
post-exercise to 70 minutes post-exercise, Math SAT scores improved (r=0.43, p=.019). These
increases in SA appear to signify that SA had decreased significantly enough immediately post-
exercise to have room to increase. Therefore, the important message that these positive
correlations may provide is that SA was significantly low enough post-exercise, and that this
may be the reason that enhanced math performance was seen. This could place the individual at
their optimal level of SA for performance. If they had not been given the opportunity to reduce
their anxiety in the first place it may have remained high and not had room to increase anymore.
RELATIONSHIPS BETWEEN COGNITIVE BEHAVIORAL MEASURES & SAT SCORES
After exercise, a significant moderate negative correlation was found between change in
response variability to Incongruent stimuli on the Flanker Task during the second round of
cognitive testing and change in Reading SAT score (r= -0.56, p=.002; refer to Table 59). This
seems reasonable, because the Reading SAT exam was taken just prior to the second round of
cognitive testing. Lower response variability was present around the time at which the individual
took the Reading SAT exam, and may represent facilitated cognitive function, resulting in a
greater Reading SAT score.

118
That being said, controversial results were seen in relation to response variability after
exercise. Response variability increased for N0-back target stimuli during the second round of
cognitive tests as Reading SAT scores increased (r=0.40, p=.027). As N0-back RT to target and
nontarget stimuli slowed during the second round of cognitive tests and Reading SAT scores
increased (r=0.39, p=.031; r=0.36, p=.049; refer to Table 60). The same occurred for N1-back
RT to target stimuli and Reading SAT scores (r=0.47, p=.008; refer to Table 61). It could be that
when RT slows following exercise, it is because the individual is more focused and paying more
close attention to the task at hand (Barnes et al., 2010).
Larger changes in cognitive behavioral measures and SAT scores were expected for the
high-trait anxious group. Some lack of significance could have been due to the small sample size
(n=9). Many other factors could also have contributed to the absence of large changes.
Unrecorded, subjective assessments of the participants’ attitudes during the testing sessions
suggested that the participants became tired over the course of the testing session, on both days.
Comments made by participants indicated that individuals were feeling as if the session was
“dragging on”. Other comments made suggested that the participants were irritated about having
a second round of cognitive tests post-condition. The lights being off during computer tests and
the warmth and humidity of the room could also have contributed to some of the lethargy and
lack of motivation to perform to their best abilities. Observation indicated that participants
looked and acted physically tired towards the end of the session on both days. This may or may
not have influenced performance during the second round of cognitive analyses. The testing
sessions were indirectly designed to be long for one reason. It was necessary to see if any
cognitive changes that may have occurred immediately post-condition were still present after a
longer period of time post-activity. The second round of cognitive testing was used to assess this.

119
If cognitive enhancement does exist post-exercise, it is important to know how long such effects
will last. If the individual is choosing to exercise specifically to reduce anxiety and perform
better on an exam, do they have time to shower before going to take their test? Such questions
help apply the basic results of this research to daily human practice.

120
CHAPTER 6
CONCLUSIONS
This study was an attempt to understand the relationships between exercise, anxiety, and
cognition. Greater accuracy, faster RT, and smaller response variability have been assumed to be
superior to their possible inverse cognitive responses (i.e., slower RT) to acute exercise. Clearly,
these may not always be the most advantageous, in terms of superior cognitive performance, in
all situations. However, such responses are commonly cited as reflective of facilitated cognition
(Tomporowski, 2003). Reductions in state anxiety were seen in high-trait anxious individuals for
both conditions. In the present study, high-trait anxious individuals had decreased state anxiety
(SA) immediately post-condition, increased SA during the cognitive tests, and decreased SA at
the end of the session. As hypothesized, SA of the high-trait anxious group decreased
significantly more from baseline to immediately post-exercise than it did for the low-trait
anxious group (in fact, the low-trait group had a very slight increase). Low-trait anxious
individuals had less profound fluctuations in SA over time than high-trait anxious individuals.
Overall, accuracy was fairly high for all tasks except for the N2-back task. RT was slower for
tasks that were more difficult (i.e., incongruent and nontarget trials). Findings revealed generally
greater accuracy, faster RT, and greater response variability for high-trait anxious individuals
than low-trait anxious individuals on all tasks. However, these responses varied greatly
depending on the condition and time of assessment. Exercise did show a trend towards
facilitating cognitive performance, but failed to reach statistical significance on many accounts.
However, this trend was not seen for N1-back and N2-back RT, because these were slower post-
exercise for both groups. Thus, results are very inconclusive. Such results were not completely
unexpected, as a recent meta-regression analysis determined that although acute exercise had a

121
mean overall positive effect size of 0.20 in facilitating cognitive performance, the types of
exercise and cognitive tasks used have variable results (Lambourne & Tomporowski, 2010).
Math SAT scores were higher after exercise than rest, for both groups. A similar trend was seen
for Reading SAT scores.
IMPLICATIONS
From the results of this study, and related research, aerobic exercise could be used as an
economical therapy to help alleviate anxiety, improve cognitive function and academic
achievement, and increase opportunities for individuals to advance in school and the work force,
particularly for those burdened with high trait and state anxiety, along with other psychological
impairments. Higher fitness, not performance of a bout of acute aerobic exercise, has been
postulated as the primary reason for enhanced cognition (Stroth, Kubesch, Dieterle, Ruchsow,
Heim, & Keifer, 2009). However, the present results demonstrate differential changes in
cognitive performance variables in relatively high-fit individuals, on the basis of trait anxiety
level. Clearly fitness has been shown to play a role in cognitive processing ability, but acute
exercise participation should not be ruled out as a mechanism for cognitive enhancement.
Although aerobic exercise was studied in this experiment, the mode, duration, and
temporal execution of acute exercise (in relation to the time of assessment) that will be
associated with most dramatic changes in cognition is yet to be determined. It may be that acute
aerobic exercise is not the best choice for cognitive enhancement. Anxiety does seem to be
reduced by aerobic exercise participation. The anxiolytic effects of acute exercise appear to last
30-120 min post-activity (Bahrke & Morgan, 1978; Raglin & Wilson, 1996; Cox, Thomas, &
Davis, 2000). However, it may be the case that anxiety reduction prior to cognitive examination
has no effect on performance. It could also be the case that post-exercise assessment is not the

122
best time to see positive changes in cognitive functioning. Exercising while learning or studying
may produce different results depending on the intensity of exercise and the type of cognitive
task; however, information processing tasks did seem to improve during steady-state exercise
(Lambourne & Tomporowski, 2010).
Anxiety reduction does seem to be an effective strategy for enhancement of cognitive
performance. Current approaches for anxiety reduction in testing situations involve
pharmacological and cognitive-behavioral therapy approaches (Bekker & van Mens-Verhulst,
2007), or through altered environmental settings for students to take their tests. Anxiety-
reduction in test anxious individuals has been positively correlated with academic performance
enhancement; however, this is a moderate relationship and should be further investigated in
terms of general state anxiety (Driscoll, 2007), and aerobic exercise was not previously used as
the means of anxiety reduction. If anxiety is the sole moderator of cognitive impairment, then no
additive effect will be seen. However, if the two (anxiety reduction and participation in aerobic
exercise) act separately upon cognition, there may be an additive effect. Since both of these areas
have conflicting opinions for how each independent variable influences cognitive performance, it
is quite unclear whether additive enhancements, additive impairments, or neutralizing
counterbalances would occur.
If additive enhancement of cognitive functioning can be determined in anxious
individuals, it may serve as a source of motivation for individuals to exercise before important
school exams or other cognitively taxing activities. If behavior begins to change so that acute
bouts of exercise are performed more regularly, some may become chronic exercisers, which
could result in ultimate reductions in their trait anxiety levels as chronic exercise has been
associated with a 0.34 standard deviation reduction in trait anxiety (Petruzzello et al., 1991).

123
STRENGTHS
According to the meta-analysis by Lambourne and Tomporowski (2010) only 41% of
studies involving post-exercise cognitive assessment have reported fitness (e.g., VO2max) values
for their participants. By reporting VO2peak, the importance of physical fitness as a variable in
acute exercise studies has been reaffirmed. This same meta-analysis also mentioned the lack of
research on how cognitive performance changes over time in response to acute exercise and in
comparison to a control condition, both of which were done in the current study. Although
current attempts are being made to investigate aerobic exercise, cognition, and academic
achievement, the area is still relatively new, leaving unanswered questions about whether or not
acute bouts of activity can be used therapeutically, and if so, which populations would benefit
most. The results from this study add to the knowledge base in these respects. The project was
also novel in a broad sense, as it aimed to develop a new theoretical framework spanning
multiple fields of study.
LIMITATIONS
The results presented here only describe how the populations of high- and low-trait anxious
fit, young adults studied in this experiment would respond to acute aerobic exercise, and needs
further exploration in individuals with test anxiety. According to Bowers, Weaver, and Morgan
(1996), the emotional state of anxiety only occurs when the individual interprets that the stressful
situation or stimulus needs to be avoided (p. 173). This leads one to question the motivations and
study ethic that each group may have had when it came to standardized testing. It also leads to
question whether or not this type of acute exercise intervention would have any profound effects
in a high-trait anxious population, as compared to a test anxious population.

124
Participants were from a specific population (college students, mostly kinesiology
majors) making generalization of results difficult. Future research should attempt to examine this
relationship in youth, older adults, and individuals of different education levels. Since
participants in this study may or may not have had any situation-specific state anxiety changes
directly caused by “testing”, it would still be beneficial to perform this research in test-anxious
individuals. An additional flaw may have been present in the research design, as the same
versions of N-back and Flanker tasks were used during both cognitive testing rounds 1 and 2 on
any given day. Even though versions were randomized by day, they were exactly the same
within sessions, potentially allowing too much practice and corrupting results for the second
round of testing on visits 2 and 3. Therefore, some time effects seen here may not be accurate.
Attrition Issues
A total of five individuals dropped out of the study. All were low-trait anxious. Four
volunteers dropped out of the study after Visit 1: one female had overestimated the amount of
time she could commit to the study before the end of the spring semester, and three (1 male, 2
females) never responded to follow-up e-mails or phone calls. One female made numerous
cancellations and finally dropped out of the study after Visit 2 (resting condition), because she
said she was too busy with finals and was a little worried about exercising for 34 minutes. If this
study is to be replicated in the future, it is suggested that more time be set aside for recruitment,
and if possible, money should be set aside for participant reimbursement. These two changes
would be expected to increase sample sizes for both groups, high- and low-trait anxious.
FUTURE DIRECTIONS
From review of the literature, there appears to be a lack of anxiety research in testing
situations. Few have attempted to explain the association between cognition and emotion. A

125
meta-analysis discovered impaired long- and short-term visual and verbal memory and learning,
executive function, attention, and processing speed in individuals with OCD, PTSD, Social
Phobia, and Panic Disorder (Castaneda, Tuulio-Henriksson, Marttunen, Suvisaari, & Lönnqvist,
2008), but there appears to be a paucity of research on Generalized Anxiety Disorder (GAD) and
cognitive impairment. It would be recommended that the current study be replicated in test-
anxious individuals.
This exploratory work can hopefully serve as a pilot study for future research in individuals
suffering from test anxiety. As the current study looked at general trait anxiety, it would be
beneficial to determine whether or not similar or even more favorable changes in cognitive and
academic performance are yielded in these individuals. It would also be beneficial to compare
aerobic exercise to current standards for test anxiety intervention. This research area could also
benefit from the formation of a well-established theoretical model of relationships between
cognition, academic performance, exercise, and anxiety. It is the hope of this author that the
proposed hypothetical model may spur interest in creating such a cumulative model. Many of
these dual relationships have been investigated, but having an all-inclusive model could provide
guidance to individuals studying other emotional-cognitive paradigms, elderly adults, children,
and individuals with psychological disorders.

126
REFERENCES
Almeida, L., Kashdan, T. B., Nunes, T., Coelho, R., Albino-Teixeira, A., & Soares-da-Silva, P.
(2008). Who volunteers for phase I clinical trials? Influences of anxiety, social anxiety
and depressive symptoms on self-selection and the reporting of adverse events. European
Journal of Clinical Pharmacology, 64(6), 575-582.
anxiety. (2010). In Merriam-Webster Online Dictionary.
Retrieved May 6, 2010, from http://www.merriam-webster.com/dictionary/anxiety
Anxiety linked with a higher risk for certain chronic conditions. (July 2008). Harvard Women’s
Health Watch, © 2000-2011 Harvard University. Retrieved from
https://www.health.harvard.edu/press_releases/Anxiety-linked-with-a-higher-risk-f
or-certain-chronic-conditions
Audiffren, M., Tomporowski, P. D., Zagrodnik, J. (2009). Acute aerobic exercise and
information processing: Modulation of executive control in a Random Number
Generation task. Acta Psychologica, 132, 85-95.
Augustine, A. A., & Hemenover, S. H. (2009). On the relative effectiveness of affect regulation
strategies: A meta-analysis. Cognition and Emotion, 23(6), 1181-1220.
Backhouse, S. H., Ekkekakis, P., Biddle, S. J. H., Foskett, A., & Williams, C. (2007). Exercise
makes people feel better but people are inactive: Paradox or artifact? Exercise
Psychology, 29, 498-517.
Bahrke, M. S., & Morgan, W. P. (1978). Anxiety reduction following exercise and meditation.
Cognitive Therapy and Research, 2(4), 323-333.
Barnes, R. T., Coombes, S. A., Armstrong, N. B., Higgins, T. J., & Janelle, C. M. (2010).
Evaluating attentional and affective changes following an acute exercise bout using a
modified dot-probe protocol. Journal of Sports Science, 28(10), 1065-1076.

127
Basten, U., Steizel, C., & Fiebach, C. J. (2011). Trait anxiety modulates the neural efficiency of
inhibitory control. Journal of Cognitive Neuroscience, 1-14. Early Access, posted Online
March 10, 2011.(doi:10.1162/jocn_a_00003). © Massachusetts Institute of Technology.
Bekker, M. H. J., & van Mens-Verhulst, J. (2007). Anxiety disorders: Sex differences in
prevalence, degree, and background, but gender-neutral treatment. Gender Medicine,
4B, S178-S193.
Borg, G. Borg's Perceived Exertion and Pain Scales. Champaign, IL: Human Kinetics, 1998.
Bowers, C. A., Weaver, J. L., & Morgan, B. B., Jr. (1996). Moderating the performance effects
of stressors. In J. E. Driskell & E. Salas (Eds.), Stress and human performance (pp. 163-
192). Mahwah, NJ: Erlbaum.
Castaneda, A. E., Tuulio-Henriksson, A., Marttunen, M., Suvisaari, J., & Lönnqvist, J. (2008). A
review on cognitive impairments in depressive and anxiety disorders with a focus on
young adults. Journal of Affective Disorders, 106, 1-27.
Castelli, D. M., Hillman, C. H., Buck, S. M., & Erwin, H. E. (2007). Physical fitness and
academic achievement in third- and fifth-grade students. Journal of Sport & Exercise
Psychology, 29, 239-252.
Chang, Y., & Etnier, J. L. (2009). Exploring the dose-response relationship between resistance
exercise intensity and cognitive function. Journal of Sport and Exercise Psychology, 31,
640-656.
Chang, Y., Etnier, J. L., & Barella, L. A. (2009). Exploring the relationship between exercise-
induced arousal and cognition using fractionated response time. Research Quarterly for
Exercise and Sport, 80(1), 78-86.

128
Chisholm, D.M., Collis, M.L., Kulak, L.L., Davenport, W., Gruber, N., & Stewart, G. (1978).
PAR-Q Validation Report: The evaluation of a self-administered pre-exercise screening
questionnaire for adults. Vancouver, BC: Ministry of Health.
Claman, C. (Ed.). (2003). 10 Real SATs: Third Edition. New York: College Entrance
Examination Board.
Coe, D. P., Pivarnik, J. M., Womack, C. J., Reeves, M. J., & Malina, R. M. (2006). Effect of
physical education and activity levels on academic achievement in children. Medicine &
Science in Sports & Exercise, 38(8), 1515-1519.
Colcombe, S. J., & Kramer, A. F. (2003). Fitness effects on the cognitive function of older
adults: A meta-analytic study. Psychological Science,14, 125-13
College Board. (2009). SAT. Retrieved from
[http://www.collegeboard.com/student/testing/sat/about/SATI.html]
Cox, R. H., Thomas, T. R., & Davis, J. E. (2000). Delayed anxiolytic effect associated with an
acute bout of aerobic exercise. Journal of Exercise Physiology online, 3(4) 59-66.
Cronin, L. (2005, December 7). Aerobic exercise and state anxiety: The moderating role of trait
anxiety. Clemson University-Psychology, Community of Undergraduate Journals Online.
Retrieved from http://cujo.clemson.edu/publication/show/16
Davranche, K., Hall, B., & McMorris, T. (2009). Effect of acute exercise on cognitive
control required during Eriksen flanker task. Journal of Sport and Exercise
Psychology, 31, 628-639.
De Moor, M. H., Boomsma, D. I., Stubbe, J. H., Willemsen, G., & de Gues, J. C. (August, 2008).
Testing causality in the association between regular exercise and symptoms of anxiety
and depression. Archives of General Psychiatry, 65(8), 897-905.

129
de Visser, van der Knaap, van de Loo, van der Weerd, & van den Bos. (2010). Trait anxiety
affects decision-making differently in healthy men and women: Towards gender-specific
endophenotypes of anxiety. Neuropsychologia, 48(6), 1598-1606.
Dennis, T. A., & Chen, C. (2008). Trait anxiety and conflict monitoring following threat: An
ERP study. Psychophysiology, 46(1), 122-131.
Donner, E. (October, 2009). Definition of trait anxiety. Retrieved on May 1, 2010 from
http://www.ehow.com/facts_5674194_definition-trait-anxiety.html
Driscoll, R. (2007) Westside Test Anxiety Scale Validation. Education Resources Information
Center, pp. 1-5. Retrieved on April 18, 2010 from http://www.amtaa.org/res/svtxt.html
Ekkekakis, P., Hall, E. E., & Petruzzello, S. J. (1999). Measuring state anxiety in the context of
acute exercise using the state anxiety inventory: An attempt to resolve the brouhaha.
Journal of Sport & Exercise Psychology, 21, 205-229.
Ekkekakis, P., Hall, E. E., & Petruzzello, S. J (2005). Some like it vigorous: Measuring
individual differences in preference for and tolerance of exercise intensity. Journal of
Sport & Exercise Psychology, 27, 350-374.
Ekkekakis, P., Hall, E. E., & Petruzzello, S. J. (2008). The relationship between exercise
intensity and affective responses demystified: To crack the 40-year-old nut, replace
the 40-year-old nutcracker! Annals of Behavioral Medicine, 35, 136-149.
Etnier, J. L., Salazar, W., Landers, D. M., Petruzzello, S. J., Han, M., & Nowell, P. (1997). The
influence of physical fitness and exercise upon cognitive functioning: A meta-analysis.
Journal of Sport & Exercise Psychology, 19, 249-277.
Eysenck, M. W., Derakshan, N., Santos, R., & Calvo, M. G. (2007). Anxiety and cognitive
performance: Attentional control theory. Emotion, 7(2), 336-353.

130
Feingold, A. (1994). Gender differences in personality: A meta-analysis. Psychological Bulletin,
116(3), 429-456.
Gabbard, C., & Barton, J. (1979). Effects of physical activity on mathematical computation
among young children. The Journal of Psychology, 103, 287-288.
Goldman-Rakic, P. S. (September, 1992). Working memory and the mind. Scientific American,
pp. 11-117.
Gorfein, D. S., & MacLeod, C.M. “Chapter 1: The concept of inhibition in cognition.”
Inhibition in Cognition. World Composition Services, Sterling: VA, 2007.
Grissom, J. B. (2005). Physical fitness and academic achievement. Journal of Exercise
Physiology Online, 8(1), 11-25.
Gualtieri, C. T., & Morgan, D. W. (2008). The frequency of cognitive impairment in patients
with anxiety, depression, and bipolar disorder: An unaccounted source of variance in
clinical trials. Journal of Clinical Psychology, 69(7), 1122-1130.
Hardy, C. J., & Rejeski, W. J. (1989). Not what, but how one feels: the measurement of affect
during exercise. Journal of Sport & Exercise Psychology, 11(3), 304-317.
Health & PA History Form (2010). Department of Kinesiology & Community Health, University
of Illinois at Urbana-Champaign.
Hillman, C. H., Snook, E. M., & Jerome, G. J. (2003). Acute cardiovascular exercise and
executive control function. International Journal of Psychophysiology, 48, 307-314.
Hillman, C. H., Pontifex, M. B., Raine, L. B., Castelli, D. M., Hall, E. E., & Kramer, A. F.
(2009). The effect of acute treadmill walking on cognitive control and academic
achievement in preadolescent children. Neuroscience, 159, 1044-1054.

131
Hommel, B. (2003). Spatial asymmetries in the flanker-congruency effect: Attentional scanning
is biased by flanker orientation. Psychology Science, 45(1), 63-77.
Howley, E. T., & Frakes, B. D. (2003). Health fitness instructor’s handbook: Fourth edition.
Champaign, IL: Human Kinetics.
http://www.amtaa.org/index.html
Humara, M. (September, 1999). The relationship between anxiety and performance: A cognitive-
behavioral perspective. Athletic Insight: The Online Journal of Sport Psychology, 1(2), 1-
14.
Kavussanu, M., & McAuley, E. (1995). Exercise and optimism: Are highly active individuals
more optimistic? Journal of Sport & Exercise Psychology, 17(3), 246-258.
Kennedy, C. A., & Yoke, M. M. (2005). Methods of group exercise instruction. Champaign, IL:
Human Kinetics.
Koltyn, K.F., & Morgan, W.P. (1997). Influence of west suit wear on anxiety responses to
underwater exercise. Undersea and Hyperbaric Medical Society, 23-28.
Kramer, A. F., Erickson, K. I., & Colcombe, S. J. (2006). Exercise, cognition, and the aging
brain. Journal of Applied Physiology, 101, 1237–1242.
Kyizom, T., Singh, S., Singh, K. P., Tandon, O. P., & Kumar, R. (2010). Effect of pranayama &
yoga-asana on cognitive brain functions in type 2 diabetes-P3 event related evoked
potential (ERP). The Indian Journal of Medical Research 131. 636-640.
Lambourne, K., & Tomporowski, P. (2010). The effect of exercise-induced arousal on cognitive
task performance: A meta-regression analysis. Brain Research, 1341(23), 12-24.
Mathews, A., & Mackintosh, B. (1998). A cognitive model of selective processing in anxiety.
Cognitive Therapy and Research, 22(6), 539-560.

132
Mahar, M. T., Murphy, S. K., Row, D. A., Golden, J., Shields, A. T., & Raedeke, T. D. (2006).
Effects of a classroom-based program on physical activity and on-task behavior.
Medicine & Science in Sports & Exercise, 38(12), 2086-2094.
McMorris, T., Sproule, J., Turner, A., & Hale, B. J. (2011). Acute, intermediate intensity
exercise, and speed and accuracy in working memory tasks: A meta-analytical
comparison of effects. Physiological Behavior, 102(3-4), 421-428.
McNaughten, D., & Gabbard, C. (1993). Physical exertion and immediate mental performance of
sixth-grade children. Perceptual & Motor Skills, 77(3), 1155-1159.
Miller, G. (1995). How we think about cognition, emotion, and biology in psychopathology.
Psychophysiology, 33, 615-628.
Moriya, J. M., & Tanno, Y. (2009). Dysfunction of attentional networks for non-emotional
processing in negative affect. Cognition and Emotion, 23(6), 1090-1105.
Motl, O’Connor, & Dishman. (2003). Effects of cycling exercise on the soleus H-reflex and state
anxiety among men with low or high trait anxiety. Psychophysiology, 41(1), 96-105.
National Institute of Mental Health. (2008). The Numbers Count: Mental Disorders in America.
Online. Retrieved from http://www.nimh.nih.gov/health/publications/the-numbers-count-
mental-disorders-in-america/index.shtml#Anxiety
Owen, A. M., McMillan, K. M., Laird, A. R., & Bullmore, E. (2005). N-back working memory
paradigm: A meta-analysis of normative functional neuroimaging studies. Human Brain
Mapping, 25(46), 46-59.
PAR-10-137: Behavioral and Social Science Research on Understanding and Reducing Health
Disparities (R21). Retrieved from http://grants.nih.gov/grants/guide/pa-files/PAR-10-
137.html#SectionIV1

133
Parvomedics TrueOne 2400. Sandy, UT, USA
Pellegrini, R. J., Hicks, R. A., & Lopez, J. C. (2008). Is there a multiple chance effect in human
performance? A preliminary study of expected opportunity. Current Research in Social
Psychology, 13(13), 154-160.
Peterson, P. (1977). Interactive effects of student anxiety, achievement orientation, and teach
behavior on student achievement and attitude. Journal of Educational Psychology, 69(6),
779-792.
Petruzzello, S. J. (1995). Anxiety reduction following exercise: Methodological artifact or "real"
phenomenon? Journal of Sport and Exercise Psychology, 17, 105-111.
Petruzzello, S. J., Landers, D. M., Hatfield, B. D., Kubitz, K. A., & Salazar, W. (1991). A
Meta-analysis on the anxiety-reducing effects of acute and chronic exercise. Sports
Medicine, 11(3), 143-182.
Polar Electro. Polar Heart Rate Monitor, model Vantage XL, Finland. Copyright © Polar Electro
Oy 2010. Retrieved from http://www.polar.fi/en
Pontifex, M. B., Hillman, C. H., Fernhall, B., Thompson, K. M., & Valentini, T. A. (2009). The
effect of acute aerobic and resistance exercise on working memory. Medicine & Science
in Sports & Exercise, 41(4), 927-934.
Post, D. (2003). CASE TEACHING NOTES for The 2000 Meter Row: A Case Study in
Performance Anxiety. Retrieved on May 5, 2010 from
http://www.sciencecases.org/crew_anxiety/crew_anxiety_notes.asp Predicting your cardiorespiratory fitness level. (2007, July 27). McKinley Health Center. © The
Board of Trustees of the University of Illinois. Retrieved from
http://www.mckinley.illinois.edu/handouts/pdfs/cardiorespiratory_fitness.pdf

134
Raglin, J. S., & Wilson, M. (1996). State anxiety following 20 minutes of bicycle ergometer
exercise at selected intensities. International Journal of Sports Medicine, 17(6), 467-
471.
Ross, D. B., & Driscoll, R. 2006. Test Anxiety: Age Appropriate Interventions. Presentation
made at the American Counseling Association Southern Region Leadership Conference:
October 26th, 2006 in Huntsville, Alabama .
Sedlock, D. A., & Duda, J. L. (1994). The effect of trait anxiety and fitness level on heart rate
and state anxiety responses to a mental arithmetic stressor among college-age women.
International Journal of Sport Psychology, 25(2), 218-229.
Shobe, E., Brewin, A., & Carmack, S. (2005). A simple visualization exercise for reducing test
anxiety and improving performance on difficult math tests. Journal of Worry and
Affective Experience, 1(1), 34-52.
Slosman et al. (2004). Negative neurofunctional effects of frequency, depth, and environment in
recreational scuba diving: the Geneva “memory dive” study. British Journal of Sports
Medicine, 38, 108-114.
Sorg, B. A., & Whitney, P. (1992). The effect of trait anxiety and situational stress on working
memory capacity. Journal of Research in Personality, 26(3), 235-241.
Spielberger, C. D. (1983). Manual for the State-Trait Anxiety Inventory (Form Y). Palo Alto, CA:
Consulting Psychologists Press.
Spirduso, W. W. (2009). The influence of exercise on cognition in older adults. Revista de
Investigacion en Educacion, 6, 195-198.
Spirduso, W. W., Poon, L. W., & Chodzko-Zajko, W. (2008). Exercise and its mediating effects
on cognition. Champaign, IL: Human Kinetics.
135
Steptoe, A., Edwards, S., Moses, J., & Mathews, A. (1989). The effects of exercise training on
mood and perceived coping ability in anxious adults from the general population. Journal
of Psychometric Research, 33(5), 537-547.
Stroth, S., Kubesch, S., Dieterle, K., Ruchsow, M., Heim, R., & Keifer, M. (2009). Physical
fitness, but not acute exercise modulates event-related potential indices for executive
control in healthy adolescents. Brain Research, 1269, 114-124.
Surgeon General, 2000. http://www.surgeongeneral.gov/library/mentalhealth/chapter4/sec2.html
Takezawa, T., & Miyatani, M. (2005, October). Quantitative relation between conflict and
response inhibition in the Flanker task. Psychological Reports, 97(2), 515-526.
Themanson, J. R., & Hillman, C. H. (2006). Cardiorespiratory fitness and acute aerobic
exercise effects on neuroelectric and behavioral measures of action monitoring.
Neuroscience, 141, 757-767.
Tomporowski, P. D. (2003). Effects of acute bouts of exercise on cognition. Acta Pscyhologica,
112(3), 297-324.
Trudeau, F., & Shephard, R. J. (2008). Physical education, school physical activity, school sports
and academic performance. International Journal of Behavioral Nutrition and Physical
Activity, 5(10), 1-12.
Wine, J. (1971). Test anxiety and direction of attention. Psychological Bulletin, 76(2), 92-104.

136
Appendix A: Informed Consent Document
The Informed Consent Document contains the information about the study and risks, benefits,
and rights of participants. It may be found in a supplemental file named ICD.pdf.

137
Appendix B: Flyer
The Flyer was passed out and hung on bulletin boards during participant recruitment and can be
found in a supplemental file named flyer.pdf.

138
Appendix C: Mass e-mail
The Mass e-mail was sent out to various departmental advisors on campus during participant
recruitment and can be found in a supplemental file named email.pdf.

139
Appendix D: Physical Activity Readiness-Questionnaire (PAR-Q)
The PAR-Q was a questionnaire used to determine eligibility and safety of the participants in the
study and can be found in a supplemental file named PAR-Q.pdf.

140
Appendix E: Health & Physical Activity History Inventory
The Health & Physical Activity History Inventory was a questionnaire used to collect data from
the participants in the study and can be found in a supplemental file named HPAHI.pdf.

141
Appendix F: Feeling Scale (FS)
The Feeling Scale was a scale used to assess how participants were feeling during exercise and
rest and can be found in the middle column of a supplemental file named FS.pdf.

142
Appendix G: Felt Arousal Scale (FAS)
The Felt Arousal Scale was a scale used to determine how aroused participants were during the
study and can be found in the right column of a supplemental file named FAS.pdf.
143
Appendix H: Preference and Tolerance for Intensity of Exercise Questionnaire
(PRETIE-Q)
The PRETIE-Q was a questionnaire used to determine participants’ exercise habits and can be
found in a supplemental file named PRETIE-Q.pdf.

144
Appendix I: Rating of Perceived Exertion (RPE) Scale
The Rating of Perceived Exertion Scale was a used to determine how hard participants felt that
they were working during the study and can be found in the left column of a supplemental file
named RPE.pdf.

145
Appendix J: State Anxiety Inventory (SAI)
The State Anxiety Inventory was a questionnaire used to assess state anxiety during the study
and can be found in a supplemental file named SAI.pdf.

146
Appendix K: Trait Anxiety Inventory (TAI)
The Trait Anxiety Inventory was a questionnaire used to assess trait anxiety at the beginning of
the study and can be found in a supplemental file named TAI.pdf.
147
Appendix L: Modified Flanker Task (Image & Instructions)
The Modified Flanker Task was used as a cognitive measure in the study. The Image was shown
to participants to explain the task. The Instructions were used to describe the task. All can be
found in supplemental file Flanker.pdf.

148
Appendix M: N-back Task (Image & Instructions)
The N-back Task was used as a cognitive measure in the study. The Image was shown to
participants to explain the task. The Instructions were used to describe the task. All can be found
in supplemental file Nback.pdf.

149
Appendix N: Practice Reading Scholastic Aptitude Test (SAT) (Versions 1 & 2)
The Practice Reading SAT test was used as a measure of academic performance in the study.
Versions 1 and 2 can be found in supplemental file Read.pdf.

150
Appendix O: Practice Math Scholastic Aptitude Test (SAT) (Versions 1 & 2)
The Practice Math SAT test was used as a measure of academic performance in the study.
Versions 1 and 2 can be found in supplemental file Math.pdf.


