EFFECTS OF COLLARS ON LOCAL SCOUR AROUND SEMI-CIRCULAR END BRIDGE ABUTMENTS
A THESIS SUBMITTED TO THE GRADUATE SCHOOL OF NATURAL AND APPLIED SCIENCES
OF MIDDLE EAST TECHNICAL UNIVERSITY
BY
SÜEYLA DAŞKIN
IN PARTIAL FULFILLMENT OF THE REQUIREMENTS FOR
THE DEGREE OF MASTER OF SCIENCE IN
CIVIL ENGINEERING
JUNE 2011

Approval of the thesis:
EFFECTS OF COLLARS ON LOCAL SCOUR AROUND SEMI-CIRCULAR END BRIDGE ABUTMENTS
submitted by SÜEYLA DAŞKIN in partial fulfillment of the requirements for the degree of Master of Science in Civil Engineering Department, Middle East Technical University by, Prof. Dr. Canan Özgen _____________________ Dean, Graduate School of Natural and Applied Sciences Prof. Dr. Güney Özcebe _____________________ Head of Department, Civil Engineering Prof. Dr. Mustafa Göğüş _____________________ Supervisor, Civil Engineering Department, METU Examining Committee Members: Prof. Dr. Nevzat Yıldırım _____________________ Civil Engineering Dept., GAZI UNI. Prof. Dr. Mustafa Göğüş _____________________ Civil Engineering Dept., METU Assoc. Prof. Dr. Burcu Altan Sakarya _____________________ Civil Engineering Dept., METU Assoc. Prof. Dr. M. Ali Kökpınar _____________________ Technical Research and Quality Control Dept., DSI Assist. Prof. Dr. Mete Köken _____________________ Civil Engineering Dept., METU
Date: 13.06.2011

I hereby declare that all information in this document has been obtained and presented in accordance with academic rules and ethical conduct. I also declare that, as required by these rules and conduct, I have fully cited and referenced all material and results that are not original to this work.
Name, Last name : Süeyla DAŞKIN
Signature :
iii

ABSTRACT
EFFECTS OF COLLARS ON LOCAL SCOUR AROUND SEMI-CIRCULAR END BRIDGE ABUTMENTS
Daşkın, Süeyla
M.Sc., Department of Civil Engineering
Supervisor: Prof. Dr. Mustafa Göğüş
June 2011, 73 Pages
During severe floods, bed material around bridge piers and abutments are scoured by
the flow and as a result, bridges are subject to damages. These damages are mostly
unrepairable and can result in loss of lives and property. In this thesis study,
abutment scour under clear-water condition was investigated and collars were tested
as scour countermeasures around the abutments. The experimental study was carried
out in a rectangular channel with an almost uniform cohesionless bed material of
d50=1.50 mm for a test period of 3-hours. The channel was 28.5 m long and 1.5 m
wide. The erodible bed material was placed into the test section that was 5.8 m long
and 0.48 m deep.
For this thesis study, 60 experiments were carried out with and without various
collars placed at different elevations around the abutments. The scour formation
around the abutments with collars was observed and scour reduction efficiencies of
the collars were studied. Experiment results were compared with the previous studies
of Doğan (2008) and Kayatürk (2005) in terms of sediment size, abutment shape and
flow depth, and the effects of these factors on collar's scour reduction efficiency were
studied. Based on the results of the experimental studies, it was observed that scour
depths decreased as the collar width increased and the collar placed deeper into the
sediment bed for a given abutment length. When the present study and the previous
iv

studies were compared, it was observed that sediment size and flow depth had no
significant effect on the scour reduction performances of the collars.
Keywords: Scour, Semi-circular End Bridge Abutments, Collar, Scour
Countermeasures
v

ÖZ
KÖPRÜ KENAR AYAKLARINA YERLEŞTİRİLEN PLAKALARIN YARI
DAİRESEL KENAR AYAKLAR ETRAFINDAKİ YEREL OYULMAYA
ETKİSİ
Daşkın, Süeyla
Yüksek Lisans, İnşaat Mühendisliği Bölümü
Tez Yöneticisi: Prof. Dr. Mustafa Göğüş
Haziran 2011, 73 Sayfa
Büyük taşkınlar sırasında köprü orta ve kenar ayakları etrafındaki yatak malzemesi
aşınmakta ve köprüler zarar görmektedir. Bu hasarlar çoğu zaman onarılamaz
boyutlara ulaşabilmekte, sonuç olarak can ve mal kayıplarına neden olabilmektedir.
Bu tez çalışmasında, temiz su oyulması koşulu altında köprü kenar ayakları etrafında
oluşan oyulmalar ve bu oyulma derinliklerinin azaltılması için yerleştirilen plakalar
incelenmiştir. Deneyler, dikdörtgen bir kanalda, d50=1.50 mm olan oldukça üniform
ve kohezyonsuz yatak malzemesi kullanılarak 3’er saatlik periyotlarla yapılmıştır.
Kanal yapısı, 28.5 m uzunluğunda ve 1.5 m genişliğindedir. Kanalda deneylerin
yapıldığı kısım, 5.8 m uzunluğunda olup, 0.48 m derinliğinde oyulabilir yatak
malzemesi ile doldurulmuştur.
Bu tez çalışması için 60 deney yapılmış olup, deneylerde köprü kenar ayakları,
etraflarına plaka yerleştirilmeden; daha sonra ise değişik boyutlarda farklı
derinliklerde plakalar yerleştirilerek test edilmiştir. Plakalar yerleştirildiğinde, kenar
ayaklar etrafındaki oyulmaların formasyonları değerlendirilerek, plakaların verimleri
gözlemlenmiştir. Deney sonuçları, Doğan’ın (2008) ve Kayatürk’ün (2005) deneysel
vi
çalışmaları ile sediment tane büyüklüğü, kenar ayak şekli ve su derinliği açısından
kıyaslanmış, bu etmenlerin yatay plakaların oyulmaya karşı gösterdiği davranışlar
üzerindeki etkisi incelenmiştir. Deneyler sonucunda, kenar ayak boyu sabit tutulup
plaka genişliği arttıkça ve plaka daha derinlere yerleştirildikçe oyulma derinliğinde
azalma olduğu gözlenmiştir. Mevcut tez çalışması önceki iki çalışma ile
kıyaslanırken, sediment çapının ve su derinliğinin, plakaların oyulma derinliğini
azaltma performansları üzerinde kayda değer bir etkisi olmadığı sonucuna
varılmıştır.
Anahtar Kelimeler: Oyulma, Yarı Dairesel Köprü Kenar Ayakları, Plakalar, Oyulma
Tedbirleri
vii

TO MY FAMILY ...
viii

ACKNOWLEDGEMENTS
This study was suggested and has been completed under the supervision of Prof. Dr.
Mustafa Göğüş in the Hydromechanics Laboratory at Middle East Technical
University (METU) in Ankara, Turkey.
I would like to express my sincerest gratitude and appreciation to my supervisor
Prof. Dr. Mustafa Göğüş and Assist. Prof. Dr. Mete Köken for their invaluable
guidance, advice and encouragement throughout my whole thesis study.
I would also like to thank the Hydromechanics Laboratory staff for their help during
the experimental part of my thesis study.
I would like to express my sincere appreciation to my managers at Hidro Dizayn
Engineering for their patience and support during my studies.
Most importantly, I would like to thank my parents and my sister, Hülya Daşkın, for
their love, understanding, patience, trust and invaluable support throughout my
whole life.
ix
TABLE OF CONTENTS
ABSTRACT.......................................................................................................... IV
ÖZ .........................................................................................................................VI
DEDICATION ......................................................................................................VIII
ACKNOWLEDGEMENTS .................................................................................. IX
TABLE OF CONTENTS......................................................................................X
LIST OF TABLES ................................................................................................XII
LIST OF FIGURES ..............................................................................................XIII
LIST OF SYMBOLS ............................................................................................XV
CHAPTERS
1. INTRODUCTION ...................................................................................1
1.1 GENERAL REMARKS....................................................................1
1.2 OBJECTIVES and SCOPE...............................................................2
1.3 SYNOPSIS OF THE THESIS ..........................................................2
2. BRIDGE ABUTMENT SCOUR.............................................................4
2.1 INTRODUCTION ............................................................................4
2.2 BRIDGE ABUTMENT SCOUR MECHANISM.............................4
2.3 PARAMETERS INFLUENCING LOCAL SCOUR AT
ABUTMENTS ........................................................................................7
2.3.1 Time Evolution.....................................................................9
2.3.2 The Effect of Flow Velocity.................................................11
2.3.3 The Effect of Flow Depth.....................................................11
2.3.4 The Effect of Sediment Size.................................................12
2.3.5 The Effect of Sediment Gradation........................................13
2.3.6 The Effect of Abutment Length ...........................................13
2.3.7 The Effect of Abutment Shape .............................................14
2.3.8 The Effect of Abutment Skewness .......................................15
2.4 CLOSURE ........................................................................................16
3. BRIDGE ABUTMENT SCOUR COUNTERMEASURES....................17
x

3.1 GENERAL REMARKS....................................................................17
3.2 COUNTERMEASURE CONCEPTS ...............................................18
3.3 ABUTMENT SCOUR COUNTERMEASURES.............................19
3.4 CONCLUSION.................................................................................21
4. EXPERIMENTAL SETUP .....................................................................22
4.1 THE FLUME ....................................................................................22
4.2 THE ABUTMENT MODEL ............................................................24
4.3 SAND MATERIAL..........................................................................27
4.4 U/Uc RATIO .....................................................................................27
4.5 MEASUREMENT AND DEVICE...................................................27
5. APPLICATION OF COLLAR TO CONTROL SCOURING AROUND
ABUTMENTS.............................................................................................29
5.1 GENERAL........................................................................................29
5.2 LITERATURE REVIEW .................................................................29
5.3 DIMENSIONAL ANALYSIS ..........................................................32
5.4 EXPERIMENTAL PROCEDURE ...................................................33
5.5 SCOUR MECHANISM....................................................................36
5.6 DISCUSSION OF RESULTS...........................................................36
5.6.1 Scour Profiles around the Abutment with and without
Collar .............................................................................................36
5.6.2 Maximum Scour Reduction around the Abutments with
Collars............................................................................................46
5.7 SUMMARY, CONCLUSIONS and RECOMMENDATIONS .......62
5.7.1 Summary...............................................................................62
5.7.2 Conclusions ..........................................................................62
5.7.3 Recommendations ................................................................64
REFERENCES......................................................................................................66
APPENDIX...........................................................................................................73
xi
LIST OF TABLES
TABLES
Table 2.1 Parameters influencing local scour around abutments..........................8
Table 2.2 Abutment shape factors (Barbhuiya and Dey, 2004)............................14
Table 3.1 Advantages and disadvantages of various countermeasures (Handbook of
Scour Countermeasures Designs, FHWA NJ, 2005) ............................................19
Table 5.1 Abutment and collar sizes used in the tests...........................................35
Table 5.2 Experimental data for Q=0.0678 m3/s, y=13.5 cm and Ba=10 cm........38
Table 5.3 Optimum design parameters of an abutment-collar arrangement.........51
Table 5.4 Some of the important parameters of abutment, flow and sediment used in
the Present, Doğan’s and Kayatürk’s studies .......................................................63
Table A.1 Sample data obtained to draw 3-D views of scour formation around the
abutment of La=20 cm with collar of Bc=5 cm at Zc/y=0 .....................................73
xii

LIST OF FIGURES
FIGURES
Figure 2.1 General view of the abutment scour (after Kwan, 1984).....................6
Figure 2.2 General view of the scour hole around a semi-circular end abutment
tested in this study...............................................................................6
Figure 2.3 Time development of clear-water and live-bed scour (after Chabert &
Engeldinger, 1956)..............................................................................10
Figure 2.4 Abutment skewness angle ...................................................................15
Figure 4.1 Side view of the experimental setup....................................................23
Figure 4.2 Abutment La=20 cm with collar Bc=10 cm at Zc/y=-0.25 ...................24
Figure 4.3 Abutment La=25 cm without collar .....................................................25
Figure 4.4 Abutment La=25 cm with collar Bc=5 cm at Zc/y=0 ...........................25
Figure 4.5 Abutment La=25 cm with collar Bc=7.5 cm at Zc/y=-0.25 ..................26
Figure 4.6 Abutment La=30 cm with collar Bc=5 cm at Zc/y=-0.50 .....................26
Figure 4.7 Acoustic device used in the experiments.............................................28
Figure 5.1 Definition sketch of the collar-abutment arrangement ........................32
Figure 5.2 3-D views of the scour and deposition pattern around La=20 cm.......40-42
xiii

Figure 5.3 3-D views of the scour and deposition pattern around La=35 cm.......43-45
Figure 5.4 Effect of collar size and elevation on the maximum scour depth around the
abutments of various lengths (Q=0.0678 m3/s, y=13.5 cm, d50 = 1.50 mm)
------------- .............................................................................................................47
Figure 5.5 Effect of collar size and elevation on the maximum scour depth around the
abutments of various lengths (Q=0.017 m3/s, y= 4.25 cm, d50 = 0.90 mm)
(Doğan, 2008) .....................................................................................48
Figure 5.6 Effect of collar size and elevation on the maximum scour depth around the
abutments of various lengths (Q=0.050 m3/s, y = 10 cm, d50 = 1.48 mm)
(Kayatürk, 2005) .................................................................................49
Figure 5.7 Variation of [(ds)max,c / y]opt with θ (Q=0.0678 m3/s, y=13.5 cm, Fr=0.29,
U/Uc=0.90, d50 = 1.50 mm, t=3 hrs).....................................................53
Figure 5.8 Variation of [(ds)max,c / y]opt with θ (Q=0.017 m3/s, y=4.25 cm, Fr=0.41,
U*/U*c=0.90, d50 = 0.90 mm, t=6 hrs) (Doğan, 2008)..........................54
Figure 5.9 Variation of [(ds)max,c / y]opt with θ (Q=0.050 m3/s, y=10 cm, Fr=0.34,
U*/U*c=0.90, d50 = 1.48 mm, t=6 hrs) (Kayatürk, 2005) .....................55
Figure 5.10 Variation of [(ds)max,c / y]opt with )B/L( caθ ..................................58
Figure 5.11 Variation of [Zc/y]opt with La/Bc........................................................59
Figure 5.12 Variation of [%Reduction]opt with La/Bc...........................................61
xiv

LIST OF SYMBOLS
Atotal Total area of the abutment with collar
Aabutment Abutment area on the horizontal plane
B Channel width
Ba Abutment width
Bc Collar width around the abutment
Bt Total width of the abutment width and collar width on
horizontal
C Cohesiveness
Cu Uniformity coefficient
ds Local scour depth at the abutment at any time
(ds)max Maximum scour depth at the abutment at the end of the
given time duration
(ds)max,c Maximum scour depth at the abutment with collar
d50 Median size of sediment
d84 Sediment size for which 84 % of the sediment finer
d60 Sediment size for which 60 % of the sediment finer
d16 Sediment size for which 16 % of the sediment finer
d10 Sediment size for which 10 % of the sediment finer
Fr Froude number of flow
g Gravitational acceleration
Ka Shape factor of abutment
KG Approach channel geometry factor
La Projecting length of abutment, perpendicular to the flow
Lc Projecting length of collar, perpendicular to the flow
R2 Correlation coefficient
Re* Particle Reynolds number
Q Discharge of the flow
S0 Slope of the channel
Se Energy slope of flow
xv

Sp Particle shape factor
Ss Specific gravity
Tc Collar thickness
t Time
U Mean approach flow velocity
Uc The value of the U at the threshold of grain motion
U* Shear velocity of the approach flow
U*c The value of the U* at the threshold of grain motion
y Normal flow depth
yc Critical flow depth at the threshold of grain motion
w Sediment fall velocity
Zc Collar level on the abutment with reference to bed level
θ Ratio of total area of the abutment and collar to the
abutment area on horizontal plane
αa Abutment skewness
αc Shield’s entrainment factor, dimensionless critical shear
factor
σg Standard deviation of particle–size distribution
φ Angle of repose
ρ Fluid density
ρs Sediment density
μ Dynamic viscosity of fluid
τ0 Bed shear stress
τc Critical shear stress for sediment particles to move
xvi
CHAPTER 1
INTRODUCTION
1.1 GENERAL REMARKS
Human has tried to bridge flowing waters in order to enhance the ability to
manipulate resources in the adjoining shores since ancient times. Technical
knowledge is required to design and construct a structure across a river.
Therefore, it is often required to place vertical columns and piers in riverbed to
support the load of the bridge structure in order that bending moments and shear
forces acting on the bridge to be reduced. However, in the effort to reduce these
forces, bridge piers and abutments unknowingly pose a different and serious
challenge for engineers even in today’s conditions (Chiew, 2008). The citation
by Neill (1973) stating, “man who overlooks water under bridge will find bridge
under water”, compactly describes the danger enforced on bridges when there is
an interaction between the flow-structure and the erodible bed on which the
bridge is founded (Chiew, 2008).
The term “scour” becomes more significant for bridges when this interaction
between the flow and erodible bed is considered since scour phenomenon is the
result of the erosive action of flowing water, excavating and carrying away
material from the bed and banks of streams (Li, Kuhnle and Barkdoll, 2006).
Scour failures have a tendency to occur suddenly without prior warning and also
monitoring these failures is very difficult during flood events. Bridge
replacement costs, widespread economic interruption on transportation and even
the loss of life assigned to bridge failures resulted from foundation scour during
1

hydrologic events have been widely documented (Stamey, 1996, Parola et al.,
1998, Morris and Pagan-Ortiz, 1999, Richardson and Davis, 2001).
Among the large number of bridge failures recorded, one of the main causes
was abutment scour during flood events (Melville, 1992, Richardson and
Richardson, 1993). Although, researches showed that one of the main reasons is
abutment scour, it has received less attention when compared to pier scour
(M. M. Abou Seida et. al., 2009). For that reason, abutment scour and especially
countermeasures for this type of scour should be researched and studied to
understand its mechanism and to minimize the damages that come forth.
1.2 OBJECTIVES and SCOPE
The primary objective of this thesis study is to investigate the effects of collars with
different sizes that are placed at various elevations around semi-circular end
abutments, on the reduction of local scour at the base of abutments. A series of
experiments were conducted at the laboratory under clear-water flow conditions with
semi-circular end abutments and collars of various sizes and at various depths using
almost uniform sand of d50=1.50 mm. In comparison with the thesis studies of
Kayatürk (2005) and Doğan (2008), the abutment shape, the depth of the flow and
the grain size of the uniform cohesionless bed material are altered to observe whether
the results are in accordance with each other. In the discussion part, the results
obtained from the above mentioned thesis studies and this one to be compared and
interpreted.
1.3 SYNOPSIS OF THE THESIS
The information about bridge abutment scour is presented and the literature is
reviewed in Chapter 2. The countermeasures to protect bridge abutments from scour
2
are described and the related previous studies are also mentioned in Chapter 3. In
Chapter 4, the experimental setup and the model are illustrated. Chapter 5 presents
the experimental results and conclusions drawn from the experiments. In Chapter 5,
the present study is compared with the previous studies of Doğan (2008) and
Kayatürk (2005), and recommendations are given based on the studied conditions.
3
CHAPTER 2
BRIDGE ABUTMENT SCOUR
2.1 INTRODUCTION
As mentioned in Chapter 1, abutment scour appears to be the primary reason for
bridge failures and potential catastrophic results; such that abutment damages can
cause excessive scour resulting in bridge failures and consequently potential loss of
lives (Li, Kuhnle and Barkdoll, 2006). Accordingly, it is critical to understand scour
mechanism and effective parameters on local scour at bridge abutments. Therefore,
before considering any countermeasures, mechanism and parameters will be
investigated fundamentally in this chapter.
2.2 BRIDGE ABUTMENT SCOUR MECHANISM
In a river, bridge abutments disturb the flow by protruding into the main channel or
into the floodplain and as a result causing the river flow to accelerate and separate at
the upstream face of the abutment while passing the bridge abutment (M. M. Abou
Seida et. al., 2009). According to Kwan (1988), the flow around abutments is a
complex system of vortices, namely downflow vortex, primary vortex, secondary
vortices and wake vortices (Papanicolaou et. al., 2004). When flow encounters the
frontal face of the abutment, it is forced downward towards the sediment bed in a jet
motion that is impinging on the bed. On the other hand, the primary vortex is formed
resulting from that downflow is further deflected up parallel to the bottom surface of
the abutment. In addition, the primary vortex is pushed around the tip of the
abutment along the bed surface in a continuation of scour formation. According to
4
Papanicolaou and Hilldale (2002), these frontal vortices (downflow vortex and
primary vortex) are then coupled with secondary vortices resulted from flow
constriction due to the existence of the abutment and finally, wake vortices formed at
the downstream end of the abutment due to the flow separation. Boundaries of the
stagnant wake region are defined by the secondary and wake vortices (Papanicolaou
et. al., 2004). As the strength of the primary vortex and downward flow increase,
the size and depth of the scour hole increase due to erosion and removal of more
sediment particles from the scour hole. Until the equilibrium condition is
reached, the condition that sediments inside the scour hole can no longer be
moved by the flow field and bottom shear stress, the scour hole deepens and
enlarges. In equilibrium condition for clear-water scour, there is no change in
the scour pattern with time; however, for live-bed scour case, the scour pattern
may vary with time due to the continuous supply of sediment into the scour
hole. However, in general, the scour shape around the abutments can be defined
as an inverted cone with some formations of secondary groove in the river bed
resulting from secondary vortices (M. M. Abou Seida et. al., 2009). Below, the
abutment scour parameters and an experiment photograph of this study are
shown in Figures 2.1 and 2.2 accordingly.
5

Figure 2.1 General view of the abutment scour (after Kwan, 1984)
Figure 2.2 General view of the scour hole around a semi-circular end abutment
tested in this study
6

2.3 PARAMETERS INFLUENCING LOCAL SCOUR AT ABUTMENTS
In general, the local scour around an abutment is affected by the following
parameters; fluid, flow, channel geometry, bed material, abutment geometry
parameters and time (independent variable). These parameters and the related items
are listed below:
1. Fluid parameters: density, viscosity and temperature.
2. Approaching flow parameters: mean flow velocity, flow depth, shear velocity,
roughness and gravitational acceleration.
3. Channel geometry parameters: width, cross-sectional shape and slope.
4. Bed material (sediment) parameters: median size, grain size distribution, mass
density, angle of repose and cohesiveness.
5. Abutment geometry parameters: size, shape, orientation with respect to the main
flow and surface condition.
6. Time of scouring can be regarded as an independent parameter for the developing
scour hole.
A list of the commonly used parameters is given in Table 2.1, usually the same
parameters are identified affecting the scour depth at an abutment in different non-
dimensional forms (Li, Kuhnle and Barkdoll, 2006).
7
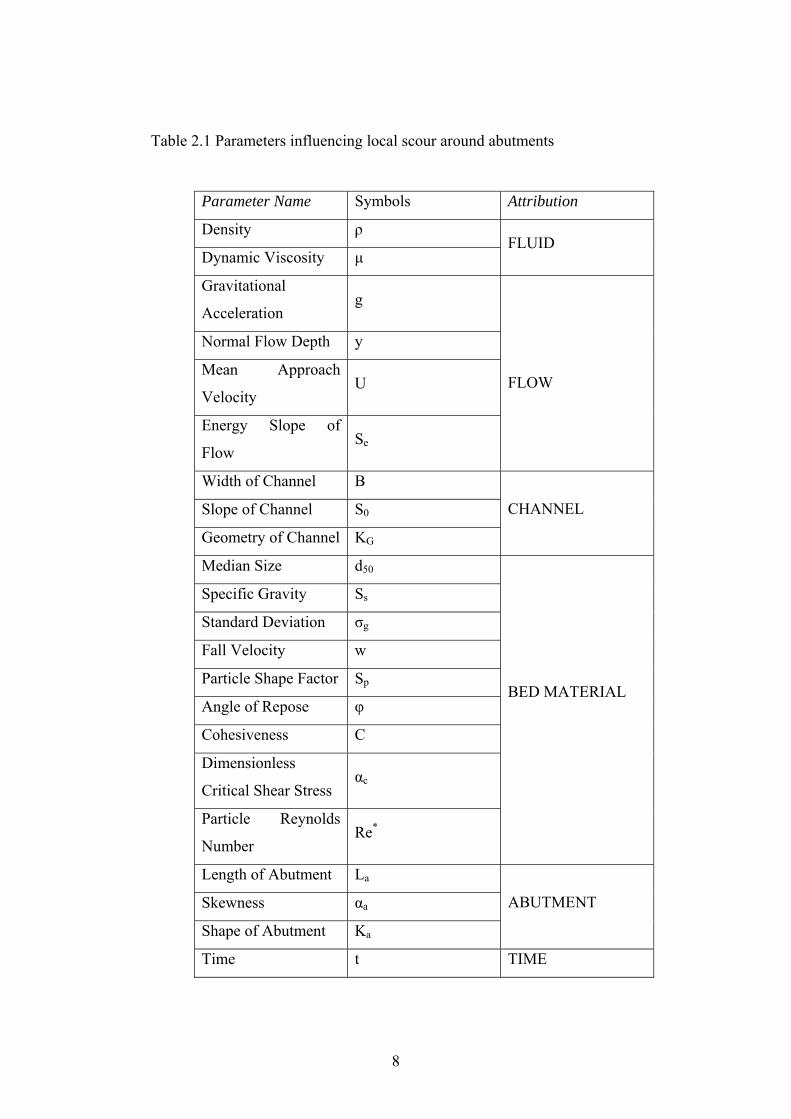
Table 2.1 Parameters influencing local scour around abutments
Parameter Name Symbols Attribution
Density ρ
Dynamic Viscosity μ FLUID
Gravitational
Acceleration g
Normal Flow Depth y
Mean Approach
Velocity U
Energy Slope of
Flow Se
FLOW
Width of Channel B
Slope of Channel S0
Geometry of Channel KG
CHANNEL
Median Size d50
Specific Gravity Ss
Standard Deviation σg
Fall Velocity w
Particle Shape Factor Sp
Angle of Repose φ
Cohesiveness C
Dimensionless
Critical Shear Stress αc
Particle Reynolds
Number Re*
BED MATERIAL
Length of Abutment La
Skewness αa
Shape of Abutment Ka
ABUTMENT
Time t TIME
8

The local scour depth (ds) around a bridge abutment can be written as:
ds = f [ρ, μ, y, U, Se, g, B, S0, KG, d50, Ss, σg, w, Sp, φ, C, αc, Re*, La, αa, Ka, t] (2.1)
Eliminating some of these parameters for the specific conditions and making the
remaining ones non-dimensional, the following parameters can be accepted as the
most important those influence the abutment scour (Li, Kuhnle and Barkdoll, 2006):
ds/L = f (t, U/Uc, La/d50, La/y, σg, Ka, Kg, αa) (2.2)
where Uc is the critical mean velocity at which initiation of particle motion starts at
the channel bed.
The countermeasures against abutment scour can be selected by making use of these
parameters but at the beginning of selection and design process, it is critical to
understand the variables and their relative effects. Therefore, in the following
sections, some of the variables are discussed in detail.
2.3.1 Time Evolution
In bridge foundation design stage, identifying the temporal change of the scour and
the time needed to reach the equilibrium state of scour is very helpful in obtaining
the maximum scour depth in order to avoid over-designs by knowing how much the
bridge foundations required to be protected from scour and to save the funds.
However, the equilibrium time reached in the laboratory conditions and real time for
a design flood do not precisely match with and also estimating the time needed for
the scour depth to reach its maxima is difficult (Doğan, 2008).
Scour time evolution curve might be used to predict the scour depth at a certain
moment of a flood hydrograph (Li, Kuhnle and Barkdoll, 2006). A schematic
diagram of the time-variation of the scour depth at a cylindrical pier is shown on
Figure 2.3 (after Chabert & Engeldinger 1956).
9

Figure 2.3 Time development of clear-water and live-bed scour (after Chabert &
Engeldinger, 1956)
According to Figure 2.3, the clear-water scour depth reaches its maximum over a
longer period of time than prevailing for the live-bed condition. In addition, the
maximum depth of the local clear-water scour may not be reached until after several
floods (Richardson and Davis, 2001). According to Melville and Chiew (1999), the
time required for the equilibrium scour depth to develop increases rapidly with flow
velocity in clear-water flow conditions while it decreases rapidly for the live-bed
scour. It can take a very long time for the equilibrium scour hole to form due to the
fact that the equilibrium clear-water scour depth is reached asymptotically with time.
“Rouse (1965), Gill (1972), Rajaratnam & Nwachukwu (1983), Dargahi (1990),
Ettema (1980), Kohli & Hager (2001), Oliveto & Hager (2002) and Coleman et. al.
(2003) think that the variation of the scour depth with time is logarithmic. Ahmad
(1953), Franzetti et. al. (1982), Kandasamy (1989), Whitehouse (1997), Cardoso &
Bettess (1999) and Ballio & Orsi (2000) propose an exponential time-variation of the
scour; while Breusers (1967) and Cunha (1975) give a power law distribution”
(Barbhuiya and Dey, 2004).
10

2.3.2 The Effect of Flow Velocity
The ratio of the shear velocity (U*) to the critical shear velocity (U*c) represents the
term flow intensity. Flow intensity can also be defined as the ratio of the approach
mean velocity (U) to the critical mean velocity (Uc) due to the difficulty of
measuring the shear velocity under live-bed conditions (Melville and Chiew, 1999).
The local scour depth in uniformly-graded sediment increases almost linearly with
velocity to a maximum at the threshold velocity under clear-water flow conditions
(Melville and Coleman, 2000). When the ratio U*/U*c = 1, the maximum scour depth
is reached and the corresponding maximum scour depth is termed as the threshold
peak. As the velocity exceeds the threshold velocity, the local scour depth in uniform
sediment first decreases and then increases again to a second peak, but the threshold
peak is not exceeded provided that the sediment is uniform (P. D. Alabi, 2006).
An increasing trend in the relationship between scour depth and flow velocity was
indicated in the data of Dongol (1994). Chabert and Engeldinger (1956), Ettema
(1980), Raudkivi and Ettema (1983), Laursen and Toch (1956), Breusers et al.
(1977) and Chiew (1984) also observed the same trend. Generally, it was concluded
that for clear-water scour conditions the maximum local scour depth in uniform
sediments occurs at the threshold condition.
2.3.3 The Effect of Flow Depth
Abutment scour data obtained by Wong (1982), Tey (1984), Kwan (1988),
Kandasamy (1989) and Dongol (1994) showed a trend such that the scour depth at
abutment increases at a decreasing rate with flow depth. Barbhuiya & Dey (2004)
also reported that for smaller flow depths the equilibrium scour depth increases
significantly with increasing flow depth (y), on the other hand for higher flow depths,
equilibrium scour depth is independent of flow depth.
11

2.3.4 The Effect of Sediment Size
When considering the effects of the sediment size on the scour, the median sediment
diameter d50 and geometric standard deviation σg = (d84 / d16)0.5 of particle size
distribution are the two most commonly used parameters (Barbhuiya & Dey, 2004).
It is important to make a distinction between clear-water and live-bed scour for
studying the effect of sediment size on scour. Some early pier scour researchers
argued that there is no significant effect of sediment size on local scour under live-
bed conditions whereas some others proposed that the scour depth decreases with an
increase in the sediment size. On the other hand, considering clear-water flow
conditions, most studies have shown that sediment size has an effect on local scour
(Li, Kuhnle and Barkdoll, 2006).
In addition, the coefficient of uniformity, i.e., Cu = d60 / d10, is also a parameter used
to identify the uniformity of a sediment sample. Sediment mixture can be defined as
uniform when the value of Cu is less than 3.0 (Doğan, 2008).
Dongol (1994) used abutment length, La, and median sediment size, d50, with the
ratio of La / d50 term based on scour development to represent the sediment size
effect. There were four different values of La / d50 as follows: (1) La / d50 > 100: fine
sediment; (2) 100 > La / d50 > 40: intermediate sediment; (3) 40 > La / d50 > 10:
coarse sediment; (4) 10 > La / d50 : very coarse sediment (Li, Kuhnle and Barkdoll,
2006). For the case La / d50 > 50, the effect of La / d50 reduces on the scour
development that is valid for most of the actual prototype conditions. For grain sizes
with La / d50 < 50, the grains which obstruct the scouring process are large enough
when compared to the width of the groove excavated by downflow (Melville and
Coleman, 2000).
12

2.3.5 The Effect of Sediment Gradation
River bed materials are generally nonuniform. A measure of the nonuniformity of the
sediment is geometrical standard deviation σg (Li, Kuhnle and Barkdoll, 2006). For
the log-normally distributed sediment, σg is given by
9.15
1.84
dd
g =σ (2.3)
Clear-water or live-bed scour conditions have an influence on the effect of sediment
gradation on scour depth. It is found that under the similar flow conditions for
sediment with same d50, the development of the scour is less in nonuniform
sediments than in uniform sediments, i.e., the scour depth tends to decrease with
increasing value of σg due to formation of armour-layers in scour holes (Barbhuiya &
Dey, 2004). Ettema (1980), Wong (1982), Melville (1992) and Dongol (1994), Li,
Kuhnle and Barkdoll (2006) also observed that scour depth was decreasing gradually
with increasing σg; it is found that less scour is developed in nonuniform sediments
than in uniform sediments.
2.3.6 The Effect of Abutment Length
Abutment length and contraction ratio, termed as the inverse of the opening ratio
(Barbhuiya and Dey, 2004), are two important parameters that influence the scour
process and depth at an abutment. Various experimental data have shown that the
scour depth increases as the abutment length increases since the opening ratio
decreases when the length of the abutment is increased as Kandasamy mentioned in
1989.
13

2.3.7 The Effect of Abutment Shape
Depending on the shape of the abutment, the local scour magnitude at abutments
differs; such that, well streamlined bodies like semi-circular ended, spill-through and
wing-wall abutments produce low strength vortex that resulted from downflow and
secondary flow while sharp obstructions, e.g. vertical-wall abutments are capable of
producing strong vortex fields. Therefore, greater scour depths occur in the case of
sharp obstructions compared with the streamlined bodies (Barbhuiya and Dey, 2004,
Li, Kuhnle and Barkdoll, 2006). The effect of abutment shape on the local scour at
abutments has been of interest to researchers for a long time. In order to account for
the effect of shape of the abutments on the equilibrium scour depth, Melville (1992,
1995 and 1997) used shape factor Ks. Commonly used abutment shapes and
corresponding values of the shape factors are shown in Table 2.2 below:
Table 2.2 Abutment shape factors (Barbhuiya and Dey, 2004)
14
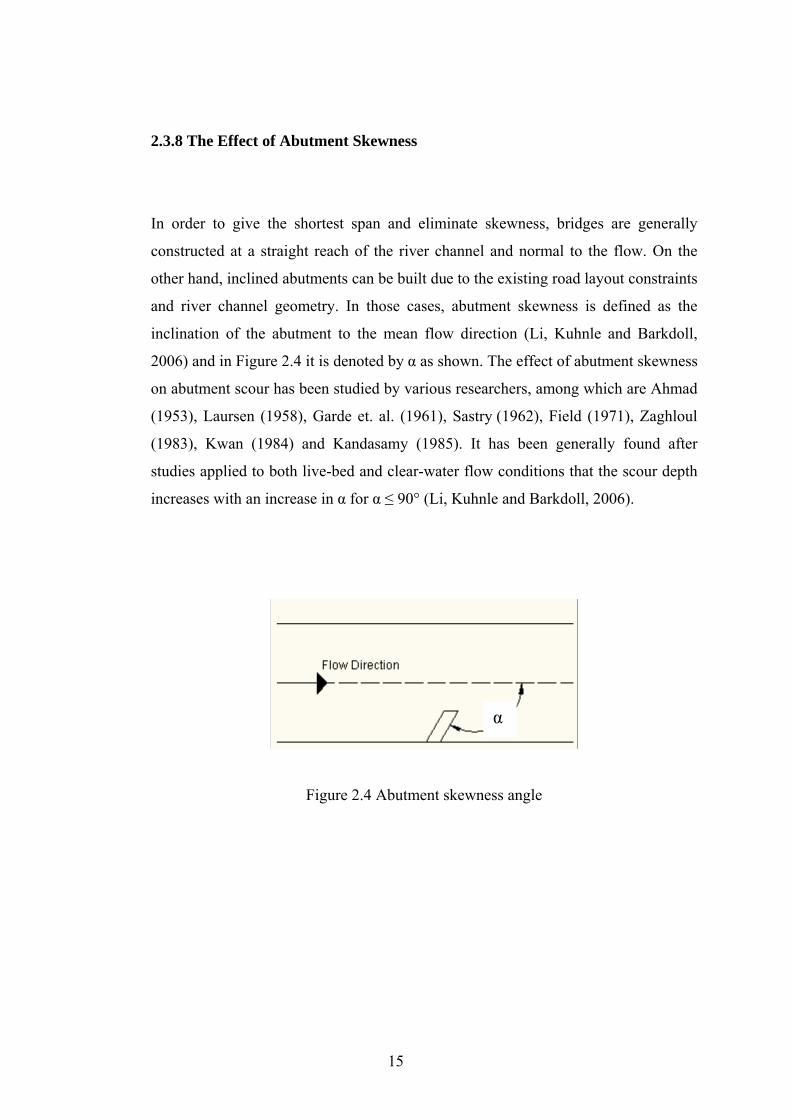
2.3.8 The Effect of Abutment Skewness
In order to give the shortest span and eliminate skewness, bridges are generally
constructed at a straight reach of the river channel and normal to the flow. On the
other hand, inclined abutments can be built due to the existing road layout constraints
and river channel geometry. In those cases, abutment skewness is defined as the
inclination of the abutment to the mean flow direction (Li, Kuhnle and Barkdoll,
2006) and in Figure 2.4 it is denoted by α as shown. The effect of abutment skewness
on abutment scour has been studied by various researchers, among which are Ahmad
(1953), Laursen (1958), Garde et. al. (1961), Sastry (1962), Field (1971), Zaghloul
(1983), Kwan (1984) and Kandasamy (1985). It has been generally found after
studies applied to both live-bed and clear-water flow conditions that the scour depth
increases with an increase in α for α ≤ 90° (Li, Kuhnle and Barkdoll, 2006).
Figure 2.4 Abutment skewness angle
α
15

2.4 CLOSURE
The local scour at bridge abutments is a complex phenomenon that involves numbers
of parameters. However, the basic mechanism of the abutment scour can be
summarized such that the downflow at the upstream face of an abutment and
associated primary vortex with the secondary and wake vortices erode the material
from the base region of the abutment and create local scour hole (Doğan, 2008). The
parameters affecting the scour phenomenon are listed and explained shortly within
this chapter.
16

CHAPTER 3
BRIDGE ABUTMENT SCOUR COUNTERMEASURES
3.1 GENERAL REMARKS
As mentioned in the previous chapters, bridge abutment scour is a common cause of
bridge failures that often result in excessive repairs, substantial traffic interruption,
loss of accessibility and sometimes loss of lives (Kayatürk, 2005). As a result, bridge
failures resulting from scour at bridge abutments have increased the researches and
studies in scour prediction and scour countermeasures. The main aim of the studies
related with the countermeasures against bridge abutment scour is to determine
design guidelines for countermeasures that are effective in preventing or reducing
local scour at the abutments so as for the bridges to be built in future and to save and
rehabilitate the existing bridges from scour failures (Li, Kuhnle and Barkdoll, 2006).
Several studies have investigated scour countermeasures for bridge abutments or
provided suggestions for the countermeasures. Notably, NCHRP, Report 587
“Countermeasures to Protect Bridge Abutments from Scour” and the FHWA
Hydraulic Engineering Circular No. 23 (HEC 23) “Bridge Scour And Stream
Instability Countermeasures Experience, Selection, and Design Guidance” (2001)
addresses various countermeasures. In addition, FHWA NJ’s “Handbook of Scour
Countermeasures Designs” Final Report in September 2005, defined a
countermeasure by HEC-23 as “a measure incorporated at a stream/bridge crossing
system to monitor, control, inhibit, change, delay, or minimize stream and bridge
stability problems and scour”. As can be understood from this definition, selection of
a countermeasure is directly dependent on the state of the problem.
17

In addition to determining the state of the problem, it is important to consider
limitations enforced by environmental regulation, relative cost, availability,
serviceability, constructability and design constraints while selecting the
countermeasures. The criteria for countermeasure selection usually include the set of
considerations below (NCHRP, Report 587, 2007):
• Technical effectiveness,
• Constructability,
• Durability and maintainability,
• Aesthetics and environmental issues,
• Cost.
In order to cope with the scour at bridge elements, firstly it is important to identify
the problem and set the conditions of the problematic area of the bridge site. Then,
selection of the countermeasure type can be made accordingly.
3.2 COUNTERMEASURE CONCEPTS
The primary concepts for abutment scour mitigation are bank hardening,
embankment stabilizing, and flow altering (NCHRP, Report 587, 2007).
Bank hardening countermeasures such as riprap, cable-tied blocks, geo-bags,
partially grouted riprap, and interlocking devices aim to armor or strengthen the
surface of a bank in order to resist the hydrodynamic forces resulted from flow
around an abutment. Embankment-stabilizing countermeasures increase the slope
stability of the earthfill embankment at an abutment so that the embankment does not
fail geotechnically when scour hole forms at the toe of the embankment. The aim of
flow-altering countermeasures is to reduce the stresses caused by flow on the bed and
banks such that the bed or bank material will not be eroded, e.g. spur dikes, stone
walls, collars, submerged vanes, and guidebanks. The detailed explanation and
presentation of these groups are given in NCHRP, Report 587 (2007).
18

3.3 ABUTMENT SCOUR COUNTERMEASURES
The abutment scour countermeasures, their advantages and disadvantages against
abutment scour are presented in Table 3.1.
Table 3.1 Advantages and disadvantages of various countermeasures (Handbook of
Scour Countermeasures Designs, FHWA NJ, 2005)
Countermeasure Advantages Disadvantages
Local Scour at Abutment
Peak Flood Closure Low initial cost Limits access, constant
monitoring
Monitoring Low initial cost Does not prevent scour
Riprap
Familiarity, relatively low
cost and maintenance, easy
to construct, ability to
adjust to minor scour
Can wash out, disturbs channel
ecosystem until vegetation
reestablished
Gabions Relatively low cost, ability
to adjust to minor scour
Can be undermined, stones can
wash out of wire mesh,
disturbs channel ecosystem
Cable-tied Blocks Will not wash out as easily More difficult to construct,
higher maintenance
Tile Mats Will not wash out as easily
More difficult to construct,
higher maintenance, easier for
water to lift
Alarm Systems Low initial cost Provides no scour protection,
must be checked periodically
19
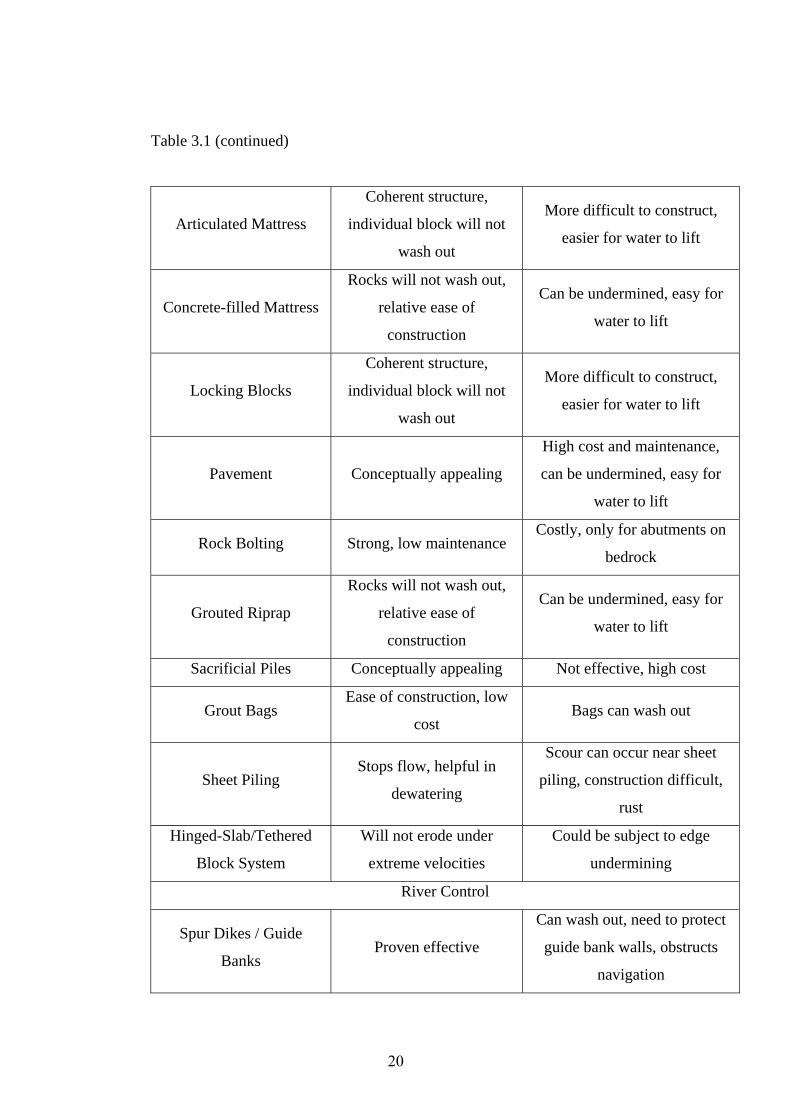
Table 3.1 (continued)
Articulated Mattress
Coherent structure,
individual block will not
wash out
More difficult to construct,
easier for water to lift
Concrete-filled Mattress
Rocks will not wash out,
relative ease of
construction
Can be undermined, easy for
water to lift
Locking Blocks
Coherent structure,
individual block will not
wash out
More difficult to construct,
easier for water to lift
Pavement Conceptually appealing
High cost and maintenance,
can be undermined, easy for
water to lift
Rock Bolting Strong, low maintenance Costly, only for abutments on
bedrock
Grouted Riprap
Rocks will not wash out,
relative ease of
construction
Can be undermined, easy for
water to lift
Sacrificial Piles Conceptually appealing Not effective, high cost
Grout Bags Ease of construction, low
cost Bags can wash out
Sheet Piling Stops flow, helpful in
dewatering
Scour can occur near sheet
piling, construction difficult,
rust
Hinged-Slab/Tethered
Block System
Will not erode under
extreme velocities
Could be subject to edge
undermining
River Control
Spur Dikes / Guide
Banks Proven effective
Can wash out, need to protect
guide bank walls, obstructs
navigation
20
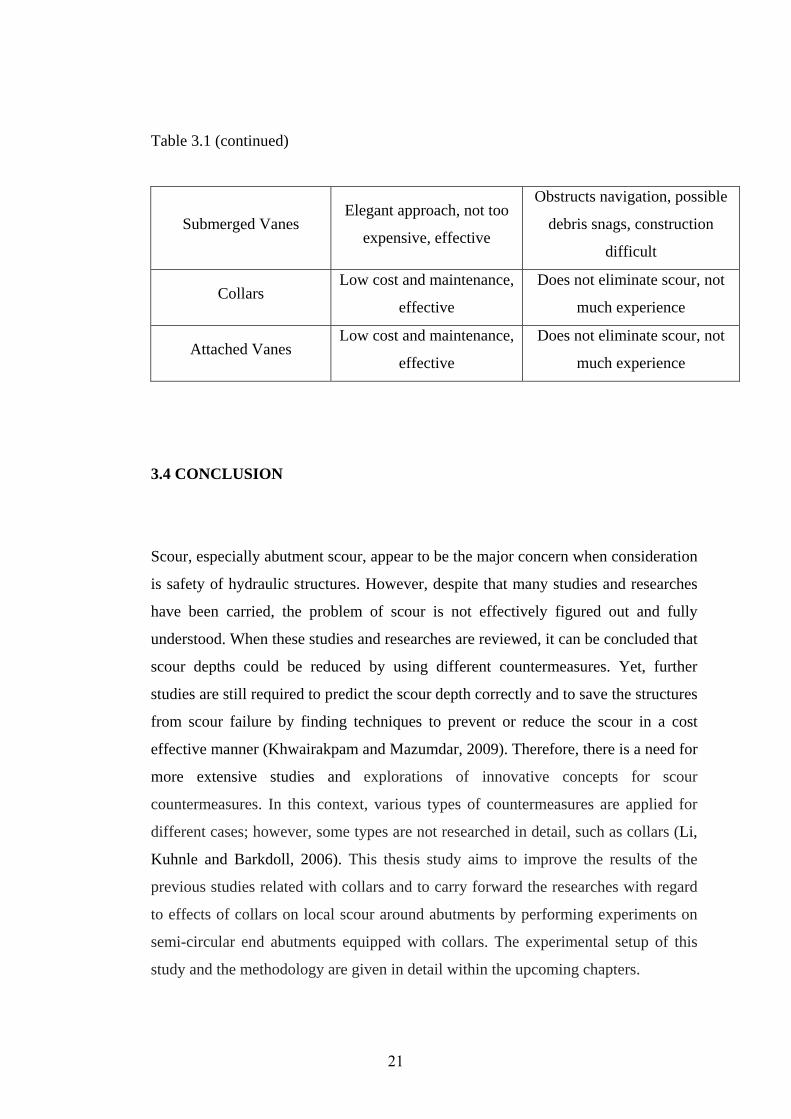
Table 3.1 (continued)
Submerged Vanes Elegant approach, not too
expensive, effective
Obstructs navigation, possible
debris snags, construction
difficult
Collars Low cost and maintenance,
effective
Does not eliminate scour, not
much experience
Attached Vanes Low cost and maintenance,
effective
Does not eliminate scour, not
much experience
3.4 CONCLUSION
Scour, especially abutment scour, appear to be the major concern when consideration
is safety of hydraulic structures. However, despite that many studies and researches
have been carried, the problem of scour is not effectively figured out and fully
understood. When these studies and researches are reviewed, it can be concluded that
scour depths could be reduced by using different countermeasures. Yet, further
studies are still required to predict the scour depth correctly and to save the structures
from scour failure by finding techniques to prevent or reduce the scour in a cost
effective manner (Khwairakpam and Mazumdar, 2009). Therefore, there is a need for
more extensive studies and explorations of innovative concepts for scour
countermeasures. In this context, various types of countermeasures are applied for
different cases; however, some types are not researched in detail, such as collars (Li,
Kuhnle and Barkdoll, 2006). This thesis study aims to improve the results of the
previous studies related with collars and to carry forward the researches with regard
to effects of collars on local scour around abutments by performing experiments on
semi-circular end abutments equipped with collars. The experimental setup of this
study and the methodology are given in detail within the upcoming chapters.
21

CHAPTER 4
EXPERIMENTAL SETUP
4.1 THE FLUME
Experiments of this study were conducted in a channel in the Hydromechanics
Laboratory at Middle East Technical University, METU, in Ankara.
A rectangular channel with transparent walls, 28.5 m length and 1.5 m width with a
slope of S0=0.001 was filled with erodible almost uniform sediment of d50=1.5 mm.
The depth of the sand layer was 0.48 m having a length of 5.8 m in the flow
direction. The discharge of the experimental setup was supplied by a pump from a
constant-head water tank. A control gate was equipped at the end of the channel to
adjust the flow depths.
Figure 4.1 shows the side view of the experimental setup.
22

Figu
re 4
.1 S
ide
view
of t
he e
xper
imen
tal s
etup
0.47
0.48
Rec
tang
ular
Wei
r
Tras
hrac
k
Flow
Dire
ctio
nC
ontro
lG
ate
San
d B
ed
Abu
tmen
t
1.50 28.5
0
Not
e : D
imen
sion
s ar
e gi
ven
in m
eter
.
5.8
23

4.2 THE ABUTMENT MODEL
All the abutment models used during the experiments were constructed from
plexiglass and had a constant width of 10 cm and variable lengths of 40 cm, 35 cm,
30 cm, 25 cm, 20 cm and 15 cm. Below, Figures 4.2 to 4.6 show some of the
abutment models and abutment-collar arrangements used in the experiments.
Figure 4.2 Abutment La=20 cm with collar Bc=10 cm at Zc/y=-0.25
24

Figure 4.3 Abutment La=25 cm without collar
Figure 4.4 Abutment La=25 cm with collar Bc=5 cm at Zc/y=0
25

Figure 4.5 Abutment La=25 cm with collar Bc=7.5 cm at Zc/y=-0.25
Figure 4.6 Abutment La=30 cm with collar Bc=5.0 cm at Zc/y=-0.50
26

4.3 SAND MATERIAL
The bed material in the flume was almost uniform and had a median size diameter of
d50=1.50 mm with σg=1.29 geometric standard deviation of particle size distribution
and uniformity coefficient of Cu=1.7.
4.4 U / Uc RATIO
The shear velocity ratio U*/U*c and the mean velocity ratio U/Uc can be used as a
measure of the flow intensity in scouring problems (Li, Kuhnle and Barkdoll, 2006).
In these experiments, the ratio of U/Uc was used to determine the water depth
satisfying the clear-water flow condition for the U/Uc=0.9 ratio, where U is the
average velocity of the approach flow and Uc is the value of U at the threshold of
grain motion. Before starting the experiments, first, the critical water depth for the
initiation of grain motion yc=12.1 cm was observed when the discharge was
Q=0.0678 m3/s. Then, the required flow depth for U/Uc=0.9 ratio is calculated as
y=13.5 cm for the given discharge by adjusting the gate at the end of the channel.
During this procedure, the threshold condition of bed material motion was defined as
a condition for which the finer materials may move, but the elevation of the bed
would not be lower more than 1 mm to 2 mm during the test duration (Doğan, 2008).
4.5 MEASUREMENT AND DEVICE
The flow discharge was measured with a sharp-crested rectangular weir having a
width of 1.5 m and a height of 0.30 m mounted at the upstream section of the flume.
In order to have uniform flow conditions, turbulence of the flow was reduced using
bricks and sheet-iron strainer at the entrance of the channel. Uniform flow condition
was necessary to measure the water depth in the channel and the scour depth around
the abutment, correctly. When the necessary conditions obtained, the maximum
27

scour depths were measured using a point-gauge with an accuracy of ±1 mm without
disturbing the shape of the scour hole. Moreover, in order to get a 3-dimensional
view of the sediment bed around the abutment for scoured and deposited zones, the
channel bed is scanned by an acoustic device (Sea Tek 5 MHz Ultrasonic Ranging
System) to determine the relative scour and deposition depths with respect to the
sediment bed level (see Figure 4.7 below).
Figure 4.7 Acoustic device used in the experiments
28

CHAPTER 5
APPLICATION OF COLLAR TO CONTROL SCOURING AROUND
ABUTMENTS
5.1 GENERAL
The primary objective of this thesis study is to investigate the effects of collars
around semi-circular end abutments, on the reduction of local scour at the base
of abutments by comparing the experimental results with the ones of Doğan’s
(2008) and Kayatürk’s (2005), and make contributions to use of collars for
scour reduction.
5.2 LITERATURE REVIEW
Secondary and wake vortices added to the primary vortex at the upstream corner
of the abutment erode material from the base region of the abutment causing
local scour hole. The depth of this scour hole can be reduced by placing an
obstacle around the abutment that prevents the hole to deepen any further
(Doğan, 2008). Herein, when the previous studies are reviewed, collars are used
to reduce scour hole depth in such a way to “block the downflow at the leading
edge of piers and abutments and eliminate scour-inducing secondary vortices”
(Li, Kuhnle and Barkdoll, 2006). However, it should be noted that these
researches are mainly focused on preventing local scour at bridge piers. Kapoor
and Keana (1994), Kumar et. al. (1999) and Borghei et. al. (2004) are some of
the researchers studied with collars on pier scour.
29
Collars are being studied as a countermeasure for their efficiency on preventing
bridge abutment scour mainly in the last few years. Kayatürk, in her doctoral
thesis (2005), studied the time development of the local scour around the bridge
abutment with and without collars of various sizes installed at different
elevations. Scour preventing efficiency of a collar is determined as a function of
its size and vertical location on the abutment. According to the results of that
study, it was concluded that as the collars placed below the bed material, the
local scour depth decreases; besides, collars placed above the bed level reduced
the scour depth yet not effective as collars below the bed level. On the other
hand, the scour depth decreases as the collar size increases. The effects of the
collar size on the scour reduction can be grouped as; when the abutment length,
La, is greater than the flow depth, y, i.e., La/y>1, the reduction efficiency
increases with increasing collar width Bc and increases as the collar elevation
penetrating deeper in the sand bed providing the clear-water flow conditions,
U*/U*c = 0.90. On the other hand, when the abutment length is smaller than the
flow depth, the collars placed at the bed level shows higher scour reducing
efficiency than placed at other elevations. The experimental results showed that
collars also reduced the rate of temporal development of the scour hole in
addition to reducing the scour depths (Masjedi A. et. al., 2010). Moreover, in the
doctoral study of Kayatürk (2005) partial collars were proposed as an
economical solution for scour depth reduction.
In 2006, Li, Kuhnle and Barkdoll conducted experiments on “countermeasures
against scour at abutments”. A series of flat, horizontal and steel collars having
different lengths and widths were also tested in a laboratory flume under clear-
water flow conditions at a vertical-face wingwall abutment at the edge of a main
channel (typical configuration of older bridges on smaller streams). Collars
were found to protect the bridge abutment efficiently by eliminating secondary
vortices that ordinarily would cause local scour. According to the results of that
study, “the minimum collar dimensions that eliminated local scour were a flow
perpendicular width of 0.23 La (La is the abutment length perpendicular to the
flow direction) and a flow parallel length of 0.7 times the flow parallel
30

abutment width. It was determined that a vertical location of 0.08 y (where y is
the main channel flow depth) below the mean bed sediment elevation gave the
best results of scour reduction. In addition, the collar not only reduced the scour
magnitude near the abutment, but also retarded the development of the scour
hole” (Li, Kuhnle and Barkdoll, 2006).
Doğan (2008), carried out a series of experiments under clear-water flow
conditions in a rectangular channel with uniform non-cohesive sediment of
d50=0.90 mm grain size diameter. Rectangular collars placed around the
rectangular abutments (in plan view) used at different elevations. In Doğan’s
study since one of the main objectives is to compare the results of the conducted
experiments with Kayatürk’s results, similar parameters were used. Doğan’s
study also aimed to draw a conclusion about the effect of sediment particle size
of the bed material on the performance of the collar against abutment scour. The
experiments carried out under clear-water flow condition of U*/U*c = 0.90 with
a different flow depth from Kayatürk’s and satisfying the condition that La/y>1
for all abutment lengths. According to results of Doğan’s study (2008),
regardless of the flow depth, when the clear-water flow condition was satisfied,
decreasing La/Bc resulted in increasing scour reduction efficiency. On the other
hand, as La/Bc increased, the collar depths shifted deeper into the bed level. In
general, Doğan’s results (2008) with a grain size diameter of 0.90 mm gave
almost the same results of Kayatürk’s results (2005) with a grain size of
1.48 mm.
In the literature review presented above, the need for further studies related with
collar use for abutment scour reduction is obvious. It is also important to relate
the previous studies with the new studies in order to compare the results and to
make contributions to the existing results. For that reason, this study aims to
make comparisons with the studies of Doğan (2008) and Kayatürk (2005), and
to obtain new data for collar use and to get a better understanding of collar
effect for decreasing local scour around abutments.
31

5.3 DIMENSIONAL ANALYSIS
The dimensional analysis obtained by Kayatürk (2005) was used in this thesis study,
also. The maximum scour depth around an abutment in existence of collar, (ds)max,c
was defined as a function of the following parameters for clear-water scour
condition:
⎪⎩
⎪⎨⎧
⎭⎬⎫
=Btd
gSyUTZBBLfd
gs
cccaacs ,,,,,,
,,,,,,,,,)(
50
0max, σμρρ
(5.1)
where, Bc=collar width, Zc=elevation of the collar with respect to the sand level, and
Tc=collar thickness. Figure 5.1 shows a sketch of the collar-abutment arrangement
with the related parameters.
Figure 5.1 Definition sketch of the collar-abutment arrangement
32

The Buckingham’s π theorem gives the following dimensionless terms:
( )⎪⎩
⎪⎨⎧
⎪⎭
⎪⎬⎫
=y
d,,S,
yUt,
Uy,
yB,
gyU,
ρρ
,y
T,
yZ
,y
B,
yB
,fy
50g0
scccamax, σρ
μy
Ldacs
(5.2)
Same as Kayatürk’s (2005) and Doğan’s (2008) studies, the experiments of this study
were conducted with one sediment size and with constant parameters of bed slope,
channel width, collar thickness, abutment width, duration of the experiment, flow
depth and discharge. Therefore, Equation (5.2) can be simplified as:
),,()( max,
a
ac
c
acs
BL
yZ
BL
fy
d= (5.3)
The reduction in the scour depth around the bridge abutments as compared to the
case without collar, (ds)max,c can be given as:
( )( ) ),,(
)(
max
max,max
a
ac
c
a
s
css
BL
yZ
BL
fd
dd=
− (5.4)
The above equations are valid for Fr = ygU ./ = 0.29, Re = (U.ρ.y)/μ = 45200 and
U/Uc = 0.90 where μ ≈1x10⁻³ N.sec/m2, ρ = 1000 kg/m3.
5.4 EXPERIMENTAL PROCEDURE
The experimental model was setup in the Hydromechanics Laboratory at METU.
The collars were cut from 3 mm thick plexiglass plates. The elevations and widths of
the collars were changed for each experiment. All the abutments used in this study
were semi-circular end abutments with lengths of La= 15, 20, 25, 30, 35 and 40 cm
and with a constant width of Ba=10 cm. Since the effect of streamwise abutment
33

length on the development of the scour hole is small, the widths of the abutments
were kept constant (Oliveto and Hager, 2002 and Kayatürk, 2005).
From preliminary experiments it was observed that the threshold condition of the bed
material movement, that is U/Uc≈1.00, was attained at the flow depth of y=12.1 cm
for the discharge of Q=0.0678 m3/s. In order to get the flow depth corresponding to
the condition of U/Uc≈0.90 for the same discharge, the flow control gate at the
downstream end of the channel was raised gradually and finally the depth of y=13.5
cm was obtained. After these conditions were accomplished, the abutment to be
tested was placed in the channel, the sand bed was leveled and the experiment was
started. The scour formation and the maximum depth of the scour hole around the
abutment were investigated after the 3-hour continued run under clear-water flow
conditions. The maximum scour depths were measured with a point-gauge at the end
of each 3-hour run (the data related with the abutments and collars tested in each
experiment are given in Table 5.1). When the experiment was completed, the channel
was drained and the collar was demounted carefully without disturbing the scour
formation to record the data properly. At the end of each experiment, before starting
the new run, the sand bed was levelled with a steel plate that could move over the
rails mounted along the sidewalls of the channel.
On the other hand, the experiments with the acoustic device, used to get the 3-
dimensional views of the sediment bed after scour formation, were conducted for the
abutments of La=20 cm and La=35 cm without collar and with collars of Bc=5 cm
and Bc=10 cm. Using varying number of transducers slightly submerged in water, the
flow depths at downstream, upstream zones and around the abutment were measured.
The scour depths and sediment depths in the sediment deposition zones were
determined. These depths were non-dimensionalized dividing them by the flow depth
of y=13.5 cm. The depth measurement accuracy of the acoustic device was found to
be ± 0.1 mm by comparing the measured depths by those obtained using point-gauge.
34

Table 5.1 Abutment and collar sizes used in the tests
Zc (cm) = ±0.0, -3.4, -6.8 (with respect to the sediment bed ) Abutment
Type La
(cm) Case Bc
(cm) a 10.0
b 7.5 1 15
c 5.0
a 10.0
b 7.5 2 20
c 5.0
a 10.0
b 7.5 3 25
c 5.0
a 10.0
b 7.5 4 30
c 5.0
a 10.0
b 7.5 5
35 c 5.0
a 10.0
b 7.5
BaBc
A A
± 0.0Sediment Bed
Flow
Flow
Collar
Abutment
Section A - A
Top View
La
Zc
6 40
c 5.0
35
5.5 SCOUR MECHANISM
Downflow vortex, primary vortex, wake vortices and secondary vortices cause local
scour around bridge abutments eroding material from base region of the abutment.
According to Papanicolaou and Hilldale (2002), frontal vortices, i.e., downflow
vortex and primary vortex are coupled with secondary vortices resulted from flow
constriction due to the existence of the abutment and finally, wake vortices formed at
the downstream end of the abutment due to the flow separation (Papanicolaou et. al.,
2004).
Function of collars for preventing abutment scour can be understood better when the
scour mechanism is considered, such that at any level above the bed collars separate
the flow into two regions as above and below the collar. For the region above the
collar, downflow is blocked by the collar and as a result, its strength of impingement
at the bed decreases. On the other hand, below the collar, strength of the downflow
and primary vortex decreases. Briefly, the size of the collar and its location on the
abutment with respect to the bed affect the efficiency of the collar in scour reduction
(Kayatürk, 2005).
5.6 DISCUSSION OF RESULTS
5.6.1 Scour Profiles around the Abutment with and without Collar
Within the scope of this study totally 60 experiments were conducted. 54 of these
experiments were conducted with abutments of La=15 cm, 20 cm, 25 cm, 30 cm,
35 cm and 40 cm for a period of 3-hours, placing the collars of Bc=5 cm, 7.5 cm and
10 cm widths at three different locations on the abutments. The remaining 6
experiments were carried out with the same abutments but without collars for the
same time period to get the maximum scour depths around the abutments. Table 5.2
shows the results of all the experiments conducted for the conditions with and
36
without collars in terms of maximum scour depths and collar efficiencies as well as
the abutment and flow properties. In Table 5.2; (ds)max stands for the maximum scour
depth around the abutment having no collar around it, and (ds)max,c represents the
maximum scour depth around the abutment where collars are placed at various
elevations for scour reduction. The last column of the table shows the percent
reduction of the maximum scour depth obtained with the collars.
37

Table 5.2 Experimental data for Q=0.0678 m3/s, y=13.5 cm and Ba=10 cm
Run no La Bc La/Bc La/Ba Zc y Zc/y Θ (ds)max (ds)max,c % Reduction in max.(cm) (cm) (cm) (cm) (cm) (cm) scour depth
R1 15.0 5.0 3.0 1.5 0.0 13.5 0.00 11.2 5.3 52.7%R2 15.0 5.0 3.0 1.5 -3.4 13.5 -0.25 11.2 5.0 55.4%R3 15.0 5.0 3.0 1.5 -6.8 13.5 -0.50 11.2 6.7 40.2%R4 15.0 7.5 2.0 1.5 0.0 13.5 0.00 11.2 4.7 58.0%R5 15.0 7.5 2.0 1.5 -3.4 13.5 -0.25 11.2 5.2 53.6%R6 15.0 7.5 2.0 1.5 -6.8 13.5 -0.50 11.2 6.8 39.3%R7 15.0 10.0 1.5 1.5 0.0 13.5 0.00 11.2 4.0 64.3%R8 15.0 10.0 1.5 1.5 -3.4 13.5 -0.25 11.2 5.1 54.5%R9 15.0 10.0 1.5 1.5 -6.8 13.5 -0.50 11.2 6.8 39.3%
R10 20.0 5.0 4.0 2.0 0.0 13.5 0.00 12.0 8.5 29.2%R11 20.0 5.0 4.0 2.0 -3.4 13.5 -0.25 12.0 7.6 36.7%R12 20.0 5.0 4.0 2.0 -6.8 13.5 -0.50 12.0 8.6 28.3%R13 20.0 7.5 2.7 2.0 0.0 13.5 0.00 12.0 9.7 19.2%R14 20.0 7.5 2.7 2.0 -3.4 13.5 -0.25 12.0 7.4 38.3%R15 20.0 7.5 2.7 2.0 -6.8 13.5 -0.50 12.0 7.4 38.3%R16 20.0 10.0 2.0 2.0 0.0 13.5 0.00 12.0 6.0 50.0%R17 20.0 10.0 2.0 2.0 -3.4 13.5 -0.25 12.0 6.2 48.3%R18 20.0 10.0 2.0 2.0 -6.8 13.5 -0.50 12.0 7.8 35.0%R19 25.0 5.0 5.0 2.5 0.0 13.5 0.00 15.5 12.9 16.8%R20 25.0 5.0 5.0 2.5 -3.4 13.5 -0.25 15.5 10.1 34.8%R21 25.0 5.0 5.0 2.5 -6.8 13.5 -0.50 15.5 9.5 38.7%R22 25.0 7.5 3.3 2.5 0.0 13.5 0.00 15.5 9.8 36.8%R23 25.0 7.5 3.3 2.5 -3.4 13.5 -0.25 15.5 11.1 28.4%R24 25.0 7.5 3.3 2.5 -6.8 13.5 -0.50 15.5 9.2 40.6%R25 25.0 10.0 2.5 2.5 0.0 13.5 0.00 15.5 9.5 38.7%R26 25.0 10.0 2.5 2.5 -3.4 13.5 -0.25 15.5 7.5 51.6%R27 25.0 10.0 2.5 2.5 -6.8 13.5 -0.50 15.5 8.0 48.4%R28 30.0 5.0 6.0 3.0 0.0 13.5 0.00 17.8 16.2 9.0%R29 30.0 5.0 6.0 3.0 -3.4 13.5 -0.25 17.8 13.1 26.4%R30 30.0 5.0 6.0 3.0 -6.8 13.5 -0.50 17.8 10.7 39.9%R31 30.0 7.5 4.0 3.0 0.0 13.5 0.00 17.8 11.2 37.1%R32 30.0 7.5 4.0 3.0 -3.4 13.5 -0.25 17.8 10.2 42.7%R33 30.0 7.5 4.0 3.0 -6.8 13.5 -0.50 17.8 9.8 44.9%R34 30.0 10.0 3.0 3.0 0.0 13.5 0.00 17.8 13.2 25.8%R35 30.0 10.0 3.0 3.0 -3.4 13.5 -0.25 17.8 8.5 52.2%R36 30.0 10.0 3.0 3.0 -6.8 13.5 -0.50 17.8 9.0 49.4%R37 35.0 5.0 7.0 3.5 0.0 13.5 0.00 19.1 16.1 15.7%R38 35.0 5.0 7.0 3.5 -3.4 13.5 -0.25 19.1 14.0 26.7%R39 35.0 5.0 7.0 3.5 -6.8 13.5 -0.50 19.1 12.9 32.5%R40 35.0 7.5 4.7 3.5 0.0 13.5 0.00 19.1 17.9 6.3%R41 35.0 7.5 4.7 3.5 -3.4 13.5 -0.25 19.1 16.2 15.2%R42 35.0 7.5 4.7 3.5 -6.8 13.5 -0.50 19.1 12.8 33.0%R43 35.0 10.0 3.5 3.5 0.0 13.5 0.00 19.1 11.7 38.7%R44 35.0 10.0 3.5 3.5 -3.4 13.5 -0.25 19.1 10.0 47.6%R45 35.0 10.0 3.5 3.5 -6.8 13.5 -0.50 19.1 11.9 37.7%R46 40.0 5.0 8.0 4.0 0.0 13.5 0.00 21.2 18.9 10.8%R47 40.0 5.0 8.0 4.0 -3.4 13.5 -0.25 21.2 17.8 16.0%R48 40.0 5.0 8.0 4.0 -6.8 13.5 -0.50 21.2 16.1 24.1%R49 40.0 7.5 5.3 4.0 0.0 13.5 0.00 21.2 18.3 13.7%R50 40.0 7.5 5.3 4.0 -3.4 13.5 -0.25 21.2 18.0 15.1%R51 40.0 7.5 5.3 4.0 -6.8 13.5 -0.50 21.2 15.2 28.3%R52 40.0 10.0 4.0 4.0 0.0 13.5 0.00 21.2 18.7 11.8%R53 40.0 10.0 4.0 4.0 -3.4 13.5 -0.25 21.2 15.2 28.3%R54 40.0 10.0 4.0 4.0 -6.8 13.5 -0.50 21.2 11.0 48.1%
4.43
2.51
3.30
3.77
4.85
2.63
3.48
3.15
4.31
5.63
2.81
3.85
4.17
2.43
3.18
3.98
2.37
3.08
38

The summary of the results of the experiments for each abutment tested are presented
in the following sections:
1. The abutment of La=15 cm; Bc=5, 7.5, 10 cm, Zc/y=0, -0.25, -0.50
When the collars are placed at an elevation of Zc/y=0, the maximum scour reductions
are observed for the collars of Bc=7.5 cm and 10 cm. During scour formation, the
maximum scour depths are observed at the upstream side of the abutment and the
bed material is swept away towards the downstream of the abutment. For the
experiments with La=15 cm, it could be clearly seen that the scour does not penetrate
below the collars when they are placed at the depths of Zc/y=-0.5. Among the
experiments, the maximum scour reduction efficiency is observed at Zc/y=0 for
Bc=10 cm.
2. The abutment of La=20 cm; Bc=5, 7.5, 10 cm, Zc/y=0, -0.25, -0.50
The best collar performance for La=20 cm is obtained at the elevation of Zc/y=0 for
the collar of Bc=10 cm. On the other hand, for Bc=5 cm, the maximum collar
efficiency is observed at Zc/y=-0.25 while for Bc=7.5 cm, the minimum scour depth
is observed both at Zc/y=-0.25 and Zc/y=-0.5.
The 3-D views of the scour hole and deposition around the abutment of La=20 cm for
the cases of without and with collars of Bc=5 cm and 10 cm placed at various Zc/y
values are plotted and given in Figure 5.2.
39

a) La=20 cm, without collar
b) La=20 cm, Bc=5 cm, Zc/y=0
c) La=20 cm, Bc=5 cm, Zc/y=-0.25
Figure 5.2 3-D views of the scour and deposition pattern around La=20 cm
FLOW
FLOW
FLOW
40

d) La=20 cm, Bc=5 cm, Zc/y=-0.50
e) La=20 cm, Bc=10 cm, Zc/y=0
f) La=20 cm, Bc=10 cm, Zc/y=-0.25
Figure 5.2 (continued)
FLOW
FLOW
FLOW
41

g) La=20 cm, Bc=10 cm, Zc/y=-0.50
Figure 5.2 (continued)
3. The abutment of La=25 cm; Bc=5, 7.5, 10 cm, Zc/y=0, -0.25, -0.50
The maximum scour reductions are obtained at Zc/y=-0.5 for the collars of Bc= 5 cm
and 7.5 cm at La=25 cm. However, it should be noted that for Bc=10 cm at Zc/y= -
0.25 and -0.5, the scour depth values are very close to each other. As a result,
according to the observations of this experiment, it may be concluded that for La=25
cm, Zc/y=-0.5 gives the best scour reduction.
4. The abutment of La=30 cm; Bc=5, 7.5, 10 cm, Zc/y=0, -0.25, -0.50
The bed profiles of La=30 cm show that the maximum scour reduction performance
is observed at Zc/y=-0.25 for Bc=10 cm while it is at Zc/y=-0.50 for the collars of
Bc=5.0 cm and 7.5 cm. However, it should be kept in mind that the maximum scour
reduction performance of the collars of Bc=10 cm at Zc/y=-0.25 and -0.50 are very
close to each other. The maximum collar efficiencies improve as the width of the
collars increase.
FLOW
42

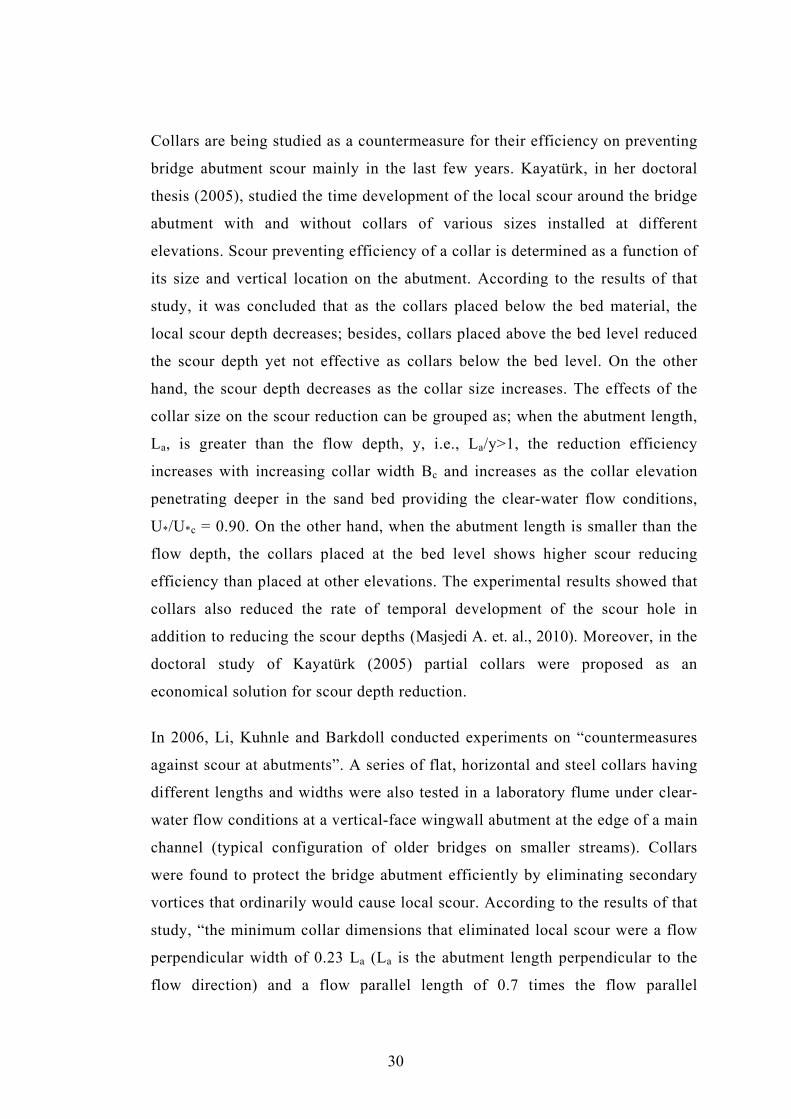
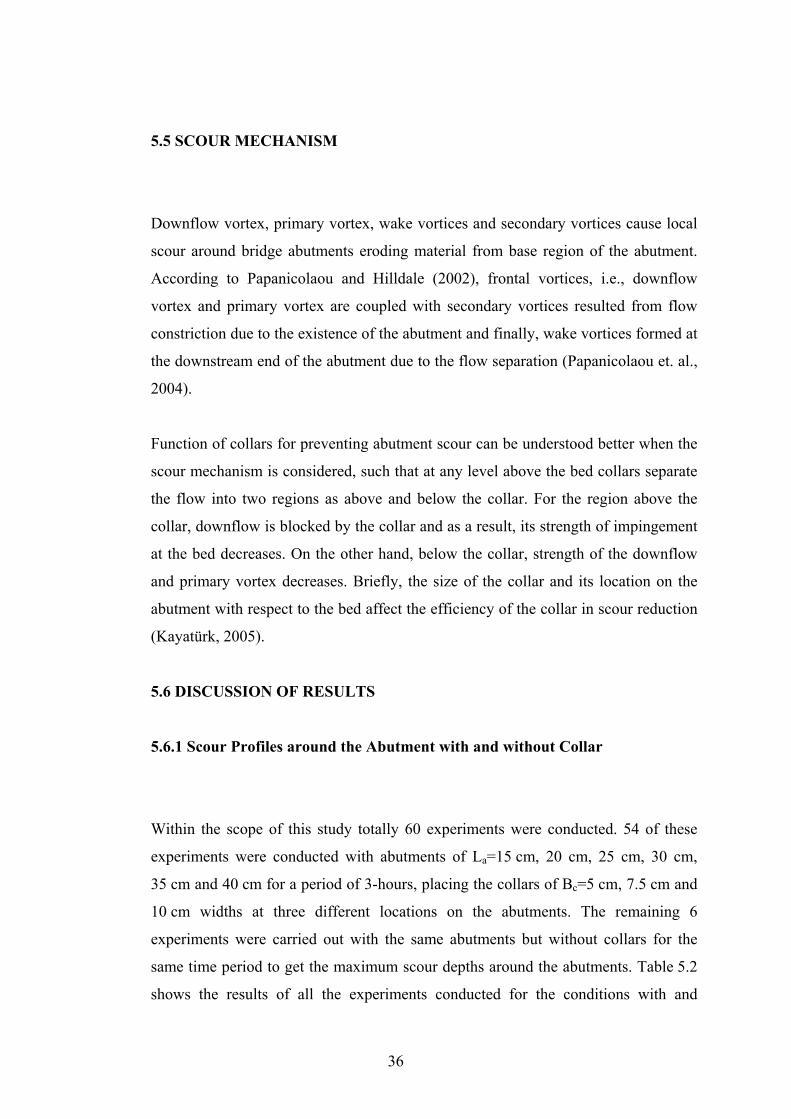
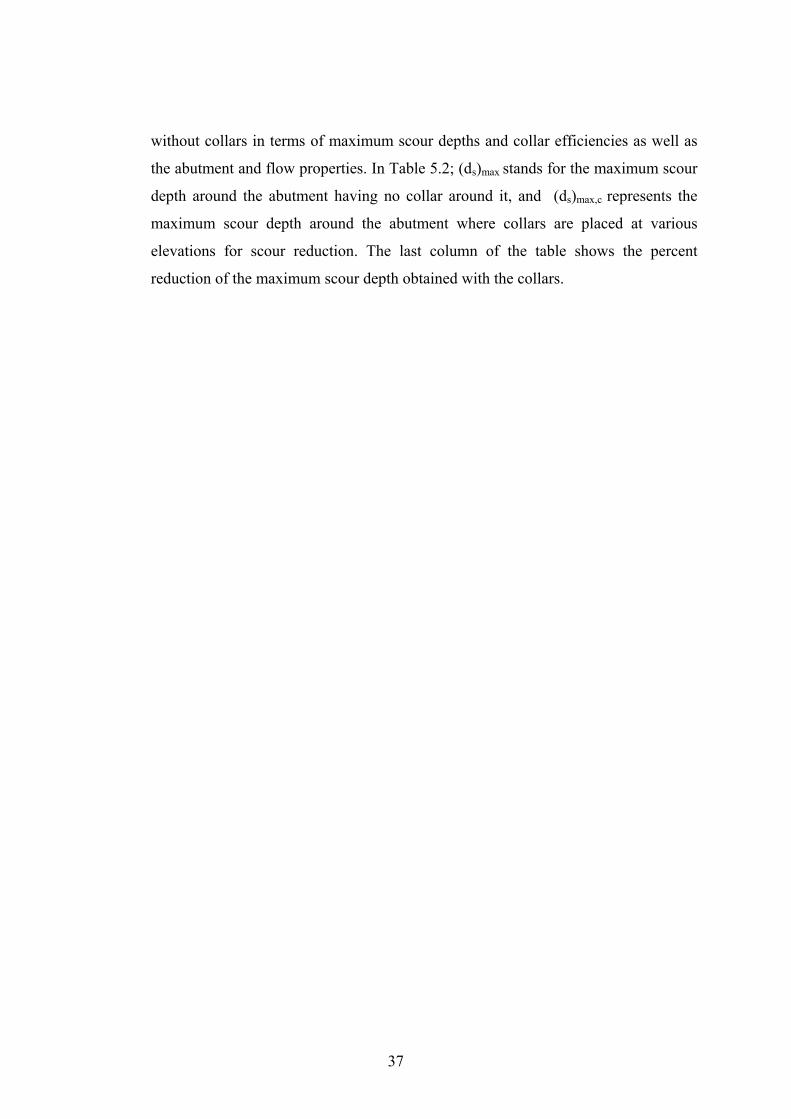
5. The abutment of La=35 cm; Bc=5, 7.5, 10 cm, Zc/y=0, -0.25, -0.50
For the collar of Bc=10 cm at Zc/y=-0.25, the maximum collar efficiency is obtained.
The maximum collar efficiencies for other collars tested; Bc=5.0 cm and 7.5 cm are
obtained at dimensionless collar location of Zc/y=-0.50.
The 3-D views of the scour and deposition patterns around the abutment of La=35 cm
for the cases without collar and with collars of Bc=5 cm and 10 cm placed at various
Zc/y values were plotted and given in Figure 5.3.
a) La=35 cm, without collar
b) La=35 cm, Bc=5 cm, Zc/y=0
Figure 5.3 3-D views of the scour and deposition pattern around La=35 cm
FLOW
FLOW
43
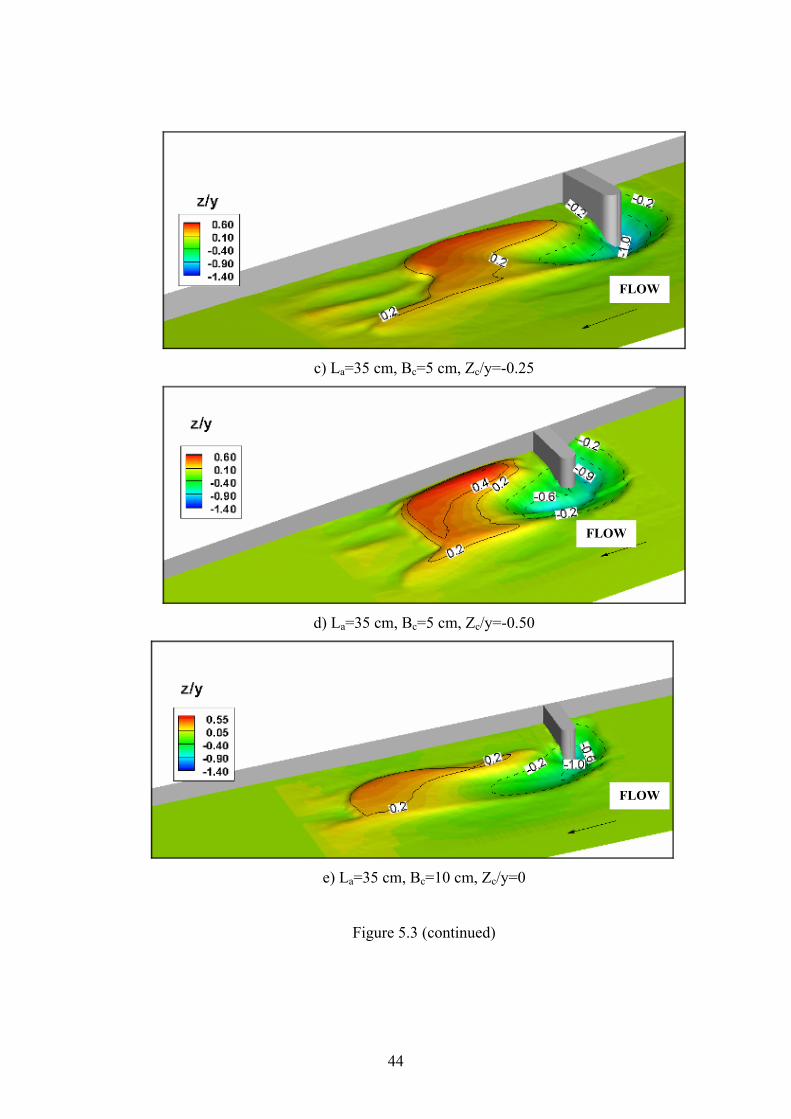
c) La=35 cm, Bc=5 cm, Zc/y=-0.25
d) La=35 cm, Bc=5 cm, Zc/y=-0.50
e) La=35 cm, Bc=10 cm, Zc/y=0
Figure 5.3 (continued)
FLOW
FLOW
FLOW
44

f) La=35 cm, Bc=10 cm, Zc/y=-0.25
g) La=35 cm, Bc=10 cm, Zc/y=-0.50
Figure 5.3 (continued)
6. The abutment of La=40 cm; Bc=5, 7.5, 10 cm, Zc/y=0, -0.25, -0.50
The experimental results of the longest abutment of La=40 cm showed the maximum
scour reduction efficiency at Zc/y=-0.5 for Bc=10 cm. All the collars tested around
the abutment of La=40 cm yield the minimum scour depths at the dimensionless
elevation of Zc/y=-0.50. In addition, it should also be noted that the scour reductions
of this abutment are the lowest ones compared with other abutment lengths tested.
FLOW
FLOW
45

5.6.2 Maximum Scour Reduction around the Abutments with Collars
Abutment length, collar width and collar location effects on the reduction of the
maximum scour depth are shown in Figure 5.4 along with Figures 5.5 and 5.6 which
present the results of Doğan’s (2008) and Kayatürk’s (2005) studies. From the graph,
it can be seen that for small values of La/Bc, i.e., less than about 2.0, the maximum
reductions in the scour depths are obtained when the collars are located at the bed
level, Zc/y=0. On the other hand, for the range of 2< La/Bc <5, the maximum scour
reduction depths fluctuate between Zc/y=-0.25 and Zc/y=-0.50. Moreover, the relative
depth of Zc/y=-0.50 gives the maximum scour reduction performance for all
abutments having La/Bc values greater than and equal to 5, similar to Kayatürk’s and
Doğan’s results. According to the results of this study and the previous studies, it can
be seen that an increase in the collar width, also increases scour reduction
performances of the collars, but on the other hand, when the abutment length
increases, the scour reduction efficiency of the collar decreases.
46

Figu
re 5
.4 E
ffec
t of c
olla
r siz
e an
d el
evat
ion
on th
e m
axim
um sc
our d
epth
aro
und
the
abut
men
ts o
f
Figu
re 5
.4 E
ffec
t of c
olla
r siz
e an
d el
evat
ion
on th
e m
axim
um sc
our d
epth
aro
und
the
abut
men
ts o
f
vario
us le
ngth
s (Q
=0.0
678
m3 /s
, y=
13.5
cm
, d50
= 1
.5 m
m)
47

Figu
re 5
.5 E
ffec
t of c
olla
r siz
e an
d el
evat
ion
on th
e m
axim
um sc
our d
epth
aro
und
the
abut
men
ts o
f
vario
us le
ngth
s (Q
=0.0
17 m
3 /s, y
= 4.
25 c
m, d
50 =
0.9
0 m
m) (
Doğ
an, 2
008)
-20
-100102030405060708090100
-0.5
-0.2
50
0.25
0.5
Z c/y
% Reduction in Maximum Scour Depth
3.0
6.0
8.0
10.0
14.0
1.5
3.0
4.0
5.0
7.0
1.0
2.0
2.7
3.3
4.7
0.8
1.5
2.0
2.5
3.5
L a=7
.5 c
m, L
a/B
c
La=
15 c
m, L
a/B
c
La=
20 c
m, L
a/B
c
La=
25 c
m, L
a/B
c
L
a=35
cm
, La/
Bc
48

Figu
re 5
.6 E
ffec
t of c
olla
r siz
e an
d el
evat
ion
on th
e m
axim
um sc
our d
epth
aro
und
the
abut
men
ts o
f
vario
us le
ngth
s (Q
=0.0
50 m
3 /s, y
= 1
0 cm
, d50
= 1
.48
mm
) (K
ayat
ürk,
200
5)
-20
-100102030405060708090100
-0.5
-0.2
50
0.25
0.5
Z c/y
% Reduction in Maximum Scour Depth
3.0
6.0
8.0
10.0
14.0
1.5
3.0
4.0
5.0
7.0
1.0
2.0
2.7
3.3
4.7
0.8
1.5
2.0
2.5
3.5
L a=7
.5 c
m, L
a/B
c
La=
15 c
m, L
a/B
c
La=
20 c
m, L
a/B
c
La=
25 c
m, L
a/B
c
L
a=35
cm
, La/
Bc
49

In Table 5.3 in addition to [(ds)max,c / y]opt and [Zc / y]opt, which are the values
corresponding to the “maximum % reductions in maximum scour depths” obtained
from Table 5.2 for an abutment of known length and collar size, θ value which is the
ratio of the “total area of the abutment and collar” to “the abutment area” on the
horizontal plane are also shown, i.e.,
abutment
otalt
AA
=θ (5.5)
Here the parameter θ is defined to show the effect of the areal sizes of the abutment
and the collar on the scour.
50

T
able
5.3
Opt
imum
des
ign
para
met
ers o
f an
abut
men
t-col
lar a
rran
gem
ent
θ
θ(A
tota
l/Aab
utm
ent)
(Ato
tal/A
abut
men
t)3.
003.
15-0
.25
0.37
55.3
66
1.75
-0.4
71.
7914
.6-0
.50.
9723
2.00
4.31
0.00
0.35
58.0
43
2.67
-0.2
41.
3237
.1-0
.50.
560
1.50
5.63
0.00
0.30
64.2
92
3.75
-0.2
40.
4777
.5-0
.25
0.25
801.
55
00
100
00.
1886
4.00
2.81
-0.2
50.
5636
.67
81.
69-0
.47
2.26
14.3
-0.5
1.29
162.
673.
77-0
.50
0.55
38.3
34
2.5
-0.4
71.
8430
.4-0
.50.
9637
2.00
4.85
0.00
0.44
50.0
02.
673.
44-0
.47
0.89
66.1
-0.5
0.6
612
4.5
00.
2491
.1-0
.50.
567
5.00
2.63
-0.5
00.
7038
.71
101.
65-0
.47
2.64
1.8
-0.5
1.47
203.
333.
48-0
.50
0.68
40.6
55
2.4
-0.4
72.
0722
.8-0
.51.
1935
2.50
4.43
-0.2
50.
5651
.61
3.33
3.25
-0.4
71.
7933
.3-0
.50.
9846
2.5
4.2
-0.4
70.
4782
.5-0
.50.
6167
6.00
2.51
-0.5
00.
7939
.89
4.00
3.30
-0.5
00.
7344
.94
3.00
4.17
-0.2
50.
6352
.25
7.00
2.43
-0.5
00.
9632
.46
141.
61-0
.47
3.04
2.3
-0.5
1.99
14.
673.
18-0
.50
0.95
32.9
87
2.29
-0.4
72.
926.
1-0
.51.
952.
93.
503.
98-0
.25
0.74
47.6
44.
673.
04-0
.24
2.56
17.4
-0.5
1.76
12.4
3.5
3.86
-0.2
42.
0234
.8-0
.51.
4528
8.00
2.37
-0.5
01.
1924
.06
5.33
3.08
-0.5
01.
1328
.30
4.00
3.85
-0.5
00.
8148
.11
4.00
2.50
2.5
3.00
3.50
3.5
2.00
2
L a/B
aL a
/Bc
[(d
s)m
ax,c
/y] o
pt[%
Redu
ctio
n] o
pt
1.50
1.5
[Zc/y] op
t[(
d s) m
ax,c/y] op
t[%
Redu
ctio
n ]op
t[Z
c/y] o
ptKAY
ATÜ
RK’S
RES
ULT
S (2
005)
L a/B
aL a
/Bc
[Zc/y] op
t[(
d s) m
ax,c/y] op
t[%
Redu
ctio
n ]op
t
RESU
LTS
OF
PRES
ENT
STU
DY
DOĞ
AN’S
RES
ULT
S (2
008)
51

In Figure 5.7, [(ds)max,c / y]opt versus θ values of this study are shown as a function of
La/Ba and the relevant plots of two studies; Doğan’s (2008) and Kayatürk’s (2008)
are also given for comparison. In Figure 5.7, it is seen that [(ds)max,c / y]opt values
decrease with increasing θ values for a given value of La/Ba. The rate of decrease of
[(ds)max,c / y]opt with increasing θ decreases as La/Ba values get smaller. For a given
La/Ba value, as the total area increases, i.e. the collar area increases, the maximum
scour depth decreases accordingly. The data points given in Figures 5.8 and 5.9 show
the similar trends described above. Referring to these figures one can also determine
the optimum location of the collar to be placed on the abutment, (Zc/y)opt, by finding
the value of [(ds)max,c / y]opt from a given θ and La/Bc.
52

θ
(Zc/
y)op
t=0.
0
(Zc/
y)op
t=0.
0
(Zc/
y)op
t=-0
.25
(Zc/
y)op
t=-0
.25
(Zc/
y)op
t=-0
.25
(Zc/
y)op
t=0.
0
(Zc/
y)op
t=-0
.5(Z
c/y)
opt=
-0.5
(Zc/
y)op
t=-0
.25
(Zc/
y)op
t=-0
.5
(Zc/
y)op
t=-0
.5
(Zc/
y)op
t=-0
.25
(Zc/
y)op
t=-0
.5
(Zc/
y)op
t=-0
.5
(Zc/
y)op
t=-0
.5(Z
c/y)
opt=
-0.2
5
(Zc/
y)op
t=-0
.5
0.20
0.30
0.40
0.50
0.60
0.70
0.80
0.90
1.00
1.10
1.20
2.00
2.50
3.00
3.50
4.00
4.50
5.00
5.50
6.00
La/B
a=1.
5La
/Ba=
2La
/Ba=
2.5
La/B
a=3
La/B
a=3.
5La
/Ba=
4
Fi
gure
5.7
Var
iatio
n of
[(d s
) max
,c /
y]op
t with
θ (Q
=0.0
678
m3 /s
, y=1
3.5
cm, F
r=0.
29, U
/Uc=
0.90
, d50
= 1
.50
mm
, t=3
hrs
)
[(ds)max,c / y)]opt
θ
53

Figu
re 5
.8 V
aria
tion
of [(
d s) m
ax,c
/ y]
opt w
ith θ
(Q=0
.017
m3 /s
, y=4
.25
cm, F
r=0.
41, U
*/U*c
=0.9
0, d
50 =
0.9
0 m
m, t
=6 h
rs) (
Doğ
an, 2
008)
θ
[(ds)max,c / y)]opt
54

Figu
re 5
.9 V
aria
tion
of [(
d s) m
ax,c
/ y]
opt w
ith θ
(Q=0
.050
m3 /s
, y=1
0 cm
, Fr=
0.34
, U*/U
*c=0
.90,
d50
=1.
48 m
m, t
= 6h
rs) (
Kay
atür
k, 2
005)
θ
[(ds)max,c / y)]opt
55

An alternative form of the data given in Figure 5.7 is presented in Figure 5.10,
[(ds)max,c / y]opt versus ( )ca BL /θ as well as the data around a single curve. The best
fit lines of the data given in Figure 5.10 for three different studies, which are
applicable only for the flow conditions under which they were obtained, can be used
to determine the [(ds)max,c / y]opt for known θ and La/Bc values of an abutment. Here,
it should be kept in mind that the best fit line of the present data falls far below the
other best fit lines due to the short experiment period of t=3 hours. It can be claimed
that for longer experiment period; such as t=6 hours as the other studies, the data
points of the present study fall far above and may be they would coincide with those
of Kayatürk’s data since the mean diameters of the bed materials of both studies are
almost the same.
The variation of [Zc/y]opt with La/Bc is shown in Figure 5.11 for the present study as
well as those of Kayatürk’s (2005) and Doğan’s (2008) data. [Zc/y]opt values of
Figure 5.11 can be classified in three zones as a function of La/Bc as summarized
below:
For the data of present study:
[Zc/y]opt = 0 for La/Bc≤ 2.0
-0.50 ≤ [Zc/y]opt ≤ -0.25 for 2.0 ≤ La/Bc ≤ 5.0 (5.6)
[Zc/y]opt = -0.50 for 5.0 < La/Bc
The above relations are valid within the range of La/Bc between 1.5 and 8.
Doğan’s study (2008):
[Zc/y]opt = 0 for La/Bc ≤ 2.0
-0.47 ≤ [Zc/y]opt ≤ -0.24 for 2.0 < La/Bc < 5.0 (5.7)
[Zc/y]opt = -0.47 for 5.0 ≤ La/Bc ≤ 14.0
Kayatürk’s study (2005):
[Zc/y]opt = 0 for La/Bc = 2.0 -0.50 ≤ [Zc/y]opt ≤ -0.25 for 2.0 ≤ La/Bc ≤ 3.0 (5.8)
56

[Zc/y]opt = -0.50 for 3.0 < La/Bc ≤ 14
The above relations of Kayatürk’s and Doğan’s studies are valid within the range of
La/Bc between 0.75 and 14.
57
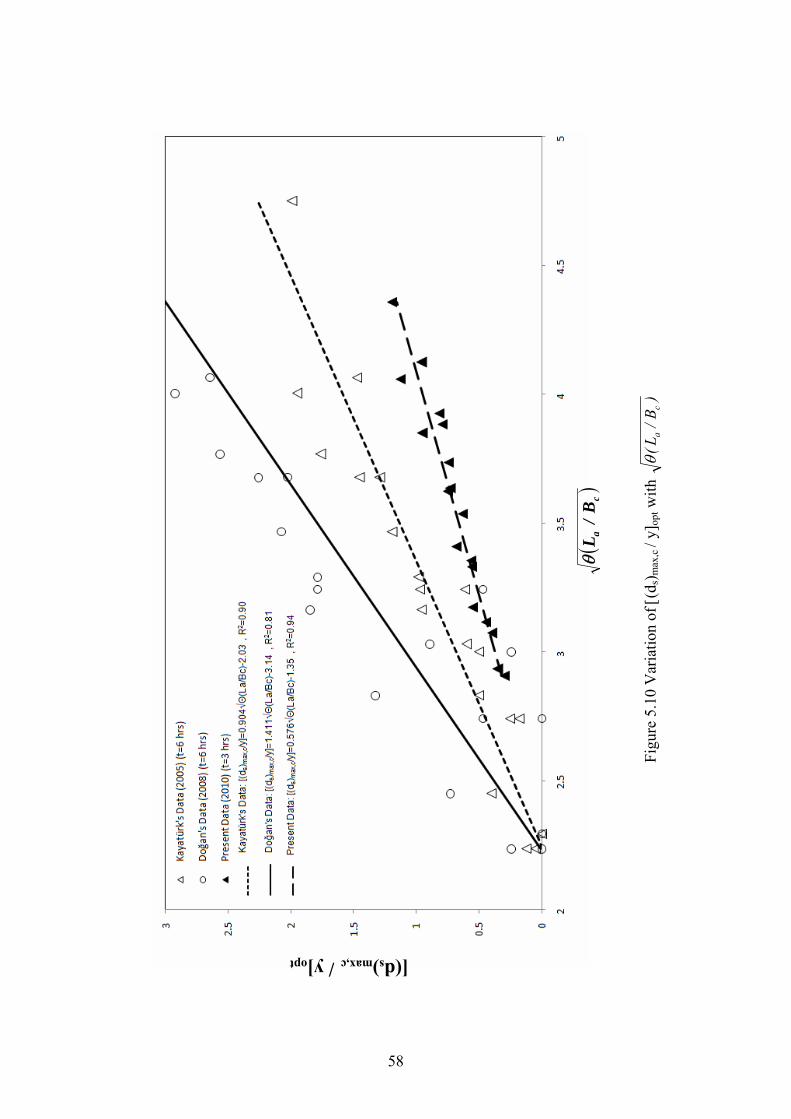
Fi
gure
5.1
0 V
aria
tion
of [(
d s) m
ax,c
/ y]
opt w
ith
)B/
L(c
aθ
[(ds)max,c / y]opt
()
ca
B/L
θ
58

-0.6
0
-0.5
0
-0.4
0
-0.3
0
-0.2
0
-0.1
0
0.00
0.00
1.00
2.00
3.00
4.00
5.00
6.00
7.00
8.00
9.00
10.0
011
.00
12.0
013
.00
14.0
015
.00
L a/B
c
Pre
sent
Dat
a (2
010)
Doğ
an's
Dat
a (2
008)
Kay
atür
k's D
ata
(200
5)
[Zc/y]opt
Figu
re 5
.11
Var
iatio
n of
[Zc/y
] opt w
ith L
a/Bc
59
The variation of [%Reduction]opt with respect to La/Bc is shown in Figure 5.12.
When this figure is compared with the previous studies, it is seen that the
experiments of this study give higher collar scour reduction efficiencies for La/Bc≥3;
however, for La/Bc<3 the efficiencies are less than the results of the previous studies.
Here, when comparing the results it should be noticed that this study is different from
other studies of Kayatürk and Doğan, in terms of sediment size, abutment and collar
shapes.
60

020406080100
120
02
46
810
1214
16
La/B
c
[% Reduction]opt
Doğa
n's Data (2008)
Kayatürk's Data (2005)
Prese
nt Data (2010)
Doğa
n's
Data
: [%
Red
uctio
n=13
2.8
e-0.3
45x ,
R2 =0.
81]
Kaya
türk
's D
ata:
[% R
educ
tion=
118.
5 e-0
.311
x , R2 =
0.77
]
Pres
ent D
ata:
[% R
educ
tion=
69.5
e-0
.125
x , R2 =
0.72
]
Figu
re 5
.12
Var
iatio
n of
[%R
educ
tion]
opt w
ith L
a/Bc
61

5.7 SUMMARY, CONCLUSIONS and RECOMMENDATIONS
5.7.1 Summary
The function of a collar placed around a bridge abutment is to protect the sediment
bed from direct impact of the downflow by deflecting the flow (Zarrati A. R. et. al.,
2004). In other words, collars work as a “downflow-halting” device during scour
hole formation and eliminate the secondary vortices forming around the abutment
(Li, Kuhnle and Barkdoll, 2006). The size of the collar and its vertical location on
the abutment with respect to the bed affect collar’s scour reduction efficiency around
the abutment. As the size of the collar, Bc, increases, the depth of the scour hole
decreases; but increasing the abutment length decreases the scour reduction
efficiency. On the other hand, lowering the collar elevation results in less flow to
penetrate under the collar and as a result weaker downflow is formed under the
collar. However, it should be pointed out that placing the collar deeper into the
sediment bed may not lead to a significant increase in the collar’s scour reduction
efficiency (Zarrati A. R. et. al., 2004).
5.7.2 Conclusions
The results of this study are compared with the other two studies of Kayatürk (2005)
and Doğan (2008). As mentioned in the previous sections; discharges, flow depths,
sediment diameters and abutment shapes used in the experiments of those studies
which are briefly presented in Table 5.4, were different from those of this study.
62

Table 5.4 Some of the important parameters of abutment, flow and sediment used in
the Present, Doğan’s and Kayatürk’s studies
Present Study Doğan (2008) Kayatürk
(2005)
Abutment Shape Semi-circular
end Rectangular Rectangular
Abutment Length, La,
(cm)
15, 20, 25, 30,
35 and 40
7.5, 15, 20, 25
and 35
7.5, 15, 20, 25
and 35
Collar width, Bc, (cm) 5, 7.5 and 10 cm 2.5, 5, 7.5 and
10 cm
2.5, 5, 7.5 and
10 cm
Collar Shape Semi-circular
end Rectangular Rectangular
Discharge (m3/s) 0.0678 0.017 0.050
Flow Depth (cm) 13.5 4.25 10
Sediment diameter , d50, (mm)
1.50 0.90 1.48
Flow Conditions Clear-water Clear-water Clear-water
U/Uc , U*/U*c U/Uc =0.90 U*/U*c =0.90 U*/U*c =0.90
Experiment duration 3 hours 6 hours 6 hours
63

The results of these studies are very similar and the following conclusions can be
drawn:
o Collars can be used as effective scour countermeasures for semi-circular end
abutments as well as rectangular abutments.
o As the size of the collar, Bc, or θ increases, the depth of the scour hole around
the abutment of given length decreases (Figure 5.7).
o The dimensionless maximum scour depth corresponding to the optimum
collar size, (ds)max,c / y, increases as the dimensionless collar length, La/Ba,
increases for a given collar size, θ, (Figure 5.8).
o Almost the same classification can be made for the optimum locations of the
collars which will produce the maximum scour reduction around the
abutment, (Zc/y)opt , as a function of La/Bc regardless of the abutment shape
(Figure 5.11).
o The scour reduction efficiency of a collar, [% Reduction]opt,, decreases as
La/Bc value increases. [% Reduction]opt, values corresponding to a collar of
known La/Bc can be estimated using Figure 5.12 not only for semi-circular
end abutments but also for rectangular abutments of earlier studies.
5.7.3 Recommendations
It should be emphasized as a general comment that abutment scour is not adequately
documented despite its importance on bridge vulnerability (Balio & Orsi, 2001). To
this respect, a number of recommendations concerning future works about abutment
scour and collars are given as follows:
o The similar studies can be done with other abutments of different shapes such
as wing-wall and spill-through to determine the effect of collars on the scour
reduction.
64
o Collars were tested under laboratory conditions; however, it would be useful
to test the effectiveness of collars on the field since relatively large errors
should be expected when predicting abutment scour on the base of literature
models (Balio & Orsi, 2001). In addition, to make collar application as a
practical scour countermeasure for abutments, collar-placing methods should
also be studied.
o In this study and other previous studies, collars were tested under clear-water
flow conditions since there is no sediment supply to the system and thus,
clear-water flow condition results in deeper scour holes. On the other hand,
abutment scour under live-bed conditions should be tested in further
researches for a better understanding of abutment scour and collar efficiency,
although it is difficult to observe and measure the scour depth under the collar
around the abutment (Li, Kuhnle and Barkdoll, 2006).
o Future studies should also take into consideration of abutment/pier
interactions affecting collars’ scour reduction efficiencies regarding both
abutment and pier scour.
65

REFERENCES
• Alabi, P. D. (2006). Time Development Of Local Scour At A Bridge Pier
Fitted With A Collar. Thesis Submitted To The College Of Graduate Studies
And Research In Partial Fulfillment Of The Requirements For The Degree Of
Master Of Science In The Department Of Civil And Geological Engineering.
• Ahmad, M. (1953). Experiments on design and behavior of spur-dikes. Proc.
Int. Hydraul. Convention.: 145–159.
• Ballio, F. and Orsi, E. (2000). Time Evolution of Scour Around Bridge
Abutments. Water Eng. Res. 2: 243–259.
• Balio, F. and Orsi, E. (2001). Time Evolution of Scour Around Bridge
Abutments. Politecnico di Milano, dept. I.I.A.R.
• Barbhuiya, A. K. and Dey, S. (2004). Local Scour at Abutments: A Review.
Sadhana. Vol. 29, Part 5, 449-476.
• Borghei, S. M., Vatannia, Z., Ghodsian, M., Jalili, M. R. and Nalder, G.
(2004). Discussion: Oblique rectangular sharp-crested weir. Water
Management,Vol. 157, No. 4.
• Breusers, H. N. C. (1967). Time scale of two-dimensional local scour. Proc.
12th Cong. IAHR 3: 275–282.
• Breusers, H. N. C., Nicollet, G. and Shen, H.W. (1977). Local scour around
cylindrical piers. Journal of Hydraulic Research, 15(3): 211-252.
66

• Cardoso, A. H. and Bettess, R. (1999). Effects of time and channel geometry
on scour at bridge abutments. ASCE Journal of Hydraulic Engineering, Vol.
125: 388–399.
• Chabert, J. and Engeldinger, P. (1956). Etude des affouillements autour des
piles de points (Study of scour at bridge piers). Bureau Central d.Etudes les
Equipment d.Outre-Mer, Laboratoire National d.Hydraulique, France.
• Chiew, Y. M. (1984). Local scour at bridge piers. Ph.D Thesis, University of
Auckland, Auckland, New Zealand.
• Chiew, Y. M. (2008). Scour and Scour Countermeasures at Bridge Sites.
Transactions of Tianjin University, Vol. 14, No. 4, 2008.
• Coleman, S. E., Lauchlan, C. S. and Melville, B.W. (2003). Clear-water scour
development at bridge abutments. J. Hydraul. Res. 41: 521–531.
• Cunha, L. V. (1975). Time evolution of local scour. Proc. 16th Conf. Int.
Assoc. Hydraulic Research (Delft: IAHR) pp 285–299.
• Dargahi, B. (1990). Controlling mechanism of local scouring. ASCE Journal
of Hydraulic Engineering, Vol. 116: 1197–1214.
• Doğan, A., E. (2008). Effects Of Collars On Scour Reduction At Bridge
Abutments. Thesis presented to Middle East Technical University, Ankara,
Turkey, in partial fulfillment of the requirements for the degree of Master of
Science in Civil Engineering.
• Dongol, D. M. S. (1994). Local scour at bridge abutments. Rep. No. 544,
School of Engineering, University of Auckland, Auckland, New Zealand.
67

• Ettema, R. (1980). Scour at bridge piers. Rep. No. 216, School of
Engineering, University of Auckland, Auckland, New Zealand.
• Federal Highway Administration, New Jersey (2005). Handbook of Scour
Countermeasures Designs. Report No. 49777-11-04, U. S.
• Federal Highway Administration, (2001). Bridge Scour and Stream Instability
Countermeasures. National Highway Institute, Publication No. FHWA NHI
01-003, HEC No. 23, U. S.
• Field, W. G. (1971). Flood protection at highway bridge openings. University
of Newcastle, N.S.W., Engineering Bulletin CE3.
• Franzetti, S., Larcan, E., Mignosa, P. (1982). Influence of test duration on the
evaluation of ultimate scour around circular piers. Proc. Int. Conf. Hydraulics
and Modelling of Civil Structures, Coventry, England, pp 381–396.
• Garde, R. J., Subramanya, K. and Nambudripad, K. D. (1961). Study of scour
around spur dikes. ASCE Journal of the Hydraulics Division, 87(HY6), 23-
37.
• Gill, M. A. (1972). Erosion of sand beds around spur-dikes ASCE Journal of
Hydraulic Engineering, Vol. 98: 1587–1602.
• Kandasamy, J. K. (1985). Local scour at skewed abutments. Rep. No. 375,
School of Engineering, University of Auckland, Auckland, New Zealand.
• Kandasamy, J. K. (1989). Abutment scour. Rep. No. 458, School of
Engineering, University of Auckland, Auckland, New Zealand.
• Kapoor, B. S., and Keana, C. M. (1994). Experimental overview to
mechanism of scour around a round nosed pier and effect of delta wing like
68

device on scour pattern around it. Modelling, Measurement & Control C:
Energetics, Chemistry, Earth, Environmental & Biomedical Problems, Vol.
46,No. 3, AMSE Press, Tassin-la-Demi-Lune, France.
• Kayatürk, Ş.Y. (2005). Scour and Scour Protection at Bridge Abutments.
Thesis presented to Middle East Technical University, Ankara, Turkey, in
partial fulfillment of the requirements for the degree of Doctor of Philosophy.
• Kohli, A., Hager, W. H. (2001). Building scour in floodplains. Water
Maritime Eng., Proc. Inst. Civ. Eng. (London) 148: 61–80.
• Kumar, V., Ranga Raju, K.G. and Vittal, N. (1999). Reduction of local scour
around bridge piers using slots and collars. Journal of Hydraulic Engineering,
ASCE, 125(12): 1302-1305.
• Kwan, F. (1984). Study of Abutment Scour. Report No. 328, University of
Auckland, School of T. Engineering, Department of Civil Engineering Private
Bag, Auckland, New Zealand.
• Kwan, F. (1988). Study of Abutment Scour. Report No. 451, University of
Auckland, School of T. Engineering, Department of Civil Engineering Private
Bag, Auckland, New Zealand.
• Laursen, E.M. (1958). Scour at bridge crossings. Iowa Highway Research
Board Bulletin, No. 8.
• Li, H., Kuhnle, R. A., and Barkdoll, B. D. (2006). Countermeasures Against
Scour at Abutments. National Sedimentation Laboratory, Research Report
No. 49, U.S.
69

• M. M. Abou Seida et. al. (2009). Experimental Investigation of Abutment
Scour in Sandy Soil. Journal of Applied Sciences Research, 5(1): 57-65,
2009.
• Masjedi, A. et. al. (2010). Time develoment of local scour at a bridge pier
using square collar in a 180 degree flume bend. Journal of American Science
2010;6(8):188-195.
• Melville, B. W. (1992). Local scour at bridge abutments. ASCE Journal of
Hydraulic Engineering, Vol. 118: 615–631.
• Melville, B. W. (1995). Bridge abutment scour in compound channels. ASCE
Journal of Hydraulic Engineering, Vol. 121: 863–868.
• Melville, B. W. (1997). Pier and abutment scour: integrated approach. ASCE
Journal of Hydraulic Engineering, Vol.123: 125–136.
• Melville, B. W. and Chiew, Y. M. (1999). Time Scale for Local Scour at
Bridge Piers. J. Hydr. Engrg, Vol. 125, No. 1, 59-65.
• Melville, B.W. and Coleman, S.E. (2000). Bridge Scour. Water Resources
Publications.
• Morris, J.L. and Pagan-Ortiz, J.E. (1999). Bridge scour evaluation program in
the United States. Stream Stability and Scour at Highway Bridges, E.V.
Richardson and P.F. Lagasse, eds., ASCE, 61-70.
• National Cooperative Highway Research Program, (2007). Countermeasures
to Protect Bridge Abutments from Scour. NCHRP Report 587. Washington,
D.C.
70
• Neill, C.R. (1973). Guide to bridge hydraulics. Roads and Transportation
Assoc. of Canada, Univ. of Toronto Press, Toronto, Canada.
• Oliveto, G. and Hager, W. H. (2002). Temporal evolution of clear-water pier
and abutment scour. ASCE Journal of Hydraulic Engineering, Vol. 128: 811–
820.
• Padmini, K. and Asis, M. (2009). Local Scour Around Hydraulic Structures.
International Journal of Recent Trends in Engineering, Vol. 1, No. 6, May
2009.
• Papanicolaou, A. N. and Hilldale, R. (2002). Turbulence characteristic in a
gradual channel transition. J. of Engrg., ASCE, 128(9), 948-961.
• Papanicolaou et.al (2004). Investigation of Flow and Local Scour
Characteristics around a Partially Submerged Permeable WSDOT Barb.
Report no. WA-RD 581.1, Washington State Transportation Center (TRAC).
• Parola, A. C., Hagerty, D. J. and Kamojjala, S. (1998). Highway
infrastructure damage caused by the 1993 upper Mississippi River basin
flooding. NCHRP Report 417, Transportation Research Board, Washington,
DC.
• Rajaratnam, N. and Nwachukwu, B. A. (1983). Flow near groin-like
structures. ASCE Journal of Hydraulic Engineering, Vol.109: 463–480.
• Raudkivi, A. J. and Ettema, R. (1983). Clear-water scour at cylindrical piers.
ASCE Journal of Hydraulic Engineering, Vol. 109: 338–350.
• Richardson, J.R. and Richardson, E.V. (1993). Discussion of "Local Scour at
Bridge Abutments," by B.W. Melville. Journal of Hydraulic Engineering,
ASCE, 119(9), pp. 1069-1071.
71
• Richardson, E. V. and Davis, S. R. (2001). Evaluating scour at bridges.
HEC18 FHWA NHI-001. Federal Highway Administration, US Department
of Transportation, Washington, DC.
• Rouse, H. (1965). Engineering hydraulics: sediment transportation. New
York: John Wiley and Sons.
• Sastry, C. L. N. (1962). Effect of spur-dike inclination on scour
characteristics. M. E. thesis, University of Roorkee, Roorkee.
• Stamey, Timothy C. (1996). Summary of data-collection activities and effects
of flooding from Tropical Storm Alberto in parts of Georgia, Alabama, and
Florida, July 1994. U.S. Geological Survey Open-File Report 96-228, 23p.
• Tey, C. B. (1984). Local scour at bridge abutments. Rep. No. 329, School of
Engineering, University of Auckland, Auckland, New Zealand.
• Whitehouse, R. J. S. (1997). Scour at marine structures: a manual for
engineers and scientists. Res. Rep. SR417, HR Wallingford Limited,
Wallingford, UK.
• Wong, W. H. (1982). Scour at bridge abutments. Rep. No. 275, School of
Engineering, University of Auckland, New Zealand.
• Zarrati, A. R., Gholami, H. and Mashahir, M. B. (2004). Application of
Collar to Control Scouring Around Rectangular Bridge Piers. J. Hydr.
Research, Vol. 42, No. 1, 97-103.
• Zaghloul, N. A. (1983). Local scour around spur-dikes. J. Hydrol. 60: 123–
140.
72

APPENDIX
Table A.1 Sample data obtained to draw 3-D views of scour formation around the
abutment of La=20 cm with collar of Bc=5 cm at Zc/y=0
Note: y = 13.5 cm (normal flow depth)
X (cm) Y (cm) Scouring&Deposition (cm) X/y Y/y Z/y-30 1 -0.17 -2.222 0.074 -0.013-30 3 -0.21 -2.222 0.222 -0.016-30 5 -0.24 -2.222 0.370 -0.018-30 7 -0.25 -2.222 0.519 -0.019-30 9 -0.32 -2.222 0.667 -0.024-30 11 -0.26 -2.222 0.815 -0.019-30 13 -0.24 -2.222 0.963 -0.018-30 15 -0.36 -2.222 1.111 -0.026-30 17 -0.31 -2.222 1.259 -0.023-30 19 -0.19 -2.222 1.407 -0.014-30 21 -0.19 -2.222 1.556 -0.014-30 23 -0.23 -2.222 1.704 -0.017-30 25 -0.23 -2.222 1.852 -0.017-30 27 -0.17 -2.222 2.000 -0.012-30 29 -0.21 -2.222 2.148 -0.016-30 31 -0.13 -2.222 2.296 -0.010-30 33 -0.19 -2.222 2.444 -0.014-30 35 -0.09 -2.222 2.593 -0.007-30 37 -0.03 -2.222 2.741 -0.002-30 39 0.02 -2.222 2.889 0.001-30 41 0.00 -2.222 3.037 0.000-30 43 0.07 -2.222 3.185 0.005-30 45 -0.08 -2.222 3.333 -0.006-30 47 0.10 -2.222 3.481 0.007-30 49 -0.14 -2.222 3.630 -0.010-30 51 -0.10 -2.222 3.778 -0.007
73


