HAL Id: hal-01824007https://hal.archives-ouvertes.fr/hal-01824007
Submitted on 5 Oct 2018
HAL is a multi-disciplinary open accessarchive for the deposit and dissemination of sci-entific research documents, whether they are pub-lished or not. The documents may come fromteaching and research institutions in France orabroad, or from public or private research centers.
L’archive ouverte pluridisciplinaire HAL, estdestinée au dépôt et à la diffusion de documentsscientifiques de niveau recherche, publiés ou non,émanant des établissements d’enseignement et derecherche français ou étrangers, des laboratoirespublics ou privés.
Effects of fungal decay on elasticity and damping ofsmall-diameter silver fir logs assessed by the transverse
vibration resonant methodJean Baptiste Barré, Franck Bourrier, Loïc Brancheriau, Freddy Rey, David
Bertrand
To cite this version:Jean Baptiste Barré, Franck Bourrier, Loïc Brancheriau, Freddy Rey, David Bertrand. Effects offungal decay on elasticity and damping of small-diameter silver fir logs assessed by the transversevibration resonant method. Wood Science and Technology, Springer Verlag, 2018, 52 (2), pp.403-420.�10.1007/s00226-017-0961-2�. �hal-01824007�
Effects of fungal decay on elasticity and dampingof small-diameter silver fir logs assessedby the transverse vibration resonant method
Jean Baptiste Barre1 • Franck Bourrier1 •
Loıc Brancheriau2 • David Bertrand3 •
Freddy Rey1
Abstract A number of studies have shown the ability of the vibration resonant
method (VRM) to measure the modulus of elasticity (MOE) and the damping ratio
(n) of calibrated wooden samples of various dimensions. This method based on free
transverse vibrations was also studied to assess the decay extent in small stakes.
Nevertheless, a need for investigations was identified in order to apply the method
to decayed logs. Both decay and geometrical singularities brought heterogeneity not
taken into account by the VRM. The aim of this study was to examine the effects of
fungal decay on these two mechanical properties of small-diameter silver fir logs
using the VRM. Fifty-five small-diameter logs were monitored over a decay process
taking place in a greenhouse located near Grenoble (France). The MOE and n were
measured in intact and decayed states. The results showed the reliability of the
measurements of both properties. n was found to be independent of moisture content
for wood above the fibre saturation point. The results validated the loss in MOE and
the gain in n due to fungal activity. Thus, indicators based on the MOE and n were
proposed and compared to quantify the decay extent. Indicators calculated from the
first mode of vibration appeared to be relevant for that purpose. Future work is
needed to validate indicators on structural size logs and to compare this quantitative
assessment to those obtained by the standard EN 152 that currently serves as a
benchmark.
& Jean Baptiste Barre
1 Irstea, UR EMGR, Universite Grenoble Alpes, 2 rue de la Papeterie-BP 76,
38402 St-Martin-d’Heres, France
2 UR BioWooEB UMR AMAP, CIRAD, 34398 Montpellier Cedex 5, France
3 INSA Lyon (National Institute of Applied Sciences of Lyon), Universite de Lyon, 20, Avenue
Albert Einstein, Villeurbanne Cedex, France
1
Introduction
Natural hazards such as erosion or small landslides may be mitigated by ecological
engineering structures built from a wooden logs framework. These timber structures
are mostly made of local softwoods such as, in the French Alps, larch, Douglas fir,
pine or silver fir. Built in ground contact without any wood preservatives, they
undergo fungal attacks since their construction starts. Fungi are well known to have
dramatic effects on wood mechanical properties (Curling et al. 2002) depending on,
inter alia, wood species, wood moisture content and temperature (Zabel and Morrell
1992). The two last parameters fluctuate significantly geographically and in time
(Brischke and Rapp 2008). As a consequence, practitioners meet difficulties in
quantifying the decay extent of logs. The standard EN 252 (CEN 2014) serves as
benchmark to assess the decay extent of samples decayed in the field. It is based on
qualitative method that is hardly repeatable from one experiment to another. Other
standards such as EN 15083 (CEN 2006) proposed quantitative methods based on
mass loss between intact and decayed states. However, the methods are applicable
in controlled conditions and hardly transferable to field applications. Moreover, the
mass loss due to decay is slower than the loss in mechanical properties (Curling
et al. 2002). Thus, the assessment of the decay extent by means of the measurement
of mechanical properties variations is more relevant in the context of ecological
engineering structures, especially for the early stages of decay. For that purpose,
practitioners can use non-destructive methods which have been developed to
appraise structures (Cruz et al. 2015; Tannert et al. 2013; Riggio et al. 2013).
However, few of them are suited to the constraints of these outdoor timber
structures. The non-destructive method has to be battery powered, little influenced
by moisture content (MC) of wood, especially when it is above the fibre saturation
point (FSP) and, finally, applicable to little decayed logs as well as severely decayed
logs including some cracks. Researches have studied methods suited to these
constraints as time domain reflectometry water content measurements or methods
based on species composition and population structures of basidiomycetes in wood
(Previati et al. 2012; Noetzli et al. 2008). Others developed methods allowing to
overcome them as methods based on near infrared spectroscopy (Barre et al. 2017;
Sandak et al. 2015). However, none of them assesses impact of decay on the
mechanical properties in a cost-effective way. This brings to light the vibration
resonant method (VRM), another common non-destructive method.
The vibration resonant method is currently used for mechanical grading of intact
(non-attacked) timber beams (Stapel and van de Kuilen 2013). The method is fast
and non-destructive. It consists of recording the displacement of a freely supported
beam subjected to longitudinal or transversal vibrations. From this measurement,
the Euler–Bernoulli or Timoshenko beam theories allow to calculate the modulus of
elasticity (MOE). The VRM has initially been elaborated to calculate the MOE for
beams of regular cross section and homogeneous material. However, studies have
shown its relevancy by comparison with static bending techniques for timber beam
including geometric or material singularities. Wang et al. (2002) found a strong
correlation (R2 ¼ 0:85 for Jack pine and 0.95 for red pine) between the MOE
2
obtained by transverse vibration (Etv) and by static bending technique (MOEs) for
logs (3.7 m in length and MC above FSP), i.e. a piece of wood which has not been
shaped by hewing or sawing. The logs diameter was between 11.9 and 27.9 cm.
This result has been confirmed by Green et al. (2006) who obtained high correlation
(R2 ¼ 0:88) for perfectly round large timber beams (diameter of 22.8 cm, length of
500 cm and MC of 15.5%). Finally, for wood above its fibre saturation point (FSP)
and compared to other methods based on sound or ultrasound propagation, the VRM
measures the MOE without being influenced by the moisture content as the MOE
remains constant above the FSP (Machek et al. 2001; Barrett and Hong 2009).
Furthermore, the VRM has been studied to investigate influence of decay on
bending property. Grinda and Goller (2005) and Alfredsen et al. (2006) confirmed
the VRM is a relevant method to quantify decay in wood. Nevertheless, these
studies consider small rectangular stakes with a maximum of 500 mm in length and
50 mm in height. The small sample size limits the number of defects, which are
naturally present in wood and influence the measure of the MOE. They differ
importantly from the beams used in ecological engineering timber structures (logs
of diameter from 10 to 30 cm). Moreover, regarding decayed wood and the VRM,
researches have been mainly focused on the effects on the MOE as it could be easily
compared to static measurements. However, the VRM allows measuring the
damping, another mechanical property highly involved in vibratory phenomena.
Few studies have been devoted to the sensitivity of the damping of samples
submitted to a fungal activity.
The damping characterizes the ability of a structure to dissipate mechanical
energy when it is subjected to cyclic loading. Its origin is associated with three
classes of mechanisms related to the material, the boundaries conditions and the
surrounding fluid (Woodhouse 1998). In wood science, this energy dissipation is
frequently quantified by the logarithmic decrement dlog or the damping ratio n,which are both frequency dependent and related together by the following relation
when n � 1 (Brancheriau 2002, p. 119):
dlog � 2pn ð1Þ
For dissipative linear structures with a single degree-of-freedom (SDOF system),
which corresponds to the simplest vibrating mechanical system, the calculation of nhas been largely studied in case of free vibration (De Silva 2005, p. 16). However,
the log on its elastic supports is a multiple degree-of-freedom system (MDOF
system) that possesses several vibration modes. The analysis of this system is
facilitated by considering the MDOF system as a superposition of SDOF systems
(Ouis 2000). The vibratory response of the log is then studied for each vibration
mode separately in order to determine the damping characteristics (Brancheriau
2002, p. 122).
Labonnote et al. (2013) itemised values of n in the scientific literature from 1950
for several intact wood species. Species investigated in the different studies were
mainly softwoods with moisture content (MC) below the FSP. The values are
between 0.0022 and 0.0068. The differences are due to diversities of species,
anatomical orientations and the experimental conditions. Below FSP, MC has a
3
significant effect on n (Obataya et al. 1998; Yeh et al. 1971) as it is well known for
other mechanical properties. n increases when the MC rises. But n behaviour has notbeen studied when the MC rises above FSP. Regarding the effects of decay on
damping, Ouis (1999) mentioned no significant research. Dunlop (1983) released
that decay leads to an increase in the damping of longitudinal acoustic waves. Ouis
(2000) confirms this fact using a room acoustical technique to detect decay in logs.
Bucur (2006) introduced the damping coefficient as an indicator of microstructural
modifications but without mentioning the decay.
The aim of this study was to assess the decay effect of small-diameter silver fir
logs (155 cm in length, 6–10 cm in diameter), on the damping and the MOE
measured by the transverse vibration resonant method. An experiment has been set
up in order to decay the small-diameter logs in a wide range. Their mechanical
properties have been measured by the VRM before and after the decay process.
First, the validity of the MOE and n measurements is discussed by taking into
account the geometric and material singularities of the logs. Then, the effect of
decay on each of the properties is analysed. Finally, a combined analysis of the
MOE and n is proposed to consider the effect of decay.
Materials and methods
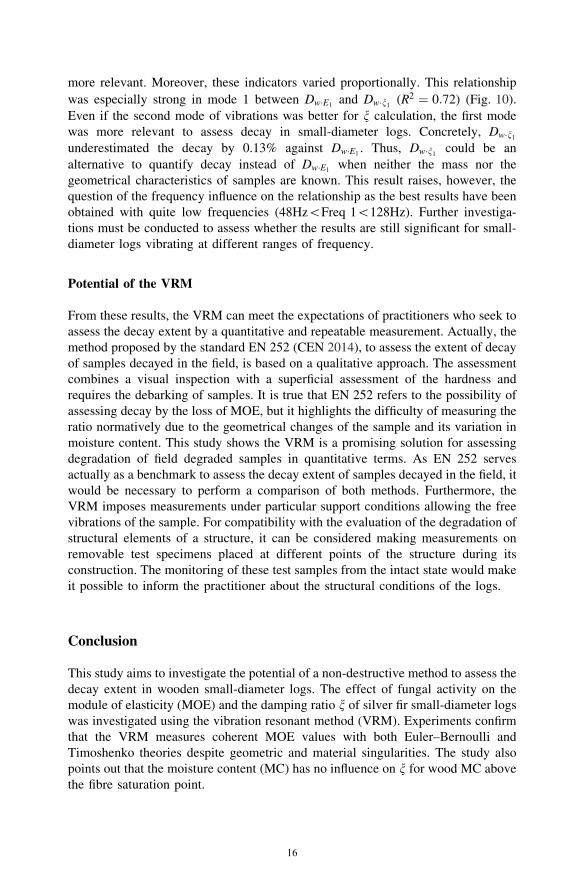
Preparation of samples
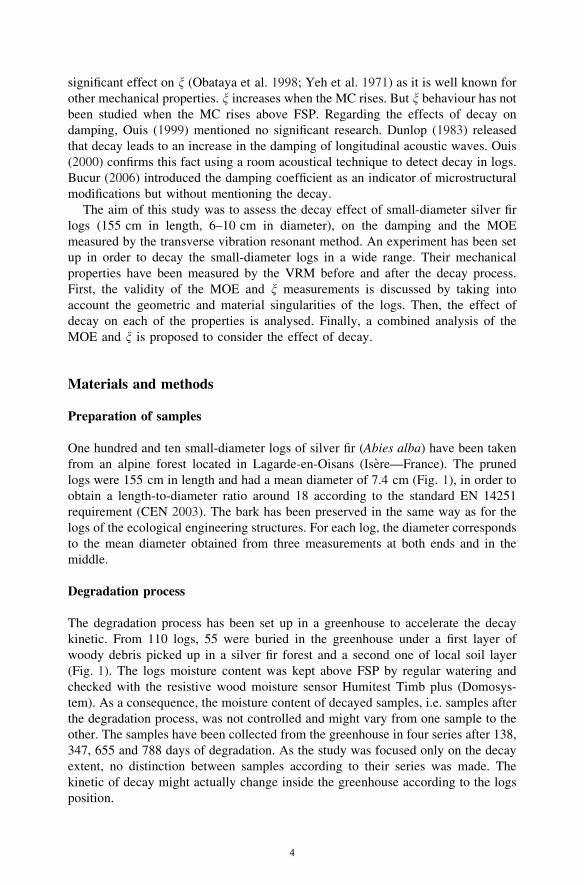
One hundred and ten small-diameter logs of silver fir (Abies alba) have been taken
from an alpine forest located in Lagarde-en-Oisans (Isere—France). The pruned
logs were 155 cm in length and had a mean diameter of 7.4 cm (Fig. 1), in order to
obtain a length-to-diameter ratio around 18 according to the standard EN 14251
requirement (CEN 2003). The bark has been preserved in the same way as for the
logs of the ecological engineering structures. For each log, the diameter corresponds
to the mean diameter obtained from three measurements at both ends and in the
middle.
Degradation process
The degradation process has been set up in a greenhouse to accelerate the decay
kinetic. From 110 logs, 55 were buried in the greenhouse under a first layer of
woody debris picked up in a silver fir forest and a second one of local soil layer
(Fig. 1). The logs moisture content was kept above FSP by regular watering and
checked with the resistive wood moisture sensor Humitest Timb plus (Domosys-
tem). As a consequence, the moisture content of decayed samples, i.e. samples after
the degradation process, was not controlled and might vary from one sample to the
other. The samples have been collected from the greenhouse in four series after 138,
347, 655 and 788 days of degradation. As the study was focused only on the decay
extent, no distinction between samples according to their series was made. The
kinetic of decay might actually change inside the greenhouse according to the logs
position.
4
MC and specific gravity measurement
The MC was measured on a 5 cm-transversal slice of each sample in intact and
decayed states. It was calculated according to Eq. 2. The result is a mean MC of the
slice and does not take into account the potential variation of theMC along the sample.
MC ¼ ½ðWh �W0Þ=W0� � 100 ð2Þ
where Wh is the wet weight and W0 is the oven-dry weight.
The oven-dry specific gravity (SG) was measured according to Williamson and
Wiemann (2010) on the same 5 cm-transversal slice used for the MC measurement.
The volume measurement consists in immersing the sample in a container placed on
a scale. The displayed mass thus corresponds to the volume of the sample. Before
immersion and after weighing, the samples were covered by a grease layer as thin as
possible to avoid rehydration. The SG was calculated with Eq. 3.
SG ¼ ðW0=V0Þ � 100 ð3Þ
where V0 is the oven-dry volume.
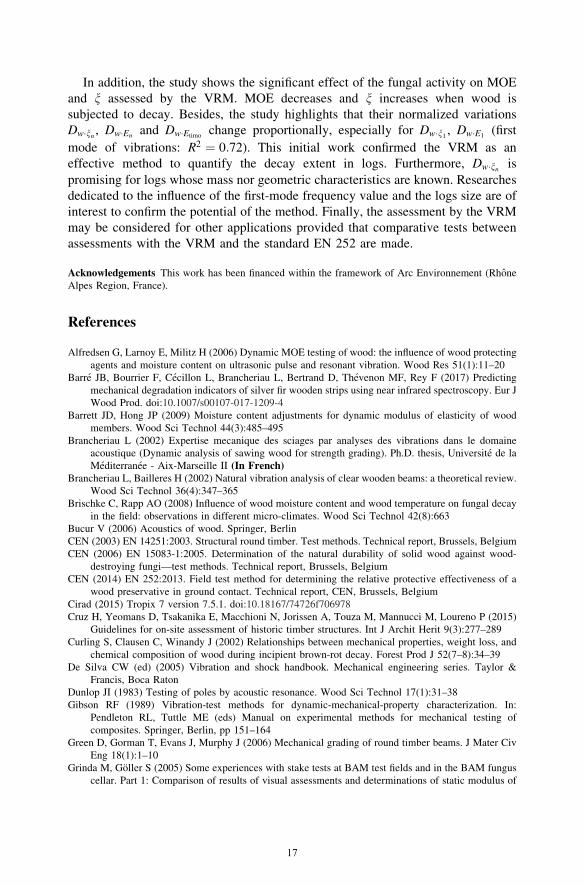
MOE measurement of intact or decayed small-diameter logs
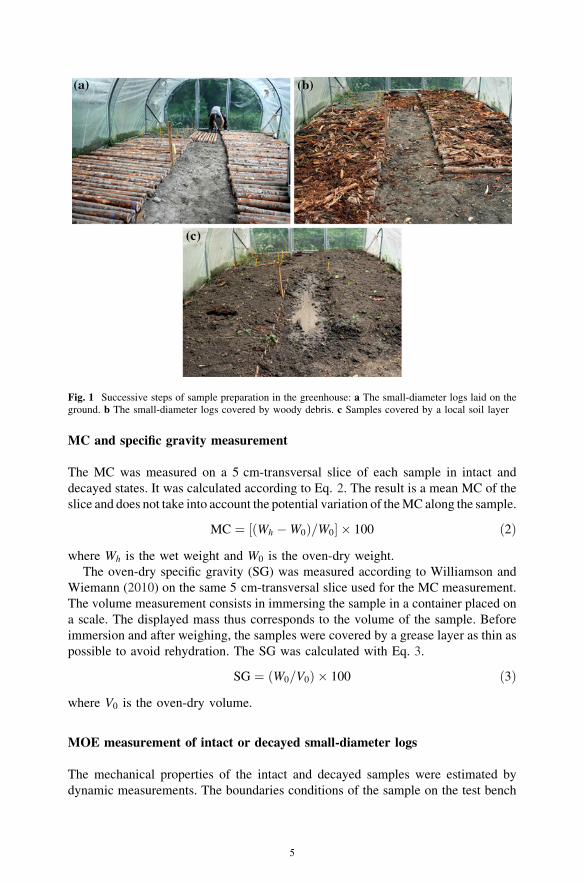
The mechanical properties of the intact and decayed samples were estimated by
dynamic measurements. The boundaries conditions of the sample on the test bench
Fig. 1 Successive steps of sample preparation in the greenhouse: a The small-diameter logs laid on theground. b The small-diameter logs covered by woody debris. c Samples covered by a local soil layer
5
(Fig. 2a) allowed reproducing free–free transverse vibrations thanks to rubber bands
supports. The supports were sufficiently elastic to neglect the effect of supports
position on the MOE measurement. The small-diameter logs were positioned with
an overhang of 10 cm at each extremity. A vertical impulse initiated the vibrations
at 5 cm from one extremity. The vertical vibrational response was acquired at 5 cm
from the other extremity with the piezoelectric accelerometer Deltraton type 4397
from Bruel and Kj�r magnetised on a screw (Fig. 2b). The accelerometer was
powered by Deltraton Power Supply WB 1372 and its signal converted by the
analogue-to-digital converter PicoScope 4224 from Pico Technology. The digital
signal was recorded with a sampling frequency of 20 kHz and an acquisition
duration of 1.638 s. The frequency resolution was 0.6 Hz.
The free vibrations occur theoretically in the vertical plane passing through the
longitudinal axis of the samples. The first three modes were determined from a
signal processing developed with R software (R Core Team 2016) and the signal
package (Signal Developers 2015). The fast Fourier transform (FFT) of the signal
was calculated to determine the frequency of each mode. The fundamental
frequency, i.e. the frequency of the first mode of vibration, corresponds to the first
most energetic peak of the FFT. The frequencies of the first three vibration modes
were recorded and used to calculate the MOE values.
The MOE has been calculated based on both the Euler–Bernoulli and
Timoshenko models. Euler–Bernoulli theory neglects the distortion caused by
shear and the effects of the elastic supports. It gives the analytical expression of the
MOE for beams with a high length (l) to depth (h) ratio [l=h[ 20 according to
Brancheriau and Bailleres (2002)]:
En ¼ 4p2qSL4f 2nIXn
ð4Þ
with En the MOE calculated for the mode n, I ¼ p � d4=64 the moment of inertia
with d the mean diameter of the sample, q the specific gravity at the sample MC, S
area of the cross section, L the beam length, fn the natural frequency and Xn specific
coefficient: X1 ¼ 500:5467;X2 ¼ 3803:14;X3 ¼ 14;619:72. The modulus of elas-
ticity En has been assumed consistent in the whole beam.
Fig. 2 a Small-diameter log prepared on the test bench for the dynamic test. b Accelerometer installedon the small-diameter log
6
En was, respectively, noted Esn and Ed
n for intact and decayed states. The
normalized loss in En of a sample, Dw�En, is defined for the mode n by:
Dw�En¼ Es
n � Edn
Esn
ð5Þ
The Timoshenko theory takes into account the rotational inertia and the strain
caused by shear. The effects of the elastic supports are still neglected. The modulus
of elasticity is given for natural frequency n by the solution of Bordonne (Bran-
cheriau and Bailleres 2002):
Etimo
q� Etimo
KGaF2ðmnÞ4p2
SL4
I
f 2nXn
� �¼ 4p2
SL4
I
f 2nXn
1þ aF1ðmnÞ½ � ð6Þ
with Etimo the MOE, G the shear modulus, I ¼ p � d4=64 the moment of inertia with
d the mean diameter of the sample, q the specific gravity, S the area of the cross
section, L the beam length, fn the natural frequency, Xn ¼ m4n, K the shear correction
factor, mn the solution of the equation cosðmnÞchðmnÞ ¼ 1 and
F1ðmnÞ ¼ h2ðmnÞ þ 6hðmnÞ ð7Þ
F2ðmnÞ ¼ h2ðmnÞ � 2hðmnÞ ð8Þ
hðmnÞ ¼ mn
tanðmnÞtanhðmnÞtanðmnÞ � tanhðmnÞ
ð9Þ
The modulus of elasticity Etimo has been assumed consistent in the whole beam.
Etimo is, respectively, noted Estimo and Ed
timo for intact and decayed states. The nor-
malized loss in Etimo of a sample is defined for the mode n by:
Dw:Etimo¼ Es
timo � Edtimo
Estimo
ð10Þ
Damping ratio n measurement of intact or decayed small-diameter logs
It was assumed that the small-diameter log behaved like an underdamped system
submitted to viscously damped free vibrations. This system with multiple degrees-
of-freedom has several modes of vibration and equates to a superposition of
dissipative linear structures with single degree-of-freedom (SDOF system) associ-
ated with each mode (Brancheriau 2002, p. 120). Thus, for each mode, the raw
acceleration signal was filtered in spectral domain by a pass-band Tchebychev filter
centred on the frequency of the considered mode. As a result, the filtered
acceleration signal in temporal domain decreased exponentially over time
(Thomson and Dahleh 1998) and its outer envelope amax was temporally governed
by Eq. 11 for the pulsation xn.
7
amaxðtÞ ¼ Ae�nnxnt ð11Þ
where n is the number of the mode, nn is the damping ratio, A is a constant and xn
the fundamental pulsation.
n was estimated by a curve-fitting method: the natural logarithm of amaxðtÞ wasfitted by a linear regression. n is defined as the ratio of the slope of the regression
line and the fundamental pulsation xn. nin and ndn were, respectively, the damping
ratio of a sample in intact and decayed states. The normalized gain in n of a sample
was defined by:
Dw:nn ¼ndn � nsn
ndnð12Þ
Comparison Dw�nn versus Dw�Enand versus Dw�Etimo
Dw�nn , Dw�Enand Dw�Etimo
were first graphically compared with boxplots that
summarize the minimum and maximum of dataset, the quartiles, the median and, if
any, the outliers. The relationships between Dw�nn versus Dw�Enand versus Dw�Etimo
were tested by a linear regression and quantified through its coefficient of
determination r2.
Results
Specific gravity measurement
On average, the SG is 463 kg m-3 for intact samples and 397 kg m-3 for decayed
samples. The SD of decayed samples increases from 53 to 65 kg m-3 compared to
SD of intact samples.
MOE measurement of intact or decayed small-diameter logs
For intact and most of decayed samples, the first three modes were always
identified. The third mode was not identified for 12 decayed samples (Table 1).
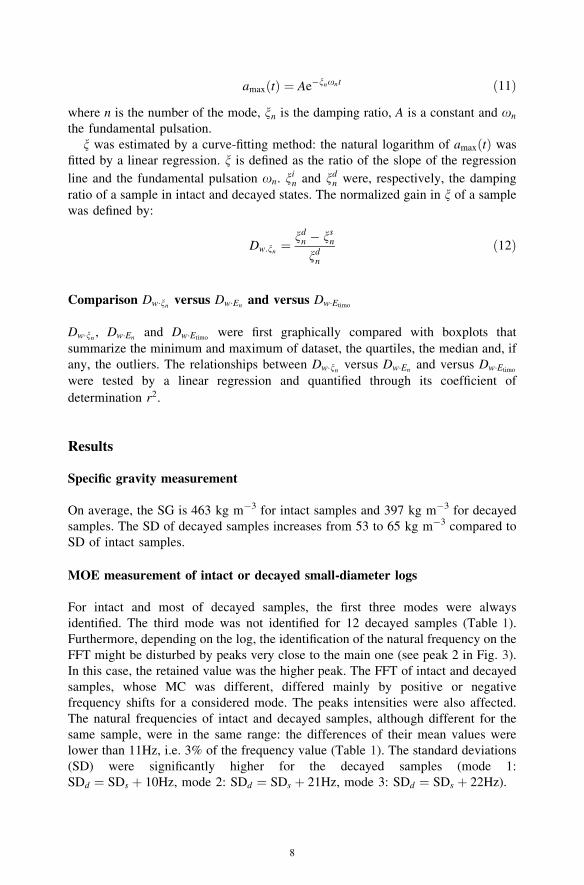
Furthermore, depending on the log, the identification of the natural frequency on the
FFT might be disturbed by peaks very close to the main one (see peak 2 in Fig. 3).
In this case, the retained value was the higher peak. The FFT of intact and decayed
samples, whose MC was different, differed mainly by positive or negative
frequency shifts for a considered mode. The peaks intensities were also affected.
The natural frequencies of intact and decayed samples, although different for the
same sample, were in the same range: the differences of their mean values were
lower than 11Hz, i.e. 3% of the frequency value (Table 1). The standard deviations
(SD) were significantly higher for the decayed samples (mode 1:
SDd ¼ SDs þ 10Hz, mode 2: SDd ¼ SDs þ 21Hz, mode 3: SDd ¼ SDs þ 22Hz).
8
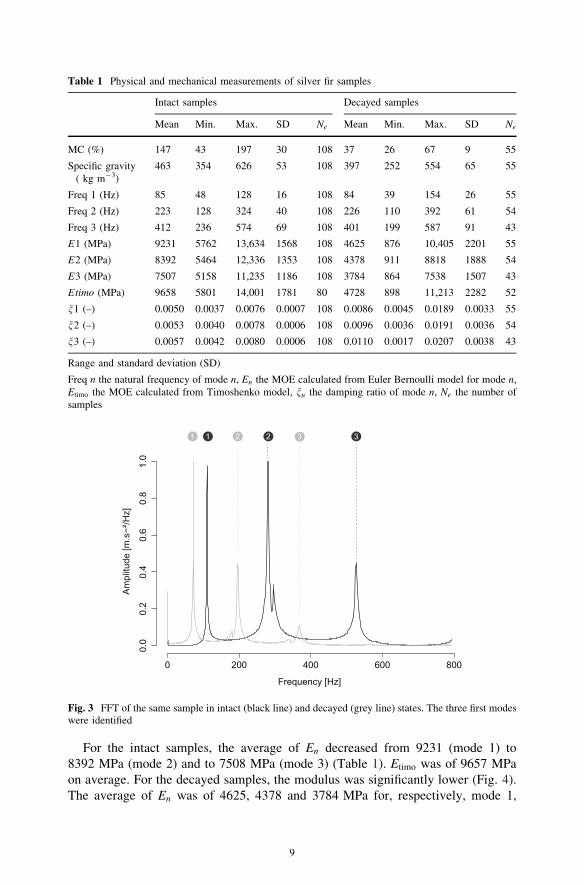
For the intact samples, the average of En decreased from 9231 (mode 1) to
8392 MPa (mode 2) and to 7508 MPa (mode 3) (Table 1). Etimo was of 9657 MPa
on average. For the decayed samples, the modulus was significantly lower (Fig. 4).
The average of En was of 4625, 4378 and 3784 MPa for, respectively, mode 1,
Table 1 Physical and mechanical measurements of silver fir samples
Intact samples Decayed samples
Mean Min. Max. SD Ne Mean Min. Max. SD Ne
MC (%) 147 43 197 30 108 37 26 67 9 55
Specific gravity
( kg m-3)
463 354 626 53 108 397 252 554 65 55
Freq 1 (Hz) 85 48 128 16 108 84 39 154 26 55
Freq 2 (Hz) 223 128 324 40 108 226 110 392 61 54
Freq 3 (Hz) 412 236 574 69 108 401 199 587 91 43
E1 (MPa) 9231 5762 13,634 1568 108 4625 876 10,405 2201 55
E2 (MPa) 8392 5464 12,336 1353 108 4378 911 8818 1888 54
E3 (MPa) 7507 5158 11,235 1186 108 3784 864 7538 1507 43
Etimo (MPa) 9658 5801 14,001 1781 80 4728 898 11,213 2282 52
n1 (–) 0.0050 0.0037 0.0076 0.0007 108 0.0086 0.0045 0.0189 0.0033 55
n2 (–) 0.0053 0.0040 0.0078 0.0006 108 0.0096 0.0036 0.0191 0.0036 54
n3 (–) 0.0057 0.0042 0.0080 0.0006 108 0.0110 0.0017 0.0207 0.0038 43
Range and standard deviation (SD)
Freq n the natural frequency of mode n, En the MOE calculated from Euler Bernoulli model for mode n,
Etimo the MOE calculated from Timoshenko model, nn the damping ratio of mode n, Ne the number of
samples
0 200 400 600 800
0.0
0.2
0.4
0.6
0.8
1.0
Frequency [Hz]
1 2 31 2 3
Fig. 3 FFT of the same sample in intact (black line) and decayed (grey line) states. The three first modeswere identified
9
mode 2 and mode 3. The average of Etimo was of 4728 MPa. The Wilcoxon signed-
rank test applied to intact and decayed En for each mode gave significantly low p
value of 1.13e-10, 1.67e-10 and 2.27e-13 for modes 1, 2 and 3. For Etimo, the
p value was of 3.61e-10.
Damping ratio n measurement of intact or decayed small-diameter logs
For a considered mode, the presence of multi-peaks in the FFT of the signal
indicated the presence of secondary modes of lesser intensities and induced in
particular by the geometrical irregularities of the samples. As a result, the signal
damping presented oscillations (Fig. 5a) depending on the samples and the modes.
As the damping did not follow an exponential law, the natural logarithm of amaxðtÞwas noisy (Fig. 5b). However, the coefficients of determination R2 were high for all
5000
10000
mode 1
soun
d
mode 1
deca
y
mode 2
soun
d
mode 2
deca
y
mode 3
soun
d
mode 3
deca
y
timo.
soun
d
timo.
deca
y
Dyn
amic
MO
E [M
Pa]
Fig. 4 Dynamic MOE of intact (black) and decayed samples (grey)
0.0
0.2
0.4
0.6
0.8
Frequency [Hz]1
(a)
0 200 300 400 500 6000.5 1.0 1.5
50
5
Time [s]
Acce
lera
tion
[m.s
²]
(b)
0.5 1.0 1.5Time [s]
R²= 0.93= 0.0050
n
ln(a
max
)
ln(A)
(c)
24
20
4
Fig. 5 Successive steps of the signal numerical treatment for n calculation. Example is given for mode 1.a FFT of the raw signal filtered by a pass-band filter centred on x1 (92.2 Hz). b First mode filteredacceleration (grey curve) and the maxima amaxðtÞ (black dots). c Natural logarithm of the maximalnðamaxðtÞÞ with its linear regression. The slope of this regression divided by the pulsation x1 allows tocalculate n1
10
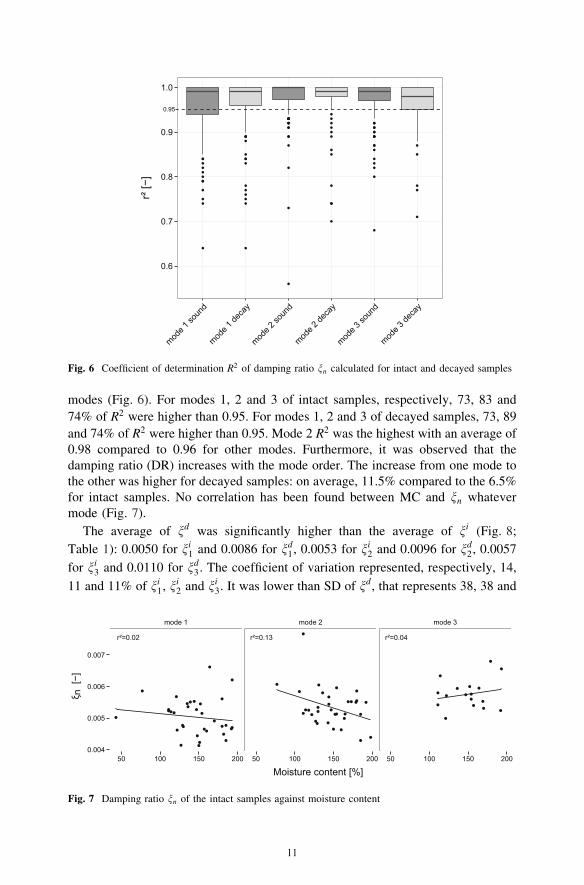
modes (Fig. 6). For modes 1, 2 and 3 of intact samples, respectively, 73, 83 and
74% of R2 were higher than 0.95. For modes 1, 2 and 3 of decayed samples, 73, 89
and 74% of R2 were higher than 0.95. Mode 2 R2 was the highest with an average of
0.98 compared to 0.96 for other modes. Furthermore, it was observed that the
damping ratio (DR) increases with the mode order. The increase from one mode to
the other was higher for decayed samples: on average, 11.5% compared to the 6.5%
for intact samples. No correlation has been found between MC and nn whatever
mode (Fig. 7).
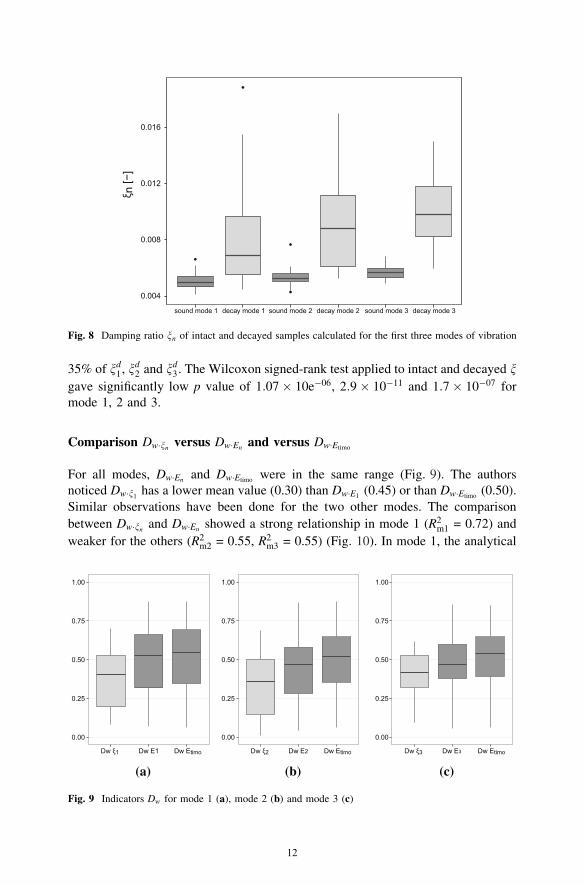
The average of nd was significantly higher than the average of ni (Fig. 8;
Table 1): 0.0050 for ni1 and 0.0086 for nd1, 0.0053 for ni2 and 0.0096 for nd2, 0.0057
for ni3 and 0.0110 for nd3. The coefficient of variation represented, respectively, 14,
11 and 11% of ni1, ni2 and ni3. It was lower than SD of nd, that represents 38, 38 and
0.6
0.7
0.8
0.9
1.0
mode 1
soun
d
mode 1
deca
y
mode 2
soun
d
mode 2
deca
y
mode 3
soun
d
mode 3
deca
y
0.95
Fig. 6 Coefficient of determination R2 of damping ratio nn calculated for intact and decayed samples
3edom2edommode 1
0.004
0.005
0.006
0.007
50 100 150 200 50 100 150 200 50 100 150 200
Moisture content [%]
n
40.0=²r31.0=²r20.0=²r
Fig. 7 Damping ratio nn of the intact samples against moisture content
11
35% of nd1, nd2 and n
d3. The Wilcoxon signed-rank test applied to intact and decayed n
gave significantly low p value of 1:07� 10e�06, 2:9� 10�11 and 1:7� 10�07 for
mode 1, 2 and 3.
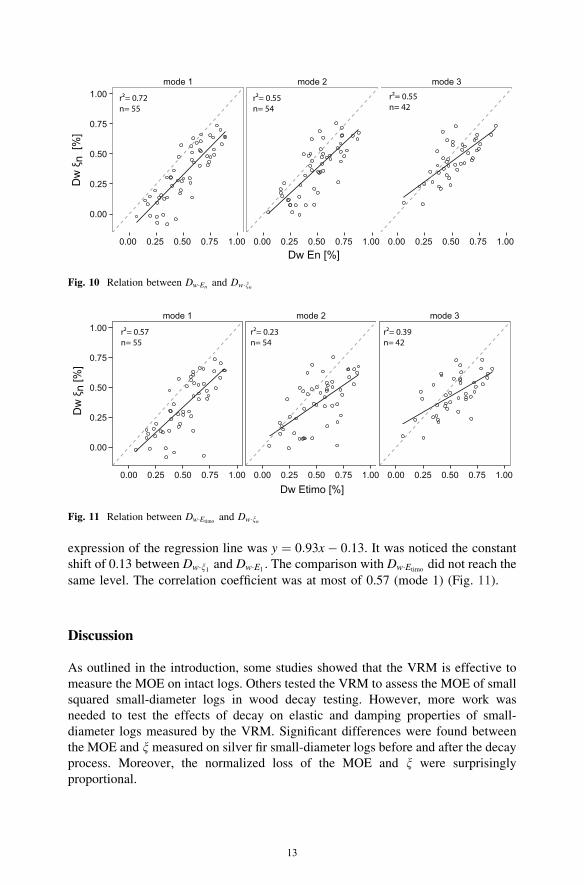
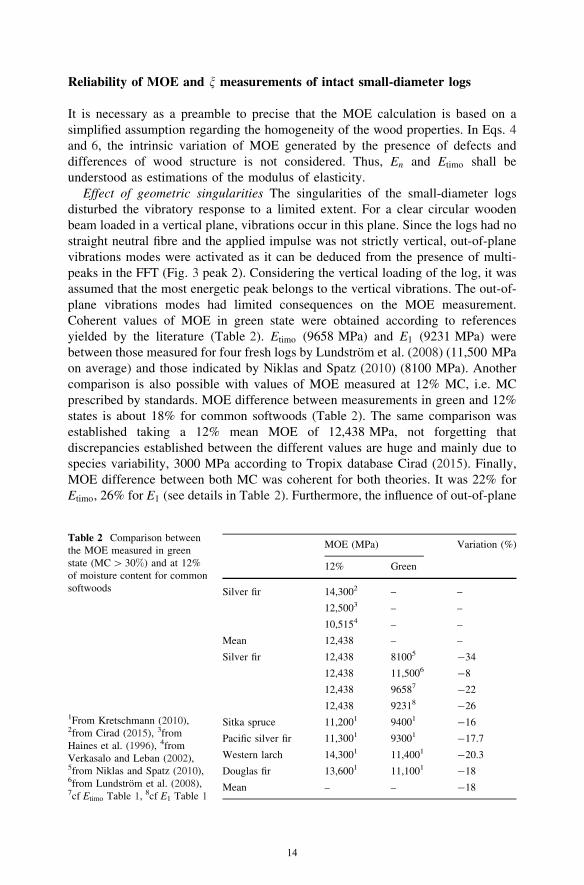
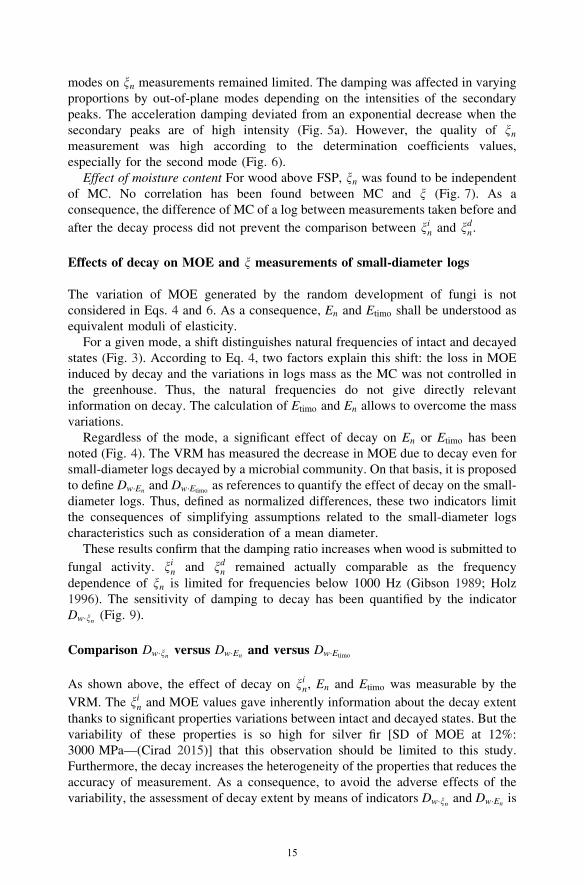
Comparison Dw�nn versus Dw�Enand versus Dw�Etimo
For all modes, Dw�Enand Dw�Etimo
were in the same range (Fig. 9). The authors
noticed Dw�n1 has a lower mean value (0.30) than Dw�E1(0.45) or than Dw�Etimo
(0.50).
Similar observations have been done for the two other modes. The comparison
between Dw�nn and Dw�Enshowed a strong relationship in mode 1 (R2
m1 = 0.72) and
weaker for the others (R2m2 = 0.55, R2
m3 = 0.55) (Fig. 10). In mode 1, the analytical
0.004
0.008
0.012
0.016
sound mode 1 decay mode 1 sound mode 2 decay mode 2 sound mode 3 decay mode 3
n
Fig. 8 Damping ratio nn of intact and decayed samples calculated for the first three modes of vibration
0.00
0.25
0.50
0.75
1.00
1 Dw E1 Dw Etimo
(a)
0.00
0.25
0.50
0.75
1.00
2 Dw E2 Dw Etimo
(b)
0.00
0.25
0.50
0.75
1.00
3 Dw E3 Dw Etimo
(c)
Fig. 9 Indicators Dw for mode 1 (a), mode 2 (b) and mode 3 (c)
12
expression of the regression line was y ¼ 0:93x� 0:13. It was noticed the constant
shift of 0.13 between Dw�n1 and Dw�E1. The comparison with Dw�Etimo
did not reach the
same level. The correlation coefficient was at most of 0.57 (mode 1) (Fig. 11).
Discussion
As outlined in the introduction, some studies showed that the VRM is effective to
measure the MOE on intact logs. Others tested the VRM to assess the MOE of small
squared small-diameter logs in wood decay testing. However, more work was
needed to test the effects of decay on elastic and damping properties of small-
diameter logs measured by the VRM. Significant differences were found between
the MOE and n measured on silver fir small-diameter logs before and after the decay
process. Moreover, the normalized loss of the MOE and n were surprisingly
proportional.
3edom2edom1edom
0.00
0.25
0.50
0.75
1.00
0.00 0.25 0.50 0.75 1.00 0.00 0.25 0.50 0.75 1.00 0.00 0.25 0.50 0.75 1.00 Dw En [%]
Dw
n
[%]
r²= 0.72n= 55
r²= 0.55n= 54
r²= 0.55n= 42
Fig. 10 Relation between Dw�Enand Dw�nn
3edom2edom1edom
0.00
0.25
0.50
0.75
1.00
0.00 0.25 0.50 0.75 1.00 0.00 0.25 0.50 0.75 1.00 0.00 0.25 0.50 0.75 1.00
Dw Etimo [%]
Dw
n
[%]
r²= 0.57 n= 55
r²= 0.23 n= 54
r²= 0.39 n= 42
Fig. 11 Relation between Dw�Etimoand Dw�nn
13
Reliability of MOE and n measurements of intact small-diameter logs
It is necessary as a preamble to precise that the MOE calculation is based on a
simplified assumption regarding the homogeneity of the wood properties. In Eqs. 4
and 6, the intrinsic variation of MOE generated by the presence of defects and
differences of wood structure is not considered. Thus, En and Etimo shall be
understood as estimations of the modulus of elasticity.
Effect of geometric singularities The singularities of the small-diameter logs
disturbed the vibratory response to a limited extent. For a clear circular wooden
beam loaded in a vertical plane, vibrations occur in this plane. Since the logs had no
straight neutral fibre and the applied impulse was not strictly vertical, out-of-plane
vibrations modes were activated as it can be deduced from the presence of multi-
peaks in the FFT (Fig. 3 peak 2). Considering the vertical loading of the log, it was
assumed that the most energetic peak belongs to the vertical vibrations. The out-of-
plane vibrations modes had limited consequences on the MOE measurement.
Coherent values of MOE in green state were obtained according to references
yielded by the literature (Table 2). Etimo (9658 MPa) and E1 (9231 MPa) were
between those measured for four fresh logs by Lundstrom et al. (2008) (11,500 MPa
on average) and those indicated by Niklas and Spatz (2010) (8100 MPa). Another
comparison is also possible with values of MOE measured at 12% MC, i.e. MC
prescribed by standards. MOE difference between measurements in green and 12%
states is about 18% for common softwoods (Table 2). The same comparison was
established taking a 12% mean MOE of 12,438 MPa, not forgetting that
discrepancies established between the different values are huge and mainly due to
species variability, 3000 MPa according to Tropix database Cirad (2015). Finally,
MOE difference between both MC was coherent for both theories. It was 22% for
Etimo, 26% for E1 (see details in Table 2). Furthermore, the influence of out-of-plane
Table 2 Comparison between
the MOE measured in green
state (MC[ 30%) and at 12%
of moisture content for common
softwoods
1From Kretschmann (2010),2from Cirad (2015), 3from
Haines et al. (1996), 4from
Verkasalo and Leban (2002),5from Niklas and Spatz (2010),6from Lundstrom et al. (2008),7cf Etimo Table 1, 8cf E1 Table 1
MOE (MPa) Variation (%)
12% Green
Silver fir 14,3002 – –
12,5003 – –
10,5154 – –
Mean 12,438 – –
Silver fir 12,438 81005 -34
12,438 11,5006 -8
12,438 96587 -22
12,438 92318 -26
Sitka spruce 11,2001 94001 -16
Pacific silver fir 11,3001 93001 -17.7
Western larch 14,3001 11,4001 -20.3
Douglas fir 13,6001 11,1001 -18
Mean – – -18
14
modes on nn measurements remained limited. The damping was affected in varying
proportions by out-of-plane modes depending on the intensities of the secondary
peaks. The acceleration damping deviated from an exponential decrease when the
secondary peaks are of high intensity (Fig. 5a). However, the quality of nnmeasurement was high according to the determination coefficients values,
especially for the second mode (Fig. 6).
Effect of moisture content For wood above FSP, nn was found to be independent
of MC. No correlation has been found between MC and n (Fig. 7). As a
consequence, the difference of MC of a log between measurements taken before and
after the decay process did not prevent the comparison between nin and ndn.
Effects of decay on MOE and n measurements of small-diameter logs
The variation of MOE generated by the random development of fungi is not
considered in Eqs. 4 and 6. As a consequence, En and Etimo shall be understood as
equivalent moduli of elasticity.
For a given mode, a shift distinguishes natural frequencies of intact and decayed
states (Fig. 3). According to Eq. 4, two factors explain this shift: the loss in MOE
induced by decay and the variations in logs mass as the MC was not controlled in
the greenhouse. Thus, the natural frequencies do not give directly relevant
information on decay. The calculation of Etimo and En allows to overcome the mass
variations.
Regardless of the mode, a significant effect of decay on En or Etimo has been
noted (Fig. 4). The VRM has measured the decrease in MOE due to decay even for
small-diameter logs decayed by a microbial community. On that basis, it is proposed
to define Dw�Enand Dw�Etimo
as references to quantify the effect of decay on the small-
diameter logs. Thus, defined as normalized differences, these two indicators limit
the consequences of simplifying assumptions related to the small-diameter logs
characteristics such as consideration of a mean diameter.
These results confirm that the damping ratio increases when wood is submitted to
fungal activity. nin and ndn remained actually comparable as the frequency
dependence of nn is limited for frequencies below 1000 Hz (Gibson 1989; Holz
1996). The sensitivity of damping to decay has been quantified by the indicator
Dw�nn (Fig. 9).
Comparison Dw�nn versus Dw�Enand versus Dw�Etimo
As shown above, the effect of decay on nin, En and Etimo was measurable by the
VRM. The nin and MOE values gave inherently information about the decay extent
thanks to significant properties variations between intact and decayed states. But the
variability of these properties is so high for silver fir [SD of MOE at 12%:
3000 MPa—(Cirad 2015)] that this observation should be limited to this study.
Furthermore, the decay increases the heterogeneity of the properties that reduces the
accuracy of measurement. As a consequence, to avoid the adverse effects of the
variability, the assessment of decay extent by means of indicators Dw�nn and Dw�Enis
15
more relevant. Moreover, these indicators varied proportionally. This relationship
was especially strong in mode 1 between Dw�E1and Dw�n1 (R2 ¼ 0:72) (Fig. 10).
Even if the second mode of vibrations was better for n calculation, the first mode
was more relevant to assess decay in small-diameter logs. Concretely, Dw�n1underestimated the decay by 0.13% against Dw�E1
. Thus, Dw�n1 could be an
alternative to quantify decay instead of Dw�E1when neither the mass nor the
geometrical characteristics of samples are known. This result raises, however, the
question of the frequency influence on the relationship as the best results have been
obtained with quite low frequencies (48Hz\Freq 1\128Hz). Further investiga-
tions must be conducted to assess whether the results are still significant for small-
diameter logs vibrating at different ranges of frequency.
Potential of the VRM
From these results, the VRM can meet the expectations of practitioners who seek to
assess the decay extent by a quantitative and repeatable measurement. Actually, the
method proposed by the standard EN 252 (CEN 2014), to assess the extent of decay
of samples decayed in the field, is based on a qualitative approach. The assessment
combines a visual inspection with a superficial assessment of the hardness and
requires the debarking of samples. It is true that EN 252 refers to the possibility of
assessing decay by the loss of MOE, but it highlights the difficulty of measuring the
ratio normatively due to the geometrical changes of the sample and its variation in
moisture content. This study shows the VRM is a promising solution for assessing
degradation of field degraded samples in quantitative terms. As EN 252 serves
actually as a benchmark to assess the decay extent of samples decayed in the field, it
would be necessary to perform a comparison of both methods. Furthermore, the
VRM imposes measurements under particular support conditions allowing the free
vibrations of the sample. For compatibility with the evaluation of the degradation of
structural elements of a structure, it can be considered making measurements on
removable test specimens placed at different points of the structure during its
construction. The monitoring of these test samples from the intact state would make
it possible to inform the practitioner about the structural conditions of the logs.
Conclusion
This study aims to investigate the potential of a non-destructive method to assess the
decay extent in wooden small-diameter logs. The effect of fungal activity on the
module of elasticity (MOE) and the damping ratio n of silver fir small-diameter logs
was investigated using the vibration resonant method (VRM). Experiments confirm
that the VRM measures coherent MOE values with both Euler–Bernoulli and
Timoshenko theories despite geometric and material singularities. The study also
points out that the moisture content (MC) has no influence on n for wood MC above
the fibre saturation point.
16
In addition, the study shows the significant effect of the fungal activity on MOE
and n assessed by the VRM. MOE decreases and n increases when wood is
subjected to decay. Besides, the study highlights that their normalized variations
Dw�nn , Dw�Enand Dw�Etimo
change proportionally, especially for Dw�n1 , Dw�E1(first
mode of vibrations: R2 ¼ 0:72). This initial work confirmed the VRM as an
effective method to quantify the decay extent in logs. Furthermore, Dw�nn is
promising for logs whose mass nor geometric characteristics are known. Researches
dedicated to the influence of the first-mode frequency value and the logs size are of
interest to confirm the potential of the method. Finally, the assessment by the VRM
may be considered for other applications provided that comparative tests between
assessments with the VRM and the standard EN 252 are made.
Acknowledgements This work has been financed within the framework of Arc Environnement (Rhone
Alpes Region, France).
References
Alfredsen G, Larnoy E, Militz H (2006) Dynamic MOE testing of wood: the influence of wood protecting
agents and moisture content on ultrasonic pulse and resonant vibration. Wood Res 51(1):11–20
Barre JB, Bourrier F, Cecillon L, Brancheriau L, Bertrand D, Thevenon MF, Rey F (2017) Predicting
mechanical degradation indicators of silver fir wooden strips using near infrared spectroscopy. Eur J
Wood Prod. doi:10.1007/s00107-017-1209-4
Barrett JD, Hong JP (2009) Moisture content adjustments for dynamic modulus of elasticity of wood
members. Wood Sci Technol 44(3):485–495
Brancheriau L (2002) Expertise mecanique des sciages par analyses des vibrations dans le domaine
acoustique (Dynamic analysis of sawing wood for strength grading). Ph.D. thesis, Universite de la
Mediterranee - Aix-Marseille II (In French)Brancheriau L, Bailleres H (2002) Natural vibration analysis of clear wooden beams: a theoretical review.
Wood Sci Technol 36(4):347–365
Brischke C, Rapp AO (2008) Influence of wood moisture content and wood temperature on fungal decay
in the field: observations in different micro-climates. Wood Sci Technol 42(8):663
Bucur V (2006) Acoustics of wood. Springer, Berlin
CEN (2003) EN 14251:2003. Structural round timber. Test methods. Technical report, Brussels, Belgium
CEN (2006) EN 15083-1:2005. Determination of the natural durability of solid wood against wood-
destroying fungi—test methods. Technical report, Brussels, Belgium
CEN (2014) EN 252:2013. Field test method for determining the relative protective effectiveness of a
wood preservative in ground contact. Technical report, CEN, Brussels, Belgium
Cirad (2015) Tropix 7 version 7.5.1. doi:10.18167/74726f706978
Cruz H, Yeomans D, Tsakanika E, Macchioni N, Jorissen A, Touza M, Mannucci M, Loureno P (2015)
Guidelines for on-site assessment of historic timber structures. Int J Archit Herit 9(3):277–289
Curling S, Clausen C, Winandy J (2002) Relationships between mechanical properties, weight loss, and
chemical composition of wood during incipient brown-rot decay. Forest Prod J 52(7–8):34–39
De Silva CW (ed) (2005) Vibration and shock handbook. Mechanical engineering series. Taylor &
Francis, Boca Raton
Dunlop JI (1983) Testing of poles by acoustic resonance. Wood Sci Technol 17(1):31–38
Gibson RF (1989) Vibration-test methods for dynamic-mechanical-property characterization. In:
Pendleton RL, Tuttle ME (eds) Manual on experimental methods for mechanical testing of
composites. Springer, Berlin, pp 151–164
Green D, Gorman T, Evans J, Murphy J (2006) Mechanical grading of round timber beams. J Mater Civ
Eng 18(1):1–10
Grinda M, Goller S (2005) Some experiences with stake tests at BAM test fields and in the BAM fungus
cellar. Part 1: Comparison of results of visual assessments and determinations of static modulus of
17
elasticity (MOE). Document IRG/WP 05-20319. International Research Group on Wood Protection,
p 28
Haines D, Leban JM, Herb C (1996) Determination of Young’s modulus for spruce, fir and isotropic
materials by the resonance flexure method with comparisons to static flexure and other dynamic
methods. Wood Sci Technol 30(4):253–263
Holz D (1996) Tropical hardwoods used in musical instruments—can we substitute them by temperate
zone species? Holzforschung 50(2):121–129
Kretschmann D (2010) Mechanical properties of wood. In: Ross R (ed) Wood handbook: wood as an
engineering material, chap 5. U.S. Department of Agriculture, Forest Service, Forest Products
Laboratory, Madison
Labonnote N, Ronnquist A, Malo KA (2013) Experimental evaluations of material damping in timber
beams of structural dimensions. Wood Sci Technol 47(5):1033–1050
Lundstrom T, Stoffel M, Stockli V (2008) Fresh-stem bending of silver fir and Norway spruce. Tree
Physiol 28(3):355–366
Machek L, Militz RH, Sierra A (2001) As the influence of wood moisture content on dynamic modulus of
elasticity measurements in durability testing. Holzforschung Holzverwertung 53(5):97–100
Niklas KJ, Spatz HC (2010) Worldwide correlations of mechanical properties and green wood density.
Am J Bot 97(10):1587–1594
Noetzli K, Boell A, Graf F, Sieber T, Holdenrieder O (2008) Influence of decay fungi, construction
characteristics, and environmental conditions on the quality of wooden check-dams. Forest Prod J
58(4):72–79
Obataya E, Norimoto M, Gril J (1998) The effects of adsorbed water on dynamic mechanical properties
of wood. Polymer 39(14):3059–3064
Ouis D (1999) Vibrational and acoustical experiments on logs of spruce. Wood Sci Technol
33(2):151–184
Ouis D (2000) Detection of decay in logs through measuring the dampening of bending vibrations by
means of a room acoustical technique. Wood Sci Technol 34(3):221–236
Previati M, Canone D, Bevilacqua I, Boetto G, Pognant D, Ferraris S (2012) Evaluation of wood
degradation for timber check dams using time domain reflectometry water content measurements.
Ecol Eng 44:259–268
R Core Team (2016) R: a language and environment for statistical computing. R Foundation for
Statistical Computing, Vienna, Austria. https://www.R-project.org/
Riggio M, Anthony RW, Augelli F, Kasal B, Lechner T, Muller W, Tannert T (2013) In situ assessment
of structural timber using non-destructive techniques. Mater Struct 47(5):749–766
Sandak A, Sandak J, Riggio M (2015) Assessment of wood structural members degradation by means of
infrared spectroscopy: an overview. Struct Control Health Monit. doi:10.1002/stc.1777
Signal Developers (2015) Signal: signal processing. http://r-forge.r-project.org/projects/signal/
Stapel P, van de Kuilen JWG (2013) Effects of grading procedures on the scatter of characteristic values
of European grown sawn timber. Mater Struct 46(9):1587–1598
Tannert T, Anthony RW, Kasal B, Kloiber M, Piazza M, Riggio M, Rinn F, Widmann R, Yamaguchi N
(2013) In situ assessment of structural timber using semi-destructive techniques. Mater Struct
47(5):767–785
Thomson WT, Dahleh MD (1998) Theory of vibration with applications, 5th edn. Prentice Hall, Upper
Saddle River
Verkasalo E, Leban JM (2002) MOE and MOR in static bending of small clear 520 specimens of Scots
pine, Norway spruce and European fir from Finland and France and their prediction for the
comparison of wood quality. Paperi ja Puu/Paper and Timber 84(5):332–340
Wang X, Ross R, Mattson J, Erickson J, Forsman J, Geske E, Wehr M (2002) Nondestructive evaluation
techniques for assessing modulus of elasticity and stiffness of small-diameter logs. Forest Prod J
52(2):79–85
Williamson GB, Wiemann MC (2010) Measuring wood specific gravity..correctly. Am J Bot
97(3):519–524
Woodhouse J (1998) Linear damping models for structural vibration. J Sound Vib 215(3):547–569
Yeh CT, Hartz BJ, Brown CB (1971) Damping sources in wood structures. J Sound Vib 19(4):411–419
Zabel RA, Morrell JJ (1992) Wood microbiology: decay and its prevention. Academic Press, San Diego
18


