
i
ELECTRICAL OVERCURRENT PROTECTION GRADING IN V4D
By
Miguel Angel ENGONGA ELA AKABA
ID 14635
Dissertation Submitted
In Partial Fulfillment of the Requirements for the
Bachelor of Engineering (Hons)
(Electrical & Electronic Engineering)
SEPTEMBER 2015
Universiti Teknologi PETRONAS
Bandar Seri Iskandar
31750 Tronoh
Perak Darul Ridzuan
brought to you by COREView metadata, citation and similar papers at core.ac.uk
provided by UTPedia

ii
CERTIFICATION OF APPROVAL
ELECTRICAL OVERCURRENT PROTECTION GRADING IN V4D
By
Miguel Angel Engonga Ela Akaba
14635
A project dissertation submitted to the
Electrical and Electronic Engineering Programme
Universiti Teknologi PETRONAS
in partial fulfilment of the requirement for the
Bachelor of Engineering (Hons)
(ELECTRICAL AND ELECTRONIC ENGINEERING)
Approved by,
_____________________
AP Ir Dr Nursyarizal
UNIVERSITI TEKNOLOGI PETRONAS
TRONOH, PERAK
December 2015.

iii
CERTIFICATION OF ORIGINALITY
This is to certify that I am responsible for the work submitted in this project, that the original
work is my own except as specified in the references and acknowledgements, and that the
original work contained herein have not been undertaken or done by unspecified sources or
persons.
___________________________________________
Miguel Angel Engonga Ela Akaba

iv
ABSTRACT
Selective Coordination contributes to the localization of an overcurrent condition to restrict
outages to the circuit or equipment affected, accomplished by the choice of overcurrent protective
devices and their ratings and settings. Selective Coordination is critical for the reliability of
electrical distribution system and must be analyzed and test regularly. A properly engineered and
installed system will allow only the nearest upstream overcurrent protective device to open for
both overload and all types of short-circuits, leaving the remainder of the systems undisturbed and
preserving continuity of service. The aim of this study is to perform a Coordination and Overload
study for the electrical installation in Village-4D T1, in order to know the root causes of the
continuous tripping of its main Circuit Breaker which results in frequent power outage in the area.
The revision of past researches was the first step taken toward understanding the concept involving
protections; followed by a series of site inspections which helped gather the relevant data needed
for the study such as the types of protective devices and their arrangement as well as the ratings.
The methodology required a sensitivity analysis of the CBs in the area of study and Overload study
in which fault levels were simulated using Simulink/MATLAB. The preliminary results of the
study based on CBs level of sensitivity showed that V4D protective devices level of sensitivity is
medium, therefore less prone to nuisance tripping outside the nominal tripping current. Thus
sensitivity is not the factor causing the breaker to trip. However the results from the overload study
show that the increasing number of overheating appliances used by students causes the circuit to
overload, thus tripping the main breaker.

v
ACKNOWLEDGEMENTS
First of all I praise God the Almighty for having given me the existence, and being with me in
every step I take, for strengthening my heart and illuminating my mind. I praise Him for all those
people He has put in my way and whom have been my support throughout my studies.
I have been blessed with a cheerful and friendly supervisor, AP Ir Dr Nursyarizal Mohd. With his
patience and knowledge, he has supported me throughout the Final Year Project, whilst allowing me the
room to work in my own way. Without his sincerest encouragement and effort, this report would not have
been completed.
To my mother Gertrudis Akaba Engonga, for the love and devotion you have to your children, for the
infinite and unconditional support you have always shown me, for being the woman who gave me life and
taught me to live it and for being my source of inspiration, there is no words to thank you.

vi
TABLE OF CONTENTS
Page
CERTIFICATION OF APPROVAL……………………………………………………….….ii
CERTIFICATION OF ORIGINALITY……………………………………………………....iii
ABSTRACT……………………………………………………………………………………...iv
ACKNOWLEDGEMENTS……………………………………………………………….….…v
LIST OF FIGURES……………………………………………………………………..……..viii
LIST OF TABLES………………………………………………………………………………ix
LIST OF ABBREVIATIONS…………………………………………………………………..x
CHAPTER 1: INTRODUCTION…………..……………………………………...........1
1.1 Background of Study………………….………………….…...…..1
1.1.1 Selective Coordination………………….…… ………….1
1.1.2 Selective Coordination Avoids Blackout…………… .…..2
1.2 Problem Statement…………………………………..…..… …....3
1.3 Objectives ….……………………………………………….. ..…3
1.4 Scope of Study………………………………………….….. .......4
CHAPTER 2: LITERATURE REVIEW………………………..………………. ...…..5
2.1 Objectives of Protection systems…………………….……….... . 6
2.1.1 Zones of Protection…………………………..……….. ...7
2.2 The Discrimination Principle……………………..………… ….8
2.3 Protective Devices: Residual Current Circuit Breakers……….......9
2.4 Protection against Overload…………………….……….. …..….10
2.4.1 Overloads………………………………………………...10
2.4.2 Sustained Overloads………………………….…………..10
2.4.3 Temporary Overloads……………………………………10
2.5 The Lifespan of Electric Conductors…………………………….11
2.5.1 Old Electrical Installation: Imminent danger……….…...11
2.5.2 Typical Loads in Low Voltage Installations……….……13
2.5.2.1 Resistive Loads………………………….13
2.5.3 Installed Power Demand and Utilization Factor…….…..14
2.5.3.1 Apparent, Active and Reactive Power…..15

vii
2.6 Summary of the Literature Review………………………………16
CHAPTER 3: METHODOLOGY……………………………………………………..18
3.1 Sensitivity and Data Analysis……………………………………18
3.1.1 UTP Single Line Diagram………. ……………………...18
3.1.2 UTP CBs Sensitivity Study…………………….………..19
3.2 Overload Study…………………………………………………..19
3.2.1 V4D-T1 Breaker Box Connections….…….……..….......10
3.2.2 Electrical Load Classification …………………….…….21
3.2.2.1 Continuous Load…………………………21
3.2.2.2 Non-Continuous Load……………………23
3.3 Flow Chart……………………………………………………….24
CHAPTER 4: RESULTS AND DISCUSSIONS………….………...…………………25
4.1 Calculations………….……………………………..……………25
4.1.1 Total Power Draw in Continuous Loads……….………..25
4.1.2 Total Power Draw in Non-Continuous Loads……….…..26
4.2 Circuit Diagram………………..……………………...…………27
4.3 Simulations…………………………………………....…………29
4.3.1 Ideal Case……………………………………..……….…29
4.3.2 4000W Intermittent Load……………………..……….…32
4.3.3 8000W Intermittent Load……………………..……….…33
4.3.4 12000W Intermittent Load……………………..………...34
4.3.5 13681.92W Intermittent Load………………..….……….35
4.3.6 Short Circuit Current……………………….………….…36
4.4 Discussion…………………………………………………….….37
4.5 Project Gantt chart…………………………………………….…38
CHAPTER 5: CONCLUSION…….……………………………………………….…..39
CHAPTER 6: RECOMMENDATIONS…………….…..……………………………..40
REFERENCES…………………………………………………………….…………………....41
viii
LIST OF FIGURES
Page
Figure 1: Line-Diagram illustrating selective coordination………………………..…… 2
Figure 2: Zones of protection……………………………………………………..……. ..8
Figure 3: Backup protection……………………………………………………..………..8
Figure 4: UTP power system’s Single Line Diagram…………………..…………..…....18
Figure 5: V4D-T1 Panel Box…………………...…………………..……………………20
Figure 6: Fluorescent Lamp Ballast Circuit Diagram….……..…………………………22
Figure 7: Ceiling Fan Circuit Diagram.…..………...……………………………………22
Figure 8: Methodology Flow chart………………………………………………………24
Figure 9: Preliminary Circuit Diagram of the Area of Study……………………………28
Figure 10: Actual Circuit Diagram of the Area of Study………………………………..28
Figure 11: Continuous Load……………………………………………………………..30
Figure 12: Intermittent Load……………………………………………………………..30
Figure 13 (a): Current Waveform for Ideal Case………………………………………...31
Figure 13 (b): Voltage Waveform for Ideal Case………………………………………..31
Figure 14 (a): Current Waveform for 4000W……………………………………………32
Figure 14 (b): Voltage Waveform for 4000W…………………………………………...32
Figure 15 (a): Current Waveform for 8000W…………………………...……………….33
Figure 15 (b): Voltage Waveform for 80000W……………………………………..…...33
Figure 16 (a): Current Waveform for 12000W……………………………….……….…34
Figure 16 (b): Voltage Waveform for 12000W……………………………………….…34
Figure 17 (a): Current Waveform for 13681.92W…………………………………….…35
Figure 17 (b): Voltage Waveform for 13681.92W………………………………………35
Figure 18(a): Current Waveform at fault level…………………………………………..36
Figure 18(b): Voltage Waveform at fault level………………………………………….36
Figure 19: Project Gantt chart……………………………………………………………38
ix
LIST OF TABLES
Page
Table 1: Summary of the Literature Review………………………………………….......16
Table 2: Continuous Load Devices………………………………………………………21
Table 3: Intermittent Load Devices……………………………………………………....23
Table 4: Calculation of Current Draw in Continuous Load……………………………...26
Table 5: Calculation of Current Draw in Intermittent Load………………………….….27
Table 6: Power Consumption in the Ideal Case……………………………………….…20
Table 7: Amperage draw per Load………………………………………………….……37

x
LIST OF ABBREVIATIONS
NEC National Electric Code
CB Circuit Breaker
V4D Village-4
UTP Universiti Teknologi PETRONAS
ABB ASEAN Brown Boveri
ELCB Earth Leakage Circuit Breaker
RCCD Residual Current Circuit Breaker
In Nominal Current
OSHA Occupational Safety and Health Act
BS 7671 British Standard 7671
RCB Residual Current Breaker
RCD Residual Current Device
AC Alternating Current
ROC Residual Operating Current

1
Chapter 1
INTRODUCTION
1.1 Background of Study
Reducing the risk of equipment damage in the event of an electrical fault, is the primary objective
and the most important part of an electrical distribution systems. A major power outage will not
only paralyze any ongoing activity, but will also have a considerable economic impact and in some
cases, it can cause the loss of a valuable information which might have not been saved at the
moment of the failure. Thus, it is an essential requirement that the design of electrical systems
takes into account its Electrical Overcurrent Protection Grading or Selective Coordination.
1.1.1 Selective Coordination
Article 100 of the National Electric Code (NEC) defines Selective Coordination as the localization
of an overcurrent condition to restrict outages to the circuit or equipment affected, accomplished
by the choice of overcurrent protective devices and their ratings or settings [1]. It refers to the
selection and setting of protective devices in an electric power system in such a manner as to cause
the smallest possible portion of the system to be de-energized due to an abnormal condition. Being
overcurrent condition the most commonly encountered abnormality.
It is important to wisely select overcurrent protective devices while designing electrical
distribution systems. Major power failures are sometimes the consequences of inconsistent devices
and ratings (or settings) selection. However a good device and ratings selection will determine if
a system is selectively coordinated.
Electric Protective devices include:
Lightning arresters
Surge protectors
Fuses and Relays
Circuit Breakers and
Reclosers
2
A power distribution system properly coordinated will open the downstream protective device
nearest to the fault, leaving the rest of the system unaffected.
1.1.2 Selective Coordination Avoids Blackout
Figure 1 shows conditions to illustrate selective coordination operation. The diagrams represent
two electrical distribution systems with their corresponding Bus-bar, protective devices and loads.
The systems to the right is selectively coordinated what means that if an electrical fault occurs at
one of its downstream circuit, only the nearest upstream Circuit Breaker (CB) protecting the
affected area will open thus isolating it from the rest of the systems as can be seen in the line-
diagram. The remaining parts of the system will not be affected.
The systems to the left is not selectively coordinated thus a fault on one of the circuits, will open
unnecessarily all the upstream circuit breakers, resulting on unwanted power loss on loads that
should have not been affected. In addition, if the overcurrent occur on a feeder circuit, a selectively
coordinated system will open the immediate upstream overcurrent protective devices to isolate the
feeder.
Figure 1: Line-Diagram illustrating selective coordination
3
1.2 Problem Statement
The Village-4 D (V4D) is located within Universiti Teknologi PETRONAS (UTP) campus. It is
one of the newest student hostels built in response to the increasing number of student in the
campus. The V4 is divided into blocks being V4D one of the blocks.
V4D T1 regularly experience power outages caused by the tripping of the main CB located at the
pantry. This power failure disturbingly leaves without electricity all the rooms in V4D T1
compartment. In consequence, student sometimes lose unsaved valuable information since it gives
them no time to properly save their files and shutdown the computers. Thus the purpose of this
project is to provide UTP with a coordination study for all existing installation in V4D T1 for it
will help us to quickly detect the root causes of the power loss and come up with their possible
solutions.
The basic hypothesis here is that due to poor maintenance and/or testing of the protection system,
the risk for protective device miscoordination in the event of an overcurrent condition is high.
What would unnecessary trip the man CB at V4D T1 pantry resulting in electrical power loss in
the affected area.
1.3 Project Objectives
The primary objective of this project is to carry on a protection system study for the electrical
installation in V4D T1, in order to know the causes of the continuous power loss in that area. The
study aims to provide UTP with a time current curves for all the affected protective devices.
The specific objectives of the project are:
a. To survey the protective device settings for V4D T1
b. To evaluate coordination against protection principles
c. To propose a new device settings or alternative arrangement for protective devices in V4D
T1 for proper overcurrent protection grading thus achieving devices coordination and
maximizing protection system’s selectivity, reliability and speed.
4
1.4 Scope of the Study
This study focuses mainly on V4D T1 protective devices. These devices are principally ASEA
Brown Boveri (ABB) and Earth Leakage CBs (ELCB). The ABB CBs are of type Residual Current
Circuit Breaker (RCCB) –F362, having a nominal current (In) of 63Amps. The Earth Leakage CBs
are of type DZ47-60 with a rated current of 20 Amps each. . Most of the data gathering was done
through site inspections with the help of the system One-Line-Diagram. Through site inspection,
it was possible to check the protective devices in the area of study and their ratings.

5
Chapter 2
LITERATURE REVIEW
Basically all electrical installations experiences overcurrent. Unless removed in time, even
moderate overcurrents quickly overheat system components, damaging insulations, conductors
and equipment. Large overcurrent may melt conductors and vaporize insulation. Very high current
produce magnetic forces that bend and twist bus bars. They can pull cables from their terminal and
crack insulators and spacers. Very often fire explosions, poisonous fume and panic accompany
uncontrolled overcurrent. They do not only damage electrical systems and equipment, but may
cause injury or death to people around.
To reduce these hazards the (NEC), Occupational Safety and Health Act (OSHA) regulations and
other applicable design and installation standards require overcurrent protection that will
disconnect overload or faulted equipment [2]
Electrical systems must all meet applicable code requirement including those for overcurrent
protection before electric utilities can provide electric power to a facility. Thus Littlefuse [3]
defines a system with quality overcurrent protection as the one meeting the following
characteristics:
Meets all legal requirement such as NEC, OSHA, local codes etc.
Provides maximum safety for personnel, exceeding minimum code requirements as
necessary.
Minimizes overcurrent damage to property, equipment, and electrical systems.
Provides coordinated protection. Only protective devices immediately on the line side of
an overcurrent opens to protect the systems.
Is cost effective. Provides reserve interrupting capacity for future growth. Not subject to
obsolescence. Requires minimum maintenance that can be done by regular maintenance
personnel using readily available tools and equipment.
A basic rule to consider in electrical protection systems is that the downstream protective device
should trip faster than the corresponding upstream device for any current equal or lower than the
short circuit level of the area.
6
It should be noted that protections should be slow enough to allow the flow of normal current and
overcurrent. However it should be faster to protect equipment.
2.1 Objectives of System Protection
Lewis B and Thomas J [4] clearly define the fundamental objective of a protection system as to
isolate a faulty area of a power system as quickly as possible, minimizing in that way its impact to
the rest of the system. Protections lack of the ability to prevent a fault or equipment failure from
occurring. It will only act after the unwanted condition has occurred, limiting the problems that it
may cause. The fundamental aspects of a protection system are:
Reliability
Reliability has two factors, dependability and security. Dependability is defines as the
degree of certainty that a protection system will operate correctly [5]. Security relates to
the degree of certainty that a protection system will not operate correctly [5]. Therefore
dependability indicates the ability of a protection system to perform correctly when
required, whereas security is its ability to avoid unnecessary operating during normal day-
after-day operation and faults and problems outsides the designated zone of protection.
Thus the protection must be secure, yet dependable.
Speed
A fault should be clear as quickly as possible in order to maximize safety, minimize
equipment damage and minimize system instability. Thus it is desirable that a protection
isolates a trouble zone as quickly as possible. Zero-time or very high speed protection may
results in an increased number of undesired tripping. Generally, the faster the operation is
the higher the probability on incorrect operation. A high-speed relay is one that operates in
less than 50msec (three cycles on a 60Hz basis) [6]. Because speed is essential in clearing
a damage element, to minimize the cost and delay in making repairs, protection should
neither be too slow which may result in damage to equipment, nor should it be too fast
which may result in undesired operations.
Simplicity
Protection systems should be as simple as possible to accomplish its goals
7
Sensitivity
Sensitivity is the ability of the protection system to operate reliably under the real condition
that produces the least operating tendency. The protection device must be sufficiently
sensitive so that it will operate under the minimum condition expected. Protection system
will operate reliably when level of fault condition just crosses the predefined limit.
Selectivity
It is the ability to correctly locate and classify the fault. A relay should be able to
discriminate whether the fault is in its jurisdiction or not. Thus jurisdiction of a relay is
called zone of protection. Protection is arranged in zones are to make sure no part is left
unprotected. When a fault occurs, the protection is required to select and trip the nearest
CB only. It is also known as time discrimination.
2.1.1 Zones of Protection
A protective device zone of protection is a region which defines its jurisdiction. Protection are
implemented in zones or areas of protection to limit or isolate the portion of the power system
which is disconnected when a fault occurs, as shown in Figure 2. Ideally protection areas should
overlap so that no area of the systems remain unprotected. However Rezon T. [7], on his analysis
on power systems, realized that for practical, physical and economic reasons, this ideal is not
always achieved. In the majority of the cases, current transformers are located only in one side of
the switch. In that case there will be an area between the switch and the current transformer that is
not fully protected in the event of a failure.
Protections are classified into primary and backup protection.
Primary protection
In primary protection, CBs are located in the connections to each power element
making it possible to disconnect only the faulty element. A separate zone of protection
is established around each system element. Any failure occurring within a given zone
will cause the tripping of all CBs within that zone.
Adjacent zones overlap around a CB. Relaying equipment of the zone trip not only the
breakers within its zone but also one or more breakers of the adjacent zone.

8
Figure 2: Zones of protection
Backup protection
Backup protection functions only if primary protection fails. It is arranged in a way that it
does not control anything in common with the primary protection it backs-up. Back-up
protection provides primary protection when the primary protection equipment is out of
service for maintenance or repair.
Figure 3 illustrates the concept of backup protection, where we have three zones of
protection. Zones of protection 1 and 2 are protected by the CB located in panel board C,
which in this case act as a backup to the main CB in panel B in zone-2.
Figure 3: Backup Protection
2.2 The Discrimination Principle
Protection functions form a consistent system depending on the overall structure of the power
distribution system and the neutral grounding arrangement. They are based on the “Principle of
Discrimination which consists of isolating the faulty part of the power system and only that part
as quickly as possible, leaving all the fault-free parts of the power system energized” [8].
Discrimination is implemented through:
9
Time based discrimination
Current-based discrimination
Data exchange discrimination
Directional discrimination
Differential discrimination and
Combined discrimination
2.3 Protective Devices: Residual Current Circuit Breakers
British Standard 7671 (BS 7671) defines Residual Current Breaker (RCB) as a switching
protective device which will isolate the protecting circuit, by impeding the flow of residual current
after it has reached certain value within the predefined conditions [9].
Residual Current Devices (RCD) serve as disconnectors of flow of electrical current during
unwanted situations caused by overcurrent, lightning or cable insulator melting. For single phase
circuits, the device checks the continuous reading of current between both line and neutral
conductors [10].
For circuit with high degree of stability, the sum of the current in both line and neutral conductors
is zero during normal operations. When a line-to-ground fault occurs, part of line current will not
return through the neutral conductor. When fault current reaches a predefined value, the RCD will
detect the difference in current therefore tripping to isolate the circuit.
RCD primary objective is to protect the installation from the abnormal situations that will damage
the protecting equipment. It provides protection against fault, fire. However it does not properly
protect the installation against overcurrent. Circuit Breakers and Fuses are the most appropriate
protective devices for overcurrent.

10
2.4 Protection against Overcurrent
An overcurrent is a current exceeding the levels of rated Amperes of a conductor, an equipment
or a device. The term overcurrent includes overload and short circuit, and the latter flows out of
the normal pathways.
2.4.1 Overloads
An overload of the components of the installation occurs when a service nominal current intensities
exceed the values assigned by the manufacturer for prolonged periods, and when the electrical
equipment such as switches, motors, cables produce heat and reduce the useful life of the
insulation. Intense overload quickly reach the temperature limits [12]. Overload protection should
trip before it exceeds the permissible time and causes damage or short circuit in the system
2.4.2 Sustained Overload
Sustained Overloads are commonly caused by an over-installation of equipment such as public
lighting, electromechanical equipment [12]. If the overload is not disconnected within the time
limit, it will overheat the system components, causing thermal damage to the insulation and other
parts of the electrical system. Sustained Overload protective devices will disconnect electrical
circuits and equipment that are experiencing continuous overload before they are overheated.
2.4.3 Temporary Overload
The most frequently occurring overload faults are temporary overload, which are the results of the
starting of inductive loads such as motors. Ideally Overload protection are not designed to trip
during the starting of a motor [13]. Protective devices should have enough time delay to support
sudden burst of engines and temporary overloads. However if a continuous fault occur, protective
devices should instantly open the circuit before system equipment are damaged.
A short circuit in the other hand is a current outside the normal levels and cause by the rupture of
the insulation or connection failure. During a normal operation of a circuit, total current draw is
11
determined by the total connected load. While during a short circuit, current is bridged by a
conductor
2.5 The lifespan of Electrical Conductor
The quality and correct use of electrical wires play a key role in the lifespan of the conductors as
well as the building electrical installation. When the operating temperature of the conductor is not
exceeded due to a correct selection of wires and there is a minimum rate of overload faults in the
system, the lifespan of an installation is 20 years or more [14]. However, small overloads that may
not be detected by protective devices, can shorten the lifespan of a conductor.
The continuous use of electrical appliances such as electric cooker, kettles and microwave must
be accompanied by an analysis of the load capacity of the electrical system; to determine whether
it can withstand the increasing power consumption due to the addition of more electrical appliances
in the system. Otherwise the risk of electrical faults and power shortages affecting the system
design will be very high [14]. The typical accidents that repeatedly occur in an electrical
installation can be prevented if the safety and security on an electrical installations is considered
during the system design.
A safe and reliable electrical installation is one in which its components guarantee that the
probability of occurrence of electrical accidents that will endanger the consumers life, as well as
the possibility of electrical faults in the electrical equipment will be minimized. Due to that, all
electrical installations where poor quality devices have been used or where the designers did not
consider the safety of the installation, a prone to repeatedly experience electrical faults and in
consequence, power shortages.
2.5.1 Old Electrical Installations: Imminent danger
Old electrical installations should be the main focus of attention to the problem mention previously
since they are not prepared to withstand the growing electrical demand [14]. Wires that have
exceed their lifespan are the main cause of electrical accidents due to the following factors:
The section of the conductors cannot withstand the increasing power consumption of the
system

12
Wires overheating produced by the excess of power consumption, result in an accelerated
aging of the insulation
Wire used are if power quality with differences in the actual section of the copper despite
being of the same nominal section
Mechanical damage to the cable produced during the installation when the cables are not
channeled properly
In addition, it is highly recommend to consider that:
The poor conditions of the insulation material due predominantly to the aging of the
installation, can cause leakage current and short-circuit. The presence of moisture in the
installation also increase this danger
The uncontrolled growth of the installations through the use of extensions and without the
assistance of qualified electricians can cause installation overload
The acquisition of inappropriate materials, without certification, which generally do not
meet standard requirements and product safety can put at risk the electrical installation as
well as the consumers.
The absence of preventive maintenance of the facility, increases the risk through aging of
the installation.
The useful life of electrical wire of an installation is considered when it has been in service for a
minimum of 20 years. After 20 years, the conductor and protective devices should be replaced or
go through a more technical maintenance. In the same way, it is important to use installation
remodeling for inspection and to determine if it is in conditions to withstand the load of appliances
being used and that of those that will be used during the system expansion.
It should be considered that the use of old electrical wires can result in increased power
consumption in the system, so that its renewal is the best alternative to have a safe and reliable
installation. In this aspect, the designer plays an important role and must be aware of the risk
associated with having an installation in poor condition.

13
2.5.2 Typical loads in low voltage installations
Electrical loads can be of three types resistive, capacitive and inductive. An incandescent lamp is
a resistive load, a motor is an inductive load and a capacitor bank is a capacitive load. Most loads
of electrical appliances are combined with a large number of circuits that contain resistance and
capacitance.
Different electrical appliances such as lamps, heaters, water pumps and electronic devices are
frequently connected to the system. All of these are predominantly inductive and affect the system
power factor. A great number of industries use capacitive loads to correct the power factor being
0.95 the preferable value for the system power factor [15]. A high value of power factor will help
prevent the heating of distribution line due to an excess of reactive power transmission
predominantly inductive. Analyzing the system electrical circuit help represent each of the system
loads as impedance which is a combination of resistance and reactance. Their combination is
represented as follows:
𝑍 = 𝑅 ± 𝑗𝑋 (2.1)
Where:
R is the resistance and
X is the reactance which can be capacitive or inductive
2.5.2.1 Resistive Loads
Resistive loads are the cause of major consumption of active power in the system. Resistive loads
can be found in incandescent lamps, kettles, rice cookers and iron, where the energy required for
its operation is transformed into light, heat with a unity power factor. In a purely resistive load, the
current is in phase with the voltage thus an immediate function of the voltage is obtained. Therefore
if the current and the voltage are in phase, their relationship can be expressed in the following
equation:
𝑅 =𝑉
𝐼 (2.2)
14
2.5.3 Installed Power Demand and Utilization Factor
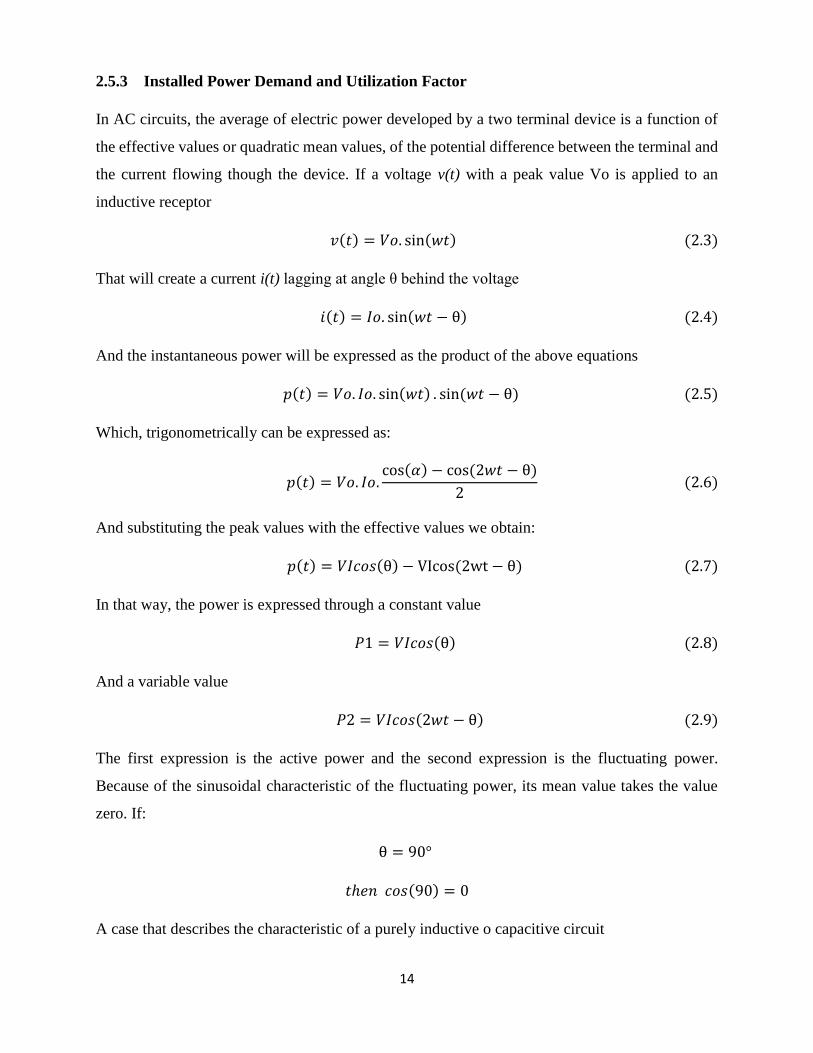
In AC circuits, the average of electric power developed by a two terminal device is a function of
the effective values or quadratic mean values, of the potential difference between the terminal and
the current flowing though the device. If a voltage v(t) with a peak value Vo is applied to an
inductive receptor
𝑣(𝑡) = 𝑉𝑜. sin(𝑤𝑡) (2.3)
That will create a current i(t) lagging at angle θ behind the voltage
𝑖(𝑡) = 𝐼𝑜. sin(𝑤𝑡 − θ) (2.4)
And the instantaneous power will be expressed as the product of the above equations
𝑝(𝑡) = 𝑉𝑜. 𝐼𝑜. sin(𝑤𝑡) . sin (𝑤𝑡 − θ) (2.5)
Which, trigonometrically can be expressed as:
𝑝(𝑡) = 𝑉𝑜. 𝐼𝑜.cos(𝛼) − cos (2𝑤𝑡 − θ)
2 (2.6)
And substituting the peak values with the effective values we obtain:
𝑝(𝑡) = 𝑉𝐼𝑐𝑜𝑠(θ) − VIcos(2wt − θ) (2.7)
In that way, the power is expressed through a constant value
𝑃1 = 𝑉𝐼𝑐𝑜𝑠(θ) (2.8)
And a variable value
𝑃2 = 𝑉𝐼𝑐𝑜𝑠(2𝑤𝑡 − θ) (2.9)
The first expression is the active power and the second expression is the fluctuating power.
Because of the sinusoidal characteristic of the fluctuating power, its mean value takes the value
zero. If:
θ = 90°
𝑡ℎ𝑒𝑛 𝑐𝑜𝑠(90) = 0
A case that describes the characteristic of a purely inductive o capacitive circuit
15
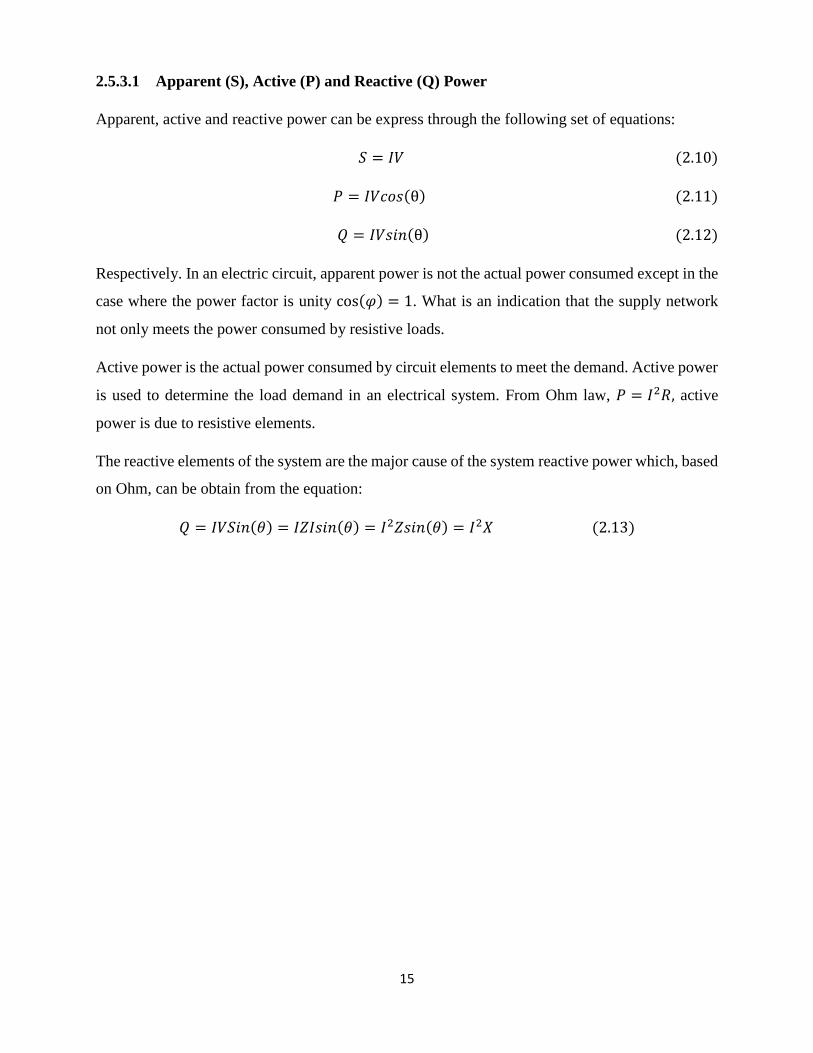
2.5.3.1 Apparent (S), Active (P) and Reactive (Q) Power
Apparent, active and reactive power can be express through the following set of equations:
𝑆 = 𝐼𝑉 (2.10)
𝑃 = 𝐼𝑉𝑐𝑜𝑠(θ) (2.11)
𝑄 = 𝐼𝑉𝑠𝑖𝑛(θ) (2.12)
Respectively. In an electric circuit, apparent power is not the actual power consumed except in the
case where the power factor is unity cos(𝜑) = 1. What is an indication that the supply network
not only meets the power consumed by resistive loads.
Active power is the actual power consumed by circuit elements to meet the demand. Active power
is used to determine the load demand in an electrical system. From Ohm law, 𝑃 = 𝐼2𝑅, active
power is due to resistive elements.
The reactive elements of the system are the major cause of the system reactive power which, based
on Ohm, can be obtain from the equation:
𝑄 = 𝐼𝑉𝑆𝑖𝑛(𝜃) = 𝐼𝑍𝐼𝑠𝑖𝑛(𝜃) = 𝐼2𝑍𝑠𝑖𝑛(𝜃) = 𝐼2𝑋 (2.13)

16
2.6 Summary of the Literature Review
Table 1 shows a summary of the past researches revised:
Table 1: Summary of the Literature Review
Author/ Date Paper Title Topic/ Focus/
Question
Conclusion/
Advantage/
Disadvantage
NEC-70, 2005 ed.
----
This standard focuses
on defining Electrical
parameters and the
conditions they should
be used.
Information about the
practical safety of
person and property
from electrical hazards
NEC-700, 2005 ed. Emergency Systems Installation, operation
and maintenance of ES
Defines all installation
standards required for
protections
Littlefuse, 2005 Circuit Protection
solutions
Electrical devices
protection
It does not include a
coordination study
J. L. Blackburn and T. J.
Domin, 2007ed
Protective relaying
principles and
applications
Info in new
development and topics
in protective relaying
It covers all aspects of
protection and the
factors affecting
Protections
IEEE Std C37-2, 2008 Electrical power
systems device function
numbers
It applies to the
definition of device
function numbers
Not intended to assure
safety and security in
all circumstances
IEEE Std C37-100,
2001
Definitions for Power
Switchgears
Electrical terms
definitions
Establishes meaning of
terms used in
switchgear standards
R. T. Amador, 2007 Protecciones Electricas Low-Voltage protection
systems and Protection
reliability
It focuses on all types
of discrimination
principles: Time,
Current and T-C
17
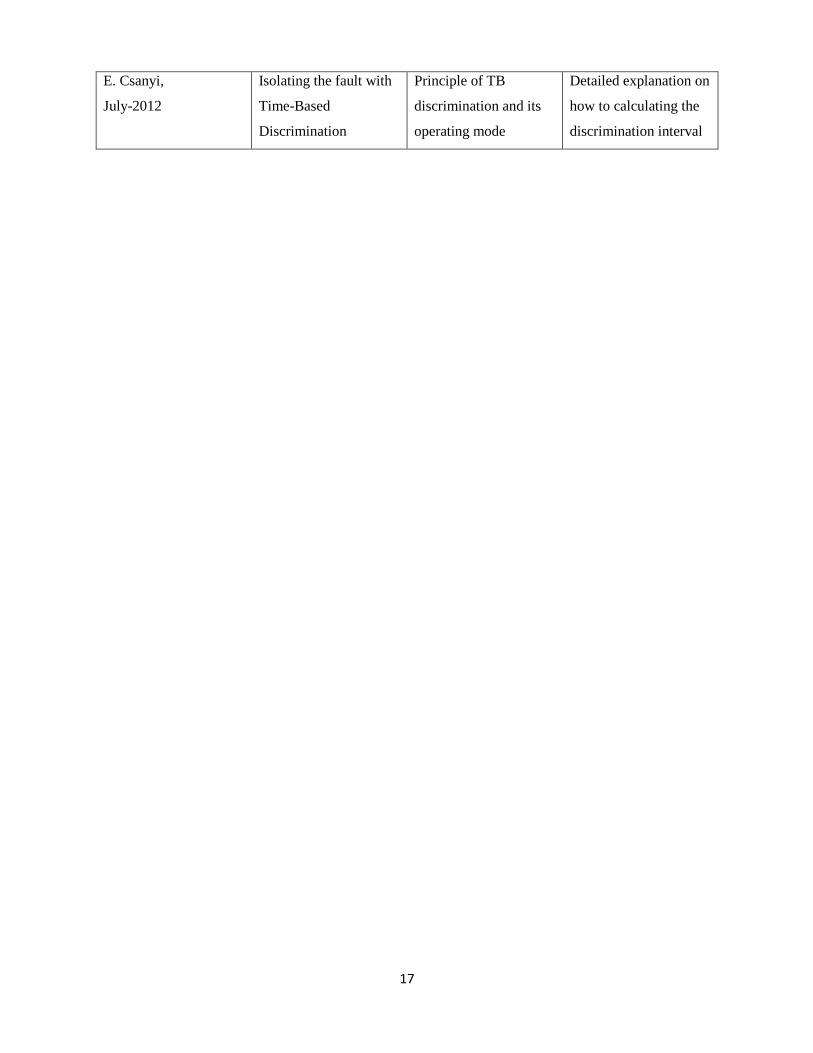
E. Csanyi,
July-2012
Isolating the fault with
Time-Based
Discrimination
Principle of TB
discrimination and its
operating mode
Detailed explanation on
how to calculating the
discrimination interval

18
Chapter 3
METHODOLOGY
3.1 Sensitivity and Data Analysis
In this stage, the data obtained from the site surveys is analyzed as to have a clearer picture of the
problem. Data analysis is performed using two approaches:
Sensitivity analysis of the main CB and
Overload study which include the simulation of the fault based on the load.
3.1.1 UTP Single Line Diagram
The single line diagram in Figure 4 is a simplified notation representing UTP’s Power System
from Sub-Station DS2 connected to a Low Voltage (LV) Main Switchboard to the distribution of
power through the respective Villages and Buildings. The solid yellow line marks the connection
to V4D which is protected by 200 Amps MCC. The Line-Diagram for power distribution in V4D
is not available the reason why it is not displayed here. However, to estimate the distribution of
power throughout the building, it was necessary to manually trip the CBs and check its range of
protection by observing the power lost in the area when the CB is OFF.
Figure 4: UTP power system’s Single Line Diagram

19
3.1.2 CBs Sensitivity Analysis
IEC 60755 standard defines three types of RCD based on the device frequency and the current for
which the device will trip. They are classified as:
AC-Type: which trips for sinusoidal residual AC current
A-Type: which trips for pulsating DC current and
B-Type: which is the same as type AC and 1kHz-current
For an RCCB protecting a circuit, load diversification is the most preferable and secure technique.
RCCD degree of sensitivity is an indication of device operating current, noted IΔn. Thus based on
the degree of sensitivity and the value of CBs residual current, RCCD can be categorize into the
following groups:
Highly sensitive: 6 – 10 – 30 mA Residual current
Mediumly sensitive: 100 – 300 – 500 – 1,000 mA
Low sensitivity: 3 – 10 – 30 A
The device operating current for the main CB in the area of study is 100mA which falls under the
group of devices with a medium degree of sensitivity
3.2 Overload Study
The main problem that need to be addressed is to performance of an overload study on V4D T1
due to a several sudden power loss in that area.
The very first step taken to successfully carry on with the project is the revision of past researches
on Load and Coordination studies. That is followed by a series of site inspections or site surveys
in order to gather more data of the electrical equipment involved in the load study for that specific
area. From the site surveys it was possible to know the types of protective devices affected, their
ratings and their manufacturer. Thus basically, the required information needed to perform the
study is:
An accurate One-Line Diagram of the area of study
Equipment ratings
Protective devices

20
3.2.1 V4D-T1 Breaker Box Connection
Single line diagram is crucial when performing a fault analysis or coordination study since it helps
us evaluate upstream and downstream CBs connections and it also provide us with more
information on the protective device and equipment located in the area of study. Due to the lack
of a Single-Line diagram of the area of study, a different approach had to be implemented in order
to know the internal wiring of the area of study. And that required a continuous manual switching
of the CBs in the Breaker Box located in the Pantry as can be observed Figure 5.
The Panel Box is equipped with 18 ELCB numbered from 1 to 9 and divided into two sets of CBs:
Lamps Protection: ELCBs 1 to 6 are connected to the Fluorescent Lamps in the rooms of
the area of study while ELCB-8 is connected to the Fluorescent Lamps in the pantry.
ELCB-9 is the protection for the Exit Lights while ELCB-7 remain spear.
Socket Protection: The sockets in the rooms are protected by ELCBs 1 to 6 while ELCB-
7 provide protection for sockets in the pantry. Both ELCBs-8 and 9 remain spares.
Beside the ELCBs protecting the Sockets and Fluorescent Lamps, there is the Main Switch which
is a RCCB with a Nominal Current In of 63 Amps and rated Residual Operating Current (ROP) of
100 mA.
Figure 5: V4-D T1 Panel Box

21
3.2.2 Electrical Load Classification
V4-D T1 power consumption or electrical load has been classified based on its continuity or
discontinuity for a defined period of time. Based on the above classification the following load
categories were obtained:
3.2.2.1 Continuous Loads
Continuous load is any load which is ON for 3 hours or more [11]. This includes all the electrical
equipment running for a long period of time without power interruption. Their power consumption
can be considered as constant within the defined parameters. Ceiling fans, Fluorescent Lamps and
the Fridge in the pantry fall under that classification as their activity is barely interrupted, making
their power consumption oscillated within the rated peak values.
The table 2 provides information on the type of appliance and the power consumption per
appliance as well as the amperage the device draw on the circuit.
Table 2: Continuous Load devices
Appliances Watts Volt Circuit
Fluorescent Lamps
28
240
Ceiling Fans
75
240
Fridge
168
240
Fluorescent Lamps
The total number of Fluorescent Lamps in every student apartment in V4-D is 22 Lamps per
apartment. What make them a fundamental device to consider in term of power consumption. In
that aspect is essential to analyze their internal wiring, which help understanding how a Fluorescent
Lamps work.

22
The most important component of a Fluorescent Lamps is the Electronic Ballast Figure 6 which
control the flow of current through the circuit and the terminal voltage. Due to a high current draw
in a Filament Tube, a ballast circuit is used to limit the flow of current throughout the lamps thus
preventing it from its self-destruction.
Figure 6: Fluorescent Lamp Ballast circuit diagram
Ceiling Fans and Fridges
Fans and Fridges which are continuously running are also considered as continuous loads. There
is a total of 6 ceiling fans in the V4-D-T1 apartment. When fans are running at maximum speed
their power consumption reaches the peak value therefore, their load neglected. The operation of
a single fan is linked to a capacitor start motor which is composed of starting and running winding
as can be observed in the circuit diagram in Figure 7 a capacitor is connected to the winding mainly
to determine the direction of rotation.
Figure 7: Ceiling Fan circuit diagram

23
3.2.2.2 Non-Continuous Loads
Non continuous loads refers to those appliances that are not running for the most part of the day
or those running for less than 3 hours daily. The list of appliance which load is not considered as
continuous includes rice cookers, water heaters, mist-fans, PCs, personal air-conditioners, printers.
The types of appliances considered as non-continuous loads in this study as well as their watt and
amp-ratings are provided in Table 3. The study considers only those appliances that can be found
in the majority of student rooms in the campus and particularly in V4.
Table 3: Intermittent load devices
Appliances Watts Volt-circuit
PC 65 240
Printers 1.23h 240
Rice cookers 700 240
Air-Conditioner 1119 240
Fans 65 240
Mist-Fans 90 240
Jug Kettle 1500 240
Speakers 156 240
PlayStation 250 240
Electric Iron 1000 240
Induction Cooker 2400h 240

24
3.2 Flow Chart
The methodology of the project up to this stage can be summarize in the following flow chart
diagram. As observed in Figure 8, it was fundamental to start working on the project after a
thorough revision of past researches on protection system and load analysis. The revision of past
researches was followed by a series of field surveys in the area of study. Field surveys helps
gathering and collecting all the relevant information on protective devices used in the installation,
such as the device type, rating and manufacturer. After obtaining the relevant information needed
for the project, the next step was to perform a qualitative and quantitative analysis of the data
obtained, which involved calculations and simulations that led to an accurate interpretation of the
results.
Figure 8: Methodology flow chart

25
Chapter 4
RESULTS AND DISCUSSION
This chapter consist of three sections. Continuous and non-continuous load calculations are
presented in the first section, followed by the Simulink Circuit Diagram of the area of study and
the simulation results
4.1 Calculation
Simulink simulation of the data gathered from the site survey required the use of some
mathematical calculations to approximate the value of the system continuous and intermittent
loads. Using the maximum power rating labelled on each device and system voltage, it was
possible to calculate the amperage draw of each system device based on the equation:
𝑃 = 𝑉𝐼 (4.1)
Thus the main CB, with a nominal current (In) of 63Amps and 240V, will have a Voltage-Current
relationship of:
𝑃 = 𝑉𝐼 = 63𝑥2400 = 15120 𝑊
and the amperage draw in both continuous and intermittent loads will be calculated as follows:
4.1.1 Total Power draw in Continuous loads
Table 4 shows the total current draw or the total power consumption in continuous loads which is
minimum as compared to the CB capacity.

26
Table 4: Calculation of current draw in Continuous Loads
Appliances Watts/Unit Num. Units Total
(W)
Voltage
(V)
Current
(A)
Fluorescent L.
28
22
616
240
2.57
Ceiling Fans
75
6
450
240
1.875
Fridge
168
3
504
240
2.1
Total 1570 240 6.546
4.1.2 Total Power draw in Non-Continuous loads
The total current draw or power consumption in intermittent loads is shown in Table 5. As can be
observed, the power consumption in intermittent loads is very high when compared to the value
obtained for continuous loads. Device such as Electric Iron, Jug kettle and Induction Cooker can
easily overload the system due to their high power consumption.
27
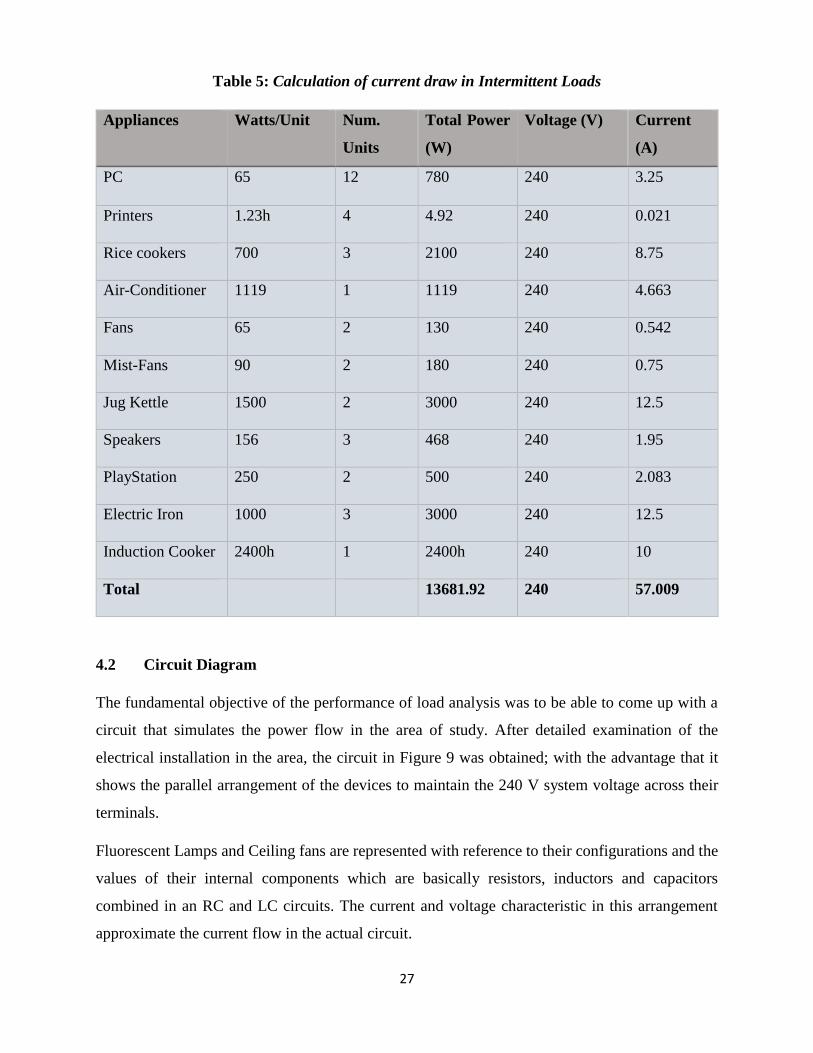
Table 5: Calculation of current draw in Intermittent Loads
Appliances Watts/Unit Num.
Units
Total Power
(W)
Voltage (V) Current
(A)
PC 65 12 780 240 3.25
Printers 1.23h 4 4.92 240 0.021
Rice cookers 700 3 2100 240 8.75
Air-Conditioner 1119 1 1119 240 4.663
Fans 65 2 130 240 0.542
Mist-Fans 90 2 180 240 0.75
Jug Kettle 1500 2 3000 240 12.5
Speakers 156 3 468 240 1.95
PlayStation 250 2 500 240 2.083
Electric Iron 1000 3 3000 240 12.5
Induction Cooker 2400h 1 2400h 240 10
Total 13681.92 240 57.009
4.2 Circuit Diagram
The fundamental objective of the performance of load analysis was to be able to come up with a
circuit that simulates the power flow in the area of study. After detailed examination of the
electrical installation in the area, the circuit in Figure 9 was obtained; with the advantage that it
shows the parallel arrangement of the devices to maintain the 240 V system voltage across their
terminals.
Fluorescent Lamps and Ceiling fans are represented with reference to their configurations and the
values of their internal components which are basically resistors, inductors and capacitors
combined in an RC and LC circuits. The current and voltage characteristic in this arrangement
approximate the current flow in the actual circuit.

28
Figure 9: Preliminary circuit diagram of the area of study
However due to the complexity of the internal design of some continuous loads such as the fridge
in the pantry, it was necessary to design a circuit that only relate to both the continuous and non-
continuous. As can be observed in Figure 10, the continuous loads is constant while the non-
continuous load is variable as it depends on student usage of the electric appliances.
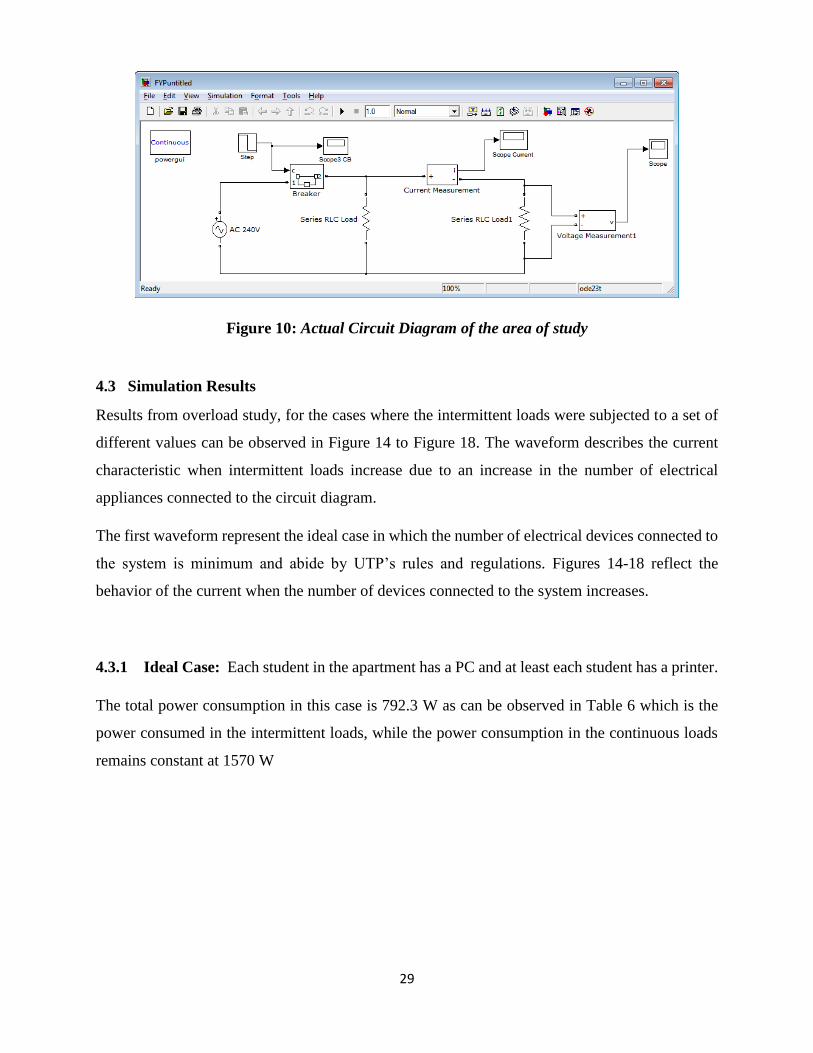
29
Figure 10: Actual Circuit Diagram of the area of study
4.3 Simulation Results
Results from overload study, for the cases where the intermittent loads were subjected to a set of
different values can be observed in Figure 14 to Figure 18. The waveform describes the current
characteristic when intermittent loads increase due to an increase in the number of electrical
appliances connected to the circuit diagram.
The first waveform represent the ideal case in which the number of electrical devices connected to
the system is minimum and abide by UTP’s rules and regulations. Figures 14-18 reflect the
behavior of the current when the number of devices connected to the system increases.
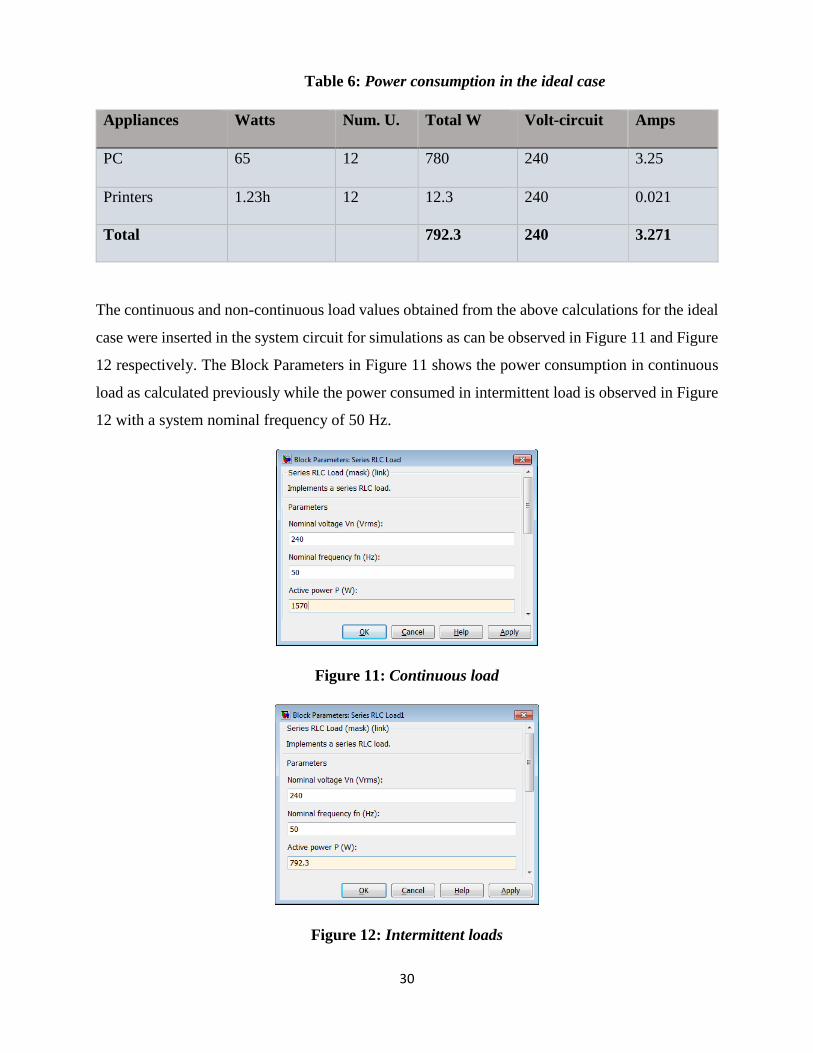
4.3.1 Ideal Case: Each student in the apartment has a PC and at least each student has a printer.
The total power consumption in this case is 792.3 W as can be observed in Table 6 which is the
power consumed in the intermittent loads, while the power consumption in the continuous loads
remains constant at 1570 W
30
Table 6: Power consumption in the ideal case
Appliances Watts Num. U. Total W Volt-circuit Amps
PC 65 12 780 240 3.25
Printers 1.23h 12 12.3 240 0.021
Total 792.3 240 3.271
The continuous and non-continuous load values obtained from the above calculations for the ideal
case were inserted in the system circuit for simulations as can be observed in Figure 11 and Figure
12 respectively. The Block Parameters in Figure 11 shows the power consumption in continuous
load as calculated previously while the power consumed in intermittent load is observed in Figure
12 with a system nominal frequency of 50 Hz.
Figure 11: Continuous load
Figure 12: Intermittent loads
31
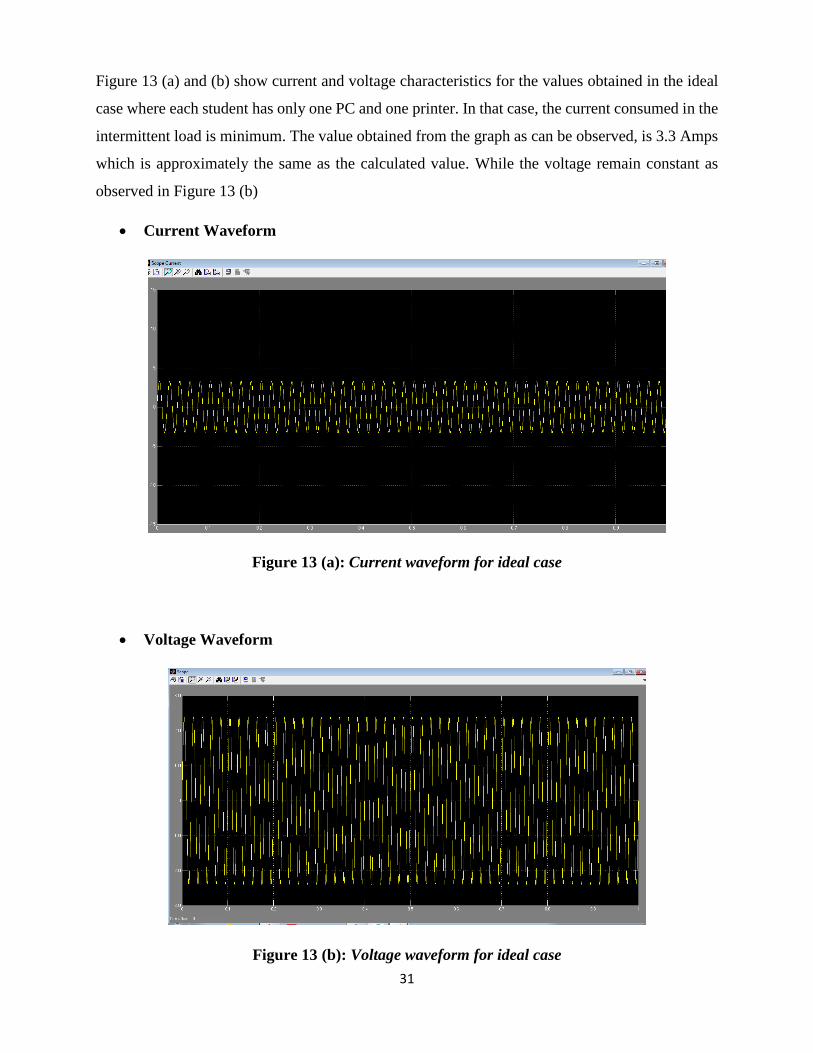
Figure 13 (a) and (b) show current and voltage characteristics for the values obtained in the ideal
case where each student has only one PC and one printer. In that case, the current consumed in the
intermittent load is minimum. The value obtained from the graph as can be observed, is 3.3 Amps
which is approximately the same as the calculated value. While the voltage remain constant as
observed in Figure 13 (b)
Current Waveform
Figure 13 (a): Current waveform for ideal case
Voltage Waveform
Figure 13 (b): Voltage waveform for ideal case
32
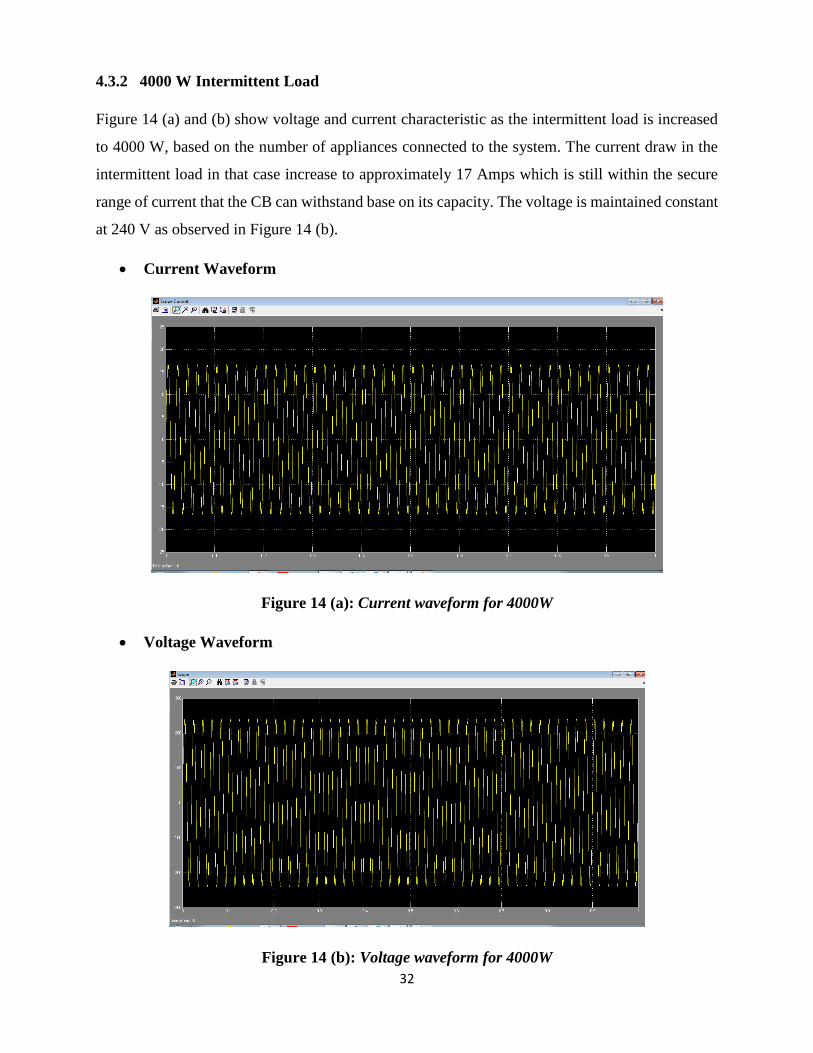
4.3.2 4000 W Intermittent Load
Figure 14 (a) and (b) show voltage and current characteristic as the intermittent load is increased
to 4000 W, based on the number of appliances connected to the system. The current draw in the
intermittent load in that case increase to approximately 17 Amps which is still within the secure
range of current that the CB can withstand base on its capacity. The voltage is maintained constant
at 240 V as observed in Figure 14 (b).
Current Waveform
Figure 14 (a): Current waveform for 4000W
Voltage Waveform
Figure 14 (b): Voltage waveform for 4000W
33
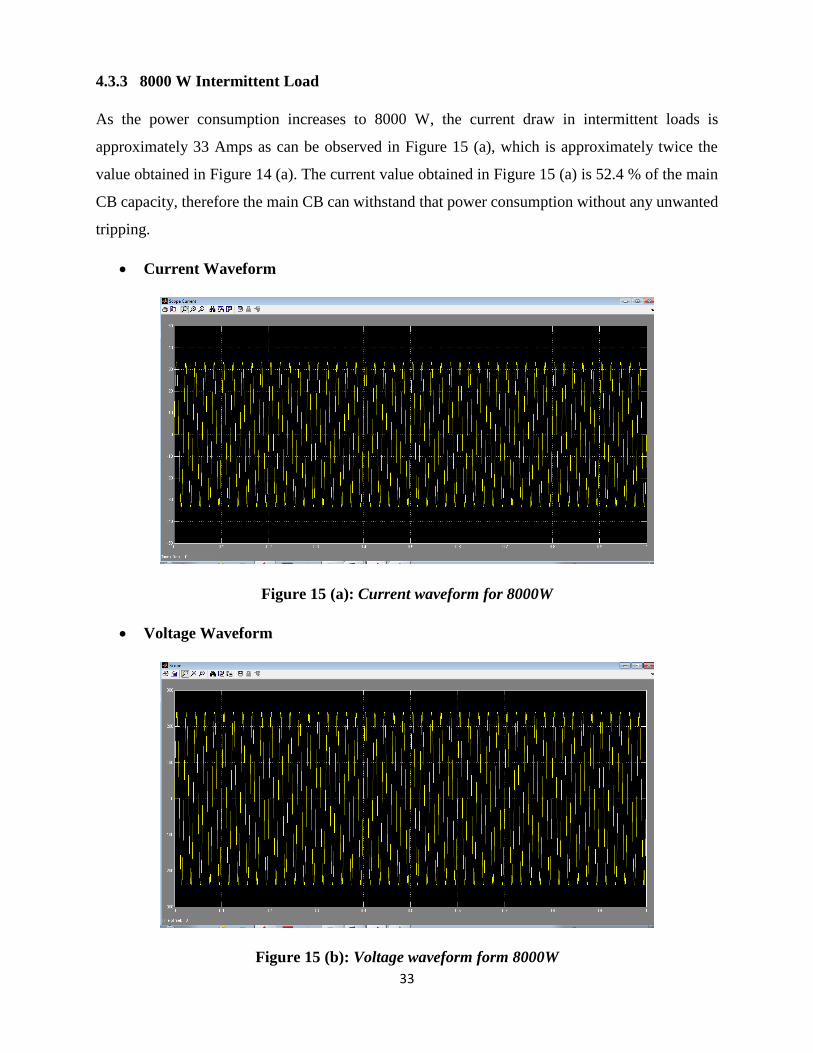
4.3.3 8000 W Intermittent Load
As the power consumption increases to 8000 W, the current draw in intermittent loads is
approximately 33 Amps as can be observed in Figure 15 (a), which is approximately twice the
value obtained in Figure 14 (a). The current value obtained in Figure 15 (a) is 52.4 % of the main
CB capacity, therefore the main CB can withstand that power consumption without any unwanted
tripping.
Current Waveform
Figure 15 (a): Current waveform for 8000W
Voltage Waveform
Figure 15 (b): Voltage waveform form 8000W

34
4.3.4 12000 W Intermittent Load
Increasing the power consumption in intermittent to 12000 W increases the current draw in the
same load to 50 Amps with a constant voltage of 240V shown in Figure 16 (a) and 16 (b)
respectively. 50 Amps of current draw represent a 79.4 % of the main CB capacity therefore at this
level, the risk for CB tripping due to overload is high as compared to previous cases. That is
because 79.4 % is close to maximum safety level of the main CB which is 80 %.
Current Waveform
Figure 16 (a): Current waveform for 12000W
Voltage Waveform
Figure 16 (b): Voltage waveform for 12000W
35
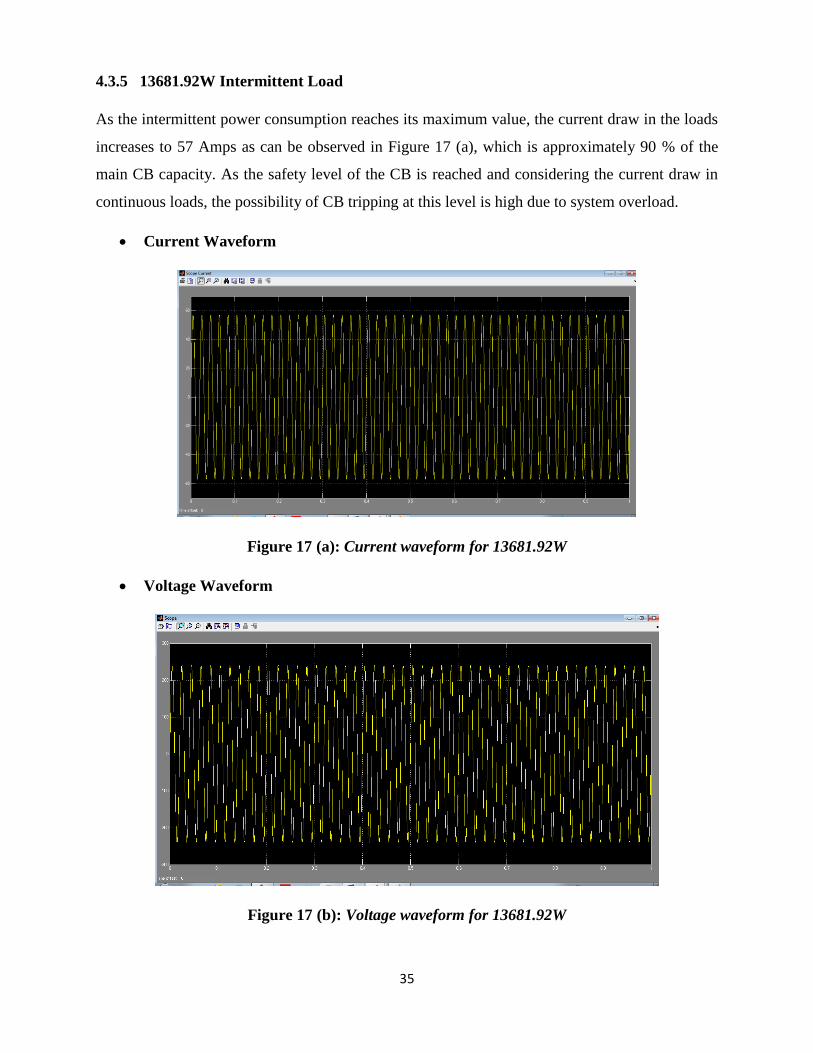
4.3.5 13681.92W Intermittent Load
As the intermittent power consumption reaches its maximum value, the current draw in the loads
increases to 57 Amps as can be observed in Figure 17 (a), which is approximately 90 % of the
main CB capacity. As the safety level of the CB is reached and considering the current draw in
continuous loads, the possibility of CB tripping at this level is high due to system overload.
Current Waveform
Figure 17 (a): Current waveform for 13681.92W
Voltage Waveform
Figure 17 (b): Voltage waveform for 13681.92W
36
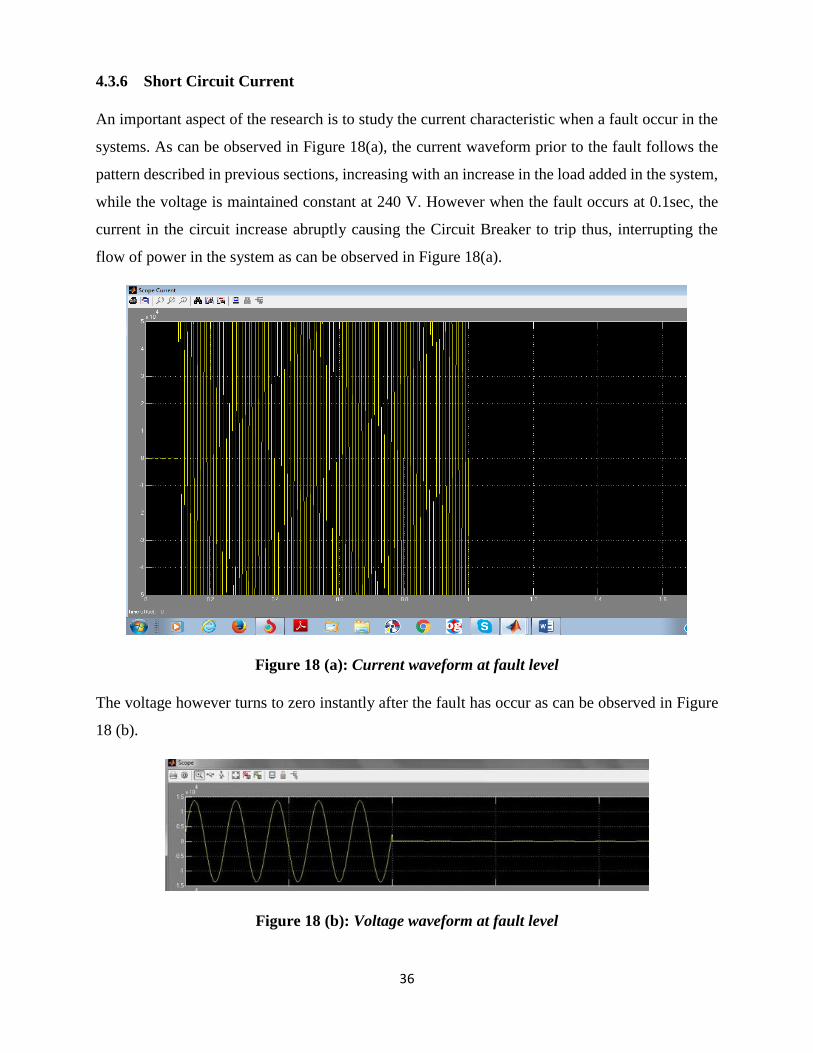
4.3.6 Short Circuit Current
An important aspect of the research is to study the current characteristic when a fault occur in the
systems. As can be observed in Figure 18(a), the current waveform prior to the fault follows the
pattern described in previous sections, increasing with an increase in the load added in the system,
while the voltage is maintained constant at 240 V. However when the fault occurs at 0.1sec, the
current in the circuit increase abruptly causing the Circuit Breaker to trip thus, interrupting the
flow of power in the system as can be observed in Figure 18(a).
Figure 18 (a): Current waveform at fault level
The voltage however turns to zero instantly after the fault has occur as can be observed in Figure
18 (b).
Figure 18 (b): Voltage waveform at fault level

37
4.4 Discussion
The values of intermittent loads that have been used to study the current characteristic of the circuit
are 792.3 W, 4000 W, 8000 W, 12000 W and 13681.92 W respectively. The first value represent
the ideal case in which students only use those devices registered in UTP’s rules and regulations.
The subsequent values represent the power consumption as more electrical appliances are in use.
The relationship between simulated power consumption and current draw in the circuit can be
observed in Table 7.
Table 7: Amperage draw per Load
Simulation Watts Current (Amps)
1 792.3 3.3
2 4000 17
3 8000 33
4 12000 50
5 13681.92 57
5 15000 63
From the graph above it has been observed that as the value of the power consumption increases,
the current draw in the circuit also increases correspondingly. In the ideal case where the number
of appliances in the system is minimum, there is as low as 3.3 Amps needed to keep the devices
running. However in the case where the number of appliances connected to the system is maximum
the current draw in the circuit increases up to 57 Amps which is near the rated current of the main
CB which is 63 Amps.

38
4.5 Project Gantt chart
The overall work done on the project along with the time taken for the tasks to be completed, are
summarized in a Gantt chart in Figure 20.
Figure 19: Project Gantt chart
39
Chapter 5
CONCLUSION
The continuous tripping of V4D CB has been analyzed using two different approaches: CBs
sensitivity analysis and circuit overload. The preliminary results showed that sensitivity is not the
factor causing the breaker to trip. The sensitivity level for protective devices in V4D is medium
what makes it less prone to nuisance tripping outside the nominal tripping current. From the
manual inspection it was observed that the increasing use of overheating appliances causes the
circuit to overload, since overheating appliances pull in more amps than normal. Therefore, it was
necessary to perform an overload analysis of the area of study which required a technical data
gathering process. The data obtained helped classify the Electrical Appliances in the area of study
into two categories: Continuous and Intermittent loads.
The power calculated from both Continuous and Intermittent Loads was simulated in different
sequences using SIMULINK/MATLAB. The results obtained showed that as load increases, the
current draw in the circuit also increase proportionally and the maximum value obtained was
57Amps. Which is close to the 63Amps rating of the main CB. Therefore, if more appliances are
connected to the system, that will increase the current draw and in consequence trip the main CB
protecting the area of study.

40
Chapter 6
RECOMMENDATIONS
Further analysis could be done in the area of study to minimize the rate of occurrence of the
problem. The installation and protective devices in the Student Villages should be tested regularly
to increase installation safety and devices reliability. Testing the electrical installation will help
detect and prevent defects that would cause electrical faults and damage in the system.
Extensive analysis could be done on Buildings wiring. Electrical conductors play an important role
in the installation safety due to its impact on the presence of electrical faults. Thus proper selection
of the cables and their periodic inspection will contribute to the overall safety of the electrical
installation.
In Student Villages, activities such as cooking and heating water take place in the apartment
pantries. Knowing that the increasing use of overheating appliances causes the circuit to overload
thus tripping the protective device, the incoming line could be split off on two separated lines with
one of them taking the power to the rooms and the other to the pantry and both having two separate
Circuit Breakers. This arrangement will help tripping the CB in the faulted line and leaving the
rest of the system undisturbed.
41
REFERENCES
[1] The National Electric Code, NFPA 70, The National Fire Protection Association, Inc.,
2005 edition.
[2] The National Electric Code, NFPA 700, “Emergency Systems”, 2005.
[3] Littlefuse, 2005, “Circuit Protection Solutions”. [online]. Available
http://www.littelfuse.com/~/media/electronics/product_catalogs/littelfuse_fuse_catalog.p
df.pdf.
[4] J. L. Blackburn and T. J. Domin, “Protective Relaying Principles and Applications”, 3rd
ed., 2007,
[5] IEEE Std C37-2-2008, IEEE Standard for Electrical Power Systems Device Function
Numbers, Acronyms and Contact Designations.
[6] IEEE Std C37-100-2001, IEEE Standard for Definitions for Power Switchgears.
[7] R. T. Amador “Protectiones Electricas”, Bogota, Colombia, 2007.
[8] E. Csanyi, (2012, Jul). “Isolating the Fault with Time-based Discrimination”. Retrieved
from: http://electrical-engineering-portal.com/isolating-the-fault-with-time-based-
discrimination
[9] BS 7671: June 2013, Requirements for Electrical Installations
[10] Inspection and Testing of Electrical Installations: Residual Current Devices, March,
2014. Retrieved from http://electrical.theiet.org/wiring-matters/50/rcd/index.cfm
[11] The National Electric Code, NFPA 100, The National Fire Protection Association, Inc.,
2008 edition
[12] VG Electricidad. (2009). Instalaciones Electricas Seguras [Online]. Available:
http://vgelectricidad.blogspot.my/2009/09/sobrecarga-cortocircuito-y.html
[13] E. S. Garza. (2001, December). “Coordinacion de Protecciones en Sistemas Electricos en
Industria del Alcali S.A. de C.V”, Master Dissertation, Facultad de Ingenieria Mecanica
y Electrica, Universidad Autonoma de Nuevo Leon, Ciudad de Mexico, Mexico, 2001.
[14] C.U. Leonardo. (2014). Importancia del Buen Estado de los Conductores electricos para
lograr la Seguridad de la Instalacion Electrica. [online]. Available:
http://programacasasegura.org/pe/2010/10/21/importancia-del-buen-estado-de-los-
conductores-electricos-para-lograr-la-seguridad-de-la-instalacion-electrica/
42
[15] G.A. Gonzalez. (2011, January). “Seleccion y Coordinacion de Protecciones de Baja
Tension", Doctoral Dissertation, Facultad de Ingenieria Escuela de Ingenieria Mecanica
Electrica, Universidad de San Carlos de Guatemala, Ciudad de Guatemala, Guatemala.


