
Electronic Supplementary Information (ESI)
An efficient heteroatom-doped carbon electro-catalyst for oxygen reduction
reaction by pyrolysis of protein-rich pulse flour cooked with SiO2
nanoparticles
Rohan Gokhale,a Sreekuttan M. Unni,a Dhanya Puthusseri,a Sreekumar Kurungot*a and
Satishchandra Ogale*a
a Physical and Materials Chemistry Department, National Chemical Laboratory (CSIR), Dr. Homi Bhabha Road, Pune-411008, India
Electronic Supplementary Material (ESI) for Physical Chemistry Chemical PhysicsThis journal is © The Owner Societies 2014

ESI-I
TABLE S1
No. Reference Material Onset Potential of Material (V) with loading
Onset Potential (V) of commer. Pt/C ref used with loading
Electrolyte used
Ave. No. of elec. transferred
Reference Electrode used
1 Jeon et al. J. Am. Chem. Soc. 2013, 135, 1386 1393
Acid functionalized GNPs
-0.16 (5μl of 1mg/ml dispersion of catalyst)
0.5 (Similar procedure used to drop cast)
0.1 M KOH
2.6-3.6 Ag/AgCl
2 Li et al. J. Am. Chem. Soc. 2012, 134, 18932 18935
N-doped colloidal graphene quantum dots
0.04, 0.10 and 0.14 V negative to reference Pt/C (15 μg on GCE)
Not mentioned (15 μg on GCE) 20% wt. Pt on Vulcan XC-72R
0.1 M KOH
3.9 SCE
3 Yang et al. J. Am. Chem. Soc. 2012, 134, 16127 16130
Phosphorus doped ordered mesoporous carbon
-0.11 Not mentioned (20 wt % Pt supported on Vulcan XC72R carbon
0.1 M KOH
3.9 Ag/AgCl
4 Wohlgemuth et al. J. Mater. Chem. A, 2013, 1, 4002–4009
N doped carbon aerogels
Not precisely defined but significantly negative to platinum. 5 μl of 5 mg/350 μl
Not mentioned 20 wt% Pt@C
0.1 M KOH
3.3 Ag/AgCl
5 Zhang et al. Adv. Mater. 2013, 25, 4932–4937
Phosphorus doped graphene
0.92 10 L of 1mg/mL solution
0.95 10 L of 1mg/mL solution
0.1 M KOH
3-3.8 RHE
6 Wang et al. Angew. Chem. Int. Ed. 2012, 51, 4209 –4212
Boron and Nitrogen doped CNTs
Not precisely defined but shown to be comparable to platinum. 10 L of 1mg/mL solution
Not defined precisely 20% platinum on Vulcan XC-72R; E-TEK
0.1 M KOH
Close to 4 SCE
7 Silva et al. J. Am. Chem. Soc. 2013, 135, 7823 7826
N and O doped mesoporous carbon
0.94 (100 μg/cm2)
Not precisely mentioned but graph shows comparable behavior Pt/C (1% Pt)
0.1 M KOH
~4 RHE
8 Chen et al. Adv. Mater. 2012, 24, 5593–5597
N doped carbon nanocages
-0.13 10 L of 2mg/mL solution
-0.03 10 L of 2mg/mL solution Pt/C (with Pt loading of 20%,
0.1 M KOH
3.27 Ag/AgCl
Electronic Supplementary Material (ESI) for Physical Chemistry Chemical PhysicsThis journal is © The Owner Societies 2014

9 Lin et al. Adv. Energy Mater. 2012, 2, 884–888
N doped Graphene -0.1 141 g cm 2
No comparison shown Pt/C (20 wt.% Pt)
0.1 M KOH
3.6 Ag/AgCl
10 Liang et al. Angew. Chem. Int. Ed. 2012, 51, 11496 –11500
S,N doped mesoporous Graphene
-0.06 10 L of 2 mg/mL solution
-0.03 20 wt% Vulcan Pt/C
0.1 M KOH
3.6 Ag/AgCl
11 Liu et al. Nano Res. 2013 DOI 10.1007/s12274-013-0307-9
N doped nanoporous carbon
0.88 (0.1mg/cm2)
- (0.1mg/cm2) Pt/C (20 wt.% Pt loading
0.1 M KOH
~4 RHE
12 Yang et al. J. Am. Chem. Soc. 2011, 133, 206–209
N doped mesoporous carbon
0.035 0.06 20 wt% Pt/C (130 μg loading)
0.1M KOH
~3-4 Ag/AgCl
13 Gong et al., Science 2009, 323,760-763
N doped VA-CNTs Observed around 0 V (Not mentioned precisely)
Observed around 0 V (Not mentioned precisely)
0.1 M KOH
3.9 Ag/AgCl
14 Our Work N doped heirarchically porous carbon
0.949 (255μg/cm2)
0.972 (25 μg/cm2) Pt/C (20 wt.%)
0.1 M KOH
3.5 RHE
Synthesis Protocols of the materials for the references given above:
1. “Edge-selectively functionalized graphene nanoplatelets (EFGnPs) with different functional groups were efficiently prepared simply by dry ball milling graphite in the presence of hydrogen, carbon dioxide, sulfur trioxide, or carbon dioxide/sulfur trioxide mixture”- Jeon et al. J. Am. Chem. Soc. 2013, 135, 1386 1393
2. “Solution chemistry approach to nitrogen-doped colloidal graphene quantum dots with well-defined structures” - Li et al. J. Am. Chem. Soc. 2012, 134, 18932 18935
3. “Phosphorus-doped ordered mesoporous carbons (POMCs) with different lengths were synthesized
using a metal-free nanocasting method of SBA-15 mesoporous silica with different sizes as template and triphenylphosphine and phenol as phosphorus and carbon sources, respectively”. HF was used for etching subsequently. Yang et al. J. Am. Chem. Soc. 2012, 134, 16127 16130
4. “A one pot hydrothermal synthesis towards nitrogen doped organic aerogels with tunable surface area
and nitrogen content is presented. The gels were synthesized from a sustainable glucose carbon precursor with 2-pyrrol-carboxaldehyde (PCA) as the nitrogen source and borax mineral as the structure forming agent.” Wohlgemuth et al. J. Mater. Chem. A, 2013, 1, 4002–4009
5. “A facile, low-cost and scalable thermal annealing method for the synthesis of PG using graphite oxide (GO) and triphenylphosphine (TPP) as carbon and phosphorus sources, respectively”- Zhang et al. Adv. Mater. 2013, 25, 4932–4937
6. “Developed a facile approach to metal-free BCN graphene of tunable B/N co-doping levels as
efficient ORR electrocatalysts simply by thermal annealing GO in the presence of boric acid and ammonia” Wang et al. Angew. Chem. Int. Ed. 2012, 51, 4209 –4212
Electronic Supplementary Material (ESI) for Physical Chemistry Chemical PhysicsThis journal is © The Owner Societies 2014

7. “Mesoporous oxygen- and nitrogen-doped carbons were synthesized from in situ polymerized
mesoporous silica-supported polyaniline (PANI) by carbonization of the latter, followed by etching away the mesoporous silica template from it.” Silva et al. J. Am. Chem. Soc. 2013, 135, 7823 7826
8. “NCNCs were prepared with pyridine as the precursor in this study”. MgO was used as a template -
Chen et al. Adv. Mater. 2012, 24, 5593–5597
9. GO was treated with SiO2 nanoparticle solution and then dual doped using chemicals like BDS/Melamine (heat treatment). HF was used for etching. Liang et al. Angew. Chem. Int. Ed. 2012, 51, 11496 –11500
10. “N-doped porous carbon materials have been prepared by a simple one-step pyrolysis of
ethylenediaminetetraacetic acid (EDTA) and melamine in the presence of KOH and Co(NO3)2·6H2O.”- Liu et al. Nano Res. 2013, DOI 10.1007/s12274-013-0307-9
11. “NG is successfully prepared from GO and a solid N precursor, urea, both of which are low-cost and being manufactured in large quantities.” “Well-mixed GO and urea were pyrolyzed at 800 ° C in an inert environment” - Lin et al. Adv. Energy Mater. 2012, 2, 884–888
14. In our work, the protein enriched food grain powder (gram flour, soyabin) was cooked with SiO2 nano-particle dispersion in water (Ludox). During swelling of the grain matrix SiO2 nanoparticles were uniformly sucked-in and distributed. After SiO2 etching by HF hierarchically porous nitrogen doped conducting carbon was obtained which gave a good ORR performance.
Electronic Supplementary Material (ESI) for Physical Chemistry Chemical PhysicsThis journal is © The Owner Societies 2014
ESI-II
Characterizations:
Field Emission Scanning Electron Microscopy (FESEM, Nova NanoSEM 450) and High
Resolution-Transmission Electron Microscopy (HR-TEM, FEI Tecnai 300) were used. The
surface area of carbon was obtained from BET surface area measurements (Quantachrome
Quadrasorb automatic volumetric instrument). X-ray photoelectron spectroscopy (XPS) (ESCA-
3000, VG Scienti c Ltd. UK, with a 9 channeltron CLAM4 analyzer under vacuum better than
1* 10-8 Torr, Al Ka radiation (1486.6 eV) and a constant pass energy of 50 eV) was employed to
study the chemical state of carbon in the materials respectively. X-ray Diffraction (XRD, Philips
X’Pert PRO) and Raman spectroscopy (a confocal micro-Raman spectrometer LabRAM
ARAMIS Horiba JobinYvon, with laser excitation wavelength of 612 nm) was also used.
Resistance Measurement:
5 mg of each carbon catalyst was mixed with 1 mg of binder (kiner ). 1 ml NMP was added and
the contents were ground in a mortar pestle to make a uniform thin paste. 7 μL of the paste was
drop casted on 0.5* 0.5 cm of glass slide. Resistance was measured over a distance of 1 mm on a
two-probe system.
Electrochemical studies: Biologic electrochemical workstation was used for all electrochemical
analysis with conventional three- electrode test cell from Pine Instruments. Hg/HgO and graphite
rode were used as the reference and counter electrodes, respectively. A glassy carbon (GC)
electrode (5 mm diameter) embedded in Teflon was used as working electrode. Working
electrode was polished using 0.3 m alumina slurry and cleaned using water and alcohol. 10 mg
of the catalyst was dispersed in 2 ml of dimethyl acetamide by ultrasonication. 10 L from the
prepared slurry was drop casted on the GC electrode followed by coating of 2 L of 0.1 %
Electronic Supplementary Material (ESI) for Physical Chemistry Chemical PhysicsThis journal is © The Owner Societies 2014

Nafion® solution. Cyclic voltammetric (CV), chronoamperometric (CA) and rotating disc
electrode (RDE) studies were carried in 0.1 M KOH (Aldrich). 5 mV s-1 scan rate was used for
both RDE and cyclic voltammetric analysis. For RDE analysis, oxygen and nitrogen saturated
0.1 KOH was used respectively for oxygen saturated and oxygen free environment.
For Rotating ring disc electrode (RRDE), carbon samples (50μl) coated on 0.24 cm2 glassy
carbon disc surrounded by platinum ring were used as working electrode and Hg/HgO and
graphite rode were used as reference and counter electrode respectively. Oxygen saturated 0.1 M
KOH was used for RRDE analysis. All potentials were converted to RHE by calibrating Hg/HgO
in hydrogen saturated 0.1 M KOH.
Electronic Supplementary Material (ESI) for Physical Chemistry Chemical PhysicsThis journal is © The Owner Societies 2014

ESI-III
Figure S1. Pore size distribution of GFMC1
Figure S2. Pore size distribution of GFMC2
5 10 15 20 25 30 35 40 45 50 55 60 65 70-0.001
0.000
0.001
0.002
0.003
0.004
0.005
0.006
0.007
0.008GFMC1
dV/r
(cc/
Å/g
)
Pore Width (Å)
0 50 100 150 200 250 300 350
0.00
0.01
0.02
0.03
0.04
0.05 GFMC2
dV/r
(cc/
Å/g
)
Pore Width (Å)
Electronic Supplementary Material (ESI) for Physical Chemistry Chemical PhysicsThis journal is © The Owner Societies 2014

ESI-IV
Adsorption isotherms for GFMCs
Figure S3. Adsorption isotherms for GFMCs
All the samples were measured by nitrogen adsorption–desorption experiments at 77 K. All the
adsorption isotherms are of type II with typical hysteris loop at high value of p/p0. Hysteresis
loop at high value of p/p0 signifies microporosity in these materials.
0.0 0.2 0.4 0.6 0.8 1.0
0
5
10
15
20
25
30 GFMC1
Vol
ume
@ S
TP
(cc/
g)
Relative Pressure
0.0 0.2 0.4 0.6 0.8 1.0
0
200
400
600
800
1000
1200
1400 GFMC3
Vol
ume
@ S
TP
(cc/
g)
Relative Pressure
0.0 0.2 0.4 0.6 0.8 1.0-200
0
200
400
600
800
1000
1200
1400GFMC2
Vol
ume
at S
TP
(cc/
g)
Relative Pressure
Electronic Supplementary Material (ESI) for Physical Chemistry Chemical PhysicsThis journal is © The Owner Societies 2014
ESI-V
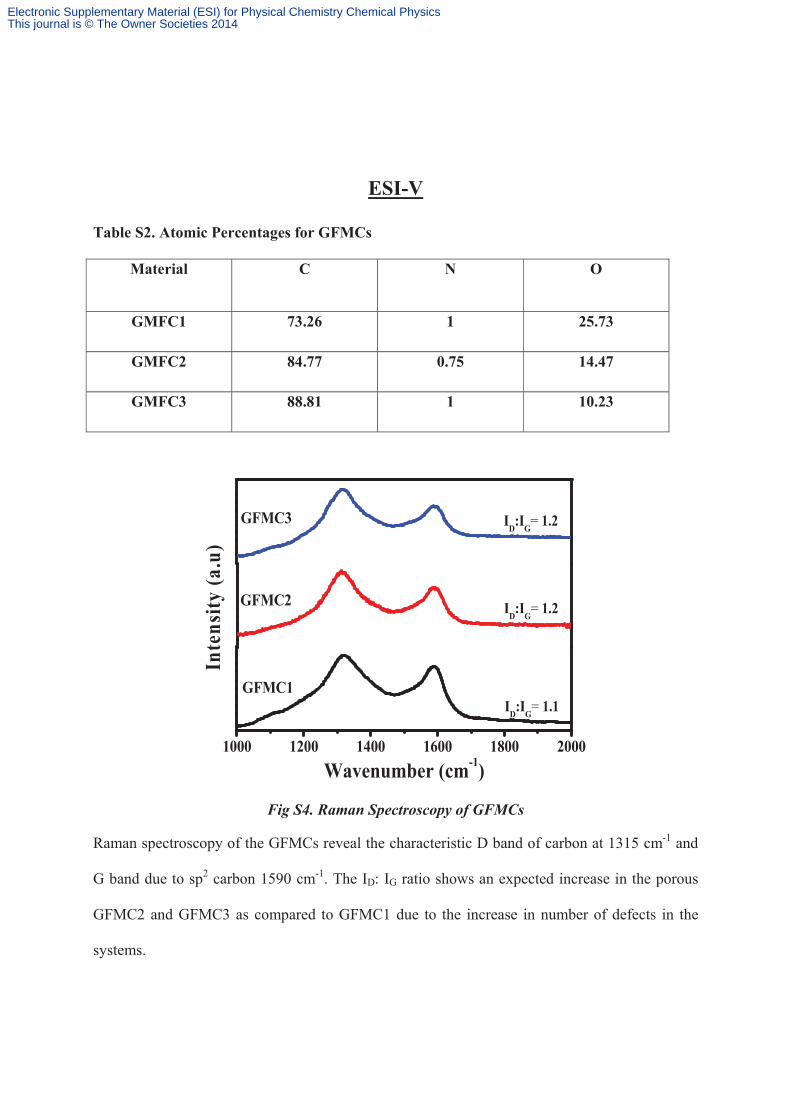
Table S2. Atomic Percentages for GFMCs
Material C N O
GMFC1 73.26 1 25.73
GMFC2 84.77 0.75 14.47
GMFC3 88.81 1 10.23
Fig S4. Raman Spectroscopy of GFMCs
Raman spectroscopy of the GFMCs reveal the characteristic D band of carbon at 1315 cm-1 and
G band due to sp2 carbon 1590 cm-1. The ID: IG ratio shows an expected increase in the porous
GFMC2 and GFMC3 as compared to GFMC1 due to the increase in number of defects in the
systems.
1000 1200 1400 1600 1800 2000
GFMC1ID:IG= 1.1
Inte
nsity
(a.u
)
Wavenumber (cm-1)
ID:IG= 1.2
ID:IG= 1.2
GFMC3
GFMC2
Electronic Supplementary Material (ESI) for Physical Chemistry Chemical PhysicsThis journal is © The Owner Societies 2014

ESI-VI
Conversion of Hg/HgO to RHE
Hg/HgO electrode calibration was carried in a three electrode system with Pt wires as working and counter electrode and Hg/HgO as reference electrode. Hydrogen saturated 0.1 M KOH was used as an electrolyte. Linear sweep voltammetry was performed at 1 mV/s scan rate and the potential at which current crosses zero was taken as thermodynamic potential (vs Hg/HgO) for the hydrogen electrode.
The potential at which current crosses zero is -0.949V vs Hg/HgO
So E (RHE) = E (Hg/HgO) + 0.949
Figure S5. Calibration curve for reference electrode
Electronic Supplementary Material (ESI) for Physical Chemistry Chemical PhysicsThis journal is © The Owner Societies 2014

Fig S7. 0.1M KO
Linear sweOH with a s
LSV curve
eep voltammscan rate of
es of all GFM
mograms of f 5 mV s-1 .
ESI-VI
MC at diffe
f GFMCs at
I
erent electr
t different ro
rode rotatio
otation in an
on
n oxygen sa
turated
Electronic Supplementary Material (ESI) for Physical Chemistry Chemical PhysicsThis journal is © The Owner Societies 2014

Detailsperfor
Figure varying 130 m2/Electrocvoltammis 0.196
s of commrmance
S6: (a) & (in between
/g (d) Cyclchemical acmogram and6 cm2).
mercial Pt
(b) are the Tn 3 - 5 nm (lic voltammctive surfacd it is 51 m2
t/C (20%)
TEM imagec) N2 adsor
mogram of ce was cal2/g. (Pt load
ESI-VII
used for
es of Pt/C arption isothePt/C at 50lculated fro
ding in the e
II
the comp
at different merm of Pt/C mV/s scanom the hyelectrode is 2
parison of
magnificatio. Calculatedn rate in 0drogen des25 μg/ cm2
f electroch
on. Pt partid BET surfa.1 M KOHsorption areand area of
hemical
cle size is ace area is
H solution. ea of the f electrode
Electronic Supplementary Material (ESI) for Physical Chemistry Chemical PhysicsThis journal is © The Owner Societies 2014

ESI- IX
Fig S8. Current Density of the catalysts plotted in terms of mA/mg a) Pt/C b) GFMCs
0.0 0.2 0.4 0.6 0.8 1.0 1.2-4
-3
-2
-1
0
Cur
rent
den
sity
(mA
mg
carb
on-1)
Potential (V vs RHE)
GFMC3 GFMC2 GFMC1
Electronic Supplementary Material (ESI) for Physical Chemistry Chemical PhysicsThis journal is © The Owner Societies 2014

Onset p
The potthe onseblack an
Fig S9saturateat zero r
potential de
ential whereet potential fnd LSV in n
9. Linear sed 0.1M KOrotation (Re
eterminatio
e the reductfor the ORR
nitrogen satu
sweep voltaOH with a sced).
on
tion current R. (LSV in ourated 0.1 M
ammogram can rate of
ESI- X
sharply incroxygen satu
M KOH at 0
of GFMC5 mV s-1 (B
X
reasing comurated 0.1 M
rpm as blan
C at rotatBlack) and in
mpared to blM KOH at 16
nk in red)
ion at 1600n nitrogen s
ank is consi600 rpm is g
0 rpm in asaturated 0.
idered as given in
an oxygen 1 M KOH
Electronic Supplementary Material (ESI) for Physical Chemistry Chemical PhysicsThis journal is © The Owner Societies 2014

ESI XI
Fig S10. Methanol tolerance studies of GFMC3 at a rotation speed of 1000 rpm in oxygen saturated 0.1 M KOH at 0.8 V. At 500 s, 3 M methanol was added into the electrolyte in order to evaluate the crossover effect.
Fig S11. Linear sweep voltammogram of a) Pt/C catalyst at rotation of 1600rpm in an oxygen saturated 0.1M KOH with a scan rate of 5 mV s-1 before and after 5000 potential cycling (Accelerated Durability Test (ADT)). Note: The LSV curves for Pt/C in Figure 7 and Figure S12 are slightly different as compared to the curve given here. This is because for this ADT
200 400 600 800 1000 1200-8
-6
-4
-2
0
2
4C
urre
nt d
ensit
y (m
A c
m-2)
Time (s)
Pt/C GFMC3
Electronic Supplementary Material (ESI) for Physical Chemistry Chemical PhysicsThis journal is © The Owner Societies 2014

experiment we had to use the catalyst material from a different batch, having exhausted with the materials we had before. The LSV curves of Figure 7 and Figure S12 are the same.
Fig S12. ADT plot of GFMC3 plotted with the LSV of the GFMCs
0.0 0.4 0.8
-6
-4
-2
0
Cur
rent
Den
sity
(mA
/cm
2 )
Potential (V vs RHE)
GFMC3 GFMC2 GFMC1 Pt Before ADT After ADT
Electronic Supplementary Material (ESI) for Physical Chemistry Chemical PhysicsThis journal is © The Owner Societies 2014

ESI-XII
SBMC1 as an electrocatalyst for ORR
XPS analysis shows that SBMC1 contains Carbon, Nitrogen and Oxygen in the ratio of
22:1.25:80. Very high oxygen content is observed in this material. A slightly greater % N atom
doping (1.25%) is seen in SBMC1. This may be due to increased protein content of the
precursor. The nitrogen content shows peaks at 399.7 eV (pyrrolic N), 401.3 eV (graphitic N),
403.3 eV (oxygenated N) (Fig S5)
Fig S13. XPS analysis of N1s in SBMC1
396 398 400 402 404 406
N1sSBMC1
Inte
nsity
(a.u
)
Binding Energy (B.E)
Electronic Supplementary Material (ESI) for Physical Chemistry Chemical PhysicsThis journal is © The Owner Societies 2014

Fig S14. Pore size distribution of SBMC1
The pore size distribution of SBMC1 shows a similar hierarchical pore distribution which is
responsible for enhanced catalytic activity (Fig S14). The BET surface area of SBMC1 however
is low (28 m2/g).
This could be due to insufficient penetration of SiO2 nanoparticles into the seed coat of soybean
grains during the synthesis. The resistance of SBMC1 pellet also shows an increase as compared
to GFMCs (~ 10.23 ohms). However the good performance in ORR in this case can be attributed
to an increased nitrogen doping percentage and oxygen functionalization as compared to
GFMCs. It is quite clear that SBMC1 possesses large number of catalytic sites inspite of having
lesser surface area and conductivity as compared to GFMC2.
50 100 150 200 250 300 3500.0000
0.0002
0.0004
0.0006
0.0008
0.0010
0.0012
0.0014
dV/r
(cc/
Å/g
)
Pore Width (Å)
Electronic Supplementary Material (ESI) for Physical Chemistry Chemical PhysicsThis journal is © The Owner Societies 2014

Fig S15. TEM image of SBMC1
Electronic Supplementary Material (ESI) for Physical Chemistry Chemical PhysicsThis journal is © The Owner Societies 2014

Electrochemical Properties
Fig S16. a) LSV studies of the SBMC1 catalysts in 0.1 M oxygen saturated KOH at different
electrode rotation with scan rate is 5 mV s-1. Reference electrode is Hg/HgO and graphite rode
as counter electrode. b) K-L plots of the SBMC1 at different potential. Plots are derived from
the LSV at different rotation speed. c) Kinetic current density of the GFMCs Calculated from the
slope of K-L plot d) Number of electron transfer calculated from the slope of K-L plot.
-0.8 -0.6 -0.4 -0.2 0.0 0.2 0.4
-4.5
-4.0
-3.5
-3.0
-2.5
-2.0
-1.5
-1.0
-0.5
0.0 (a)
Cur
rent
den
sity
(mA
cm
-2)
E (V vs Hg/HgO)
400 rpm 900 rpm 1200 rpm 1600 rpm 2000 rpm 2500 rpm
0.06 0.08 0.10 0.12 0.14 0.16
0.30
0.35
0.40
0.45
0.50
0.55
0.60
0.65
0.70(b)
I -1 (m
A-1)
-1/2 (rad-1/2 s1/2)
-0.27 V -0.31 V -0.35 V -0.39 V
2 4 6 8 10 12 14 16 18 20-0.7
-0.6
-0.5
-0.4
-0.3
-0.2
-0.1 (c)
E (V
vs H
g/H
gO)
jk (mA cm-2)-0.7 -0.6 -0.5 -0.4 -0.3 -0.2
0.0
0.5
1.0
1.5
2.0
2.5
3.0
3.5
4.0(d)
No.
of e
lect
rons
tran
sfer
red
E (V vs Hg/HgO)
Electronic Supplementary Material (ESI) for Physical Chemistry Chemical PhysicsThis journal is © The Owner Societies 2014
Figure S16 a, shows LSV curves of SBMC1 at different rotation speed with an onset potential of 0.05 V
vs Hg/HgO for ORR. SBMC1 also showing excellent ORR activity similar to GFMCs. SBMC1 shows
ORR electron transfer number around 3 in the entire potential range. This clearly indicates that SBMC1
follow a mixed kinetics where both peroxide and OH- formation occurs. Electrocatalytic activity of
SBMC1 proves pyrolysis of protein enriched food waste is a generalized strategy to synthesize cost
effective fuel cell electrocatalyst for ORR.
Electronic Supplementary Material (ESI) for Physical Chemistry Chemical PhysicsThis journal is © The Owner Societies 2014


