
Community ProfileElmhurst/Corona
Elmhurst
Corona
ROOSEVELT AVE
LONG ISLAND EXPRESSWAY
111 ST

CIDI is a research/policy center located in the Offi ce of the Mayor of the City of New York under the auspice of the Deputy Mayor for Health and Human Services. As part of the Offi ce of the Mayor, CIDI conducts citywide interagency research to identify areas of service need in the City. The vision of CIDI is to make data come alive to inspire change.
To learn more about CIDI and to access this report, please visit www.nyc.gov/cidi.
About the Center for Innovation through Data Intelligence (CIDI)

Introduction
Community Overview
Health and Well-Being
Education
Economic Assets
Cultural and Social Connections
Child Welfare and Juvenile Justice
Data User Guide
Table of Contents
4
6
8
10
12
14
16
19
Health and Well-Being

4
In Fall 2017 the NYC Administration for Children’s Services (ACS) created The Division of Child and Family Well-Being (CFWB) to implement primary prevention strategies to promote well-being, family stability, and contribute to reducing involvement in child welfare. Rooted in the belief that all New Yorkers should have access to quality resources and opportunities that enhance their capacity to thrive, CFWB provides and links to primary supports for families and communities to promote child and family well-being, reduce child maltreatment, and minimize child welfare system involvement.
The Community Partnership Program (CPP) was first established in 2007 to coordinate community-based supports for children and families already involved in child welfare investigations or foster care. Beginning in 2016, the CPPs began a redesign process to identify successes, challenges, and additional support needed from ACS. In addition to incorporating primary prevention strategies as part of the new division, the redesign identified the need for data and stakeholder-driven strategic planning processes as critical.
The Center for Innovation Through Data Intelligence (CIDI) in the Mayor’s Office created Community Profiles for each of the 11 CPPs. ACS hopes these community profile will serve as a data resource to inform inclusive strategic planning. While a helpful planning tool, it is our hope that the profiles act as a conversation starter so that informed decisions can be made based on the perspectives of families, providers local leaders and others. For example, local knowledge of the presence of a particular resource may be consistent with the profile map, but information about quality and accessibility can only be unearthed when the right voices are in the room.
Each profile contains data related to well-being and participation in select City programs, as well as resource maps that identify community assets such as parks, health clinics, libraries, and City-funded social service providers. Data and resource maps are presented in six sections.
INT
RO
DU
CT
ION

5
First is an introduction that provides a demographic overview and description of community boundaries. Second are four sections that correspond to the core components of the Two-Generation Approach, which are education, health and well-being, social and cultural connections (or social capital) and economic assets. Finally, a section on child welfare and juvenile justice looks at involvement in ACS programs.
Data in each section are provided at the city and community level, as well as by neighborhood tabulation areas (NTA). NTAs are smaller geographical units within communities that reflect neighborhood names often more familiar to those who live there. Looking at community indicators by NTAs: 1) provides an understanding of how parts of a large community can vary greatly from one another; 2) helps leaders focus CPP strategies in a specific geographic area; and 3) allows for a more manageable assessment of outcomes.
On a final note, ACS recognizes that these community profiles have limitations. Specifically, more data and community assets could have been included. Data that were included were identified as primary indicators for each section. In some cases, data on mental health, homeless populations, or social networks were not available, not complete, or confidential. In addition, community assets identified on resource maps are primarily those funded and staffed by the City (e.g., schools) or City-contracted programs (e.g., ACS prevention services).
But there is room to work around these limitations. ACS may be able to help access additional data upon request and can support CPPs to explore opportunities to collect their own data for families involved in CPP activities. ACS also hopes that each CPP will identify community assets not known to the City, such as community providers and faith-based organizations, all of whom – like the providers, residents and local leaders that compose the CPPs – play a critical role in supporting child and family well-being.

6
CO
MM
UN
ITY
OV
ER
VIE
W
Queens Community District 04 Boundary
New York City
Queens Community District 04
Surrounding NTAs
Elmhurst/Corona, Queens Community District 04, includes 2 Neighborhood Tabulation Areas (NTAs): Corona (QN25) and Elmhurst (QN29). Additional neighborhoods associated with the community district include Lefrak City and Corona Heights.
NTAs included in the profi le
Elmhurst
Forest Hills
Jackson Heights
Middle Village
Corona
MaspethRego Park
East Elmhurst
North Corona
Elmhurst-Maspeth
Woodside
Steinway AirportAirport
College Point
Corona
Astoria
Flushing
QN29
QN25
ROOSEVELT AVE
LONG ISLAND EXPRESSWAY
111 ST

7
DE
MO
GR
AP
HIC
S
QN25 Corona
QN29 Elmhurst
Total Population
Total Population by Race
Hispanic/LatinX (%)
Not Hispanic/LatinX (%)
White Alone (%)
Black or African American Alone (%)
American Indian and Alaska Native Alone (%)
Asian Alone (%)
Native Hawaiian and Other Pacific Islander Alone (%)
Some other race Alone (%)
Two or more races (%)
Total Population by Gender
Male (%)
Female (%)
Total Population by Age Group
Under 5 Years (%)
Under 18 Years (%)
18 to 64 Years (%)
65 years and over (%)
QN25
58,626
61.5
38.5
6.8
16.2
0.3
14.3
0.0
0.4
0.5
52.4
47.6
8.7
26.1
63.3
10.6
QN29
83,663
43.2
56.8
6.0
2.1
0.2
46.4
0.0
0.6
1.7
50.9
49.1
6.7
19.6
68.1
12.3
NYC
8,461,961
29.0
71.0
32.3
22.2
0.2
13.6
0.0
0.9
1.8
47.7
52.3
6.6
21.2
65.8
13.0
QN04
142,289
50.7
49.3
6.3
7.9
0.2
33.2
0.0
0.5
1.2
51.5
48.5
7.5
22.3
66.1
11.6

HE
ALT
H A
ND
WE
LL-B
EIN
G
Late or no prenatal care (%)
Preterm births (%)
Annual births (Avg)
Teen births (per 1,000 women aged 15 to 19 years)
Infant mortality (per 1,000 live births)
Health insurance (%)
Medicaid enrollment (%)
Children covered by Medicaid (%)
No health insurance: Ages 0-17 (%)
Disability (any): Ages 0-17 (%)
Disability (any): Adults 18+ (%)
Hospitalizations: Preventable (per 100,000 population)
QN25
8.3
8.2
956
37.4
NA
77.1
47.3
74.3
3.1
4.8
14.7
1,690
QN29
8.4
7.2
1,333
31.8
NA
78.8
45.9
75.9
3.2
3.4
10.1
1,044
QN04
8.9
7.9
2,747
22.1
3.3
78.1
42.3
70.4
3.1
4.1
11.9
1,127
NYC
7.0
9.1
122,718
23.7
4.1
89.0
37.0
54.6
3.1
3.4
12.5
1,662
QN25 Corona
QN29 Elmhurst
This Two-Generation core component focuses on the impact that physical and mental health have on a family’s ability to thrive. Critical resources include places where residents can access health care and obtain health promotion or prevention services. This core component also puts emphasis on building strong parent-child relationships to encourage healthy attachment. Beyond the traditional understanding of health, childhood trauma in the form of adverse childhood experiences (ACEs) and community trauma in the form of overt and systemic racism have lasting health and social consequences. It is critical that practitioners and educators are aware of the impact of trauma and other forms of toxic stress, and have tools and resources to help mitigate or prevent them.
8

NTA Boundary
CD Boundary
Hospitals and Clinics
School-based Health Centers and Hospitals
Community Health Centers
Health Promotion and Disease Prevention
Mental Health Services
Chemical Dependency Services
Programs for People with Disabilities
Senior Services
MAP LEGEND
8Elmhurst/Corona CPP
")#*
#*
#*
#*
#*
!(!(!(
!(!(
#*
#*#*
#*!(!(
!(
!(
#*
!(
")")
$+
#* #*#*#*
!(!(!(
!(
!(
!(
!(
")
!(!(
#*#*
#*
#*#*
#*
#*
#*
#*#*
#*
#*
#*
#*
#*
")
!(
!(
")
")
")")
#*
#*
#*#*
#*
#*#*#*#*#*#*#*#*#*
")
#*!(
!(
!(
#*
#*
#*
#*
#*
")!( #*#*#*#*
!(
8
Elmhurst CoronaQN29 QN25
RE
SO
UR
CE
S
9

ED
UC
AT
ION
Early Education
Early education enrollment (nursery school, pre-school) (%)
Number of children served by early learn programs
K-12 Education
3rd-8th grade math profi ciency (%)
3rd-8th grade ELA profi ciency (%)
Education less than high school (%)
High school graduate (includes equivalency) (%)
Chronic absenteeism (%)
Graduation rate (%)
QN25
43.5
286
34.7
38.6
32.7
32.2
21.9
74.9
QN29
40.5
167
53.4
54.9
28.7
28.6
14.2
85.7
QN04
41.8
513
45.0
47.6
30.2
30.0
17.6
80.9
NYC
61.6
52,379
44.7
48.0
19.2
24.0
26.8
74.5
Postsecondary Education
Bachelor’s degree or higher (%)
Employment
Unemployment (%)
Disconnected youth (%)
15.5
3.8
NA
24.9
4.0
NA
21.3
3.9
2.8
36.2
5.5
5.2
PRIMARY AND SECONDARY EDUCATION
POSTSECONDARY EDUCATION AND EMPLOYMENT
This Two-Generation core component is emphasized because of its role in alleviating intergenerational poverty and replacing it with a cycle of intergenerational opportunity. It is important from an early age to invest in early childhood development programs like child care, Head Start, and Pre-K. For older youth, providing academic enhancement activities and K-12 educational support is critical for success later in life. For adults, learning continues through postsecondary education, workforce development, and family literacy activities that engage all family members. Parents who complete a college degree increase their incomes, and a parent’s level of educational attainment is a strong predictor of a child’s success.
10
QN25 Corona
QN29 Elmhurst

EarlyLearn Head Start
Day Care and Pre-kindergarten
ESL Schools
Higher Education
Libraries
Schools
Community Schools
Vocational/Job Training/Trade Schools
Workforce 1 Career Centers
Workforce Development
NTA Boundary
CD Boundary
MAP LEGEND
8Elmhurst/Corona CPP
#*#*
#*
!(
!(
!(
!(
!(
!(
!(
!(
!(
!(
!(
!(
!( !(
!(!(
!(!(
!(!(
!(
!(
!(
!(
#*
#*
#*
#*
#*
#*#*
#*
!(!(
!(
")
#*#*
!(
!(
!(
!(!(
!(
!(
!(
!( !(
!(
!(
!(
!(
!(
!(
!(
!(
!(
#*
#*
#*#*
#*
#*#*$+
!( !(!(!(!(
#*
#*#*
#*
#*!(
!(
!(!(
!(
!(
!(
!(
!(
!(
!(#*
#*
#*#*
#*
#*
#*
!(
!(
!(
!(
!(
!(
!(
!(!(
!(
!(
!(
!(
!(
!(
#*
#*
#*
$+
!(!(
#*#*
#*
#*
#*
!(
!(
!(!(
!(
!( !(
!(
!(!(
!(
!(
!(
!(
!(
!(
!(
!(
!(
!(
!(!(
!(!(!(
!(
!(
!(
#*#* #*
#*
#*
#*
#*#*
#*#*#*
#*#*
#*#*#*
#*
$+!(
$+
#*
#*#*
!(
!(
!(
!(
!(!(
!(
!(!(
!(
!(#*
#*#*#*
#*
$+
$+!(
#*#*#*#*#*
#*
#* #*
#*
!(
!(
!(
!(
!(
!(
!(
!(
!(
!(
!(
!(
!(
!(!(
!(
!(!(
!(!(!(
!(
!(
!(
!(
#*
#*
#*#*
#*#*
#*
#*#*
#*
#*#*
#*
$+!(
!(
#*
#*
#*
#*
#*
#*
#*
#*!(
!(
!(
!(
!(
!(
!(
!(
!(
!(!(
!(
!(
!(
!(
!(
!( !(
!(
!(
!(
#*#*
#*
#*
#*
#*
#*
#*#*
#*#*
#*#*
#*
#*#*
#*
$+
!(
!(
!( !(!(
!(
#*
!(
!(
!( !(
!(
!(
!(
!(
!(
!(
!(
#*
#*
#*
#*#*#*#* #*
#*
$+
#*
#*
!(
!(!(
!(!(
!(!(
!(
!(
!(
!(
!(
!(
!(
!(
#*
#*
#*
#*
#*
#*#*
#*
#*#*!(
!(
!(!(!(
!(
!(
!(!(
!(!(
!(
!(
!(!(#*
#*
#*#*
!(
!(
!(
#*#*!(
8
Elmhurst CoronaQN29 QN25
RE
SO
UR
CE
S
11

EC
ON
OM
IC A
SS
ET
S
As a Two-Generation core component, this focuses on the role that building fi nancial assets plays in a family’s economic mobility, and how family income and fi nancial security impact a child’s future prospects. Helping families increase their economic security and mobility through housing, access to transportation, fi nancial education, accessing student fi nancial aid, and connecting them to concrete supports in times of need (such as food assistance or job placement programs) can make a huge difference.
12
QN25 Corona
QN29 Elmhurst
Housing
Overcrowded housing (%)
Homeownership (%)
Median rent ($)
Rent burden: Greater than 35 percent (%)
Residents living in public housing: Ages 0-12
Residents living in public housing: Ages 13-17
Children living in homeless shelters: Ages 0-12
Children living in homeless shelters: Ages 13-17
Income
Median household income ($)
Families below poverty (%)
Individuals below poverty (%)
Individuals below poverty: Ages 0-17 (%)
Food stamps/SNAP benefi ts (%)
*Data not disclosed due to small cell size
QN25
21.8
23.0
1,427
52.7
*
*
74
21
45,589
17.4
20.8
27.1
27.7
QN29
21.1
24.4
1,371
58.1
*
*
*
*
44,367
17.1
20.8
27.4
17.0
QN04
21.4
23.9
1,393
56.0
*
*
205
41
44,865
17.3
20.8
27.2
21.1
NYC
9.0
32.0
1,294
44.6
69,414
34,783
18,583
3,929
55,191
17.0
20.3
29.0
20.4

Fire Stations
Police Stations
Public Housing Facilities
Tax Prep
Food Pantries
NTA Boundary
CD Boundary
MAP LEGEND
8Elmhurst/Corona CPP
#*
#*
")
#*#*
#*
#*
#*
#*
#*
#*
#*
#*
#*#*#*#*
#*
#*#*
#*
#*
#*
#*
#*
#*
#*
")
#*
#*
")
#*
#*#*
#*#*
#*
#*
#*
$+
$+
$+8
Sources: Esri, HERE, DeLorme, USGS, Intermap, increment P Corp., NRCAN,Esri Japan, METI, Esri China (Hong Kong), Esri (Thailand), TomTom, MapmyIndia,© OpenStreetMap contributors, and the GIS User Community
Elmhurst CoronaQN29 QN25
RE
SO
UR
CE
S
13

CU
LTU
RA
L A
ND
SO
CIA
L C
ON
NE
CT
ION
S
Foreign-born (%)
Most common language1
Second most common language1
Third most common language1
Most common country of birth2
Second most common country of birth2
Third most common country of birth2
QN25
56.1
Spanish or Spanish Creole
Chinese
Russian
Mexico
Ecuador
Dominican Republic
QN29
67.3
Spanish or Spanish Creole
Chinese
Other Indic languages
China3
Ecuador
Mexico
QN04
62.7
Spanish or Spanish Creole
Chinese
Other Indic languages
China3
Ecuador
Mexico
NYC
37.2
Spanish or Spanish Creole
Chinese
Russian
Dominican Republic
China3
Mexico
This section represents the Two-Generation core component of social capital, which is the formal and informal networks through which people develop meaningful connections, fi nd support, and access resources and knowledge. These networks and the skills to build them are important contributors to families’ well-being. Examples of forms of social capital include friends or family who provide emotional support, neighbors that look out for one another, and workplace contacts such as mentors and colleagues. ACS hopes that the CPPs will be builders of social capital in their communities through developing the leadership of Community Ambassadors and facilitating peer-led activities that build relationships and support among residents.
14
1Most common language other than English2Most common country of birth other than US3Excluding Hong Kong and Taiwan
QN25 Corona
QN29 Elmhurst
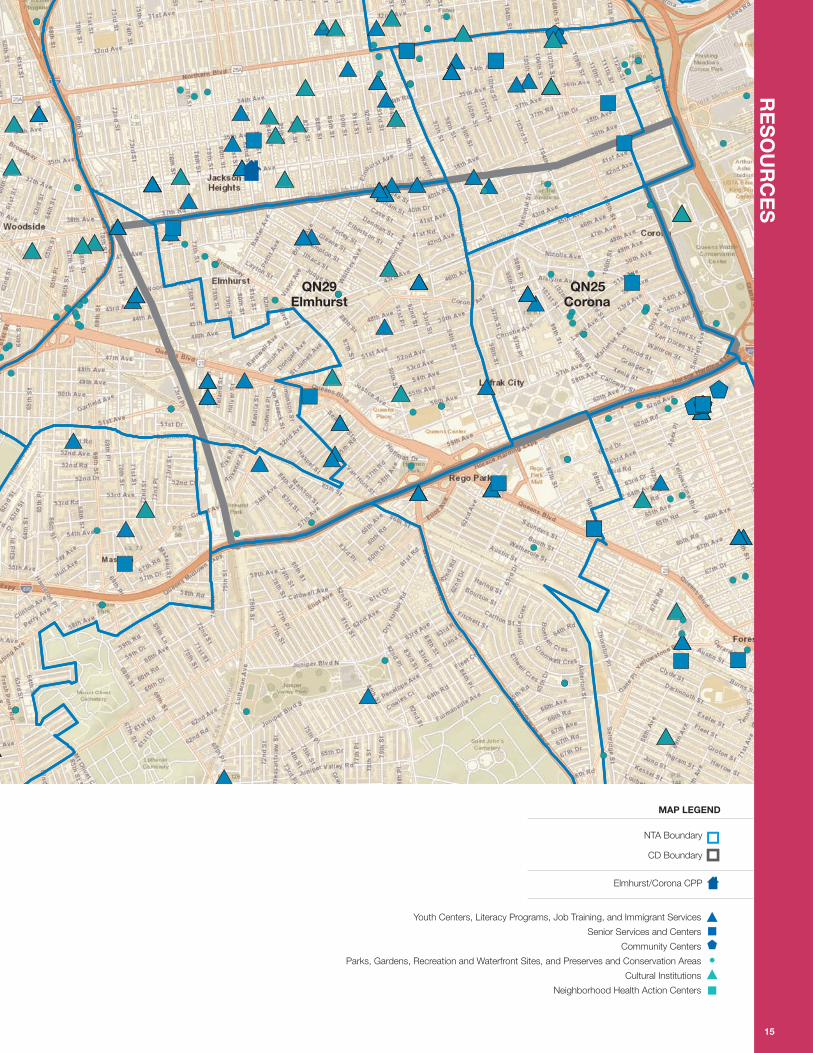
Youth Centers, Literacy Programs, Job Training, and Immigrant Services
Senior Services and Centers
Community Centers
Parks, Gardens, Recreation and Waterfront Sites, and Preserves and Conservation Areas
Cultural Institutions
Neighborhood Health Action Centers
NTA Boundary
CD Boundary
MAP LEGEND
8Elmhurst/Corona CPP
#*
#*#*
#*#*
#*
#*
#*#*#*
#*
#*
#*
#*
#*
#*
$+$+$+$+$+
!(
!(
!(
!(
!(
!(
!(
!( !(
!(
!(
!(
!(
")")")
")")
#*#* #*#*#*#*!(
!(
!(
!(
!(
!(
!(
")")
")
")
#*
#*
#*
!(
!(
#*#*#*#*!(
!(
!(
!(
!(
!(
!(
!(
!(
!(
!(!(!(
")
$+#*#*
#*
#*#*#*
#*
#*
#*
!(
#*
#*
!(
#*
!(
!(
!(
!(
!(
!(
!(
!(
!(
!(")")")
")
")
")
#*
#*!(#*#*
!(
!(!(
!(
!(
")
#*#*
#*
#*
#*
#*#*
#*
#*
#*
#*
#*
#*
#*
#*
#*#*
#*#* #*#*
#*
#*
#*
#*
#*
#*
!(
!(
!(
!(
!(
!(!(
!(
!(
!(
!(
!(
!(
!( !(
!(
!(
!(
!(
")
")
#*
#*
#*
#*
#*
#*#*
#*
#*
#*
#*
#*
#*
#*
#*
#*#*
#*
#*
#*
!(
!(
!(
!(
!(
!(
!(
!(
!(
!(
!(
!(!(
")
")
#*#*
#*
#*
#*
#*
#*
!(
!(
!(
!(
!(
!(
!(
")
#*
#*
#* #*#*
#*
#*
#*
#*
#*
#*
#*
!(
!(!(
!(!(!(!(
!(
!(
#*
#*#*
#*
#*
#*
#*
#*#* #*
!(
!(
!(
!(!(
!(
!(
!(
!(")
#*#*
!(
!(
!(
!(
8
Elmhurst CoronaQN29 QN25
15
RE
SO
UR
CE
S

CH
ILD
WE
LFA
RE
AN
D J
UV
EN
ILE
JU
ST
ICE
ACS has a variety of primary prevention services through the Division of Child and Family Well-Being (CFWB) aimed at reducing the need for ACS intervention, including the Community Partnership Programs (CPP) and Family Enrichment Centers (FEC). When intervention is necessary, ACS provides a continuum of services and support to children and families aimed at strengthening stability and well-being for both families and the communities where they live.
In child welfare, the Division of Child Protection (DCP) investigates all allegations of abuse and maltreatment. ACS also provides free prevention services to families involved in investigations to prevent foster care placement through the Division of Preventive Services (DPS). The Family Permanency Services (FPS) Division works with ACS’ contracted foster care provider agencies and other key stakeholders to achieve positive safety, permanency, and well-being outcomes for children and families in the foster care system.
In juvenile justice, the Division of Youth and Family Justice (DYFJ) provides a wide range of services and programs to improve the lives of children and families involved in the juvenile justice system. DYFJ provides preventive programs, therapeutic treatments, and other services to youth in custodial care, and helps youth develop the tools necessary to leave the justice system for good. Most recently under the state’s Raise the Age law, DYFJ is expanding its continuum of residential and community-based alternative services to support the vast majority of youth aged 16 and 17 who will no longer be detained in or sentenced to adult facilities.
16
QN25 Corona
QN29 Elmhurst
QN25 QN29QN04
Juvenile Justice
Admissions to juvenile detention
Admissions to juvenile detention (per 1,000 children aged 12 to 17 years )
Child Welfare
Children in investigations
Children in investigations (%)
Children in indicated Investigations
Children in indicated Investigations (%)
Children in child welfare prevention cases
Children in child welfare prevention cases (%)
Foster care placements
Foster care placements (per 1,000 children below 18 years)
Foster care population
Foster care population (per 1,000 children below 21 years)
Vouchers for Child Care
Vouchers for Child Care (%)
*Data not disclosed due to small cell size
NYC
1,856
3
87,621
5
37,121
2
44,270
2
3,890
2
7,672
4
95,931
8
*
*
1,080
3
445
1
618
2
35
1
27
1
344
2
17
3
480
3
220
1
278
2
17
1
18
1
196
2
*
*
392
2
148
1
212
1
*
*
*
*
110
1

Preventive Services
Family Enrichment Centers
NTA Boundary
CD Boundary
MAP LEGEND
8Elmhurst/Corona CPP
#*#*
8
Elmhurst CoronaQN29 QN25
17
RE
SO
UR
CE
S


Data User GuideIndicator CalculationsData DictionaryMethodologyMaps

20
INDICATOR CALCULATIONS: Examples
The indicators are primarily expressed as either percentages or rates.
Rates Defi nition: the number of individuals/events with a given characteristic per 1,000 individuals/events (both with and without the characteristic). Rates are typically used for rare events.
Percentages Defi nition: the number of individuals/events with a given characteristic divided by the total individuals/events (both with and without that characteristic).
Calculation example: Teen births
# of births in which the mother was under 20 years old in the geographic area
total # of women 15 to 19 years old in the geographic area.
1000
Calculation example: Individuals below poverty: Ages 0-17
# of individuals aged 17 years and under living below the poverty threshold in the geographic area
total # of individuals aged 17 years and under in the geographic area
100

21
DATA DICTIONARY
I. Community Demographics
1. Total Population
Total Population by Race (%)These indicators measure the population of the following racial groups as a percentage of the total population in the geographic area.
2. Hispanic/ LatinX* 3. Not Hispanic / LatinX*4. Black or African American Alone5. American Indian and Alaskan Native Alone6. Asian Alone7. Native Hawaiian and Other Pacific Islander Alone8. Some other race Alone9. Two or more races
*LatinX: Hispanic/LatinX is being used as a gender-neutral and nonbinary alterative to the U.S.Census indicator of Hispanic/Latino
Sources: American Community Survey 5-Year Estimate (2012-2016)Geography: City, Census Tract, PUMA, NTA
Total Population by Gender (%)These indicators measure the male and female population as a percentage of the total population in the geographic area. Male and female, in this measure, refer to the biological sex of an individual.
10. Male11. Female
Sources: American Community Survey 5-Year Estimate (2012-2016)Geography: City, Census Tract, PUMA, NTA
Total Population by Age Group (%)These indicators measure the population of the following age groups as a percentage of the total population in the geographic area.
12. Under 5 Years13. Under 18 Years14. 18 – 64 Years15. 65 years and over
Sources: American Community Survey 5-Year Estimate (2012-2016)Geography: City, Census Tract, PUMA, NTA

22
II. Health and Well Being
1. Late or no prenatal care (%)This indicator measures live births receiving late prenatal care as a percentage of all live births in the geographic area. Late prenatal care is defined here as births that received prenatal care after the first and second trimesters or births that received no prenatal care at all.
Sources: NYC Department of Health and Mental Hygiene, Bureau of Vital Statistics (2010-2014) NYC Department of Health and Mental Hygiene, Bureau of Vital Statistics (2016)Geography: City, CD, NTA
2. Preterm births (%)This indicator measures preterm births as a percentage of all live births in the geographic area. Preterm birth is defined as a birth that occurs before 37 weeks gestation.
Sources: NYC Department of Health and Mental Hygiene, Bureau of Vital Statistics (2010-2014) NYC Department of Health and Mental Hygiene, Bureau of Vital Statistics (2016)Geography: City, CD, NTA
3. Annual births (Avg)This indicator measures the average number of births per year in the geographic area.
Sources: NYC Department of Health and Mental Hygiene, Bureau of Vital Statistics (2010-2014)Geography: City, CD, NTA 4. Teen births (per 1,000 women ages 15 to 19 years)This indicator measures the number of births in which the mother was under 20 years old per 1,000 women aged 15 to 19 years in the geographic area.
Sources: NYC Department of Health and Mental Hygiene, Bureau of Vital Statistics (2010-2014) NYC Department of Health and Mental Hygiene, Bureau of Vital Statistics (2016)Geography: City, CD, NTA
5. Infant mortality (per 1,000 live births)This indicator measures the number of infant deaths per 1,000 live births (3-year average) in the Community District, and the number of infant deaths per 1,000 live births (1-year).
Sources: NYC Department of Health and Mental Hygiene, Bureau of Vital Statistics (2014-2016) and (2016)Geography: City, CD
6. Health insurance (%)This indicator measures the civilian noninstitutionalized population with health insurance coverage as a percentage of the total civilian noninstitutionalized population in the geographic area.
Sources: American Community Survey 5-Year Estimate (2012-2016)Geography: City, Census Tract, PUMA, NTA

23
7. Medicaid enrollment (%)This indicator measures the population that was continuously enrolled (for 11 months or more) in Medicaid as a percentage of the total population in the geographic area.
Sources: NYC Department of Health and Mental Hygiene, Salient NYC Medicaid Enterprise System (2015)Geography: City, CD, NTA
8. Children covered by Medicaid (%)This indicator measures the population aged 17 years and under that was continuously enrolled (for 11 months or more) in Medicaid as a percentage of the total population aged 17 years and under in the geographic area.
Sources: NYC Department of Health and Mental Hygiene, Salient NYC Medicaid Enterprise System (2015)Geography: City, CD, NTA
9. No health insurance: Ages 0-17 (%)This indicator measures the civilian noninstitutionalized population aged 17 years and under with no health insurance coverage as a percentage of the total civilian noninstitutionalized population aged 17 years and under in the geographic area.
Sources: American Community Survey 5-Year Estimate (2012-2016)Geography: City, Census Tract, PUMA, NTA
10. Disability (any): Ages 0-17) (%)This indicator measures the civilian noninstitutionalized population aged 17 years and under with a disability as a percentage of the total civilian noninstitutionalized population aged 17 years and under in the geographic area. Disability includes hearing, vision, cognitive, ambulatory, self-care, or an independent living difficulty.
Sources: American Community Survey 5-Year Estimate (2012-2016)Geography: City, Census Tract, PUMA, NTA
11. Disability (any): Adults 18+ (%)This indicator measures the civilian noninstitutionalized population aged 18 years and over with a disability as a percentage of the total civilian noninstitutionalized population aged 18 years and over in the geographic area. Disability includes hearing, vision, cognitive, ambulatory, self-care, or an independent living difficulty.
Sources: American Community Survey 5-Year Estimate (2012-2016)Geography: City, Census Tract, PUMA, NTA
12. Hospitalizations: Preventable (per 100,000 population)This indicator measures the age-adjusted number of all preventable hospitalizations per 100,000 individuals aged 18 and older in the geographic area.
Sources: NYC Department of Health and Mental Hygiene, Statewide Planning and Research Cooperative System (SPARCS) Inpatient Hospitalizations (2012-2014)Geography: City, CD, NTA

24
III. Primary and Secondary Education
Early Education
1. Early education enrollment (nursery school, pre-school) (%)This indicator measures the population aged 3 years and over enrolled in nursery school or pre-school as a percentage of children aged 3-4 years old in the geographic area.
Sources: American Community Survey 5-Year Estimate (2012-2016)Geography: City, Census Tract, PUMA, NTA
2. Number of children served by early learn programsThis indicator measures children aged 4 years and under who are enrolled in contracted early care, head start, or child care programs. The number of children served could exceed capacity because not all children receive services for the entire duration of the year.
Sources: Administration for Children’s Services (2018)Geography: City, CD, NTA
K-12 Education
3. 3rd-8th grade math proficiency (%) This indicator measures 3rd through 8th grade students enrolled in Department of Education schools who scored a 3 or 4 on the New York State Common Core Mathematics Tests as a percentage of all students in grades three through eight in the geographic area.
Sources: New York City Department of Education (2018)Geography: City, Census Tract, PUMA, NTA
4. 3rd to 8th grade ELA proficiency (%)This indicator measures 3rd through 8th grade students enrolled in Department of Education schools who scored a 3 or 4 on the New York State Common Core English Language Arts (ELA) as a percentage of all students in grades three through eight in the geographic area.
Sources: New York City Department of Education (2018) Geography: City, Census Tract, PUMA, NTA
5. Education less than high school (%)This indicator measures the population aged 25 years and older whose highest level of educational attainment is less than a high school diploma as a percentage of the total population aged 25 years and older in the geographic area.
Sources: American Community Survey 5-Year Estimate (2012-2016)Geography: City, Census Tract, PUMA, NTA

25
6. High school graduate (includes equivalency) (%)This indicator measures the population aged 25 years and older whose highest level of educational attainment is a high school diploma or equivalency as a percentage of the total population aged 25 years and older in the geographic area.
Sources: American Community Survey 5-Year Estimate (2012 -2016)Geography: City, Census Tract, PUMA, NTA
7. Chronic absenteeism (%)This indicator measures students with less than 90% attendance as a percentage of the total population of students enrolled in Department of Education schools in the geographic area.
Sources: New York City Department of Education (2018) Geography: City, Census Tract, PUMA, NTA
8. Graduation rate (%)This indicator measures students who graduated with a diploma within four years as a percentage of the total cohort of all students in the geographic area who entered ninth grade in Department of Education high schools. August graduates are also included in this indicator.
Sources: New York City Department of Education (2017)Geography: City, Census Tract, PUMA, NTA
IV. Postsecondary Education and Employment Pathways
Postsecondary Education
1. Bachelor’s degree or higher (%)This indicator measures the population aged 25 years and older whose highest level of educational attainment is a Bachelor’s degree or higher as a percentage of the total population aged 25 years and older in the geographic area.
Sources: American Community Survey 5-Year Estimate (2012-2016)Geography: City, Census Tract, PUMA, NTA
Employment
2. Unemployment (%)This indicator measures the population aged 16 years and older who are unemployed as a percentage of the total population aged 16 years and older in the geographic area.
Sources: American Community Survey 5-Year Estimate (2012-2016)Geography: City, Census Tract, PUMA, NTA
3. Disconnected Youth (%)This indicator measures youth ages 16 to 24 years who are not employed or in school as a percentage of the total population of youth ages 16 to 24 in the geographic area.
Sources: American Community Survey 5-Year Estimate (2012-2016), IPUMS USAGeography: City, PUMA

26
V. Economic Assets and Safety
Housing
1. Overcrowded housing (%)This indicator measures housing units with more than 1.01 occupants per room as a percentage of the total occupied housing units in the geographic area.
Sources: American Community Survey 5-Year Estimate (2012-2016)Geography: City, Census Tract, PUMA, NTA
2. Homeownership (%) This indicator measures owner-occupied units as a percentage of total occupied units in the geographic area.
Sources: American Community Survey 5-Year Estimate (2012-2016)Geography: City, Census Tract, PUMA, NTA
3. Rent Burden: Greater than 35 percent (%)This indicator measures occupied housing units whose gross rent as a percentage of household income (GRAPI) is 35 percent or more. This indicator is expressed as a percentage of the total number of housing units paying rent in the geographic area. This measure excludes units where GRAPI cannot be calculated.
Sources: American Community Survey 5-Year Estimate (2012-2016)Geography: City, Census Tract, PUMA, NTA
4. Residents living in public housing: Ages 0-12This indicator measures the total number of residents living in New York City Housing Authority public housing in the geographic area who are ages 12 years and under.
Sources: New York City Housing Authority (2018)Geography: City, CD, NTA
5. Residents living in public housing: Ages 13-17This indicator measures the total number of residents living in New York City Housing Authority public housing in the geographic area who are ages 13 through 17 years.
Sources: New York City Housing Authority (2018)Geography: City, CD, NTA
6. Children living in shelters: Ages 0-12 This indicator measures the total number of children living in homeless shelters in the geographic area on January 1, 2019 who were 12 years old and under.
Sources Department of Homeless Services (2018)Geography: City, CD, NTA

27
7. Children living in shelters: Ages 13-17This indicator measures the total number of children living in homeless shelters in the geographic area on January 1, 2019 who were 13 through 17 years old.
Sources Department of Homeless Services (2018)Geography: City, CD, NTA
Income
8. Median household income ($)This indicator measures the median household income of all households in the geographic area. It includes those with no income. The American Community Survey defines household income as income of the householder and all other people aged 15 years and older in the household, regardless of their relation to the householder.
Sources: American Community Survey 5-Year Estimate (2012-2016)Geography: City, Census Tract, PUMA, NTA
9. Families below poverty (%)This indicator measures families whose income in the past 12 months was below the poverty threshold1 as the percentage of all families in the geographic area.
Sources: American Community Survey 5-Year Estimate (2012-2016)Geography: City, Census Tract, PUMA, NTA
10. Individuals below poverty (%)This indicator measures the individuals whose income in the past 12 months was below the poverty threshold1 as a percentage of all individuals in the geographic area.
Sources: American Community Survey 5-Year Estimate (2012-2016)Geography: City, Census Tract, PUMA, NTA
11. Individuals below poverty: Ages 0-17 (%)This indicator measures individuals ages 17 and under who were living below the poverty threshold1 as a percentage of all individuals ages 17 and under in the geographic area.
Sources: American Community Survey 5-Year Estimate (2012-2016)Geography: City, Census Tract, PUMA, NTA
12. Food stamp/SNAP benefits (%)This indicator measures households that received Food stamp/SNAP benefits in the past 12 months as a percentage of total households in the geographic area.
Sources: American Community Survey 5-Year Estimate (2012-2016)Geography: City, Census Tract, PUMA, NTA
1American Community Survey creates poverty thresholds - the dollar amounts used to determine poverty status
- based on size of the family and age of the members. These thresholds do not vary geographically.

28
VI. Cultural and Social Connections
1. Foreign-born (%)This indicator measures the population born outside of the U.S. and U.S. territories as a percentage of the total population in the geographic area. This indicator does not include as foreign-born people who were born abroad to American parent(s).
Sources: American Community Survey 5-Year Estimate (2012-2016)Geography: City, Census Tract, PUMA, NTA
2. Most common language other than EnglishThis indicator measures the most common language spoken by the population in the geographic area who report that they speak English less than “very well.”
Sources: American Community Survey 5-Year Estimate (2012-2016)Geography: City, Census Tract, PUMA, NTA
3. Second most common language other than EnglishThis indicator measures the second most common language spoken by the population in the geographic area who report that they speak English less than “very well.”
Sources: American Community Survey 5-Year Estimate (2012-2016)Geography: City, Census Tract, PUMA, NTA
4. Third most common language other than EnglishThis indicator measures the third most common language spoken by the population in the geographic area who report that they speak English less than “very well.”
Sources: American Community Survey 5-Year Estimate (2012-2016)Geography: City, Census Tract, PUMA, NTA
5. Most common country of birth other than the U.S.This indicator measures the most common country of birth among the population in the geographic area who were born outside of the U.S. and U.S. territories.
Sources: American Community Survey 5-Year Estimate (2012-2016)Geography: City, Census Tract, PUMA, NTA
6. Second most common country of birth other than the U.S.This indicator measures the second most common country of birth among the population in the geographic area who were born outside of the U.S. and U.S. territories.
Sources: American Community Survey 5-Year Estimate (2012-2016)Geography: City, Census Tract, PUMA, NTA

29
7. Third most common country of birth other than the U.S.This indicator measures the third most common country of birth among the population in the geographic area who were born outside of the U.S. and U.S. territories.
Sources: American Community Survey 5-Year Estimate (2012-2016)Geography: City, Census Tract, PUMA, NTA
VII. Child Welfare and Juvenile Justice
Juvenile Justice
1. Admissions to juvenile detention (per 1,000 children aged 12 to 17 years)This indicator measures the number of children who are admitted to juvenile detention per 1,000 children between ages 12 to 17 years in the geographic area. Rates are calculated using admissions, which include children between 11 and 17 years as the numerator and the population estimates of children between 12 and 17 years from available American Community Survey data, as the denominator.
Sources: Administration for Children’s Services, CJIS (2017), American Community Survey 5-Year Estimate (2012 -2016) Geography: City, CD, NTA
Child Welfare
2. Children in investigations (%)This indicator measures the population of children below 18 years in abuse/neglect consolidated investigations as the percentage of the total population of individuals below 18 years old in the geographic area. Geographic area is defnied by the residence of the children in the investigation. If children in the same investigation live at different addresses, the address of only one child was used to designate the geographic area. Children in more than one investigation are counted more than once.
Sources: Administration for Children’s Services, Connections (2017), American Community Survey 5-Year Estimate (2012-2016)Geography: City, CD, NTA
3. Children in indicated investigations (%)This indicator measures the population of children below 18 years in indicated investigations as the percentage of total individuals below 19 years old in the geographic area. Geographic area is defnied by the residence of the children in the indicated investigation. If children in the same investigation live at different addresses, the address of only one child was used to designate the geographic area. Children in more than one indicated investigation are counted more than once.
Sources: Administration for Children’s Services, Connections (2017), American Community Survey 5-Year Estimate (2012-2016)Geography: City, CD, NTA

30
4. Children in child welfare prevention cases (%)This indicator measures the population of children below 18 years who were served by Child Welfare Preventive Services as the percentage of the total population below 18 years old in the geographic area. This indicator measures the unique counts of children served during the year. If a child had more than one home address during the year, the most recent was used.
Sources: Administration for Children’s Services, PROMIS (2017)Geography: City, CD, NTA
5. Foster care placements (per 1,000 children below 18 years)This indicator measures the number of children below 18 years in foster care per 1,000 children below 18 years old in the geographic area. This excludes Close to Home placements.
Sources: Administration for Children’s Services, CCRS (2017), American Community Survey 5-Year Estimate (2012-2016)Geography: City, CD, NTA
6. Foster care population (per 1,000 children below 21 years)This indicator measures the number of children below 21 years old in foster care on January 31, 2019 per 1,000 children below 21 years in the geographic area. This includes children in 24 hour care only and excludes children in Close to Home placements.
Sources: Administration for Children’s Services, CCRS (2019), American Community Survey 5-Year Estimate (2012-2016)Geography: City, CD, NTA
7. Vouchers for child care (%)This indicator measures children who used vouchers for child care as a percentage of the total number of children ages 10 and below in the geographic area. This indicator measures unique counts of children during the calendar year. If a child had more than one address during the year, the most recent address is used to define the geographic area. Children using vouchers are primarily below 12 years of age.
Sources: Administration for Children’s Services, ACCIS (2017)Geography: City, CD, NTA

31
METHODOLOGY
Reliability
A few American Community Survey indicators within the community profiles are shown as grayed values. The grayed values indicate that data is not statistically reliable. In order to determine reliability, the Coefficient of Variation (CV) is computed for each indicator. Indicators with a CV greater than 20% are considered unreliable and hence grayed out. Similarly, the indicators with values of zero are considered unreliable and grayed out.
PUMAs and CDs
American Community Survey indicators are not provided at the Community District (CD) level because CDs are political geographical units unique to NewYork City. The American Community Survey, however, does provide indicators for Public Use Microdata Areas (PUMA) and these are frequently equivalent to CDs. Thus, where CDs had clear PUMA equivalents, the PUMA values were used for the CDs. For the CDs that did not have clear PUMA equivalencies, census tracts were aggregated to calculate CD level information.
“Neighborhood Tabulation Areas (NTAs) were created to project populations at a small area level, from 2000 to 2030 for PlaNYC, the long-term sustainability plan for New York City. Since population size affects the error associated with population projections, these geographic units needed to have a minimum population, which we determined to be 15,000. This criterion resulted in combinations of neighborhoods that probably would not occur if one were solely designating boundaries of historical neighborhoods. Moreover, the neighborhood names associated with the neighborhood tabulation areas are not intended to be definitive. Another feature of the sustainability plan, was the creation of projections for Public Use Microdata Areas (PUMAs), which are approximations of New York City’s Community Districts developed for use with the Census Bureau’s Public Use Microdata Samples (PUMS). In order to make the boundaries consistent with PUMAs, NTAs were created using whole census tracts, from the 2010 census, within PUMAs. Since NTAs were not permitted to cross PUMA boundaries, this further restricted our ability to identify what may be thought of as historical neighborhood boundaries. Thus, users need to be cognizant of the reason why NTAs were created and the demographic/geographic constraints inherent in how they were configured. Despite these limitations, NTAs are a valuable summary level for use with both the 2010 Census and the American Community Survey (ACS). Regarding the decennial census, these geographic areas offer a good compromise between the very detailed data for census tracts (2,168) and the broad strokes provided by community districts (59). For the ACS, NTAs offer a more statistically reliable alternative to the high sampling error that renders data for most individual census tracts unusable.”1
1 NYC Planning, https://www1.nyc.gov/site/planning/data-maps/open-data/dwn-nynta.page

32
MAPS
Maps in this report are created using ArcMap (ESRI).
Data Sources for Maps:
Data Points:Administration for Children’s Services (ACS)Access NYCNYC City Planning-Facilties Database
Geographical Boundaries:NYC City Planning
Map Sources as listed (Pages 9, 11,13,15,17): Esri, HERE, DeLorme, USGS, Intermap, increment P Corp., NRCAN, Esri Japan, METI, Esri China (Hong Kong), Esri (Thailand), TomTom, MapmyIndia, ©OpenStreetMap contributors, and the GIS User Community.

33


