Download - Emerging Hot Spot Analysis
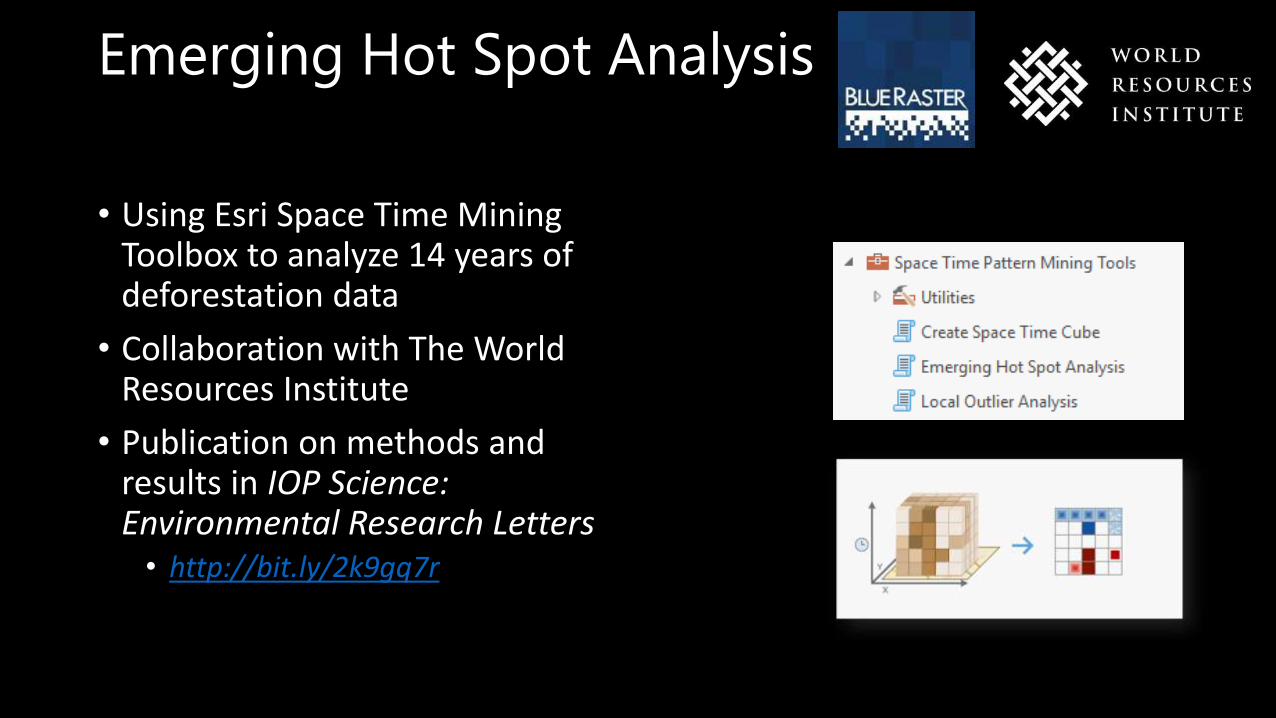
Emerging Hot Spot Analysis
• Using Esri Space Time Mining Toolbox to analyze 14 years of deforestation data
• Collaboration with The World Resources Institute
• Publication on methods and results in IOP Science: Environmental Research Letters• http://bit.ly/2k9gq7r
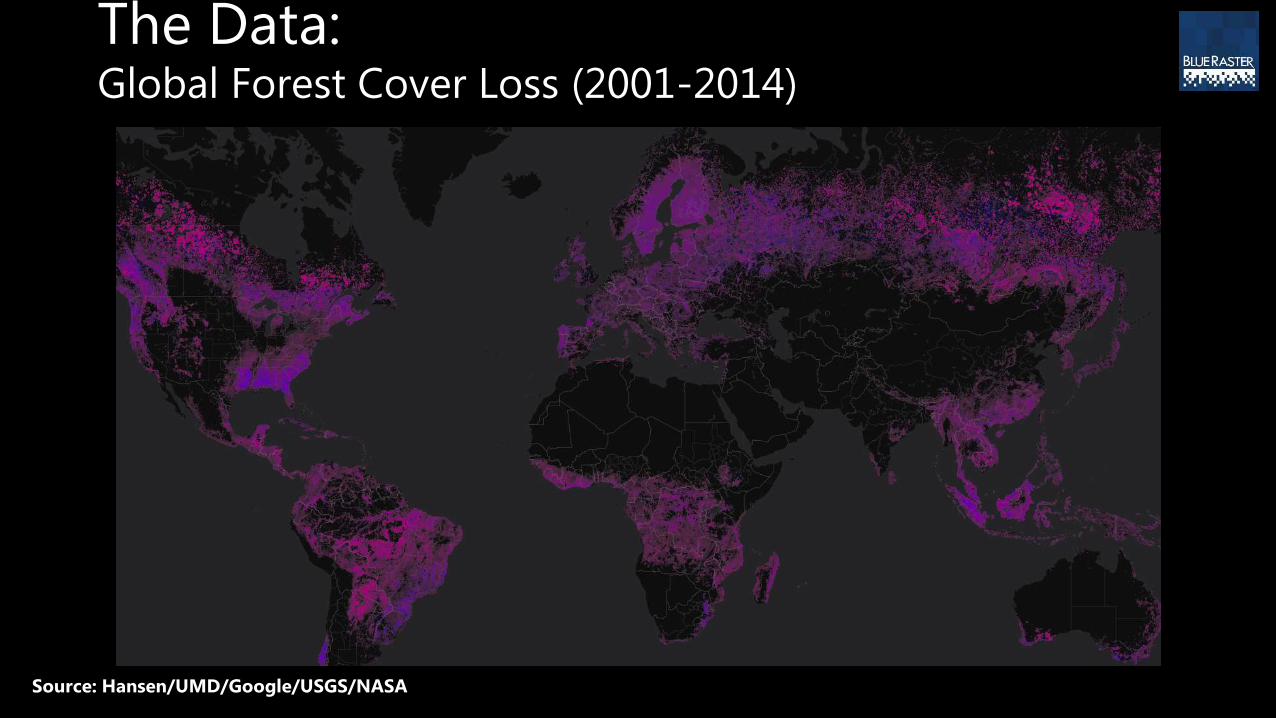
The Data:Global Forest Cover Loss (2001-2014)
Source: Hansen/UMD/Google/USGS/NASA
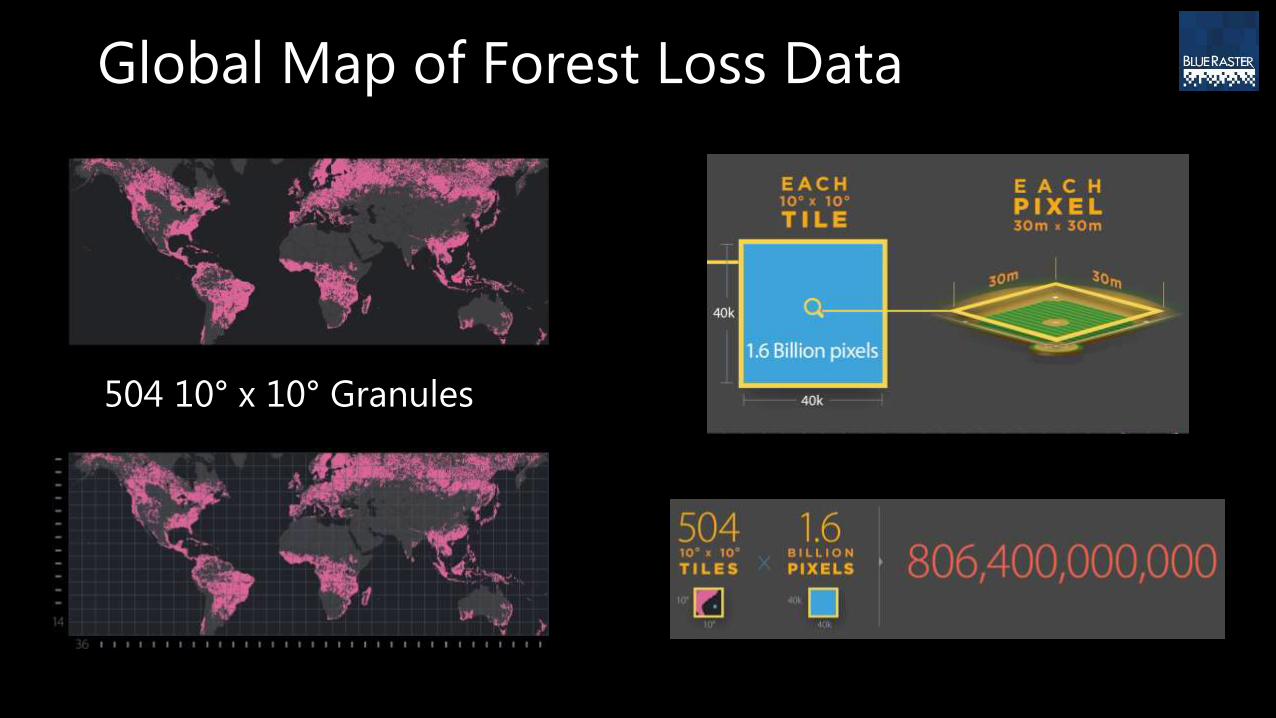
Global Map of Forest Loss Data
504 10° x 10° Granules
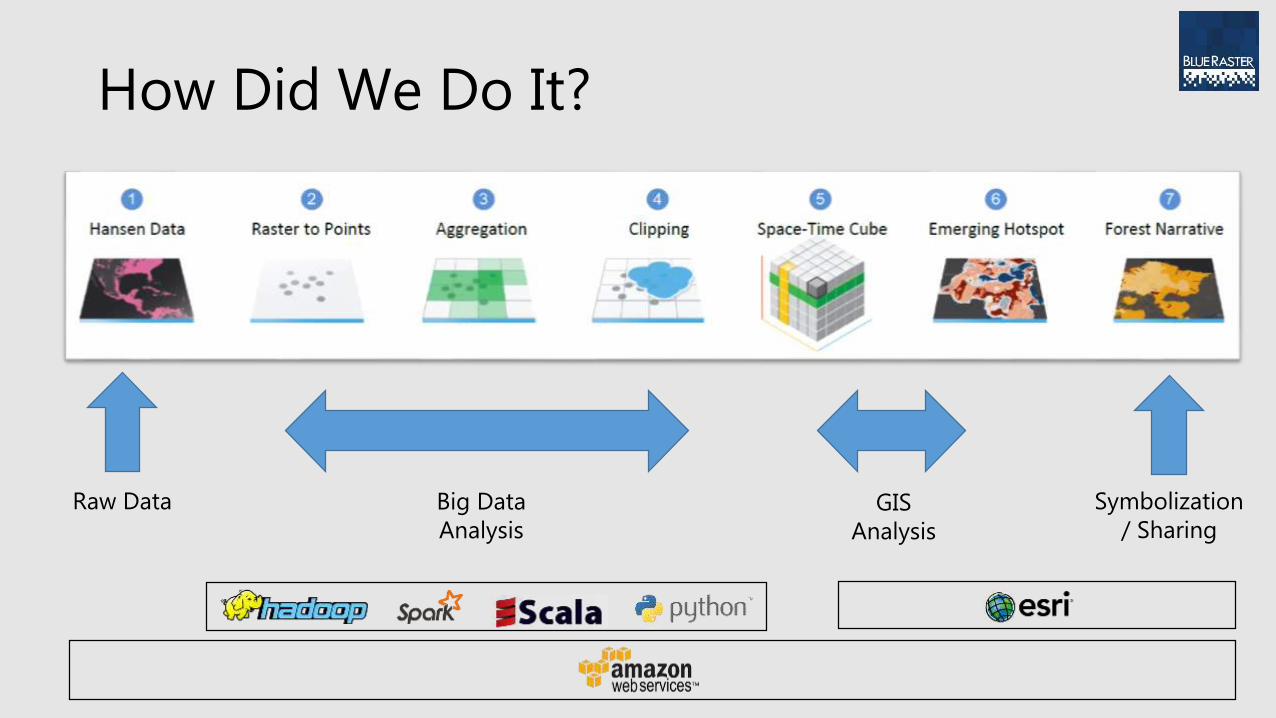
How Did We Do It?
Raw Data Big Data Analysis
GIS Analysis
Symbolization / Sharing
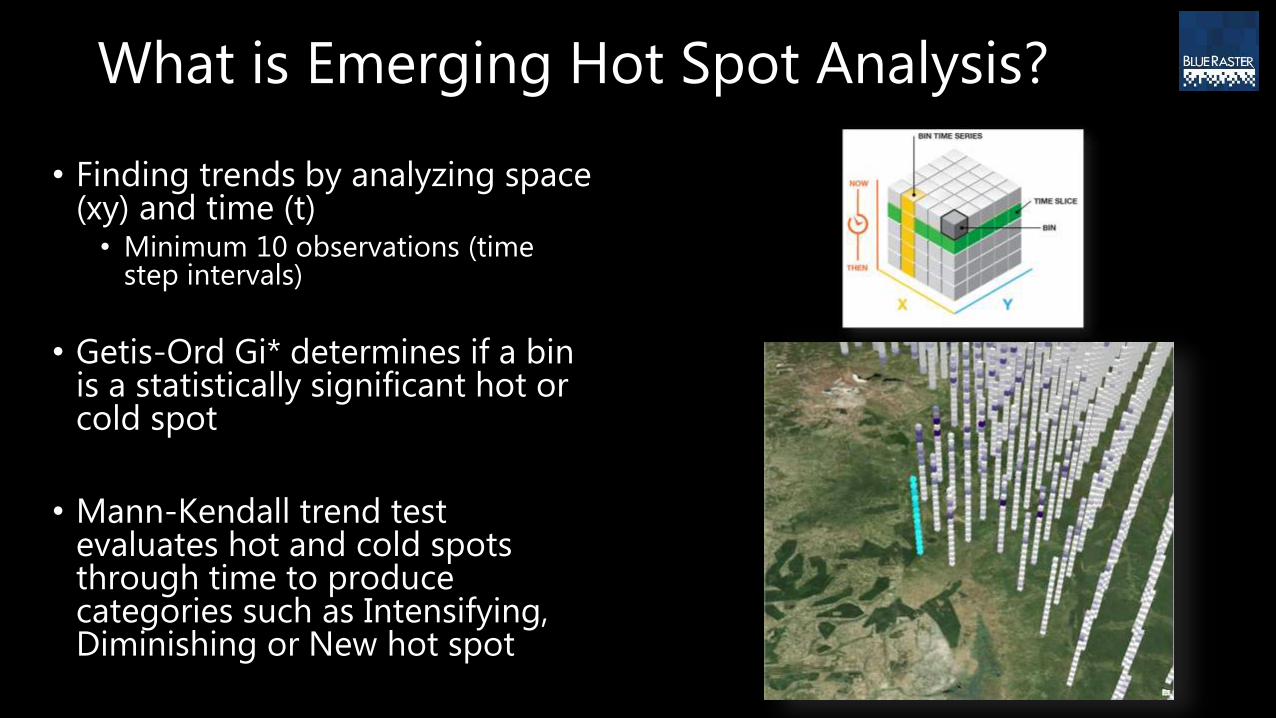
What is Emerging Hot Spot Analysis?
• Finding trends by analyzing space (xy) and time (t)• Minimum 10 observations (time
step intervals)
• Getis-Ord Gi* determines if a bin is a statistically significant hot or cold spot
• Mann-Kendall trend test evaluates hot and cold spots through time to produce categories such as Intensifying, Diminishing or New hot spot
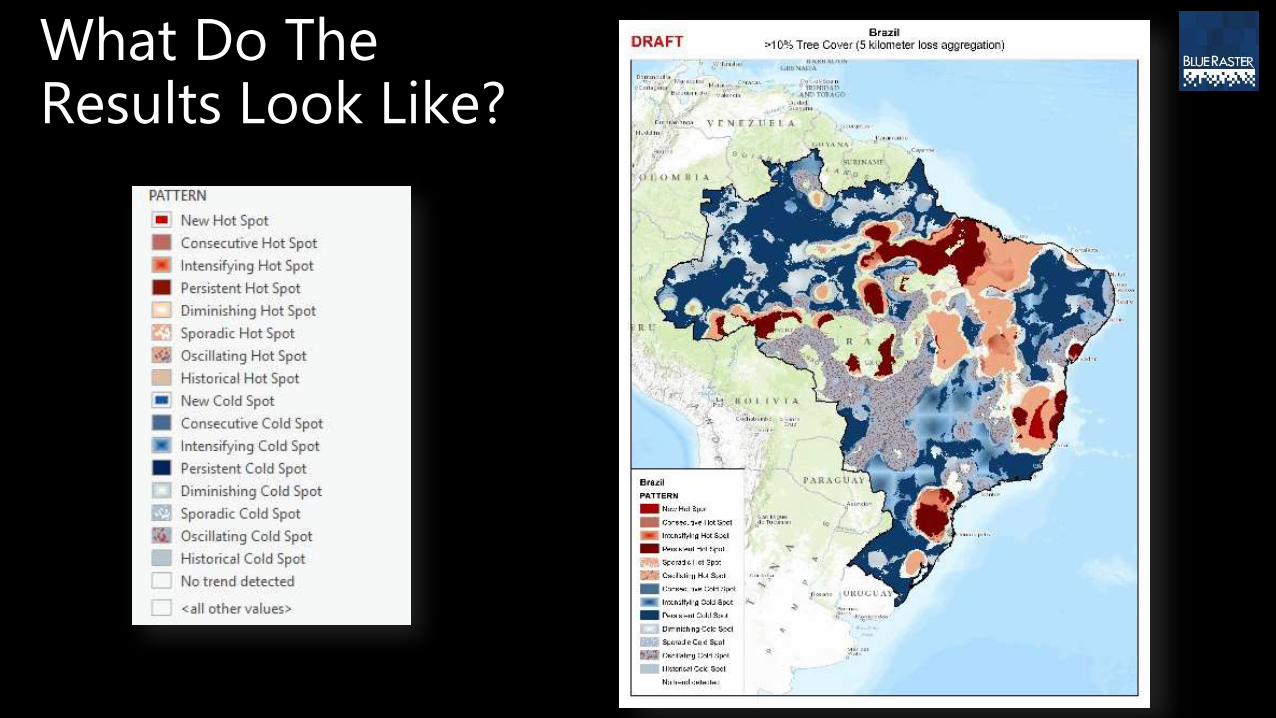
What Do The Results Look Like?
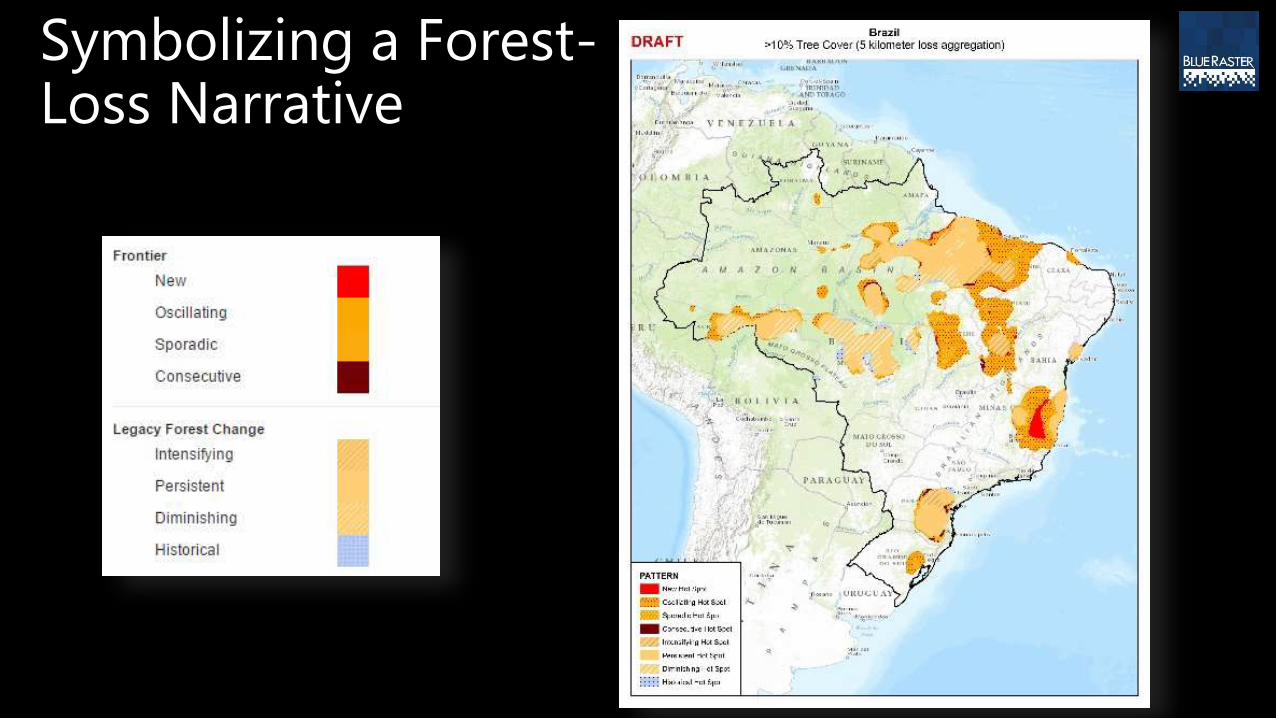
Symbolizing a Forest-Loss Narrative
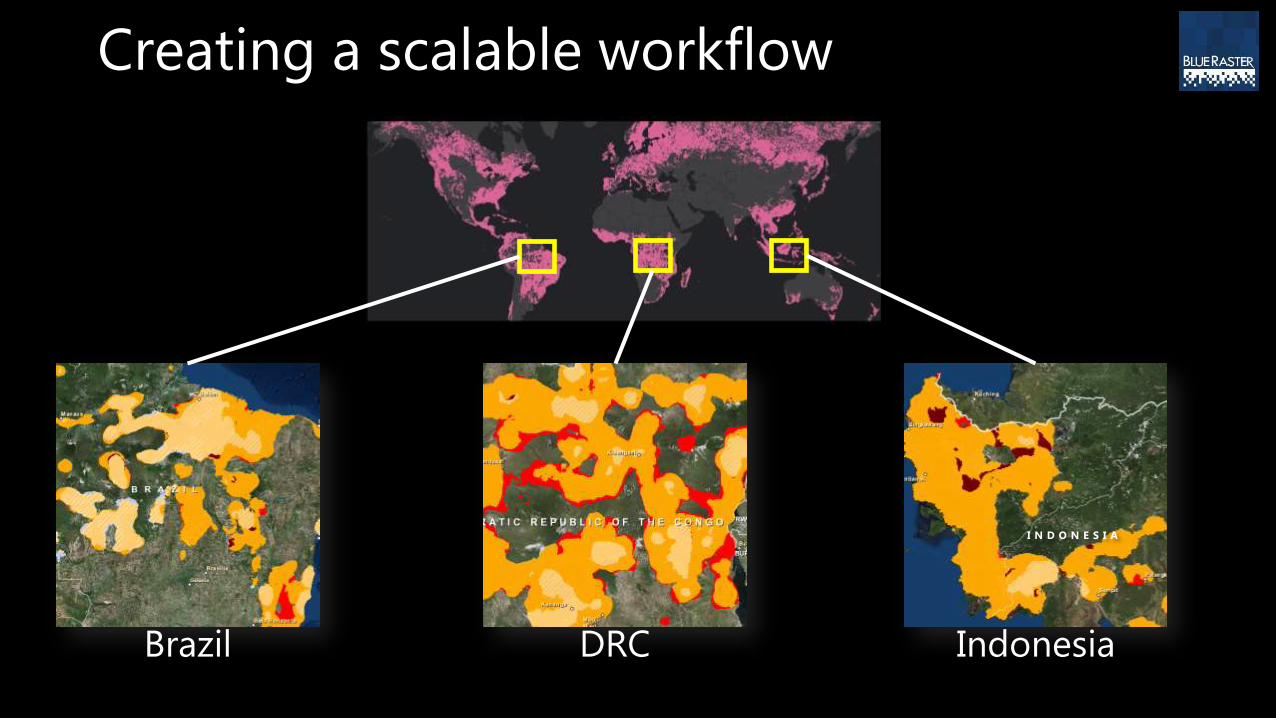
Creating a scalable workflow
I N D O N E S I A
Brazil DRC Indonesia
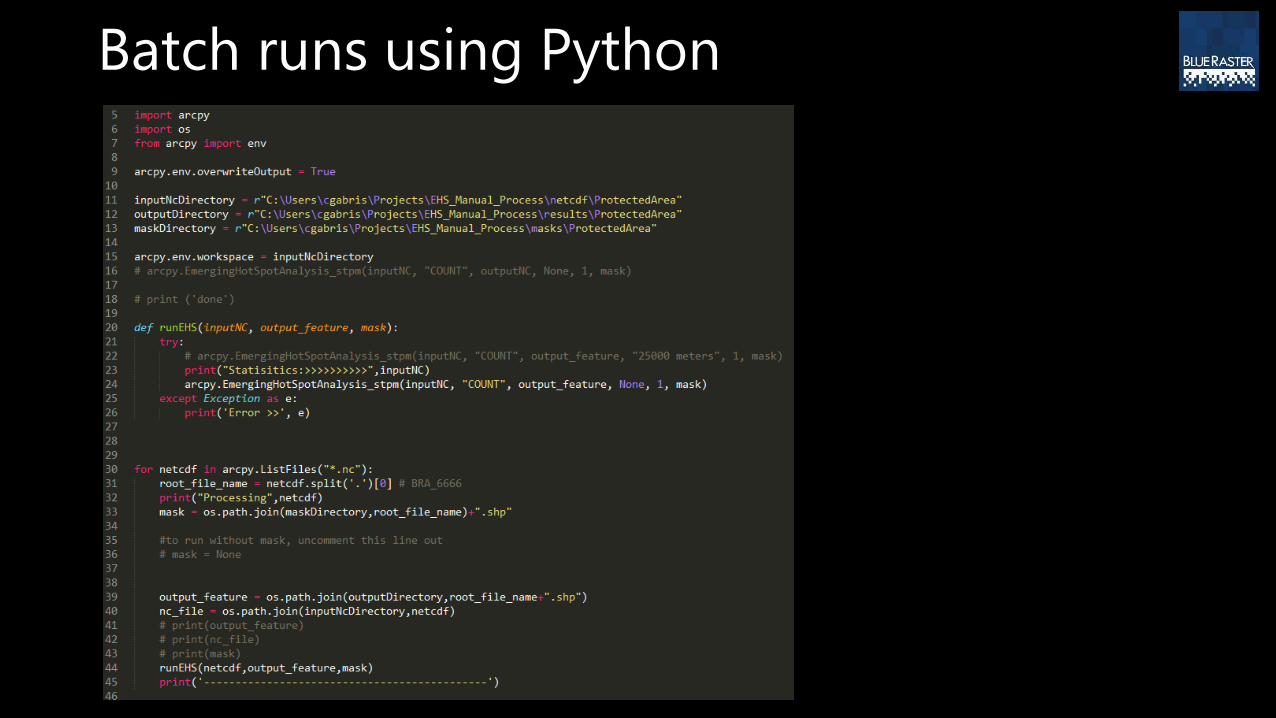
Batch runs using Python
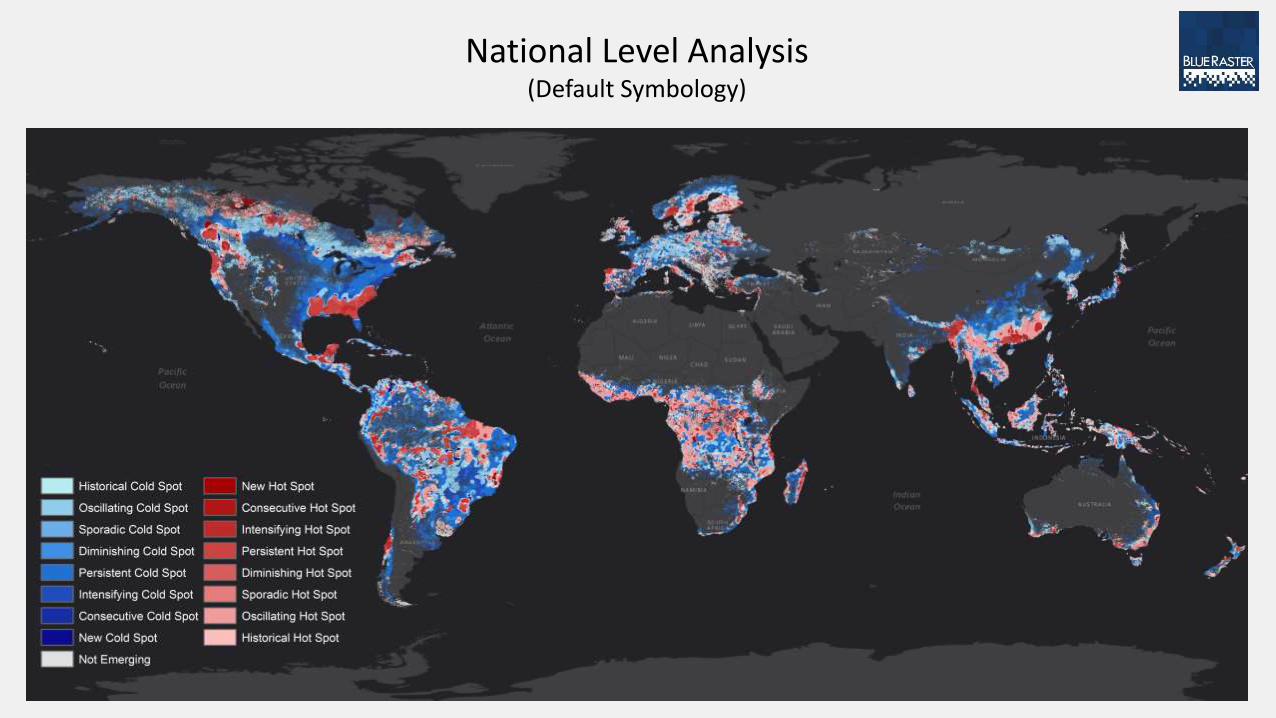
National Level Analysis (Default Symbology)
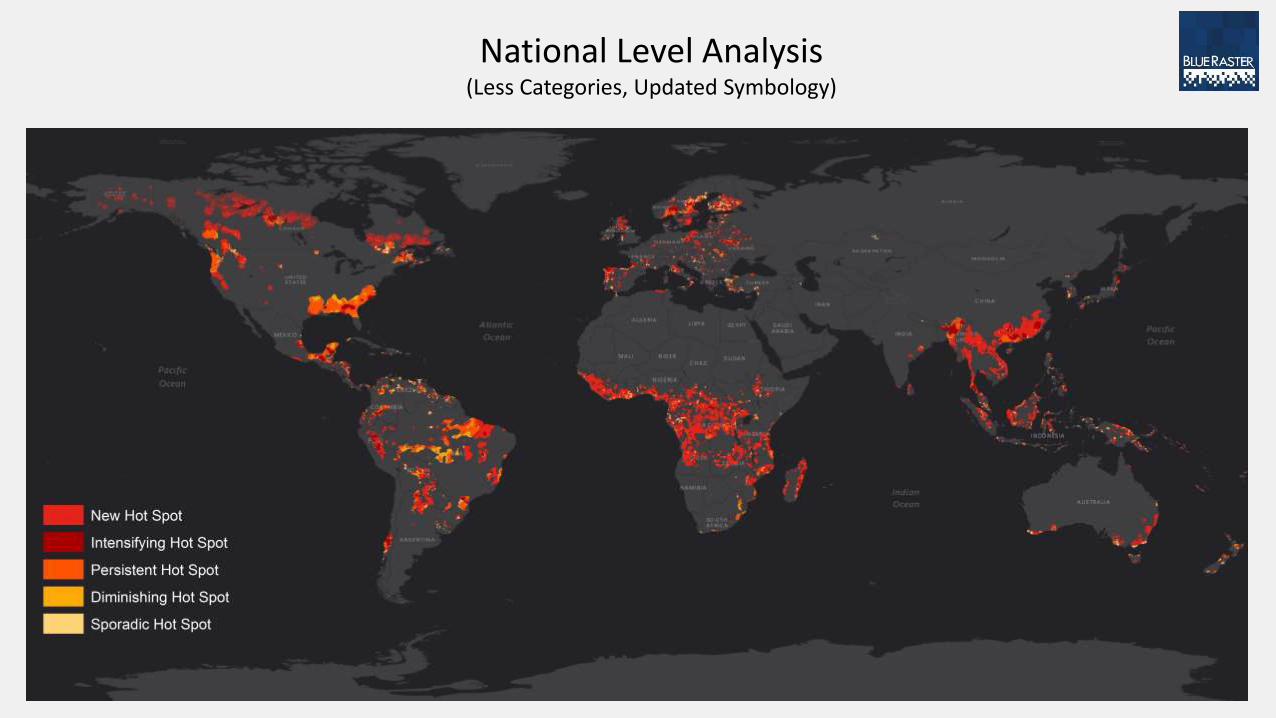
National Level Analysis (Less Categories, Updated Symbology)
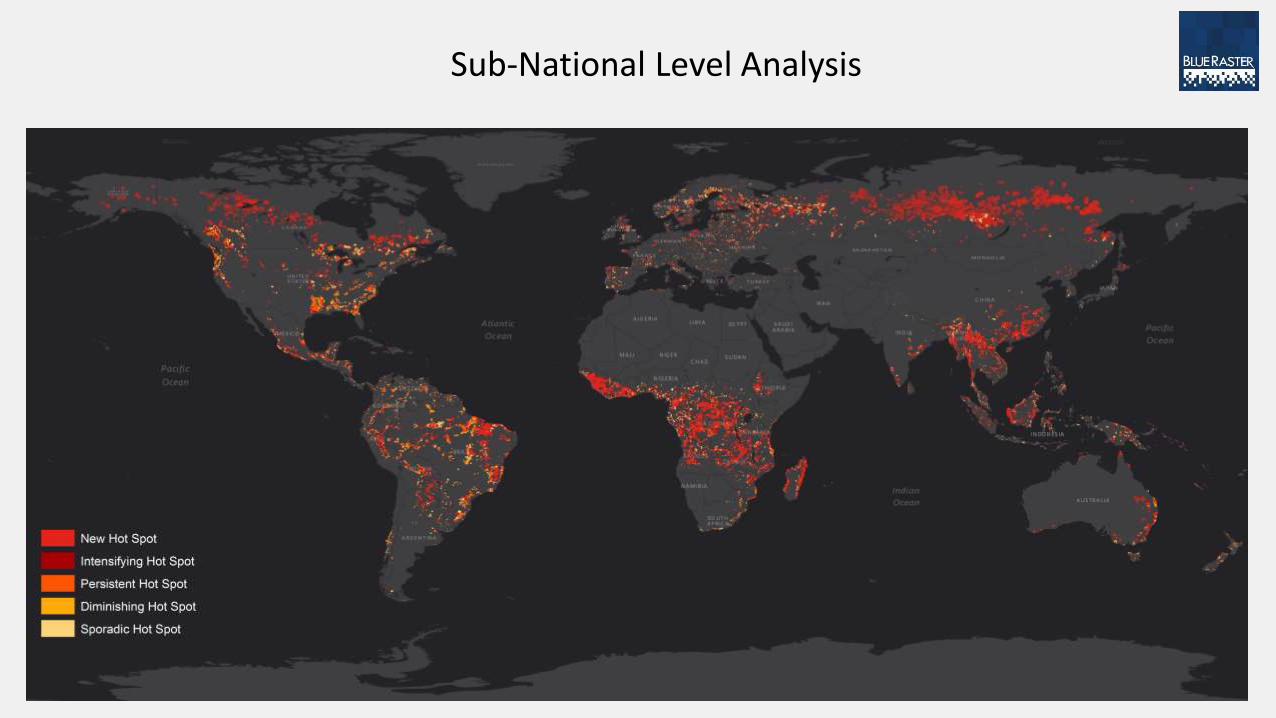
Sub-National Level Analysis
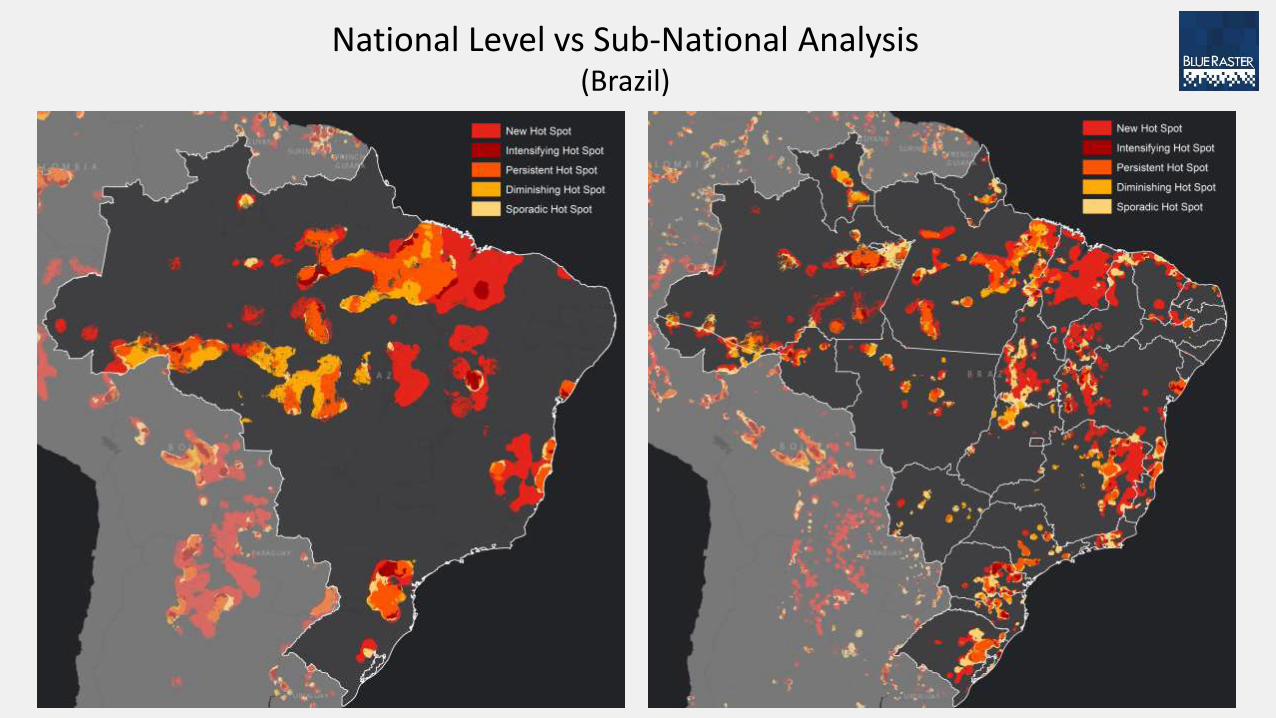
National Level vs Sub-National Analysis (Brazil)

Thank you!
Learn more at: www.blueraster.com


