environment.nsw.gov.au/business
Energy Efficiency and Renewables Finance Guide

© 2014 State of NSW and Office of Environment and Heritage
With the exception of photographs, the State of NSW and Office of Environment and Heritage are pleased to allow this material to be reproduced in whole or in part for educational and non-commercial use, provided the meaning is unchanged and its source, publisher and authorship are acknowledged. Specific permission is required for the reproduction of photographs
Advice to users of the guide: Disclaimer
This guide has been prepared based on information available at November 2014. The information contained in this guide is of general character only and while the Office of Environment and Heritage (“OEH”) and its consultants (Energetics and BDO) in the development of this guide have endeavoured to ensure that information contained in this guide is accurate and based on reliable sources, no warranty is made as to accuracy, reliability or completeness.
The case studies in Appendix A are accompanied online by cash flow models. These models are designed to help you to identify the best finance options for projects from a cash flow impact perspective. However, these cash flow models are not business case development tools and should not be relied on as such.
To the extent that this guide or the accompanying cash flow models contain prospective financial information, that information has been based on current expectations about future events as at the date above and is subject to risks, uncertainties and assumptions that could cause actual results to differ materially from the expectations described in such prospective financial information. Past financial performance is not indicative of future financial performance.
This guide and the accompanying cash flow models have been prepared without taking into account the objectives, financial situation or needs of you or your organisation. For this reason, OEH, Energetics and BDO in the development of this guide do not endorse or recommend any investment decisions based on information provided in this guide or as a result of using the cash flow models. You should independently verify and check the accuracy, completeness, reliability and suitability of the information contained within it and seek independent professional advice on how it will affect your specific situation.
This guide may be subject to revision without notice and you should ensure you are using the latest version. OEH, Energetics and BDO accept no responsibility for errors or omissions in the guide or accompanying cash flow models, or for any loss or damage arising from the use of the guide or cash flow tools. To the fullest extent permitted by law, OEH, Energetics and BDO expressly disclaim all warranties, whether express or implied. In no event will OEH, Energetics and BDO be liable for any indirect, special, incidental, tort, economic or consequential damage or damages for negligence for any loss of profit, whether arising out of the use or inability to use the guide and cash flow tools, any outcome produced by the guide or cash flow tools or any reliance thereon, or otherwise.
Published by:
Office of Environment and Heritage59 Goulburn Street, Sydney NSW 2000PO Box A290, Sydney South NSW 1232Phone: (02) 9995 5000 (switchboard)Phone: 131 555 (environment information and publications requests)Phone: 1300 361 967 (national parks, general environmental enquiries, and publications requests)Fax: (02) 9995 5999TTY users: phone 133 677, then ask for 131 555Speak and listen users: phone 1300 555 727, then ask for 131 555Email: [email protected]: www.environment.nsw.gov.au
Report pollution and environmental incidentsEnvironment Line: 131 555 (NSW only) or [email protected] also www.environment.nsw.gov.au
ISBN 978 1 74359 784 2OEH 2014/0746November 2014
Printed on environmentally sustainable paper
3
About this Guide 04
1.0 Energy efficiency and renewables finance options 05
1.1 The advantages and disadvantages of different finance options 051.2 Finance terms 091.3 Technologies, sectors and credit profiles most appropriate for 10
each financing option
2.0 Main providers of energy efficiency and renewables finance 12
3.0 Finance and the NSW Energy Savings Scheme 14
4.0 Guidance on selecting a finance option 14
4.1 Which finance options best suit my preferences? 154.2 How do I compare the financial outcomes of the different 17 financial options?
5.0 Steps to achieve a finance commitment 18
5.1 Loans, leases and Environmental Upgrade Agreements 185.2 On-bill financing 195.3 Energy Services Agreement 20
6.0 Information templates and checklists 21
6.1 Commercial loan or Environmental Upgrade Agreement 216.2 Energy Efficient loan 236.3 Operating lease or capital lease 256.4 On-bill financing 276.5 Energy Services Agreement 28
Appendix A Case studies 29
Appendix B Financial appraisal methods 54
Contents
4 Energy Saver Energy Efficiency and Renewables Finance Guide
Undertaking energy efficient upgrades or installing renewable energy makes good business sense and helps you offset rising electricity and gas prices. The way forward in terms of financing projects is not always clear or easy to understand.
The Energy Efficiency and Renewables Finance Guide (the ‘finance guide’) has been developed to help you understand the options available to finance your project. It provides practical information on the types of finance available, along with:
> A series of tools to assist you in selecting the most suitable type of finance including a decision tree, a decision matrix and cash flow models which can be found online.
> Information on the financiers offering support, and the suitability of each type of finance to different industry sectors, technologies and businesses.
> A list of the steps for securing each of the finance options.
> Checklists for eligibility and templates to streamline the application process.
> Case studies which illustrate the financial benefit of installing energy efficiency equipment over standard equipment under various finance options.
About this guide
5Back to Contents PageEnergy efficiency and renewables finance options
1.0 Energy efficiency and renewables finance options
The availability of finance for energy efficiency and renewable energy projects has increased in recent years. There are a range of finance options available and providers offering these for commercial businesses.
The following sections provide an overview of the current energy efficiency and renewables finance options available in Australia, including the advantages and disadvantages of each. The broad terms offered by financiers for each option are outlined, as well as the suitability of each option to different businesses and technology types.
1.1 The advantages and disadvantages of different finance options
The information provided on the tax and accounting implications of each finance option is based on general advice provided by OEH consultants. It does not reflect the specific circumstances of any business using this guide and should not be relied on by businesses seeking any of these finance options. Instead, you need to seek your own tax and accounting advice.
UP-FRONT COMMITMENT OF CAPITAL
Some businesses may seek options where the need for up-front investment in the form of internal financing is reduced.
OWNERSHIP OF THE ASSET AND BALANCE SHEET IMPACT
There are benefits to avoiding having new debt on the balance sheet as this can affect existing loan covenants and the ability to get further finance. However, some businesses may prefer to own assets, even if this impacts their balance sheets
SURETY / COLLATERAL Some finance options require that a business or its owners provide security or supporting collateral, which can be a barrier
REPAYMENT TERMS Businesses should be wary of repayment obligations which they might be unable to meet, especially when repayments can vary
TAX TREATMENT Depreciation, interest payments and repayments that are treated as operating costs are tax deductable
RISK TRANSFER The risk of the energy efficiency or renewables project not performing as expected or losing value to the financier can be transferred under some finance options.
When selecting a financial product, the following features should be taken into consideration.
6 Energy Saver Energy Efficiency and Renewables Finance Guide
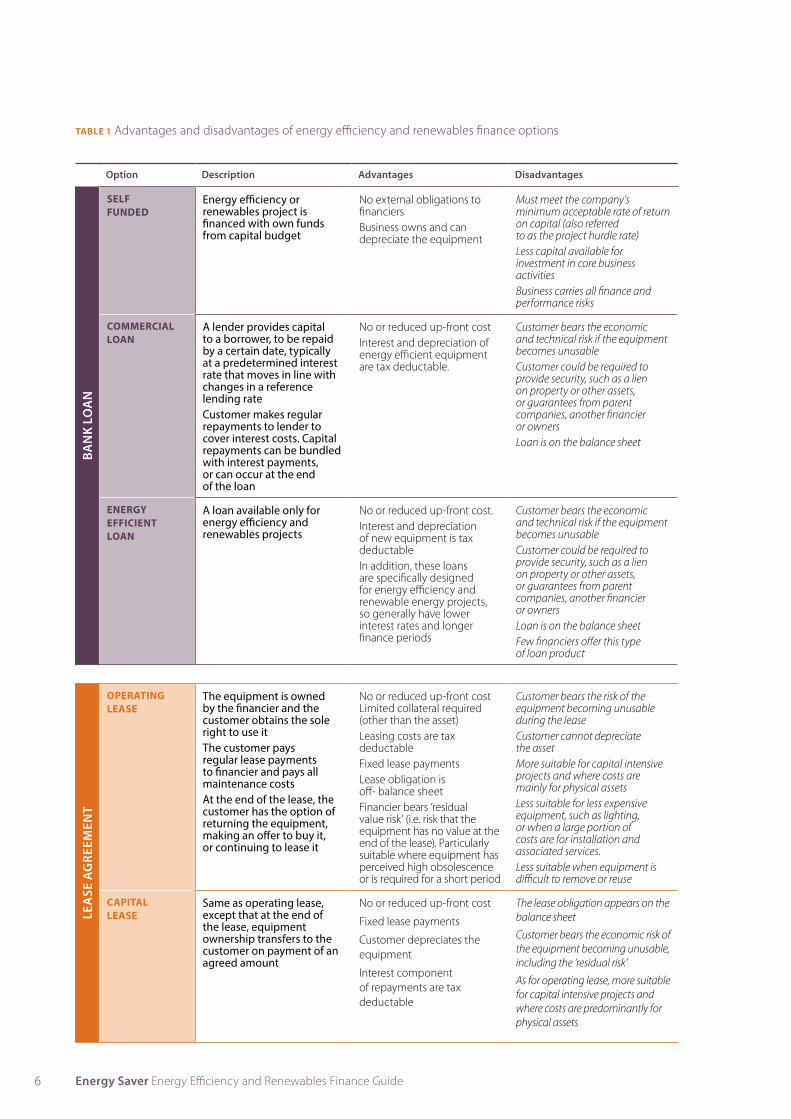
TABLE 1 Advantages and disadvantages of energy efficiency and renewables finance options
Option Description Advantages Disadvantages
SELF FUNDED
Energy efficiency or renewables project is financed with own funds from capital budget
No external obligations to financiersBusiness owns and can depreciate the equipment
Must meet the company’s minimum acceptable rate of return on capital (also referred to as the project hurdle rate)Less capital available for investment in core business activitiesBusiness carries all finance and performance risks
COMMERCIAL LOAN
A lender provides capital to a borrower, to be repaid by a certain date, typically at a predetermined interest rate that moves in line with changes in a reference lending rateCustomer makes regular repayments to lender to cover interest costs. Capital repayments can be bundled with interest payments, or can occur at the end of the loan
No or reduced up-front cost Interest and depreciation of energy efficient equipment are tax deductable.
Customer bears the economic and technical risk if the equipment becomes unusableCustomer could be required to provide security, such as a lien on property or other assets, or guarantees from parent companies, another financier or ownersLoan is on the balance sheet
ENERGY EFFICIENT LOAN
A loan available only for energy efficiency and renewables projects
No or reduced up-front cost. Interest and depreciation of new equipment is tax deductableIn addition, these loans are specifically designed for energy efficiency and renewable energy projects, so generally have lower interest rates and longer finance periods
Customer bears the economic and technical risk if the equipment becomes unusableCustomer could be required to provide security, such as a lien on property or other assets, or guarantees from parent companies, another financier or ownersLoan is on the balance sheetFew financiers offer this type of loan product
OPERATING LEASE
The equipment is owned by the financier and the customer obtains the sole right to use it The customer pays regular lease payments to financier and pays all maintenance costsAt the end of the lease, the customer has the option of returning the equipment, making an offer to buy it, or continuing to lease it
No or reduced up-front costLimited collateral required (other than the asset)Leasing costs are tax deductableFixed lease paymentsLease obligation is off- balance sheetFinancier bears ‘residual value risk’ (i.e. risk that the equipment has no value at the end of the lease). Particularly suitable where equipment has perceived high obsolescence or is required for a short period
Customer bears the risk of the equipment becoming unusable during the leaseCustomer cannot depreciate the assetMore suitable for capital intensive projects and where costs are mainly for physical assetsLess suitable for less expensive equipment, such as lighting, or when a large portion of costs are for installation and associated services. Less suitable when equipment is difficult to remove or reuse
CAPITAL LEASE
Same as operating lease, except that at the end of the lease, equipment ownership transfers to the customer on payment of an agreed amount
No or reduced up-front cost
Fixed lease payments
Customer depreciates the equipment
Interest component of repayments are tax deductable
The lease obligation appears on the balance sheet
Customer bears the economic risk of the equipment becoming unusable, including the ‘residual risk’
As for operating lease, more suitable for capital intensive projects and where costs are predominantly for physical assets
BA
NK
LO
AN
LEA
SE A
GR
EEM
ENT

7Back to Contents PageEnergy efficiency and renewables finance options
Option Description Advantages Disadvantages
ENVIRONMENTAL UPGRADE AGREEMENT (EUA)
A loan for the environmental upgrade of a building which is repaid through a local council environmental upgrade charge
No or reduced up-front cost
Loan tied to the property leads to lower risk for the financier, so better rates and extended terms are offered.
Lower risk for financier, so better rates and extended terms offered
Interest component of payments are tax deductible
Fixed EUA repayments
Provides a mechanism for transparent pass-through of repayments to tenants
At present only available for commercial and industrial buildings in limited council areas: City of Sydney, North Sydney, Parramatta, Newcastle, Lake Macquarie, and City of Melbourne
Perceived to be complex
Consequently, deals below $250,000 are not preferable for some financiers.
The loan can be considered on the balance sheet, subject to the specific circumstances of a business
UTILITY ON-BILL FINANCING
Energy retailer installs equipment. This is repaid through a ‘repayment’ charge on energy bills. Once all payments are made, title for the equipment transfers to the customer
No or reduced up-front cost
Interest component of repayments are tax deductible
Payment via utility bill reduces risk of default, therefore lowering financing costs
Typically have guaranteed savings
Typically arranged through a provider who can identify and implement energy saving opportunities
Generally ties customer to the energy retailer for the financing term, regardless of whether the retailer offers competitive energy rates
Risk of energy being cut if customer defaults on the debt repayment
If energy savings are not guaranteed, customer bears technical risks
Repayment liability is on the balance sheet
ENERGY SERVICES AGREEMENT (ESA)
An ESA provider designs, constructs, owns and operates equipmentCustomer pays fees to cover operation and maintenance costs, including energy costs, and to repay capital and implementation cost. The fees are indexed to CPI, labour rates, and to the price of energy. Customer can typically purchase equipment at end of ESAAn ESA provides the end-to-end delivery of energy efficiency and renewable energy projects. Finance can be arranged using any of the finance options above, or can be provided by the ESA provider
No or reduced up-front cost
An ESA is off balance sheet
Payments are tax deductible (operating expense)
Implementation and operating risks are transferred to the ESA provider
The ESA provider is incentivised to maximise energy savings; they guarantee savings or the customer only pays for the output of the equipment
Can be higher cost than using other finance options in isolation, due to transfer of risks to an ESA provider
ESA suppliers will generally not undertake projects that do not require significant on-going maintenance
The ESA market in Australia is at an early stage of maturity; it is a limited source of financing for non-governmental organisations
ESAs are typically only available for large projects
OTH
ERS
8 Energy Saver Energy Efficiency and Renewables Finance Guide
Another potential option for financing renewable energy, particularly solar PV, is Power Purchase Agreements (PPAs). This is not included as a finance option in this guide as the PPA market for small scale renewable energy installations is not well developed at present. In particular, there are many small operators with very divergent terms and risks. At the time of publication, three new funds offering solar PV leases and PPA were announced by the Clean Energy Finance Corporation. As an introduction, we provide a brief description of PPAs. Future versions of this finance guide will include more information on these funds as it becomes available.
A PPA provider designs, constructs, owns, operates and finances the energy generation equipment. The customer pays a cost per kWh price for all electricity generated; this price is escalated during the term of the PPA. To have a PPA, the generator needs to be connected to a revenue-grade meter which must be read monthly or quarterly to determine how much electricity the customer needs to be charged for. Due to the expense of installing and reading the meter, PPAs are generally not used for smaller systems, particularly those under 100kW; instead loans or leases may be used. However there are some small providers who may provide PPAs for systems as small as 20kW.
Choosing on-bill financing means the energy retailer installs equipment. This is repaid through a ‘repayment’ charge on energy bills. Once all payments are made, title for the equipment transfers to the customer
“
”

9Back to Contents PageEnergy efficiency and renewables finance options
1.2 Finance Terms
Indicative finance terms for external finance options are outlined in Table 2. The actual terms offered by a financier will depend on your circumstances, the nature of your project and the prevailing market conditions.
Finance terms largely depend on the risks borne by financiers. When these risks are perceived as high (in terms of higher default risk or lower value of collateral or other security) the finance terms become less attractive for financiers.
Below is a list of finance terms and how they are affected by their associated risks.
• Finance period: the period over which financiers are willing to provide finance. Longer finance periods increase risk for the financier; therefore this period is generally reduced as other risks increase. Alternatively, as the finance period increases, other terms generally become less favourable for the borrower.
• Finance amount: the amount of finance provided. The amount available to the customer will generally be dependent upon the customer’s ability to service the finance repayments and with the value of collateral and other security provided. There is generally a minimum amount, as the expected return for financiers must be sufficient to exceed the cost they incur when providing finance.
• Finance percentage: the percentage of the required capital expenditure for which finance is provided. This can be up to 100% for all finance options. However, in practice this varies, like finance rates, between projects and applicants for the same finance product. Financiers are generally willing to finance a larger portion of project cost as risk decreases.
• Inclusion of soft costs: the percentage of total finance that can be used for non-asset items, such as installation costs and professional service fees.
• Drawdowns: the customer receives finance in stages to align with project expenditure. This increases the risk for the financier as the full collateral is not available until project expenditure is complete. As risk increases the borrower’s ability to drawdown will decrease.
• Residual value/balloon payment: leases can be structured with a residual value, which is the assumed value of the asset at the end of the lease. This reduces the required repayments and, for capital leases, must be paid to the financier at the end of the lease for the customer to gain ownership of the asset. Loans can be structured with a balloon payment, which is a large portion of principal to be repaid at the end of the loan. This reduces the periodic payments during the term of the loan. In the case of leases, the size of residual value depends on the ability for the asset to be removed from the customer’s site and resold. In both cases, the allowable residual value or balloon payment decreases as overall risks increase.
• Finance cost: the required return financiers use to calculate finance repayments, such as the interest rate on a loan. Indicative rates are not provided, as they are highly dependent on the customer, project and prevailing market conditions; however the finance cost increases with increasing risk.

10 Energy Saver Energy Efficiency and Renewables Finance Guide
TABLE 2 Typical finance terms for external energy efficiency finance options
Option Finance period (years)
Finance amount Soft cost Drawdowns Residual value/Balloon payment
Indicative interest rate %
COMMERCIAL LOAN
Generally 1-51-15 for BankMECU
$10,000+ Beyond 10% depends on risk
Possible for larger projects
Balloon available
6.5
ENERGY EFFICIENT LOAN
3-7 $250,000+ if an existing CBA customer, otherwise $500,000+
Beyond 10% depends on risk
Possible over a 12 month period; during this time an interest only repayment is required
Balloon available
8.0
OPERATING LEASE
1-5 FlexiGroup, Alleasing: $2,000-10,000+Macquarie: $250,000+
20%+ Possible for larger projects
Depends on customer and asset risk
7.5
CAPITAL LEASE
1-15 $2,000+ 20%+ Possible for larger projects
Depends on customer and asset risk
6-7.5
ENVIRONMENTAL UPGRADE AGREEMENT
BankMECU: 1-20NAB: 3-10
BankMECU: $10,000+NAB: $250,000+
No limit Possible for larger projects
None 7
ON-BILL FINANCING
1-7 No specific limit. Projects to date have ranged from $10,000 to $1,000,000
No limit N/A None N/A
ENERGY SERVICES AGREEMENT
5-40 Up to $200,000,000
No limit N/A Depends on project, generally 0%
N/A
1.3 Technologies, sectors and credit profiles most appropriate for each financing option
Not all finance options are suitable to all situations. Your sector, the technology you seek to finance and your credit profile can all affect the suitability of a finance option.
• Sector: this will not generally have an impact on whether a finance option is appropriate. The exception is Environmental Upgrade Agreements, which are designed for upgrades to commercial and industrial buildings, although exceptions may apply. Rather than being an eligibility criterion, the sector, including its size and growth prospects, is considered in the risk assessment process.
11Back to Contents PageEnergy efficiency and renewables finance options
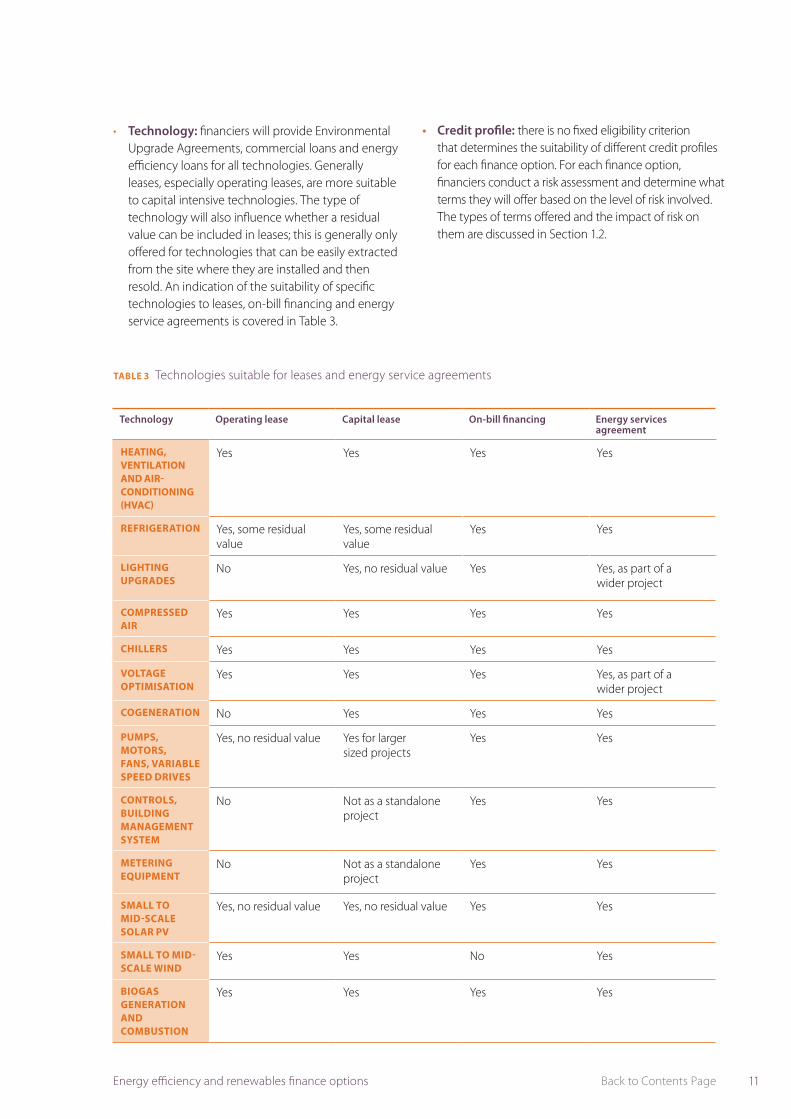
• Technology: financiers will provide Environmental Upgrade Agreements, commercial loans and energy efficiency loans for all technologies. Generally leases, especially operating leases, are more suitable to capital intensive technologies. The type of technology will also influence whether a residual value can be included in leases; this is generally only offered for technologies that can be easily extracted from the site where they are installed and then resold. An indication of the suitability of specific technologies to leases, on-bill financing and energy service agreements is covered in Table 3.
TABLE 3 Technologies suitable for leases and energy service agreements
Technology Operating lease Capital lease On-bill financing Energy services agreement
HEATING, VENTILATION AND AIR-CONDITIONING (HVAC)
Yes Yes Yes Yes
REFRIGERATION Yes, some residual value
Yes, some residual value
Yes Yes
LIGHTING UPGRADES
No Yes, no residual value Yes Yes, as part of a wider project
COMPRESSED AIR
Yes Yes Yes Yes
CHILLERS Yes Yes Yes Yes
VOLTAGE OPTIMISATION
Yes Yes Yes Yes, as part of a wider project
COGENERATION No Yes Yes Yes
PUMPS, MOTORS, FANS, VARIABLE SPEED DRIVES
Yes, no residual value Yes for larger sized projects
Yes Yes
CONTROLS, BUILDING MANAGEMENT SYSTEM
No Not as a standalone project
Yes Yes
METERING EQUIPMENT
No Not as a standalone project
Yes Yes
SMALL TO MID-SCALE SOLAR PV
Yes, no residual value Yes, no residual value Yes Yes
SMALL TO MID-SCALE WIND
Yes Yes No Yes
BIOGAS GENERATION AND COMBUSTION
Yes Yes Yes Yes
• Credit profile: there is no fixed eligibility criterion that determines the suitability of different credit profiles for each finance option. For each finance option, financiers conduct a risk assessment and determine what terms they will offer based on the level of risk involved. The types of terms offered and the impact of risk on them are discussed in Section 1.2.
12 Energy Saver Energy Efficiency and Renewables Finance Guide
2.0 Main providers of energy efficiency and renewables finance
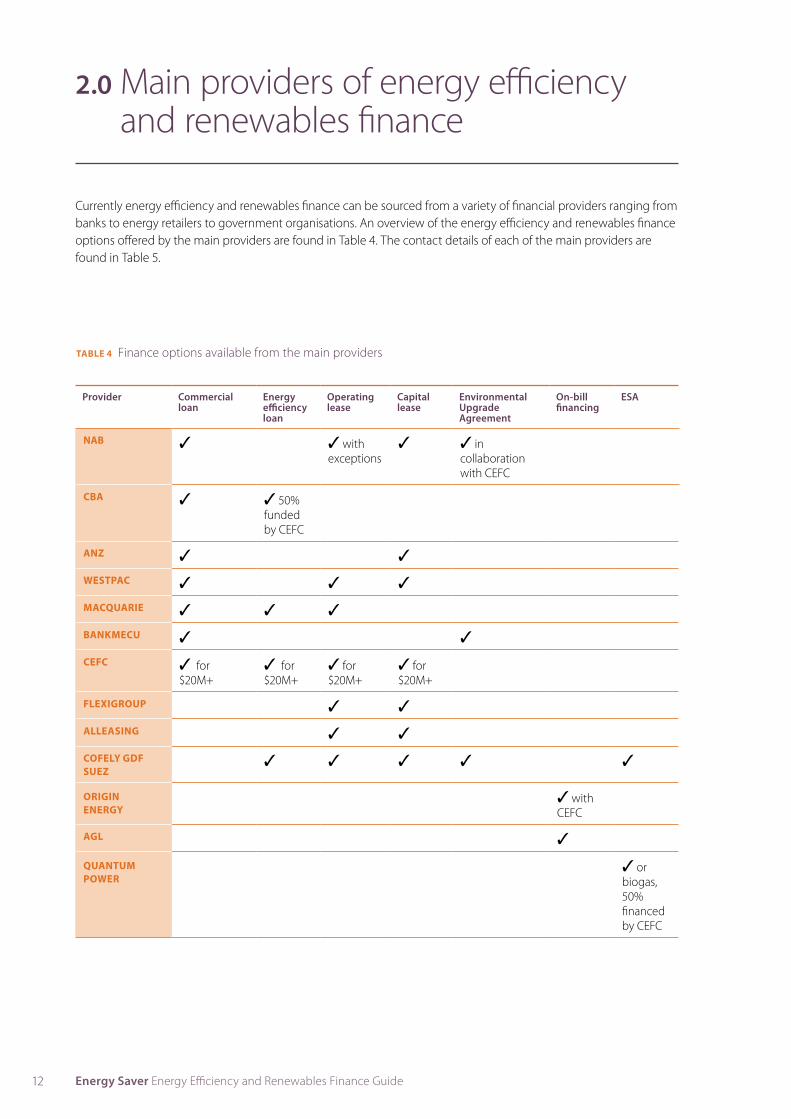
TABLE 4 Finance options available from the main providers
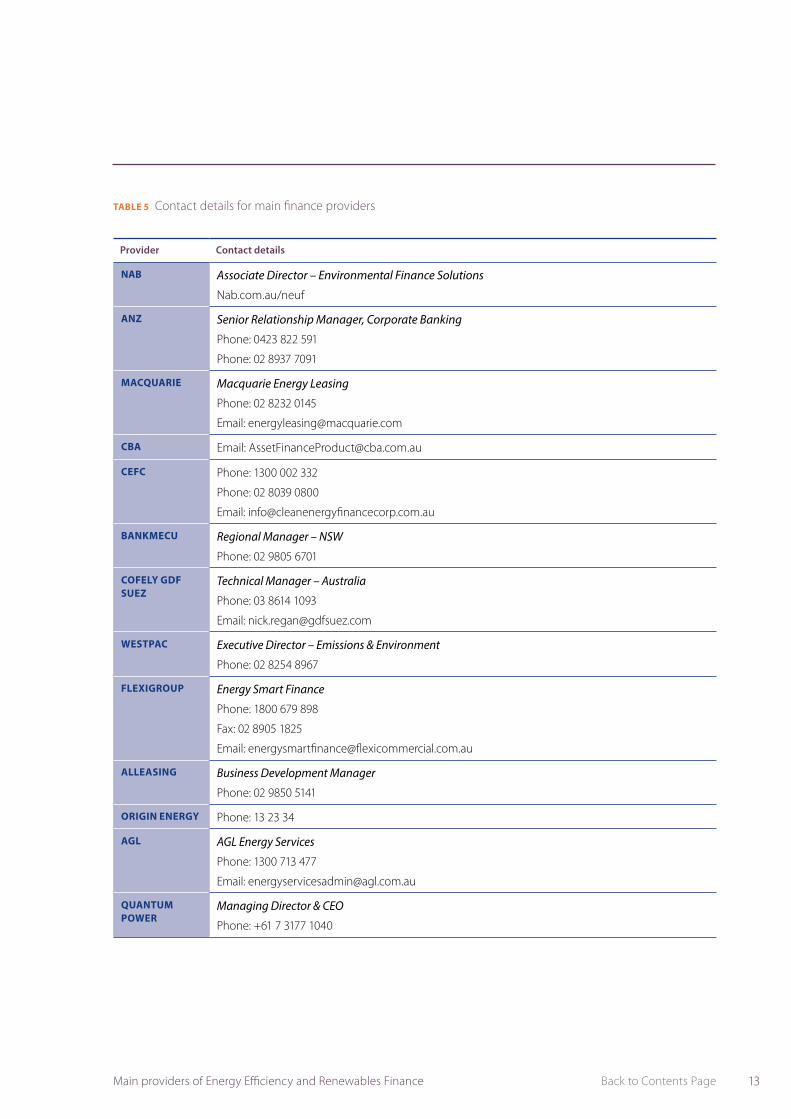
Currently energy efficiency and renewables finance can be sourced from a variety of financial providers ranging from banks to energy retailers to government organisations. An overview of the energy efficiency and renewables finance options offered by the main providers are found in Table 4. The contact details of each of the main providers are found in Table 5.
Provider Commercial loan
Energy efficiency loan
Operating lease
Capital lease
Environmental Upgrade Agreement
On-bill financing
ESA
NAB ✓ ✓ with exceptions
✓ ✓ in collaboration with CEFC
CBA ✓ ✓ 50% funded by CEFC
ANZ ✓ ✓
WESTPAC ✓ ✓ ✓
MACQUARIE ✓ ✓ ✓
BANKMECU ✓ ✓
CEFC ✓ for $20M+
✓ for $20M+
✓ for $20M+
✓ for $20M+
FLEXIGROUP ✓ ✓
ALLEASING ✓ ✓
COFELY GDF SUEZ
✓ ✓ ✓ ✓ ✓
ORIGIN ENERGY
✓ with CEFC
AGL ✓
QUANTUM POWER
✓ or biogas, 50% financed by CEFC
13Back to Contents PageMain providers of Energy Efficiency and Renewables Finance
TABLE 5 Contact details for main finance providers
Provider Contact details
NAB Associate Director – Environmental Finance Solutions
Nab.com.au/neuf
ANZ Senior Relationship Manager, Corporate Banking
Phone: 0423 822 591
Phone: 02 8937 7091
MACQUARIE Macquarie Energy Leasing
Phone: 02 8232 0145
Email: [email protected]
CBA Email: [email protected]
CEFC Phone: 1300 002 332
Phone: 02 8039 0800
Email: [email protected]
BANKMECU Regional Manager – NSW
Phone: 02 9805 6701
COFELY GDF SUEZ
Technical Manager – Australia
Phone: 03 8614 1093
Email: [email protected]
WESTPAC Executive Director – Emissions & Environment
Phone: 02 8254 8967
FLEXIGROUP Energy Smart Finance
Phone: 1800 679 898
Fax: 02 8905 1825
Email: [email protected]
ALLEASING Business Development Manager
Phone: 02 9850 5141
ORIGIN ENERGY Phone: 13 23 34
AGL AGL Energy Services
Phone: 1300 713 477
Email: [email protected]
QUANTUM POWER
Managing Director & CEO
Phone: +61 7 3177 1040
14 Energy Saver Energy Efficiency and Renewables Finance Guide
3.0 Finance and the NSW Energy Savings Scheme
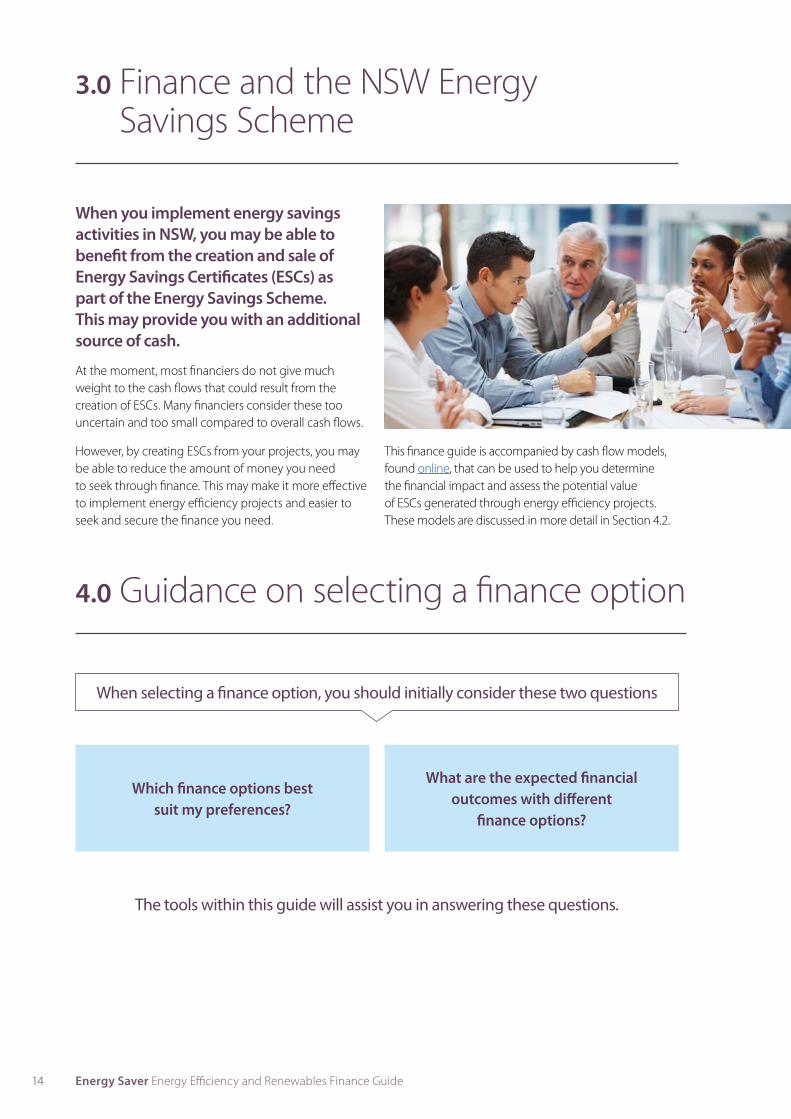
When you implement energy savings activities in NSW, you may be able to benefit from the creation and sale of Energy Savings Certificates (ESCs) as part of the Energy Savings Scheme. This may provide you with an additional source of cash.
At the moment, most financiers do not give much weight to the cash flows that could result from the creation of ESCs. Many financiers consider these too uncertain and too small compared to overall cash flows.
However, by creating ESCs from your projects, you may be able to reduce the amount of money you need to seek through finance. This may make it more effective to implement energy efficiency projects and easier to seek and secure the finance you need.
4.0 Guidance on selecting a finance option
When selecting a finance option, you should initially consider these two questions
The tools within this guide will assist you in answering these questions.
Which finance options best suit my preferences?
What are the expected financial outcomes with different
finance options?
This finance guide is accompanied by cash flow models, found online, that can be used to help you determine the financial impact and assess the potential value of ESCs generated through energy efficiency projects. These models are discussed in more detail in Section 4.2.

15Back to Contents PageGuidance on selecting a finance option
4.1 Which finance options best suit my preferences?You should seek finance options that meet your preferences and requirements for:
• the level and type of risk you are comfortable with,• balance sheet impact,• asset ownership and your ability to pay the up-front cost.
Discuss with your finance manager or chief financial officer what your finance limitations, motivations for seeking finance and finance preferences are. You can then use the following decision tree to determine which finance options best suit your business requirements.
FIGURE 1 Energy efficiency and renewable energy finance decision tree
What is the investment size
NO
Self funded
YES
> $10K> $2K
Capital lease
> $250K
Capital lease Commercial loan On-bill financing*
Energy Efficiency loan EUA**
Capital lease Commercial loan On-bill financing*
YESYES
Energy Services Agreement
NO
Balance Sheet Treatment
Do you wish to self manage the energy
project and its technical risks?
OFF
Can you pay the full installation cost?
ON
Operating Lease Energy Service
Agreement
* Energy retailers currently providing on-bill financing are AGL and Origin Energy
** EUAs may be provided at a lower investment amount, please see your financial provider to discuss your needs. EUAs are currently available in the following council areas: City of Sydney, North Sydney, Parramatta, Newcastle, Lake Macquarie and City of Melbourne.
16 Energy Saver Energy Efficiency and Renewables Finance Guide
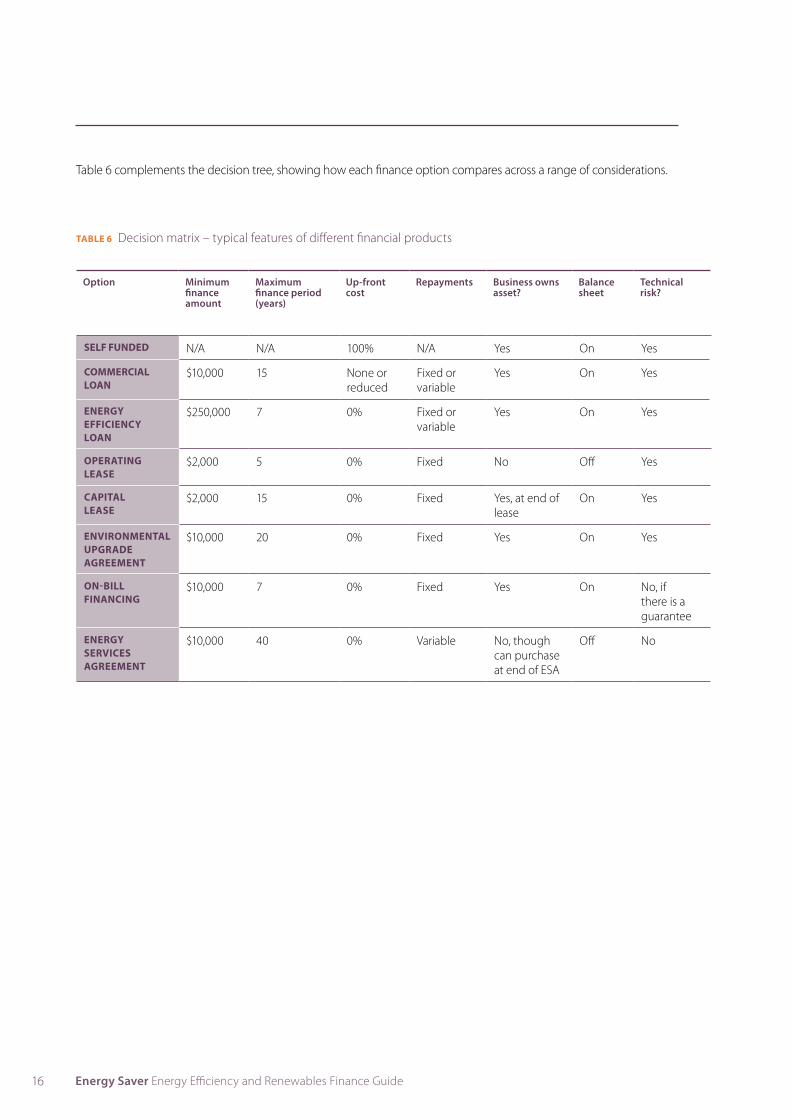
TABLE 6 Decision matrix – typical features of different financial products
Table 6 complements the decision tree, showing how each finance option compares across a range of considerations.
Option Minimum finance amount
Maximum finance period (years)
Up-front cost
Repayments Business owns asset?
Balance sheet
Technical risk?
SELF FUNDED N/A N/A 100% N/A Yes On Yes
COMMERCIAL LOAN
$10,000 15 None or reduced
Fixed or variable
Yes On Yes
ENERGY EFFICIENCY LOAN
$250,000 7 0% Fixed or variable
Yes On Yes
OPERATING LEASE
$2,000 5 0% Fixed No Off Yes
CAPITAL LEASE
$2,000 15 0% Fixed Yes, at end of lease
On Yes
ENVIRONMENTAL UPGRADE AGREEMENT
$10,000 20 0% Fixed Yes On Yes
ON-BILL FINANCING
$10,000 7 0% Fixed Yes On No, if there is a guarantee
ENERGY SERVICES AGREEMENT
$10,000 40 0% Variable No, though can purchase at end of ESA
Off No
17Back to Contents PageGuidance on selecting a finance option
4.2 How do I compare the financial outcomes of the different financial options?
The business case studies align with the information provided in each of the cash flows models found online, as excel spreadsheets. The cash flow models that illustrate possible financial outcomes from installing energy efficient equipment. The online models include two parts:
Part 1: How does energy efficient equipment compare to standard equipment?
• This part provides a comparison of the financial benefit of installing new energy efficient equipment versus installing equipment of standard efficiency. The type of equipment that a business could typically consider is defined and the cash flows are provided to compare the financial outcomes of energy efficient equipment against standard equipment. The value of any ESCs that could be created by installing the energy efficient equipment is also included.
• The cash flows are based on assumed costs and energy use for each equipment type, as well as assumed energy prices and discount rates expected for small to medium sized businesses.
• Cash flows and net present value (NPV) are calculated for standard equipment options to compare against the financial savings from choosing the energy efficient equipment option. This comparison is done with and without the creation of ESCs.
Note: for renewables technologies, this part of the tool compares the installation of the renewable energy system with business as usual.
Part 2: How do financing options compare?
• This models the cash flows that would result from installing the energy efficient equipment with financing sourced from each of the available financing options.
• The user of the model has the option of entering cost and savings estimates for a project they are considering and their own energy prices to determine which financing option would be most viable for their specific needs. Alternatively, if the user does not enter the cost and savings estimates, the costs and savings for the energy efficient equipment and the energy prices and discount rate considered in Part 1 are used to illustrate how the financing options compare.
• The cash flows and NPVs are calculated for each finance option that is suitable to the project under consideration. Cash flows and NPV are shown with and without the creation of ESCs. The finance options are ranked from highest NPV to lowest.
Cash flow models are available for a number of equipment types, including HVAC, refrigeration, lighting upgrades, compressed air, chillers, voltage optimisation, motors, motors with variable speed drives, building management systems, solar PV, wind turbines and biogas.
By inputting their own figures, businesses can use the cash flow models to determine which finance options appear most financially viable. They can then select the finance option that both aligns with their preferences and results in the best financial outcome as compared to other options.
Appendix B provides information on different financial appraisals you can use to assess projects, including simple payback, NPV and internal rate of return (IRR). IRR has not been considered in the case studies due to its disadvantages, as described in the appendix.

18 Energy Saver Energy Efficiency and Renewables Finance Guide
5.0 Steps to achieve a finance commitment
Once you have selected the preferred finance option, you need to apply for and secure this finance. The processes to achieve this for each finance option are outlined in this section.
5.1 Loans, leases and Environmental Upgrade Agreements
The overall processes for securing a commercial loan, energy efficiency loan or lease are very similar. The process for EUAs requires some extra steps.
Step 1 Scope the project• Conduct an energy audit to determine the works required and the costs involved. • Identify preferred suppliers.
Step 2 Ensure eligibility• Check you are eligible for your chosen finance option by completing the relevant eligibility
checklist in Section 6, page 21.
Step 3 (EUA) Obtain council approval for EUA• Complete and submit your local council’s EUA application form. If the application is approved,
the council will issue the EUA template.• Details of the councils where EUAs are available are listed in Table 7.
Step 4 Contact financier and apply for finance• If you are an existing customer of the financier, contact your relationship manager.
If not, use the information provided in Section 2, page 13.• Complete the information collection template for the type of finance you are applying for and send
this information to the financier. Information collection templates are contained in Section 6, page 21.
Step 5 Financier assessment of borrower and project• The financier conducts an initial assessment of you/your business and the project for which you are
seeking finance. The financier will contact you with requests for further information, if needed.
Step 6 Letter of offer• The financier either refuses to provide the finance, or provides a letter of offer containing
the offered terms and conditions of finance.• Once you are happy with the terms offered, you and the financier agree on the letter of offer.
Step 7 (EUA) Complete the EUA template• If you intend to pass on EUA costs to tenants, inform them of this and obtain their agreement.• The template is then agreed on by you, the financier and your local council.
Step 8 Financier completes their credit risk assessment and confirms final terms
Step 9 Finalise and sign agreements• Finalise the scope of work for the project and sign purchase/construction agreements,
as well as the letter of offer. In the case of an EUA, you also sign the EUA template.
19Back to Contents PageSteps to achieve a finance commitment
TABLE 7 EUA council contacts
Council Website Contact
SYDNEY www.cityofsydney.nsw.gov.au/business/business-support/greening-your-business/environmental-upgrade-finance
Environmental Upgrade Finance TeamPhone: 02 9246 7843Email: [email protected]
PARRAMATTA www.parracity.nsw.gov.au/eua Environmental Outcomes TeamPhone: 02 9806 5050Email: [email protected]
NORTH SYDNEY www.northsydney.nsw.gov.au/Business_Parking/Support_Programs/Environmental_Upgrade_Agreements
Phone: 9936 8100Email: [email protected]
LAKE MACQUARIE
www.lakemac.com.au/environment/sustainable-living/business/environmental-upgrade-agreements
Phone: 02 4921 0333Email: [email protected]
NEWCASTLE www.newcastle.nsw.gov.au/environment/environmental_upgrade_agreement
City of NewcastleEmail: [email protected]
5.2 On-bill financing
Check you are eligible for on-bill financing by completing the relevant eligibility checklist in Section 6.4, page 27.
On-bill financing is currently offered by Origin Energy and AGL in Australia.
For information on the process for accessing on-bill finance, contact either your client relationship manager at AGL or Origin Energy if you are a current customer of either, or use the contact details provided in Section 2, page 13. Origin Energy provide a factsheet with information on funding your project. Additionally the following websites provide further information:
• www.cleanenergyfinancecorp.com.au/media/40801/origin_factsheet.pdf
• www.originenergy.com.au/3149/ Funding-your-project
• www.agl.com.au

20 Energy Saver Energy Efficiency and Renewables Finance Guide
5.3 Energy Services Agreement
The following steps are required to secure an ESA.
Step 1 Ensure eligibility• Check you are eligible for an ESA by completing the relevant eligibility checklist in Section 6.5, page 28.
Step 2 Contact and meet ESA supplier• Arrange and attend an introduction meeting to discuss your site and your energy efficiency objectives.
Contact details for some ESA suppliers are in Section 2, page 13.
Step 3 Scope project• The ESA supplier conducts a site audit to determine your business as usual energy costs
and opportunities to lower these costs. The ESA determines an equipment solution at a lower cost per kWh than your business as usual costs.
Step 4 Non-binding offer• The ESA supplier provides a concept project report incorporating a non-binding offer.
Step 5 Memorandum of Understanding (MoU)• You and the ESA supplier sign a MoU prior to a detailed site assessment.
Step 6 Detailed assessment• The ESA supplier conducts a detailed site assessment to fully scope out the proposed works.
Step 7 Binding offer• The ESA supplier provides a project report including a binding offer.
Step 8 Sign ESA and commence works• You and the ESA supplier sign the ESA and energy efficiency works commence.
21Back to Contents Page Information templates and checklists
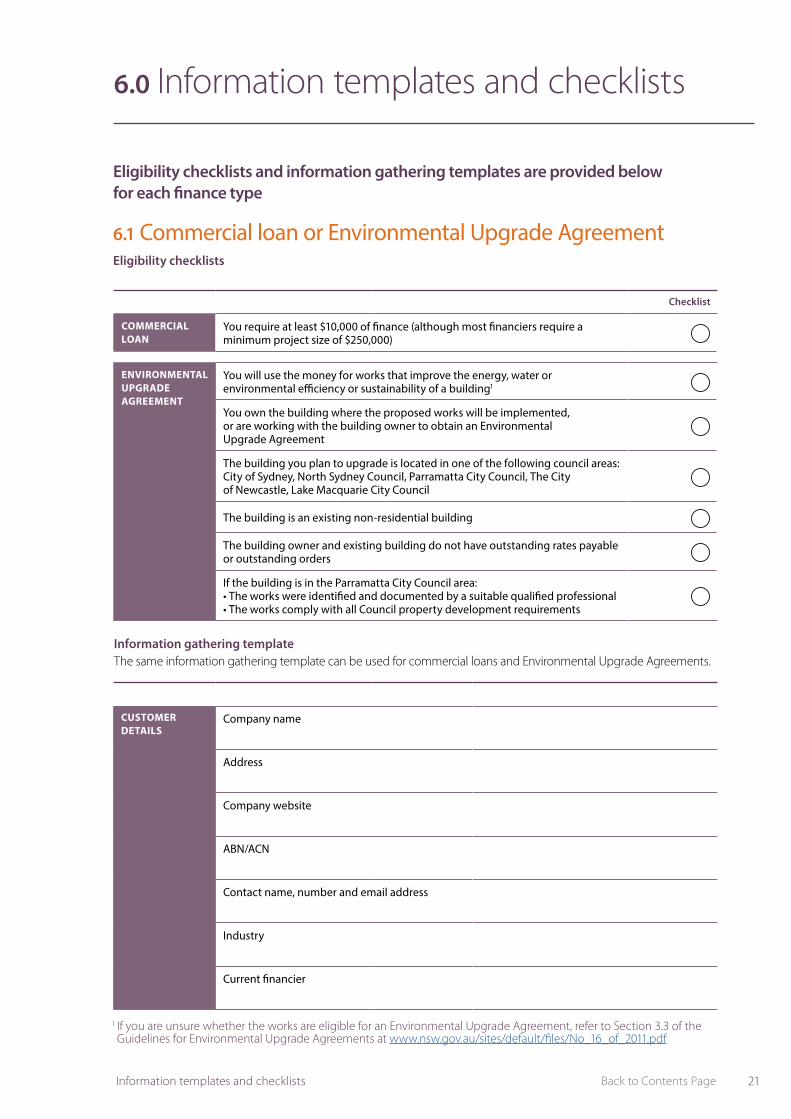
6.0 Information templates and checklists
Eligibility checklists and information gathering templates are provided below for each finance type
6.1 Commercial loan or Environmental Upgrade AgreementEligibility checklists
Checklist
COMMERCIAL LOAN
You require at least $10,000 of finance (although most financiers require a minimum project size of $250,000)
ENVIRONMENTAL UPGRADE AGREEMENT
You will use the money for works that improve the energy, water or environmental efficiency or sustainability of a building1
You own the building where the proposed works will be implemented, or are working with the building owner to obtain an Environmental Upgrade Agreement
The building you plan to upgrade is located in one of the following council areas: City of Sydney, North Sydney Council, Parramatta City Council, The City of Newcastle, Lake Macquarie City Council
The building is an existing non-residential building
The building owner and existing building do not have outstanding rates payable or outstanding orders
If the building is in the Parramatta City Council area:• The works were identified and documented by a suitable qualified professional• The works comply with all Council property development requirements
CUSTOMER DETAILS
Company name
Address
Company website
ABN/ACN
Contact name, number and email address
Industry
Current financier
Information gathering template The same information gathering template can be used for commercial loans and Environmental Upgrade Agreements.
1 If you are unsure whether the works are eligible for an Environmental Upgrade Agreement, refer to Section 3.3 of the Guidelines for Environmental Upgrade Agreements at www.nsw.gov.au/sites/default/files/No_16_of_2011.pdf
22 Energy Saver Energy Efficiency and Renewables Finance Guide
Checklist
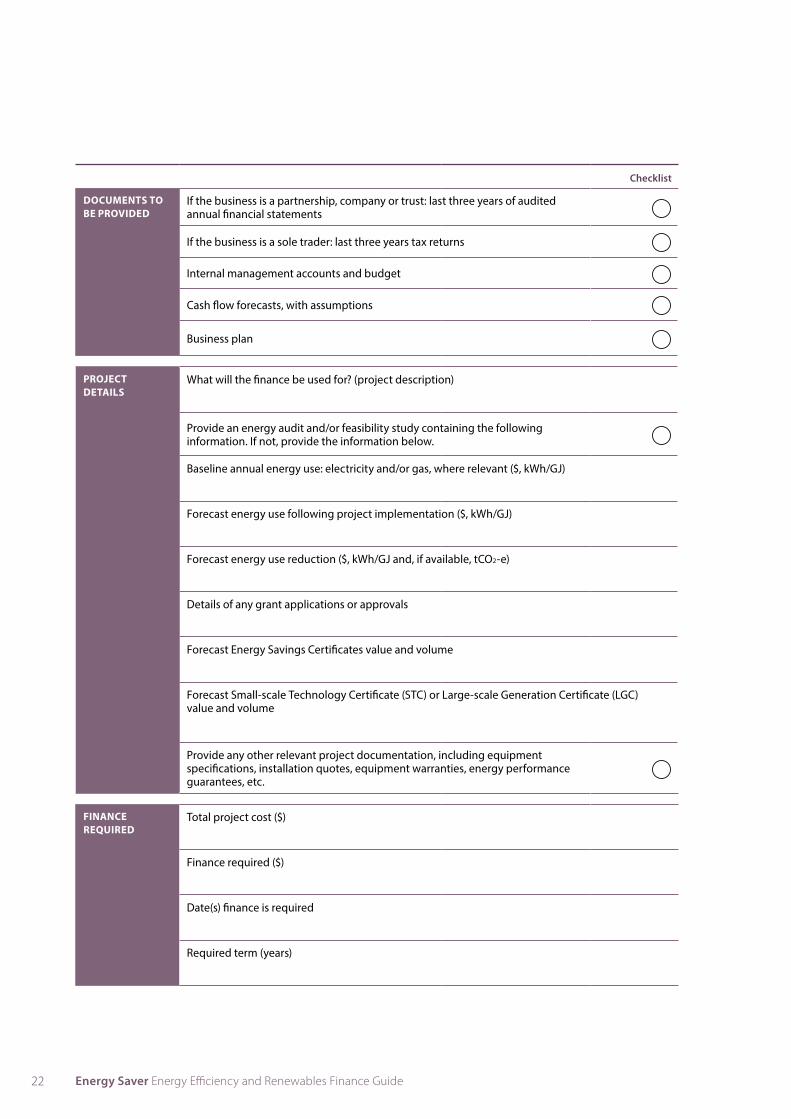
DOCUMENTS TO BE PROVIDED
If the business is a partnership, company or trust: last three years of audited annual financial statements
If the business is a sole trader: last three years tax returns
Internal management accounts and budget
Cash flow forecasts, with assumptions
Business plan
PROJECT DETAILS
What will the finance be used for? (project description)
Provide an energy audit and/or feasibility study containing the following information. If not, provide the information below.
Baseline annual energy use: electricity and/or gas, where relevant ($, kWh/GJ)
Forecast energy use following project implementation ($, kWh/GJ)
Forecast energy use reduction ($, kWh/GJ and, if available, tCO2-e)
Details of any grant applications or approvals
Forecast Energy Savings Certificates value and volume
Forecast Small-scale Technology Certificate (STC) or Large-scale Generation Certificate (LGC) value and volume
Provide any other relevant project documentation, including equipment specifications, installation quotes, equipment warranties, energy performance guarantees, etc.
FINANCE REQUIRED
Total project cost ($)
Finance required ($)
Date(s) finance is required
Required term (years)
23Back to Contents Page Information templates and checklists
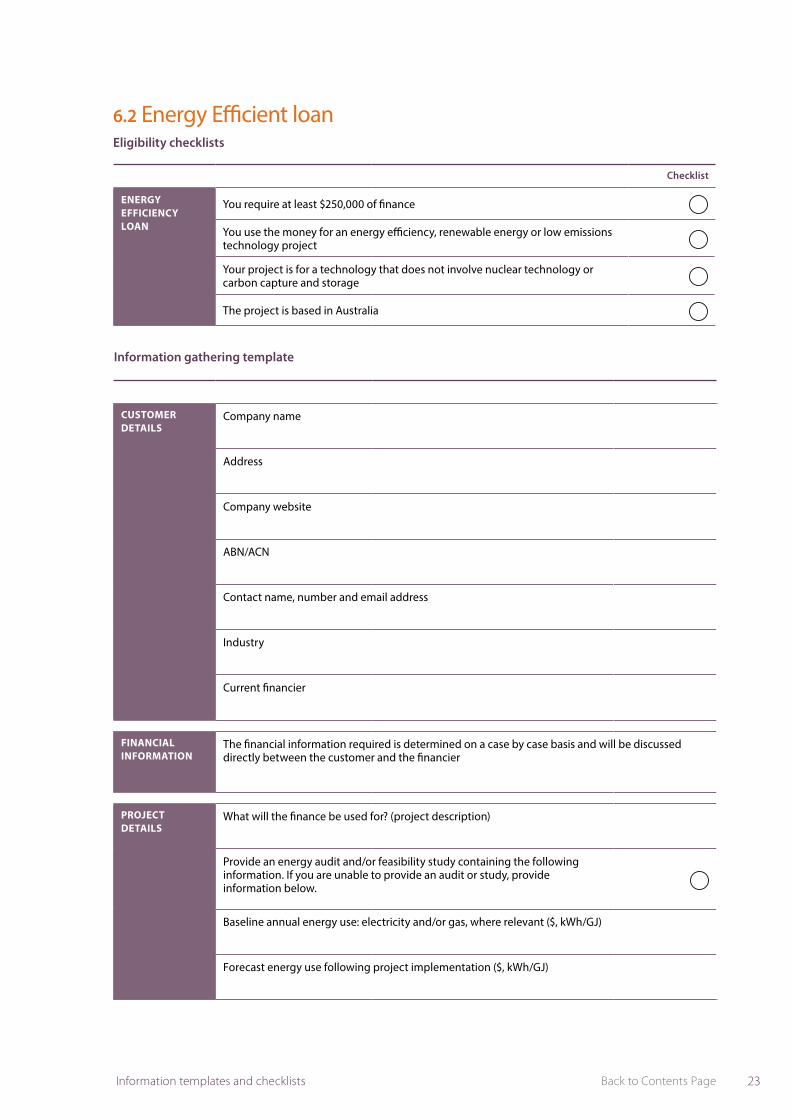
6.2 Energy Efficient loanEligibility checklists
CUSTOMER DETAILS
Company name
Address
Company website
ABN/ACN
Contact name, number and email address
Industry
Current financier
FINANCIAL INFORMATION
The financial information required is determined on a case by case basis and will be discussed directly between the customer and the financier
PROJECT DETAILS
What will the finance be used for? (project description)
Provide an energy audit and/or feasibility study containing the following information. If you are unable to provide an audit or study, provide information below.
Baseline annual energy use: electricity and/or gas, where relevant ($, kWh/GJ)
Forecast energy use following project implementation ($, kWh/GJ)
Information gathering template
Checklist
ENERGY EFFICIENCY LOAN
You require at least $250,000 of finance
You use the money for an energy efficiency, renewable energy or low emissions technology project
Your project is for a technology that does not involve nuclear technology or carbon capture and storage
The project is based in Australia

24 Energy Saver Energy Efficiency and Renewables Finance Guide
PROJECT DETAILS (Continued)
Forecast energy use reduction ($, kWh/GJ and, if available, tCO2-e)
Details of any grant applications or approvals
Forecast Energy Savings Certificates value and volume
Forecast Small-scale Technology Certificate (STC) or Large-scale Generation Certificate (LGC) value and volume
Provide any other relevant project documentation, including equipment specifications, installation quotes, equipment warranties, energy performance guarantees, etc.
FINANCE REQUIRED
Total project cost ($)
Finance required ($)
Date(s) finance is required
Required term (years)
Additional required information for solar PV installations If you are seeking an Energy Efficient loan for a solar PV installation, you will need to provide the following additional information:
SOLAR PV INSTALLATIONS
Product specification brochures for both solar panels and inverters
Product warranty and performance guarantee brochures for both solar panels and inverters
Confirmation of product and installer accreditations
How will the energy generated be used? i.e. will all the generated energy be used onsite to offset all or part of the baseline consumption? If only part of, then how much?
Do you intend to export excess power to the grid? If yes, what is the status of your connection and supply to grid application with the network provider, and what will the feed-in tariff price be?
Are you the solutions provider or the end customer?
Is a Power Purchase Agreement involved?

25Back to Contents Page Information templates and checklists
6.3 Operating lease or capital leaseEligibility checklists
Checklist
LEASES You require at least $2,000 of finance
If you are seeking an operating lease, you intend to install one of the following types of equipment: HVAC, refrigeration, compressed air, chillers, pumps, motors, fans.
If you are seeking a capital lease, you intend to install one of the following types of equipment: HVAC, refrigeration, lighting, compressed air, chillers, voltage optimisation, cogeneration, pumps, motors, fans.
CUSTOMER DETAILS
Company name
Address
Company website
ABN/ACN
Contact name, number and email address
Industry
Current financier
DOCUMENTS TO BE PROVIDED
If the business is a partnership, company or trust: last three years of audited annual financial statements
If the business is a sole trader: last three years tax returns
Internal management accounts and budget
Cash flow forecasts, with assumptions
Business plan
PROJECT DETAILS
Description of project
Asset description, including quantity, serial number(s) and price(s) (including GST)
Information gathering template
26 Energy Saver Energy Efficiency and Renewables Finance Guide
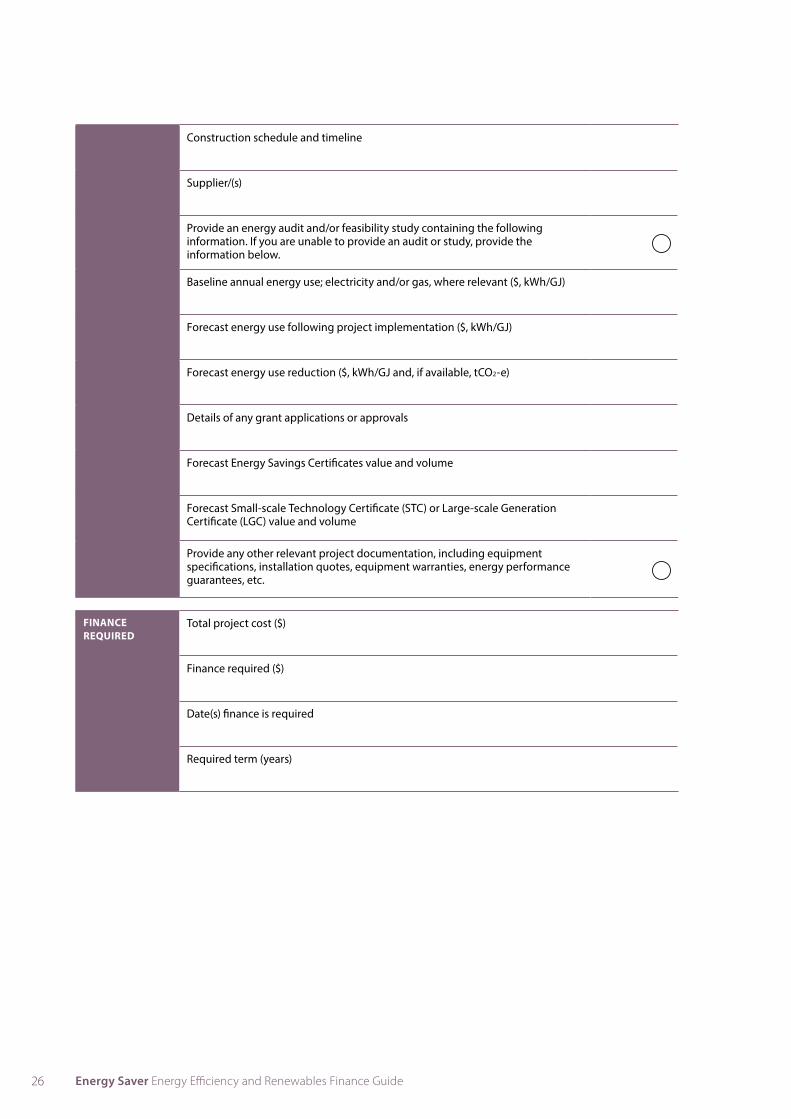
Construction schedule and timeline
Supplier/(s)
Provide an energy audit and/or feasibility study containing the following information. If you are unable to provide an audit or study, provide the information below.
Baseline annual energy use; electricity and/or gas, where relevant ($, kWh/GJ)
Forecast energy use following project implementation ($, kWh/GJ)
Forecast energy use reduction ($, kWh/GJ and, if available, tCO2-e)
Details of any grant applications or approvals
Forecast Energy Savings Certificates value and volume
Forecast Small-scale Technology Certificate (STC) or Large-scale Generation Certificate (LGC) value and volume
Provide any other relevant project documentation, including equipment specifications, installation quotes, equipment warranties, energy performance guarantees, etc.
FINANCE REQUIRED
Total project cost ($)
Finance required ($)
Date(s) finance is required
Required term (years)
27Back to Contents Page Information templates and checklists
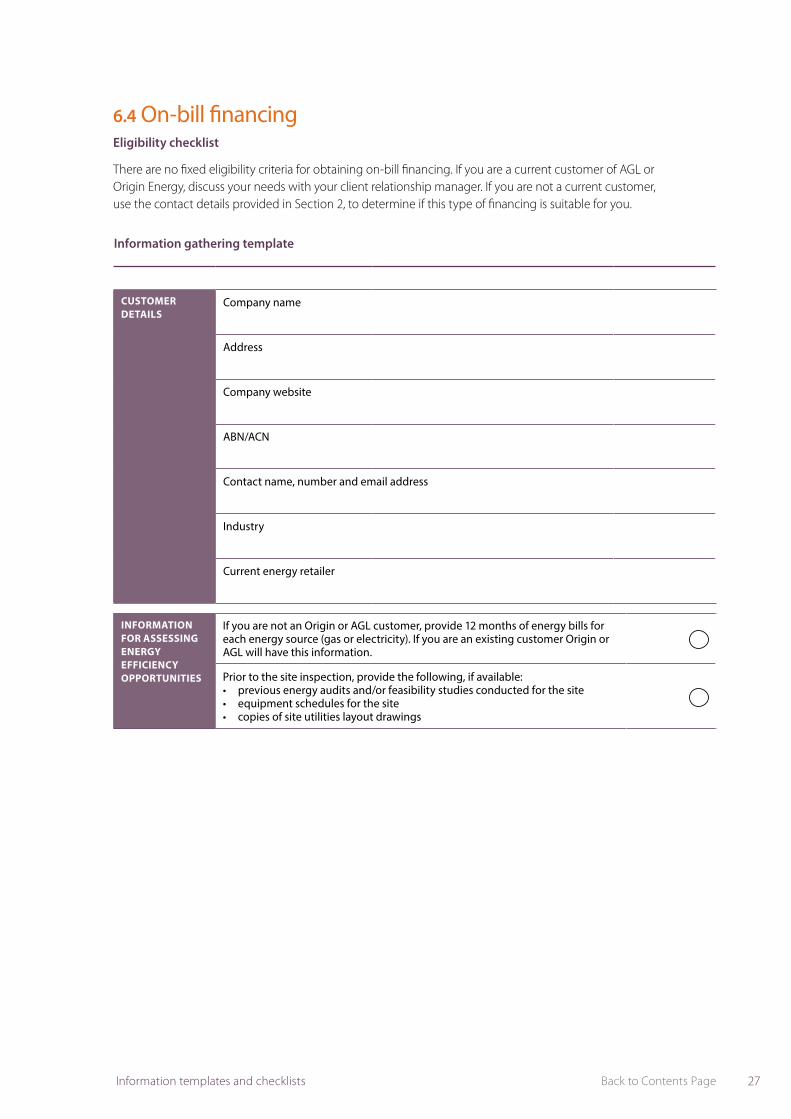
6.4 On-bill financingEligibility checklist
There are no fixed eligibility criteria for obtaining on-bill financing. If you are a current customer of AGL or Origin Energy, discuss your needs with your client relationship manager. If you are not a current customer, use the contact details provided in Section 2, to determine if this type of financing is suitable for you.
CUSTOMER DETAILS
Company name
Address
Company website
ABN/ACN
Contact name, number and email address
Industry
Current energy retailer
INFORMATION FOR ASSESSING ENERGY EFFICIENCY OPPORTUNITIES
If you are not an Origin or AGL customer, provide 12 months of energy bills for each energy source (gas or electricity). If you are an existing customer Origin or AGL will have this information.
Prior to the site inspection, provide the following, if available:• previous energy audits and/or feasibility studies conducted for the site• equipment schedules for the site• copies of site utilities layout drawings
Information gathering template
28 Energy Saver Energy Efficiency and Renewables Finance Guide
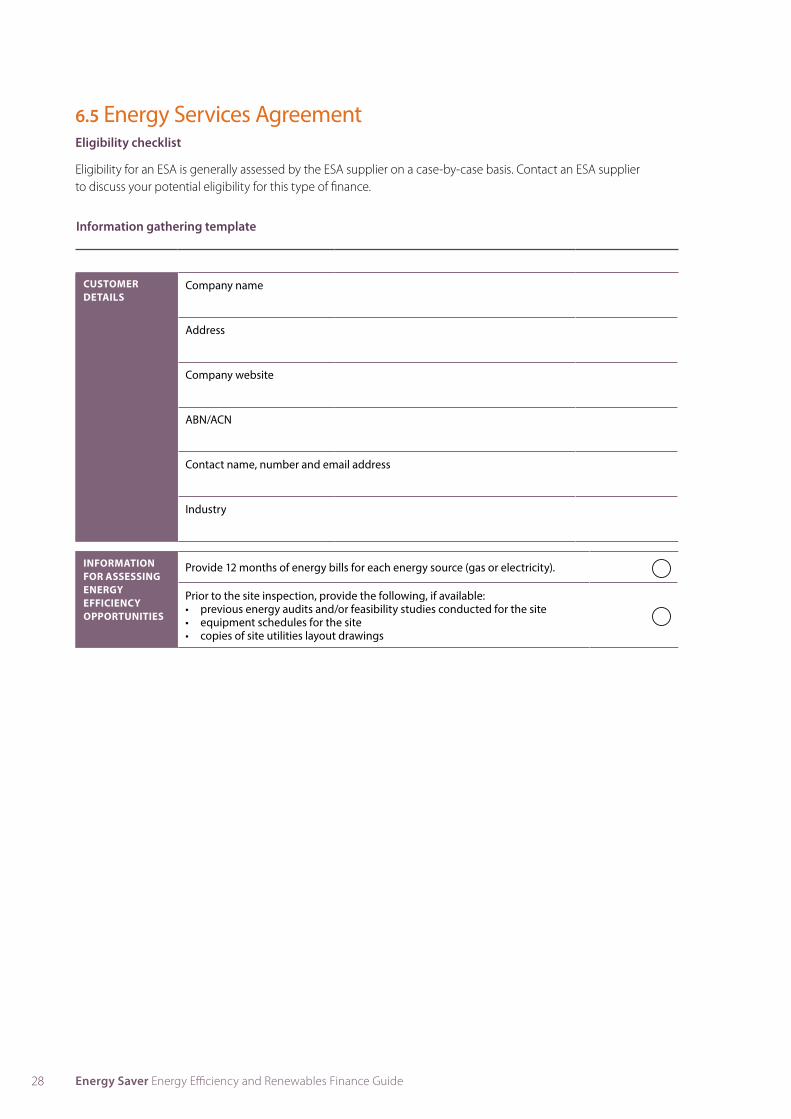
6.5 Energy Services AgreementEligibility checklist
Eligibility for an ESA is generally assessed by the ESA supplier on a case-by-case basis. Contact an ESA supplier to discuss your potential eligibility for this type of finance.
CUSTOMER DETAILS
Company name
Address
Company website
ABN/ACN
Contact name, number and email address
Industry
INFORMATION FOR ASSESSING ENERGY EFFICIENCY OPPORTUNITIES
Provide 12 months of energy bills for each energy source (gas or electricity).
Prior to the site inspection, provide the following, if available:• previous energy audits and/or feasibility studies conducted for the site• equipment schedules for the site• copies of site utilities layout drawings
Information gathering template
29Back to Contents PageCase studies
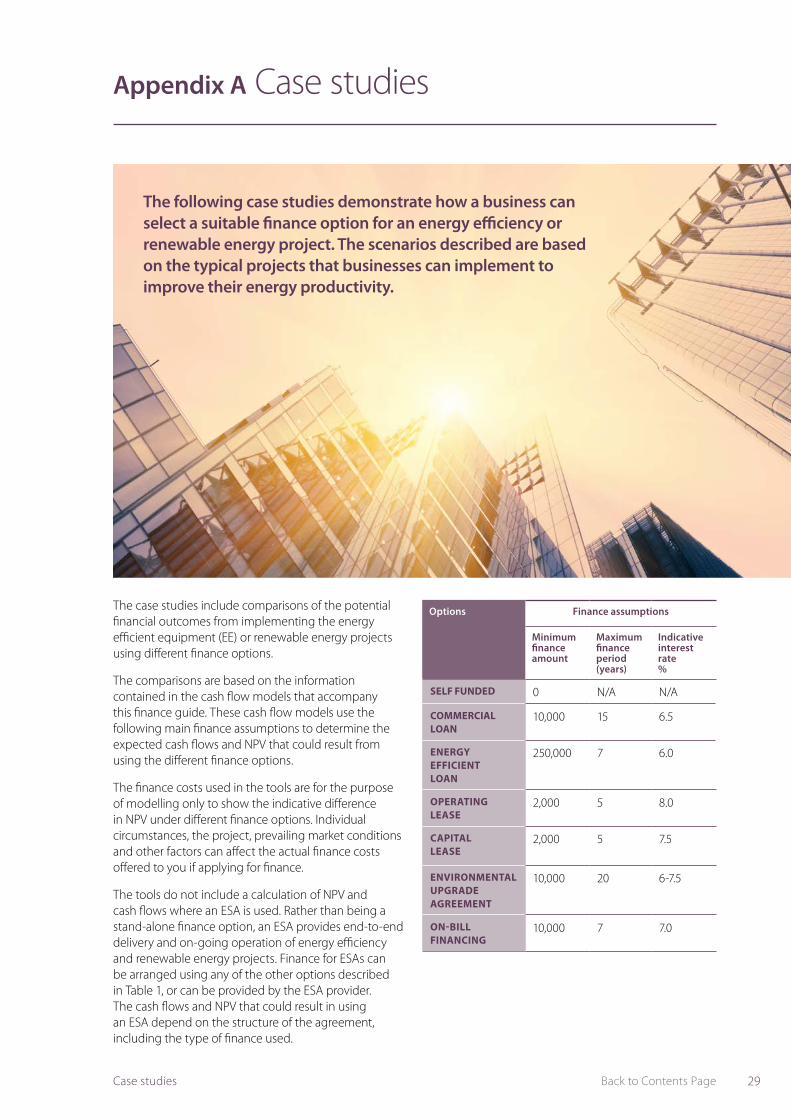
Appendix A Case studies
The case studies include comparisons of the potential financial outcomes from implementing the energy efficient equipment (EE) or renewable energy projects using different finance options.
The comparisons are based on the information contained in the cash flow models that accompany this finance guide. These cash flow models use the following main finance assumptions to determine the expected cash flows and NPV that could result from using the different finance options.
The finance costs used in the tools are for the purpose of modelling only to show the indicative difference in NPV under different finance options. Individual circumstances, the project, prevailing market conditions and other factors can affect the actual finance costs offered to you if applying for finance.
The tools do not include a calculation of NPV and cash flows where an ESA is used. Rather than being a stand-alone finance option, an ESA provides end-to-end delivery and on-going operation of energy efficiency and renewable energy projects. Finance for ESAs can be arranged using any of the other options described in Table 1, or can be provided by the ESA provider. The cash flows and NPV that could result in using an ESA depend on the structure of the agreement, including the type of finance used.
The following case studies demonstrate how a business can select a suitable finance option for an energy efficiency or renewable energy project. The scenarios described are based on the typical projects that businesses can implement to improve their energy productivity.
Options Finance assumptions
Minimum finance amount
Maximum finance period (years)
Indicative interest rate %
SELF FUNDED 0 N/A N/A
COMMERCIAL LOAN
10,000 15 6.5
ENERGY EFFICIENT LOAN
250,000 7 6.0
OPERATING LEASE
2,000 5 8.0
CAPITAL LEASE
2,000 5 7.5
ENVIRONMENTAL UPGRADE AGREEMENT
10,000 20 6-7.5
ON-BILL FINANCING
10,000 7 7.0
30 Energy Saver Energy Efficiency and Renewables Finance Guide
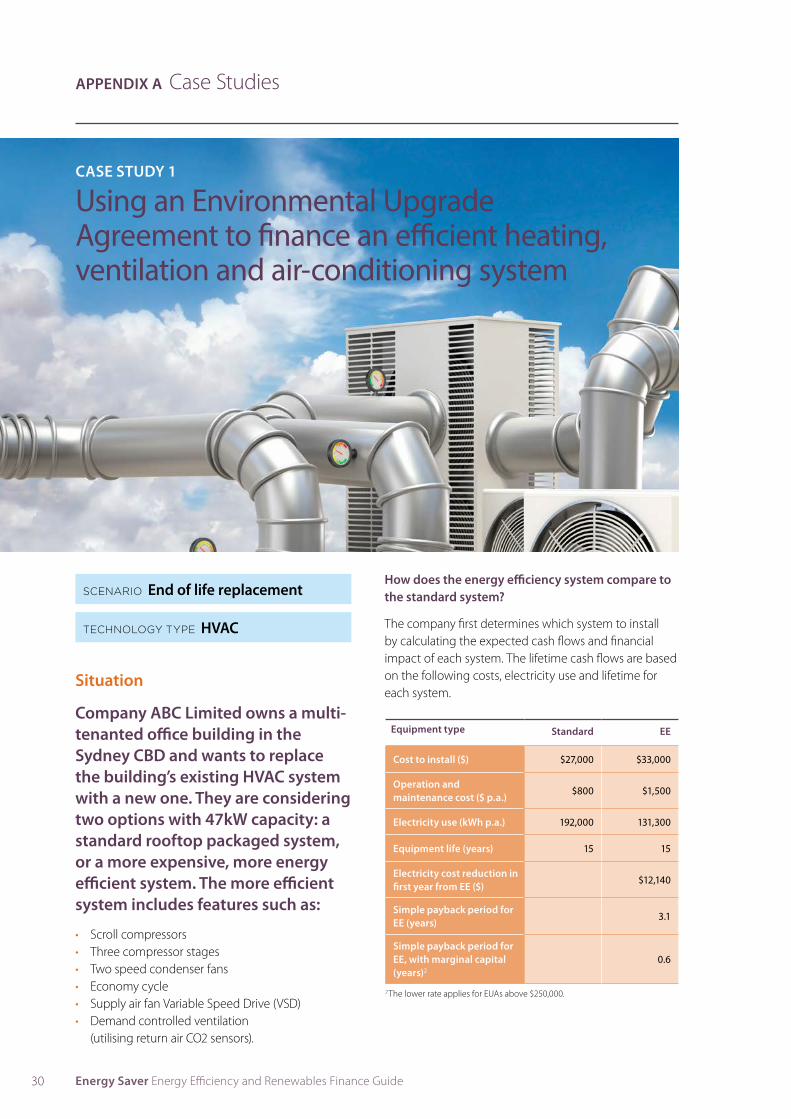
CASE STUDY 1
Using an Environmental Upgrade Agreement to finance an efficient heating, ventilation and air-conditioning system
SCENARIO End of life replacement
TECHNOLOGY TYPE HVAC
Situation
Company ABC Limited owns a multi-tenanted office building in the Sydney CBD and wants to replace the building’s existing HVAC system with a new one. They are considering two options with 47kW capacity: a standard rooftop packaged system, or a more expensive, more energy efficient system. The more efficient system includes features such as:
• Scroll compressors• Three compressor stages• Two speed condenser fans• Economy cycle• Supply air fan Variable Speed Drive (VSD)• Demand controlled ventilation
(utilising return air CO2 sensors).
How does the energy efficiency system compare to the standard system?
The company first determines which system to install by calculating the expected cash flows and financial impact of each system. The lifetime cash flows are based on the following costs, electricity use and lifetime for each system.
Equipment type Standard EE
Cost to install ($) $27,000 $33,000
Operation and maintenance cost ($ p.a.)
$800 $1,500
Electricity use (kWh p.a.) 192,000 131,300
Equipment life (years) 15 15
Electricity cost reduction in first year from EE ($)
$12,140
Simple payback period for EE (years)
3.1
Simple payback period for EE, with marginal capital (years)2
0.6
APPENDIX A Case Studies
2 The lower rate applies for EUAs above $250,000.
31Back to Contents PageCase studies
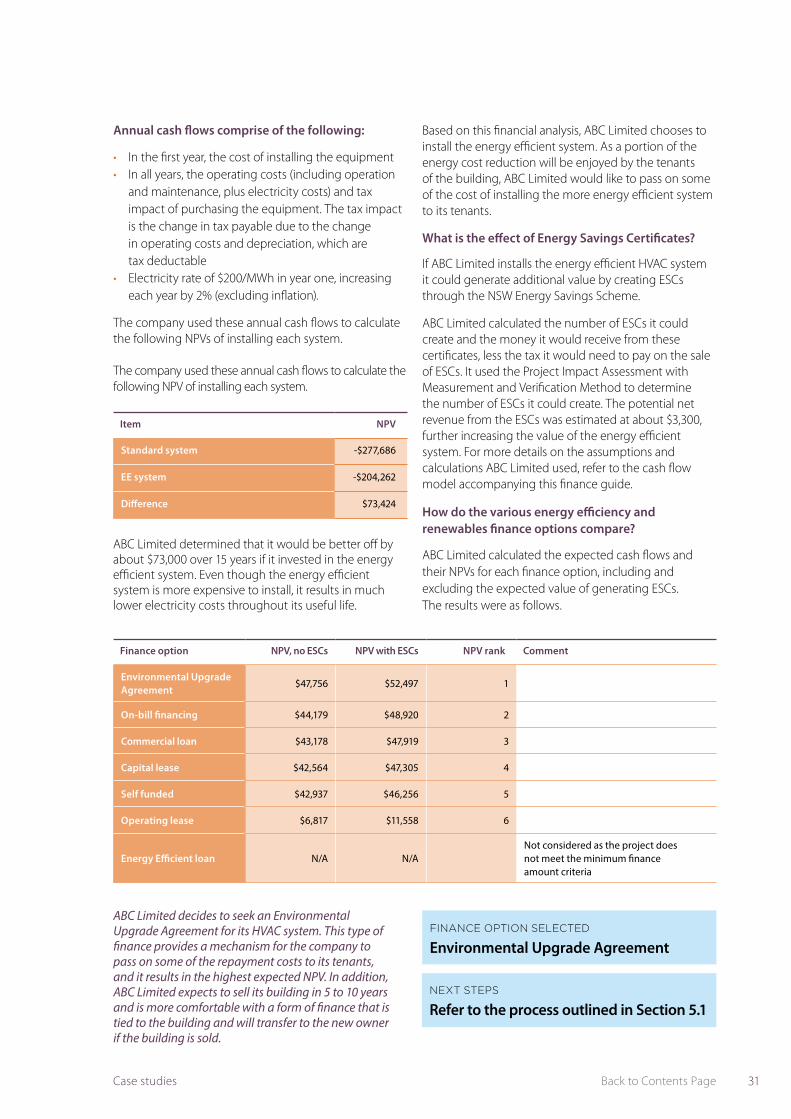
Finance option NPV, no ESCs NPV with ESCs NPV rank Comment
Environmental Upgrade Agreement
$47,756 $52,497 1
On-bill financing $44,179 $48,920 2
Commercial loan $43,178 $47,919 3
Capital lease $42,564 $47,305 4
Self funded $42,937 $46,256 5
Operating lease $6,817 $11,558 6
Energy Efficient loan N/A N/ANot considered as the project does not meet the minimum finance amount criteria
FINANCE OPTION SELECTED
Environmental Upgrade Agreement
NEXT STEPS
Refer to the process outlined in Section 5.1
ABC Limited decides to seek an Environmental Upgrade Agreement for its HVAC system. This type of finance provides a mechanism for the company to pass on some of the repayment costs to its tenants, and it results in the highest expected NPV. In addition, ABC Limited expects to sell its building in 5 to 10 years and is more comfortable with a form of finance that is tied to the building and will transfer to the new owner if the building is sold.
Annual cash flows comprise of the following:
• In the first year, the cost of installing the equipment• In all years, the operating costs (including operation
and maintenance, plus electricity costs) and tax impact of purchasing the equipment. The tax impact is the change in tax payable due to the change in operating costs and depreciation, which are tax deductable
• Electricity rate of $200/MWh in year one, increasing each year by 2% (excluding inflation).
The company used these annual cash flows to calculate the following NPVs of installing each system.
The company used these annual cash flows to calculate the following NPV of installing each system.
ABC Limited determined that it would be better off by about $73,000 over 15 years if it invested in the energy efficient system. Even though the energy efficient system is more expensive to install, it results in much lower electricity costs throughout its useful life.
Item NPV
Standard system -$277,686
EE system -$204,262
Difference $73,424
Based on this financial analysis, ABC Limited chooses to install the energy efficient system. As a portion of the energy cost reduction will be enjoyed by the tenants of the building, ABC Limited would like to pass on some of the cost of installing the more energy efficient system to its tenants.
What is the effect of Energy Savings Certificates?
If ABC Limited installs the energy efficient HVAC system it could generate additional value by creating ESCs through the NSW Energy Savings Scheme.
ABC Limited calculated the number of ESCs it could create and the money it would receive from these certificates, less the tax it would need to pay on the sale of ESCs. It used the Project Impact Assessment with Measurement and Verification Method to determine the number of ESCs it could create. The potential net revenue from the ESCs was estimated at about $3,300, further increasing the value of the energy efficient system. For more details on the assumptions and calculations ABC Limited used, refer to the cash flow model accompanying this finance guide.
How do the various energy efficiency and renewables finance options compare?
ABC Limited calculated the expected cash flows and their NPVs for each finance option, including and excluding the expected value of generating ESCs. The results were as follows.
32 Energy Saver Energy Efficiency and Renewables Finance Guide
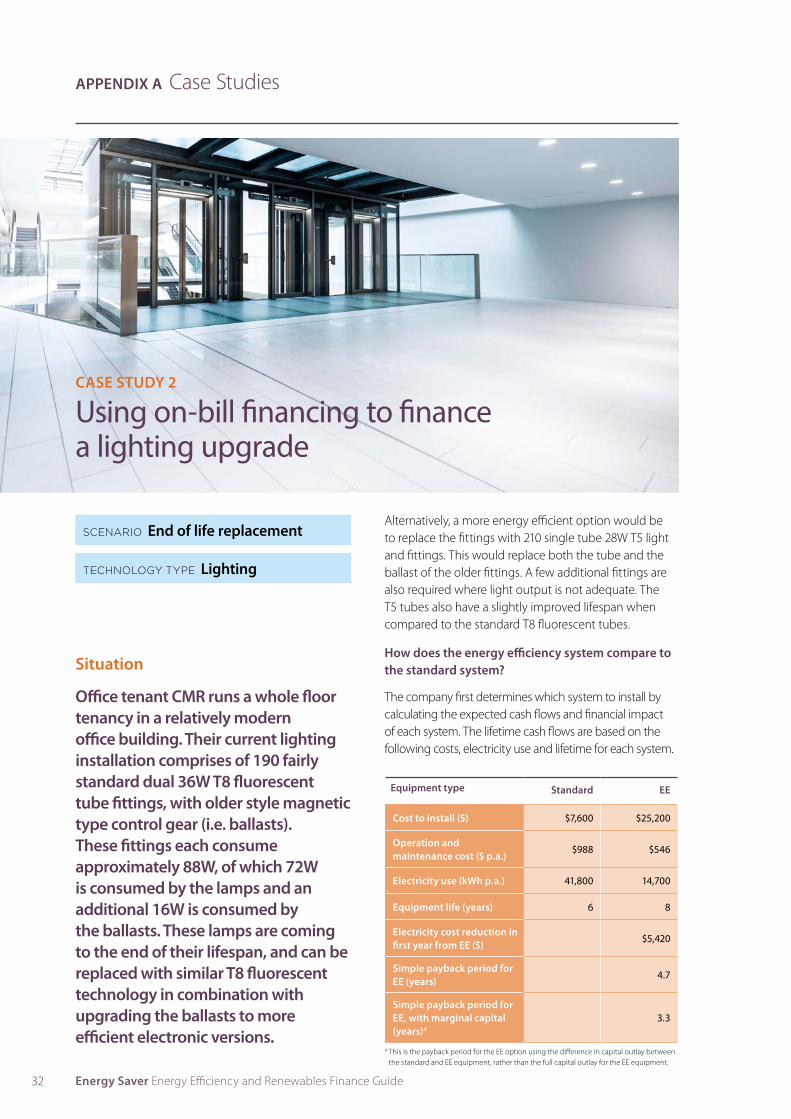
CASE STUDY 2
Using on-bill financing to finance a lighting upgrade
Situation
Office tenant CMR runs a whole floor tenancy in a relatively modern office building. Their current lighting installation comprises of 190 fairly standard dual 36W T8 fluorescent tube fittings, with older style magnetic type control gear (i.e. ballasts). These fittings each consume approximately 88W, of which 72W is consumed by the lamps and an additional 16W is consumed by the ballasts. These lamps are coming to the end of their lifespan, and can be replaced with similar T8 fluorescent technology in combination with upgrading the ballasts to more efficient electronic versions.
Alternatively, a more energy efficient option would be to replace the fittings with 210 single tube 28W T5 light and fittings. This would replace both the tube and the ballast of the older fittings. A few additional fittings are also required where light output is not adequate. The T5 tubes also have a slightly improved lifespan when compared to the standard T8 fluorescent tubes.
How does the energy efficiency system compare to the standard system?
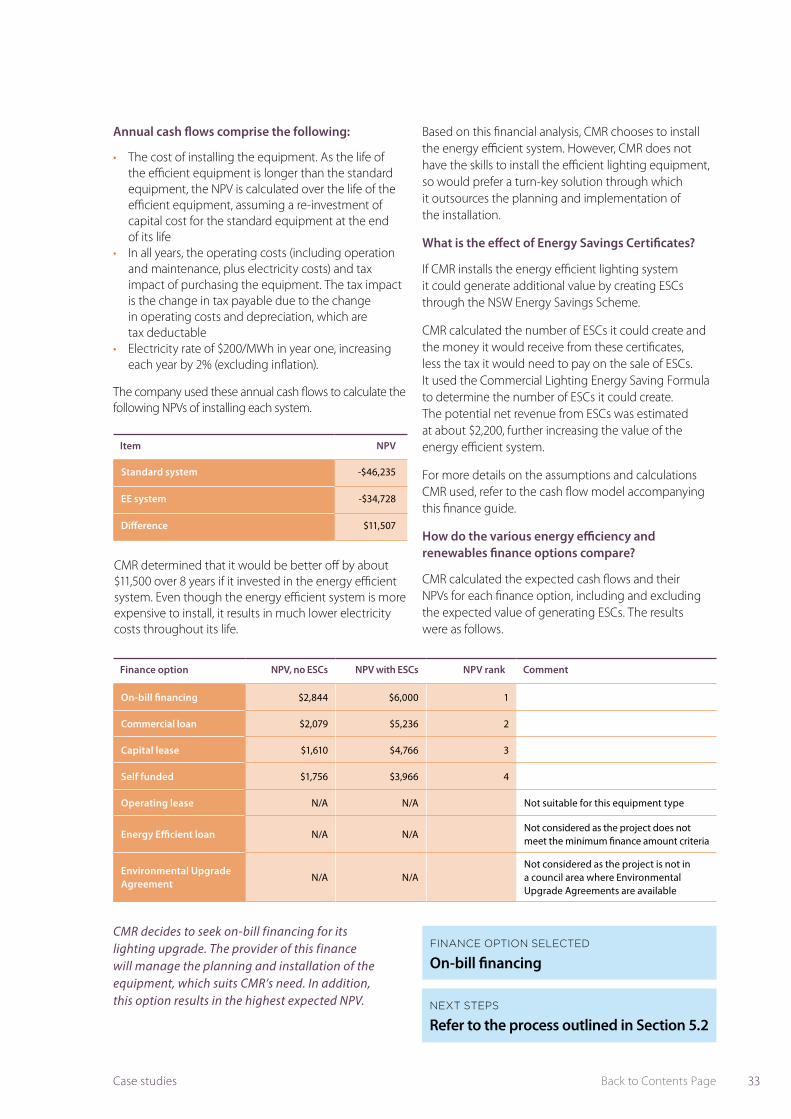
The company first determines which system to install by calculating the expected cash flows and financial impact of each system. The lifetime cash flows are based on the following costs, electricity use and lifetime for each system.
Equipment type Standard EE
Cost to install ($) $7,600 $25,200
Operation and maintenance cost ($ p.a.)
$988 $546
Electricity use (kWh p.a.) 41,800 14,700
Equipment life (years) 6 8
Electricity cost reduction in first year from EE ($)
$5,420
Simple payback period for EE (years)
4.7
Simple payback period for EE, with marginal capital (years)4
3.3
APPENDIX A Case Studies
SCENARIO End of life replacement
TECHNOLOGY TYPE Lighting
4 This is the payback period for the EE option using the difference in capital outlay between the standard and EE equipment, rather than the full capital outlay for the EE equipment.
33Back to Contents PageCase studies
Annual cash flows comprise the following:
• The cost of installing the equipment. As the life of the efficient equipment is longer than the standard equipment, the NPV is calculated over the life of the efficient equipment, assuming a re-investment of capital cost for the standard equipment at the end of its life
• In all years, the operating costs (including operation and maintenance, plus electricity costs) and tax impact of purchasing the equipment. The tax impact is the change in tax payable due to the change in operating costs and depreciation, which are tax deductable
• Electricity rate of $200/MWh in year one, increasing each year by 2% (excluding inflation).
The company used these annual cash flows to calculate the following NPVs of installing each system.
Item NPV
Standard system -$46,235
EE system -$34,728
Difference $11,507
Finance option NPV, no ESCs NPV with ESCs NPV rank Comment
On-bill financing $2,844 $6,000 1
Commercial loan $2,079 $5,236 2
Capital lease $1,610 $4,766 3
Self funded $1,756 $3,966 4
Operating lease N/A N/A Not suitable for this equipment type
Energy Efficient loan N/A N/ANot considered as the project does not meet the minimum finance amount criteria
Environmental Upgrade Agreement
N/A N/ANot considered as the project is not in a council area where Environmental Upgrade Agreements are available
CMR decides to seek on-bill financing for its lighting upgrade. The provider of this finance will manage the planning and installation of the equipment, which suits CMR’s need. In addition, this option results in the highest expected NPV.
CMR determined that it would be better off by about $11,500 over 8 years if it invested in the energy efficient system. Even though the energy efficient system is more expensive to install, it results in much lower electricity costs throughout its life.
Based on this financial analysis, CMR chooses to install the energy efficient system. However, CMR does not have the skills to install the efficient lighting equipment, so would prefer a turn-key solution through which it outsources the planning and implementation of the installation.
What is the effect of Energy Savings Certificates?
If CMR installs the energy efficient lighting system it could generate additional value by creating ESCs through the NSW Energy Savings Scheme.
CMR calculated the number of ESCs it could create and the money it would receive from these certificates, less the tax it would need to pay on the sale of ESCs. It used the Commercial Lighting Energy Saving Formula to determine the number of ESCs it could create. The potential net revenue from ESCs was estimated at about $2,200, further increasing the value of the energy efficient system.
For more details on the assumptions and calculations CMR used, refer to the cash flow model accompanying this finance guide.
How do the various energy efficiency and renewables finance options compare?
CMR calculated the expected cash flows and their NPVs for each finance option, including and excluding the expected value of generating ESCs. The results were as follows.
FINANCE OPTION SELECTED
On-bill financing
NEXT STEPS
Refer to the process outlined in Section 5.2
34 Energy Saver Energy Efficiency and Renewables Finance Guide
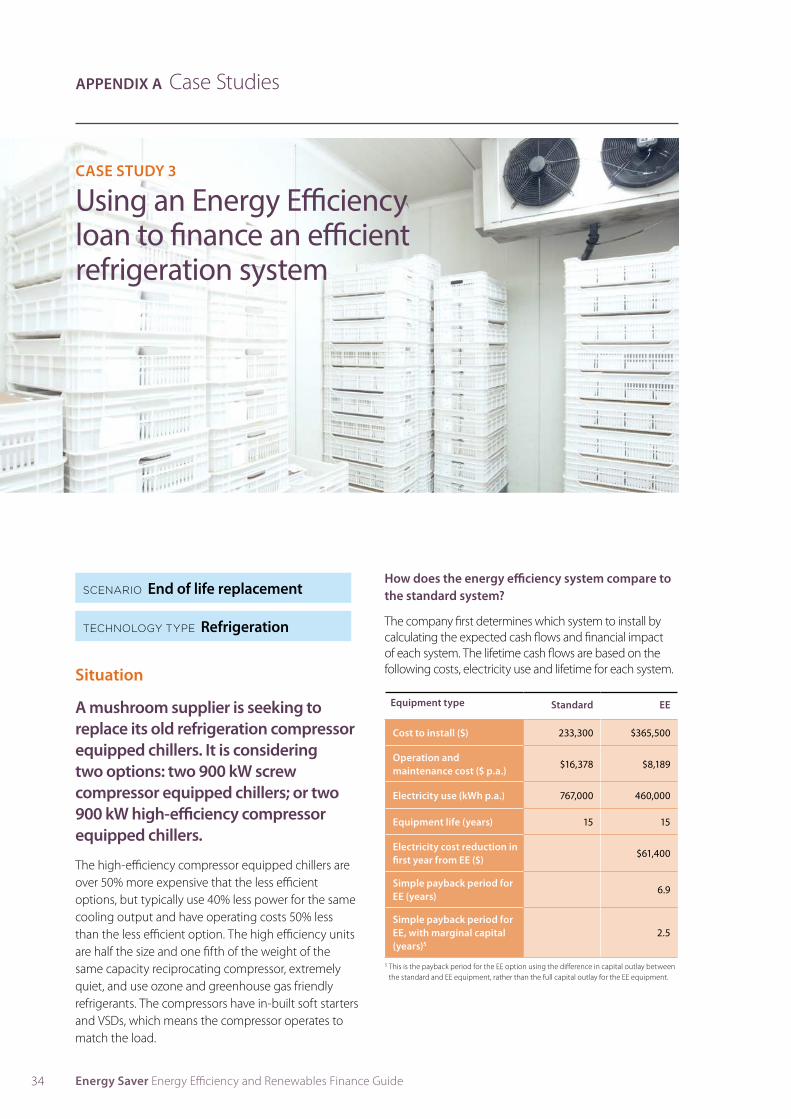
CASE STUDY 3
Using an Energy Efficiency loan to finance an efficient refrigeration system
Situation
A mushroom supplier is seeking to replace its old refrigeration compressor equipped chillers. It is considering two options: two 900 kW screw compressor equipped chillers; or two 900 kW high-efficiency compressor equipped chillers.
The high-efficiency compressor equipped chillers are over 50% more expensive that the less efficient options, but typically use 40% less power for the same cooling output and have operating costs 50% less than the less efficient option. The high efficiency units are half the size and one fifth of the weight of the same capacity reciprocating compressor, extremely quiet, and use ozone and greenhouse gas friendly refrigerants. The compressors have in-built soft starters and VSDs, which means the compressor operates to match the load.
How does the energy efficiency system compare to the standard system?
The company first determines which system to install by calculating the expected cash flows and financial impact of each system. The lifetime cash flows are based on the following costs, electricity use and lifetime for each system.
Equipment type Standard EE
Cost to install ($) 233,300 $365,500
Operation and maintenance cost ($ p.a.)
$16,378 $8,189
Electricity use (kWh p.a.) 767,000 460,000
Equipment life (years) 15 15
Electricity cost reduction in first year from EE ($)
$61,400
Simple payback period for EE (years)
6.9
Simple payback period for EE, with marginal capital (years)5
2.5
APPENDIX A Case Studies
SCENARIO End of life replacement
TECHNOLOGY TYPE Refrigeration
5 This is the payback period for the EE option using the difference in capital outlay between the standard and EE equipment, rather than the full capital outlay for the EE equipment.
35Back to Contents PageCase studies
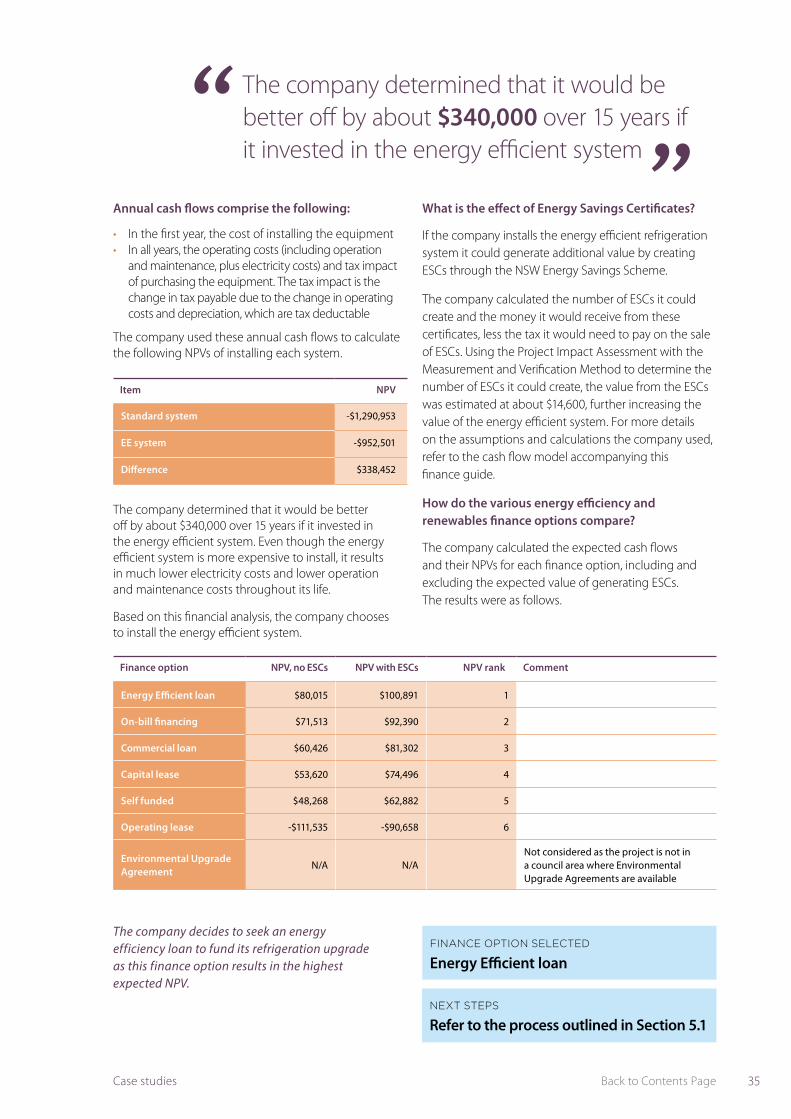
Item NPV
Standard system -$1,290,953
EE system -$952,501
Difference $338,452
Finance option NPV, no ESCs NPV with ESCs NPV rank Comment
Energy Efficient loan $80,015 $100,891 1
On-bill financing $71,513 $92,390 2
Commercial loan $60,426 $81,302 3
Capital lease $53,620 $74,496 4
Self funded $48,268 $62,882 5
Operating lease -$111,535 -$90,658 6
Environmental Upgrade Agreement
N/A N/ANot considered as the project is not in a council area where Environmental Upgrade Agreements are available
The company decides to seek an energy efficiency loan to fund its refrigeration upgrade as this finance option results in the highest expected NPV.
The company determined that it would be better off by about $340,000 over 15 years if it invested in the energy efficient system. Even though the energy efficient system is more expensive to install, it results in much lower electricity costs and lower operation and maintenance costs throughout its life.
Based on this financial analysis, the company chooses to install the energy efficient system.
What is the effect of Energy Savings Certificates?
If the company installs the energy efficient refrigeration system it could generate additional value by creating ESCs through the NSW Energy Savings Scheme.
The company calculated the number of ESCs it could create and the money it would receive from these certificates, less the tax it would need to pay on the sale of ESCs. Using the Project Impact Assessment with the Measurement and Verification Method to determine the number of ESCs it could create, the value from the ESCs was estimated at about $14,600, further increasing the value of the energy efficient system. For more details on the assumptions and calculations the company used, refer to the cash flow model accompanying this finance guide.
How do the various energy efficiency and renewables finance options compare?
The company calculated the expected cash flows and their NPVs for each finance option, including and excluding the expected value of generating ESCs. The results were as follows.
The company determined that it would be better off by about $340,000 over 15 years if it invested in the energy efficient system
“”
Annual cash flows comprise the following:
• In the first year, the cost of installing the equipment• In all years, the operating costs (including operation
and maintenance, plus electricity costs) and tax impact of purchasing the equipment. The tax impact is the change in tax payable due to the change in operating costs and depreciation, which are tax deductable
The company used these annual cash flows to calculate the following NPVs of installing each system.
FINANCE OPTION SELECTED
Energy Efficient loan
NEXT STEPS
Refer to the process outlined in Section 5.1
36 Energy Saver Energy Efficiency and Renewables Finance Guide
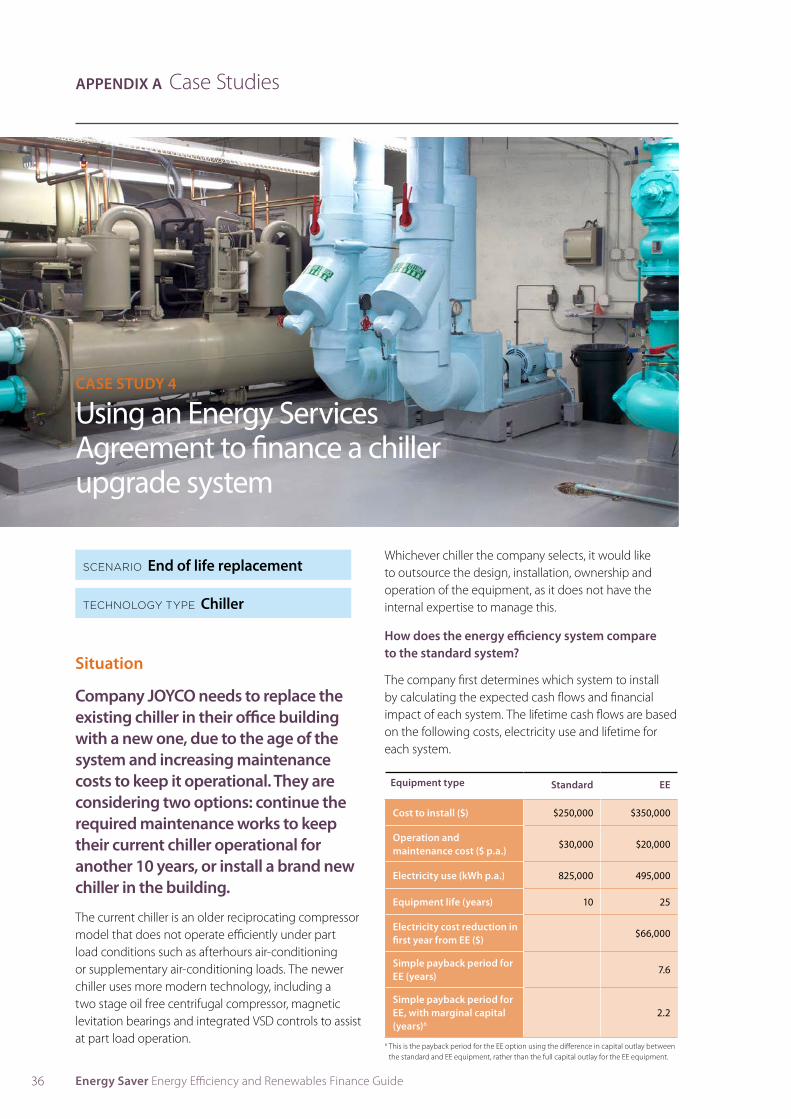
CASE STUDY 4
Using an Energy Services Agreement to finance a chiller upgrade system
Situation
Company JOYCO needs to replace the existing chiller in their office building with a new one, due to the age of the system and increasing maintenance costs to keep it operational. They are considering two options: continue the required maintenance works to keep their current chiller operational for another 10 years, or install a brand new chiller in the building.
The current chiller is an older reciprocating compressor model that does not operate efficiently under part load conditions such as afterhours air-conditioning or supplementary air-conditioning loads. The newer chiller uses more modern technology, including a two stage oil free centrifugal compressor, magnetic levitation bearings and integrated VSD controls to assist at part load operation.
Whichever chiller the company selects, it would like to outsource the design, installation, ownership and operation of the equipment, as it does not have the internal expertise to manage this.
How does the energy efficiency system compare to the standard system?
The company first determines which system to install by calculating the expected cash flows and financial impact of each system. The lifetime cash flows are based on the following costs, electricity use and lifetime for each system.
Equipment type Standard EE
Cost to install ($) $250,000 $350,000
Operation and maintenance cost ($ p.a.)
$30,000 $20,000
Electricity use (kWh p.a.) 825,000 495,000
Equipment life (years) 10 25
Electricity cost reduction in first year from EE ($)
$66,000
Simple payback period for EE (years)
7.6
Simple payback period for EE, with marginal capital (years)6
2.2
APPENDIX A Case Studies
SCENARIO End of life replacement
TECHNOLOGY TYPE Chiller
6 This is the payback period for the EE option using the difference in capital outlay between the standard and EE equipment, rather than the full capital outlay for the EE equipment.
37Back to Contents PageCase studies
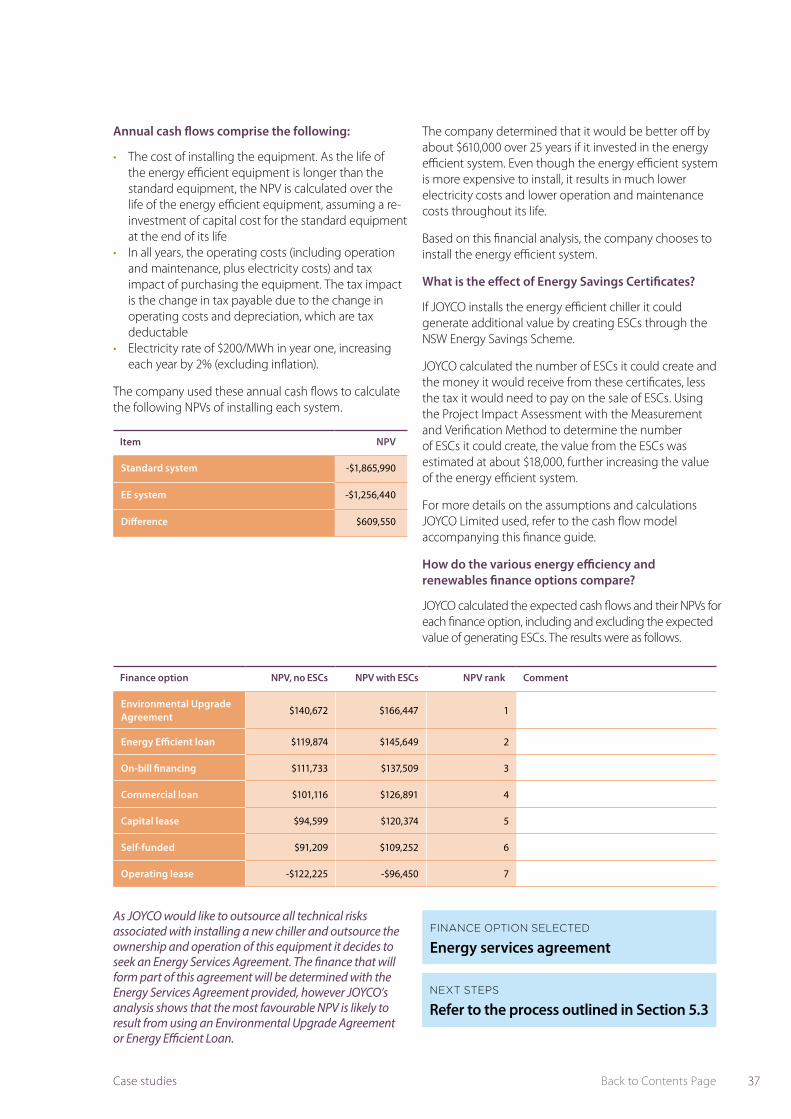
The company determined that it would be better off by about $610,000 over 25 years if it invested in the energy efficient system. Even though the energy efficient system is more expensive to install, it results in much lower electricity costs and lower operation and maintenance costs throughout its life.
Based on this financial analysis, the company chooses to install the energy efficient system.
What is the effect of Energy Savings Certificates?
If JOYCO installs the energy efficient chiller it could generate additional value by creating ESCs through the NSW Energy Savings Scheme.
JOYCO calculated the number of ESCs it could create and the money it would receive from these certificates, less the tax it would need to pay on the sale of ESCs. Using the Project Impact Assessment with the Measurement and Verification Method to determine the number of ESCs it could create, the value from the ESCs was estimated at about $18,000, further increasing the value of the energy efficient system.
For more details on the assumptions and calculations JOYCO Limited used, refer to the cash flow model accompanying this finance guide.
How do the various energy efficiency and renewables finance options compare?
JOYCO calculated the expected cash flows and their NPVs for each finance option, including and excluding the expected value of generating ESCs. The results were as follows.
Annual cash flows comprise the following:
• The cost of installing the equipment. As the life of the energy efficient equipment is longer than the standard equipment, the NPV is calculated over the life of the energy efficient equipment, assuming a re-investment of capital cost for the standard equipment at the end of its life
• In all years, the operating costs (including operation and maintenance, plus electricity costs) and tax impact of purchasing the equipment. The tax impact is the change in tax payable due to the change in operating costs and depreciation, which are tax deductable
• Electricity rate of $200/MWh in year one, increasing each year by 2% (excluding inflation).
The company used these annual cash flows to calculate the following NPVs of installing each system.
Item NPV
Standard system -$1,865,990
EE system -$1,256,440
Difference $609,550
Finance option NPV, no ESCs NPV with ESCs NPV rank Comment
Environmental Upgrade Agreement
$140,672 $166,447 1
Energy Efficient loan $119,874 $145,649 2
On-bill financing $111,733 $137,509 3
Commercial loan $101,116 $126,891 4
Capital lease $94,599 $120,374 5
Self-funded $91,209 $109,252 6
Operating lease -$122,225 -$96,450 7
As JOYCO would like to outsource all technical risks associated with installing a new chiller and outsource the ownership and operation of this equipment it decides to seek an Energy Services Agreement. The finance that will form part of this agreement will be determined with the Energy Services Agreement provided, however JOYCO’s analysis shows that the most favourable NPV is likely to result from using an Environmental Upgrade Agreement or Energy Efficient Loan.
FINANCE OPTION SELECTED
Energy services agreement
NEXT STEPS
Refer to the process outlined in Section 5.3
38 Energy Saver Energy Efficiency and Renewables Finance Guide
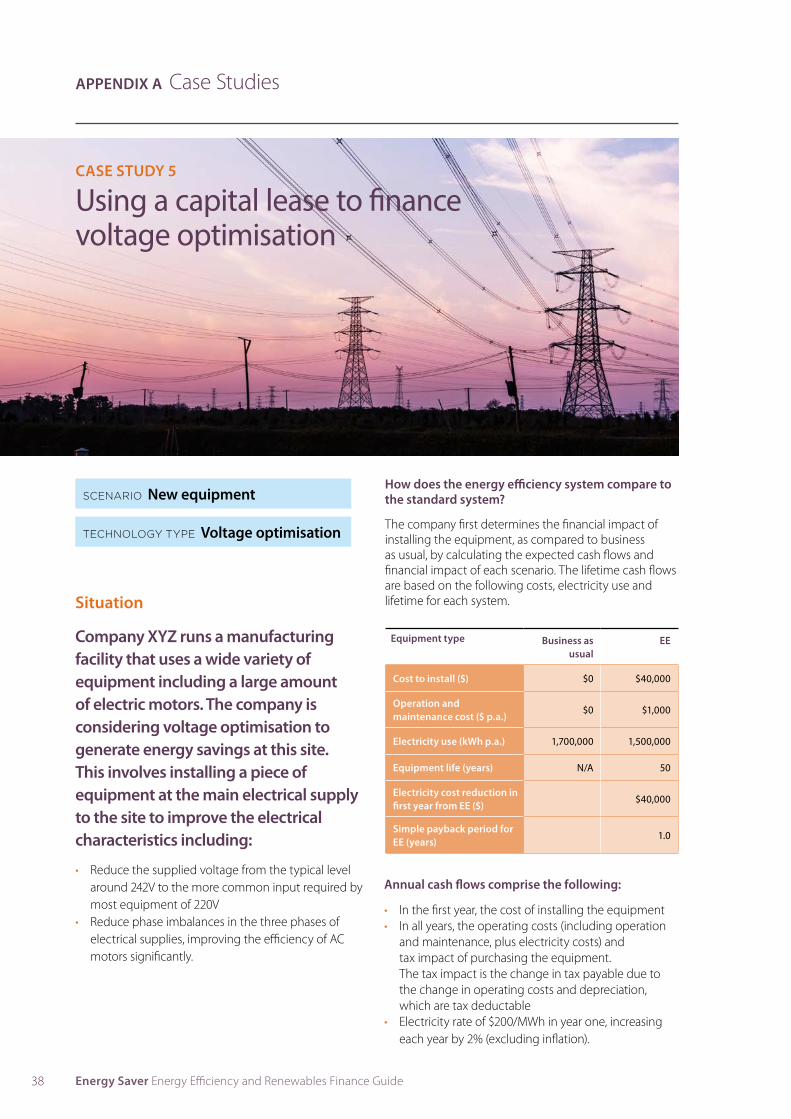
CASE STUDY 5
Using a capital lease to finance voltage optimisation
Situation
Company XYZ runs a manufacturing facility that uses a wide variety of equipment including a large amount of electric motors. The company is considering voltage optimisation to generate energy savings at this site. This involves installing a piece of equipment at the main electrical supply to the site to improve the electrical characteristics including:
• Reduce the supplied voltage from the typical level around 242V to the more common input required by most equipment of 220V
• Reduce phase imbalances in the three phases of electrical supplies, improving the efficiency of AC motors significantly.
Equipment type Business as usual
EE
Cost to install ($) $0 $40,000
Operation and maintenance cost ($ p.a.)
$0 $1,000
Electricity use (kWh p.a.) 1,700,000 1,500,000
Equipment life (years) N/A 50
Electricity cost reduction in first year from EE ($)
$40,000
Simple payback period for EE (years)
1.0
Annual cash flows comprise the following:
• In the first year, the cost of installing the equipment• In all years, the operating costs (including operation
and maintenance, plus electricity costs) and tax impact of purchasing the equipment. The tax impact is the change in tax payable due to the change in operating costs and depreciation, which are tax deductable
• Electricity rate of $200/MWh in year one, increasing each year by 2% (excluding inflation).
APPENDIX A Case Studies
How does the energy efficiency system compare to the standard system?
The company first determines the financial impact of installing the equipment, as compared to business as usual, by calculating the expected cash flows and financial impact of each scenario. The lifetime cash flows are based on the following costs, electricity use and lifetime for each system.
SCENARIO New equipment
TECHNOLOGY TYPE Voltage optimisation

39Back to Contents PageCase studies
Item NPV
Business as usual -$3,197,467
EE system -$2,866,311
Difference $331,156
The company determined that it would be better off by about $331,000 over 50 years if it invested in voltage optimisation. While the business would need to invest in new equipment, the voltage optimisation results in much lower electricity costs and lower operation and maintenance costs throughout its life.
Based on this financial analysis, the company chooses to install voltage optimisation.
What is the effect of Energy Savings Certificates?
If company XYZ installs voltage optimisation it could generate additional value by creating ESCs through the NSW Energy Savings Scheme.
XYZ calculated the number of ESCs it could create and the money it would receive from these certificates, less the tax it would need to pay on the sale of ESCs. It used the Project Impact Assessment with the Measurement and Verification Method to determine the number of ESCs it could create. The potential net revenue from the ESCs was estimated at about $4,900, further increasing the value of the energy efficient system.
For more details on the assumptions and calculations XYZ used, refer to the cash flow model accompanying this finance guide.
How do the various energy efficiency and renewables finance options compare?
The company calculated the expected cash flows and their NPVs for each finance option, including and excluding the expected value of generating ESCs. The results were as follows.
Finance option NPV, no ESCs NPV with ESCs NPV rank Comment
On-bill financing $332,287 $339,281 1
Commercial loan $331,073 $338,068 2
Capital lease $330,328 $337,323 3
Self funded $331,156 $336,052 4
Operating lease $86,805 $93,799 5
Environmental Upgrade Agreement
N/A N/ANot considered as the project is not in a council area where Environmental Upgrade Agreements are available
Energy Efficient loan N/A N/ANot considered as the project does not meet the minimum finance amount criteria
On-bill financing results in the highest NPV; however the company does not purchase energy from Origin Energy or AGL and does not wish to change energy retailers, so it will not seek this finance option. The next best options are commercial loans and capital leases. The company would prefer a finance option with fixed finance repayments to provide more certainty when it develops its budgets. It therefore decides to seek a capital lease to finance its voltage optimisation project.
The company used these annual cash flows to calculate the following NPVs of each scenario.
FINANCE OPTION SELECTED
Capital lease
NEXT STEPS
Refer to the process outlined in Section 5.1
Electricity cost reduction
$40,000 in the first year
The company determined that it would be better off by about $331,000 over 50 years
“”

40 Energy Saver Energy Efficiency and Renewables Finance Guide
CASE STUDY 6
Using an operating lease to finance motors
Situation
A textile manufacturing company is developing a new production line. It needs to install motors with a combined capacity of 2,750kW. The motors will run approximately 8,000 hrs. p.a. with an average load of 75%. There are two options for replacement:
1. Replace with standard efficiency motors that have an aggregate efficiency of 89.5% at 75% load, or
2. Replace with more expensive premium efficiency motors with an aggregate efficiency of 92.2% at 75% load.
How does the energy efficiency system compare to the standard system?
The company first determines which system to install by calculating the expected cash flows and financial impact of each system. The lifetime cash flows are based on the following costs, electricity use and lifetime for each system.
Equipment type Standard EE
Cost to install ($) $275,000 $325,000
Operation and maintenance cost ($ p.a.)
$0 $0
Electricity use (kWh p.a.) 18,435,754 17,895,879
Equipment life (years) 15 15
Electricity cost reduction in first year from EE ($)
$107,975
Simple payback period for EE (years)
3.0
Simple payback period for EE, with marginal capital (years) 7
0.5
Annual cash flows comprise the following:
• In the first year, the cost of installing the equipment• In all years, the operating costs (including operation
and maintenance, plus electricity costs) and tax impact of purchasing the equipment. The tax impact is the change in tax payable due to the change in operating costs and depreciation, which are tax deductable
• Electricity rate of $200/MWh in year one, increasing each year by 2% (excluding inflation).
APPENDIX A Case Studies
SCENARIO End of life replacement
TECHNOLOGY TYPE Motor
7 This is the payback period for the EE option using the difference in capital outlay between the standard and EE equipment, rather than the full capital outlay for the EE equipment.
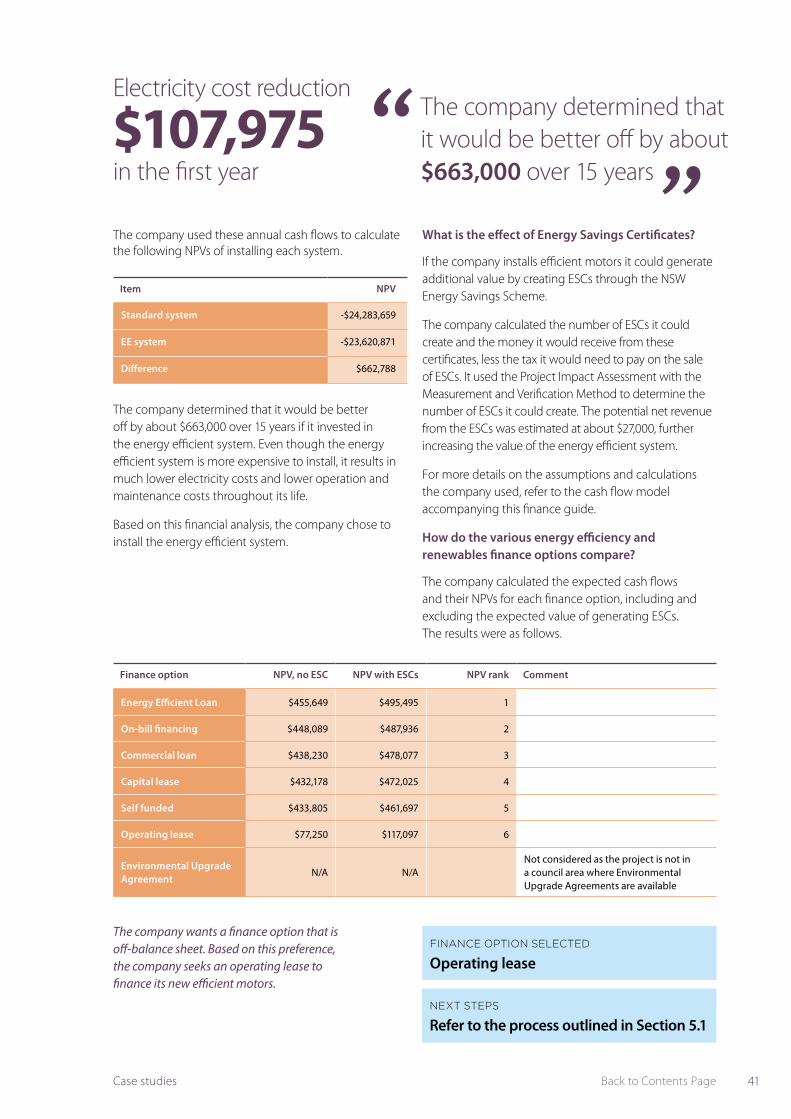
41Back to Contents PageCase studies
Item NPV
Standard system -$24,283,659
EE system -$23,620,871
Difference $662,788
The company determined that it would be better off by about $663,000 over 15 years if it invested in the energy efficient system. Even though the energy efficient system is more expensive to install, it results in much lower electricity costs and lower operation and maintenance costs throughout its life.
Based on this financial analysis, the company chose to install the energy efficient system.
What is the effect of Energy Savings Certificates?
If the company installs efficient motors it could generate additional value by creating ESCs through the NSW Energy Savings Scheme.
The company calculated the number of ESCs it could create and the money it would receive from these certificates, less the tax it would need to pay on the sale of ESCs. It used the Project Impact Assessment with the Measurement and Verification Method to determine the number of ESCs it could create. The potential net revenue from the ESCs was estimated at about $27,000, further increasing the value of the energy efficient system.
For more details on the assumptions and calculations the company used, refer to the cash flow model accompanying this finance guide.
How do the various energy efficiency and renewables finance options compare?
The company calculated the expected cash flows and their NPVs for each finance option, including and excluding the expected value of generating ESCs. The results were as follows.
Finance option NPV, no ESC NPV with ESCs NPV rank Comment
Energy Efficient Loan $455,649 $495,495 1
On-bill financing $448,089 $487,936 2
Commercial loan $438,230 $478,077 3
Capital lease $432,178 $472,025 4
Self funded $433,805 $461,697 5
Operating lease $77,250 $117,097 6
Environmental Upgrade Agreement
N/A N/ANot considered as the project is not in a council area where Environmental Upgrade Agreements are available
The company wants a finance option that is off-balance sheet. Based on this preference, the company seeks an operating lease to finance its new efficient motors.
The company determined that it would be better off by about $663,000 over 15 years
“”
FINANCE OPTION SELECTED
Operating lease
NEXT STEPS
Refer to the process outlined in Section 5.1
Electricity cost reduction
$107,975 in the first year
The company used these annual cash flows to calculate the following NPVs of installing each system.
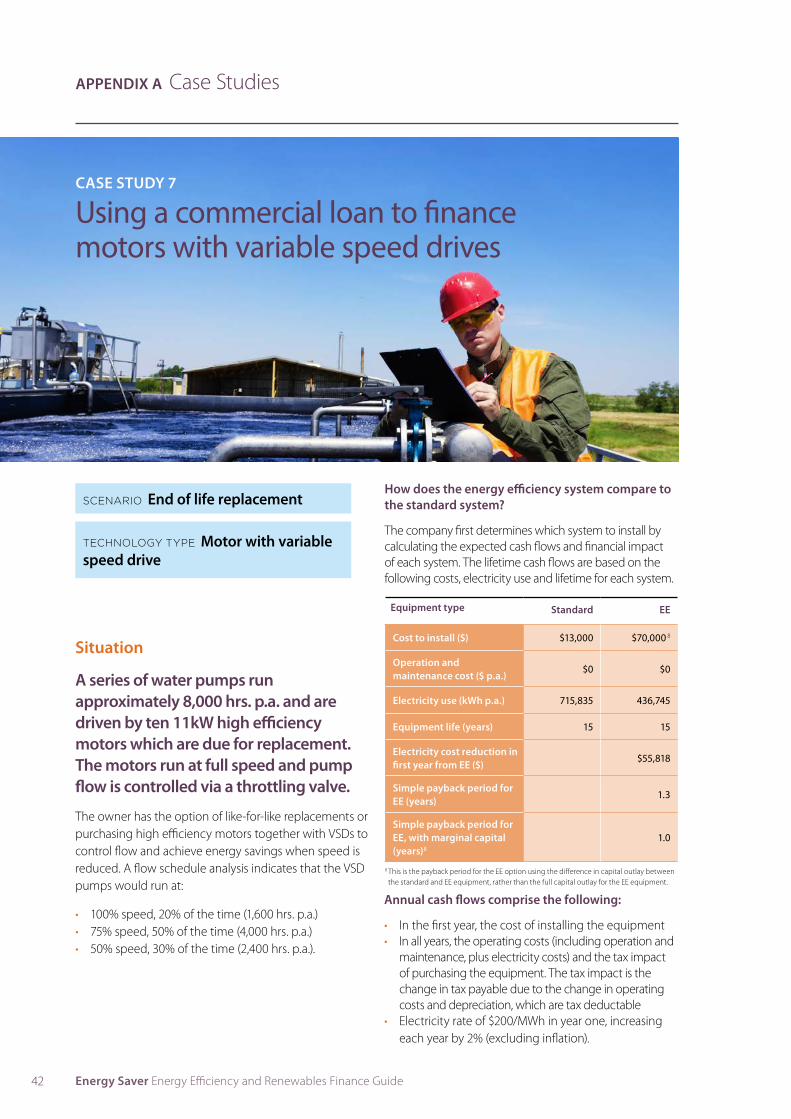
42 Energy Saver Energy Efficiency and Renewables Finance Guide
CASE STUDY 7
Using a commercial loan to finance motors with variable speed drives
Situation
A series of water pumps run approximately 8,000 hrs. p.a. and are driven by ten 11kW high efficiency motors which are due for replacement. The motors run at full speed and pump flow is controlled via a throttling valve.
The owner has the option of like-for-like replacements or purchasing high efficiency motors together with VSDs to control flow and achieve energy savings when speed is reduced. A flow schedule analysis indicates that the VSD pumps would run at:
• 100% speed, 20% of the time (1,600 hrs. p.a.)• 75% speed, 50% of the time (4,000 hrs. p.a.)• 50% speed, 30% of the time (2,400 hrs. p.a.).
How does the energy efficiency system compare to the standard system?
The company first determines which system to install by calculating the expected cash flows and financial impact of each system. The lifetime cash flows are based on the following costs, electricity use and lifetime for each system.
Equipment type Standard EE
Cost to install ($) $13,000 $70,000 8
Operation and maintenance cost ($ p.a.)
$0 $0
Electricity use (kWh p.a.) 715,835 436,745
Equipment life (years) 15 15
Electricity cost reduction in first year from EE ($)
$55,818
Simple payback period for EE (years)
1.3
Simple payback period for EE, with marginal capital (years)8
1.0
Annual cash flows comprise the following:
• In the first year, the cost of installing the equipment• In all years, the operating costs (including operation and
maintenance, plus electricity costs) and the tax impact of purchasing the equipment. The tax impact is the change in tax payable due to the change in operating costs and depreciation, which are tax deductable
• Electricity rate of $200/MWh in year one, increasing each year by 2% (excluding inflation).
APPENDIX A Case Studies
SCENARIO End of life replacement
TECHNOLOGY TYPE Motor with variable speed drive
8 This is the payback period for the EE option using the difference in capital outlay between the standard and EE equipment, rather than the full capital outlay for the EE equipment.
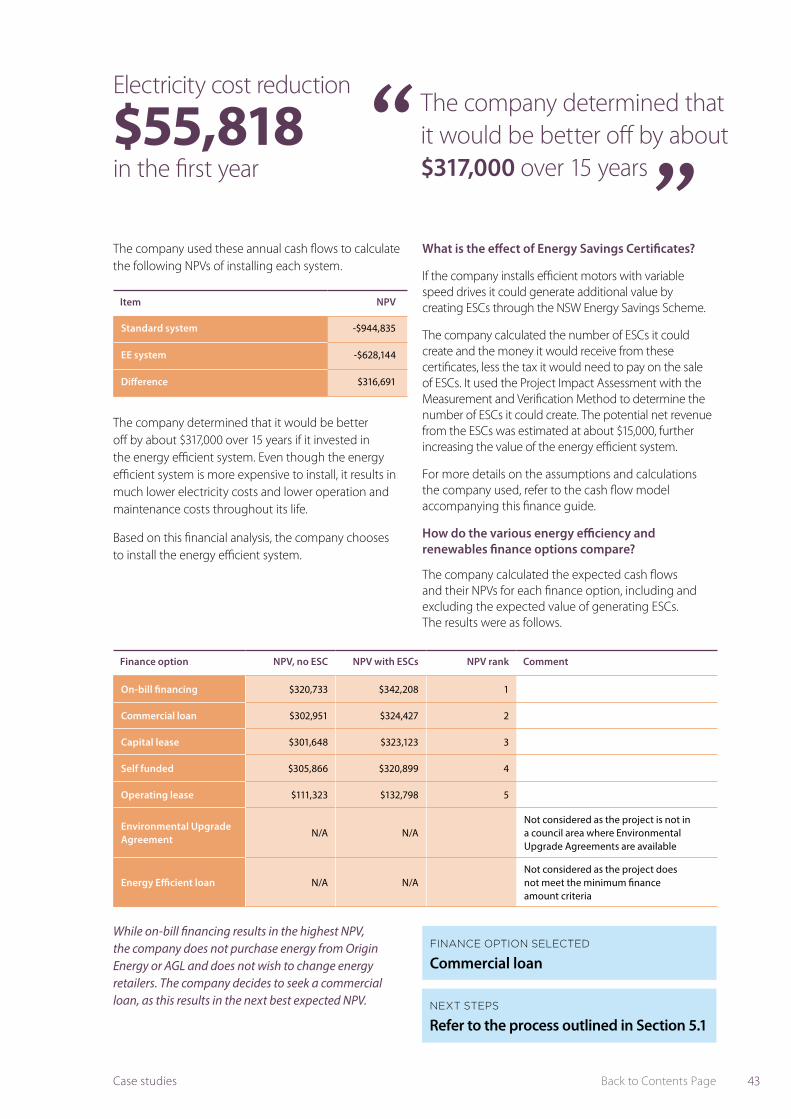
43Back to Contents PageCase studies
The company used these annual cash flows to calculate the following NPVs of installing each system.
The company determined that it would be better off by about $317,000 over 15 years if it invested in the energy efficient system. Even though the energy efficient system is more expensive to install, it results in much lower electricity costs and lower operation and maintenance costs throughout its life.
Based on this financial analysis, the company chooses to install the energy efficient system.
Item NPV
Standard system -$944,835
EE system -$628,144
Difference $316,691
What is the effect of Energy Savings Certificates?
If the company installs efficient motors with variable speed drives it could generate additional value by creating ESCs through the NSW Energy Savings Scheme.
The company calculated the number of ESCs it could create and the money it would receive from these certificates, less the tax it would need to pay on the sale of ESCs. It used the Project Impact Assessment with the Measurement and Verification Method to determine the number of ESCs it could create. The potential net revenue from the ESCs was estimated at about $15,000, further increasing the value of the energy efficient system.
For more details on the assumptions and calculations the company used, refer to the cash flow model accompanying this finance guide.
How do the various energy efficiency and renewables finance options compare?
The company calculated the expected cash flows and their NPVs for each finance option, including and excluding the expected value of generating ESCs. The results were as follows.
Finance option NPV, no ESC NPV with ESCs NPV rank Comment
On-bill financing $320,733 $342,208 1
Commercial loan $302,951 $324,427 2
Capital lease $301,648 $323,123 3
Self funded $305,866 $320,899 4
Operating lease $111,323 $132,798 5
Environmental Upgrade Agreement
N/A N/ANot considered as the project is not in a council area where Environmental Upgrade Agreements are available
Energy Efficient loan N/A N/ANot considered as the project does not meet the minimum finance amount criteria
While on-bill financing results in the highest NPV, the company does not purchase energy from Origin Energy or AGL and does not wish to change energy retailers. The company decides to seek a commercial loan, as this results in the next best expected NPV.
FINANCE OPTION SELECTED
Commercial loan
NEXT STEPS
Refer to the process outlined in Section 5.1
The company determined that it would be better off by about $317,000 over 15 years
“”
Electricity cost reduction
$55,818 in the first year
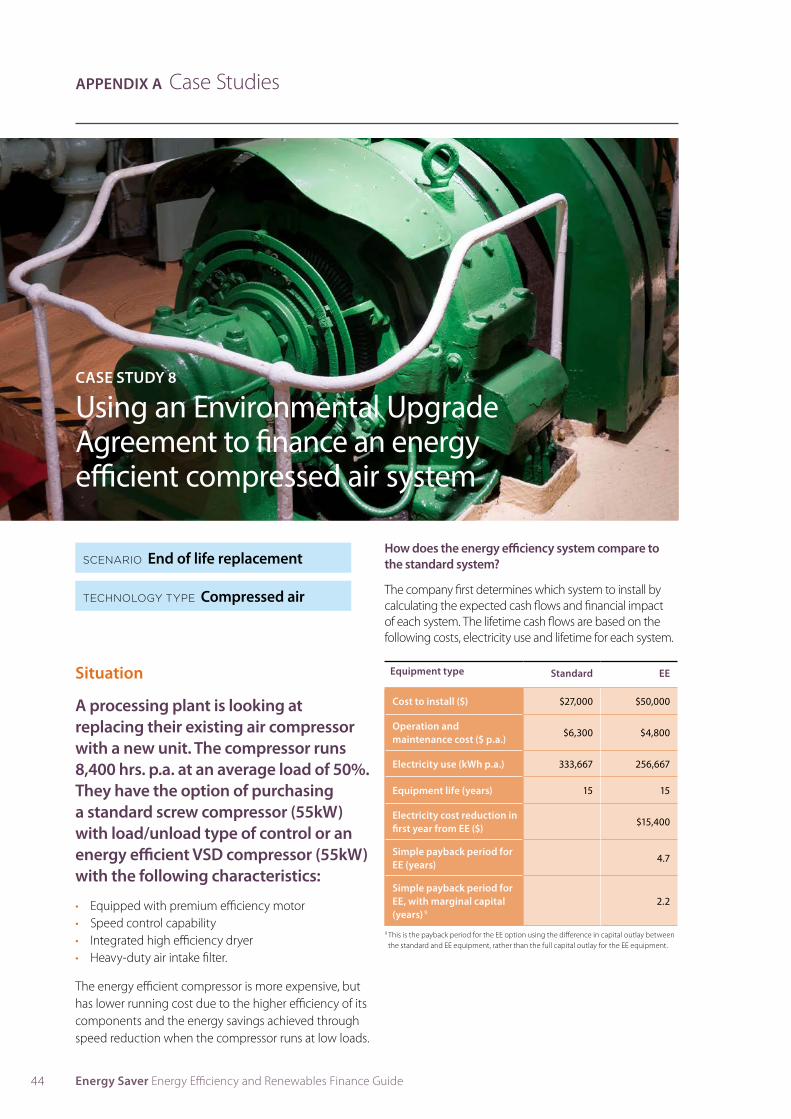
44 Energy Saver Energy Efficiency and Renewables Finance Guide
CASE STUDY 8
Using an Environmental Upgrade Agreement to finance an energy efficient compressed air system
Situation
A processing plant is looking at replacing their existing air compressor with a new unit. The compressor runs 8,400 hrs. p.a. at an average load of 50%. They have the option of purchasing a standard screw compressor (55kW) with load/unload type of control or an energy efficient VSD compressor (55kW) with the following characteristics:
• Equipped with premium efficiency motor• Speed control capability• Integrated high efficiency dryer• Heavy-duty air intake filter.
The energy efficient compressor is more expensive, but has lower running cost due to the higher efficiency of its components and the energy savings achieved through speed reduction when the compressor runs at low loads.
How does the energy efficiency system compare to the standard system?
The company first determines which system to install by calculating the expected cash flows and financial impact of each system. The lifetime cash flows are based on the following costs, electricity use and lifetime for each system.
Equipment type Standard EE
Cost to install ($) $27,000 $50,000
Operation and maintenance cost ($ p.a.)
$6,300 $4,800
Electricity use (kWh p.a.) 333,667 256,667
Equipment life (years) 15 15
Electricity cost reduction in first year from EE ($)
$15,400
Simple payback period for EE (years)
4.7
Simple payback period for EE, with marginal capital (years) 9
2.2
APPENDIX A Case Studies
SCENARIO End of life replacement
TECHNOLOGY TYPE Compressed air
9 This is the payback period for the EE option using the difference in capital outlay between the standard and EE equipment, rather than the full capital outlay for the EE equipment.
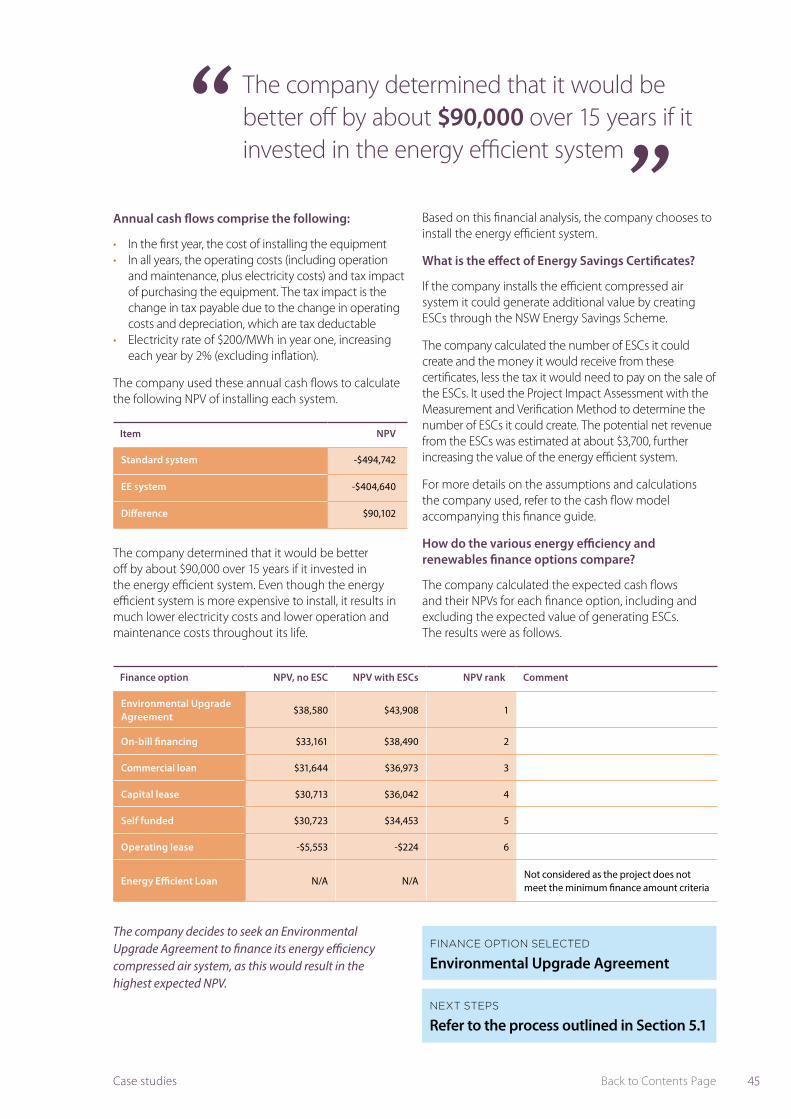
45Back to Contents PageCase studies
Annual cash flows comprise the following:
• In the first year, the cost of installing the equipment• In all years, the operating costs (including operation
and maintenance, plus electricity costs) and tax impact of purchasing the equipment. The tax impact is the change in tax payable due to the change in operating costs and depreciation, which are tax deductable
• Electricity rate of $200/MWh in year one, increasing each year by 2% (excluding inflation).
The company used these annual cash flows to calculate the following NPV of installing each system.
Item NPV
Standard system -$494,742
EE system -$404,640
Difference $90,102
The company determined that it would be better off by about $90,000 over 15 years if it invested in the energy efficient system. Even though the energy efficient system is more expensive to install, it results in much lower electricity costs and lower operation and maintenance costs throughout its life.
Based on this financial analysis, the company chooses to install the energy efficient system.
What is the effect of Energy Savings Certificates?
If the company installs the efficient compressed air system it could generate additional value by creating ESCs through the NSW Energy Savings Scheme.
The company calculated the number of ESCs it could create and the money it would receive from these certificates, less the tax it would need to pay on the sale of the ESCs. It used the Project Impact Assessment with the Measurement and Verification Method to determine the number of ESCs it could create. The potential net revenue from the ESCs was estimated at about $3,700, further increasing the value of the energy efficient system.
For more details on the assumptions and calculations the company used, refer to the cash flow model accompanying this finance guide.
How do the various energy efficiency and renewables finance options compare?
The company calculated the expected cash flows and their NPVs for each finance option, including and excluding the expected value of generating ESCs. The results were as follows.
Finance option NPV, no ESC NPV with ESCs NPV rank Comment
Environmental Upgrade Agreement
$38,580 $43,908 1
On-bill financing $33,161 $38,490 2
Commercial loan $31,644 $36,973 3
Capital lease $30,713 $36,042 4
Self funded $30,723 $34,453 5
Operating lease -$5,553 -$224 6
Energy Efficient Loan N/A N/ANot considered as the project does not meet the minimum finance amount criteria
The company decides to seek an Environmental Upgrade Agreement to finance its energy efficiency compressed air system, as this would result in the highest expected NPV.
FINANCE OPTION SELECTED
Environmental Upgrade Agreement
NEXT STEPS
Refer to the process outlined in Section 5.1
The company determined that it would be better off by about $90,000 over 15 years if it invested in the energy efficient system
“”

46 Energy Saver Energy Efficiency and Renewables Finance Guide
CASE STUDY 9
Using on-bill financing to finance a new building management system
Situation
A property company owns and operates a mixed use building that includes office space and retail space. This building is served by a central air-conditioning system that is controlled by an out-dated building management system (BMS). This system is over 10 years old, no longer supported by the vendor, and does not provide a sufficient level of control to manage and optimise control strategies.
Replacing this system with a ‘like for like’ package will solve the redundancy issues, however installation and commissioning of a newer, smarter system including additional monitoring and control points can provide significant savings by:
• Using fresh air to provide cooling when conditions are correct
• Monitoring the amount of fresh air required, particularly during winter
• Speeding up or slowing down pumps and fans as required
• Providing automated alarms when control parameters move outside set limits, allowing contractors to fix problems quickly.
How does the energy efficiency system compare to the standard system?
The company first determines which system to install by calculating the expected cash flows and financial impact of each system. The lifetime cash flows are based on the following costs, electricity use and lifetime for each system.
Equipment type Standard EE
Cost to install ($) $100,000 $200,000
Operation and maintenance cost ($ p.a.)
$5,000 $5,000
Electricity use (kWh p.a.) 900,000 810,000
Equipment life (years) 10 15
Electricity cost reduction in first year from EE ($)
$18,000
Simple payback period for EE (years)
15.4
Simple payback period for EE, with marginal capital (years)10
7.7
APPENDIX A Case Studies
SCENARIO End of life replacement
TECHNOLOGY TYPE Building Management System
10 This is the payback period for the EE option using the difference in capital outlay between the standard and EE equipment, rather than the full capital outlay for the EE equipment.
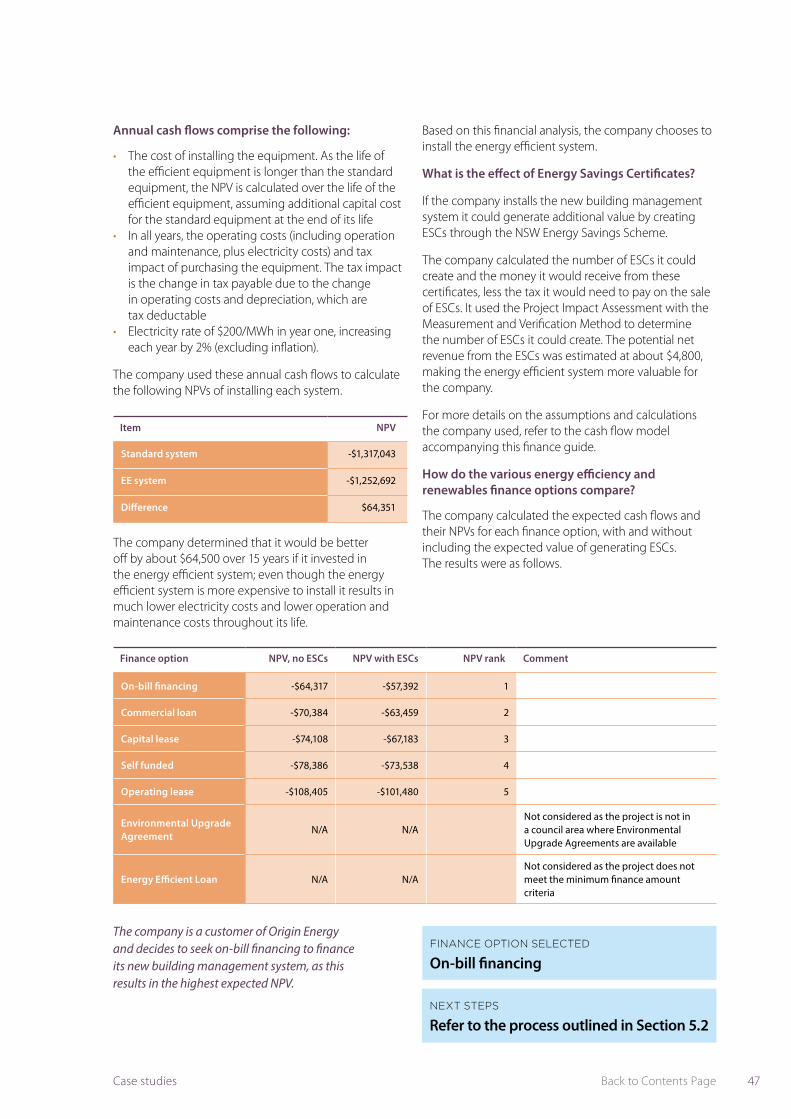
47Back to Contents PageCase studies
Annual cash flows comprise the following:
• The cost of installing the equipment. As the life of the efficient equipment is longer than the standard equipment, the NPV is calculated over the life of the efficient equipment, assuming additional capital cost for the standard equipment at the end of its life
• In all years, the operating costs (including operation and maintenance, plus electricity costs) and tax impact of purchasing the equipment. The tax impact is the change in tax payable due to the change in operating costs and depreciation, which are tax deductable
• Electricity rate of $200/MWh in year one, increasing each year by 2% (excluding inflation).
The company used these annual cash flows to calculate the following NPVs of installing each system.
Item NPV
Standard system -$1,317,043
EE system -$1,252,692
Difference $64,351
Finance option NPV, no ESCs NPV with ESCs NPV rank Comment
On-bill financing -$64,317 -$57,392 1
Commercial loan -$70,384 -$63,459 2
Capital lease -$74,108 -$67,183 3
Self funded -$78,386 -$73,538 4
Operating lease -$108,405 -$101,480 5
Environmental Upgrade Agreement
N/A N/ANot considered as the project is not in a council area where Environmental Upgrade Agreements are available
Energy Efficient Loan N/A N/ANot considered as the project does not meet the minimum finance amount criteria
The company is a customer of Origin Energy and decides to seek on-bill financing to finance its new building management system, as this results in the highest expected NPV.
The company determined that it would be better off by about $64,500 over 15 years if it invested in the energy efficient system; even though the energy efficient system is more expensive to install it results in much lower electricity costs and lower operation and maintenance costs throughout its life.
Based on this financial analysis, the company chooses to install the energy efficient system.
What is the effect of Energy Savings Certificates?
If the company installs the new building management system it could generate additional value by creating ESCs through the NSW Energy Savings Scheme.
The company calculated the number of ESCs it could create and the money it would receive from these certificates, less the tax it would need to pay on the sale of ESCs. It used the Project Impact Assessment with the Measurement and Verification Method to determine the number of ESCs it could create. The potential net revenue from the ESCs was estimated at about $4,800, making the energy efficient system more valuable for the company.
For more details on the assumptions and calculations the company used, refer to the cash flow model accompanying this finance guide.
How do the various energy efficiency and renewables finance options compare?
The company calculated the expected cash flows and their NPVs for each finance option, with and without including the expected value of generating ESCs. The results were as follows.
FINANCE OPTION SELECTED
On-bill financing
NEXT STEPS
Refer to the process outlined in Section 5.2

48 Energy Saver Energy Efficiency and Renewables Finance Guide
CASE STUDY 10
Using an Environmental Upgrade Agreement to finance a solar PV system
Situation
A shopping centre owner is investigating ways to reduce the amount of electricity it purchases from the grid. The shopping centre site has the following characteristics:
• it is likely to be occupied for at least another 7-10 years• there is 400m2 of available roof space with good
exposure and a northern orientation, and 500m2 of available ground space.
The owner decides to investigate installing solar PV at the site, as there is suitable space for a solar PV system and it intends to keep using the site for many more years. A system of 90kW total capacity is considered.
How does the renewable energy system compare to business as usual?
The company first determines the expected financial impact from installing the renewable energy system to offset its current energy costs. The lifetime cash flows are based on the following costs, energy generation and lifetime of the system:
Item Value
Cost to install ($) $222,300
Electricity generation (kWh p.a.) 124,380
Equipment life (years) 25
Electricity cost reduction in first year from EE ($)
$24,876
Simple payback period for EE (years) 8.9
Annual cash flows comprise the following:
• The cost of installing the equipment• In all years, the tax impact of purchasing the
equipment. The tax impact is the change in tax payable due to the reduction in electricity costs and the increase in depreciation, which are tax deductable
• Creation of Renewable Energy Target certificates• Electricity rate of $200/MWh in year one, increasing
each year by 2% (excluding inflation).
APPENDIX A Case Studies
TECHNOLOGY TYPE Solar PV
SCENARIO New power generation system
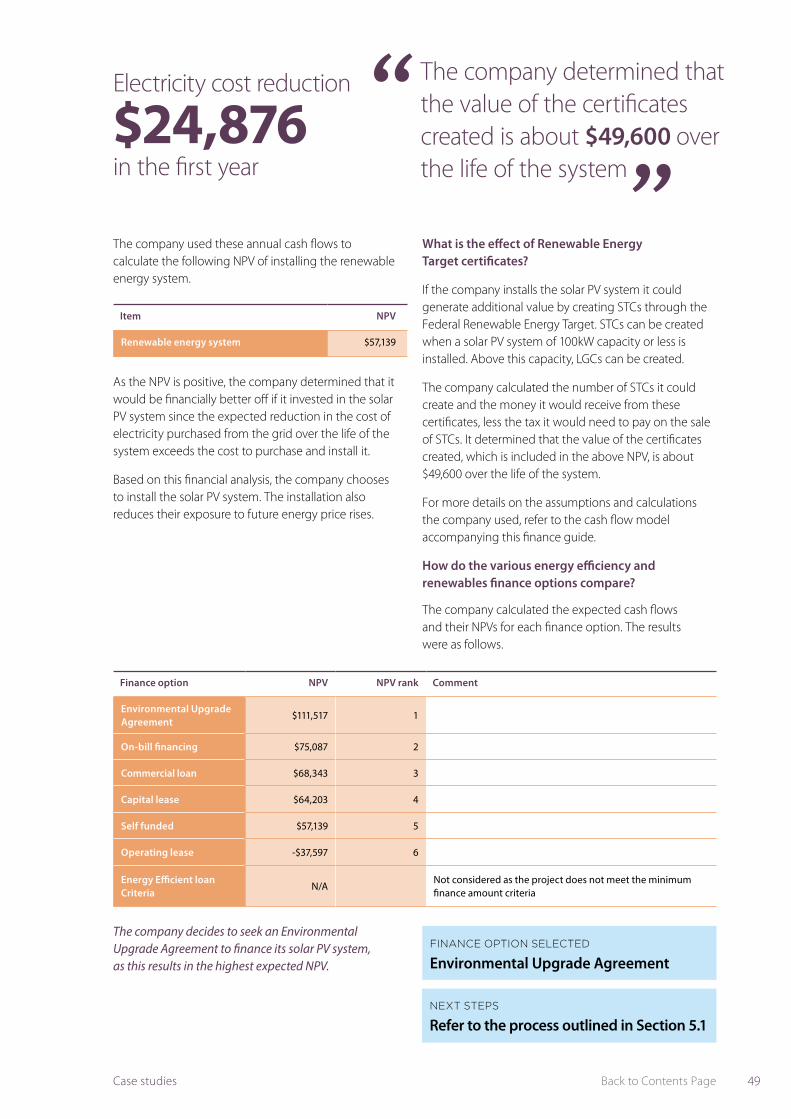
49Back to Contents PageCase studies
Item NPV
Renewable energy system $57,139
Finance option NPV NPV rank Comment
Environmental Upgrade Agreement
$111,517 1
On-bill financing $75,087 2
Commercial loan $68,343 3
Capital lease $64,203 4
Self funded $57,139 5
Operating lease -$37,597 6
Energy Efficient loan Criteria
N/ANot considered as the project does not meet the minimum finance amount criteria
The company decides to seek an Environmental Upgrade Agreement to finance its solar PV system, as this results in the highest expected NPV.
The company used these annual cash flows to calculate the following NPV of installing the renewable energy system.
As the NPV is positive, the company determined that it would be financially better off if it invested in the solar PV system since the expected reduction in the cost of electricity purchased from the grid over the life of the system exceeds the cost to purchase and install it.
Based on this financial analysis, the company chooses to install the solar PV system. The installation also reduces their exposure to future energy price rises.
What is the effect of Renewable Energy Target certificates?
If the company installs the solar PV system it could generate additional value by creating STCs through the Federal Renewable Energy Target. STCs can be created when a solar PV system of 100kW capacity or less is installed. Above this capacity, LGCs can be created.
The company calculated the number of STCs it could create and the money it would receive from these certificates, less the tax it would need to pay on the sale of STCs. It determined that the value of the certificates created, which is included in the above NPV, is about $49,600 over the life of the system.
For more details on the assumptions and calculations the company used, refer to the cash flow model accompanying this finance guide.
How do the various energy efficiency and renewables finance options compare?
The company calculated the expected cash flows and their NPVs for each finance option. The results were as follows.
FINANCE OPTION SELECTED
Environmental Upgrade Agreement
NEXT STEPS
Refer to the process outlined in Section 5.1
The company determined that the value of the certificates created is about $49,600 over the life of the system
“”
Electricity cost reduction
$24,876 in the first year
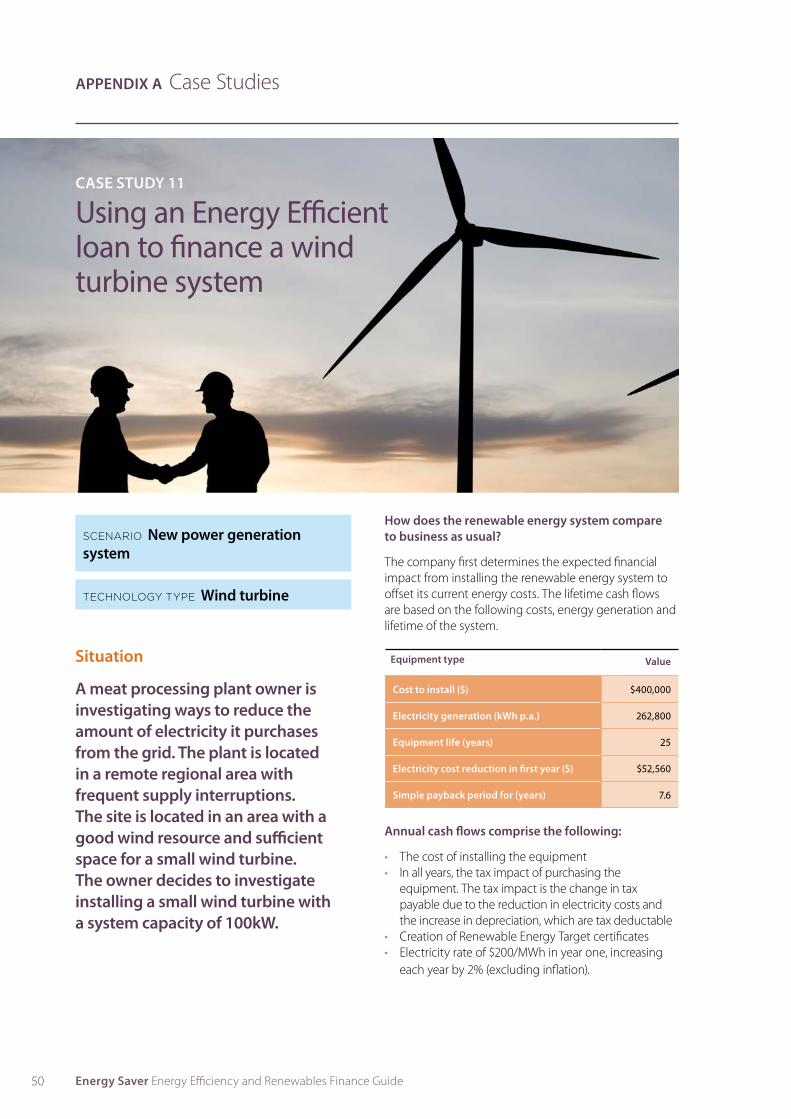
50 Energy Saver Energy Efficiency and Renewables Finance Guide
CASE STUDY 11
Using an Energy Efficient loan to finance a wind turbine system
Situation
A meat processing plant owner is investigating ways to reduce the amount of electricity it purchases from the grid. The plant is located in a remote regional area with frequent supply interruptions. The site is located in an area with a good wind resource and sufficient space for a small wind turbine. The owner decides to investigate installing a small wind turbine with a system capacity of 100kW.
How does the renewable energy system compare to business as usual?
The company first determines the expected financial impact from installing the renewable energy system to offset its current energy costs. The lifetime cash flows are based on the following costs, energy generation and lifetime of the system.
Equipment type Value
Cost to install ($) $400,000
Electricity generation (kWh p.a.) 262,800
Equipment life (years) 25
Electricity cost reduction in first year ($) $52,560
Simple payback period for (years) 7.6
APPENDIX A Case Studies
Annual cash flows comprise the following:
• The cost of installing the equipment• In all years, the tax impact of purchasing the
equipment. The tax impact is the change in tax payable due to the reduction in electricity costs and the increase in depreciation, which are tax deductable
• Creation of Renewable Energy Target certificates• Electricity rate of $200/MWh in year one, increasing
each year by 2% (excluding inflation).
TECHNOLOGY TYPE Wind turbine
SCENARIO New power generation system
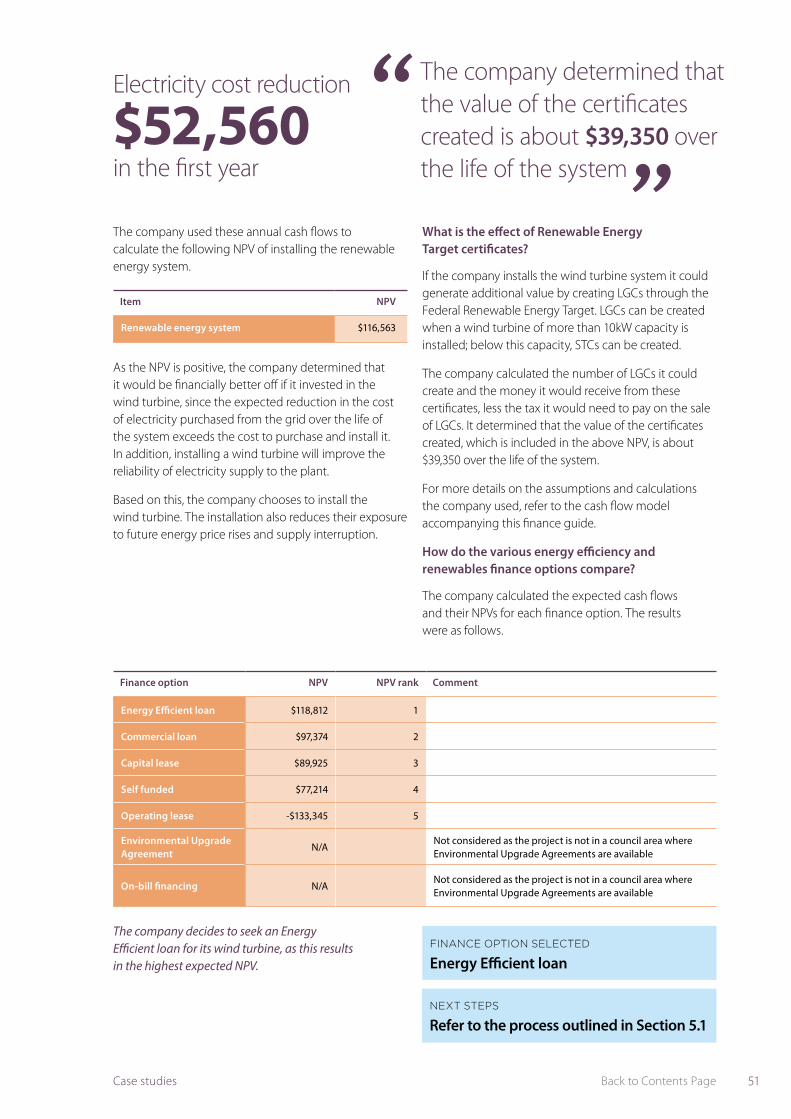
51Back to Contents Page
Finance option NPV NPV rank Comment
Energy Efficient loan $118,812 1
Commercial loan $97,374 2
Capital lease $89,925 3
Self funded $77,214 4
Operating lease -$133,345 5
Environmental Upgrade Agreement
N/ANot considered as the project is not in a council area where Environmental Upgrade Agreements are available
On-bill financing N/ANot considered as the project is not in a council area where Environmental Upgrade Agreements are available
The company decides to seek an Energy Efficient loan for its wind turbine, as this results in the highest expected NPV.
What is the effect of Renewable Energy Target certificates?
If the company installs the wind turbine system it could generate additional value by creating LGCs through the Federal Renewable Energy Target. LGCs can be created when a wind turbine of more than 10kW capacity is installed; below this capacity, STCs can be created.
The company calculated the number of LGCs it could create and the money it would receive from these certificates, less the tax it would need to pay on the sale of LGCs. It determined that the value of the certificates created, which is included in the above NPV, is about $39,350 over the life of the system.
For more details on the assumptions and calculations the company used, refer to the cash flow model accompanying this finance guide.
How do the various energy efficiency and renewables finance options compare?
The company calculated the expected cash flows and their NPVs for each finance option. The results were as follows.
Item NPV
Renewable energy system $116,563
As the NPV is positive, the company determined that it would be financially better off if it invested in the wind turbine, since the expected reduction in the cost of electricity purchased from the grid over the life of the system exceeds the cost to purchase and install it. In addition, installing a wind turbine will improve the reliability of electricity supply to the plant.
Based on this, the company chooses to install the wind turbine. The installation also reduces their exposure to future energy price rises and supply interruption.
The company used these annual cash flows to calculate the following NPV of installing the renewable energy system.
FINANCE OPTION SELECTED
Energy Efficient loan
NEXT STEPS
Refer to the process outlined in Section 5.1
The company determined that the value of the certificates created is about $39,350 over the life of the system
“”
Electricity cost reduction
$52,560 in the first year
Case studies

52 Energy Saver Energy Efficiency and Renewables Finance Guide
CASE STUDY 12
Using an Energy Services Agreement to finance a biogas system
SCENARIO New power generation system
TECHNOLOGY TYPE Biogas
Situation
A piggery with 15,000 standard pig units (SPU) is considering an anaerobic digester to generate biogas to offset the rising cost of natural gas. It wishes to combust this biogas in a co-generation system to generate electricity and heat; this would displace both electricity purchased from the grid and purchases of natural gas currently used for heating.
To generate the biogas, the pig manure and hosing water would be collected in static pits, located under the shed floors. Effluent would be released weekly from the static pits and conveyed into a primary anaerobic treatment pond. The biogas would be collected and transported to a co-generation system for combustion.
The piggery owner does not have experience with biogas generation and combustion and would like to outsource the detailed planning, implementation and operation of the equipment to a specialist.
How does the renewable energy system compare to business as usual?
The company first determines the expected financial impact from installing the renewable energy system to offset its current energy costs. The lifetime cash flows are based on the following costs, energy generation and lifetime of the system.
Item Value
Cost to install ($) $850,000
Electricity generation (kWh p.a.) 289,719
Reduction in gas purchases (GJ p.a.) 3,477
Equipment life (yrs) 20
Energy cost reduction in first year ($) $99,663
Simple payback period (yrs) 8.5
APPENDIX A Case Studies
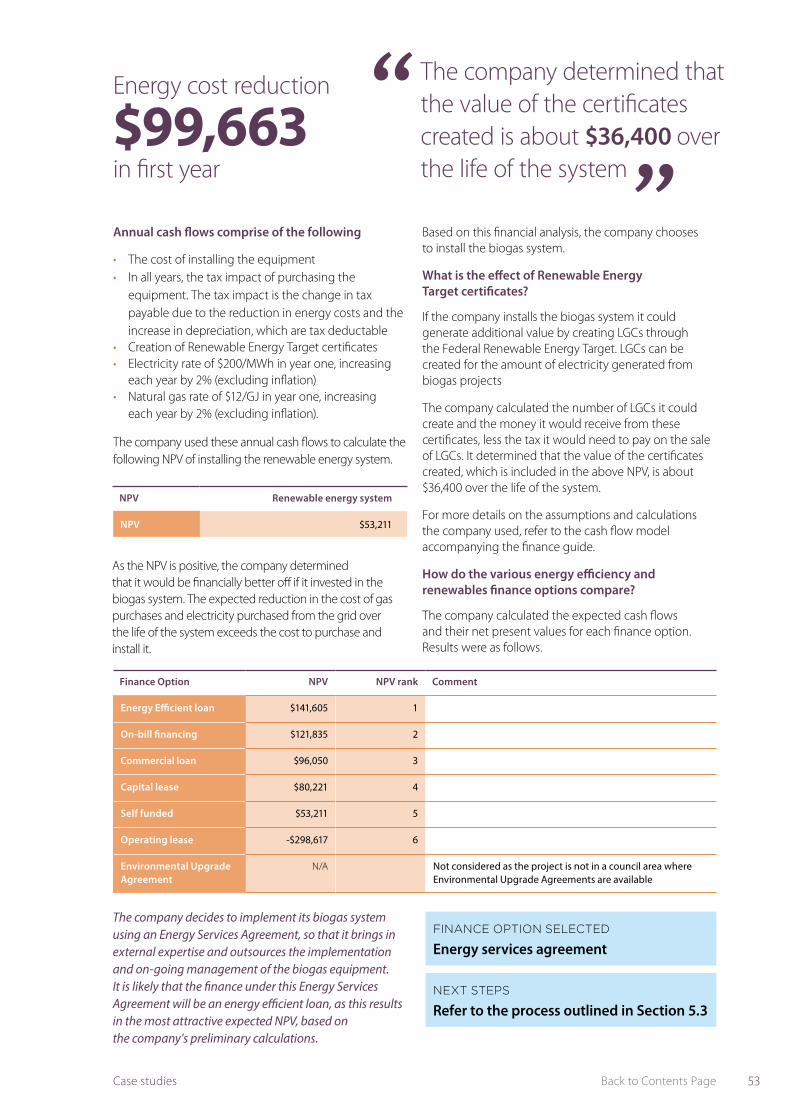
53Back to Contents PageCase studies
Annual cash flows comprise of the following
• The cost of installing the equipment• In all years, the tax impact of purchasing the
equipment. The tax impact is the change in tax payable due to the reduction in energy costs and the increase in depreciation, which are tax deductable
• Creation of Renewable Energy Target certificates• Electricity rate of $200/MWh in year one, increasing
each year by 2% (excluding inflation)• Natural gas rate of $12/GJ in year one, increasing
each year by 2% (excluding inflation).
The company used these annual cash flows to calculate the following NPV of installing the renewable energy system.
As the NPV is positive, the company determined that it would be financially better off if it invested in the biogas system. The expected reduction in the cost of gas purchases and electricity purchased from the grid over the life of the system exceeds the cost to purchase and install it.
NPV Renewable energy system
NPV $53,211
The company decides to implement its biogas system using an Energy Services Agreement, so that it brings in external expertise and outsources the implementation and on-going management of the biogas equipment. It is likely that the finance under this Energy Services Agreement will be an energy efficient loan, as this results in the most attractive expected NPV, based on the company’s preliminary calculations.
Finance Option NPV NPV rank Comment
Energy Efficient loan $141,605 1
On-bill financing $121,835 2
Commercial loan $96,050 3
Capital lease $80,221 4
Self funded $53,211 5
Operating lease -$298,617 6
Environmental Upgrade Agreement
N/A Not considered as the project is not in a council area where Environmental Upgrade Agreements are available
Based on this financial analysis, the company chooses to install the biogas system.
What is the effect of Renewable Energy Target certificates?
If the company installs the biogas system it could generate additional value by creating LGCs through the Federal Renewable Energy Target. LGCs can be created for the amount of electricity generated from biogas projects
The company calculated the number of LGCs it could create and the money it would receive from these certificates, less the tax it would need to pay on the sale of LGCs. It determined that the value of the certificates created, which is included in the above NPV, is about $36,400 over the life of the system.
For more details on the assumptions and calculations the company used, refer to the cash flow model accompanying the finance guide.
How do the various energy efficiency and renewables finance options compare?
The company calculated the expected cash flows and their net present values for each finance option. Results were as follows.
FINANCE OPTION SELECTED
Energy services agreement
NEXT STEPS
Refer to the process outlined in Section 5.3
Energy cost reduction
$99,663 in first year
The company determined that the value of the certificates created is about $36,400 over the life of the system
“”

54 Energy Saver Energy Efficiency and Renewables Finance Guide
Appendix B Financial appraisal methods
Method Definition and calculation Benefits Disadvantages
SIMPLE PAYBACK PERIOD
The simple payback period (SPB) is the time it takes for the upfront cost of an investment to be recovered from the savings generated by the investment.
A business should invest in a project if it has a SPB less than the target payback period.
The SPB is calculated as follows:
SPB = Upfront investment Savings per period
Very simple to calculate and understand.
Most useful when a business has a very limited amount of money to invest. In this case, it is generally very important to recover upfront investment costs quickly so other investments can be made
Does not consider the time value of money, that is, that cash received today is more valuable than the same amount of cash received in the future.
Does not consider the value of cash flows that occur after the payback period e.g. a project delivering the same cash inflows for five years after the payback period is more valuable than one delivering the same cash flow for two years after the payback period.
NET PRESENT VALUE
The NPV is the present value of all cash flows generated by a project. All cash inflows and outflows are discounted to present value using a target rate of return. The target rate of return is the return you need from an investment and is generally based on the interest rate for any debt you have and the return required by the owners of the business.
A business should invest in a project if its NPV is positive or zero, as this means the project delivers the required return on investment or more. If selecting between projects, invest in those projects with the highest NPVs.
The NPV is calculated as follows:
Where:C0 = upfront investmentCt = cash flow in period tt = the time periodn = the total number of periodsr = the discount rate
Accounts for the time value of money.
Easy to understand.
Determines how profitable a project will be in comparison to alternatives.
Sensitive to the discount rate used, which is especially important as each business will have its own equity return expectations. Running sensitivity analyses is important.
The table below provides a summary of the financial appraisal methods commonly used in the evaluation of energy projects, their advantages and disadvantages

55Back to Contents PageFinancial appraisal methods
INTERNAL RATE OF RETURN
The IRR is the discount rate that makes the net present value of all cash flows from an investment equal to zero.
IRRs can be used to prioritise competing projects; generally the higher the IRR, the more attractive the project. A business should invest in projects with an IRR above the required rate of return.
The IRR is calculated by determining the discount rate for which the NPV is zero, as follows:
Where:C0 = upfront investmentCt = cash flow in period tt = the time periodn = the total number of periodsr = the discount rate
Allows all projects to be compared against the same benchmark – the required return.
Most useful when assessing individual projects, not those which are mutually exclusive.
Does not determine the value that a project will add to a firm. Two projects with the same IRR can be of different sizes and provide significantly different cash inflows to a business over their lifetimes. As a result, it is difficult to select between mutually exclusive projects using IRRs.
Is difficult to calculate if there are negative cash flows during the project’s life (e.g. due to replacement of large parts).
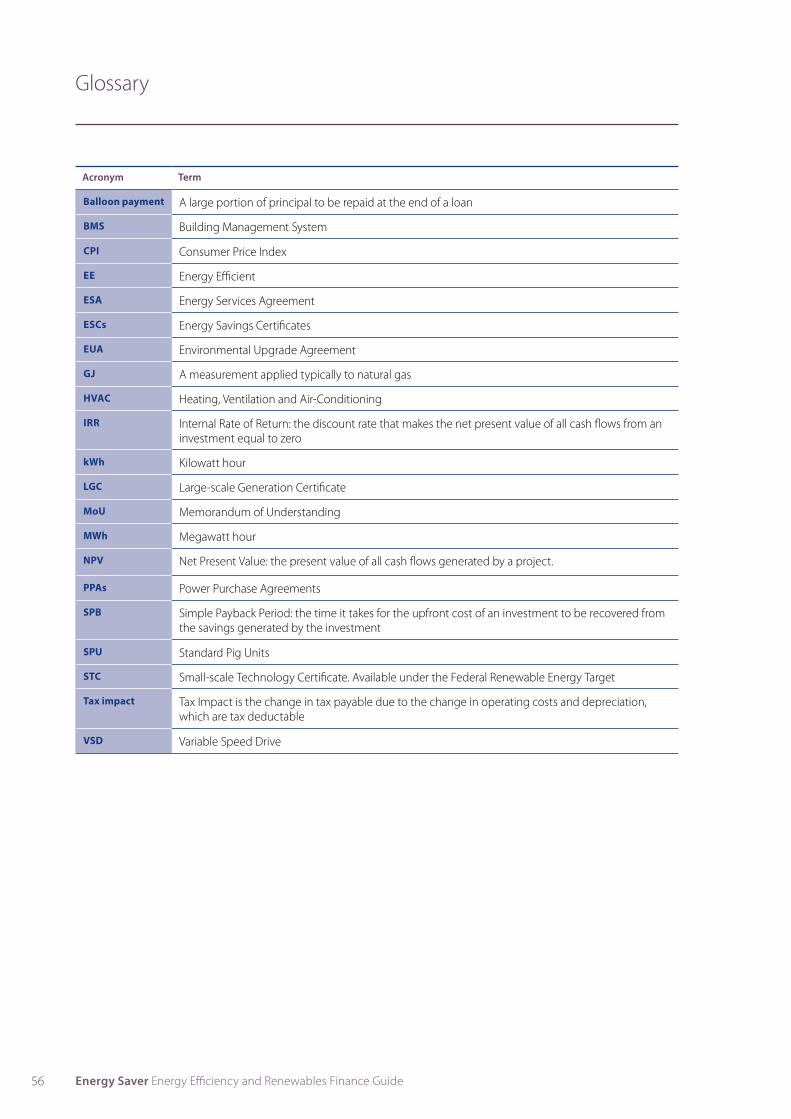
56 Energy Saver Energy Efficiency and Renewables Finance Guide
Acronym Term
Balloon payment A large portion of principal to be repaid at the end of a loan
BMS Building Management System
CPI Consumer Price Index
EE Energy Efficient
ESA Energy Services Agreement
ESCs Energy Savings Certificates
EUA Environmental Upgrade Agreement
GJ A measurement applied typically to natural gas
HVAC Heating, Ventilation and Air-Conditioning
IRR Internal Rate of Return: the discount rate that makes the net present value of all cash flows from an investment equal to zero
kWh Kilowatt hour
LGC Large-scale Generation Certificate
MoU Memorandum of Understanding
MWh Megawatt hour
NPV Net Present Value: the present value of all cash flows generated by a project.
PPAs Power Purchase Agreements
SPB Simple Payback Period: the time it takes for the upfront cost of an investment to be recovered from the savings generated by the investment
SPU Standard Pig Units
STC Small-scale Technology Certificate. Available under the Federal Renewable Energy Target
Tax impact Tax Impact is the change in tax payable due to the change in operating costs and depreciation, which are tax deductable
VSD Variable Speed Drive
Glossary

57Back to Contents PageFinancial appraisal methods
biogas system 11, 12, 17, 52, 53
building management system 11, 17, 46, 47
capital lease 6, 9, 10, 11, 15, 25, 29, 38, 39
chillers 11, 17, 25, 34, 36, 37
commercial loan 6, 10, 11, 12, 15, 18, 21, 29, 42, 43
compressed air 11, 17, 25, 44, 45
Energy Efficient loan 6, 10, 23, 29, 35, 51
Energy Savings Certificate 14, 22, 24, 26, 31, 33, 35, 37, 39, 41, 43, 45, 47
Energy Savings Scheme 14, 31, 33, 35, 37, 39, 41, 43, 45, 47
energy services agreement 7, 10, 11, 15, 16, 20
Environmental Upgrade Agreement 7, 10, 11, 12, 16, 18, 19, 21, 29, 30, 31, 44, 45, 48, 49
finance options 5, 6
heating ventilation and air-conditioning 11, 17, 25, 30, 31
lighting upgrade 6, 11, 17, 25, 32
variable speed drives 11, 17, 30, 42, 43
motors 11, 17, 25, 38, 40, 41, 42, 43
on-bill financing 7, 10, 11, 12, 15, 16, 19, 27, 29, 32, 33
operating lease 6, 10, 11, 12, 15, 16, 25, 40, 41
power purchase agreements 8, 24
refrigeration 11, 17, 25, 34
self-funded 6, 15, 16
solar PV 8, 11, 17, 24, 48
voltage optimisation 11, 17, 25, 38, 39
wind turbine 17, 50
Index