
Received: October 13, 2020. Revised: December 24, 2020. 236
International Journal of Intelligent Engineering and Systems, Vol.14, No.2, 2021 DOI: 10.22266/ijies2021.0430.21
Engagement Detection through Facial Emotional Recognition Using a Shallow
Residual Convolutional Neural Networks
Michael Moses Thiruthuvanathan1* Balachandran Krishnan1 Madhavi Rangaswamy2
1Department of Computer Science and Engineering, School of Engineering and Technology,
CHRIST (Deemed to be University), Bangalore, India 2Department of Psychology, School of Social Sciences, CHRIST (Deemed to be University), Bangalore, India
* Corresponding author’s Email: [email protected]
Abstract: Online teaching and learning has recently turned out to be the order of the day, where majority of the learners
undergo courses and trainings over the new environment. Learning through these platforms have created a requirement
to understand if the learner is interested or not. Detecting engagement of the learners have sought increased attention
to create learner centric models that can enhance the teaching and learning experience. The learner will over a period
of time in the platform, tend to expose various emotions like engaged, bored, frustrated, confused, angry and other
cues that can be classified as engaged or disengaged. This paper proposes in creating a Convolutional Neural Network
(CNN) and enabling it with residual connections that can enhance the learning rate of the network and improve the
classification on three Indian datasets that predominantly work on classroom engagement models. The proposed
network performs well due to introduction of Residual learning that carries additional learning from the previous batch
of layers into the next batch, Optimized Hyper Parametric (OHP) setting, increased dimensions of images for higher
data abstraction and reduction of vanishing gradient problems resulting in managing overfitting issues. The Residual
network introduced, consists of a shallow depth of 50 layers which has significantly produced an accuracy of 91.3%
on ISED & iSAFE data while it achieves a 93.4% accuracy on the Daisee dataset. The average accuracy achieved by
the classification network is 0.825 according to Cohens Kappa measure.
Keywords: Student engagement detection, Residual networks, Convolutional neural network, Emotion detection,
Facial expression recognition.
1. Introduction
Recognition of user interaction becomes highly
important in a digital environment that is filled with
information of consumers. It is important for
applications to be “aware” of the user's presence
when delivering information. Affect is a
psychological process used to define the feeling and
its external presentation. Affective computing aims at
designing systems and tools capable of detecting,
reading and simulating human effects across various
sources such as face, speech and biological signals.
Due to the availability of online resources to learn
during these pandemic times, students are involved in
attending online classes. Virtual learners take part in
numerous instructional events including reading,
writing, viewing video lessons, virtual exams and
online meetings. They display different degrees of
interaction during involvement in these educational
events, such as fatigue, annoyance, excitement,
indifference, uncertainty, and advantage in learning.
To provide customized pedagogical support through
online learner initiatives, it is critical that online
educators reliably and effectively detect the state of
involvement of their online learners. In the sense of
online learning this paper provides a study of the state
of the art in interaction identification. While students
take part in these online classes, computing is
required to estimate the valence and arousal to
analyse the engagement of the users by capturing
facial features. Enormous efforts have been made to
develop reliable automated Facial Expression
Recognition (FER) systems for use in machines and

Received: October 13, 2020. Revised: December 24, 2020. 237
International Journal of Intelligent Engineering and Systems, Vol.14, No.2, 2021 DOI: 10.22266/ijies2021.0430.21
devices that are aware of the impact. These programs
can more easily grasp the individual feelings and
communicate with the consumer. Current
technologies, however, are yet to achieve the
maximum emotional and social capacities needed to
create a rich and stable Human Machine Interaction
(HMI). It is primarily due to the reality that HMI
devices need to communicate with humans in an
unregulated atmosphere (aka wild setting) where
scene illumination, camera orientation, picture size,
landscape, user-head posture, gender and ethnicity
can differ considerably.
Furthermore, there are inadequate variations and
annotated samples in the data that drive the creation
of affective computing systems and particularly FER
systems that can be used in developing these systems.
Studies in late psychology showed that people
basically convey their feelings externally. Study of
facial expression is an essential part of genuinely rich
Man-Machine Frameworks on communication
(MMI), as it uses nonverbal signs all over to measure
the user's enthusiasm. This work emphasises on
creation of Neural Networks to detect user emotions
and User engagement by utilising most commonly
used datasets. In the recent literature and the work
carried by various authors for user engagement
detection, Convolutional Neural Networks (CNN)
and Residual Networks (ResNet) are considerably
used to improve the outcomes in emotional detections.
Residual Networks utilizes skip networks that can
connect between layers to enhance the learning
pattern of the network. This rest of the paper is
organised as follows, Section 2 describes the Related
Work and Section 3 explains the Datasets. Section 4
explains the Residual Network. The details of
experimentation are provided in section 5. The
detailed Results are in Section 6. Finally, Section 7
concludes the paper.
2. Related works
In literature, there are several models to measure
emotional behaviours: 1) definite models that select
the emotion or affect from a list of categories of
affectivity, including six specific emotions identified
by Ekman etc. 2) Dimensional model where meaning,
such as a valence and arousal, is selected over a
sustained emotional scale 3) Facial Action coding
systems, in the case of Action Units (AUs), all
potential facial behaviours are identified. 4) Tagged
Emotions, these are emotions that are grouped
together based on Eckman’s categorical model to
create emotional tags as combinational outcomes [1].
The authors have grouped the emotions into four
primary categories of learning environments: 1)
boredom, 2) engaged, 3) frustrated and 4) confused
Few authors have used combinational methods
explicitly by combining two emotions that became
unable to interpret mixed feelings into a limited
collection of words sufficiently [2]. On the other hand,
the dimensional model of affect can discern between
slightly different displays of affect and represent
minor changes in the intensity of each emotion on a
continuous scale, such as valence and anticipation.
Valence reflects how positive or negative an event is
and excitement reflects whether an event is exciting,
restless or calm.
In the continuous domain, dimensional
perception of affect encompasses the strength and
specific types of emotion. However, comparatively
fewer studies have been performed to establish
automatic algorithms for calculating affect using a
cumulative dimensional model (e.g. valence and
arousal). One of the key reasons for this is that
building a massive database to cover the entire
continuous space of valence and anticipation is costly
and there are very few annotated face databases in the
continuous domain. Facial Expression Recognition
(FER) for different domains use supervised/semi
supervised learning methods for automated affective
computing. They require labelled dataset for training
and testing, these datasets are generally created by
subjects based on posed actions and also expressions
extracted from videos enacted by various actors.
Recent studies of the education sectors have
initiated to impart knowledge through online portals.
These methods have become challenging in
analysing the engagement levels of the students while
teaching and learning is conducted through online
portals [2]. Facial expression and affect datasets in
the wild have been receiving a lot of attention
recently. These datasets are either collected from
movies or the world wide web and well labelled [3-
5], and varied dimensions [6]. However, they cover
just one model of affect, have a small range of
subjects, or include little instances of certain
emotions like disgust and sadness. A broad archive,
with such a substantial quantity of object variations
in wild condition covering numerous affect models is
therefore, a requirement. Though there are several
models for affect computing for emotional
recognition in videos or single images, object
localization and continuous emotional analysis has
always been a challenging task due to face detection,
posture recognition, segmentation, human pose,
object association and for affective state
classification using facial expressions in a cluttered
environment. For the better growth of Massive Open
Online Courses (MOOCs), there is a need to design
smart interfaces that can simulate the interactions

Received: October 13, 2020. Revised: December 24, 2020. 238
International Journal of Intelligent Engineering and Systems, Vol.14, No.2, 2021 DOI: 10.22266/ijies2021.0430.21
between the instructor and pupil. The principal
disadvantage of existing e-learning systems is, that
they cannot have direct input in real time Students (or
instructors) during the delivery of the content,
compared with traditional instruction in the
classroom., MOOCs have a 91-93% dropout rate [7].
Understanding user engagement at different junctures
of the e-learning experience can help design intuitive
interfaces that support students' better absorption of
knowledge and personalize learning. The user 's
understanding of affective state is an important
computer vision sub-area, centred for a long time on
datasets of the seven basic terms: neutral, happiness,
sadness, anger, disgust, surprise and contempt [8]. In
recent years, the data collection has been extended to
cover successful states in terms of dimension
representations [9-11], but the vast subtleties in
affective states allow datasets for particular goals to
be established. This strategy, which is backed by
recent developments, including, tends to promote
measurable outcomes. It has been found that in e-
learning and classroom settings students often prefer
to communicate only a few effective conditions.
These included 7 fundamental emotions and a
few emotions that are concentrated on learning.
Distinct works focus on hand gesture [12], facial
recognition, affective states, however there are a very
few works on elaborating the available dataset on
assessing various cognitive levels of understanding
students emotional state for engagement and
distraction. There are distinctive doubts on the
curation and usage of facial data in facial recognition
[13]. Few researchers have captured emotions under
controlled environments while the subjects watch
videos of different emotions [14-18]. With such
methods being able to collect a vast number of frames,
the variety of such repositories is restricted due to the
number of participants, head orientation, and
environmental exposures [21, 22].
Some of the works carried out on ISED datasets
have predominantly used CNN as the crux, while
some modifications on the network is incorporated to
enhance the accuracy of the algorithm [25-26].
Feature extraction methods involving Local
prominent directional patterns and local directional
structural pattern have been used. However, these
methods lack in efficient classification accuracy
when compared to the CNN’s [25-27]. Many authors
use modified CNN in order to achieve greater results
by adding multiple deep layers that enhance the
performance of the system [29-31]. CNN’s are prone
to issues of vanishing gradients that leads to accuracy
loss by curating the training into an expanding
memory requirement. In all the major works carried
out mentioned in this section, there is a need to
improve the scope of detection rate and the precision
of detection percentage for individual emotions. The
need for a system that can reduce the error rates while
training is important as the connections established in
each layer kneads to weight updating and
approximation to improve detection in the data.
This paper aims in analysing the Residual
network’s performance with respect to parameterized
study that can establish the significance of
classification model on three established datasets.
Also, this work would compare the results with the
existing models in terms of accuracy.
3. Datasets
Data for any work is pivotal and all the
experiments are based on the data. There are critical
datasets that emulate emotions and help in creating
models for detecting emotions for various
applications. Classification problems to detect
emotions have recently been a field of study in
various prominent datasets that contribute to the
understanding of emotions. Though there are several
datasets that help in analysing the face for emotions,
there are few datasets for Indian Origin faces for a
classroom environment. The learning environments
not only are limited to the basic emotions also can be
extended to various classes of classifications that can
influence the accurate measurement of engagement
in a class. This work focusses on elaborating the
emotions by using the available dataset for Indian
origin by combining basic classes, Engagement
recognition and Learning centered emotions. The
following datasets are used for this study are DAISEE,
iSAFE and ISED databases. Table 1 lists the details
of the available datasets for affectnet.
4. The residual network
In this work the priority is to elaborate the feature
extraction process by creating a space where a
particular emotion exposed by a human is discrete.
This is achieved by extending the emotions into 10
classes and establishing a model that can eliminate
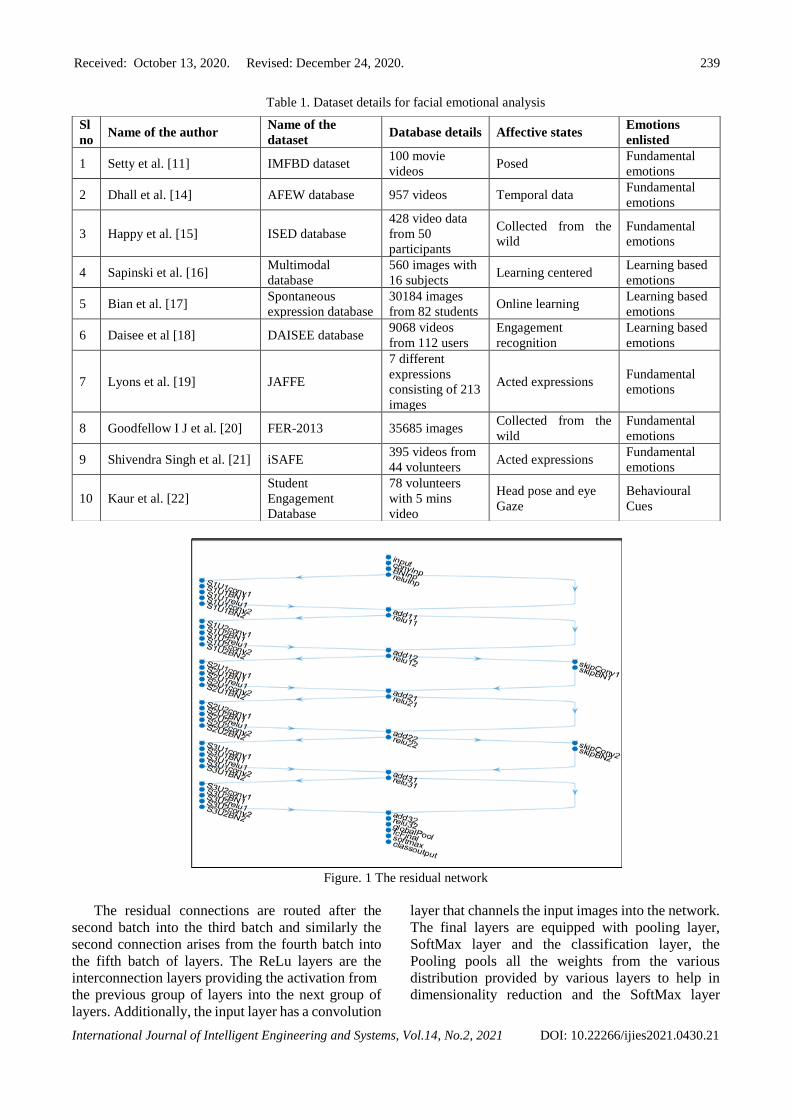
the bias of learning and detection. network that was
used for emotional analysis. This network is grouped
as convolutional layers on the left of the figure and
the Skip network on the right. The middle layers
represent the connection between the residual
connections and the convolution layers.
SIU1CONV1 represents one single convolutional
unit and S1U1BN1 represents the Batch
normalization layer. Each of these layers are grouped
into groups, each consisting of two convolutional and
batch normalization layers.
Received: October 13, 2020. Revised: December 24, 2020. 239
International Journal of Intelligent Engineering and Systems, Vol.14, No.2, 2021 DOI: 10.22266/ijies2021.0430.21
Table 1. Dataset details for facial emotional analysis
Figure. 1 The residual network
The residual connections are routed after the
second batch into the third batch and similarly the
second connection arises from the fourth batch into
the fifth batch of layers. The ReLu layers are the
interconnection layers providing the activation from
the previous group of layers into the next group of
layers. Additionally, the input layer has a convolution
layer that channels the input images into the network.
The final layers are equipped with pooling layer,
SoftMax layer and the classification layer, the
Pooling pools all the weights from the various
distribution provided by various layers to help in
dimensionality reduction and the SoftMax layer
Sl
no Name of the author
Name of the
dataset Database details Affective states
Emotions
enlisted
1 Setty et al. [11] IMFBD dataset 100 movie
videos Posed
Fundamental
emotions
2 Dhall et al. [14] AFEW database 957 videos Temporal data Fundamental
emotions
3 Happy et al. [15] ISED database
428 video data
from 50
participants
Collected from the
wild
Fundamental
emotions
4 Sapinski et al. [16] Multimodal
database
560 images with
16 subjects Learning centered
Learning based
emotions
5 Bian et al. [17] Spontaneous
expression database
30184 images
from 82 students Online learning
Learning based
emotions
6 Daisee et al [18] DAISEE database 9068 videos
from 112 users
Engagement
recognition
Learning based
emotions
7 Lyons et al. [19] JAFFE
7 different
expressions
consisting of 213
images
Acted expressions Fundamental
emotions
8 Goodfellow I J et al. [20] FER-2013 35685 images Collected from the
wild
Fundamental
emotions
9 Shivendra Singh et al. [21] iSAFE 395 videos from
44 volunteers Acted expressions
Fundamental
emotions
10 Kaur et al. [22]
Student
Engagement
Database
78 volunteers
with 5 mins
video
Head pose and eye
Gaze
Behavioural
Cues
Received: October 13, 2020. Revised: December 24, 2020. 240
International Journal of Intelligent Engineering and Systems, Vol.14, No.2, 2021 DOI: 10.22266/ijies2021.0430.21
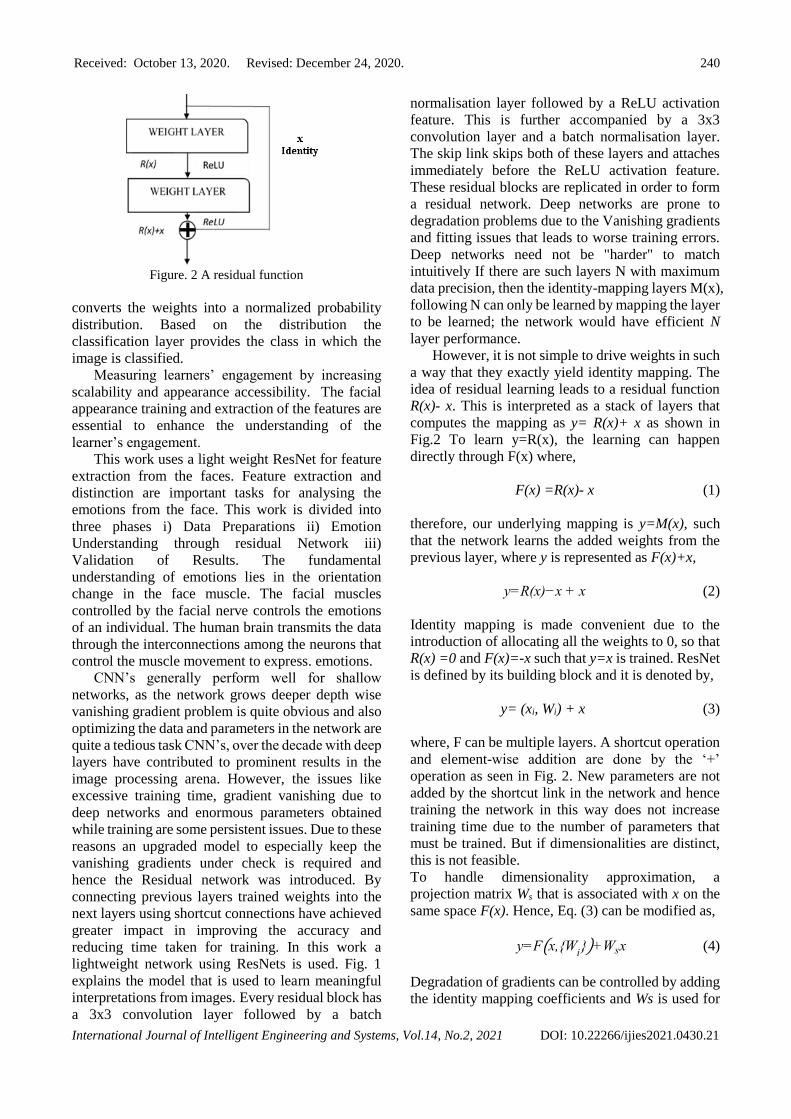
Figure. 2 A residual function
converts the weights into a normalized probability
distribution. Based on the distribution the
classification layer provides the class in which the
image is classified.
Measuring learners’ engagement by increasing
scalability and appearance accessibility. The facial
appearance training and extraction of the features are
essential to enhance the understanding of the
learner’s engagement.
This work uses a light weight ResNet for feature
extraction from the faces. Feature extraction and
distinction are important tasks for analysing the
emotions from the face. This work is divided into
three phases i) Data Preparations ii) Emotion
Understanding through residual Network iii)
Validation of Results. The fundamental
understanding of emotions lies in the orientation
change in the face muscle. The facial muscles
controlled by the facial nerve controls the emotions
of an individual. The human brain transmits the data
through the interconnections among the neurons that
control the muscle movement to express. emotions.
CNN’s generally perform well for shallow
networks, as the network grows deeper depth wise
vanishing gradient problem is quite obvious and also
optimizing the data and parameters in the network are
quite a tedious task CNN’s, over the decade with deep
layers have contributed to prominent results in the
image processing arena. However, the issues like
excessive training time, gradient vanishing due to
deep networks and enormous parameters obtained
while training are some persistent issues. Due to these
reasons an upgraded model to especially keep the
vanishing gradients under check is required and
hence the Residual network was introduced. By
connecting previous layers trained weights into the
next layers using shortcut connections have achieved
greater impact in improving the accuracy and
reducing time taken for training. In this work a
lightweight network using ResNets is used. Fig. 1
explains the model that is used to learn meaningful
interpretations from images. Every residual block has
a 3x3 convolution layer followed by a batch
normalisation layer followed by a ReLU activation
feature. This is further accompanied by a 3x3
convolution layer and a batch normalisation layer.
The skip link skips both of these layers and attaches
immediately before the ReLU activation feature.
These residual blocks are replicated in order to form
a residual network. Deep networks are prone to
degradation problems due to the Vanishing gradients
and fitting issues that leads to worse training errors.
Deep networks need not be "harder" to match
intuitively If there are such layers N with maximum
data precision, then the identity-mapping layers M(x),
following N can only be learned by mapping the layer
to be learned; the network would have efficient N
layer performance.
However, it is not simple to drive weights in such
a way that they exactly yield identity mapping. The
idea of residual learning leads to a residual function
R(x)- x. This is interpreted as a stack of layers that
computes the mapping as y= R(x)+ x as shown in
Fig.2 To learn y=R(x), the learning can happen
directly through F(x) where,
F(x) =R(x)- x (1)
therefore, our underlying mapping is y=M(x), such
that the network learns the added weights from the
previous layer, where y is represented as F(x)+x,
y=R(x)−x + x (2)
Identity mapping is made convenient due to the
introduction of allocating all the weights to 0, so that
R(x) =0 and F(x)=-x such that y=x is trained. ResNet
is defined by its building block and it is denoted by,
y= (xi, Wi) + x (3)
where, F can be multiple layers. A shortcut operation
and element-wise addition are done by the ‘+’
operation as seen in Fig. 2. New parameters are not
added by the shortcut link in the network and hence
training the network in this way does not increase
training time due to the number of parameters that
must be trained. But if dimensionalities are distinct,
this is not feasible.
To handle dimensionality approximation, a
projection matrix Ws that is associated with x on the
same space F(x). Hence, Eq. (3) can be modified as,
y=F(x,{Wi})+Wsx (4)
Degradation of gradients can be controlled by adding
the identity mapping coefficients and Ws is used for

Received: October 13, 2020. Revised: December 24, 2020. 241
International Journal of Intelligent Engineering and Systems, Vol.14, No.2, 2021 DOI: 10.22266/ijies2021.0430.21
matching the dimensions of the previous layer with
the next layer. Multiple convolutional layers are
represented with the function F(x,{Wi}). The
element-wise addition is performed on two feature
maps, channel by channel. Table. 2 illustrates the
details of various parameter setting used in the
network. Eq. (5), explains the CNN process, in
which: n is the size of the image, p is the padding size,
f is the size of the filter, nc is the number of channels,
nf is the number of filters and s is the stride.
convolutions are carried out on each image based on
n, nc and f, preserving the relation between pixels and
creating a matrix of feature maps. s is used to shift the
filter over the image pixels p.
[n,n,nc]. [f,f,nc]= [[n+2p-f
s+1] [
n+2p-f
s+1] ,nf] (5)
After two layers of convolution Eq. (4) is introduced
as a shortcut layer to carry information from the
previous layers into the next layer. The residual
connections help in associating the prediction values
that were estimated by the previous layers as an input
into the next layer. The residual function computes
and matches the actual value with the predicted value.
If the value of x is equal to the actual value then the
residual function is zero resulting in a higher
derivative. along with the residual connections batch
normalization is also carried out in the block to
normalize the values to a threshold where the
derivatives are not too small to be removed due to
least significance. All the layers, parameters
mentioned are the outcome of OHP. This tuning helps
in assembling the required number of layers to extract
meaningful interpretations of mid-level and high-
level features after each iteration to create a pool of
weighted probabilities. These probabilities are used
to classify the images during validation and testing.
5. Experimentation
The Residual Network was used on the following
datasets, ISED, iSAFE and Daisee Datasets. The
network is trained with images of the faces of Indian
origin. Since these images are created by the authors
for an E-learning environment the same trained
network was used to create an observation on the
Online classes that are being conducted during these
pandemic years. All the experiments were carried out
using Intel Xeon E3 based workstations, NVIDIA
Gforce GTX graphics card on a 32 GB RAM and
Matlab2019b was used as the platform to train and
validate the network. Images from the testing data is
drawn at random and fed into the network, these
Table 1. Parameter setting detail
Parameter’s Name Value
Networks Layers 50
InitialLearnRate(Lr) 1.00E-04
Regularization Function l2Regularization
GradientThreshold 'l2norm'
MaxEpochs 40
MiniBatchSize(Bs) 32
Verbose Frequency 50
Validation Frequency (Vf) 500
Shuffle 'every-epoch'
Padding Direction 'right' (1,1)
Filter Size (3 x 3)
Stride (1,1)
Number of Filters(layer) 8,16,32,64
Optimiser SGDM
Learning Rate Scheduler Piecewise
Image size 192 x 192 x 3
Learning Droprate 60 iterations
images are tested for True Positive, false positive,
True negative or false. The images are resized and
fed into the Residual network with the sizes of 128 x
128 x 3 dimensions.
Images from each dataset for training are 508
images from ISED and iSAFE datasets that trains
data for 7 classes. Similarly, 5295 images are used for
training data from Daisee dataset. The network was
created from the scratch and the network was used to
improve the efficiency of emotional understanding.
However, every time training is carried out on the
datasets, the learning rate of the network is set to
1.00E-04 this helps the network to learn features from
the inception. The network uses a piecewise learning
rate scheduler, this enhances the learning rate by
decreasing the learning rate often and optimizing the
network for a higher degree of weight vector
distribution. The data is shuffled after each epoch and
the mini batch size was fixed at 32. Fig. 2 elicits the
details of the network where two skip networks are
introduced. The plain network had 40 layers, while
the introduction of the residual layers has increased
the number of layers to 50.
The number of layers is still lesser than the
prominent networks like ResNet 32, ResNet50 and
Resnet 101. The pooling layers help in reducing the
dimensionality of the features extracted, while the
ReLu layers were used in the network as activation
functions. The layers were not chosen at random,
however the layers were precisely placed after
several iterations and changes to the entire network
based on the performances based on OHP. Deep
Networks with higher number of layers and residual
networks and hence achieving the desired results for
the data took a long time to reach an optimum

Received: October 13, 2020. Revised: December 24, 2020. 242
International Journal of Intelligent Engineering and Systems, Vol.14, No.2, 2021 DOI: 10.22266/ijies2021.0430.21
Figure. 3 Training & validation accuracy for daisee
dataset
solution and also the training accuracy was lesser
than 70%. This was due to the increase in feature
pooling requirement and gradient descent issue was a
common problem.
The intent is to create this optimized network for
emotional understanding through multiple classes.
The data available is imbalanced and hence F1 score
is used to determine the efficiency of the algorithm.
The training data validation was conducted after 500
iterations, that provide the information about the
training progress, parallelly once the loss function
was also measured. The details of the training are
provided in Fig. 3. The data available is imbalanced
hence F1 score is used to determine the efficiency of
the algorithm. The training data validation was
conducted after 500 iterations, which provides the
information about the training progress, parallelly the
loss function was also measured. The details of the
training are provided in Fig. 3. The Stochastic
Gradient Descent for the Function at x is,
f(x)=1
n∑ f
i(x)
𝑛
i=1
(6)
Stochastic gradient descent (SGD) reduces
computational cost at each iteration for an unbiased
estimate of the gradientf(x). At each iteration the
SGD is uniformly sampled to an index of i{1,…,n}
at random, and gradient ∇fi(x) is computed to update
x:
x←[x-ηfi(x)] (7)
Replacing η with a learning rate η(t) that is time
dependent improves in controlling the convergence
rate of an algorithm that should produce optimized
outcomes. The piecewise constant for a time-based
SGD is defined as in Eq. (8). η(t) reduces the learning
rate whenever the progress towards optimization is
not improving.
η(t)= ηi if ti ≤ t ≤ ti+1 (8)
Eq. (9) is used to calculate the efficiency of the
classifier based on the confusion matrix generated
based on the classifier on the test data. Kappa
Statistics is a measure that calculates how closely the
instances are classified by the algorithm that matched
the data labelled as ground truth also controlling the
accuracy of a random classifier as measured by the
expected accuracy.
Kappa (κ)=po - pe
1- pe
(9)
Where, po is the observed agreement, and pe is the
expected agreement. It recommends the
performances of the classifier over a classification
that is generated merely based on a guess at random
according to the frequency of each class. Accuracy,
Precision, Recall, Sensitivity, Specificity and F1
score are used as metrics gauge the performance of
the classifier for each class on the three datasets. The
iSAFE and ISED datasets are combined together for
7 classes as a single database and the Daisee Dataset
uses 4 classes. Cohens-Kappa is also used to measure
the efficiency of the classifier as it is a multiclass and
imbalanced data.
6. Results and discussions
The training samples are shuffled and taken at
random after every epoch to reduce over-fitting or
under-fitting issues. The Training Accuracy(T) and
Validation Accuracy(V) is plotted and visualized for
the efficiency index of the model after every iteration,
Fig. 3, illustrates the training and validation results
acquired using the Residual Network model. The
Validation frequency (Vf) is an important parameter
as it tests the model’s training efficiency in regular
intervals. The value for Vf , is set for every 500
iterations for this model. A weighted average of the
scores independently derived from individual layers
using the posterior class probabilities is cumulated to
improve Learning rate and reduce Validation Loss.
These weights are then trained for face image on
a cross dataset, which helps in reducing the blindness
of the model to newer data. However, while
comparing with the other methods as mentioned in
Table 3, Emonet performs with an accuracy higher
than the majority of the work carried out earlier. In
many of the dataset’s individual classifications, there
have been instances where emotions have been
wrongly classified, however individualistic and
Received: October 13, 2020. Revised: December 24, 2020. 243
International Journal of Intelligent Engineering and Systems, Vol.14, No.2, 2021 DOI: 10.22266/ijies2021.0430.21
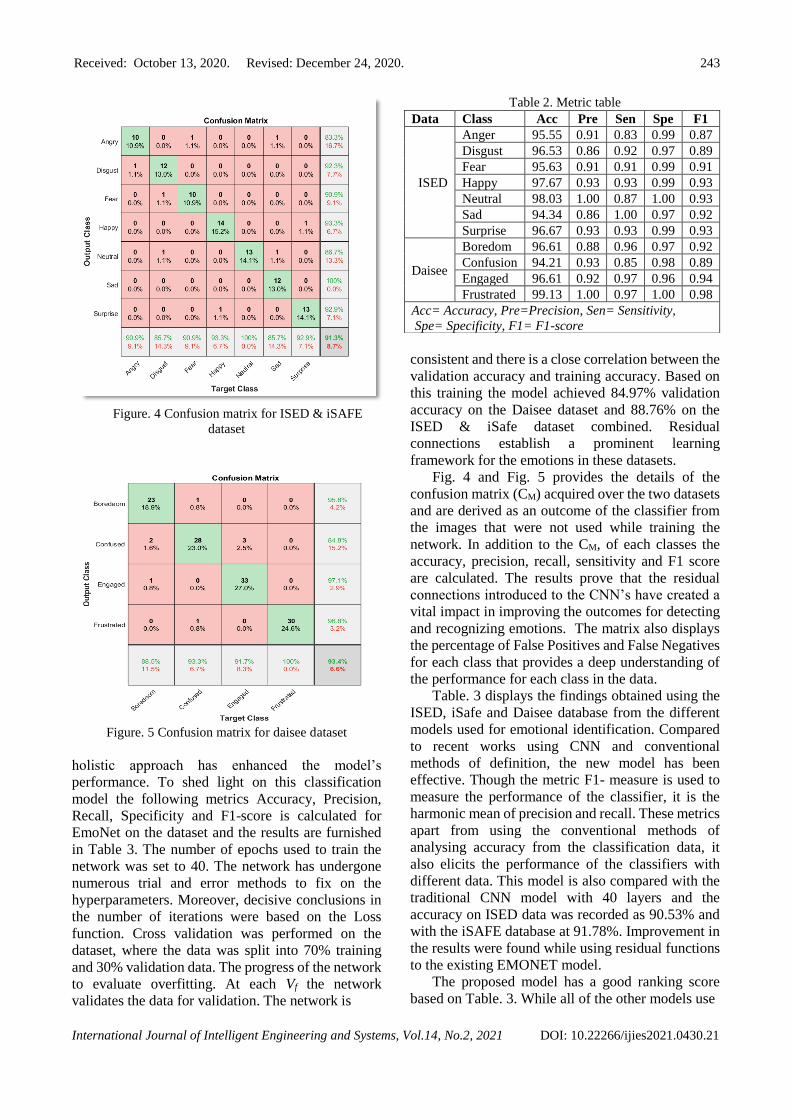
Figure. 4 Confusion matrix for ISED & iSAFE
dataset
Figure. 5 Confusion matrix for daisee dataset
holistic approach has enhanced the model’s
performance. To shed light on this classification
model the following metrics Accuracy, Precision,
Recall, Specificity and F1-score is calculated for
EmoNet on the dataset and the results are furnished
in Table 3. The number of epochs used to train the
network was set to 40. The network has undergone
numerous trial and error methods to fix on the
hyperparameters. Moreover, decisive conclusions in
the number of iterations were based on the Loss
function. Cross validation was performed on the
dataset, where the data was split into 70% training
and 30% validation data. The progress of the network
to evaluate overfitting. At each Vf the network
validates the data for validation. The network is
Table 2. Metric table
consistent and there is a close correlation between the
validation accuracy and training accuracy. Based on
this training the model achieved 84.97% validation
accuracy on the Daisee dataset and 88.76% on the
ISED & iSafe dataset combined. Residual
connections establish a prominent learning
framework for the emotions in these datasets.
Fig. 4 and Fig. 5 provides the details of the
confusion matrix (CM) acquired over the two datasets
and are derived as an outcome of the classifier from
the images that were not used while training the
network. In addition to the CM, of each classes the
accuracy, precision, recall, sensitivity and F1 score
are calculated. The results prove that the residual
connections introduced to the CNN’s have created a
vital impact in improving the outcomes for detecting
and recognizing emotions. The matrix also displays
the percentage of False Positives and False Negatives
for each class that provides a deep understanding of
the performance for each class in the data.
Table. 3 displays the findings obtained using the
ISED, iSafe and Daisee database from the different
models used for emotional identification. Compared
to recent works using CNN and conventional
methods of definition, the new model has been
effective. Though the metric F1- measure is used to
measure the performance of the classifier, it is the
harmonic mean of precision and recall. These metrics
apart from using the conventional methods of
analysing accuracy from the classification data, it
also elicits the performance of the classifiers with
different data. This model is also compared with the
traditional CNN model with 40 layers and the
accuracy on ISED data was recorded as 90.53% and
with the iSAFE database at 91.78%. Improvement in
the results were found while using residual functions
to the existing EMONET model.
The proposed model has a good ranking score
based on Table. 3. While all of the other models use
Data Class Acc Pre Sen Spe F1
ISED
Anger 95.55 0.91 0.83 0.99 0.87
Disgust 96.53 0.86 0.92 0.97 0.89
Fear 95.63 0.91 0.91 0.99 0.91
Happy 97.67 0.93 0.93 0.99 0.93
Neutral 98.03 1.00 0.87 1.00 0.93
Sad 94.34 0.86 1.00 0.97 0.92
Surprise 96.67 0.93 0.93 0.99 0.93
Daisee
Boredom 96.61 0.88 0.96 0.97 0.92
Confusion 94.21 0.93 0.85 0.98 0.89
Engaged 96.61 0.92 0.97 0.96 0.94
Frustrated 99.13 1.00 0.97 1.00 0.98
Acc= Accuracy, Pre=Precision, Sen= Sensitivity,
Spe= Specificity, F1= F1-score

Received: October 13, 2020. Revised: December 24, 2020. 244
International Journal of Intelligent Engineering and Systems, Vol.14, No.2, 2021 DOI: 10.22266/ijies2021.0430.21
Table 4. Performance comparison of various available
models
state-of-the-art deep learning networks and
traditional methods such as Inception V3, CNN, and
the well-known local directional patterns. The model
proposed exceeds the precision of all ISED algorithm
models that have used the database. Conventional
methods, CNN, Hybrid CNN’s and many more recent
works that have been carried out in the recent years
are prominent in enhancing the efficiency of
emotional analysis especially in the field of student
engagement and attention estimation. Based on Eq.
(9) the classifiers accuracy on both the dataset is
calculated based on the confusion matrix. From Table.
3, various parametric results show that the network
was able to achieve significant outcome using the
residual network. The average results for the dataset
ISED and iSafe dataset are, Accuracy 91.3%, Error at
8.7%, Sensitivity 91.34%, Specificity 98.56,
precision 91.35%, false Positive rate is recorded
at1.44% and the Kappa’s Coefficient 0.65 which is
recorded to be a substantial classifier for the database.
Similarly, in the Daisee dataset, overall results for
Accuracy: 93.44%, Error rate: 6.56%, Sensitivity:
93.63%, Specificity: 97.82%, Precision 93.37%, false
positive rate is recorded at 2.18% and the Kappa’s
Coefficient 0.825 which is recorded to be a perfect
classifier for the database. The proposed method has
attained promising results due to the enormous
images used for training, optimised layers to enrich
the shallow network to learn, understand and capture
features. The Features learned using the Network
makes it sophisticated for classification with higher
accuracy. The Feature maps created after each layer
that uses the activation functions enhances the
network by reducing the vanishing gradient and
overfitting issues that are prominent in the traditional
CNN. The network is compared with the results that
are deeper and most commonly used trained networks.
Table. 4, enlists the methods used by various authors
and the accuracy that it has achieved on the dataset,
though there are different classes in each of the
datasets our model has attained a signific-ant
improvement in all parameters used to measure the
tangibility in the introduction of residual networks on
conventional CNN.
There are three observations about the network’s
performance, firstly degradation issues have rapidly
decreased due to the lower training error rate which
was observed to be at 0.265. The reduced training
error improves the efficiency of the learning due to
the optimum depth of the network. Secondly, the
identity connections as mentioned in Fig. 1, have
helped in significantly decreased the time complexity
for training and validation by 30%. Thirdly, the
network uses SGD solver and it is able to find good
solutions. Though the network is shallow, gradient
descent algorithm works on batches of smaller sizes
this enables the network to train on smaller batches
and create multiple layers of features. These features
are the crux of the classification unit to create
probabilities on the Weighted layers by accurately
turning on the exact neurons to provide precise and
accurate results. Two-Fold Cross validations provide
visibility on the network’s validation outcome during
Sl
no
Name of the Method Dataset Acc
(%)
1 CNN [23] ISED 51.6
2 CNN [23] ISED 59.3
3 Inception V3 [23] ISED 47.9
4 EmotionNet 2 [23] ISED 21.0
5 EmotionalDAN [23] ISED 62.0
6 CNN [24] ISED 82.9
7 Local prominent
directional patterns [25]
i. LBP (Local
Binary Pattern)
ii. LDP (Local
Directional
Pattern)
iii. LDN (Local
Directional
Number)
iv. LPTP (Local
Directional
Ternary Pattern)
v. PTP (Positional
Ternary Pattern)
vi. HOG (Histogram
Of Gradients)
vii. LPDP (Local
Prominent
Directional
Pattern)
viii. LPDP𝑓 (Local
Prominent
Directional
Pattern 𝑓)
ISED
76.47
74.61
75.85
72.46
76.16
76.75
77.80
78.32
8 Landmark Detection [26] ISED 34
9 Local directional-structural
pattern [27]
ISED 77.78
10 LDP+KPCA [28] Daisee 90.89
11 Hybrid CNN [29] Daisee 86
12 Deep Engagement
Recognition Network [30]
Daisee 57.9
13 Very Deep Convolutional
Network [31]
Daisee 92.33
14 Proposed Model ISED &
iSAFE
91.3
15 Proposed Model Daisee 93.44

Received: October 13, 2020. Revised: December 24, 2020. 245
International Journal of Intelligent Engineering and Systems, Vol.14, No.2, 2021 DOI: 10.22266/ijies2021.0430.21
the training phase. This provides a closer detail of the
performance of the network. Incorporating
Optimized Hyper Parametric Settings that are
discussed in Section. 4, has cushioned the network to
be customized for better performance.
7. Conclusions
The proposed work intends to evaluate the
performance of the inclusion of residual layers to an
existing CNN model. CNN models are prone to
vanishing gradients and loss in accuracy as the
networks grow deep. The residual connections on the
shallow network is designed from the scratch
specifically for the purpose of detecting students’
engagement on an E-Learning platform. Both
behavioral classes like boredom, engaged, frustrated
and confusion classes along with emotional classes
are considered in this work. This work utilizes
students’ facial features to predict and classify
images in the wild to calculate the accuracy of the
proposed approach. In this model, the network uses
residual networks to improve connections from
previous layers into the next layers to improve the
learning and classification response of the system.
Two-fold cross validations are used to understand the
capability of the model. This network is trained on
three Indian Datasets indigenously, to be able to
detect the emotional and behavioral intent of the
students. The total layers used in the network is 50.
The shallow network helps in efficient learning
model that is able to validate images at an average of
86.87% during training. The model is tested for
detection efficiency with test data and compared with
state-of-the-art models that are built with CNN as
primary network. The usage of Residual Connections
and Optimized Hyper Parametric Settings has
considerably enhanced the performance in creating
and using the network for a Indian face based
emotional classification model.
The Furnished results in Table. 3 and Table 4
based on Fig. 4 and Fig. 5 show that the model
outperforms the other state of the art techniques. Also,
the classifiers performance is evaluated with the help
of Kappa score and the network performs well and
the classifier is diligently able to perform at 82.51%.
The proposed model is evaluated for performance
measures using standard evaluation metrics that
results in improvement close to 2% in various
parameters. The proposed model will be tested for
group engagement detections and evaluate the
Valence and Arousal of the group using the model as
a future enhancement.
Conflicts of Interest
The authors declare no conflict of interest.
Author Contributions
The contributions by the authors for this research
article are as follows: “conceptualization,
methodology, Formal analysis and writing—original
draft preparation Michael Moses Thiruthuvanathan;
Result validation, resources, formal analysis
writing—review and editing and supervision
Balachandran Krishnan; data curation, Result
Validation and ethical inference Madhavi
Rangaswamy”
Acknowledgments
Authors wish to acknowledge the technical and
infrastructure help rendered by the faculty members
from the department of Computer Science and
Engineering, CHRIST (Deemed to be University),
Bangalore, India.
References
[1] A. Mollahosseini, B. Hasani, and M. H. Mahoor,
“AffectNet: A Database for Facial Expression,
Valence, and Arousal Computing in the Wild”,
IEEE Transactions on Affective Computing, Vol.
10, No. 1, pp. 18-31, 2019.
[2] T. Ashwin and R. Guddeti, “Affective Database
for E-Learning and Classroom Environments
using Indian Students’ Faces, Hand Gestures
and Body Postures”, Future Generation
Computer Systems, Vol. 108, No. 1, pp. 334-348,
2020.
[3] A. Dhall, R. Goecke, J. Joshi, M. Wagner, and T.
Gedeon, “Emotion Recognition in the Wild
Challenge 2013”, In: Proc. of 15th International
Conf. on Multimodal Interaction, ACM, pp.
509–516, 2013.
[4] I. Goodfellow, D. Erhan, P. L. Carrier, A.
Courville, M. Mirza, B. Hamner, W. Cukierski,
Y. Tang, D. Thaler, and H. Lee, “Challenges in
Representation Learning: A Report on Three
Machine Learning Contests”, In: Proc. of
International Conf. on Neural Information
Processing, Vol. 64, No. 1, pp. 59–63, 2015.
[5] A. Mollahosseini, B. Hasani, M. J. Salvador, H.
Abdollahi, D. Chan, and M. H. Mahoor, “Facial
Expression Recognition from World Wild Web”,
In: Proc. of IEEE Conf. on Computer Vision and
Pattern Recognition (CVPR) Workshops, Vol. 1,
pp. 168-195, 2016.
[6] S. Zafeiriou, A. Papaioannou, I. Kotsia, M.
Nicolaou and G. Zhao, “Facial Affect “In-the-
Received: October 13, 2020. Revised: December 24, 2020. 246
International Journal of Intelligent Engineering and Systems, Vol.14, No.2, 2021 DOI: 10.22266/ijies2021.0430.21
Wild”: A Survey and a New Database”, In: Proc.
of IEEE Conf. on Computer Vision and Pattern
Recognition Workshops (CVPRW), pp. 1487-
1498, 2016.
[7] L. Rothkrantz, “Dropout Rates of Regular
Courses and MOOCs”, In: Proc. of International
Conf. on Computer Supported Education, Rome,
pp. 25-46, 2016.
[8] M. Li, H. Xu, X. Huang, Z. Song, X. Liu and X.
Li, “Facial Expression Recognition with Identity
and Emotion Joint Learning”, IEEE
Transactions on Affective Computing, Vol. 4,
No. 8, pp. 411-416, 2018.
[9] S. M. Mavadati, M. H. Mahoor, K. Bartlett, P.
Trinh, and J. F. Cohn, “Disfa: A Spontaneous
Facial Action Intensity Database”, IEEE
Transactions on Affective Computing, Vol. 4,
No. 2, pp. 151–160, 2013.
[10] T. Ashwin and R. Guddeti, “Unobtrusive
Students’ Engagement Analysis in Computer
Science Laboratory Using Deep Learning
Techniques”, In: Proc. of IEEE 18th
International Conf. on Advanced Learning
Technologies (ICALT), pp. 436–440, 2018.
[11] S. Setty, M. Husain, P. Beham, J. Gudavalli, M.
Kandasamy, R. Vaddi, V.Hemadri, J. Karure, R.
Raju, and B. Rajan, “Indian Movie Face
Database: A Benchmark for Face Recognition
under Wide Variations”, In: Proc. of Fourth
National Conf. on Computer Vision, Pattern
Recognition, Image Processing and Graphics
(NCVPRIPG), IEEE, 2013, pp. 1–5, 2013.
[12] S. Patwardhan and G. M. Knapp, “Affect
Intensity Estimation Using Multiple Modalities”,
In: Proc. of Florida Artificial Intelligence
Research Society Conf., pp. 130-133, 2014.
[13] R. Noorden, “The ethical questions that haunt
facial-recognition research”, Nature. Vol. 587:
pp. 354-358, 2020.
[14] A. Dhall, R. Goecke, S. Lucey, and T. Gedeon,
“Collecting Large, Richly Annotated Facial-
Expression Databases from Movies”, IEEE
MultiMedia, Vol. 19, No. 3, pp. 34-41, 2012.
[15] S. Happy, P. Patnaik, A. Routray, and R. Guha,
“The Indian Spontaneous Expression Database
for Emotion Recognition”, IEEE Transactions
on Affective Computing, Vol. 8, No. 1, pp. 131-
142, 2017.
[16] T.Sapinski, D. Kaminska, A. Pelikant, C.
Ozcinar, E.Avots, and G. Anbarjafari.
“Multimodal Database of Emotional Speech,
Video and Gestures”, In: Proc. of International
Conf. on Pattern Recognition Information
Forensics, pp. 153–163, 2018.
[17] C. Bian, Y. Zhang, F. Yang, W. Bi, and W. Lu,
“Spontaneous Facial Expression Database for
Academic Emotion Inference in Online
Learning”, IET Computer Vision. Vol. 13, No. 3,
pp. 329–337, 2018.
[18] A. Gupta, A. D’Cunha, K. Awasthi, and V.
Balasubramanian, “Daisee: Towards User
Engagement Recognition in the Wild”, arXiv
preprint arXiv: 1609.01885, 2016.
[19] M. J. Lyons, S. Akamatsu, M. Kamachi, J.
Gyoba, J. Budynek, “The Japanese female facial
expression (JAFFE) database”, In: Proc. of
Third International Conf. on Automatic Face
and Gesture Recognition, pp. 14–16, 1998.
[20] I. Goodfellow, D. Erhan, P. L. Carrier, A.
Courville, M. Mirza, B. Hamner, W. Cukierski,
Y. Tang, D. Thaler, D.-H. Lee, Y. Zhou, C.
Ramaiah, F. Feng, R. Li, X. Wang, D.
Athanasakis, J. Shawe-Taylor, M. Milakov, J.
Park, R. Ionescu, M. Popescu, C. Grozea, J.
Bergstra, J. Xie, L. Romaszko, B. Xu, Z. Chuang,
and Y. Bengio. “Challenges in representation
learning: A report on three machine learning
contests”, Neural Information Processing, Vol.
8228, pp. 117-124, 2013.
[21] S. Singh and S. Benedict, “Indian Semi-Acted
Facial Expression (iSAFE) Dataset for Human
Emotions Recognition”, Advances in Signal
Processing and Intelligent Recognition Systems.
SIRS Communications in Computer and
Information Science, Vol 1209, No. 1, pp. 150-
162, 2019.
[22] A. Kaur, A. Mustafa, L. Mehta and A. Dhall,
“Prediction and Localization of Student
Engagement in the Wild”, Digital Image
Computing: Techniques and Applications
(DICTA), Canberra, Australia, pp. 1-8, 2018.
[23] I. Tautkute, T. Trzcinski, and A. Bielski, “I
Know How You Feel: Emotion Recognition
with Facial Landmarks”, In: Proc. of IEEE Conf.
on Computer Vision and Pattern Recognition
Workshops (CVPRW), pp. 1959-1974, 2018.
[24] S. Gonzalez-Lozoya, J. Calleja and L. Pellegrin,
H.Escalante, Ma. Medina and A. Benitez-Ruiz,
“Recognition of Facial Expressions based on
CNN Features”, Multimedia Tools &
Application, Vol. 79, pp. 13987–14007, 2020.
[25] F. Makhmudkhujaev, M. Abdullah-Al-Wadud,
M. Iqbal, B. Ryu, and O. Chae, “Facial
Expression Recognition with Local Prominent
Directional Pattern”, Signal Processing: Image
Communication, Vol. 74, No. 1, pp, 1-12, 2019.
[26] S. Engoor, S. SendhilKumar, C. Hepsibah
Sharon, and G. S. Mahalakshmi, “Occlusion-
aware Dynamic Human Emotion Recognition

Received: October 13, 2020. Revised: December 24, 2020. 247
International Journal of Intelligent Engineering and Systems, Vol.14, No.2, 2021 DOI: 10.22266/ijies2021.0430.21
Using Landmark Detection”, In: Proc. of 6th
International Conf. on Advanced Computing
and Communication Systems (ICACCS), pp.
795-799, 2020.
[27] A. Rivera, J. Rojas Castillo, and O. Oksam Chae,
“Local Directional Number Pattern for Face
Analysis: Face and Expression
Recognition”, IEEE Transactions on Image
Processing, Vol. 22, No. 5, pp. 1740-1752, 2013.
[28] M. Dewan, F. Lin, D. Wen, M. Murshed and Z.
Uddin, “A Deep Learning Approach to
Detecting Engagement of Online Learners”, In:
Proc. of IEEE Smart World, Ubiquitous
Intelligence & Computing, Advanced & Trusted
Computing, Scalable Computing &
Communications, Cloud & Big Data Computing,
Internet of People and Smart City Innovation, pp.
1895-1902, 2018.
[29] T. Ashwin and R. Guddeti, “Automatic
detection of students’ affective states in
classroom environment using hybrid
convolutional neural networks”, Education
Information Technologies, Vol. 25, No. 1, pp.
1387–1415, 2020.
[30] O. Nezami, M. Dras, L. Hamey, D. Richards, S.
Wan, and C. Paris, “Automatic Recognition of
Student Engagement Using Deep Learning and
Facial Expression”, In: Proc. of Machine
Learning and Knowledge Discovery in
Databases, Lecture Notes in Artificial
Intelligence, Springer, Part III, Vol. 11908, pp.
273-289, 2020.
[31] T. Huang, Y. Mei, H. Zhang, S. Liu and H. Yang,
“Fine-grained Engagement Recognition in
Online Learning Environment”, In: Proc. of
IEEE 9th International Conf. on Electronics
Information and Emergency Communication
(ICEIEC), Beijing, China, pp. 338-341, 2019.


