Download - Engineering our tomorrow

Engineering our tomorrowEscorts Limited | 71st Annual Report 2016-17
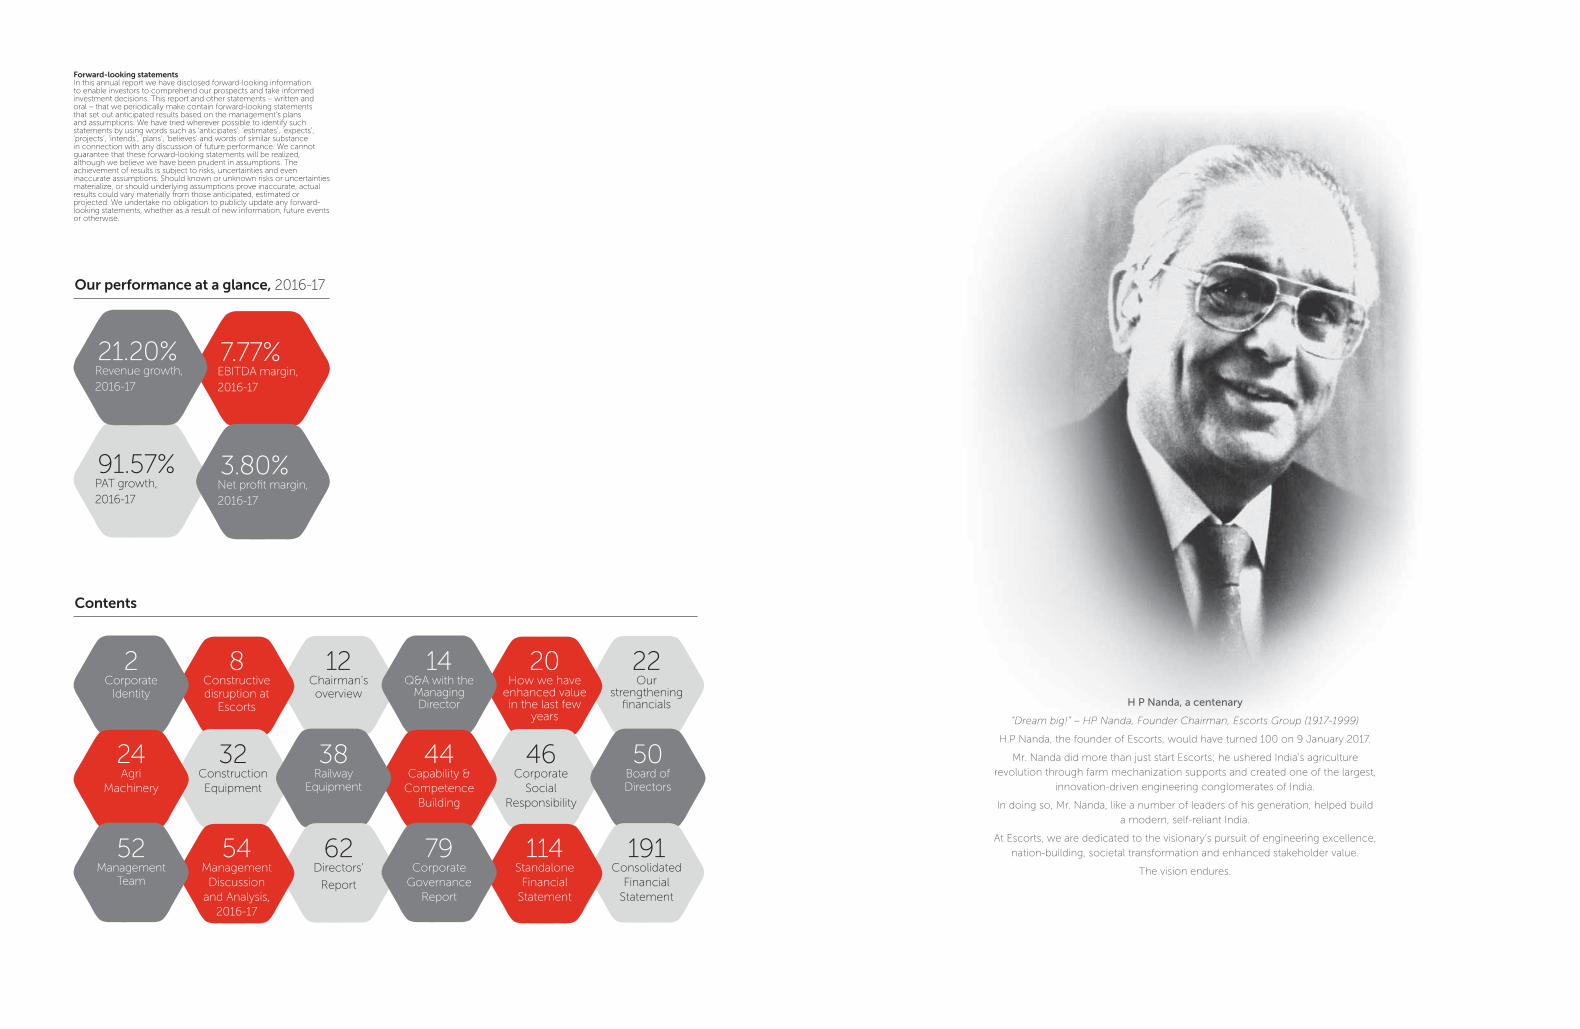
H P Nanda, a centenary
“Dream big!” – HP Nanda, Founder Chairman, Escorts Group (1917-1999)
H.P Nanda, the founder of Escorts, would have turned 100 on 9 January 2017.
Mr. Nanda did more than just start Escorts; he ushered India’s agriculture
revolution through farm mechanization supports and created one of the largest,
innovation-driven engineering conglomerates of India.
In doing so, Mr. Nanda, like a number of leaders of his generation, helped build
a modern, self-reliant India.
At Escorts, we are dedicated to the visionary’s pursuit of engineering excellence,
nation-building, societal transformation and enhanced stakeholder value.
The vision endures.
Forward-looking statements In this annual report we have disclosed forward-looking information to enable investors to comprehend our prospects and take informed investment decisions. This report and other statements – written and oral – that we periodically make contain forward-looking statements that set out anticipated results based on the management’s plans and assumptions. We have tried wherever possible to identify such statements by using words such as ‘anticipates’, ‘estimates’, ‘expects’, ‘projects’, ‘intends’, ‘plans’, ‘believes’ and words of similar substance in connection with any discussion of future performance. We cannot guarantee that these forward-looking statements will be realized, although we believe we have been prudent in assumptions. The achievement of results is subject to risks, uncertainties and even inaccurate assumptions. Should known or unknown risks or uncertainties materialize, or should underlying assumptions prove inaccurate, actual results could vary materially from those anticipated, estimated or projected. We undertake no obligation to publicly update any forward-looking statements, whether as a result of new information, future events or otherwise.
PAT growth,
2016-17
EBITDA margin,
2016-17
Revenue growth,
2016-17
Corporate Identity
Q&A with the Managing Director
Chairman’s overview
Our strengthening
financials
Constructive disruption at
Escorts
How we have enhanced value in the last few
years
Net profit margin,
2016-17
91.57%
7.77%21.20%
2 1412 228 20
3.80%
Our performance at a glance, 2016-17
Contents
Railway Equipment
Board of Directors
Construction
Equipment
Corporate
Social
Responsibility
Agri
Machinery
Capability &
Competence
Building
38 5032 4624 44
Management Team
Corporate
Governance
Report
Directors’
Report
Consolidated
Financial
Statement
Management
Discussion
and Analysis,
2016-17
Standalone
Financial
Statement
52 7962 19154 114

Corporate Identity
Escorts Limited is three companies in one.
Each of these businesses represents national priorities, attractive growth and a robust operating model.
Escorts is bringing a new urgency to each.
With the objective to make growth profitable and sustainable.
Railway Equipment
Agri Machinery
Construction Equipment
Escorts Limited
2
2
By 2020, Escorts expects to be among the top
engineering companies in India by:
• Being the preferred solutions provider to the needs
of our customers
• Practicing respectful and ethical business practices
• Being the employer of choice within the engineering
industry
• Providing superior returns to our investors
Vision 2020
Our Strategic Values
Customer Centricity: Acute sensitivity
to the needs and experiences of the
customer shall guide all that we do.
Excellence: We will strive to achieve
and surpass world class standards in
all that we do.
Innovation: We will use the power of
technology and imagination to deliver
solutions to customers’ needs.
Agility: We will operate in our markets
with the ability to change direction
and position with nimbleness and
speed
Background
Escorts Limited is one of India’s most
respected and trusted engineering
companies. The journey of Escorts
traces back to 1948, when a
nationalistic sentiment inspired
HP Nanda and Yudi Nanda to assume
a franchisee for the distribution of
tractors that would help farmers
secure their livelihoods.
Decades later, the spirit has endured;
Escorts continues to live this tradition,
the Company having established its
place among India’s leading tractor
players focusing on complementary
agriculture products and solutions, as
well as a force to reckon with in the
construction equipment and railway
equipment space.
Today, over a million tractors and over
16,000 construction and material
handling equipment that have rolled
out from Escorts, complemented
by a highly-satisfied customer base,
are testimony to the Company’s
manufacturing excellence.
71st Annual Report 2016-17 3
STRATEGIC REPORT GOVERNANCE FINANCIAL STATEMENTS OTHER INFORMATION

Our manufacturing locations
Escorts owns and operates six
integrated manufacturing plants in
Faridabad (Haryana). These plants
cover 1,83,726 sq.m. of space. The
Company also possesses a plant in
Rudrapur (tax-efficient Uttarakhand)
and a plant in Poland (Europe).
Our knowledge capital
At Escorts, we count our employees as
our most valuable asset. We invest in
their training and career development,
benchmarking their performance
with the industry’s best-in-class pay
standards. We enjoy harmonious
industrial relations. Our total workforce
(own and contractual) stood at 8,750
members as on 31 March 2017.
Our listing and market capitalization
Escorts shares are listed on the NSE,
BSE and DSE stock exchanges. The
Company’s market capitalization stood
at B6,603.8 cr with the promoter’s
holding of 43.0%, combined FII and
DII holding of 20.3% and public /
others holding of 36.7%, as on 31
March 2017. The Company’s BSE scrip
code is 500495. Escorts declared
a dividend of 150 paise per share
(15% on face value of B10 share) for
2016-17. The Company’s dividend
philosophy reconciles the need to
reward shareholders with adequate
reinvestment.
Accreditations and awards
• Escorts Agri Machinery business
has been accredited with two
international certifications
(ISO 14001:2004 and OHSAS
18001:2007)
• BBC Knowledge’s Best Brand
Marketing Campaign Award for
“Celebrating a Century of Excellence”
to commemorate Escorts’ Founder
Chairman, Late Mr. HP Nanda’s birth
centenary (2017)
• Indo-American Chambers of
Commerce’s Lifetime Excellence
Honor for Mr. HP Nanda, Escorts’
Founder Chairman, for his valuable
contribution in the setting up IACC
(2016)
• Escorts Chairman Mr. Rajan Nanda
inducted into The Machinist Hall of
Fame for his enormous contribution
to the Indian manufacturing industry
(2016)
• Machinist Super ShopFloor Award
to Escorts Agri Machinery’s Farmtrac
manufacturing unit for excellence in
productivity (2015)
• National Safety Awards for Escorts
Agri Machinery’s Farmtrac and
Powertrac manufacturing units
(2014)
At Escorts, we enjoy business-strengthening alliances with industry leaders.These leaders comprise prominent global names like Carraro, Porsche Consulting, Porsche Design, Perkins, ZF, Bosch, Honeywell, Ingeteam and Yujin Machinery.
Escorts Limited
4
4
Agri
Machinery
Construction
Equipment
Railway
Equipment
Our businesses
Agri Machinery
Escorts is one of India’s top Indian
tractor manufacturers, offering a
comprehensive range of over 225
tractor variants (25 to 75 HP). Our
brands (Farmtrac and Powertrac)
address the widest industry preference.
The business also offers crop solutions,
engines and gensets and lubricants; it is
additionally engaged in the after-market
sales of Escorts tractors.
Construction Equipment
The Company manufactures and
markets a comprehensive range of
construction equipment (cranes,
backhoe loaders, compactors and
forklifts). It is among the world’s
largest manufacturers of pick-’n’-carry
hydraulic mobile cranes.
Railway Equipment
State-of-the-art products anchored
around safety, comfort and reliability.
Comprising brakes, brake systems,
couplers, suspension systems, shock
absorbers and rail fastening systems,
among others.
80.3%
Contribution to our
2016-17 revenues*
14.5%
Contribution to our
2016-17 revenues*
5.8%
Contribution to our
2016-17 revenues*
*From continuing operations
71st Annual Report 2016-17 5
STRATEGIC REPORT GOVERNANCE FINANCIAL STATEMENTS OTHER INFORMATION
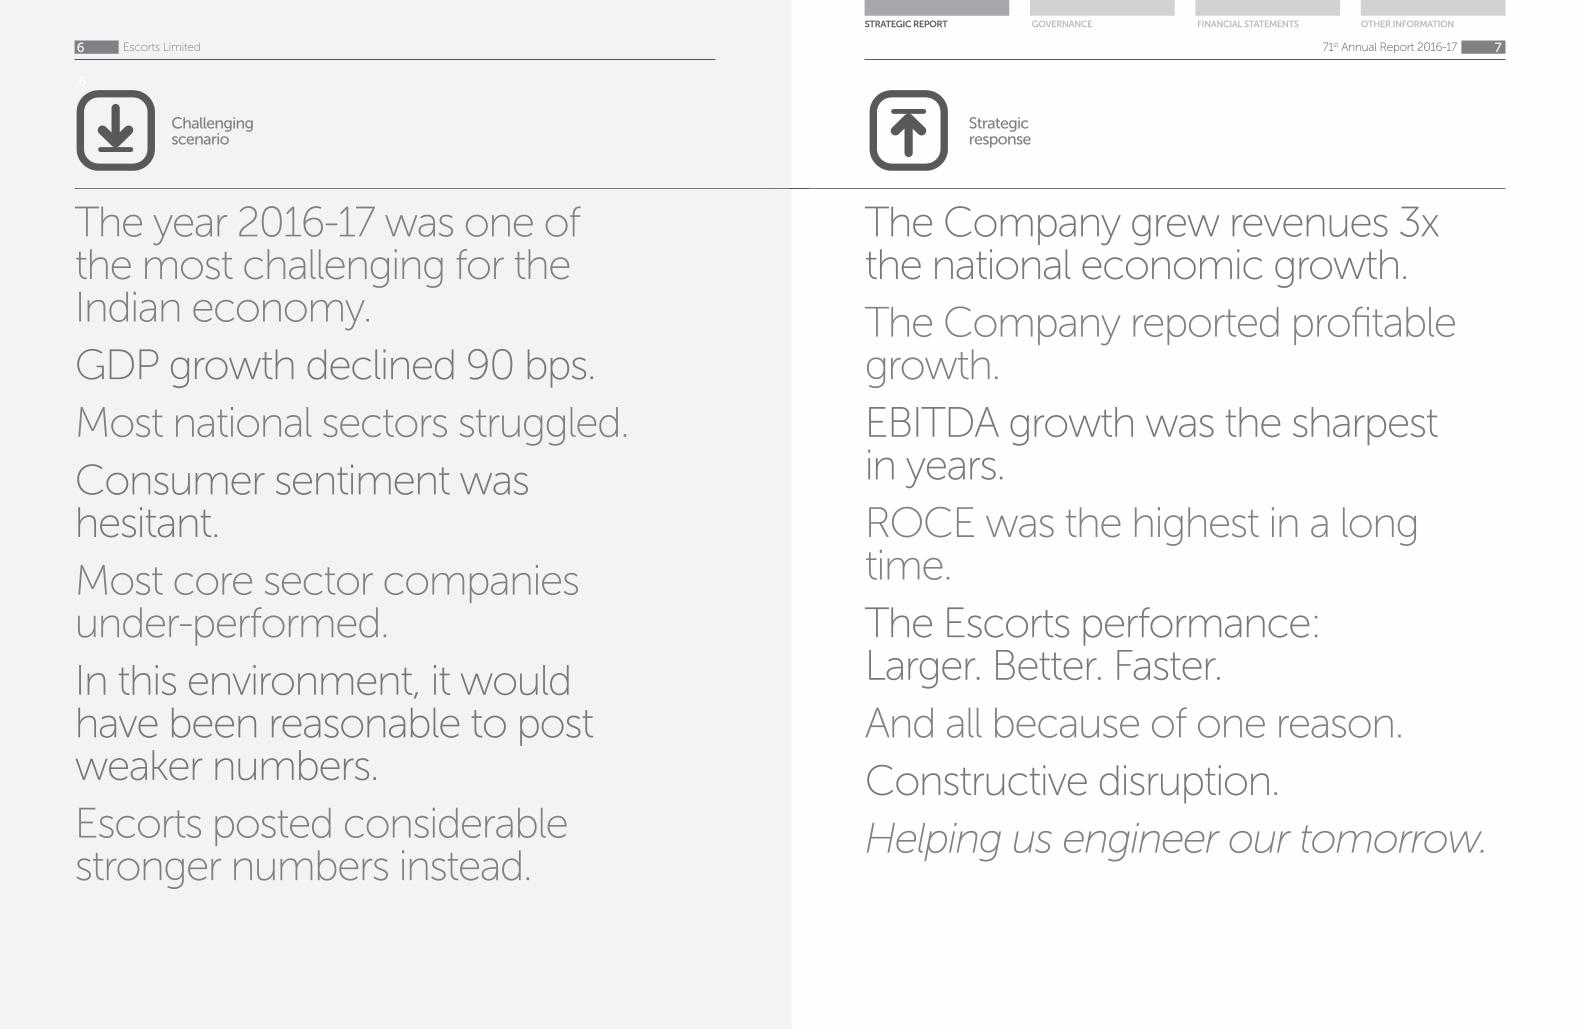
The year 2016-17 was one of the most challenging for the Indian economy.
GDP growth declined 90 bps.
Most national sectors struggled.
Consumer sentiment was hesitant.
Most core sector companies under-performed.
In this environment, it would have been reasonable to post weaker numbers.
Escorts posted considerable stronger numbers instead.
Challenging scenario
Escorts Limited
6
6
The Company grew revenues 3x the national economic growth.
The Company reported profitable growth.
EBITDA growth was the sharpest in years.
ROCE was the highest in a long time.
The Escorts performance: Larger. Better. Faster.
And all because of one reason.
Constructive disruption.
Helping us engineer our tomorrow.
Strategic response
71st Annual Report 2016-17 7
STRATEGIC REPORT GOVERNANCE FINANCIAL STATEMENTS OTHER INFORMATION

Constructive disruption at Escorts. Looking at the world with a new pair of eyes.
Where the priority is to plan for 2020
and beyond.
Where the base line is ‘Is it the best standard
in the world?’
Where every second person asks
‘Is it sustainable?’
Where research investments are
considered sacred.
Where the two words on
everybody’s dislike-list are ‘status quo’.
Where each business desires to emerge as the customer’s single-
stop solution.
Where every engineer is obsessed
with ‘customer experience’.
Where every business is being
driven more around Return on Capital Employed than market share.
Escorts Limited8
Where the focus is on creating new
markets than merely capturing share.
Where financial decisions are driven by cash flows more
than cash profits.
Where ‘zero defects’ is the new mantra.
Where every initiative is directed towards enhanced organizational value.
Where the business priority is not complete if it has not extended
to community welfare.
Where ‘transaction’ has been replaced by
‘relationship’.
Where the objective is to leave the world cleaner and greener.
Engineering our tomorrow.Preparing for it today.
Where each shopfloor manager is driven by ‘more
from less’.
71st Annual Report 2016-17 9
STRATEGIC REPORT GOVERNANCE FINANCIAL STATEMENTS OTHER INFORMATION

Constructive disruption is listening to the inner voice that says ‘Why not!’Even when the rest of the world is saying ‘It can’t be done!’
1
3
2
4
5
Escorts’ turnover* at B4,167.6 crores increased 21.2% from
B3,438.7 crores in the previous fiscal led by volume growth in
the tractor and construction equipment businesses.
Escorts’ material costs as a proportion of revenues declined by 90
basis points to 67% as against 67.9% in the previous fiscal.
Escorts’ tractor volumes strengthened 24% to 63,786 tractors
as against 51,455 tractors in the previous fiscal. Construction
equipment volume was up 29.8% to 3,315 machines against 2,555
machines in the previous year.
Escorts’ EBITDA* at B323.7 crores was up 83.2% as against B 176.7
crores in the previous fiscal. EBITDA margin strengthened 263
basis points to 7.8% as against 5.1% in the previous fiscal. PBT from
continuing operations and before exceptional items was B273
crores, up by 117% against B125.5 crores in the previous fiscal. Net
profit at B160.4 crores compared favourably with B 83.8 crores in
the previous fiscal.
Escorts’ finance cost declined B18.4 crores to B31.1 crores as against
B49.5 crores in the previous fiscal. The total debt outstanding as of
March 2017 at B263 crores was down from B360 crores in March 2016
following superior working capital efficiency.
Sceptics said that it would be difficult
outperforming India’s economic growth in a
sluggish year
Realists said that with costs rising, a
moderation in material costs would be
impossible
Doubters said that the best thing
would be to lie low and let the
storm blow over
Most analysts indicated that with a general industry
slowdown and demonetization, an improved financial
performance would be difficult.
Most experts felt
that in a cash-
squeezed situation,
strengthening the
quality of the Balance
Sheet would be
difficult.
*From continuing operations
Escorts Limited
10
10
At Escorts, constructive disruption is not a one-off response. It is a continuous journey.
The Company intends to double EBITDA over three
years
The Company intends to
enhance value through increased capacity utilization
The Company intends to
continuously attack costs
The Company intends to repay
debt
The Company intends to
launch products addressing the fastest
growing sectoral segments
The Company intends to strengthen
working capital management
The Company intends to plug portfolio gaps
The Company intends to launch
value-added products
71st Annual Report 2016-17 11
STRATEGIC REPORT GOVERNANCE FINANCIAL STATEMENTS OTHER INFORMATION

The Escorts of today is agile and responsive to capitalize on emerging opportunities
Chairman’s overview
Escorts Limited
12
12
I am pleased to present the annual report to you on the centenary of Mr. HP Nanda, the founder of the company. India
today is at an inflection point and likely to graduate from a perpetually-developing nation status into a developed modern country in the global community of nations. To create enduring
value for the country, we need to build an enterprise that is increasingly agile and future-ready.
Escorts is addressing the growing
national opportunity by selecting to
focus on three businesses aligned
with India’s development story. As
a future-facing enterprise, Escorts
is strengthening its technology
investments and positioning by
building capabilities in the areas of
product development, technology
and design, making us competitive
across local and global platforms.
We are building our engineering
capabilities and strengths to launch
new products and expand our
businesses. The three verticals we
serve have a great potential for
growth, as each represents a strong
pivot for the development of the
Indian economy.
Indian agriculture is yet to be fully
mechanized and there is a growing
need for strengthening productivity
and viability. We are working on
technology and solutions that will
help create the highly-mechanized
and evolved farms of tomorrow. We
are developing new, large and smaller
tractors that will not only help us
expand our range, but also give our
customers a wider choice.
The Indian government’s policy
priority matches this universal
relevance as well. We believe that a
number of agricultural reforms will
enhance farm viability and accelerate
reinvestments, benefiting our entire
agri machinery business.
India’s infrastructural development is
a massive task for the next 20 years.
Engineering set-ups and contractors
will have plenty of focused projects,
needing smarter and efficient
construction equipment technology
and solutions. The focus to invest
aggressively and extensively in
infrastructure will translate into the
building of new roads, bridges, ports,
airports and other infrastructure
supports. We are today producing
the required engineering solutions
that will contribute to the growing
requirement. Escorts is engaged in
scaling product design, technologies,
capability and capacities. We are
collaborating with select European
companies to offer cutting-edge
products that makes it easier for
contractors to deliver larger, better
and faster.
As the global population increases,
we see a larger investment going
into railways across the world as
an effective mass, long-cum-rapid
transport system – across scale,
safety and sophistication. The Indian
government is prioritizing railway
network expansion, which has
reflected in an increased Railway
budgetary outlay exceeding rupees
one lakh crore per year, creating an
attractive opportunity for our railway
products business. The dedicated
freight corridor connecting Delhi,
Mumbai, Kolkata and Chennai will
liberate more track capacity for
passengers and widen our product
portfolio relevance. Our product suite,
comprising all types of brakes and
couplers, are vital for the safety of
high-speed, multi-wagon trains.
The Company has made significant
progress in the last couple of years.
The Company divested its non-
core businesses, strengthened its
commitment to existing businesses
through increased investment,
widened its product range and
deepened its service commitment.
Besides, we intend to strengthen
our business by addressing the
growing scope of our products in
the international market, potentially
enhancing the quantum of our
exports in a substantial way across the
foreseeable future.
Escorts’ three businesses are aligned
with India’s development. We will
continue investing in technologies,
efficient distribution and product
mix for enhanced agility, dynamism
and customer responsiveness to
capitalize on emerging opportunities.
We have created robust structures
for benchmarking the best players in
the industry to develop a competitive
cost advantage and enhance
our profitability. As we delve into
new products and segments, the
overarching idea will be to achieve
growth using the Company’s earned-
reserves, making us a self-reliant
enterprise.
I am optimistic that this futuristic
approach will enhance value for all
our stakeholders in an enduring way.
Rajan Nanda
Chairman & Managing Director
71st Annual Report 2016-17 13
STRATEGIC REPORT GOVERNANCE FINANCIAL STATEMENTS OTHER INFORMATION

Escorts is readying for a leap in differentiating itself through products, technology and customer experiences that transform our stakeholder value creation.
Q&A with the Managing Director
Escorts Limited
14
14
Q: What is the principal message that
you wish to convey to shareholders?
A: At the outset, let me communicate
my gratitude to our stakeholder
family, without whom the robustness
in our performance would not have
transpired. It is the collaborative
working of the various arms of our
stakeholders – employees, customers,
partners, collaborators, investors,
lenders, industry, the government and
community at large – that provides
me with the optimism that this
improvement can indeed become
sustainable.
Escorts has been in existence for
nearly seven decades and yet, in a
certain sense, the journey has just
begun. This is largely because the
robust ‘India story’ has only just begun
as well. It took India 60 years to reach
its first trillion dollars in economic
value; it took the country’s economy
a mere seven years to reach its
next trillion dollars; the economy is
expected to achieve its third trillion
dollars in five years, trebling from
this point to 2030 as the third-largest
economy in the world.
At Escorts, I am optimistic that we
will more than match this national
momentum; we are engaged in
creating disruptive cutting-edge
products, carving out a large share
of the markets of our presence, and
servicing customers more effectively.
The result is that we are optimistic of
consistently outperforming and, in
doing so, doubling profitability and
market share across our businesses
across the next three years.
Q: What does the Company need
to do to more than match this
momentum?
A: I am convinced that this substantial
leap will only be achieved if we
do different things and do things
differently. The next three years of our
journey will be the most disruptive in
our existence.
For instance, in the reinvented
Escorts, we have created one of the
most disruptive innovation cells to
introduce products and solutions
for the future. We are not engaged
in merely addressing customer
needs of the day; we are engaged in
designing products and solutions that
graduate customers towards a better
tomorrow. This future-facing Escorts
is engaged in an active dialogue
with some of the most advanced
autonomous technology centres,
electric mobility companies and global
disruptive technology centres with the
objective to partner their presence
in India and evolve our personality
into a sophisticated and precision
technology-driven engineering
company of the future.
To make this happen, we have charted
a transformational path to develop
competencies, pursue innovation
and enhance our business agility by
making Escorts a performance-driven
company. As we progress, we will
also focus on process improvement,
digitization across the board for real-
time connectivity and engagement,
capacity building and creation
of robust review and monitoring
mechanisms to accelerate our growth
and unlock the full potential of our
organization.
Coupled with these initiatives,
we are engaging the best talent
with a growing focus on cutting-
edge research, innovation and
youthfulness. We are creating
differentiated products that cater
to discerning customer needs of
today and tomorrow. We are also
investing deeper in our brands
following the creation of separate
channels for Farmtrac and Powertrac
to enhance our marketing and sales
focus – a move that is expected to
deliver market share gains as well as
additional revenues in the next three
years. We are widening and deepening
our pan-India distribution channel
that makes it possible for customers
to reach us quickly and conveniently.
We believe that the combination
of this differentiated approach
– productisation, marketing and
distribution – represents a completely
new way of doing business at our
Company.
Q: What is your view of the
Company’s overall performance in
FY17?
A: I was satisfied by the Company’s
overall performance in FY17. The
industry, in all the three segments
that we operate, grew on the back
of a normal monsoon, thriving rural
sentiment and increased government
spending in infrastructure and
railways. The upcycle in the domestic
tractor industry is expected to
continue for a couple of years. The
private investment cycle hasn’t yet
picked up in full swing, so the upcycle
in the domestic equipment industry is
expected to continue for at least 4 to
5 years. The increased investment in
Indian Railways is expected to sustain
longer and the Metro is emerging as
the mainstay of urban transportation.
Our growth is in line with industry
growth trends. Our overall revenues
from continuing operations grew by
21.2% in FY17. We marginally gained
market share in the tractor business to
10.8% and maintained our position in
the construction equipment business.
Nikhil Nanda, Managing Director, explains the transition of Escorts into a rapidly value-
enhancing organization.
71st Annual Report 2016-17 15
STRATEGIC REPORT GOVERNANCE FINANCIAL STATEMENTS OTHER INFORMATION

Our overall EBITDA margin from
continuing operations also grew to
7.8% compared to 5.1% in the last fiscal
on the back of improved volumes and
cost reduction. Our RoCE improved
to 13.04% on the back of improved
margins.
Our financial health improved as our
net debt remained negative. Our cash
flows and working capital efficiency
strengthened. We invested in R&D for
new products and new technology
development, which shall bear fruit in
the future.
In Operations, we received the TPM
Excellence Award, which signifies
that we crossed the first milestone
towards world-class manufacturing.
To enhance synergies, we combined
the organizational structure at the
back-end (R&D, Manufacturing &
Supply Chain).
We successfully divested our interest
in Escorts Auto Products. This shall
enhance our management focus
and investments availability for our
remaining businesses. This also means
that we shall be able to reduce our
land requirements to facilitate the
capacity expansion of our tractor
business. We signed an agreement
with DLL to strengthen retail financing
for our customers. We realigned the
roles at the top management for clear
accountability related to profitability,
growth and sustainability.
Our partners, in terms of dealers and
suppliers, are happy as their profits
improved on the back of higher
volumes; our customers are enjoying
new products and rewarding us.
Having said all this, I feel that there
is still a lot of work to be done in the
area of manpower cost reduction,
higher exports, improving customer
satisfaction and achieving profitability
in our construction equipment
business. We are taking steps to
improve and results should be visible
in the next 2 to 3 years.
Q: Can you comment on Escorts Agri
Machinery’s performance in FY17 and
prospects?
A: In FY17, our strong markets (North &
Central India) grew by 12.5%, whereas
our opportunity markets (South &
West India) grew by 25%. We gained
market share in both markets and
increased our overall market share by
50 bps to 10.8%. This came on the
back of successful launches of new
Farmtrac products (Farmtrac 6055,
55 HP, T20 Gear box) and Powertrac
products (Euro45 and Euro50). We are
also investing deeper in our brands
following the creation of separate
channels for Farmtrac and Powertrac
to enhance our marketing and sales
We moderated our cost structure through material and financial savings; we grew our business without straining the Balance Sheet, resulting in a stronger ability to service the declining debt on our books, strengthening our long-term sustainability.
Escorts Limited
16
16
focus – a move that is expected to
deliver market share and revenue
gains in the next three years.
Our EBIT margins also went up by 221
bps to 7.3% on the back of reduced
material cost. We successfully
completed Project Shikhar, which
aims to reduce the material cost of
our tractors through VA-VE, design
changes and applying cost-effective
sourcing. We also launched new
models for exports, namely Farmtrac
6080 Pro and Farmtrac 6090 Pro
(Farmtrac Tractors in 80 and 90 HP),
which shall help us develop key export
markets.
To achieve our stated target of
establishing the Farmtrac brand as
a leader in the higher HP category
and position the Powertrac brand
as a challenger in the mass-market
category (reaching industry average
margins of 15%), we started the
LEAP program. There are four pillars
of this program, which are aimed
at increasing market share, back-
end contribution margins, spares,
while reducing fixed costs (including
manpower). This shall be a three-
year program and we are committed
to achieve our objectives. We shall
continue to lower our blue-collar
employee fixed cost through a VRS
program and planned retirements.
These initiatives shall make the
Company lean and help us negotiate
the down-cycle.
We are developing products to
penetrate South and West India in
the orchards and rice belts. We are
strengthening our channels in these
markets. We have identified key
international markets and are in the
process of completing our product
portfolio from 12-110 HP, specifically
for exports. This year, we will organize
an International Day where we will
showcase our portfolio for channel
partners. We shall launch a Compact
Series of tractors for the Indian and
global markets. We have designed the
look and styling of this tractor with the
help of a global design firm of repute.
I am sure our customers will look
forward to this tractor.
As we look to gain volumes, we are
planning to expand our capacity to 1.5
lac tractors per year. We shall watch
the industry closely and shall commit
resources with correct timing. We
shall look to use our existing land
resources as well as the now-available
Escorts Auto Products premises.
As mentioned in the past, we are
working in the direction of offering
an end-to-end service (from land
preparation to harvesting) for the
paddy crop; we started a few centers
in Andhra Pradesh and Odisha as
pilots. This will evolve us from a
product-centric approach to providing
solutions to our customers.
In terms of people capability, we
commissioned the Escorts Sales
Academy to train and polish our
front-end teams – including our own
sales force as well as Dealership
Sales Executives – so that all
Escorts representatives speak the
same language and provide the
same customer experience across
geographies. We are also working
in developing digital platforms for
training and capability-building.
71st Annual Report 2016-17 17
STRATEGIC REPORT GOVERNANCE FINANCIAL STATEMENTS OTHER INFORMATION

Q: Can you comment on Escorts
Construction Equipment’s
performance in FY17 and prospects?
A: The construction equipment
industry in our segments grew by
33% in FY17. This is the second year
of continuous growth. We feel that
with a pickup in private investment,
the momentum should continue.
The government is also investing
and facilitating private investments
in road building, power and other
infrastructure segments. India needs
considerable infrastructure investment
and the construction equipment
industry shall play a key role in
partnering nation-building.
Our volumes grew by 30% to 3,315
machines. We were able to break-
even at the operating level in Q4 due
to higher volumes. We introduced
new products in the backhoe loader
(JUNGLI) and crane segments
(15-tonne Smart City Crane).
In our cranes portfolio, we are making
a shift from the Hydra crane segment
to Safe crane segment (next gen
cranes), which shall result in a higher
contribution margin and improved
customer safety. We shall also develop
cranes, which are safer to use and can
pick up more load. In the backhoe
loader segment, customers embraced
our new product JUNGLI, which
stands for brute power and is used in
difficult applications. We aim to create
a niche in the market and improve
contribution margins per product.
At our backend, the strategic
consolidation of the teams of EAM
and ECE has started showing results.
We improved material costs in ECE;
the R&D team is conceiving new,
innovative products. We shall work
towards achieving the average
industry operating margin in the next
three to five years.
Q: Can you comment on the Railway
Equipment Division’s performance in
FY17 and future plans?
A: The RED has been in a sweet spot
in terms of sectoral tailwinds in the
industry. The government is investing
in Indian Railways infrastructure,
rolling stock and new metro projects.
Our revenues grew 6.5% on the back
of new products. We got the approval
for Bogie-Mounted Brake System
and supplied a good set of units in
FY17. Our Axle Mounted Disc Brakes
are under testing and expected to be
completed in FY18.
In the long-term, we would like
to invest more in this business
widening the moat. We shall expand
our product portfolio through
technology partnerships or inorganic
opportunities. We shall look at filling
technology gaps and approvals
for new products, while exploring
inorganic opportunities.
Q: Can we say that the Company is
reinventing itself?
A: The reinvention of the Company
is already happening and I am
convinced that this has not come
a day too soon. There is a growing
understanding that much of what we
know could be irrelevant across the
next decade. The priority of the day
then is to unlearn and re-learn; there
is a growing need to focus on ‘how
to think’ instead of the conventional
focus on ‘what to think!’
The ‘how’ related to thinking places
deep responsibilities on future-
focused companies like ours. For
instance, companies like ours will
need to step away from the routine
towards the imaginative cutting-edge;
companies like ours will need to
respond with ‘why not?’ instead of the
standard ‘why?’; companies like ours
will need to inspire, empower and
liberate people into a different kind
of thinking instead of complying with
the usual. The broad message is that
normal is going to be boring.
We are graduating from being product manufacturers into thought-leaders. We are transforming from being a conventional product company to one delivering wider, precision-based solutions, strengthening customer relationships.
Escorts Limited
18
18
Q: Is Escorts prepared?
A: We have embarked on the
journey to transform our destiny,
competitiveness and respect.
In the reinvented Escorts, the focus
is on ‘change now!’ as opposed to
‘change’. We are graduating from
being product manufacturers into
thought-leaders. We are transforming
from being a conventional product
company to one delivering
wider, precision-based solutions,
strengthening customer relationships.
We are evolving into a dependable
global manufacturing partner focused
on zero defects, data analytics and
predictive forecasting. We are now a
vibrant, youthful and gender-diverse
workplace that makes us one of the
most preferred employers in India.
Q: What are the other initiatives
undertaken to strengthen business
sustainability?
A: I am pleased to report that the
future-facing Escorts will accelerate
product launches, especially
directed at the international markets;
exports could account for a third
of the Company’s revenues in the
foreseeable future. We intend to
introduce Harvester, Implements and
Planters as a separate implements
business to address the requirements
of a vast market of tractor owners.
We believe that spare parts could be
a large business opportunity capable
of generating approximately 10% of
our annual topline. We are working
on initiatives that will bring our original
tractor parts closer to our customers,
within an attractive turnaround time-
frame.
I must also add that the basis of
organizational responsiveness is
a lean structure. In view of this,
Escorts is engaged in restructuring
with the objective to enhance
efficiency, discipline and customer
responsiveness. Escorts is also
working with leading, global auditing
firms to strengthen its governance
model and enhance stakeholder value.
Q: Is this constructive disruption
some distance away at Escorts?
A: At Escorts, I am happy to report that
this culture of constructive disruption
has begun and has already started to
reflect in our financials. Even as the
year 2016-17 was challenging, Escorts
outperformed India’s economy by a
factor of nearly 3x, which is creditable
for a company whose prospects are
driven largely by the national core
sectors.
We moderated our cost structure
through material and financial
savings; we grew our business
without straining the Balance Sheet,
resulting in a stronger ability to
service the declining debt on our
books, strengthening our long-
term sustainability. We generated
larger surpluses at a time of hesitant
consumer sentiment, accelerating our
virtuous cycle that I am confident will
translate into stronger financials and
competitiveness.
Q: What is this expected to achieve
for the Company?
A: I am optimistic that we expect to
transform from managing to scaling
the business, from a commitment to
hygiene to upscale, from responsibility
to accountability, from ‘might achieve’
to ‘will achieve’ and from aspiring
to doing. The bottomline is that
every Escortian will be the change
that he or she wants to see. I am
optimistic that as we proceed on this
disruptive journey with a Blue Ocean
mindset, we will enhance value for
all stakeholders associated with our
company.
Q: Where do you see Escorts in five
years? What is the strategic direction
of the Company?
A: We shall remain committed to
creating shareholder wealth and
nation-building in the areas of
agriculture, infrastructure and railways.
We shall keep on creating
technologically-superior products
through in-house, frugal innovation
and collaborations with technology
companies for step-jumps. We aim to
grow faster than the industry through
these innovative products and reach
industry-leading margins through
stronger pricing power of our brands
and technology, thereby enhancing
our profits.
Guided by the strategic value of
Customer Centricity, we shall take a
solutions-centric approach rather than
a product-centric approach. We shall
aim to build Escorts as an ‘employer of
choice’, thereby attracting, engaging
and retaining the best talent.
In the end, I would like to thank my
Board of Directors and Chairman for
their continued guidance and support.
There is a growing understanding that much of what we know could be irrelevant across the next decade. The priority of the day then is to unlearn and re-learn; there is a growing need to focus on ‘how to think’ instead of the conventional focus on ‘what to think!’
71st Annual Report 2016-17 19
STRATEGIC REPORT GOVERNANCE FINANCIAL STATEMENTS OTHER INFORMATION
How we have enhanced value in
Revenues (B in crores)
DefinitionIncome from operation gross of excise.
Why we measureThis measure reflects the result of our ability to understand
market trends and service customers with corresponding
products, superior technologies and competent supply
chain management.
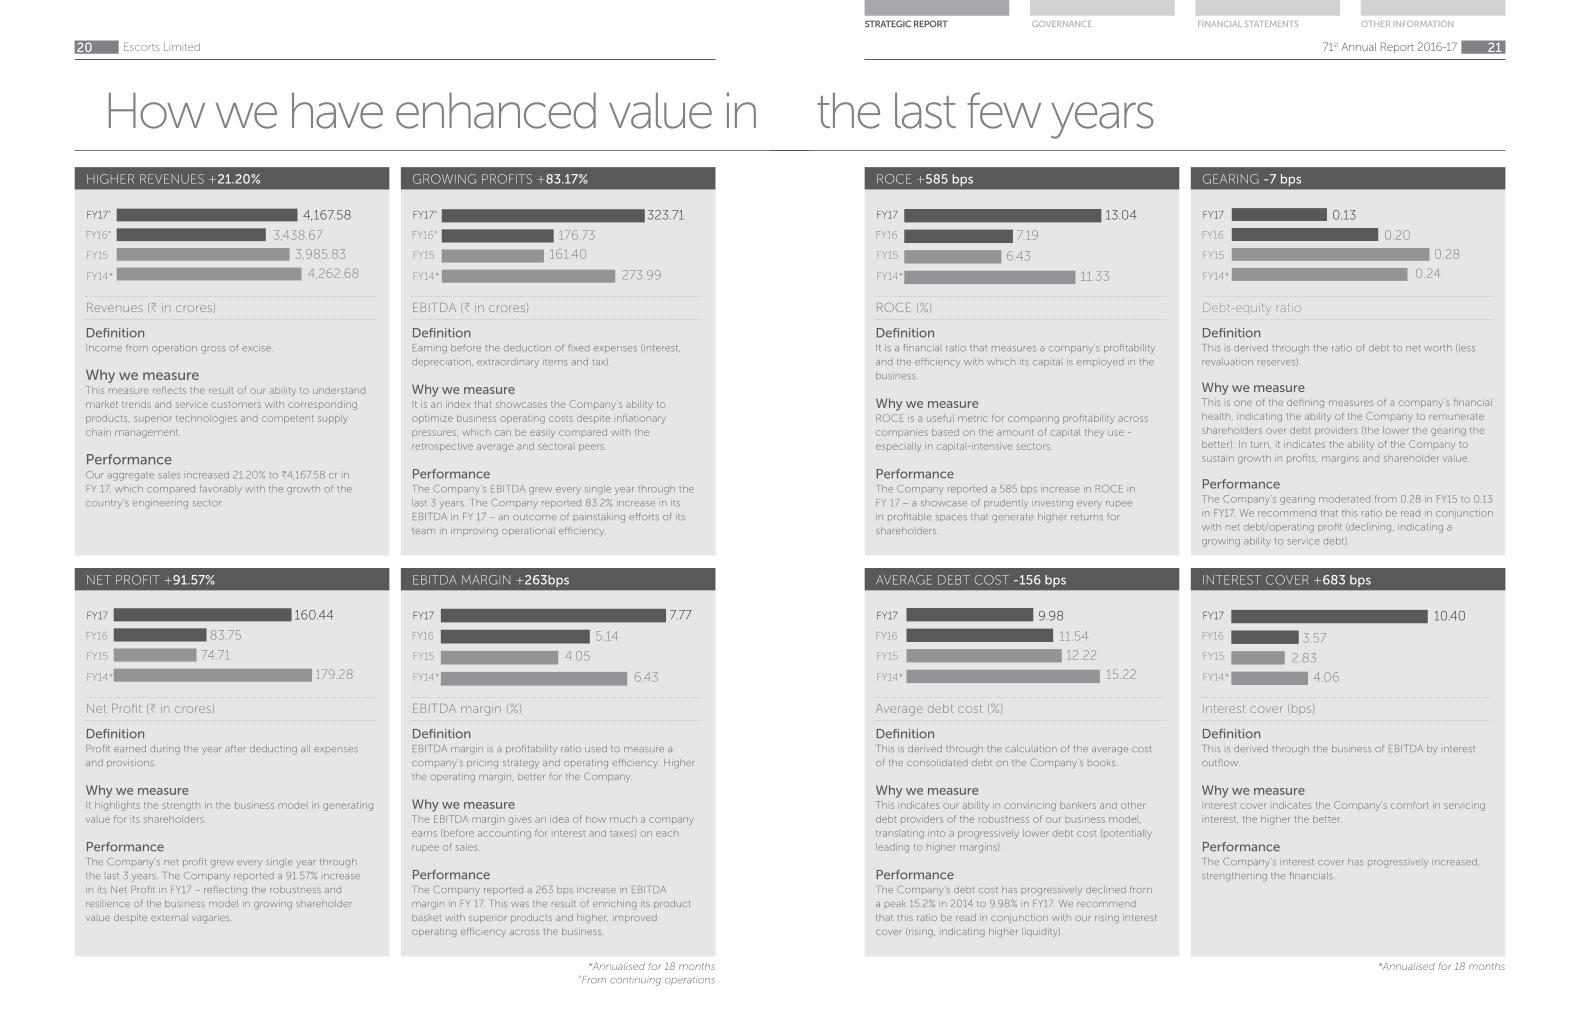
PerformanceOur aggregate sales increased 21.20% to B4,167.58 cr in
FY 17, which compared favorably with the growth of the
country’s engineering sector.
FY17^
FY16^
FY15
FY14* 1330.95
HIGHER REVENUES +21.20%
4,167.58
3,438.67
3,985.83
4,262.68
Net Profit (B in crores)
DefinitionProfit earned during the year after deducting all expenses
and provisions.
Why we measureIt highlights the strength in the business model in generating
value for its shareholders.
PerformanceThe Company’s net profit grew every single year through
the last 3 years. The Company reported a 91.57% increase
in its Net Profit in FY17 – reflecting the robustness and
resilience of the business model in growing shareholder
value despite external vagaries.
FY17
FY16
FY15
FY14* 1330.95
NET PROFIT +91.57%
160.44
83.75
74.71
179.28
EBITDA (B in crores)
DefinitionEarning before the deduction of fixed expenses (interest,
depreciation, extraordinary items and tax).
Why we measureIt is an index that showcases the Company’s ability to
optimize business operating costs despite inflationary
pressures, which can be easily compared with the
retrospective average and sectoral peers.
PerformanceThe Company’s EBITDA grew every single year through the
last 3 years. The Company reported 83.2% increase in its
EBITDA in FY 17 – an outcome of painstaking efforts of its
team in improving operational efficiency.
FY17^
FY16^
FY15
FY14* 273.99
GROWING PROFITS +83.17%
323.71
176.73
161.40
EBITDA margin (%)
DefinitionEBITDA margin is a profitability ratio used to measure a
company’s pricing strategy and operating efficiency. Higher
the operating margin, better for the Company.
Why we measureThe EBITDA margin gives an idea of how much a company
earns (before accounting for interest and taxes) on each
rupee of sales.
PerformanceThe Company reported a 263 bps increase in EBITDA
margin in FY 17. This was the result of enriching its product
basket with superior products and higher, improved
operating efficiency across the business.
FY17
FY16
FY15
FY14*
EBITDA MARGIN +263bps
7.77
5.14
4.05
6.43
*Annualised for 18 months^From continuing operations
Escorts Limited
20
20
the last few years
ROCE (%)
DefinitionIt is a financial ratio that measures a company’s profitability
and the efficiency with which its capital is employed in the
business.
Why we measureROCE is a useful metric for comparing profitability across
companies based on the amount of capital they use -
especially in capital-intensive sectors.
PerformanceThe Company reported a 585 bps increase in ROCE in
FY 17 – a showcase of prudently investing every rupee
in profitable spaces that generate higher returns for
shareholders.
FY17
FY16
FY15
FY14*
ROCE +585 bps
13.04
7.19
6.43
11.33
Average debt cost (%)
DefinitionThis is derived through the calculation of the average cost
of the consolidated debt on the Company’s books.
Why we measureThis indicates our ability in convincing bankers and other
debt providers of the robustness of our business model,
translating into a progressively lower debt cost (potentially
leading to higher margins).
PerformanceThe Company’s debt cost has progressively declined from
a peak 15.2% in 2014 to 9.98% in FY17. We recommend
that this ratio be read in conjunction with our rising interest
cover (rising, indicating higher liquidity).
FY17
FY16
FY15
FY14* 1330.95
AVERAGE DEBT COST -156 bps
9.98
11.54
12.22
15.22
Debt-equity ratio
DefinitionThis is derived through the ratio of debt to net worth (less
revaluation reserves).
Why we measureThis is one of the defining measures of a company’s financial
health, indicating the ability of the Company to remunerate
shareholders over debt providers (the lower the gearing the
better). In turn, it indicates the ability of the Company to
sustain growth in profits, margins and shareholder value.
PerformanceThe Company’s gearing moderated from 0.28 in FY15 to 0.13
in FY17. We recommend that this ratio be read in conjunction
with net debt/operating profit (declining, indicating a
growing ability to service debt).
FY17
FY16
FY15
FY14*
GEARING -7 bps
0.13
0.20
0.28
0.24
Interest cover (bps)
DefinitionThis is derived through the business of EBITDA by interest
outflow.
Why we measureInterest cover indicates the Company’s comfort in servicing
interest, the higher the better.
PerformanceThe Company’s interest cover has progressively increased,
strengthening the financials.
FY17
FY16
FY15
FY14*
INTEREST COVER +683 bps
10.40
3.57
2.83
4.06
*Annualised for 18 months
71st Annual Report 2016-17 21
STRATEGIC REPORT GOVERNANCE FINANCIAL STATEMENTS OTHER INFORMATION

“The year 2016-17 was extraordinary for Escorts; the Company reported profitable growth in a challenging year.”
Bharat Madan, Group Chief Financial Officer
Business overviewEscorts Limited is one of India’s
leading agri machinery companies
with a substantial portfolio of
premium, higher HP tractors.
The Company also possesses an
unmatched construction equipment
portfolio that is used across a
wide range of core infrastructure
developmental projects. These
business units, together with the fast-
growing railway business, positioned
us attractively to capitalize on sectoral
opportunities.
Overall, the Company performed
well in 2016-17, led by a strong
performance of the agri-machinery
business after two years of lacklustre
growth. The construction equipment
business reported positive EBIT in the
fourth quarter of 2016-17; the railways
business saw its EBIT grow 36.66%
during the year.
The agri-machinery business
continued to contribute the
largest chunk of about 80.3% to
the consolidated revenues from
continuing operations and 114.5% to
the consolidated EBITDA.
Our strengthening financials
Financial dashboard
Agri-Machinery Sales volumes (units)
2015-16 2016-17
51,455 63,786
23.96 % growth
Revenue (B crore)
2015-16 2016-17
2,734.28 3,346.00
22.37 % growth
EBIT (B crore)
2015-16 2016-17
223.56 344.65
54.16 % growth
Escorts Limited
22
22
Construction Equipment Sales volumes (units)
2015-16 2016-17
2,555 3,315
29.75 % growth
Revenue (B crore)
2015-16 2016-17
496.51 606.76
22.20 % growth
EBIT (B crore)
2015-16 2016-17
(25.73) (13.82)
46.30 % growth
Railway EquipmentRevenue (B crore)
2015-16 2016-17
227.76 242.47
6.46 % growth
EBIT (B crore)
2015-16 2016-17
22.45 30.67
36.66 % growth
Earnings per share profileEarnings per share (B)
2015-16 2016-17
6.97 13.43
92.73 % growth
Net profit profileNet profit (B crore)
2015-16 2016-17
83.75 160.44
91.57 % growth
Net profit margin (%)
2015-16 2016-17
2.37 3.80
144 bps growth
Market capitalization (BSE)Market capitalization* (B crore)
As on 31 March 2016 As on 31 March 2017
1,708.7 6,603.8
286 % growth
* Refers to day-close market capitalization
The agri-machinery business continued to contribute the largest chunk of about 80.3% to the consolidated revenues from continuing operations and 114.5% to the consolidated EBITDA.
71st Annual Report 2016-17 23
STRATEGIC REPORT GOVERNANCE FINANCIAL STATEMENTS OTHER INFORMATION

Agri Machinery
2016-17 revenues:
B 3,346 crore
Revenue growth over
2015-16: 22.4%
Percentage contribution to Company
revenues: 80.3%
Business review
Escorts Limited
24
24
Overview
Established almost half a century back, Escorts’ agri-
machinery business is among the oldest in India,
launched with the intention of reducing farmer
workload and enhancing agricultural productivity
through farm mechanization.
Over the years, Escorts has transformed into a
technology-led and innovation-driven enterprise,
catering to the holistic needs of the Indian farmer
through established brands like Powertrac and
Farmtrac that offer superior design, comfort, safety,
mileage and performance.
The Company’s brands enjoy superior recall on
account of their widespread farm presence; there are
over 10 lac Escorts tractors across Indian farms today,
helping the country enhance agricultural productivity
across crop and soil types.
2016-17 segment
EBIT: B344.7 crore
Segment EBIT
growth over 2015-16:
54.2%
Principal tractor brands:
Powertrac and Farmtrac
Manufacturing facility location:
Faridabad, Haryana
Farmtrac (35+ HP) – Volume Contribution:
42.1%
Powertrac (25-60 HP) – Volume
Contribution: 56.5%
Steeltrac (<20 HP) – Volume Contribution:
1.4%
Annual tractor production
capacity: 1 lac units
71st Annual Report 2016-17 25
STRATEGIC REPORT GOVERNANCE FINANCIAL STATEMENTS OTHER INFORMATION

Strengths
Innovation: Escorts
introduced 20+ products/
variants over three years;
volumes of 21,066 units in
2016-17 were derived from
products launched in the
last three years
Visibility: Escorts is
among the largest
tractor companies in
the largest market of
the world; the brand
enjoys a 16.3% share
in its core markets of
presence (North and
Central India)
Integrated: Escorts
manufactures
almost 70% of
critical components
in-house, ensuring
tighter cost and
quality control
Range: Escorts provides one
of the largest tractors range
of 225 variants/ models (25-
75 HP) that comprehensively
covers the country’s mid and
premium segments
Footprint: Escorts
tractors are marketed in
more than 54 countries
(Europe, Africa, SAARC
countries, West Asia,
South East Asia and
Latin America, among
others)
Distribution: Escorts’
800+ strong dealer
network plus 1,100+ sales
outlets distribute products,
provide after-sales service
and after-market tractor
dealership
Products: The
Escorts value
proposition is
centred around two
cherished brands –
Powertrac (mid-
range brand, 25-60
HP) and Farmtrac
(premium brand,
34-75 HP)
Extension: Escorts has
extended beyond product
focus to holistic crop
solutions, transforming
a one-off farmer
engagement into an
ongoing relationship
Locations: Escorts tractors
are manufactured in three
Faridabad units (Haryana)
and one in Poland (Europe)
with a cumulative annual
installed capacity of over
1,00,000 units per annum
Escorts Limited
26
26
• Advanced all-India market share
by 50 bps to 10.8%, a creditable
achievement in a competitive
environment. The Company gained
market share across all major states;
the market share in strong markets
was up 100 basis points and in
opportunity markets it was up 50 basis
points
• Increased tractor production by 24%
to 12359 units. Domestic sales grew at
24% to 12001 units
• Achieved near-homogenous market
share gains, indicating the successful
play-out of our customer acquisition
and retention strategies; at a granular
level, in our northern stronghold
markets, we became stronger while
enhancing share across southern
markets, our emerging geographical
focus area
• Launched the Powertrac Euro
Series brand in the higher HP (60 HP)
tractor category; the portfolio enabled
the Company to reap higher EBITDA
contributions because of the premium
nature of this tractor brand, which was
targeted at the sophisticated markets
of Punjab, Haryana, Rajasthan, etc.;
launched Powertrac Euro 45 and 50
(41-50 HP tractors), which combined
style and comfort with power and
performance
• Introduced Farmtrac 6055 T20
Classic, the world’s first dual HP
tractors with a 20-speed gearbox; the
product was well-received, especially
since the Company offered extended
peak performance with service
only after 500 hours of equipment
utilization; also launched the Farmtrac
Classic Series (41-50 HP), positioning
it as ‘kheton ka king’ – the product
enjoys a combination of best-in-class
modern design, powerful looks and
world-class technology
• The Anti-Lift Tractors (ALT) Series
provided users the convenience of
equipment ‘anti-lift’, enabling a larger
haulage while protecting the asset
from damage
• Reported higher exports under our
Heritage Series comprising powerful
75 HP and 90 HP tractors in the
markets of Cambodia, Bangladesh,
South Africa, Poland and Germany,
etc; exports grew 44% to 1,087 units
• Focused on major shopfloor cost
optimization initiatives anchored
around value-engineering, resource
consumption moderation, enhanced
automation, superior equipment
design cum functionality with higher
people productivity
Our respected tractor brands
Core operating highlights, 2016-17
Economy and mid-range brand addressing the largest tractor category (58% share)
25-60 HP tractors
Symbol of superior fuel-efficiency and frugal engineering
Positioned around the concept of ‘Save more’
Powertrac
Aspirational, premium and prestigious
34-75 HP tractors in India, and up to 120 HP globally
Symbolizes the need for higher farm mechanization
Positioned around the concept of ‘Earn more’
Farmtrac
71st Annual Report 2016-17 27
STRATEGIC REPORT GOVERNANCE FINANCIAL STATEMENTS OTHER INFORMATION

• Sustained Project Shikhar (launched
June 2014) to moderate raw material
costs with the objective to strengthen
EBITDA margins from this business.
During the year under review, the
Company sustained cost moderation
by 90 basis points to 67%, translating
into enhanced competitiveness.
• Extended beyond product sales to
holistic crop solutions. The Company
entered this exciting niche through
services to farmers in Odisha and
Andhra Pradesh without their having
to buy tractors, validating its presence
through enhanced farmer productivity.
• Responded to a growing customer
preference for higher denomination
(41 to 50 HP) tractors on account
of better productivity, collaborative
farming and higher irrigation intensity.
In line with this, Escorts introduced the
Euro 45 and Euro 50 series under the
Powertrac brand and Classic Series in
the 41-50 HP category of the Farmtrac
brand in FY16. The launch of these
models helped the Company arrest
decline and improve market share
with a 120 bps rebound to 10.9% in
FY16 and 80 bps gain to 11.7% in FY17.
How Escorts is disrupting the status
quo through Powertrac ALT
This brand was introduced as a
haulage-cum-agriculture product.
Ideal for river beds, mining and areas
with unsafe gradient. The traction was
positive and the Company intends to
increase volumes.
How Escorts is disrupting the status
quo through Farmtrac 6055 T20
Classic
Launched the world’s first dual HP
tractor with a 20-speed gearbox. Well
received. Offering 25% higher fuel-
efficiency. Provides extended peak
performance with service only after
500 hours of equipment utilization.
Prestigious recognition for our
shopfloor!
Our Agri Machinery units received the
TPM Award for Shopfloor Excellence
from the highly respected Japan
Institute of Plant Maintenance.
Our product basket
Tractors
Farmtrac (34-75 HP)
Powertrac (25-60 HP)
Crop Solutions
Agriculture applications
Non-agriculture applications
Engine Gensets
Escorts ‘G’ series engines
Escorts gensets
Lubricants
Suraksha
Continued focus on premiumization – Growing share of higher HP tractors
<30 HP 31-40 HP 41-50 HP >50 HP
2015-16 2016-17 2015-16 2016-17 2015-16 2016-17 2015-16 2016-17
2.0% 1.8% 45.4% 40.6% 48.7% 53.1% 3.9% 4.5%
Escorts Limited
28
28
Financial commentary • Over the past few years, EBIT
margins consistently improved on the
back of premium pricing, new product
launches of a higher HP denomination
and focused value-engineering
• In 2016-17, EBIT margins rode these
factors as well as sectoral growth
(tractor volumes increased to 5.81 lacs
units from 4.93 lacs units in 2015-16)
Focus areas
• Escorts charted a three-year
roadmap for this business - higher
tractor market share, aligning cost-
to-value to global benchmarks and
higher EBIT margin
• The business expects to increase
product launches in the higher HP
category; the business also expects
to focus on launching customized
tractors for specific crops and soil
fertility levels
• The business intends to access
cutting-edge global technology that
could strengthen its positioning
• The business intends to enlarge the
coverage of its crop solutions across
a larger geographic area, reaching a
larger community of farmers
• The business intends to grow the
contribution of exports following
traction of the Heritage brand in
existing markets and new markets of
Africa, South East Asia and specific
markets of the US and Europe.
• The business will focus on capacity
ramp-up through increasing utilization
(~66%), which will not only enable
the Company to counter competition
better but to generate a superior
ROCE following higher revenues
• The business intends to sustain
marketing and other customer-centric
activities, continuing to educate the
target audience on the importance of
farm mechanization, the deep utility
of Escorts tractors, demonstrating
appropriate farming methods and
enhancing equipment utilization on
model farms
Key financial highlights, 2016-17 Revenues (B crore)
2012-14*
2014-15
2015-16
2016-17
2,734
3,2103,522
3,3
46
EBIT margin (%)
2012-14*
2014-15
2015-16
2016-17
8.2
7.1
10
10
.3
Tractor volumes (units)
2012-14*
2014-15
2015-16
2016-17
51,455
59,779
68,963
63
,78
6
RoCE (%)
2012-14*
2014-15
2015-16
2016-17
21.8
21.4
33.6
32
.0
*Annualised
71st Annual Report 2016-17 29
STRATEGIC REPORT GOVERNANCE FINANCIAL STATEMENTS OTHER INFORMATION

The growth in India’s
tractor market, 2016-17 (%)
18The growth at Escorts’ tractor
business, 2016-17 (%)
24The annual
market (lacs) for tractors in India, the largest in the world, 2016-17
5.81Number of
Escorts tractors sold in domestic market, 2016-17
62,699
Escorts share of the premium (50HP+) Indian tractor market,
2016-17 (%)
6.9Escorts share of the Indian tractor market, 2016-17
(%)
10.8
The opportunity landscape
Escorts Limited
30
30
Optimism from the Business Head
After two successive de-growth years, the Indian tractor industry grew 18%
to 5.81 lacs units in 2016-17. The long-term structural fundamentals are
strong: increasing farm mechanization, minimum support prices for key
crops, labour scarcity, easy government credit availability, lower equipment
replacement cycle and hopes of good monsoons (medium-term).
“At Escorts Agri Machinery, our principal objective will be to strengthen the
existing business and rejuvenate the income profile through increased revenues
derived from new products and new business initiatives.
“On the one hand, we will continue to launch higher HP tractors backed by
ownership prestige, distinctive functionality, ease of use and optimized operating
costs. On the other hand, we intend to graduate beyond product to service
through the delivery of overall crop solutions, which we believe will help farmers
drive productivity, yields and income.
“We believe that a sizable opportunity awaits us in the international markets,
where we are optimistic of increasing sales from about 1,000-plus tractors in
2016-17 to about 8,000 to 10,000 units across the medium-term.
“This dynamic combination of projected growth from our existing business,
coupled with the reinvention of our approach from product to service and a
larger export footprint should graduate the performance of our flagship business
to the next level with extensive implications for the entire company.”
Mr. Ravi Menon, CEO, Escorts Agri Machinery
71st Annual Report 2016-17 31
STRATEGIC REPORT GOVERNANCE FINANCIAL STATEMENTS OTHER INFORMATION

Construction Equipment
Business review
Escorts Limited
32
32
OverviewTo leverage deep engineering skills and
production infrastructure by the virtue
of a longstanding presence in tractor
manufacturing, the construction equipment
business was launched in 1971. Over the
years, the business has come to offer
holistic solutions that find application in
core construction infrastructure sectors
like roads, real estate, mining, irrigation,
power, urban development and airports,
through material handling and construction
equipment. With a near 10% market share
in the served market, the Escorts brand
enjoys an attractive offtake of pick-and-
carry cranes, backhoe loaders, compactors,
construction cranes (like Rough Terrain
360-degree Slew Cranes, Tower Cranes) and
forklift trucks.
The Company pioneered the concept of
pick-n-carry hydraulic mobile cranes in
India around 40 years ago and extended
the product portfolio by manufacturing
cranes in technical collaboration with Faun
(Germany), Ransom & Rapier (UK) and
Franna (Australia).
The business also ventured into the
manufacture of vibratory compactors; it
is credited with manufacturing the first
vibratory compactors in India in the 80s.
Initially, compactors were manufactured
in technical collaboration with Dynapac
(Sweden) and later, new generations of
compactors were introduced in India
through a technical tie-up with HAMM
(Germany).
The business made a foray into the
earthmoving segment with the launch of
its in-house designed backhoe loader a few
years ago, gradually establishing itself as a
key player in the segment.
The Company has a pan-India network of
16 sales offices, 120 dealership locations
and over 300 company-trained service
engineers. The Company launched initiatives
under the banner of ‘Being Proactive and
Customer Centric’ with the objective to ‘Get,
Keep & Grow’ the customer base.
Revenue growth over
2015-16: 22.20%
Percentage contribution to Company
revenues: 14.5%
2016-17 revenues: B606.76
crore
Manufacturing facility
location: Faridabad, Haryana
Principal products:
Material Handling, Earth Moving
and Road Compaction
Material Handling
Equipment
• Hydraulic mobile
cranes
• Construction cranes
like Slew Cranes &
Tower Cranes
• Forklifts Trucks
1Earth Moving
Equipment
• Backhoe loaders
• Loaders2
Emerging Products
• Compactors
• Motor Graders
• Other Utility
equipment
3
71st Annual Report 2016-17 33
STRATEGIC REPORT GOVERNANCE FINANCIAL STATEMENTS OTHER INFORMATION
Strengths
Our customers
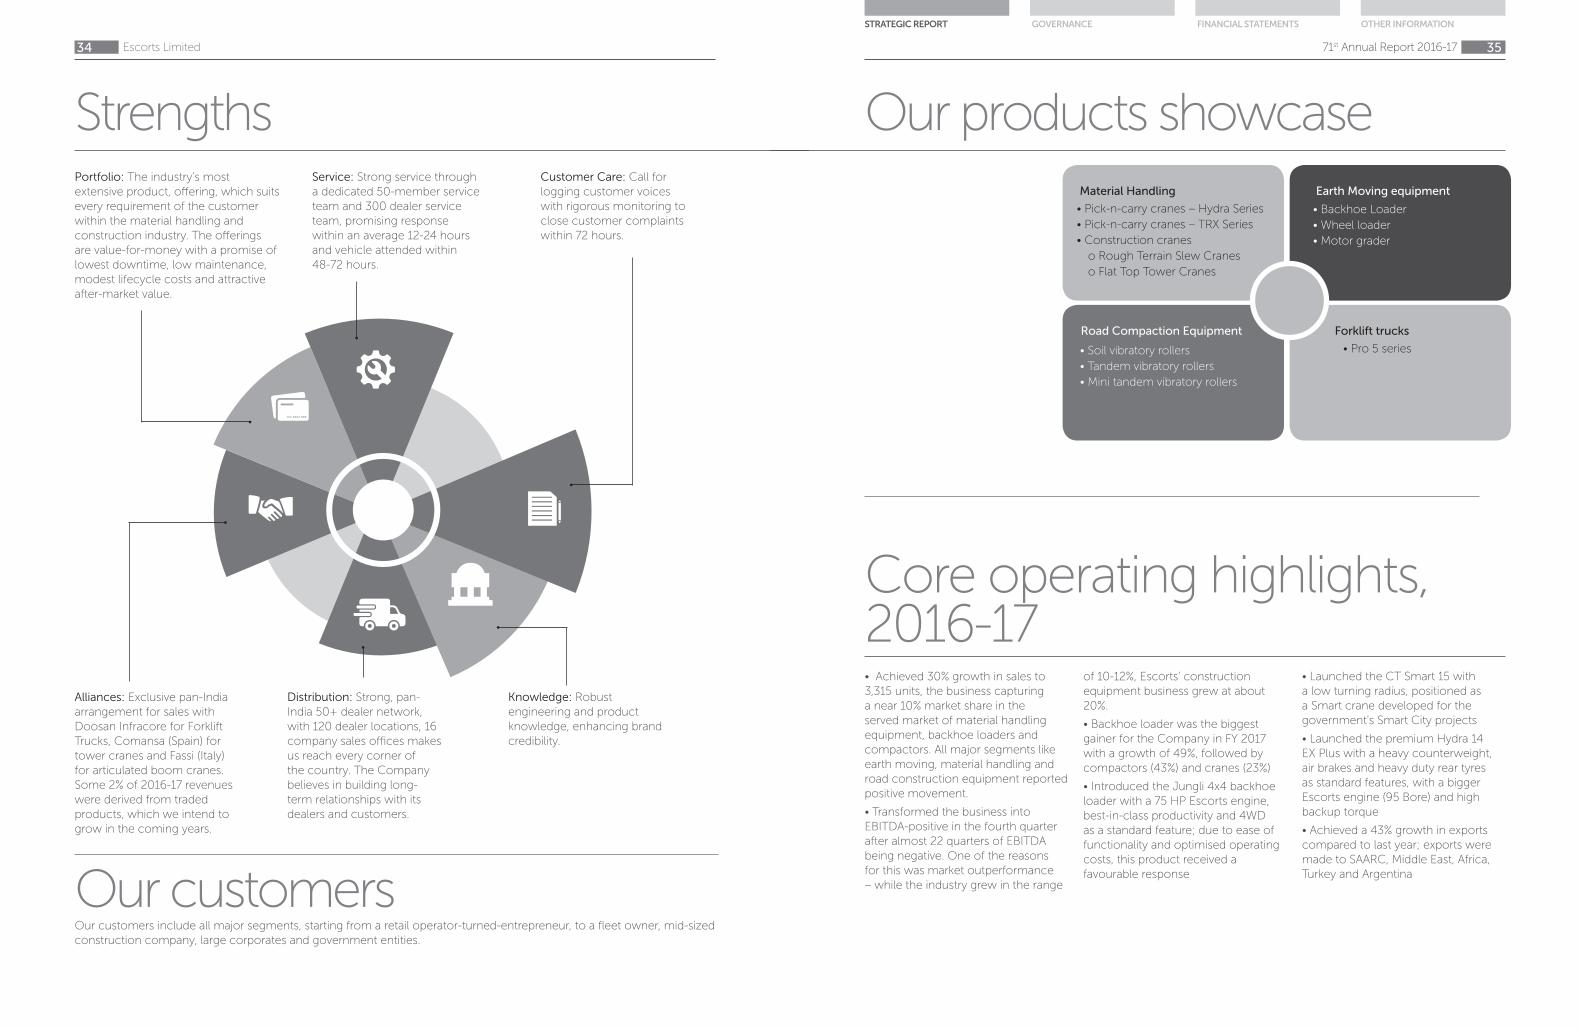
Portfolio: The industry’s most
extensive product, offering, which suits
every requirement of the customer
within the material handling and
construction industry. The offerings
are value-for-money with a promise of
lowest downtime, low maintenance,
modest lifecycle costs and attractive
after-market value.
Service: Strong service through
a dedicated 50-member service
team and 300 dealer service
team, promising response
within an average 12-24 hours
and vehicle attended within
48-72 hours.
Customer Care: Call for
logging customer voices
with rigorous monitoring to
close customer complaints
within 72 hours.
Alliances: Exclusive pan-India
arrangement for sales with
Doosan Infracore for Forklift
Trucks, Comansa (Spain) for
tower cranes and Fassi (Italy)
for articulated boom cranes.
Some 2% of 2016-17 revenues
were derived from traded
products, which we intend to
grow in the coming years.
Our customers include all major segments, starting from a retail operator-turned-entrepreneur, to a fleet owner, mid-sized
construction company, large corporates and government entities.
Distribution: Strong, pan-
India 50+ dealer network,
with 120 dealer locations, 16
company sales offices makes
us reach every corner of
the country. The Company
believes in building long-
term relationships with its
dealers and customers.
Knowledge: Robust
engineering and product
knowledge, enhancing brand
credibility.
$
Escorts Limited
34
34
• Achieved 30% growth in sales to
3,315 units, the business capturing
a near 10% market share in the
served market of material handling
equipment, backhoe loaders and
compactors. All major segments like
earth moving, material handling and
road construction equipment reported
positive movement.
• Transformed the business into
EBITDA-positive in the fourth quarter
after almost 22 quarters of EBITDA
being negative. One of the reasons
for this was market outperformance
– while the industry grew in the range
of 10-12%, Escorts’ construction
equipment business grew at about
20%.
• Backhoe loader was the biggest
gainer for the Company in FY 2017
with a growth of 49%, followed by
compactors (43%) and cranes (23%)
• Introduced the Jungli 4x4 backhoe
loader with a 75 HP Escorts engine,
best-in-class productivity and 4WD
as a standard feature; due to ease of
functionality and optimised operating
costs, this product received a
favourable response
• Launched the CT Smart 15 with
a low turning radius, positioned as
a Smart crane developed for the
government’s Smart City projects
• Launched the premium Hydra 14
EX Plus with a heavy counterweight,
air brakes and heavy duty rear tyres
as standard features, with a bigger
Escorts engine (95 Bore) and high
backup torque
• Achieved a 43% growth in exports
compared to last year; exports were
made to SAARC, Middle East, Africa,
Turkey and Argentina
Our products showcase
Core operating highlights, 2016-17
Material Handling
• Pick-n-carry cranes – Hydra Series
• Pick-n-carry cranes – TRX Series
• Construction cranes
o Rough Terrain Slew Cranes
o Flat Top Tower Cranes
Earth Moving equipment
• Backhoe Loader
• Wheel loader
• Motor grader
Road Compaction Equipment
• Soil vibratory rollers
• Tandem vibratory rollers
• Mini tandem vibratory rollers
Forklift trucks
• Pro 5 series
71st Annual Report 2016-17 35
STRATEGIC REPORT GOVERNANCE FINANCIAL STATEMENTS OTHER INFORMATION

Key financial highlights, 2016-17 Revenues (B crore)
2012-14*
2014-15
2015-16
2016-17
496.5
515.8
466.8
60
6.8
Total volumes (units)
2012-14*
2014-15
2015-16
2016-17
2,555
3,007
2,793
3,3
15
*Annualised
Financial commentary • The business focused on product premiumization; all
three major products launched during 2016-17 addressed
the premium range with a cascading impact on revenues
and return on capital employed
• The business’s focus on expanding volumes –
domestically and exports – facilitated a superior coverage
of fixed costs and margins expansion
• Focused cost optimization led to enhanced margins
Focus areas
• Rationalization of material costs through better
negotiations with material suppliers
• Enrichment of the product mix to target higher margins
and faster swing-back to sustainable profitability
• Increase in sales to neighboring markets by setting up
a more robust dealership structure; focus on backhoe
loaders for exports to the Middle East
• Strengthening of network utilization and market access,
leveraging the dealership of Escorts’ agri machinery
business in Asia
• Increasing sales of spare parts to strengthen revenue
streams
• Expansion of dealerships and outlet reach; exploring
channel financing
• Graduating to sales of higher segments (14 or 15
tonnes) which are now seeing a superior traction
• Growth of the business at 10% to 12% CAGR for two to
three years by launching innovative products
Escorts Limited
36
36
Optimism from the Business Head
As per PwC estimates, the infrastructure market could reach US$6.6 trillion
by 2025. The Indian government has already called for an investment of
US$1.0 trillion in infrastructure between 2017 and 2022.
“Assuming that the construction equipment penetration remains at the current
level, the industry would have a potential to generate about US$20 billion worth
of business in the next five years. This is an unprecedented level of opportunity
for the construction equipment space.”
“We are on the path of recovery and rebuilding our product portfolio to
capitalize on this mammoth opportunity by:
• Developing means to understand and address the evolving and future needs
of our customers
• Revitalizing our pioneering spirit
• Expanding our product portfolio to increase our served markets
• Developing aftermarket products and capability to create differentiation
The industry has already hit the sweet spot and we are attractively placed to
benefit.”
Mr. Ajay Mandahr, CEO, Escorts Construction Equipment
71st Annual Report 2016-17 37
STRATEGIC REPORT GOVERNANCE FINANCIAL STATEMENTS OTHER INFORMATION

Railway Equipment
2016-17 revenues:
B 242.5 crore
Revenue growth over
2015-16: 6.5%
Percentage contribution to Company
revenues: 5.8%
Business review
Escorts Limited
38
38
Overview
Escorts ventured into this segment in 1962 in view of
the vast sectoral opportunity. The business is engaged
in the manufacture of cutting-edge products for the
Indian Railways backed by a world-class R&D team.
The business has specialized in the safety, comfort
and reliability niche.
In an important development, the business of auto
products was divested in favour of Pune-based Badve
Engineering Limited in 2016, to cut losses and vacate
a business that required consistent capital infusion.
The sum realized out of the sale was used strategically
across the Group, benefiting businesses.
The RED business is a market leader across all
product offerings. The business develops cutting-
edge technology products in a state-of-the-art
research and design facility (Faridabad) through
collaboration with leading technology providers. The
business is ISO 9001:2008-certified with products
conforming to Indian RDSO (Research Design &
Standards Organization) and international standards
(UIC and AAR, among others). The business received
the Railway industry’s most coveted certification – IRIS
Certification – which will enhance the global brand of
the business. The business forged seven partnership
agreements with prominent global players with the
overriding agenda of rapid localization of components
manufacture in India.
The business’s manufacturing facility is spread across
12,500 sq. m (Faridabad), housing robust production
and testing facilities. The business also possesses
strong quality practices and systems backed by state-
of-the-art calibration facilities and a standard room
(including automatic 3D CMM and other facilities
selected around MSA principles).
2016-17 segment
EBIT: B30.7 crore
Segment EBIT
growth over 2015-16:
36.7%
Principal products: Safety and
ride-handling railway
products
Manufacturing location:
Faridabad, Haryana
71st Annual Report 2016-17 39
STRATEGIC REPORT GOVERNANCE FINANCIAL STATEMENTS OTHER INFORMATION
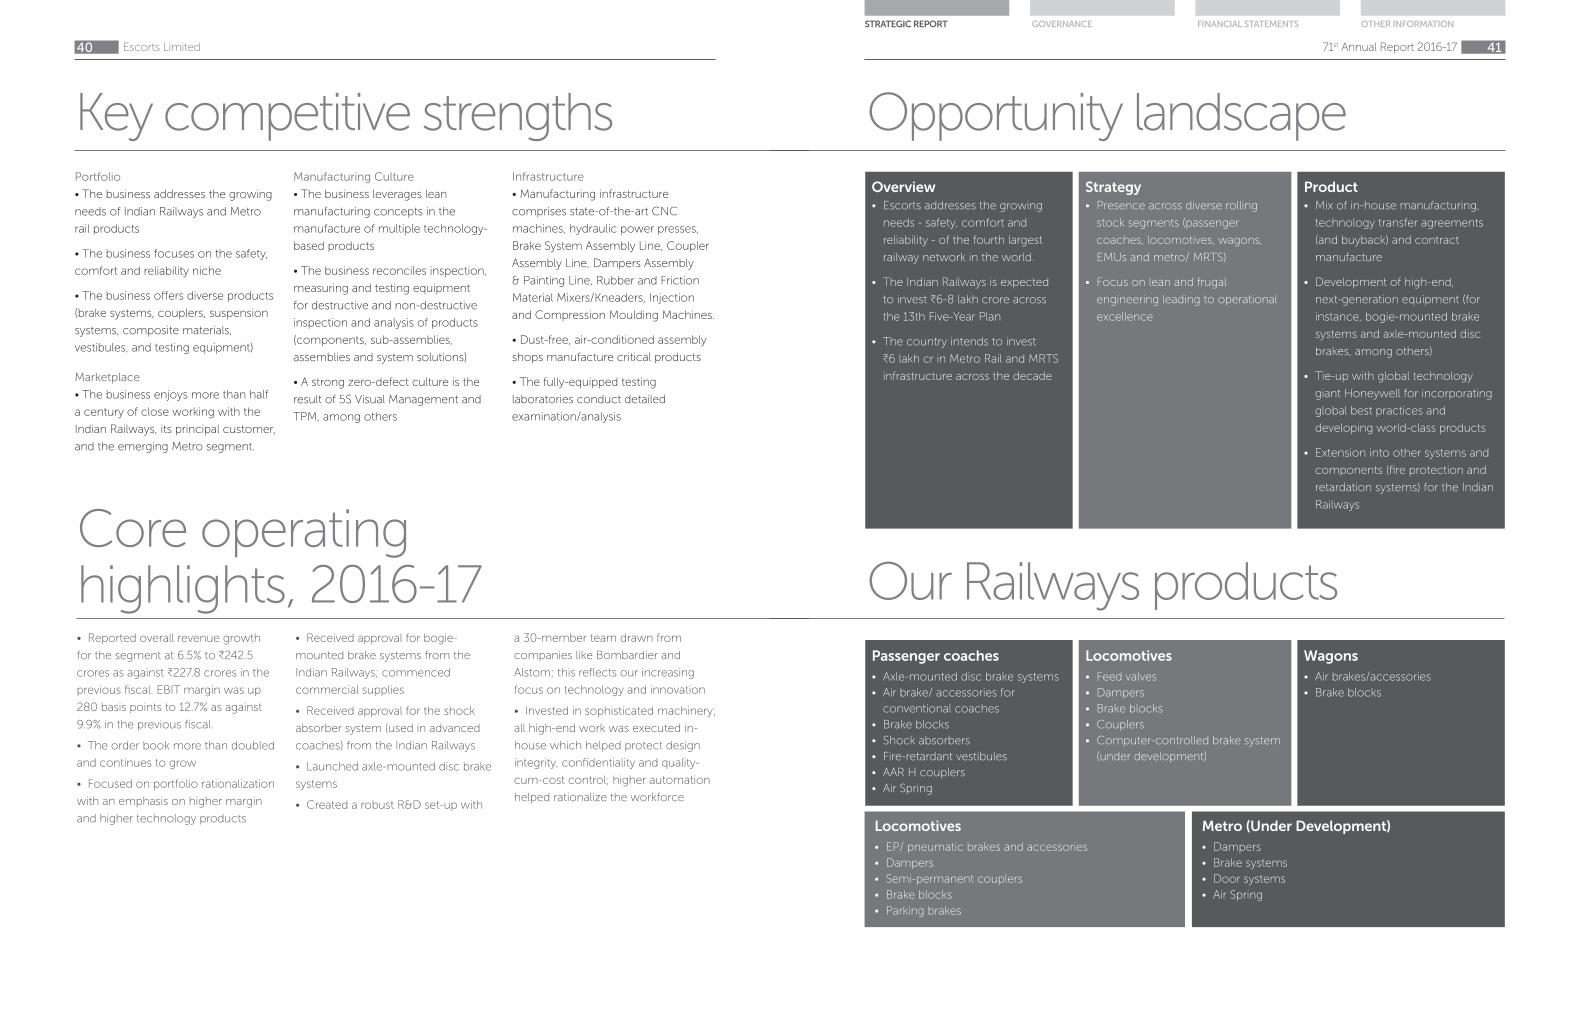
Key competitive strengths Portfolio
• The business addresses the growing
needs of Indian Railways and Metro
rail products
• The business focuses on the safety,
comfort and reliability niche
• The business offers diverse products
(brake systems, couplers, suspension
systems, composite materials,
vestibules, and testing equipment)
Marketplace
• The business enjoys more than half
a century of close working with the
Indian Railways, its principal customer,
and the emerging Metro segment.
Manufacturing Culture
• The business leverages lean
manufacturing concepts in the
manufacture of multiple technology-
based products
• The business reconciles inspection,
measuring and testing equipment
for destructive and non-destructive
inspection and analysis of products
(components, sub-assemblies,
assemblies and system solutions)
• A strong zero-defect culture is the
result of 5S Visual Management and
TPM, among others
Infrastructure
• Manufacturing infrastructure
comprises state-of-the-art CNC
machines, hydraulic power presses,
Brake System Assembly Line, Coupler
Assembly Line, Dampers Assembly
& Painting Line, Rubber and Friction
Material Mixers/Kneaders, Injection
and Compression Moulding Machines.
• Dust-free, air-conditioned assembly
shops manufacture critical products
• The fully-equipped testing
laboratories conduct detailed
examination/analysis
• Reported overall revenue growth
for the segment at 6.5% to B242.5
crores as against B227.8 crores in the
previous fiscal. EBIT margin was up
280 basis points to 12.7% as against
9.9% in the previous fiscal.
• The order book more than doubled
and continues to grow
• Focused on portfolio rationalization
with an emphasis on higher margin
and higher technology products
• Received approval for bogie-
mounted brake systems from the
Indian Railways; commenced
commercial supplies
• Received approval for the shock
absorber system (used in advanced
coaches) from the Indian Railways
• Launched axle-mounted disc brake
systems
• Created a robust R&D set-up with
a 30-member team drawn from
companies like Bombardier and
Alstom; this reflects our increasing
focus on technology and innovation
• Invested in sophisticated machinery;
all high-end work was executed in-
house which helped protect design
integrity, confidentiality and quality-
cum-cost control; higher automation
helped rationalize the workforce
Core operating highlights, 2016-17
Escorts Limited
40
40
Opportunity landscape
Our Railways products
Overview
• Escorts addresses the growing
needs - safety, comfort and
reliability - of the fourth largest
railway network in the world.
• The Indian Railways is expected
to invest B6-8 lakh crore across
the 13th Five-Year Plan
• The country intends to invest
B6 lakh cr in Metro Rail and MRTS
infrastructure across the decade
Passenger coaches
• Axle-mounted disc brake systems
• Air brake/ accessories for
conventional coaches
• Brake blocks
• Shock absorbers
• Fire-retardant vestibules
• AAR H couplers
• Air Spring
Strategy
• Presence across diverse rolling
stock segments (passenger
coaches, locomotives, wagons,
EMUs and metro/ MRTS)
• Focus on lean and frugal
engineering leading to operational
excellence
Locomotives
• Feed valves
• Dampers
• Brake blocks
• Couplers
• Computer-controlled brake system
(under development)
Locomotives
• EP/ pneumatic brakes and accessories
• Dampers
• Semi-permanent couplers
• Brake blocks
• Parking brakes
Metro (Under Development)
• Dampers
• Brake systems
• Door systems
• Air Spring
Product
• Mix of in-house manufacturing,
technology transfer agreements
(and buyback) and contract
manufacture
• Development of high-end,
next-generation equipment (for
instance, bogie-mounted brake
systems and axle-mounted disc
brakes, among others)
• Tie-up with global technology
giant Honeywell for incorporating
global best practices and
developing world-class products
• Extension into other systems and
components (fire protection and
retardation systems) for the Indian
Railways
Wagons
• Air brakes/accessories
• Brake blocks
71st Annual Report 2016-17 41
STRATEGIC REPORT GOVERNANCE FINANCIAL STATEMENTS OTHER INFORMATION

Focus areas
• Develop technology-
oriented Brake Systems for
all types of rolling stock,
enhancing manufacturing,
engineering and testing
capabilities
• Optimize manpower and
enhance productivity
• Progressively indigenise
products like Axle Mounted
Disk Brakes, enhancing
margins
• Proposed launch
of Locomotive Brake
Electronics, a high margin
product
• Enhance presence across
the country’s Metro network
New era of Indian Railways
With the Spanish Talgo trains on trial run in India, the age of sophisticated trains in India has arrived. This train can significantly moderate travel time with speeds of up to 200-350 kmph. The Tejas trains connecting Mumbai and Goa have already shrunk travel time by a third, ushering a new modernization wave across the Indian Railways network!
Unprecedented metro expansion
The Union government is all set to double the metro rail network over the next 18 months adding four new cities to the metro map. By March 2019, 19 new sections in nine cities would be commissioned, adding 313 kilometres to the existing 370-km metro network. Statistically this translates to 313 km made operational in 19 months as compared to 370 km made operational over the last 33 years in eight cities since the first metro service began in Kolkata in 1984.
Key financial highlights, 2016-17 Revenues (B crore)
2012-14*
2014-15
2015-16
2016-17
227.8
183.8
182.5
24
2.5
EBIT margin (%)
2012-14*
2014-15
2015-16
2016-17
9.9
9.5
8.5
12
.7
RoCE (%)
2012-14*
2014-15
2015-16
2016-17
22.8
14.2
14.7
41.0
*Annualised
Escorts Limited
42
42
Optimism from the Business Head
The Indian Railways offers a large opportunity for growth considering that
the total Plan Expenditure during the 12th Five-Year Plan was increased
to USD 70 billion from the 11th Five-Year Plan level of USD 32 billion.
Besides, as per the Rail Budget 2016, as much as B8.5 trillion will be invested in
the railways over five years.
“These investments will be made in Indian Railways, Metro systems for Tier-2
cities, dedicated freight corridors and high-speed railway corridors and new
technology.”
“In a landmark development, the Narendra Modi government allowed 100% FDI
in railways infrastructure, which has opened the market to larger investments in
sophisticated technology.”
“With decades of rich experience in the manufacture of critical railway
systems (safety and comfort), Escorts has played a major role in the ongoing
modernization of the Indian Railways. With a strong product pipeline, world-
class manufacturing and technological partnerships, a robust R&D setup and
multi-year supply relationships, we are poised to achieve our aspiration of
emerging among the top two component and solution providers to the Indian
Railways and Metro network across the next five years.”
Mr. Dipankar Ghosh, CEO, Railway Equipment Division
71st Annual Report 2016-17 43
STRATEGIC REPORT GOVERNANCE FINANCIAL STATEMENTS OTHER INFORMATION

At Escorts, we believe that
our competitive advantage is
resident within our people.
Our people bring to the
Company a diverse ferment
of multi-sectoral experiences,
academic qualifications and
domain knowledge drawn
across ages, genders and
regions.
More than this complement,
our people bring to the
Company a distinctive passion.
This passion has been reflected
in our ability to disrupt the
sectoral or corporate status quo
and enhance the Company’s
engineering competitiveness,
reflecting in lower costs,
superior product quality and
enhanced customer delight.
Besides, the passion of the
people at Escorts has been
underlined by the Company’s
enunciated values comprising
a Respect for People,
Empowerment, Transparency
and Collaboration.
The result is that Escorts
has evolved into one of the
most respected engineering
companies in India with
corresponding market
leadership in the businesses of
its presence. This leadership
has been derived through
the following people-centric
initiatives:
Capability & Competence Building
Escorts Limited
44
44
Competence building: In a rapidly-
changing world that warrants
a continuously evolving set of
competencies, training is an
ongoing organizational priority. The
Company invested nearly three
days of training per person per year;
nearly 100 training programs were
conducted, addressing specific
competence gaps. The Company
focused on the functional,
behavioral and technical training
for enhancing engagement and
productivity. In addition, as part of
building the leadership pipeline, the
Company created a pool of high
potential employees by imparting
quality training and development
programs.
We also invited eminent personalities
to engage with employees across
different subjects as part of outside-
in approach to competence
development.
Dialogue: In a world where
marketplace realities change
all the time, it was imperative
for the Escorts management
to communicate prevailing
realities with its various teams.
The Company strengthened the
management-employee dialogue
process by conducting more than
40 Town Halls with the Managing
Director, covering a large number of
employees across all levels. These
meetings enhanced information
cross-flow, motivation and an
understanding of the organizational
priorities and future direction.
Talent acquisition: In a world that
places a premium on building talent
pool, the Company continuously
focused on talent acquisition
along with initiatives to enhance
people retention. The Company
was invited by premier engineering
colleges and business schools to
recruit fresh graduates/MBAs. We
focused on recruitment from diverse
regions, enriching our workplace
with different perspectives. In turn,
these initiatives translated into
sectoral outperformance (record
profits, increased margins and
lower debt, among other things),
value-addition, cost management,
product breakthroughs and superior
customer service.
Going ahead, the Company intends
to focus on the three Cs: Capability,
Culture and Customer. Besides, the
Company will continue to enrich
its work culture around employee
engagement, excellence, coaching,
enhanced transparency and team
performance.
*Excludes blue collar; retainers and contractuals
Average age (years), 2015-16
39Average age
(years), 2016-17
37
Training in person-hours per employee,
2015-16
10Training in
person-hours per employee,
2016-17
11
Number* of Escorts
employees, 2015-16
1,720Number* of Escorts
employees, 2016-17
1,605
Revenues per person
(B crore), 2015-16
2.03Revenues per
person (B crore), 2016-17
2.60
Our people bring to the Company a distinctive passion. This passion has been reflected in our ability to disrupt the sectoral or corporate status quo and enhance the Company’s engineering competitiveness, reflecting in lower costs.
71st Annual Report 2016-17 45
STRATEGIC REPORT GOVERNANCE FINANCIAL STATEMENTS OTHER INFORMATION

Corporate Social Responsibility
ESCORTS SCHOOL(S) WASH
MissionAddressing the requirement of Water,
Sanitation and Hygiene (WASH) in
government schools in Faridabad.
‘Swachh Bharat: Swachh Vidyalaya’ is
the national campaign driving ‘Clean
India: Clean Schools’. A key feature
of the campaign is to ensure that
every school in India has a set of
functional and well-maintained WASH
infrastructure and facilities.
The Escorts School WASH project
was planned in 2015 to address the
lack of basic amenities in government
schools in Faridabad. For robust
functioning of the project, gaps in the
ecosystem were identified including
capacity building initiatives through
WASH, a concept globally recognized
and accepted. In 2015-16, 13 schools
were covered and in 2016-17 another
five schools were covered.
Project highlights• Project covered 7,941 students.
• A three-stage implementation
through Hardware Intervention,
Software Intervention, Monitoring &
Sustainability.
• Development of Information,
Education & Communication (IEC)
materials.
Indicators for success• Behavioural changes in
stakeholders.
• Reducing the incidence of girls
dropout due to lack of basic hygiene
infrastructure.
• Increased awareness among
community holders on environmental
issues related to water, sanitation and
hygiene.
LANDSCAPING OF GREEN BELTS
MissionTo promote a green and clean
environment in Faridabad by
converting dilapidated green
covers with proper landscaping and
correspond to the Smart City scheme.
Prevalent global climate change,
rapid environmental deterioration
and declining natural resources
have affected the way in which we
approach environment sustainability.
The project, started in 2015, helped
increase green footprint within the
city. One tree plantation removes 26
pounds of carbon dioxide from the
atmosphere annually, equalling 11,000
miles of car emissions.
Project highlights• Helped restore the ecological
balance;reduced carbon footprint.
• Two water points were created to
maintain the landscape; the green belt
was barricaded for the upkeep and
protect from stray animals.
• Tree plantation was initiated in
Sector 13/14, to celebrate World
Environment Day on June 5, 2016.
At Escorts, care, concern and social empowerment lie at the core of our business model. To us
social empowerment is not an option, but a business imperative. It encompasses our business
objectives, our responsibility to the society, the eco-sphere and efforts to enrich the lives of our
workforce.
Escorts Limited
46
46
Indicators for success• Supplementing the largest
plantation effort; increased green
footprint in the heart of the city.
• Imperative to enhance collective
responsibility by different stakeholders
in maintaining the ecological balance.
ESCORTS ROAD SAFETY EDUCATION
MissionTo harness the objective of “safe
roads” under the Escorts CSR initiative.
The project is framed to educate
citizens on road safety measures in
association with the Faridabad police
authorities under the public-private
partnership.
71st Annual Report 2016-17 47
STRATEGIC REPORT GOVERNANCE FINANCIAL STATEMENTS OTHER INFORMATION

Project highlightsThe Road Safety Education framework
was promoted in two ways:
• Engaging school and college
students in different competitions like
road safety quizzes, puzzles, slogan
writing etc. To educate and enhance
awareness about road safety, Escorts
organized the state-level quiz with
Haryana Police in which 2,00,000
students participated.
• Use of road safety patrolling to
sensitize citizens in appropriate traffic
regulations and road sense. Escorts
started joint patrolling with Faridabad
police via three fully-equipped PCR
vehicles from Badarpur border to
Ballabhgarh. The road safety initiative
was implemented with the intent
to educate the masses and spread
awareness among those with limited
or no access to awareness aids on
road safety and dealing with traumatic
situations after accidents.
Indicators for success• Reduction in road accidents.
• Supplementing the largest Haryana
Police endeavour of ‘Apki Suraksha
Apke Saath’.
• PCR presence in the area makes
people feel secure, potentially
deterring crimes.
ESCORTS GREEN OUTDOOR FITNESS PARK
MissionThe project is framed under the
initiative to develop a park and
promote preventive healthcare
for a healthy society. The main
challenge in this country’s healthcare
machinery is the lack of appropriate
preventive healthcare infrastructure.
A key focus of this project is overall
community development in terms of
physical – mental – and emotional
condition. This project promotes
overall community development and
preventive healthcare by developing
an outdoor gymnasium in the parks.
Project highlights• More than any other park amenity,
the gym brings unacquainted
community members into proximity,
inviting conversation between
individuals. In this way, the outdoor
gym can strengthen one’s social
environment, community ties and
cognitive development.
• Two world-class outdoor gyms were
installed in the parks of Sector 6 and
Sector 30 in Faridabad.
Indicators for success• The gyms are being used by persons
of all ages.
• Promotion of healthy lifestyle.
• The project is scalable and can
be extended to yoga, health and
self-defence camps for addressing
preventive healthcare needs.
• Enhances Smart City element to
Faridabad.
RECREATIONAL ACTIVITIES FOR STUDENTS
MissionDeveloping school infrastructure to
promote education and healthy
Escorts Limited
48
48
lifestyle among students. To design
and build creative play spaces at the
school. The playground ideas are
required for a child’s healthy growth
and mental development.
This innovative project helped
enhance learning abilities of students
in the government schools by play
way method. These extra-curricular
activities provide essential experiences
and development for children in areas
as diverse as social skills, creativity,
problem-solving and reasoning. In
2016-2017, five schools were covered
under this project.
Project highlights• Project covered 1500 students.
• Development of mental ability, team
work, concentration and problem
solving techniques.
Indicators for success• Making education by combining
learning with playing.
• Increased awareness on team
building, health etc.
ESCORTS SKILL DEVELOPMENTEscorts Limited started a skill
development work for the less-
privileged under a separate not-for-
profit company incorporated by the
name of Escorts Skill Development
(ESD). This company is a non-funded
partner of NSDC and several sector
skill councils established by the
Ministry of Skill Development.
ESD imparts training in various
job roles under the schemes of
Government of India and public sector
organizations. In two-and-a-half years
of existence, ESD imparted training
on various job roles to about 1,000
candidates.
ESD also set up two training centres
in Odisha to impart training to 2,200
SC/ST/Women/Minority categories
of candidates under Deen Dayal
Upadhyay Gramin Kaushal Yojna,
a Scheme of the Ministry of Rural
Development. Besides, there are
ongoing projects in Haryana, Uttar
Pradesh, North East India, Odisha and
Chhattisgarh. It is expected that ESD
will handle skill development projects
of above B50 crores during the current
financial year.
71st Annual Report 2016-17 49
STRATEGIC REPORT GOVERNANCE FINANCIAL STATEMENTS OTHER INFORMATION

Board of Directors
1 MR. RAJAN NANDA
Mr. Rajan Nanda, Chairman &
Managing Director of Escorts Group,
is a visionary leader who has played
a defining role is establishing Escorts
as an organization of repute. His
astute leadership has resulted in
giving Escorts a sharper focus in the
high growth economy sectors of agri
machinery, construction equipment
and railway equipment. Mr. Nanda
is an active member of several apex
trade and industry bodies. As a
member of the CII National Council,
he has served as the Chairman of its
Agriculture Committee. Mr. Nanda
plays a pivotal role in promoting
the cause of Indian agriculture
and his endeavours resulted in the
government announcing the long-
awaited National Agriculture Policy.
2 MR. NIKHIL NANDA
Mr. Nikhil Nanda, Managing Director,
has been a key member of the Board
since 1997. He plays a vital role in
managing the Group’s performance
and steering its operations to create a
customer-centric, technology-driven
brand. Together with the leadership
team, he is leading the organizational
transformation into a culture of high-
efficiency and aggressive growth.
Mr. Nanda is a member of Northern
Regional Council of Confederation
of Indian Industry (CII), Federation of
Indian Chambers of Commerce &
Industry (FICCI), the Indo American
Chambers of Commerce (IACC),
Young President’s Organization (YPO)
high-level strategic group constituted
by All India Management Association
(AIMA) and Young India Committee
of CII. Mr. Nanda is a member of the
prestigious Science & Technology in
Society (STS) Forum of Japan. He is
also one of the few business leaders
chosen to represent India at the Indo-
Spain CEOs Forum, which operates
under the purview of the Ministry of
External Affairs, Government of India.
3 MR. HARDEEP SINGH
Mr. Hardeep Singh, Director, has a rich
experience of holding top managerial
positions in leading Indian and foreign
companies. Mr. Singh was the Former
Executive Chairman of Cargill South
Asia and Amalgamated Plantations
Private Limited (A Tata Enterprize)
and non-executive Chairman of
HSBC Invest Direct India Limited. He
is the Chairman of the monitoring
committee on Minimum Support Price
constituted by Planning Commission,
Govt. of India. He has been a member
of National Council of CII, National
Committee for Agriculture of FICCI
and served as an honorary advisor
on Agriculture to the Chief Minister
of Punjab. An invited speaker at
the World Bank, US Department
of Agriculture Global Summit,
International Food Policy Research
Institute in Washington DC, Imperial
College in the UK and Indian Institute
of Management (IIM), Ahmedabad. He
is a graduate in Economics from Pune
University and an alumnus of Kellogg
School of Management.
4 MR. P.H. RAVIKUMAR
Mr. P.H. Ravikumar, Director, is
commerce graduate and CIIB, AIB
from London with a Senior Diploma
in French. He is also a Fellow
(Honorary) of The Chartered Institute
of Securities and Investments (CISI)
U.K., and the Chairperson of CISI’s
India Advisory Council. He has been
the founder Managing Director and
Chief Executive Officer of National
Commodity and Derivatives Exchange
Limited (NCDEX) and Invent Assets
Securitization and Reconstruction
P Ltd, an RBI regulated Asset
Reconstruction Company. Prior to
these assignments, he has worked
in senior level positions in ICICI
Bank, the leading private sector
bank in India and Bank of India, a
premier public sector bank in India.
He has been on the governing body
of Entrepreneurship Development
Institute of India, Ahmedabad and
Federal Bank Limited. He is currently
the non-executive chairperson of
Bharat Financial Inclusion Limited
(earlier known as SKS Microfinance
Ltd.) and (among other companies)
on the Boards of L&T Investment
Management Co. Ltd., Aditya Birla
Capital Advisors Ltd., Bharat Forge
Limited, etc.
5 MRS. VIBHA PAUL RISHI
Mrs. Vibha Paul Rishi, Director, an
Alumnus of FMS, Delhi, started her
career with the Tata Administrative
Services and was part of the founding
team of Titan Watches. Mrs. Rishi has
1 2 3 4 5
Escorts Limited
50
50
been an Executive Director – Brand
and Human Capital of Max India
Limited. She is a seasoned marketing
professional with extensive experience
in Indian and international markets,
coupled with an abiding passion
for people. She had been earlier
associated as the Director, Marketing
and Customer Strategy at the Future
Group, India’s largest retail group. Prior
to this she spent 17 years at PepsiCo
in marketing and innovation roles in
India, US and UK. She was one of the
founding team employees of PepsiCo
when they set up in India. She was
also associated with Pratham, an NGO
that works to provide education to
underprivileged children in India.
6 DR. SUTANU BEHURIA
Dr. Sutanu Behuria, Director, is a
postgraduate in Economics from
Delhi School of Economics as
well as a postgraduate and Ph.D in
Economics from Southern Methodist
University, Dallas, Texas. He is an
Indian Administrative Services Officer
(Himachal Pradesh) from the 1976
batch.
He has, during his illustrious carrier
spanning 38 years of professional
experience, served as Secretary in the
Dept. of Fertilizers, National Disaster
Management Authority, Ministry of
Minority Affairs and Department of
Heavy Industry. He has been the
Financial Advisor to the Ministries of
Commerce, Textiles, Coal, Mines,
Youth Affairs and Sports in the
Government of India. He has worked
as Finance and Planning Secretary
in Himachal Pradesh Government
among many other Departments. He
has served as Board member in over
25 PSUs.
Dr. Behuria has worked in the Asian
Development Bank for over 5 years.
He has also been Advisor to the
Finance Minister of Mauritius for
2 years under a Commonwealth
program.
7 MR. G.B. MATHUR
Mr. G.B. Mathur, Director, is a
member of the Institute of Company
Secretaries of India and LLB by
profession. He has more than three
decades of rich experience in the
field of corporate law. He is part of
all the major restructuring and other
important corporate decisions taken
by the Company from time to time.
Mr. Mathur provides support in
strategy decisions and CSR initiatives
of the Company.
8 MS. NITASHA NANDA
Ms. Nitasha Nanda, Director, is a multi-
faceted professional, entrepreneur and
business leader with a wide-spread
experience across global and Indian
companies.
After Graduation with Honours
in Commerce from University
of Delhi, she has worked with
Price Waterhouse, ANZ Grindlays
Bank, Hewlett Packard, Escorts
Finance Limited and other reputed
organizations in the area of Business
Strategies, Financial Management,
Operational Research and Managerial
Techniques, among others.
Ms. Nanda is responsible for
managing the Company’s subsidiary
companies which include Escorts
Securities Limited and Escorts Asset
Management Limited.
She is also on the Board of Directors
of a number of companies, including
Sietz Technologies, RNIS, Raksha TPA,
Rimari India and Sun & Moon Travels.
9 MR. D. J. KAKALIA
Mr. D. J. Kakalia, Director, is a
Commerce Graduate from Siddharth
College of Commerce & Economics,
Mumbai and a Law Graduate from
Govt. Law College, Mumbai. He
enrolled as an Advocate of Bombay
High Court in 1973, qualified as a
Solicitor from Bombay in 1976 and
qualified as a Solicitor of the Supreme
Court of England in 1982.
Presently, he is Partner in Mulla
& Mulla & Craige, Blunt & Caroe,
Advocates, Solicitors & Notaries.
He specializes in litigation for the
power and manufacturing sector,
representing and advising large Power
Companies. His clientele includes big
corporation including Reliance Group.
He is Director and member of various
Board Committees in Aditya Birla
Finance Limited, Reliance Broadcast
Network Limited and Reliance Power
Limited.
6 7 8 9
71st Annual Report 2016-17 51
STRATEGIC REPORT GOVERNANCE FINANCIAL STATEMENTS OTHER INFORMATION
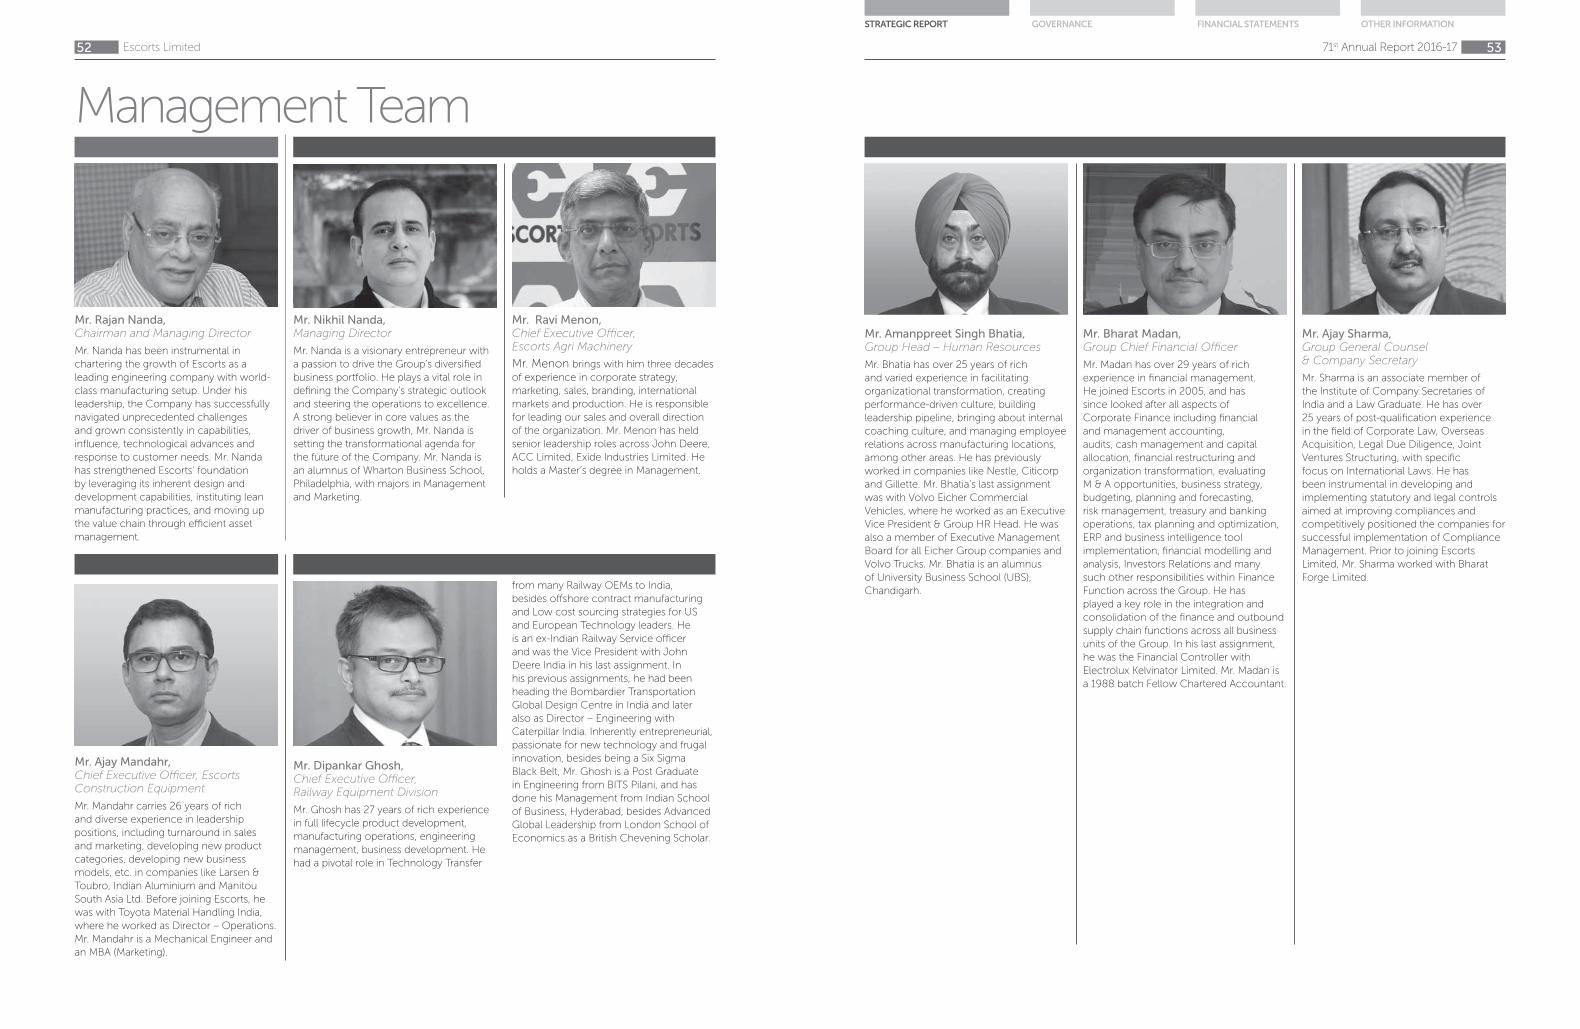
Management Team
Mr. Rajan Nanda,Chairman and Managing Director
Mr. Nanda has been instrumental in
chartering the growth of Escorts as a
leading engineering company with world-
class manufacturing setup. Under his
leadership, the Company has successfully
navigated unprecedented challenges
and grown consistently in capabilities,
influence, technological advances and
response to customer needs. Mr. Nanda
has strengthened Escorts’ foundation
by leveraging its inherent design and
development capabilities, instituting lean
manufacturing practices, and moving up
the value chain through efficient asset
management.
Mr. Nikhil Nanda, Managing Director
Mr. Nanda is a visionary entrepreneur with
a passion to drive the Group’s diversified
business portfolio. He plays a vital role in
defining the Company’s strategic outlook
and steering the operations to excellence.
A strong believer in core values as the
driver of business growth, Mr. Nanda is
setting the transformational agenda for
the future of the Company. Mr. Nanda is
an alumnus of Wharton Business School,
Philadelphia, with majors in Management
and Marketing.
Mr. Dipankar Ghosh, Chief Executive Officer, Railway Equipment Division
Mr. Ghosh has 27 years of rich experience
in full lifecycle product development,
manufacturing operations, engineering
management, business development. He
had a pivotal role in Technology Transfer
from many Railway OEMs to India,
besides offshore contract manufacturing
and Low cost sourcing strategies for US
and European Technology leaders. He
is an ex-Indian Railway Service officer
and was the Vice President with John
Deere India in his last assignment. In
his previous assignments, he had been
heading the Bombardier Transportation
Global Design Centre in India and later
also as Director – Engineering with
Caterpillar India. Inherently entrepreneurial,
passionate for new technology and frugal
innovation, besides being a Six Sigma
Black Belt, Mr. Ghosh is a Post Graduate
in Engineering from BITS Pilani, and has
done his Management from Indian School
of Business, Hyderabad, besides Advanced
Global Leadership from London School of
Economics as a British Chevening Scholar.
Mr. Ravi Menon, Chief Executive Officer, Escorts Agri Machinery
Mr. Menon brings with him three decades
of experience in corporate strategy,
marketing, sales, branding, international
markets and production. He is responsible
for leading our sales and overall direction
of the organization. Mr. Menon has held
senior leadership roles across John Deere,
ACC Limited, Exide Industries Limited. He
holds a Master’s degree in Management.
Mr. Ajay Mandahr, Chief Executive Officer, Escorts Construction Equipment
Mr. Mandahr carries 26 years of rich
and diverse experience in leadership
positions, including turnaround in sales
and marketing, developing new product
categories, developing new business
models, etc. in companies like Larsen &
Toubro, Indian Aluminium and Manitou
South Asia Ltd. Before joining Escorts, he
was with Toyota Material Handling India,
where he worked as Director – Operations.
Mr. Mandahr is a Mechanical Engineer and
an MBA (Marketing).
Escorts Limited
52
52
Mr. Ajay Sharma, Group General Counsel & Company Secretary
Mr. Sharma is an associate member of
the Institute of Company Secretaries of
India and a Law Graduate. He has over
25 years of post-qualification experience
in the field of Corporate Law, Overseas
Acquisition, Legal Due Diligence, Joint
Ventures Structuring, with specific
focus on International Laws. He has
been instrumental in developing and
implementing statutory and legal controls
aimed at improving compliances and
competitively positioned the companies for
successful implementation of Compliance
Management. Prior to joining Escorts
Limited, Mr. Sharma worked with Bharat
Forge Limited.
Mr. Amanppreet Singh Bhatia, Group Head – Human Resources
Mr. Bhatia has over 25 years of rich
and varied experience in facilitating
organizational transformation, creating
performance-driven culture, building
leadership pipeline, bringing about internal
coaching culture, and managing employee
relations across manufacturing locations,
among other areas. He has previously
worked in companies like Nestle, Citicorp
and Gillette. Mr. Bhatia’s last assignment
was with Volvo Eicher Commercial
Vehicles, where he worked as an Executive
Vice President & Group HR Head. He was
also a member of Executive Management
Board for all Eicher Group companies and
Volvo Trucks. Mr. Bhatia is an alumnus
of University Business School (UBS),
Chandigarh.
Mr. Bharat Madan, Group Chief Financial Officer
Mr. Madan has over 29 years of rich
experience in financial management.
He joined Escorts in 2005, and has
since looked after all aspects of
Corporate Finance including financial
and management accounting,
audits, cash management and capital
allocation, financial restructuring and
organization transformation, evaluating
M & A opportunities, business strategy,
budgeting, planning and forecasting,
risk management, treasury and banking
operations, tax planning and optimization,
ERP and business intelligence tool
implementation, financial modelling and
analysis, Investors Relations and many
such other responsibilities within Finance
Function across the Group. He has
played a key role in the integration and
consolidation of the finance and outbound
supply chain functions across all business
units of the Group. In his last assignment,
he was the Financial Controller with
Electrolux Kelvinator Limited. Mr. Madan is
a 1988 batch Fellow Chartered Accountant.
71st Annual Report 2016-17 53
STRATEGIC REPORT GOVERNANCE FINANCIAL STATEMENTS OTHER INFORMATION

Management Discussion and Analysis, 2016-17
Economy FY 2016-17 has been a dynamic
year with interesting developments
globally. Economic activity has
now picked up with a long-awaited
cyclical recovery in investment,
manufacturing, and trade, according
to World Economic Outlook. The
world growth is projected to rise from
3.1 percent in 2016 to 3.5 percent in
2017 and 3.6 percent in 2018.
Economic policies have an important
role to play in mitigating risks and
securing the recovery. On the
domestic front, policies should aim at
boosting productivity, upgrading the
public infrastructure; and supporting
transformations such as technological
change and globalization. At the same
time, credible strategies are needed
in many countries to place public
debt on a sustainable path. A renewed
multilateral effort is also needed to
tackle common challenges in an
integrated global economy.
Indian EconomyIndia emerged as sixth largest
manufacturing country during FY
2016-17. The Indian economic
sentiment improved, led by a normal
monsoon after two years of deficit
rainfall. The Government’s focus on
development of the agriculture and
infrastructure sectors helped drive the
demand for all operating sectors of
your company. Demonetization had a
short-term impact on Indian growth,
but will surely help the country
move towards a digital economy,
greater transparency and disclosures,
leading to formalized economy. GST
implementation will lead to uniform
tax framework for indirect taxes,
resulting in lower corruption, reducing
prices at the end consumer level.
On backdrop of favorable domestic
and global demand, the outlook for
2017-18 remains positive. On the
domestic front, the economy is set to
experience growth recovery and the
RBI expects Gross Value Added (GVA)
to grow at 7.3% year-on-year in FY18.
We are excited to cater to national and
international opportunities through
our brand and market reach.
Agriculture industry - an
overviewAgriculture plays a vital role in India’s
economy. Over 58% of the rural
households depend on agriculture
as their principal means of livelihood.
Agriculture, along with fisheries
and forestry, are key contributors to
Gross Domestic Product (GDP); the
share of agriculture and allied sectors
(including agriculture, livestock,
forestry and fishery) is expected to be
17.3% of the Gross Value Added (GVA)
during 2016-17.
The Government of India, in its Union
Budget 2017–18, planned several steps
for the sustainable development of
agriculture:
• Total allocation for rural, agricultural
and allied sectors for FY 2017-18
increased by 24 % year-on-year to
B1,87,223 crore (US$ 28.1 billion).
• A dedicated micro-irrigation fund
will be set up by National Bank for
Agriculture and Rural Development
(NABARD) with a corpus of B5,000
crore (US$ 750 million). The
government plans to set up a Dairy
Processing Fund of B8,000 crore
(US$ 1.2 billion) over three years
with an initial corpus of B2,000
crore (US$ 300 million).
• The participation of women in
Mahatma Gandhi National Rural
Employment Guarantee Act
(MNREGA) increased to 55% and
allocation to the scheme been
increased to a record B48,000 crore
(US$ 7.2 billion) for FY2017-18.
• Short-term crop loans up to
B300,000 (US$ 4,500) at subsidized
interest rate of 7% per annum
would be provided to farmers.
An additional incentive of 3% is
provided to the farmers for prompt
repayment of loans within the due
date, making an effective interest
rate for them at 4%.
• NITI Aayog has proposed various
reforms in India’s agriculture
sector, including liberal contract
farming, direct purchase from
farmers by private players, direct
sale by farmers to consumers, and
single trader license, among other
measures, in order to double rural
income in the next five years. The
Ministry of Agriculture, Government
of India, has been conducting
various consultations and seeking
suggestions from numerous
stakeholders in the agriculture
sector, to devise a strategy to
double the income of farmers by
2022.
Escorts Limited
54
54
1. Indian Tractor IndustryThe Indian tractor industry grew by
15.7% to 6.61 lacs tractors in FY 2016-
17 as against 5.71 lacs tractors in the
previous fiscal.
Despite demonetization, the domestic
tractor industry volumes went up by
18% to 5.81 lacs tractors as compared
to 4.93 lacs tractors in the previous
fiscal owing to average monsoons
in rural markets. Demonetization
had a short-term impact on the
overall industry growth; from April to
October 2017, the industry witnessed
25% growth but post-demonetization,
a cash-crunch led to growth of just
5.2% from November 2016 to March
2017.
Tractor Segmental Break-upThe 31-50 HP Segment that
constitutes more than 80% of the
domestic tractor industry has grown
by 19.3% to 4.86 lacs tractors in FY
2016-17 as against 4.07 Lacs tractors
in the previous fiscal.
The 41-50 HP segment dominated
domestic tractor industry with a 46%
share in FY 2016-17.
Export Industry in TractorsTractor exports from India grew by
2.2% in FY17 to 80.2K tractors as
against 78.4K tractors in the previous
fiscal.
Escorts Agri Machinery (EAM)Your Company’s domestic volume
went up by 23.7% at 62,699
against50,698 in 2015-16. In our
Strong markets, the business grew
by 12.5% in Punjab, Haryana, UP,
Rajasthan, Bihar and MP regions,
whereas it grew by 25.5% in our
Opportunity markets (South and west).
Escorts domestic market share was at
10.8% in year ended FY17.
We have gained market share across
all major states. Our market share in
the Strong markets improved by 100
bps and in the Opportunity market
went up by 50 bps, resulting in an
overall domestic market share of
10.8% as against 10.3% in the previous
year. Our market share increased
from 10.9% to 11.7% in the 41- 50 HP
category in FY17.
Industry Growth
Industry Segmental Share
661.1
571.2
Total Industry
15.7%
581.0
492.8
Domestic Tractors
17.9%
80.2
78.4
Exports Tractors
FY 16-17 FY 15-16
9% 11%
<30 HP
35%37%
31-40 HP
49%46%
41-50 HP
7% 7%
50 HP+
FY 16-17 FY 15-16
Volume in ‘000
In ‘000
71st Annual Report 2016-17 55
STRATEGIC REPORT GOVERNANCE FINANCIAL STATEMENTS OTHER INFORMATION

Escorts Agri Machinery Exports During the year under review, export
volumes were up by 43.6% to 1,087
tractors in FY 2016-17 as against 757 in
FY 2015-16.
With ‘Global Transformation Vision
2020’ your Company will be
launching new tractors in 12 HP to
110 HP range under flagship brands,
targeting 8k~10K units in the short to
medium term.
OutlookThe growing domestic demand for
food grains and agri-products promise
a good future for India’s tractor
industry. India’s tractor industry is
expected to grow steadily, aided by
government policies announced in
the Union Budget. With the roll out
of Goods & Service Tax (GST) in the
current year and normal monsoons
predicted for FY 2017-18,the
Domestic tractor industry is expected
to grow between 10~12%, extending
beyond its peak of FY 2013-14
An above-normal monsoon is being
forecasted for the upcoming season
by Government agencies. The impact
of the various factors like rainfall, crop
prices, % of sown area, the central
Government’s stand towards the
Land Bill and the associated farmer
compensation for the acquired land
would improve industry sentiment.
Your Company is developing products
for Opportunity markets while
strengthening its channel network.
The Company is working in the
direction of offering an end-to-end
service solution (from land preparation
to harvesting) centered around
specific crops starting with rice.
With the government focus on
doubling the farm incomes by 2022,
we expect the Indian tractor market to
grow at a CAGR of 8~10% in the long
term.
2. Infrastructure The infrastructure sector is a key driver
of the Indian economy. The sector
is highly responsible for propelling
India’s overall development and enjoys
intense focus from the Government
for initiating policies that ensure
time-bound creation of world class
infrastructure. The infrastructure
sector includes power, bridges,
dams, roads and urban infrastructure
development. In 2016, India jumped
19 places in World Bank’s Logistics
Performance Index (LPI) 2016 to rank
35th amongst 160 countries.
Construction Equipment IndustryThe construction industry in India
is growing rapidly with a major
contribution from infrastructure
development. It is expected that
various projects in transportation
infrastructure, power, urban
infrastructure and real estate will drive
the market. The development aided
by a stable Government and improved
macro-economic environment could
lead to further growth.
The total construction equipment
Industry grew 30% in FY17. All major
segments like Earth Moving, Material
Handling and Road Construction
reported a positive movement.
Your company’s served segments
(backhoe loaders, PnC and
compactors) went up by 33% in
FY17. BHL was the biggest gainer in
FY17 with a growth of 34% followed
by Cranes that grew by 31% and
Compactors grew 22% in FY17.
Escorts Construction Equipment
(ECE)Your company’s total volumes
(manufactured & traded products)
went up by 29.8% to 3,315 machines
as against 2,555 machines in the
previous fiscal. The integration of
your company’s backend operations
of tractor business and construction
equipment business started yielding
results.
OutlookThe construction equipment industry
in India is expected to reach USD 5
billion by FY20 from USD 3 billion in
FY16, in value terms. The volume sale
of construction equipment is expected
to grow to 80,000 units by 2018
from 52,000 units in FY16. NITI Aayog
estimates total infrastructure spending
to be about 9% of GDP by 2017, up
from 7.2% during the 11th Five Year
Plan (2007–12). Increasing investment
Escorts Domestic Share of Market in Tractors Category Wise Share in Tractors
1.9% 2.1%
<30 HP
12.8% 12.6%
31-40 HP
10.9% 11.7%
41-50 HP
6.1% 6.9%
>50 HP
FY 16-17 FY 15-16
492.8
FY 2015-16
10.3%581.0
FY 2016-17
10.8%
TIV (‘000) % SOM
Escorts Limited
56
56
in infrastructure development will
lead to the growth in the construction
equipment market. The construction
industry in India is growing rapidly
with a major contribution from
infrastructure development. It is
expected that various projects in
the transportation infrastructure,
power, urban infrastructure and real
estate segment will drive the market.
The development aided by a stable
Government and improved macro-
economic environment could lead to
further growth. The Government took
a number of initiatives in the Union
Budget for the infrastructure sector.
Measures announced for physical
infrastructure such as roads, ports,
aviation and rural infrastructure are
aimed at improving the connectivity
and modernizing the various key
elements of this sector. Further,
forming policies for strengthening
ties with private players will help in
overcoming roadblocks.
In the Union Budget 2017-18,
the Government of India took
the following measures for the
development of infrastructure:
• Increased total infrastructure outlay
and Defence capital expenditure by
10% and 20.6% to B3,96,135 crore (US$
59.18 billion) and B86,488 crore (US$
13.1 billion) respectively, over the FY17
revised estimate.
• Railway expenditure allocation
increased by 8% to B1,31,000 crore
(US$ 19.58 billion) for laying down
3,500 km of railway lines in 2017-18.
• Affordable housing was given
infrastructure status.
• Lock-in period for long-term capital
gains on land and buildings was
reduced from three to two years.
The business is on the growth path,
which is supported by the favorable
demand . Your Company will continue
to shift towards a better product mix,
leaner manufacturing/sales setup and
better management of fixed costs.
Going forward, we expect that our
served construction equipment
industry will continue to grow at a
CAGR of 10-12% for the next 2-3 years
Construction Equipment Industry (figures in unit)
S. No.
Category Application Major Eqpt. Volumes (FY16)
Volumes (FY17)
Growth (%)
1 EarthmovingRoads Power Backhoe Loaders (BHL) 22,800 30,700 35%
Real Estate Sand Mines Excavators & others 16,350 22,650 39%
2 Material Handling
Roads Pick & carry Cranes (PnC) 3,300 4,460 35%
Power
Other Infra
3 Road BuildingRoads Compactors 2,950 3,600 22%
Airports Others 450 560 24%
4 ConcretingIrrigation Mixer, Pumps, Batch
plants
2,450 1,780 -27%
5 Material Processing Mining Compressors, Crushers 2,870 3,010 5%
Total Total 51,170 66,760 30%
Source:ICEMA
22%
3,600
3,000Compactor 34%
4,500
3,300Cranes 31%
30,700
22,800
Backhoe Loader
FY 16-17 FY 15-16
Volume (in units)
492.8
FY 2015-16
2,555581.0
FY 2016-17
3,315
TIV (‘000) % SOM
Construction Equipment Volume (in units)
29.8%
71st Annual Report 2016-17 57
STRATEGIC REPORT GOVERNANCE FINANCIAL STATEMENTS OTHER INFORMATION

and we will launchnew innovative
products/variants to cater to this
growth.
3. Railway Equipment Division
(RED)Government is investing in railways for
creating rolling stock. Your Company
is one of the key suppliers to Indian
Railways for products - with a focus
on safety, comfort and environment.
With this wide product range and
in-house R&D capabilities, your
Company is poised to capture the
immense opportunities from the
Indian Railways.
Revenues were up 6.5% at B242.5 Cr.
as against B227.8 Cr. in the previous
fiscal. EBIT margins were up by 280
bps to 12.7% as against 9.9% in the
previous fiscal.
The order book for this division stood
at B155 crore by end of March 2017, to
get executed in the next 5-6 months.
With a focus on freight corridors, high
capacity rolling stock, last mile rail
linkages, high speed trains and port
connectivity, the opportunities in this
sector appear bright.
Your Company launched several
new products for the Metro and
railway segments in India. These
new rail products are an outcome
of frugal and value engineering by
in-house R&D and global technology
partners in making rail travel safe and
more comfortable while also paving
the road for import substitution
and reducing costly imports. In
sync with the new vision of railway
transformation, this marks the initial
success towards ‘Make In India’ by
indigenous manufacturers.
In the long term your company would
like to invest more in this business to
expand our product portfolio through
technology partnership and inorganic
opportunities.
4. Escorts Auto Products (EAP)Your company divested its OEM &
Export business of the Auto Products
to M/s Badve Engineering Ltd., Pune,
as a part of the planned strategic
reorientation of the business during
the quarter ended December 2016.
Your Company will use land available
with this divestment for the future
expansion of its other businesses.
Overall Risks & ConcernsThe prospects of the Indian tractor
and construction industry are
dependent on Government policies.
Historically, a large number of
equipment is sold on credit, despite
an increase in the non-performing
assets (NPAs) for financial institutions
over the last few years, which has led
to some tightening of credit norms.
Most of the equipment financing
done by banks comes under the
ambit of priority sector lending, a
directed-lending mechanism of
the Government of India. Despite
macro economic challenges, the
Company has been able to perform
creditably. Had the macroeconomic
environment been better, we would
have performed better.
Your Company recognizes that every
business has its inherent risks and
it is required to possess a proactive
approach to identify and mitigate
them . Your Company embedded an
efficient Enterprise Risk Management
System (ERMS), which regularly scans
the internal and external environment
to identify risks, decide on possible
mitigation plans and incorporate them
in it’s strategic plans.
MonsoonsThe monsoon is the major risk
associated with the tractor industry as
more than 50% of the sowing land is
dependent on rainfall. On the other
hand, construction equipment sales,
to some extent, run the risk in case
of an above-normal monsoon. With
normal monsoon and infra spending
from the government, we expect the
tractor and construction equipment
industry to grow in double-digit
percentage terms in FY18.
Commodity PricesIn FY17, prices increased across
most commodities. Your Company
mitigated the impact through value
engineering to remain at par with the
industry and exercised took some
price increases to absorb inflation.
Chinese Equipment ManufacturersThere is a strong Chinese presence
in some segments such as wheel
loaders and dozers, due to which
imports from China increased in FY16.
Chinese equipment tends to be price-
competitive, putting a downward
pressure on the prices of domestic
equipment manufacturers
Fuel PriceWith the domestic price of oil rising
over the past few months, the cost
of automotive fuel is likely to face an
upward pressure. This has impacted
the cost of ownership and may have
some impact on your company’s
product.
Corporate Social
Responsibility and
Community DevelopmentAs part of community development,
we engage in multiple health related
activities, such as check-up camps,
women’s empowerment, blood
donation, among others, in Haryana.
The CSR at Escorts portrays the
deep symbiotic relationship that the
group enjoys with the communities
it is engaged with. As a responsible
corporate citizen, we contribute to
social and environmental causes on
a regular basis. Please refer to CSR
Section for details.
Employee Training and
DevelopmentEmployees are the core assets for
your Company. Your Company
recognizes the need for growth and Escorts’ domestic share
FY 2015-16
9.9%
FY 2016-17
12.7%
Revenue (B Cr.)
EBIT Margin %
242
228
Escorts Limited
58
58
has reinforced the capabilities of
employees through the launch of
numerous in-house trainings and
job-specific trainings. With several
new products launches, focus on
categories recently launched and
rapid expansion opportunity markets,
your Company hired several key
resources to catalyze the next level of
growth.
Your Company manages 8,750-plus
employees at all levels. Some of the
major initiatives undertaken towards
employee development include
organizing:
• More than 200 technical training
programmes; the same initiative is
being sustained for the technical
department of our employees at a
group level;
• Behavioral workshops by renowned
trainers;
• Health and Safety seminars for
employees and vendors; this is
an ongoing activity and will be
conducted sustained;
• Yoga classes for employees to keep
them healthy.
Industrial RelationsDuring the year under review,
industrial relations with workers and
staff remained cordial. Your Company
successfully concluded long-term
wage agreement for all manufacturing
locations. The collaborative spirit
of partnership across all sections of
employees resulted in a significant
enhancement in quality and
productivity.
Cost SavingsYour Company continuously focused
on stream-lining operations and
cost rationalization during 2016-17,
including materials, manufacturing
and over-heads. All employees right
from the shop floor to the corporate
office were involved in this initiative,
wherein each team was given cost
saving targets to achieve.
Initiatives were taken in building a lean
supplier base to benchmark against
the best. Positive results are visible and
will be even more so in this financial
year. Our efforts towards reducing
fixed costs kept pace and tangible
results will be visible in the years
ahead.
Corporate GovernanceYour Company continues to
benchmark corporate governance
policies. A high ethical and corporate
governance standard was maintained
to ensure honest and professional
business practices to protect
the reputation of the Company
and stakeholders. A strong risk
management and internal control
system formed the backbone
for robust corporate governance
practices.
Your Company maintained adequate
internal control systems, which
provided, among other things, a
reasonable assurance of recording
the transactions of operations in all
material respects and of providing a
protection against significant misuse
or loss of the Company’s assets.
Your Company has a defined Risk
Management Policy at the Board
level to review risk assessment and
minimization. The process is based on
pre-identified types of risks and the risk
events or factors which require regular
assessment and responses based on
the probability.
Information TechnologyFY16-17 was an exciting year for IT
as many business transformational
initiatives were planned and
conceptualized. Major initiatives
having high business impact were
planned in the following areas:
Sales: Enhanced customer-centricity
Products: Make products smarter
R&D: Manage the product lifecycle
management
Productivity: Workspace of the future
To standardize its infrastructure
backbone, Escorts consolidated
servers and applications around a
Virtualized environment. This resulted
in phasing out obsolete hardware.
Your Company is ready to adopt
GST and all the groundwork for
GST adoption was completed
across multiple internal and external
stakeholders.
Investor RelationsYour company constantly endeavors
to improve its investor services and
keep benchmarking this performance
against best practices. Your Company
has a dedicated investor relations
desk, which services the interest of
investors through regular contact and
timely communication, to engage
with the investor community through
ongoing investor management
meetings with global shareholders and
investors.
Your Company conducted
periodic plant visits and meetings
to communicate details of
performance, important
developments and exchange
information. Your Company’s website
(www.escortsgroup.com) contains
a dedicated ‘Investor Information’
section where all the information
meant for the shareholders is available,
including information on Directors,
shareholding pattern, quarterly reports,
financial results, annual reports, press
releases, details of unpaid/unclaimed
dividends and various policies of the
Company.
Periodic reminders for unpaid
dividends were sent to shareholders
as per records of the Company
and wasalso accessible on your
Company’s website. For any queries/
suggestions one can write to us @
[email protected] and the
Company will revert within 3 working
days.
Capital ExpenditureYour Company planned capital
expenditure for the medium and
long-term with the primary focus
on developing design, productivity
improvement and cost reduction.
In addition, investments were
planned for modernization of the
existing manufacturing facilities and
improve the flexibility across all plants
providing a competitive advantage
71st Annual Report 2016-17 59
STRATEGIC REPORT GOVERNANCE FINANCIAL STATEMENTS OTHER INFORMATION

to your Company to introduce more
products.
Working CapitalYour Company was able to reduce
interest costs significantly in the
current year through a mix of
initiatives including faster sales
realization, timely sourcing of low
cost funds for working capital like
issuance of commercial paper and
deployment of surplus funds with
mutual funds and banks through
treasury operations.
Financial PerformanceYour Company adopted Indian
Accounting Standards (Ind AS) from
1st April, 2016 and accordingly
the financial statements were
prepared in compliance with the
requirements of the Companies Act,
2013 read with Companies (Indian
Account Standards) Rules, 2015,
and Companies (Indian Account
Standards) Amendment Rules, 2016.
Your Company provided segment
wise reporting as per para 4 of Ind
AS 108 “Operating segments”. This
information appears along with the
consolidated accounts.
During the financial year under review,
Company’s revenues went up by
21.2% to B4,167.6 crores in the year
ended March 2017 against B3,438.7
crores in year ended March 2016.
The tractors volume at 63,786 in year
ended March 2017 was up by 24%
against 51,455 tractors in the year
ended March 2016. Construction
equipment volumes also went up by
30% at 3,315 in year ended March
2017 against 2,555 in ended March
2016.
Earnings before Interest, Tax,
Depreciation, and Amortisation
(EBITDA) at B323.7 crores in year
ended March 2017 as against B176.7
crores in year ended March 2016.
Profit Before Tax (PBT) was at B218.3
crores in year ended March 2017
against B87 crores in year ended
March 2016 and Profit After Tax (PAT)
at B160.4 crores in year ended March
2017 against B83.8 crores in the year
ended March 2016.
Segment performanceThe Escorts agri Machinery division
revenues up by 22.4% at B3,346 crores
in the year ended March 2017 against
B2,734.3 crores in year ended March
2016. The EBIT for the division stood
at B344.7 crores in year ended March
2017 against B223.6 crores in year
ended March 2016.
The revenues of Escorts Auto Product
Division, divested in FY17, stood at
B51.3 crores in year ended March 2017
as against B100.5 crores in the year
ended March 2016. The EBIT stood at
B(10.3) crores against B(17.0) crores in
the previous year.
The Railway Products Division revenue
up by 6.5% at B242.5 crores in the
year ended March 2017 against B227.8
crores in the year ended March 2016.
The EBIT stood at B30.7 crores against
B22.5 crores in the previousyear.
The Escorts Construction Equipment
Division revenue was up by 22.2%
at B606.8 crores ended March 2017
against B496.5 crore in the year ended
March 2016. The EBIT stood at B(13.8)
crores as against B(25.7) crores last
year.
Note: The ‘forward-looking
statements’ part of the Management
Discussion & Analysis on economic
indicators is based on our best
estimate of the current environment.
This may be subject to change based
on external macro-economic factors
out of control, including but not
limited to raw material availability and
prices, cyclical demand and pricing
in the Company’s principal markets,
changes in Government regulations,
tax and economic policies.
For and on behalf of the Board of Directors
Sd/-
Place: Faridabad RAJAN NANDA
Date: May 29, 2017 Chairman & Managing Director
Escorts Limited
60
60 71st Annual Report 2016-17 61
STRATEGIC REPORT GOVERNANCE FINANCIAL STATEMENTS OTHER INFORMATION
Statutory Section

Escorts Limited62
Directors’ Report
Your Directors have pleasure in presenting the Seventy First Annual Report and the Company’s audited financial statements
(standalone and consolidated) for the financial year ended on March 31, 2017.
Financial Results
Particulars Year ended on
March 31, 2017
Year ended on
March 31, 2016
Gross Revenue 4,211.04 3,494.49
Excise Duty 74.42 71.91
Net Revenue 4,136.62 3,422.58
Profit from continuing operations before Interest, Depreciation, Exceptional
Items & Tax
367.17 232.55
Finance Cost 31.11 49.54
Profit from continuing operations before Depreciation, Exceptional Items
& Tax
336.06 183.01
Depreciation & Amortisation 63.07 57.50
Profit from continuing operations before Exceptional Items & Tax 272.99 125.51
Exceptional Item (3.76) 12.29
Profit from continuing operations before Tax 276.75 113.22
Tax Expense 75.60 12.50
Profit from continuing operations after Tax 201.15 100.72
Profit/(Loss) from discontinued operations before tax (58.46) (25.96)
Tax expense of discontinued operations (17.75) (8.99)
Net profit/(loss) from discontinued operations after tax (40.71) (16.97)
Net profit for the period 160.44 83.75
Appropriations for the year:-
Dividends (14.35) (14.30)
Tax on Dividends (2.99) (2.99)
Dividend received on shares held by beneficiary trust* 4.48 4.48
* for more information please refer note 45 of the notes to accounts of standalone financial statement
Financial Performance
The brief highlights of the Company’s performance
(standalone) for the financial year ended March 31, 2017
are:-
• Net Revenue of the Company for FY 2017 of B4,136.62 cr.
was higher by 20.86% over the last year (B3,422.58 cr. in
FY 2016).
• Profit from continuing operations Before Interest,
Depreciation, Amortisation, Exceptional Items & Tax
stood at B367.17 Cr.
• Profit from continuing operations Before Tax (PBT) stood
at B276.75 Cr and Profit from continuing operations After
Tax (PAT) stood at B201.15 Cr. Net profit for the period
stood at B160.44 Cr.
71st Annual Report 2016-17 63
STRATEGIC REPORT GOVERNANCE FINANCIAL STATEMENTS OTHER INFORMATION
• Earnings per share is of B13.43 for the year under review.
• Your Company sold 63,786 tractors during the year under
review.
Management Discussion & Analysis
Management Discussion & Analysis which forms an integral
part of this Annual Report provides a detailed analysis on
the performance of individual businesses and their outlook.
Dividend
Your Directors are pleased to recommend a Dividend of
B1.50 per Equity Share (15%) on the face value of B10/- each,
aggregating B18.39 Cr. (exclusive of tax on dividend) for the
financial year ended March 31, 2017. The dividend payout is
subject to the approval of members at the ensuing Annual
General Meeting (AGM).
The dividend, if approved at the ensuing AGM, will be
paid to members whose names appear in the Register of
Members as on September 8, 2017, in respect of shares
held in dematerialized form and members whose names
are furnished by National Securities Depository Limited and
Central Depository Services (India) Limited, as beneficial
owners as at that date.
The dividend payout for the period under review has been
formulated in accordance with shareholders’ aspirations
and the Company’s Dividend Distribution Policy to pay
sustainable dividend linked to long-term growth objectives
of the Company to be met by internal cash accruals.
Employee Stock Option Scheme
The particulars with regard to the Employees Stock Options
as on March 31, 2017 as required to be disclosed pursuant
to the provisions of Clause 12 of SEBI (Employees Stock
Option Scheme and Employees Stock Purchase Scheme)
Guidelines, 1999, as amended, are enclosed at Annexure –
A and forms an integral part of this Report.
Directors
In accordance with the provisions of Companies Act, 2013
(hereinafter referred as “the Act”) and Articles of Association
of the Company, Ms. Nitasha Nanda, Whole-time Director
and Mr. G.B. Mathur, Director retires by rotation at the
ensuing AGM and being eligible, offers themselves for re-
appointment.
The Board of Directors, in their meeting held on May
29, 2017, had recommended the re-appointment and
remuneration of Mr. Nikhil Nanda as Managing Director for
a further period of 5 years w.e.f September 19, 2017, subject
to the approval of the shareholders in the ensuing Annual
General Meeting. His appointment is appropriate and in the
best interest of the Company.
Dr. S.A. Dave had resigned as Director of the Company
w.e.f. September 20, 2016. The Board places on record its
warm appreciation for the valuable guidance and services
rendered by Dr. Dave during his tenure with the Company.
The Board of Directors, in their meeting held on May
29, 2017, had recommended the re-appointment of Mr.
P.H. Ravikumar and Mrs. Vibha Paul Rishi as Independent
Directors for a further period of 5 years for approval of
members of the Company at the ensuing AGM.
Pursuant to the provisions of Section 149 and other
applicable provisions of the Act, your directors are seeking
re-appointment of Mr. P.H. Ravikumar and Mrs. Vibha Paul
Rishi as Independent Directors for a period of 5 years.
The Company has received declarations from all the
Independent Directors of the Company confirming that
they meet with criteria of independence as prescribed
under sub-section (6) of Section 149 of the Act and
under Regulation 16(1)(b) of SEBI (Listing Obligations and
Disclosures Requirements) Regulation, 2015 (hereinafter
referred as “the Listing Regulations“). The policy for selection
of directors and determining directors independence is
attached as Annexure - B and forms an integral part of this
Report.
The Company has devised a Policy for performance
evaluation of Independent Directors, Board, Committees
and other individual Directors which includes criteria
for performance evaluation of the Non-Executive and
Executive Directors. In accordance with the Policy, a
process of evaluation was followed by the Board for its
own performance and that of its Committees and individual
Directors. The remuneration policy for directors, key
managerial personnel and other employees is annexed as
Annexure – C and forms an integral part of this Report.
The brief resumes and other details relating to the Directors
who are proposed to be appointed/ re-appointed, as
required to be disclosed under the Listing Regulations is
given in the Annexure to the Notice of the 71st AGM.
Your Directors recommend the appointment/ re-
appointment of the above said Directors at the ensuing
AGM.
The Company has devised a process where various
presentations/ programs are being conducted to make
them familiarise with various developments at Industry level,
new business initiatives and organisation strategies etc.
Escorts Limited64
The details of programme for familiarisation of Independent
Directors with the Company, their roles, rights, responsibilities
in the Company, nature of industry in which the Company
operates, business model of the Company and related
matters are put up on the website of the Company – www.
escortsgroup.com.
Conservation of Energy, Technology
Absorption, Foreign Exchange Earnings and
Outgo
The particulars relating to conservation of energy,
technology absorption, foreign exchange earnings and
outgo, as required to be disclosed under Section 134(3)(m)
of the Act read with Companies (Accounts) Rules, 2014 are
provided as Annexure - D and forms an integral part of this
Report.
Corporate Governance
Your Company reaffirms its commitment to the good
corporate governance practices and has adopted the Code
of Conduct which has set out the systems, processes and
policy conforming to international standards. Pursuant to
Regulation 34(3) of the Listing Regulations 2015, Corporate
Governance Report and Auditors’ Certificate regarding
compliance of conditions of Corporate Governance are
enclosed as Annexure - E and forms an integral part of this
Report.
Corporate Social Responsibility (CSR)
The key philosophy of all CSR initiatives of the Company
is to make CSR a key business process for sustainable
development of the society. The initiatives aim at enhancing
welfare measures of the society based on the immediate
and long term social and environmental consequence of
its activities.
The Company intends to undertake other need based
initiatives in compliance with Schedule VII of the Act.
The CSR Policy may be accessed on the Company’s website
www.escortsgroup.com under Investors Information
Section. During the year, the Company has spent B3.30 Cr.
(1.93% of the average net profits of last three financial years)
on CSR activities.
The Annual Report on CSR activities is enclosed as Annexure
– F and forms an integral part of this Report.
Indian Accounting Standards
The Ministry of Corporate Affairs (MCA) on February 16,
2015, notified that Indian Accounting Standards (Ind AS) are
applicable to certain classes of companies from April 1, 2016
with a transition date of April 1, 2015. Ind AS has replaced
the previous Indian GAAP prescribed under Section 133 of
the Companies Act, 2013 (“the Act”) read with Rule 7 of the
Companies (Accounts) Rules, 2014. Ind AS is applicable to
the Company from April 1, 2016.
The reconciliations and descriptions of the effect of the
transition from previous GAAP to Ind AS have been set
out in Note 49 in the notes to accounts in the standalone
financial statement and in Note 49 in the notes to accounts
in the consolidated financial statement.
Consolidated Financial Statements
The Consolidated Financial Statements have been prepared
in accordance with the Act and Indian Accounting
Standard (IND AS) - 110 applicable to the Consolidated
Financial Statements read with IND AS-28 on Accounting
for Investments in Associates and IND AS-31 on Financial
Reporting of Interests in Joint Ventures issued by The
Institute of Chartered Accountants of India. The Audited
Consolidated Financial Statements along with the Auditors’
Report thereon are annexed with this Report.
Subsidiaries, Joint Ventures and Associate
Companies
The statement containing salient features of financial
statements of subsidiaries, associate and joint venture
companies prepared in accordance with Section 129 of the
Act read with Rule 5 of Companies (Accounts) Rules, 2014,
forms an integral part of this Report. The Consolidated
Financial Statements presented by the Company include
the financial results of its subsidiaries, associate and joint
venture companies.
The Company will make available the Annual Accounts
of its subsidiaries, associate and joint venture companies
and related information to the members of the Company
who may be interested in obtaining the same. The annual
accounts of its subsidiaries, associate and joint venture
companies will also be kept open for inspection at the
Registered Office of the Company.
Contracts and Arrangements with Related
Parties
All contracts/ arrangements/ transactions entered by the
Company during the financial year with related parties were
in the ordinary course of business and on an arm’s length
basis. During the year, the Company had not entered into
any contract/ arrangement/ transaction with related parties
which could be considered material in accordance with the
policy of the Company on the materiality of related party
transactions.
71st Annual Report 2016-17 65
STRATEGIC REPORT GOVERNANCE FINANCIAL STATEMENTS OTHER INFORMATION
The particulars of contracts and arrangement with related
parties under Section 188(1) of the Act in Form AOC-2 is
enclosed as Annexure – G.
The Policy on materiality of related party transactions and
dealing with related party transactions as approved by the
Board may be accessed on the Company’s website www.
escortsgroup.com under Investors Information Section.
Your Directors draw attention of the members to Note 48 in
the notes to accounts in the standalone financial statement
and to note 47 in the notes to accounts in the consolidated
financial statement which sets out related party disclosures.
Auditors and Auditors’ Report
Statutory Auditors
Pursuant to the provisions of Section 139 of the Act read
with Companies (Audit and Auditors) Rules, 2014, M/s. S.N.
Dhawan & Co. LLP, Chartered Accountants, Delhi (Firm
Registration No. 000050N/N50004) Statutory Auditors of
the Company, hold office till the conclusion of the ensuing
AGM and are not eligible for re-appointment.
M/s. Walker Chandiok & Co LLP, Chartered Accountants,
New Delhi (Firm Registration No. 001076N/ N500013)
have shown their interest to act as Statutory Auditors of the
Company for a period of 5 years subject to the ratification
of their appointment at every AGM.
The Company has received letter of confirmation from
M/s. Walker Chandiok & Co LLP, Chartered Accountants to
the effect that their appointment, if made, would be within
the prescribed limits under Section 139 of the Act and that
they are not disqualified for such appointment within the
meaning of Section 141 of the Act, read with Companies
(Audit and Auditors) Rules, 2014.
The observations and comments given by M/s. S.N. Dhawan
& Co. LLP, Chartered Accountants, Statutory Auditors in
their report read together with notes to Accounts for the
year ended March 31, 2017 are self-explanatory and hence,
do not call for any further comments under Section 134 of
the Act.
Cost Auditors
The Board of Directors of the Company has re-appointed
M/s. Ramanath Iyer and Co., Cost Accountants, New
Delhi (Firm Registration No. 000019), Cost Auditors of the
Company under Section 148 of the Act, for conducting the
audit of cost records for the financial year 2017-18.
The due date of filing the Cost Audit Report for the year
ended on March 31, 2016 was September 30, 2016 and the
same has been filed on September 28, 2016.
Secretarial Auditors
The Board of Directors of the Company had appointed
M/s. Jayant Gupta and Associates, Practicing Company
Secretary to conduct secretarial audit of the Company
for the financial year 2016-17. The Secretarial Audit Report
for the financial year ended March 31, 2017 is enclosed as
Annexure – H and forms an integral part of this Report.
The observations and comments given by the Secretarial
Auditors in their report are self-explanatory and hence, do
not call for any further comments under Section 204(3) of
the Act.
The Board has also re-appointed M/s. Jayant Gupta and
Associates, Practicing Company Secretary to conduct
secretarial audit of the Company for the financial year
2017-18.
Risk Management
A Risk Management Committee which has been
entrusted with the responsibility to assist the Board in (a)
overseeing and approving the Company’s enterprise wide
risk management framework; and (b) Overseeing that
all the risks that the organisation faces such as strategic,
financial, credit, market, liquidity, security, property, IT, legal,
regulatory, reputational and other risks have been identified
and assessed and there is an adequate risk management
infrastructure in place capable of addressing those risks. The
Risk Management Policy was reviewed and approved by the
Committee.
Internal Financial Controls
The Company has in place adequate internal financial
controls for ensuring the orderly and efficient conduct of
its business. During the year, such controls were tested and
no reportable material weakness in the design or operation
was observed.
Disclosures
Meetings of the Board
Five meetings of the Board of Directors were held during the
year. For further details, please refer Report on Corporate
Governance annexed as Annexure – E to this Report.

Escorts Limited66
Audit Committee
For constitution and other details of the Audit Committee,
please refer Report on Corporate Governance annexed as
Annexure-E to this Report.
All the recommendations made by the Audit Committee
were accepted by the Board.
Extracts of Annual Return
In terms of provisions of Section 92 of the Act read with the
Companies (Management and Administration) Rules, 2014,
the extracts of Annual Return in Form MGT-9 is enclosed as
Annexure – I and forms an integral part of this Report.
Vigil Mechanism
The Company has a vigil mechanism for Directors and
Employees to report their concerns about unethical
behavior, actual or suspected fraud or violation of the
Company’s Code of Conduct. The mechanism provides
for adequate safeguards against victimization of effected
Director(s) and Employee(s). In exceptional cases, Directors
and Employees have direct access to the Chairman of the
Audit Committee. The Whistle Blower Policy is available on
Company’s website.
Registrar and Share Transfer Agent
The Share Transfer and related activities are being carried
out by M/s Karvy Computershare Private Limited, Registrar
and Share Transfer Agents (Karvy RTA), from the following
address: -
M/s Karvy Computershare Private Limited
Karvy Selenium, Tower B, Plot No. 31-32,
Gachibowli, Financial District, Nanakramguda,
Hyderabad-500032, Telengana
All correspondence may kindly be sent to the above address
only.
Particulars of Loans given, Investments made,
Guarantees given and Securities provided
Particulars of loans given, investments made, guarantees
given and securities provided along with the purpose for
which the loan or guarantee or security is proposed to be
utilised by the recipient has been given elsewhere in the
Annual Report and forms an integral part of this Report.
Particulars of Employees and related
disclosures
In terms of provisions of Section 197(12) of the Act, read
with the Companies (Appointment and Remuneration of
Managerial Personnel) Rules, 2014, a statement showing
the names and other particulars of the employees drawing
remuneration in excess of the prescribed limits are available
with the Company Secretary. Having regard to the provisions
of Section 136(1) of the Act, the Annual Report excluding
the aforesaid information is being sent to the members of
the Company. Any member interested in obtaining such
particulars may write to the Company Secretary of the
Company and the same will be furnished on request.
Disclosures pertaining to remuneration and other details
as required under Section 197(12) of the Act read with Rule
5(1) of the Companies (Appointment and Remuneration of
Managerial Personnel) Rules, 2014 is annexed as Annexure
– J and forms an integral part of this Report.
Public Deposits
The Company has not accepted/ renewed any Fixed
Deposit during the financial year.
Transfer to Investor Education and Protection
Fund
Pursuant to the provisions of Section 205A(5) of the Act, the
dividend which remained unclaimed or unpaid for a period
of seven years has been transferred by the Company, from
time to time on due dates to the Investor Education and
Protection Fund.
As on March 31, 2017, no unclaimed deposits are pending
for transfer to Investor Education and Protection Fund.
Divestment of Auto Products Business
During the year, the Company has divested its OEM & Export
Business of Auto Product Division as a part of the planned
strategic reorientation of the business to focus on core
verticals in the Agri-Machinery, Construction Equipment
and Railway Equipment segments.
Credit Rating
During the year, the credit rating of the Company have
been upgraded as under:
India Ratings has upgraded the long-term rating from ‘IND
A-’ to ‘IND A’.
ICRA Limited has upgraded the long-term rating from “A-”
to “A” with upward change in outlook from “STABLE” to
“POSITIVE”.
Business Responsibility Report
As stipulated under the Listing Regulations, the Business
Responsibility Report describing the initiatives taken by the
Company from an environmental, social and governance
71st Annual Report 2016-17 67
STRATEGIC REPORT GOVERNANCE FINANCIAL STATEMENTS OTHER INFORMATION
perspective can be accessed at the website of the Company
www.escortsgroup.com under Investor Information Section.
Directors’ Responsibility Statement
Pursuant to the requirement under Section 134(5) of the
Act, with respect to Directors’ Responsibility Statement,
your Directors hereby state that:
(i) in the preparation of the annual accounts for the year
ended March 31, 2017, the applicable accounting
standards read with requirements set out under
Schedule III to the Act, have been followed alongwith
proper explanation relating to material departures;
(ii) the Directors have selected such accounting policies
and applied them consistently and made judgements
and estimates that are reasonable and prudent so as
to give a true and fair view of the state of affairs of the
Company as at March 31, 2017 and of the profit and loss
of the Company for the year ended on that date;
(iii) the Directors have taken proper and sufficient care
for the maintenance of adequate accounting records
in accordance with the provisions of the Act, for
safeguarding the assets of the Company and for
preventing and detecting fraud and other irregularities;
(iv) the Directors have prepared the annual accounts for
financial year ended March 31, 2017 on a ‘going concern’
basis;
(v) the Directors have laid down internal financial controls
to be followed by the Company and that such internal
financial controls are adequate and are operating
effectively; and
(vi) the Directors had devised proper systems to ensure
compliance with the provisions of all applicable laws
and that such systems are adequate and operating
effectively.
General
Your Directors state that no disclosure or reporting is
required in respect of the following items as there were no
transactions on these items during the year under review:
1. Details relating to deposits covered under Chapter V of
the Act.
2. Issue of equity shares with differential rights as to
dividend, voting or otherwise.
3. Issue of shares (including sweat equity shares) to
employees of the Company under any scheme save
and except ESOS referred to in this Report.
4. Neither the Managing Director nor the Whole-time
Directors of the Company receive any remuneration or
commission from any of its subsidiaries.
5. No significant or material orders were passed by the
Regulators or Courts or Tribunals which impact the
going concern status and Company’s operations in
future.
Your Directors further state that during the year under
review, there were no cases filed pursuant to the Sexual
Harassment of Women at Workplace (Prevention,
Prohibition and Redressal) Act, 2013.
Acknowledgement
Your Directors would like to express their sincere
appreciation of the positive co-operation received from
the Central Government, the Government of Haryana
and Uttaranchal, Financial Institutions and the Company’s
Bankers, Customers and Dealers.
The Directors also wish to place on record their deep
sense of appreciation for the commitment displayed by
all executives, officers, workers and staff of the Company
resulting in the successful performance of the Company
during the year.
The Board also takes this opportunity to express its deep
gratitude for the continued co-operation and support
received from its valued shareholders.
For and on behalf of the Board of Directors
Sd/-
Place: Faridabad RAJAN NANDA
Date: May 29, 2017 Chairman & Managing Director

Escorts Limited68
(a) Total Number of Options as on 31/03/2016 1,11,100
(b) Options granted during the year NIL
(c) Pricing Formula At a price not less than the par value of Company’s share and not
more than the closing Market Price of the Stock Exchanges:
No Options were granted during the financial year ended on
March 31, 2017.
(d) Options Vested 1,11,100
(e) Options Exercised 84,000
(f) The Total number of shares arising as a result of exercise of
options
84,000
(g) Options Lapsed/ Cancelled NIL
(h) Variation of terms of options Nil
(i) Money realised by exercise of options 71,40,000/-
(j) Total number of options in force 27,100 as on March 31, 2017
(k) Employee wise details of options granted to:
• Senior managerial personnel during the year
• any other employee who receives a grant in any one year
of options amounting to 5% or more of option granted
during the year.
• identified employees who were granted option, during any
one year, equal to or exceeding 1% of the issued capital
(excluding outstanding warrants and conversions) of the
Company at the time of grant.
NIL
NIL
NIL
(l) Diluted Earnings Per Share (EPS) pursuant to issue of shares
on exercise of option calculated in accordance with Indian
Accounting Standard (IND - AS) 33 ‘Earnings Per Share’.
B16.84 per Equity Share
(m) Where the Company has calculated the employee
compensation cost using the intrinsic value of stock options,
the difference between the employee compensation cost so
computed and the employee compensation cost that shall
have been recognized if it had used the fair value of options,
shall be disclosed. The impact of this difference on profits and
EPS of the Company shall also be disclosed.
The profit of the year would have been higher by B NIL.
The EPS for the year would have been higher by B NIL.
(n) Weighted–average exercise prices and weighted-average fair
values of options shall be disclosed separately for options
whose exercise price either equals or exceeds or is less than
the market price of the stock.
Fair value option is B41.19 and Exercise Price is B85.00.
Directors’ ReportAnnexure – A to the
Disclosure regarding Employees Stock Option Plan pursuant to the SEBI
(Employees Stock Option Scheme and Employees Stock Purchase Scheme)
Guidelines, 1999
71st Annual Report 2016-17 69
STRATEGIC REPORT GOVERNANCE FINANCIAL STATEMENTS OTHER INFORMATION
(o) A description of the method and significant assumptions used
during the year to estimate the fair values of options, including
the following weighted average information :
• Risk free interest rate
• Expected life
• Expected volatility
• Expected dividends, and
• The price of the underlying share in market at the time of
option grant
The Black Scholes Option Pricing Model for dividend paying stock
has been use to compute the fair value of the options. The signifi-
cant assumptions made are:
Option Issued on October 1, 2015
7.68 %
2 Years
0.0194
15%
B154.00 on October 1, 2015
The shares to be issued under stock options shall rank pari passu,
including the right to receive dividend. Expected dividend payouts
to be paid during the life of the option reduce the value of a call
option by creating drop in market price of the stock. Adjustments
for known anticipated dividend payouts over the life of the option
are made to the formulae under the Black Scholes method.
For and on behalf of the Board of Directors
Sd/-
Place: Faridabad RAJAN NANDA
Date: May 29, 2017 Chairman & Managing Director

Escorts Limited70
1. Preamble
(i) This Policy on Appointment of Directors and Members
of Senior Management (the “Policy”) applies to the Board
of Directors (the “Board”) of Escorts Limited (“Escorts” or
the “Company”) and the Senior Management of Escorts.
This Policy was recommended by the Nomination and
Remuneration Committee of the Company (“NRC”) and
approved by the Board at its meeting held on January
16, 2015 and is subjected to periodic review by NRC.
(ii) The primary objective of the Policy is to provide a
framework and set standards for the appointment of
talented and self-motivated Directors and Members of
Senior Management who should have the capacity and
ability to lead Escorts towards achieving its stated goals
and strategic objectives, taking into account the interest
of all stakeholders.
(iii) The Board is ultimately responsible for the appointment
of Directors and recommending the appointment of
Independent Directors to the shareholders for their
approval.
(iv) The Board has delegated to NRC its responsibility for
the assessment and selection of suitable candidates
for the position of Director(s) on the Board of Escorts,
which will submit its recommendations to the Board, in
accordance with this Policy.
2. Definitions
For the purposes of this Policy:
‘Executive Board’ shall mean and include the Chairman
and Managing Director, Managing Director and any other
Whole-time Director of Escorts appointed by the Board/
Shareholders, by whatever name called.
‘Senior Management’ shall mean and include the following:
• Employees in the grade of Vice President and above; and
• KMPs (other than Whole-time Directors).
3. Criteria for Appointment as a Director and
Senior Management Positions:
(i) Matching the requirements of Escorts and enhancing
the competencies of the Board are the basis for NRC to
shortlist and recommend a candidate for appointment
to the Board. Such candidate shall have primary or
substantial strategic and balance sheet management/
profitability management responsibilities. When
recommending a candidate for such appointment, NRC
shall consider:
(a) the results of assessment of the proposed appointee
against a range of criteria formulated by NRC which
include but shall not be limited to skill sets, regional
and industry experience, background, integrity and
other qualities required to operate successfully in
the position of Director, having due regard to the
benefits of diversity of the Board;
(b) the extent to which the proposed appointee is
likely to contribute to the overall effectiveness of
the Board and work constructively with the existing
Directors and Senior Management;
(c) the present and potential future needs and
requirements of the Company and sector in which it
conducts its business and operations;
(d) the nature of existing positions held by the proposed
appointee including other directorships held or
other relationships and the impact it may have on
the appointee’s ability to exercise independent
judgment;
(e) any requirements under applicable law (including
but not limited to under the Companies Act, 2013
and/ or the rules and regulations made thereunder)
and/ or under the Listing Agreements; and
(f) time commitment required from a Director to
properly discharge his fiduciary duties towards the
Company.
Directors’ ReportAnnexure – B to the
Policy on Appointment and Removal of Director’s and Members of Senior
Management
71st Annual Report 2016-17 71
STRATEGIC REPORT GOVERNANCE FINANCIAL STATEMENTS OTHER INFORMATION
(ii) The criteria to be considered when assessing prospective
candidates for appointment as Directors shall include
the following:
(a) highest levels of personal and professional ethics
and integrity;
(b) high quality attributes such as discipline,
objectiveness, sensitivity and creativity;
(c) sharing and demonstrating the core values of
Escorts;
(d) qualification in relevant disciplines (e.g. finance,
secretarial, management, accountancy, legal and
engineers etc.) or being a recognized specialist in
disciplines or areas relevant to the Company and/ or
its business;
(e) experience in the management of a diverse
organization, whether located in India and/ or
overseas, in the Sector where the Company is
already doing business or intents to enter into;
(f) experience in accounting and finance, secretarial,
administration, corporate, engineering and strategic
planning or fund management;
(g) demonstrable ability to work effectively with the
Board;
(h) excellent interpersonal, communication and
representational skills;
(i) demonstrable leadership skills;
(j) strong influencing and negotiating skills; and
(k) continuous professional development to update
knowledge and skills.
(iii) The criteria to be considered when assessing prospective
candidates for a Senior Management position shall
include the following:
(a) highest levels of personal and professional ethics
and integrity;
(b) demonstrable leadership skills;
(c) specialist knowledge and/or experience required for
the Senior Management position in question;
(d) good interpersonal relationships;
(e) demonstrating intelligence, maturity and wisdom;
(f) possesses managerial abilities such as effective
communication skills, action focus, people
engagement, cultural sensitivity, flexibility, team
player, strategic thinking, etc.;
(g) sharing and demonstrating the values of Escorts ;
and
(h) ability to significantly contribute towards
achievement of the strategic and business objectives
of the Company.
(iv) Every person proposed to be appointed as a Director or
a member of Senior Management should be able to give
sufficient time and attention to the Company’s affairs.
(v) The Policy is aimed to engage Directors (including
Non-Executive Directors and Independent Directors)
and Members of Senior Management, who are highly
skilled, competent and experienced persons within the
fields of business, finance, accounting, management,
sales, marketing, administration, research, corporate
governance, technical operations, law or other
disciplines related to the Company’s business and
operations.
(vi) In addition to such requirements as may be specified
under this Policy, the Independent Directors shall also
fulfill the applicable requirements prescribed under
Section 149 of the Companies Act, 2013 and the rules
and regulations made there under, the provisions of
the Listing Agreement(s) and other applicable laws as
modified or amended or supplemented, from time to
time.
(vii) Each Independent Director shall be required to duly
submit/ make the stipulated declarations required to be
furnished pursuant to the provisions of the Companies
Act, 2013 and the rules and regulations made thereunder,
the Listing Agreements, other applicable laws and the
Articles of Association of the Company.
(viii) No person shall be considered for appointment/ re-
appointment as a Director of Escorts, if he is disqualified
to be appointed/ re-appointed as such in terms of the
provisions of Section 164 of the Companies Act, 2013 or
under any other applicable law.
(ix) No person shall be considered for appointment as a
Director of Escorts, if he is already a Director in ten or
more public companies or private companies, which
is either a holding or subsidiary company of a public
company.
4. Selection Process
(i) The selection procedure to be followed for the
appointment of persons for the Board is as below:

Escorts Limited72
(a) NRC in consultation with the Chairman and
Managing Director of Escorts shall determine the
selection criteria applicable for each position at the
Board level (“Director Selection Criteria”).
(b) For the positions of Whole-time Directors: based on
the applicable Selection Criteria, NRC in consultation
with the Chairman and Managing Director of
Escorts, shall generate a potential list of candidates
for the Board position in question who may meet
the prescribed Director Selection Criteria.
(c) For the positions of Independent Directors or
Non-Executive Directors: NRC shall finalize a list
of potential candidate(s) who meets the applicable
Director Selection Criteria and shall submit such
list to the Chairman of the Board along with its
recommendations.
(d) The Chairman of the Board shall thereafter meet the
short listed candidate(s) to assess their capability for
the job. In the event that the Chairman may feel that
no short listed candidate is suitable for appointment
to the Board, the Chairman may require NRC to
submit a fresh list of candidates.
(e) The candidate selected by the Chairman, shall
be appointed in accordance with the relevant
provisions of the Companies Act, 2013, rules
made thereunder and SEBI (Listing Obligations and
Disclosure Requirements) Regulations, 2015 subject
to the approval of the Board and/ or Shareholders of
Escorts at General Meeting.
(ii) The selection procedure to be followed for the
appointment of persons at the Senior Management
positions is as below:
(a) In case of vacancy of KMP (other than Whole-time
Directors), the Company’s HR in consultation with
NRC shall identify and short list employees to fill
such vacancy, who may meet the criteria mentioned
in this Policy. The appointment of the successful
candidate shall be made by the Board in accordance
with the provisions of the Companies Act, 2013,
rules made thereunder, SEBI (Listing Obligations and
Disclosure Requirements) Regulations, 2015 and
the Company’s internal rules and regulations and
policies.
(b) In case of vacancy in other Senior Management
positions, the Company’s HR shall identify and short
list employees to fill such vacancy. The details of
appointment will be placed before NRC and/ or
Board for noting only.
5. Appointment Procedure
(i) Every Director shall be appointed/ re-appointed
by Escorts at Board or General Meeting as per the
requirements of the Companies Act, 2013, Listing
Agreement(s) or any other applicable laws.
(ii) No person shall be appointed/ re-appointed as a
Director of Escorts unless he/ she has been allotted the
Director Identification Number (DIN) and he furnishes
to Escorts a declaration to the effect that he is not
disqualified to become a Director under the provisions
of the Companies Act, 2013 and rules made there under
or under any other law for the time being in force and
files consent to hold the office as Director.
(iii) No person shall be appointed as a Director whose name
appears in the list of willful defaulters published by the
Reserve Bank of India.
(iv) NRC shall ensure that the appointment/ re-appointment
of Directors of Escorts is as per the terms of this Policy
and recommendations of candidates are made to the
Board for appointment.
6. Term/ Tenure
(i) Managing Director/Whole-time Director
The Company shall appoint or re-appoint any person as
its Managing Director and CEO or Whole-time Director
for a term not exceeding three to five years at a time
with a provision for periodic review of performance.
No re-appointment shall be made earlier than one year
before the expiry of term.
(ii) Independent Director
An Independent Director shall hold the office for a
maximum term of up to five consecutive years on
the Board of the Company and will be eligible for re-
appointment on passing a special resolution by the
Company and disclosure of such appointment in the
Board’s Report.
Independent Directors will normally have an age limit
of 75 years. The Board might however in specific cases
review this age limit and continue the tenure of the
appointment subject to such approvals as are needed.
A new appointee will therefore be at the time of
appointment will not be more than 70 years old. The limit
of 75 years will not apply to non-independent directors
and/ or to Independent Directors re-categorized as non-
71st Annual Report 2016-17 73
STRATEGIC REPORT GOVERNANCE FINANCIAL STATEMENTS OTHER INFORMATION
independent directors, subject the composition of the
Board being in conformity with the extant guidelines.
No Independent Director shall hold the office for more
than two consecutive terms, but Such Independent
Director shall be eligible for appointment after the expiry
of three years of ceasing to become an Independent
Director. Provided that an Independent Director shall
not during the said period of three years, be appointed
in or be associated with the Company in other capacity,
either directly or indirectly. However, if a person who has
already served as an Independent Director for five years
or more in the Company as on April 1, 2014 or such
other date as may be determined by the Committee as
per regulatory requirement, he/ she shall be eligible for
appointment for one more term of up to five years only.
At the time of appointment of Independent Director,
it should be ensured that number of Boards on which
such Independent Director serves is restricted to seven
listed companies as an Independent Director and three
listed companies as an Independent Director in case
such person is serving as a Whole-time (Executive)
Director of a listed company.
7. Letters of Appointment to Directors
Escorts shall issue a formal letter of appointment to the
person appointed as a Director of Escorts. The letter of
appointment to be issued to the Independent Directors
shall inter alia set out the matters as stated in Schedule
IV of the Companies Act, 2013.
8. Evaluation Procedure for Directors
(i) NRC shall develop such assessment criteria as it shall
deem fit for the purposes of undertaking performance
evaluation of the Directors and the Board as a whole.
NRC shall undertake an annual performance evaluation
of all Directors of Escorts based on the relevant
assessment criteria developed by it.
(ii) The assessment criteria for performance evaluation
of Directors shall be disclosed in accordance with the
relevant provisions of the Companies Act, 2013, the
rules framed thereunder and SEBI (Listing Obligations
and Disclosure Requirements) Regulations, 2015.
9. Removal
Due to reasons for any disqualification mentioned in the
Companies Act, 2013, rules made thereafter or under
any other applicable Act, rules and regulations, the
Committee may recommend, to the Board with reasons
recorded in writing, removal of a director or KMP subject
to the provisions and compliance of said Act, rules and
regulations.
10. Retirement
The Whole-time Directors, KMP and Senior Management
Personnel shall retire as per the applicable provisions of
the Companies Act, 2013 and the prevailing policy of
the Company.
The Board will have the discretion to retain the Whole-
time Directors, KMP and Senior Management Personnel
in the same position/ remuneration or otherwise, even
after attaining the retirement age, for the benefit of the
Company.
11. Policy Review
(i) This Policy may be amended, modified or supplemented
from time to time to ensure compliance with any
modification, amendment or supplementation to the
Companies Act, 2013 and rules made thereunder,
SEBI (Listing Obligations and Disclosure Requirements)
Regulations, 2015, the Securities and Exchange Board
of India Act, 1992 and rules/ regulations/ guidelines
made thereunder, the Memorandum and Articles of
Association of the Company or as may be otherwise
prescribed by the Board from time to time.
(ii) NRC may issue/ implement such guidelines, procedures,
formats and/ or reporting mechanisms to enforce this
Policy as it may deem fit.

Escorts Limited74
1. Preamble
The primary objective of this Remuneration Policy
for the Directors, Key Managerial Personnel, Senior
Management and other employees (the “Policy”) is
to provide a framework for the remuneration of the
Directors, Key Managerial Personnel (KMP), Members
of Senior Management and other employees of the
Escorts Limited (“Escorts” or the “Company”).
In terms of Section 178 of the Companies Act, 2013
read with rules framed thereunder and SEBI (Listing
Obligations and Disclosure Requirements) Regulations,
2015, the Nomination and Remuneration Committee
of Directors of the Company (NRC) has formulated and
recommended this Policy for the approval of the Board
of Directors of Escorts.
The primary objectives of this Policy are as under:
(i) To ensure that the level and composition of remuneration
is in line with other companies in the industry, sufficient
to attract and retain right talent, at all levels and keep
them motivated enough to meet the organisational
objectives.
(ii) To ensure that a reasonable balance is maintained
in terms of composition of remuneration (fixed and
variable component).
(iii) To have performance measurement parameters in place
to assess the overall performance of Directors, KMPs,
Members of Senior Management and other employees.
Based on the above objectives and broad parameters set
herein, the Board of Directors of Escorts at its meeting
held on January 16, 2015, has approved this Policy.
2. Applicability
This Policy shall be applicable and act as a guiding
principle with regard to remuneration payable by Escorts
to all Directors, KMPs, Members of Senior Management
and other employees of the Escorts.
3. Remuneration of Non-Executive/
Independent Directors
(i) The key elements of remuneration of Non-Executive/
Independent Directors are commission and sitting fees
(except professional fee, if any), subject to overall limit as
prescribed in the Companies Act, 2013 read with rules
made thereunder and the approval of the shareholders,
as applicable. They shall be covered under the Directors
and Officers Liability Insurance (D&O) Policy. The
Independent Directors shall not be eligible for stock
options.
(ii) Since, the Non-Executive/ Independent Directors
collectively endeavor to ensure that the Company
performs well and is compliant with applicable laws,
rules, regulations and guidelines, they may be paid
commission, subject to the approval of the Board and
subject to extant legal, regulatory and other applicable
provisions and adequacy of sustained profitability.
4. Remuneration of Whole-time Director’s
including Whole-time KMP (being a
Director)
(i) The Whole-time Directors are appointed on a contractual
basis for a fixed tenure as approved by the shareholders
and such contracts are renewable upon expiry of the
tenure subject to recommendation by NRC/ Board and
approval of the shareholders.
(ii) The remuneration paid to Whole-time Directors is within
the limits approved by the shareholders of Escorts which
includes fixed salary, perquisites, variable pay in the form
of commission, other benefits and allowances and
certain retirement benefits, within the overall limit under
Section 197 of the Companies Act, 2013. They are also
eligible for stock options as per the scheme framed/ to
be framed by Escorts, from time to time.
(iii) The Whole-time Directors shall be covered under the
Directors and Officers Liability Insurance (D&O) Policy.
(iv) Their annual increments shall be linked to their overall
performance and as recommended by NRC and
approved by the Board, from time to time.
Directors’ ReportAnnexure – C to the
Remuneration Policy for the Directors, Key Managerial Personnel, Senior
Management and other employees
71st Annual Report 2016-17 75
STRATEGIC REPORT GOVERNANCE FINANCIAL STATEMENTS OTHER INFORMATION
(v) While fixing the remuneration components, the
Company will also reckon extant and emerging
economic conditions, state of the sector and economy,
competitive pressures for key qualified personnel not
merely in the sector but also in the analogous sectors
where the skill sets would be relevant; the Company will
also reckon (with a lag where necessary), the multiple of
the total emoluments payable to such directors vis-a-vis
the mean salary paid to an employee in the organization.
5. Members of Senior Management, KMP
(other than Whole-time Directors) and
other employees
(i) Senior Management shall mean and include the
following:
(a) Employees in the grade of Associate Vice
President and above; and
(b) KMPs (other than Whole-time Directors).
(ii) The key components of remuneration package
of the Senior Management and other employees
of Escorts shall comprise of basic salary, dearness
allowance, house rent allowance, transport
allowance, ex-gratia, performance bonus,
contribution to provident fund and superannuation
fund, premium on medical insurance and personal
accident insurance, scholarship for children, gratuity,
leave travel allowance, leave encashment etc.,
which is linked to their grade. They are also eligible
for stock options as per the scheme framed/ to be
framed by Escorts, from time to time.
(iii) The remuneration, performance appraisal and
rewards of Members of Senior Management and
other employees, shall be in line with the stated
objectives.
(iv) The annual increments for the Senior Management
and KMP (other than Whole-time Directors) and
other employees shall be linked to their overall
performance and as decided by the Chairman
and Managing Director in consultation with their
reporting managers and Company’s HR. The Board,
on the recommendation of NRC, shall also review
and approve the remuneration payable to the Key
Managerial Personnel of the Company.
(v) Employees must conduct themselves to ensure
that no breach of Code of Conduct, Escorts Code
of conduct for prevention of Insider trading or
such other code as may be applicable from time to
time, Standard Operating Procedures (SOPs) and all
other relevant and applicable codes is committed.
Any such breach will have a direct bearing on their
performance appraisal and rewards and shall also
attract appropriate disciplinary action.
(vi) While fixing the remuneration components, the
Company will also reckon extant and emerging
economic conditions, state of the sector and
economy, competitive pressures for key qualified
personnel not merely in the sector but also in
the analogous sectors where the skill sets would
be relevant; the Company will also reckon (with
a lag where necessary), the multiple of the total
emoluments payable to such directors vis-a-vis the
mean salary paid to an employee in the organization.
6. Disclosures in the Board’s Report
(i) The disclosures as required under the relevant
provisions of the Companies Act, 2013, rules made
thereunder and the revised SEBI (Listing Obligations
and Disclosure Requirements) Regulations, 2015
shall be made with regard to the remuneration
details of the Directors, KMPs, Senior Management
and other employees.
(ii) This Policy shall be uploaded on the website of the
Company.
7. Policy review
(i) This Policy may be amended, modified or
supplemented from time to time to ensure
compliance with any modification, amendment
or supplementation to the Companies Act, 2013,
rules made thereunder, the Listing Agreements, the
Securities and Exchange Board of India Act, 1992
and rules/ regulations/ guidelines made thereunder,
the Memorandum and Articles of Association of the
Company or as may be otherwise prescribed by the
Board from time to time.
(ii) NRC may issue/ implement such guidelines,
procedures, formats and/ or reporting mechanisms
to enforce this Policy as it may deem fit.
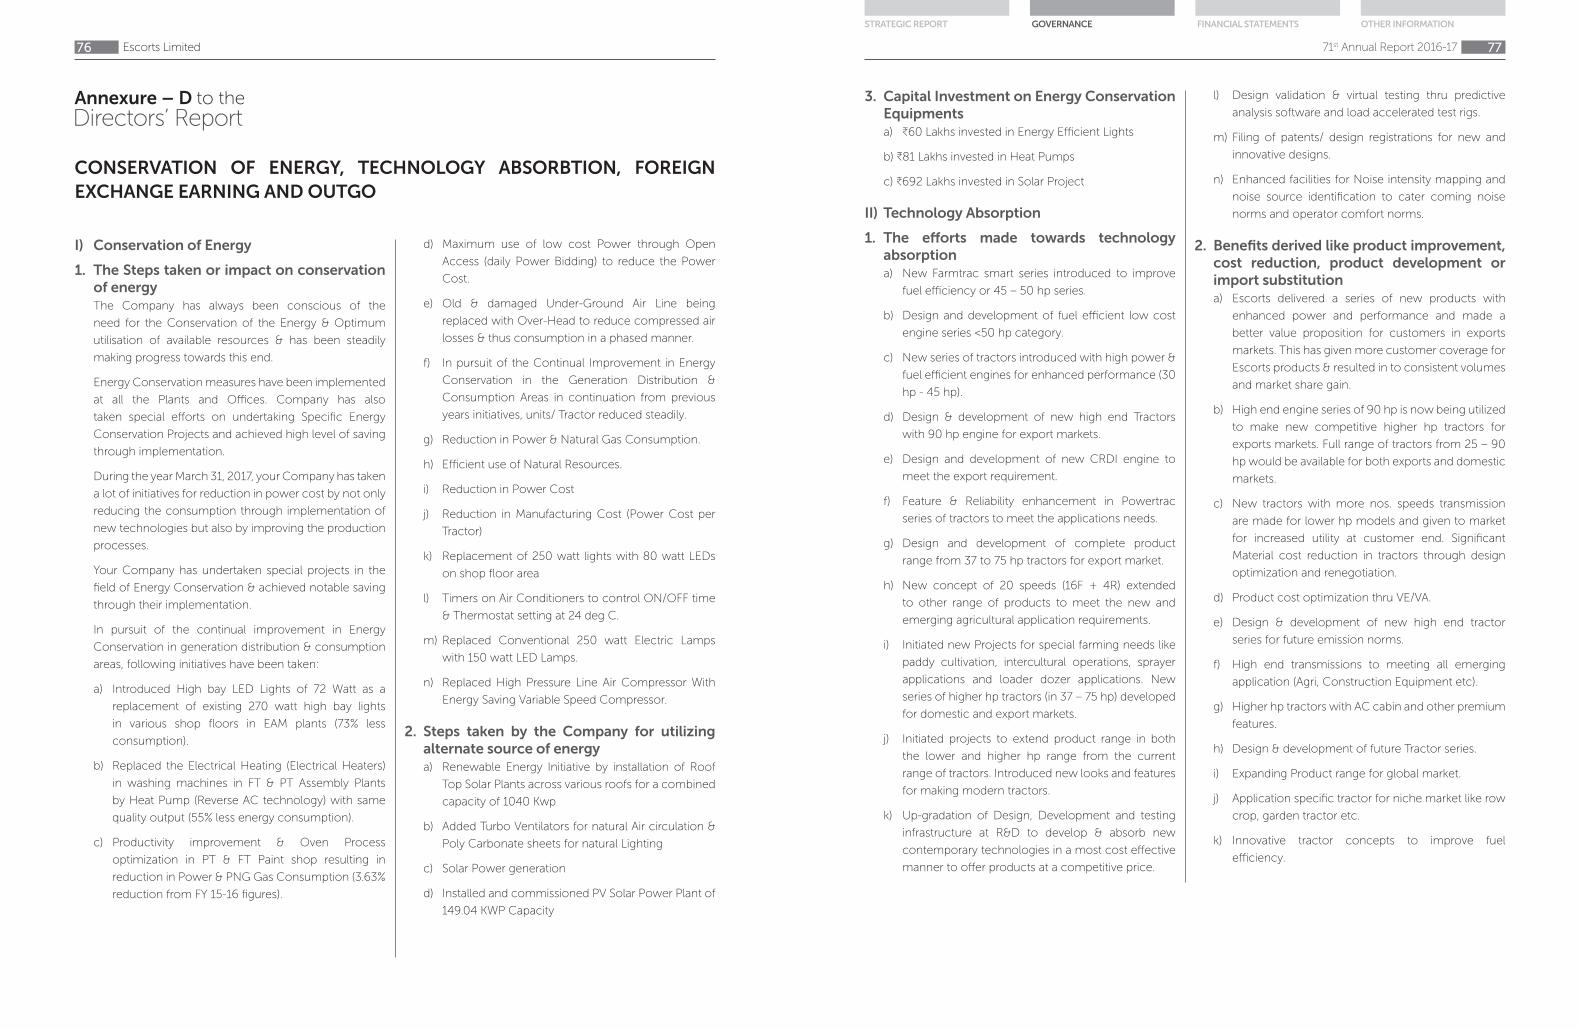
Escorts Limited76
I) Conservation of Energy
1. The Steps taken or impact on conservation
of energy
The Company has always been conscious of the
need for the Conservation of the Energy & Optimum
utilisation of available resources & has been steadily
making progress towards this end.
Energy Conservation measures have been implemented
at all the Plants and Offices. Company has also
taken special efforts on undertaking Specific Energy
Conservation Projects and achieved high level of saving
through implementation.
During the year March 31, 2017, your Company has taken
a lot of initiatives for reduction in power cost by not only
reducing the consumption through implementation of
new technologies but also by improving the production
processes.
Your Company has undertaken special projects in the
field of Energy Conservation & achieved notable saving
through their implementation.
In pursuit of the continual improvement in Energy
Conservation in generation distribution & consumption
areas, following initiatives have been taken:
a) Introduced High bay LED Lights of 72 Watt as a
replacement of existing 270 watt high bay lights
in various shop floors in EAM plants (73% less
consumption).
b) Replaced the Electrical Heating (Electrical Heaters)
in washing machines in FT & PT Assembly Plants
by Heat Pump (Reverse AC technology) with same
quality output (55% less energy consumption).
c) Productivity improvement & Oven Process
optimization in PT & FT Paint shop resulting in
reduction in Power & PNG Gas Consumption (3.63%
reduction from FY 15-16 figures).
d) Maximum use of low cost Power through Open
Access (daily Power Bidding) to reduce the Power
Cost.
e) Old & damaged Under-Ground Air Line being
replaced with Over-Head to reduce compressed air
losses & thus consumption in a phased manner.
f) In pursuit of the Continual Improvement in Energy
Conservation in the Generation Distribution &
Consumption Areas in continuation from previous
years initiatives, units/ Tractor reduced steadily.
g) Reduction in Power & Natural Gas Consumption.
h) Efficient use of Natural Resources.
i) Reduction in Power Cost
j) Reduction in Manufacturing Cost (Power Cost per
Tractor)
k) Replacement of 250 watt lights with 80 watt LEDs
on shop floor area
l) Timers on Air Conditioners to control ON/OFF time
& Thermostat setting at 24 deg C.
m) Replaced Conventional 250 watt Electric Lamps
with 150 watt LED Lamps.
n) Replaced High Pressure Line Air Compressor With
Energy Saving Variable Speed Compressor.
2. Steps taken by the Company for utilizing
alternate source of energy
a) Renewable Energy Initiative by installation of Roof
Top Solar Plants across various roofs for a combined
capacity of 1040 Kwp
b) Added Turbo Ventilators for natural Air circulation &
Poly Carbonate sheets for natural Lighting
c) Solar Power generation
d) Installed and commissioned PV Solar Power Plant of
149.04 KWP Capacity
Directors’ ReportAnnexure – D to the
CONSERVATION OF ENERGY, TECHNOLOGY ABSORBTION, FOREIGN
EXCHANGE EARNING AND OUTGO
71st Annual Report 2016-17 77
STRATEGIC REPORT GOVERNANCE FINANCIAL STATEMENTS OTHER INFORMATION
3. Capital Investment on Energy Conservation
Equipments
a) B60 Lakhs invested in Energy Efficient Lights
b) B81 Lakhs invested in Heat Pumps
c) B692 Lakhs invested in Solar Project
II) Technology Absorption
1. The efforts made towards technology
absorption
a) New Farmtrac smart series introduced to improve
fuel efficiency or 45 – 50 hp series.
b) Design and development of fuel efficient low cost
engine series <50 hp category.
c) New series of tractors introduced with high power &
fuel efficient engines for enhanced performance (30
hp - 45 hp).
d) Design & development of new high end Tractors
with 90 hp engine for export markets.
e) Design and development of new CRDI engine to
meet the export requirement.
f) Feature & Reliability enhancement in Powertrac
series of tractors to meet the applications needs.
g) Design and development of complete product
range from 37 to 75 hp tractors for export market.
h) New concept of 20 speeds (16F + 4R) extended
to other range of products to meet the new and
emerging agricultural application requirements.
i) Initiated new Projects for special farming needs like
paddy cultivation, intercultural operations, sprayer
applications and loader dozer applications. New
series of higher hp tractors (in 37 – 75 hp) developed
for domestic and export markets.
j) Initiated projects to extend product range in both
the lower and higher hp range from the current
range of tractors. Introduced new looks and features
for making modern tractors.
k) Up-gradation of Design, Development and testing
infrastructure at R&D to develop & absorb new
contemporary technologies in a most cost effective
manner to offer products at a competitive price.
l) Design validation & virtual testing thru predictive
analysis software and load accelerated test rigs.
m) Filing of patents/ design registrations for new and
innovative designs.
n) Enhanced facilities for Noise intensity mapping and
noise source identification to cater coming noise
norms and operator comfort norms.
2. Benefits derived like product improvement,
cost reduction, product development or
import substitution
a) Escorts delivered a series of new products with
enhanced power and performance and made a
better value proposition for customers in exports
markets. This has given more customer coverage for
Escorts products & resulted in to consistent volumes
and market share gain.
b) High end engine series of 90 hp is now being utilized
to make new competitive higher hp tractors for
exports markets. Full range of tractors from 25 – 90
hp would be available for both exports and domestic
markets.
c) New tractors with more nos. speeds transmission
are made for lower hp models and given to market
for increased utility at customer end. Significant
Material cost reduction in tractors through design
optimization and renegotiation.
d) Product cost optimization thru VE/VA.
e) Design & development of new high end tractor
series for future emission norms.
f) High end transmissions to meeting all emerging
application (Agri, Construction Equipment etc).
g) Higher hp tractors with AC cabin and other premium
features.
h) Design & development of future Tractor series.
i) Expanding Product range for global market.
j) Application specific tractor for niche market like row
crop, garden tractor etc.
k) Innovative tractor concepts to improve fuel
efficiency.
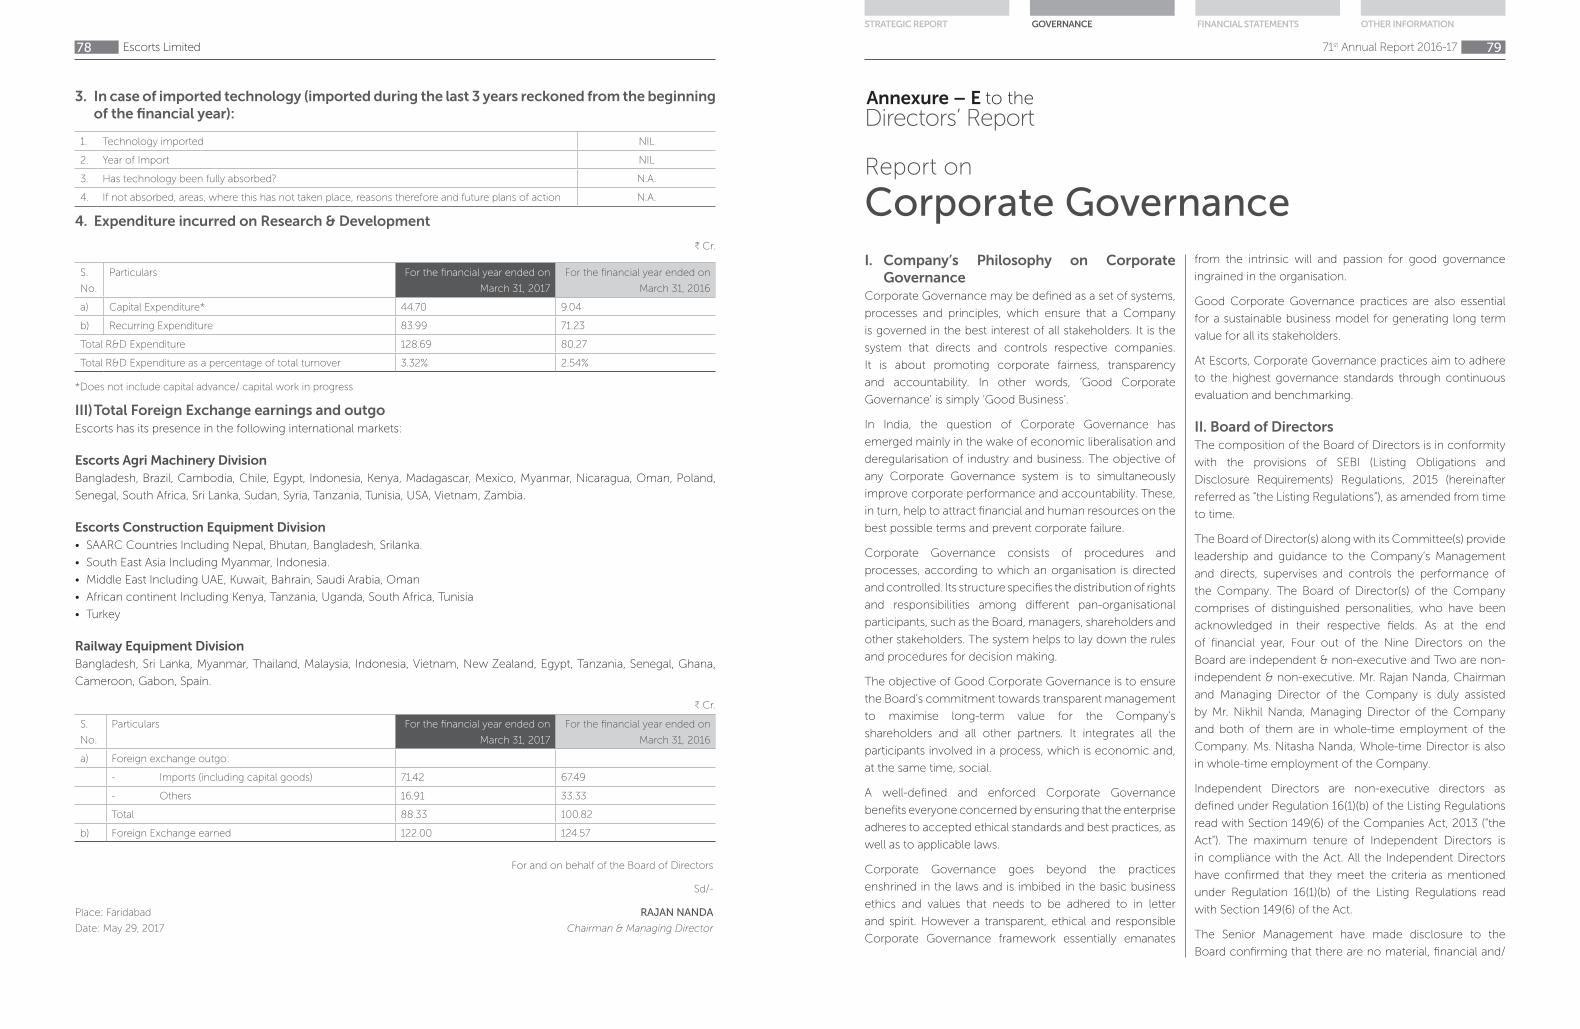
Escorts Limited78
3. In case of imported technology (imported during the last 3 years reckoned from the beginning
of the financial year):
1. Technology imported NIL
2. Year of Import NIL
3. Has technology been fully absorbed? N.A.
4. If not absorbed, areas, where this has not taken place, reasons therefore and future plans of action N.A.
4. Expenditure incurred on Research & Development
B Cr.
S.
No.
Particulars For the financial year ended on
March 31, 2017
For the financial year ended on
March 31, 2016
a) Capital Expenditure* 44.70 9.04
b) Recurring Expenditure 83.99 71.23
Total R&D Expenditure 128.69 80.27
Total R&D Expenditure as a percentage of total turnover 3.32% 2.54%
*Does not include capital advance/ capital work in progress
III) Total Foreign Exchange earnings and outgo
Escorts has its presence in the following international markets:
Escorts Agri Machinery Division
Bangladesh, Brazil, Cambodia, Chile, Egypt, Indonesia, Kenya, Madagascar, Mexico, Myanmar, Nicaragua, Oman, Poland,
Senegal, South Africa, Sri Lanka, Sudan, Syria, Tanzania, Tunisia, USA, Vietnam, Zambia.
Escorts Construction Equipment Division
• SAARC Countries Including Nepal, Bhutan, Bangladesh, Srilanka.
• South East Asia Including Myanmar, Indonesia.
• Middle East Including UAE, Kuwait, Bahrain, Saudi Arabia, Oman
• African continent Including Kenya, Tanzania, Uganda, South Africa, Tunisia
• Turkey
Railway Equipment Division
Bangladesh, Sri Lanka, Myanmar, Thailand, Malaysia, Indonesia, Vietnam, New Zealand, Egypt, Tanzania, Senegal, Ghana,
Cameroon, Gabon, Spain.
B Cr.
S.
No.
Particulars For the financial year ended on
March 31, 2017
For the financial year ended on
March 31, 2016
a) Foreign exchange outgo:
- Imports (including capital goods) 71.42 67.49
- Others 16.91 33.33
Total 88.33 100.82
b) Foreign Exchange earned 122.00 124.57
For and on behalf of the Board of Directors
Sd/-
Place: Faridabad RAJAN NANDA
Date: May 29, 2017 Chairman & Managing Director
71st Annual Report 2016-17 79
STRATEGIC REPORT GOVERNANCE FINANCIAL STATEMENTS OTHER INFORMATION
Directors’ ReportAnnexure – E to the
Report on Corporate Governance
I. Company’s Philosophy on Corporate
Governance
Corporate Governance may be defined as a set of systems,
processes and principles, which ensure that a Company
is governed in the best interest of all stakeholders. It is the
system that directs and controls respective companies.
It is about promoting corporate fairness, transparency
and accountability. In other words, ‘Good Corporate
Governance’ is simply ‘Good Business’.
In India, the question of Corporate Governance has
emerged mainly in the wake of economic liberalisation and
deregularisation of industry and business. The objective of
any Corporate Governance system is to simultaneously
improve corporate performance and accountability. These,
in turn, help to attract financial and human resources on the
best possible terms and prevent corporate failure.
Corporate Governance consists of procedures and
processes, according to which an organisation is directed
and controlled. Its structure specifies the distribution of rights
and responsibilities among different pan-organisational
participants, such as the Board, managers, shareholders and
other stakeholders. The system helps to lay down the rules
and procedures for decision making.
The objective of Good Corporate Governance is to ensure
the Board’s commitment towards transparent management
to maximise long-term value for the Company’s
shareholders and all other partners. It integrates all the
participants involved in a process, which is economic and,
at the same time, social.
A well-defined and enforced Corporate Governance
benefits everyone concerned by ensuring that the enterprise
adheres to accepted ethical standards and best practices, as
well as to applicable laws.
Corporate Governance goes beyond the practices
enshrined in the laws and is imbibed in the basic business
ethics and values that needs to be adhered to in letter
and spirit. However a transparent, ethical and responsible
Corporate Governance framework essentially emanates
from the intrinsic will and passion for good governance
ingrained in the organisation.
Good Corporate Governance practices are also essential
for a sustainable business model for generating long term
value for all its stakeholders.
At Escorts, Corporate Governance practices aim to adhere
to the highest governance standards through continuous
evaluation and benchmarking.
II. Board of Directors
The composition of the Board of Directors is in conformity
with the provisions of SEBI (Listing Obligations and
Disclosure Requirements) Regulations, 2015 (hereinafter
referred as “the Listing Regulations”), as amended from time
to time.
The Board of Director(s) along with its Committee(s) provide
leadership and guidance to the Company’s Management
and directs, supervises and controls the performance of
the Company. The Board of Director(s) of the Company
comprises of distinguished personalities, who have been
acknowledged in their respective fields. As at the end
of financial year, Four out of the Nine Directors on the
Board are independent & non-executive and Two are non-
independent & non-executive. Mr. Rajan Nanda, Chairman
and Managing Director of the Company is duly assisted
by Mr. Nikhil Nanda, Managing Director of the Company
and both of them are in whole-time employment of the
Company. Ms. Nitasha Nanda, Whole-time Director is also
in whole-time employment of the Company.
Independent Directors are non-executive directors as
defined under Regulation 16(1)(b) of the Listing Regulations
read with Section 149(6) of the Companies Act, 2013 (“the
Act”). The maximum tenure of Independent Directors is
in compliance with the Act. All the Independent Directors
have confirmed that they meet the criteria as mentioned
under Regulation 16(1)(b) of the Listing Regulations read
with Section 149(6) of the Act.
The Senior Management have made disclosure to the
Board confirming that there are no material, financial and/

Escorts Limited80
or commercial transactions between them and the Company, which could have potential conflict of interest with the
Company at large.
As on March 31, 2017, the Board comprises of Nine Directors. The names and categories of Directors, the number of
Directorship and Committee position(s) held by them in the companies, meetings attended by them and other relevant
particulars are given below.
Sl.
No
Name Designation Category Relationship with
each other
No. of Board
Meetings
attended
during the
financial
year
Whether
attended
the last
AGM
No. of
directorships
in Public
Companies (#)
No. of
Committee
Memberships
/ (Chairman-
ships) in Public
Companies (^)
1. Mr. Rajan
Nanda
Chairman &
Managing
Director
Executive
and Non-
Independent
(Promoter)
Father of Mr. Nikhil
Nanda and Ms.
Nitasha Nanda
5 Y 2 -
2. Mr. Nikhil
Nanda
Managing
Director
Executive
and Non-
Independent
(Promoter)
Son of Mr. Rajan
Nanda and Brother
of Ms. Nitasha
Nanda
5 Y 2 -
3. Ms. Nitasha
Nanda
Whole-time
Director
Executive
and Non-
Independent
(Promoter)
Daughter of Mr.
Rajan Nanda and
Sister of Mr. Nikhil
Nanda
5 N 5 3(1)
4. Mr.
Hardeep
Singh
Director Non –
Executive
and Non –
Independent
* 5 Y 3 -
5. Mr. P.H.
Ravikumar
Director Non –
Executive
and
Independent
* 5 Y 9 4(1)
6. Mrs. Vibha
Paul Rishi
Director Non –
Executive
and
Independent
* 5 Y 9 4(1)
7. Dr. Sutanu
Behuria
Director Non –
Executive
and
Independent
* 4 Y 4 1(1)
8. Mr. G.B.
Mathur
Director Non-
Executive
and Non
Independent
* 4 Y 4 2
9. Mr. D.J.
Kakalia**
Director Independent
Director
* 3 Y 6 6
10. Dr. S. A.
Dave (&)
Director Non –
Executive
and
Independent
* 2 Y - -
Y = Yes N = No
* None of the Non-Executive Directors are related to any other Director of the Company.
** Appointed as Independent Director w.e.f. May 25, 2016
(#) Including Escorts Limited.
(^) In accordance with Regulation 26, Memberships/ Chairmanships of Audit Committees and Stakeholders’ Relationship Committees in
all Public Limited Companies (excluding Escorts Limited) have been considered.
(&) Resigned from Directorship w.e.f. September 20, 2016
NOTE: 1) None of the Directors represent a Lender or Equity Investor.
2) None of the Non-Executive Directors have substantial shareholding in the Company.
71st Annual Report 2016-17 81
STRATEGIC REPORT GOVERNANCE FINANCIAL STATEMENTS OTHER INFORMATION
III. Directors’ Membership in Board/
Committees of Other Companies
In terms of the provisions of the Listing Regulations, none
of the Directors on the Company’s Board is a member of
more than ten committees and Chairman of more than
five committees (Committees being, Audit Committee
and Stakeholders’ Relationship Committee) across the
companies in which they are associated as Directors. All
the Directors have made necessary disclosures regarding
Committee positions held by them in other companies
and do not hold the office of Director in more than twenty
companies including ten public companies (including 7
listed companies).
IV. Board Meetings
During the financial year ended on March 31, 2017 the Board
of Directors met Five (5) times on the following dates:-
May 25, 2016, July 28, 2016, September 20, 2016, October
27, 2016 and February 9, 2017.
The gap between any two Board Meetings did not exceed
120 days.
Board Meeting Procedures
Escorts Limited’s Board is presented with detailed notes,
along with the agenda papers, well in advance of the
meeting. All material information is incorporated in the
agenda for facilitating meaningful and focused discussions
at the meeting. Where it is not practical to attach any
document to the agenda, the same is tabled before the
meeting with specific reference to this effect in the agenda.
In special and exceptional circumstances, additional or
supplementary items on the agenda are permitted. The
required information as enumerated in Part A of Schedule
II of the Listing Regulations are regularly made available to
the Board of Directors for discussion and consideration at
Board Meetings.
Information supplied to the Board
Regular presentations are made to the Board of Directors
covering Business Operations, Finance, Sales, Accounts,
Marketing, Compliances and other important business
issues.
The Annual Operating and Capital Budget(s) are approved
by the Board of Directors. The Board spends considerable
time in reviewing the actual performance of the Company
vis-à-vis the approved budget.
Code of Conduct
The Company has adopted a Code of Conduct for
Directors and Senior Management of the Company. The
Code has been circulated to all the members of the Board
and Senior Management and the same is also available on
the Company’s website: www.escortsgroup.com.
The Board members and Senior Management personnel
of the Company have affirmed their compliance with the
code. A declaration to this effect signed by the Chairman
and Managing Director of the Company is contained
hereinafter in this Report.
Declaration by C.E.O.
The Board of Directors,
Escorts Limited
Dear Sir,
I hereby confirm that:
The Company has received from the members of the Board
and Senior Management, a declaration of compliance with
the Code of Conduct for Directors and Senior Management
in respect of financial year ended on March 31, 2017.
Sd/-
Place: Faridabad RAJAN NANDA
Date: May 29, 2017 Chairman and Managing Director
Vigil Mechanism
The Company has adopted a Whistle Blower Policy to
report instances of unethical behaviour, fraud or violation
of the Ethics Policy of the Company. The Whistle Blower
Policy has been circulated to all the employees and
directors of the Company and the same is also available on
the Company’s website: www.escortsgroup.com.
V. Audit Committee
Constitution
During the financial year ended on March 31, 2017 the Audit
Committee had been reconstituted post the resignation of
Dr. S. A. Dave from the directorship of the Company. Mrs.
Vibha Paul Rishi was inducted as member of the Committee
on October 27, 2016.
The Audit Committee comprises of the following Non-
Executive Directors:
1. Mr. P. H. Ravikumar – Independent Director (Chairman)
2. Mr. Hardeep Singh – Non-Independent Director
3. Mrs. Vibha Paul Rishi – Independent Director
4. Dr. Sutanu Behuria – Independent Director

Escorts Limited82
All the members of the Audit Committee have accounting,
economic and financial management expertise. The
composition of the Audit Committee is in compliance
with the provisions of Section 177 of the Act and the Listing
Regulations.
The Audit Committee assists the Board in its responsibility to
oversee the quality and integrity of the accounting, auditing
and reporting practices of the Company and its compliance
with the legal and regulatory requirements. The Committee’s
purpose is to oversee the accounting and financial reporting
statements, the appointment, independence, performance
and remuneration of the Statutory Auditors, including the
Cost Auditors and the performance of Internal Auditors of
the Company.
During the financial year ended on March 31, 2017 the
Committee met Five (5) times on the following dates:- May
25, 2016, July 28, 2016, September 20, 2016, October 26,
2016 and February 9, 2017
Mr. Ajay Kumar Sharma, Group General Counsel & Company
Secretary is acting as Secretary of the Audit Committee.
Terms of Reference
The Charter of the Committee is as prescribed under
Section 177 of the Act read with the Listing Regulations:
1. Oversight of the Company’s financial reporting process
and the disclosure of its financial information to ensure
that the financial statement is correct, sufficient and
credible.
2. Recommending to the Board, the appointment,
reappointment and, if required, the replacement or
removal of the statutory auditors and the fixation of
audit fees.
3. Approval of payment to statutory auditors for any other
services rendered by the statutory auditors.
4. Reviewing, with the management, the annual financial
statements and auditor’s report thereon before
submission to the Board for approval, with particular
reference to:
a) Matters required to be included in the Directors’
Responsibility Statement forming part of Board’s
Report in terms of Clause (c) of sub-section 3 of
Section 134 of the Act.
b) Changes, if any, in accounting policies and practices
and reasons for the same.
c) Major accounting entries involving estimates based
on the exercise of judgement by management.
d) Significant adjustments made in the financial
statements arising out of audit findings.
e) Compliance with listing and other legal requirements
relating to financial statements.
f) Disclosure of any related party transactions.
g) Modified opinion(s) in the draft audit report.
5. Reviewing, with the management, the quarterly financial
statements before submission to the Board for approval.
6. Reviewing, with the management, the statement of
uses/ application of funds raised through an issue (public
issue, rights issue, preferential issue, etc.), the statement
of funds utilised for purposes other than those stated in
the offer document/ prospectus/ notice and the report
submitted by the monitoring agency monitoring the
utilisation of proceeds of a public or rights issue, and
making appropriate recommendations to the Board to
take up steps in this matter.
7. Reviewing and monitoring the auditors independence &
performance, and effectiveness of audit process.
8. Approval or any subsequent modification of transactions
of the Company with related parties.
9. Scrutiny of inter-corporate loans and investments.
10. Valuation of undertakings or assets of the Company,
wherever it is necessary.
11. Evaluation of internal financial controls and risk
management systems.
12. Reviewing, with the management, performance of
statutory & internal auditors, adequacy of the internal
control systems.
13. Reviewing the adequacy of internal audit function, if
any, including the structure of internal audit department,
staffing and seniority of the official heading the
department, reporting structure coverage and frequency
of internal audit.
14. Discussion with internal auditors of any significant
findings and follow up thereon.
15. Reviewing the findings of any internal investigations
by the internal auditors into matters where there is
suspected fraud or irregularity or a failure of internal
control systems of a material nature and reporting the
matter to the Board.
71st Annual Report 2016-17 83
STRATEGIC REPORT GOVERNANCE FINANCIAL STATEMENTS OTHER INFORMATION
16. Discussion with statutory auditors before the audit
commences, about the nature and scope of audit as
well as post-audit discussion to ascertain any area of
concern.
17. Investigating the reasons for substantial defaults in
the payment to the depositors, debenture holders,
shareholders (in case of non-payment of declared
dividends) and creditors.
18. To review the functioning of the Whistle Blower
mechanism.
19. Approving the appointment of Chief Financial Officer
(i.e. the Whole-time Finance Head or any other person
heading the finance function or discharging that
function) after assessing the qualifications, experience &
background, etc. of the candidate.
20. Reviewing any changes in the accounting policies or
practices as compared to the last completed financial
year and commenting on any deviation from the
Accounting Standards.
21. Carrying out any other function as may be referred to
the Committee by the Company’s Board of Directors
and/ or other Committees of Directors of the Company
from time to time.
22. Recommending to the Board, the terms of appointment,
re-appointment and, if required, the replacement or
removal of the Cost and the Secretarial Auditors.
23. The Committee has systems and procedures in place to
ensure that the Audit Committee periodically reviews:
a) Management discussion and analysis of financial
condition and results of operations;
b) Statement of significant related party transactions
(as defined by the Audit Committee), submitted by
management;
c) Management letters/ letters of internal control
weaknesses issued by the statutory auditors;
d) Internal audit reports relating to internal control
weaknesses, if any;
e) Appointment, removal and terms of remuneration of
the Chief Internal Auditor, if any;
f The Financial Statements, in particular, the
investments made by the unlisted subsidiaries of the
Company, in view of the requirements under the
Listing Regulations;
g) Details of material transactions with related parties,
which are not in the normal course of business; and
h) Details of material transactions with related parties
or others, if any, which are not on arm’s length basis,
along with management’s justification for the same.
i) Statement of deviations: (a) quarterly statement of
deviation(s) including report of monitoring agency, if
applicable, submitted to stock exchange(s) in terms
of Regulation 32(1). (b) annual statement of funds
utilized for purposes other than those stated in the
offer document/ prospectus/ notice in terms of the
Listing Regulations 32(7).
The Audit Committee is endowed with the following
powers:
a) To investigate any activity within its terms of reference.
b) To seek information from any employee.
c) To obtain outside legal or other professional advice.
d) To secure attendance of outsiders with relevant
expertise, if it considers necessary.
e) To invite such of the executives, as it considers
appropriate (and particularly the head of the finance) to
be present at the meetings of the committee.
Meetings & Attendance
Name of MemberDesignation No. of Meeting
Held Attended
Mr. P.H. Ravikumar Chairman 5 5
Mr. Hardeep Singh Member 5 4
Mrs. Vibha Paul Rishi* Member 5 1
Dr. Sutanu Behuria Member 5 4
Dr. S. A. Dave** Member 5 2
*Inducted as Member of the Committee w.e.f. October
27, 2016 and only one meeting held during her tenure as
member of the Committee.
**Resigned from Directorship w.e.f. September 20, 2016.
The gap between any two Audit Committee meetings did
not exceed 120 days.
VI. Nomination and Remuneration Committee
Constitution
During the financial year ended on March 31, 2017,
the Nomination and Remuneration Committee was
reconstituted on October 27, 2016 post the resignation of
Dr. S. A. Dave from the directorship of the Company.

Escorts Limited84
The Nomination and Remuneration Committee comprises
of following Non-Executive Directors:
1. Mr. P. H. Ravikumar – Independent Director (Chairman)
2. Mr. Hardeep Singh – Non-Independent Director
3. Mrs. Vibha Paul Rishi – Independent Director
4. Dr. Sutanu Behuria – Independent Director
Terms of Reference
The Charter of the Committee is as prescribed under
Section 178 of the Act read with the Listing Regulations viz.:
1. Formulation of the criteria for determining qualifications,
positive attributes and independence of a director
and recommend to the Board a policy, relating to the
remuneration of the directors, key managerial personnel
and other employees;
2. Formulation of criteria for evaluation of Independent
Directors and the Board;
3. Devising a policy on Board diversity;
4. Identifying persons who are qualified to become
directors and who may be appointed in senior
management in accordance with the criteria laid down,
and recommend to the Board their appointment and
removal. The Evaluation Criteria and the Remuneration
Policy shall form part of the Annual Report of the
Company.
The Nomination and Remuneration Committee has been
constituted to recommend/ review remuneration of the
directors, key managerial personal and other employees,
based on their performance and defined assessment
criteria.
The remuneration policy of the Company is directed towards
rewarding performance, based on review of achievements.
It is in consonance with the existing industry practice.
Non-Executive Directors can also be paid a commission
based on the performance of the Company. During the
period under review there are no pecuniary relationships or
material transactions of the Non-Executive Directors viz-a-
viz the Company.
Meetings & Attendance
During the financial year ended on March 31, 2017 the
Committee met Two (2) times on May 25, 2016 and
February 9, 2017.
Name of MemberDesignation No. of Meeting
Held Attended
Mr. P.H. Ravikumar Chairman 2 2
Mr. Hardeep Singh Member 2 2
Mrs. Vibha Paul Rishi* Member 2 1
Dr. Sutanu Behuria Member 2 1
Dr. S. A. Dave** Member 2 1
*Inducted as Member of the Committee w.e.f. October
27, 2016 and only one meeting held during her tenure as
member of the Committee.
**Resigned from Directorship w.e.f. September 20, 2016.
Remuneration Policy
The Company’s remuneration policy for Directors, Key
Managerial Personnel, Senior Management and other
employees is annexed as Annexure - C to the Directors’
Report.
The Company’s remuneration policy is directed towards
rewarding performance based on review of achievements
periodically. The remuneration policy is in consonance with
the existing industry practice.
Details of Remuneration of Directors
The Company has not paid any remuneration to any of its
Non-Executive Directors, except Sitting Fees for attending
meetings of the Board and all its Committees for which
B50,000 per meeting was paid for Board Meeting and Audit
Committee Meeting and B20,000 per meeting was paid for
any other committee meeting. The aggregate amount of
sitting fees paid during the financial year was B28.10 lakhs
(excluding service tax). The director wise payment of sitting
fee is provided in Form MGT-9 attached as Annexure - I to
the Directors’ Report.
The shareholders of the Company has approved the
payment of commission to Non-Executive Directors in the
Annual General Meeting held on September 19, 2014 for
a period of five years. Accordingly, for the financial year
ended on March 31, 2017, Mr. P.H. Ravikumar, Mrs. Vibha
Paul Rishi, Dr. Sutanu Behuria, Mr. D.J. Kakalia and Mr.
Hardeep Singh have been paid commission of B7,50,000/-
(Rupees Seven Lakh Fifty Thousand only) each, aggregating
to B37,50,000/- (Rupees Thirty Seven Lakh Fifty Thousand
only) and the same is within the limits of 1% of the net
profits of the Company calculated under Section 198 of the
Companies Act, 2013.
The remuneration paid/ payable to Mr. Rajan Nanda,
Chairman and Managing Director, Mr. Nikhil Nanda,
71st Annual Report 2016-17 85
STRATEGIC REPORT GOVERNANCE FINANCIAL STATEMENTS OTHER INFORMATION
Managing Director and Ms. Nitasha Nanda, Whole-time Director of the Company for the financial year ended on March 31,
2017 are as follows:
FY 2016-17 (B)
Particulars Mr. Rajan Nanda Mr. Nikhil Nanda Ms. Nitasha Nanda
Basic Salary 1,80,00,000 1,80,00,000 60,00,000
Allowances & Perquisites 2,97,29,599 2,79,84,544 71,95,682
Provident Fund Contribution 21,60,000 21,60,000 7,20,000
Superannuation Allowance 27,00,000 27,00,000 9,00,000
Commission (proposed)* 3,50,00,000 3,50,00,000 1,00,00,000
Total 8,75,89,599 8,58,44,544 2,48,15,682
*Commission paid for the Financial Year 2016-17
The tenure of office of the Chairman and Managing Director, Managing Director and Whole-time Director is for a period of
five years from their respective date of appointment. The services of said Directors with the Company can be terminated
by either party giving six calendar months’ notice in writing. In the event of termination of services, they shall be entitled to
receive compensation in accordance with the provisions of Section 202 of the Act.
No stock options were issued to the directors during the period under report.
VII. Shares held by Non-Executive Directors
Name Category No. of Equity shares held
Mr. P.H. Ravikumar Independent -
Mrs. Vibha Paul Rishi Independent -
Dr. Sutanu Behuria Independent -
Mr. D.J. Kakalia Independent -
Mr. Hardeep Singh Non-Independent 1,000
Mr. G.B. Mathur Non-Independent 1,679
VIII. Stakeholders’ Relationship Committee
Constitution
During the financial year ended on March 31, 2017,
the Stakeholders’ Relationship Committee had been
reconstituted post the resignation of Dr. S.A. Dave from
the directorship of the Company. Mrs. Vibha Paul Rishi was
inducting as member of the Committee on October 27,
2016.
The Stakeholders’ Relationship Committee comprises of
following Non-Executive Directors:-
1. Mr. Hardeep Singh – Non-Independent Director –
Chairman
2. Mrs. Vibha Paul Rishi – Independent Director
3. Dr. Sutanu Behuria – Independent Director
Terms of Reference
The Committee looks to redress shareholders and investors
complaints relating to share transfer, Demat, Remat, non-
receipt of declared dividends or Annual Reports etc.
The Committee additionally oversees the performance
of Share Transfer Agent and recommends measures for
overall improvement in the quality and promptness towards
investors services.
Meetings & Attendance
During the financial year ended on March 31, 2017, the
Committee met on February 9, 2017.
Name of the
MemberDesignation
No. of Meeting
Held Attended
Mr. Hardeep Singh Chairman 1 1
Mrs. Vibha Paul
Rishi*
Member 1 -
Dr. Sutanu Behuria Member 1 1
Dr. S. A. Dave ** Member 1 N.A.
*Inducted as Member of the Committee w.e.f. October 27,
2016
**Resigned from Directorship w.e.f. September 20, 2016.

Escorts Limited86
Compliance Officer
Mr. Ajay Kumar Sharma, Group General Counsel & Company
Secretary is the Compliance Officer as per the requirements
of the Listing Regulations.
Complaints received/ resolved
During the period under review, 187 complaints were
received from investors which were replied/ resolved to the
satisfaction of investors except 5 complaints pending as on
31.03.2017 which were replied/ resolved subsequently.
Pending Share Transfers
No requests for transfer and/ or dematerialisation were
pending for redressal as on March 31, 2017.
IX. Risk Management Committee
Constitution
The Risk Management Committee comprises of following
persons:-
1. Mr. Rajan Nanda – Chairman
2. Mr. Nikhil Nanda – Member
3. Dr. Sutanu Behuria – Member
4. Mr. Bharat Madan – Member
Terms of Reference
The charter of the Committee shall be as follows:
(i) Formulation & modification of the Risk Management
Policy.
(ii) Framing, implementing and monitoring the Risk
Management Plan.
(iii) Periodic reporting to the Audit Committee on the risk
and its mitigation.
(iv) Others functions in accordance with the applicable
provisions of the Act read with rules made thereunder
and the Listing Regulations.
Meetings & Attendance
During the financial year ended on March 31, 2017, the
Committee met on May 25, 2016.
Name of the
MembersDesignation
No. of Meeting
Held Attended
Mr. Rajan Nanda Chairman 1 1
Mr. Nikhil Nanda Member 1 1
Dr. Sutanu Behuria Member 1 -
Mr. Bharat Madan Member 1 1
Corporate Social Responsibility
Constitution
The Corporate Social Responsibility (CSR) Committee
comprises of following persons:
1. Mr. Rajan Nanda - Chairman
2. Mr. Nikhil Nanda - Member
3. Mr. Hardeep Singh - Member
4. Mrs. Vibha Paul Rishi - Member
5. Mr. G.B. Mathur - Member
Terms of Reference
The said committee has been entrusted with the responsibility
of formulating and recommending to the Board, CSR Policy
indicating the activities to be undertaken by the Company,
monitoring the implementation of the framework of CSR
Policy and recommending the amount to be spent on CSR
activities.
Meetings & Attendance
During the financial year ended on March 31, 2017, the
Committee met on May 25, 2016.
Name of the Members DesignationNo. of Meeting
Held Attended
Mr. Rajan Nanda Chairman 1 1
Mr. Nikhil Nanda Member 1 1
Mr. Hardeep Singh Member 1 1
Mrs. Vibha Paul Rishi Member 1 1
Mr. G.B. Mathur Member 1 1
X. Functional Committee
The Board is authorised to constitute one or more functional
committees delegating thereto powers and duties with
respect to specific purposes for which such committee has
been constituted. Meeting of such committees are held, as
and when the need arises. Time schedule for holding such
functional committees are finalised in consultation with the
Committee members.
Procedure of Committee Meetings
The Company’s guidelines relating to Board Meetings
are applicable to Committee Meetings, as far as may be
practicable. Each Committee has the authority to engage
outside experts, advisors and counsels, to the extent it
considers appropriate, to assist in its work. Minutes of the
proceedings of the Committee Meetings are placed before
the next Committee and the subsequent Board Meeting for
perusal and noting.
71st Annual Report 2016-17 87
STRATEGIC REPORT GOVERNANCE FINANCIAL STATEMENTS OTHER INFORMATION
XI. General Body Meetings
The particulars of last three Annual General Meeting(s) held by the Company are as under:
Financial Year/
Financial Period
Date Time Venue No. of Special
Resolutions Passed at
AGM
2015-16 September 20, 2016 11.00A.M Aravali Golf Club, NH-3,
N.I.T. Faridabad – 121 001 Haryana
NIL
2014-15 September 18, 2015 12.00 Noon Hotel KC Cross Road, Site No. 1, Sector – 10,
Opp. Bus Stand, Panchkula – 134 113 Haryana
One
2012-14 September 19, 2014 12.00 Noon Hotel KC Cross Road, Site No. 1, Sector – 10,
Opp. Bus Stand, Panchkula – 134 113 Haryana
Six
XII. Special Resolution passed through Postal
Ballot
During the financial year ended on March 31, 2017, the
Company has not passed any Special Resolution through
Postal Ballot.
None of the business proposed to be transacted in the
ensuing Annual General Meeting require passing a special
resolution through Postal Ballot.
XIII. Disclosures
a) There are no materially significant related party
transactions of the Company which have potential
conflict with the interest of the Company at large.
All the related party transactions during the financial
year ended on March 31, 2017 were as per the “Policy
on Materiality of Related Party Transactions and dealing
with Related Parties”.
b) Details of non-compliance by the Company, penalties,
strictures imposed on the Company by Stock Exchanges
or SEBI or any Statutory Authority, on any matter related
to capital markets, during the last three years – NIL
c) Whistle Blower Policy and affirmation that no personnel
has been denied access to the Audit Committee.
The Ethics Counselor or the Chairman of the Audit
Committee has not received any complaint/ report
during the period under review and no employee was
denied access to the Audit Committee.
d) Details of the compliance with mandatory requirement
and adoption of the discretionary requirements as
prescribed in Schedule II Part E of the Listing Regulations.
The details of mandatory requirements are mentioned in
this Report. The status of adoption of the non-mandatory
requirement are mentioned in Clause No. XVI.
e) Policy for determining ‘Material Subsidiaries’
The Policy for determining Material Subsidiaries is
available on the website of the Company www.
escortsgroup.com under Investor Information Section.
f) Policy on dealing with Related Party Transactions
The Policy on dealing with Related Party Transactions
is available on the website of the Company www.
escortsgroup.com under Investor Information Section.
g) The Company has complied with all the compliances
given under Regulation 17 to 27 and Regulation 46(2)(b)
to 46(2)(i) of the Listing Regulations.
h) Disclosure with respect to Demat Suspense Account/
Unclaimed Suspense Account: Nil
i) Disclosure(s) relating to the full particulars of the Cost
Auditor along with other details, pursuant to the General
Circular No. 15/2011 dated April 11, 2011 issued by the
Ministry of Corporate Affairs.
Pursuant to the approval of the Central Government
under Section 233B of the Companies Act, 1956, the
Company had appointed M/s. Ramanath Iyer & Co.,
Cost Accountants as Cost Auditor of the Company.
Further, the due date of filing the Cost Audit Report for
the previous year was September 30, 2016 and the same
had been filed on September 28, 2016.
Subsidiary Companies
Regulation 16 of the Listing Regulations “Material Subsidiary”
shall mean a subsidiary, whose income or net worth
exceeds twenty percent of the consolidated income or net
worth respectively, of the listed entity and its subsidiaries in
the immediately preceding accounting year. Escorts Limited
has 4 direct subsidiaries, 1 of them is registered outside India
and 3 are in India, whose turnover does not exceed the

Escorts Limited88
limit prescribed under the Listing Regulations. Thus, these
subsidiaries are out of the scope of the above definition.
Since, the Company does not have any material subsidiary, it
is not required to nominate an Independent Director of the
Company on their Board.
Appropriate details of these subsidiaries has been given
elsewhwere in the Annual Report and forms an integral part
of this report.
XIV. MEANS OF COMMUNICATION
Key Financial Reporting dated during the year ended on
March 31, 2017
The Company has published its Financial results in the
following national newspapers:
For Year ended 31.03.16: Economic Times (English), Mint
(English), Rashtriya Sahara (Hindi).
For Quarter ended 30.06.16: Economic Times (English),
Mint (English), Rashtriya Sahara (Hindi).
For Quarter ended 30.09.16: Economic Times (English),
Mint (English), Rashtriya Sahara (Hindi).
For Quarter ended 31.12.16: Economic Times (English), Mint
(English), Rashtriya Sahara (Hindi).
The Quarterly Results were displayed on Company’s
website viz. www.escortsgroup.com in accordance with the
requirement of the Listing Regulations.
The website also displays official news releases.
News Releases, Presentation
Official news releases, detailed presentations made to
media, analysts, institutional investors etc. are displayed on
the Company’s website i.e. www.escortsgroup.com.
Management Discussion and Analysis Report
The Management Discussion and Analysis Report and Risk
Management Process Highlights forms an integral part of
this Annual Report.
XV. General Shareholder Information
Company Registration Details
The Company is registered in the State of Haryana, India.
The Corporate Identity Number (CIN) allotted to the
Company by the Ministry of Corporate Affairs (MCA) is
L74899HR1944PLC039088.
Annual General Meeting (AGM)
Date : Thursday, September 21, 2017
Time : 11:00 a.m.
Venue : Aravali Golf Club, NH-3, N.I.T., Faridabad - 121 001,
Haryana
Financial Year:
April 1 to March 31
Appointment/ Re-appointment of Directors
In accordance with the provisions of the Act and Articles of
Association of the Company, Ms. Nitasha Nanda and Mr. G.B.
Mathur, Directors retires by rotation at the ensuing Annual
General Meeting of your Company and being eligible, offer
themselves for re-appointment.
The brief resume(s) and other details relating to the
Director(s) who are proposed to be appointed/ re-appointed,
as required to be disclosed under the Listing Regulations are
provided as Annexure to the AGM Notice.
Financial Calendar 2017-18 (Tentative)
Meetings of Board/ Committee thereof to take on record:
Particulars Tentative date
Financial results for Quarter ended 30.06.2017 14.08.2017
Financial results for Quarter ended 30.09.2017 14.11.2017
Financial results for Quarter ended 31.12.2017 14.02.2018
Financial results for Quarter/ Year ended
31.03.2018
30.05.2018
Annual General Meeting for the Financial Year
ending March, 2018
By September 30, 2018.
Cut off Date for e-voting
September 14, 2017 has been fixed as the cut off date to
record entitlement of the shareholder to cast their vote
electronically in the forthcoming AGM.
Book Closure
The members register will be closed from September 9, 2017
to September 21, 2017 (both days inclusive) for the purpose
of payment of Dividend for the financial year 2016-17.
Dividend
1. The Board of Directors of the Company have decided
to recommend dividend @ B1.50 per share (being 15% of
the nominal value of B10 per share) for the financial year
2016-17, subject to the approval of the shareholders in
the forthcoming AGM.
71st Annual Report 2016-17 89
STRATEGIC REPORT GOVERNANCE FINANCIAL STATEMENTS OTHER INFORMATION
2. The dividend, if declared at the AGM, would be paid/
dispatched within 30 days from the date of declaration
at the ensuing AGM to those persons or their mandates:-
a) whose names appear as beneficial owners as at the
end of the business hours on September 8, 2017
in the list of beneficial owners to be furnished by
National Securities Depository Limited and Central
Depository Services (India) Limited in respect of the
shares held in electronic mode and;
b) whose names appear as Members in the Register
of Members of the Company after giving effect to
valid share transfers in physical form lodged with the
Company on or before September 8, 2017.
3. The dividend amount shall be credited in the shareholders
bank account directly through NECS. Alternatively
physical warrant/ Demand Draft shall be posted to the
shareholders at their registered address available with
the Depository/ Company.
The intimation for credit of dividend amount through NECS
shall also be sent to the shareholders through E-mail/
ordinary post thereafter.
Listing Fees
The Company is upto date on the payment of its Annual Listing
Fees.
Dividend Payment History for Nine Years
Year Rate Date of Payment
2008-2009 10% March 23, 2010
2009-2010 15% March 10, 2011
2010-2011 15% March 27, 2012
2011-2012 12% March 30, 2013
2012-2014 12% (Interim) October 21, 2013
2012-2014 6% (Final) September 29, 2014
2014-2015 12% September 28, 2015
2015-2016 12% September 29, 2016
2016-2017 15% (Proposed) To be paid within 30 days
from the date of declaration of
Dividend
Listing
Equity Shares of Escorts Limited are listed with following
Stock Exchanges:
Listing Stock Code
National Stock Exchange of India Ltd.
Exchange Plaza, Plot No. C/1, G Block,
Bandra-Kurla Complex, Bandra East, Mumbai
– 400 051
ESCORTS
BSE Limited
Phiroze Jeejeebhoy Towers, Dalal Street,
Mumbai - 400 001
500495
Delhi Stock Exchange Limited
DSE House, 3/1, Asaf Ali Road, New Delhi –
110 002
00012
Monthly Stock Market Data
MonthNational Stock Exchange of India Limited BSE Limited
High (B) Low (B) High (B) Low (B)
April, 2016 175.85 137.70 176.00 137.90
May, 2016 181.70 162.60 181.65 163.00
June, 2016 225.50 168.20 225.70 168.35
July, 2016 269.70 214.00 269.50 214.20
August, 2016 334.90 255.50 334.70 255.20
September, 2016 392.70 325.05 393.00 325.50
October, 2016 414.40 368.05 414.20 368.70
November, 2016 390.80 270.00 390.95 270.00
December, 2016 331.00 277.05 331.35 277.50
January, 2017 375.90 293.50 375.70 294.00
February, 2017 463.45 361.20 463.95 361.70
March, 2017 549.00 445.55 548.55 446.00

Escorts Limited90
Share Transfer SystemEscorts Limited has appointed Karvy Computershare Private Limited (“Karvy”) as its Registrar and Share Transfer Agent (RTA). The share
transfer work in both physical as well as electronic mode has been carried on by Karvy. The authority relating to share transfer has
been delegated to RTA. The Share Transfer Committee of the Board of Directors take note of the Transfer, Transmission, Remat, Split &
Consolidation of share certificates etc. periodically.
The RTA ensures the approval of share transfer/ transmission/ spliting and consolidation of valid request with in a period of 15 days from
their receipt and also processing of valid Demat request within a week.
Investors Relation Centers
Escorts Limited Escorts Limited Escorts Limited Karvy Computershare Private
Limited
Escorts Corporate Centre,
15/5, Mathura Road,
Faridabad – 121 003
Telephone No.: (0129) 2564921
Fax No.: (0129) 2250060
P Block, 2/90, Ist Floor, Op-
posite PVR Rivoli, Connaught
Circus,
New Delhi – 110 001
Telephone No.: (011) 43587400
Times Square A Wing,
Unit No. 1, 3rd Floor, Andheri –
Kurla Road,
Andheri (East), Mumbai – 400
059
Telephone No.: (022) 67868607
Fax No.: (022) 67868687
Karvy Selenium Tower B, Plot
31-32, Gachibowli,
Financial District, Nanakramgu-
da, Hyderabad – 500 032
Telephone No.: (040) 67162222
Fax No.: (040) 23420814
Email: [email protected]
Investors CommunicationAll enquiries relating to transfer, transmission, transposition, demat, remat, split, consolidation, nomination, change of
address and payment of dividend can be addressed to RTA i.e. Karvy Computershare Private Limited or e-mail: einward.ris@
karvy.com or sent by post at Karvy Selenium Tower B, Plot 31-32, Gachibowli, Financial District, Nanakramguda, Hyderabad
– 500 032.
Nomination FacilityShareholders can file their nominations against shares held under physical mode as well as electronic mode. The facility
of nomination is not available to non-individual shareholders such as societies, trusts, bodies corporate, karta of Hindu
Undivided families and holders of Powers of Attorney. The shareholders, who are holding shares in physical form and wish
to avail this facility, may send prescribed Nomination Form SH-13 duly filled and signed to RTA i.e. Karvy Computershare
Private Limited or email [email protected] or sent by post at Karvy Selenium Tower B, Plot 31-32, Gachibowli, Financial
District, Nanakramguda, Hyderabad – 500 032.
Shareholding Pattern as on March 31, 2017
Category of Shareholders No. of Shareholders No. of Shares Held % to the Capital
1. Promoters and Promoter Group 28 52678738 42.98
2. Foreign Institutional Investors 120 20189496 16.47
3. Domestic Institutional Investors, Banks & Mutual Funds 65 4684535 3.82
4. Public & Others 89335 45024109 36.73
Total 89548 122576878 100.00
Distribution of Shareholding as on March 31, 2017
Range of Holding No. of Shareholders % of Total
1 to 5000 82377 91.99
5001 to 10,000 3814 4.26
10,001 to 20,000 1692 1.89
20,001 to 30,000 540 0.60
30,001 to 40,000 241 0.27
40,001 to 50,000 209 0.23
50,001 to 1,00,000 316 0.35
1,00,001 & Above 359 0.41
Total 89548 100
71st Annual Report 2016-17 91
STRATEGIC REPORT GOVERNANCE FINANCIAL STATEMENTS OTHER INFORMATION
Dematerialisation
As on March 31, 2017 dematerialised shares accounted for 98.28% (98.24% up to March 31, 2016) of the total equity shares.
Trading in Equity Shares of the Company is permitted only in dematerialised form as per the notification issued by the
Securities and Exchange Board of India.
S.
No.
Mode of holding No. of shares %
1 NSDL 113581070 92.66
2 CDSL 6886601 5.62
3 Physical 2109207 1.72
Total 122576878 100.00
Shares Liquidity
The trading volumes at major Stock Exchanges, during the financial year ended on March 31, 2017 are as follows:
MonthNational Stock Exchange of India Limited BSE Limited
No. of Shares Value (B In Lakhs) No. of Shares Value (B In Lakhs)
April, 2016 22694430 36512.34 4784132 7695.71
May, 2016 20939823 36482.32 4267645 7427.10
June, 2016 65253119 131888.04 12765864 25901.67
July, 2016 41287823 99615.51 9203344 22143.28
August, 2016 60731835 183968.94 14102915 42776.23
September,2016 48345083 175251.12 10645534 38514.22
October, 2016 31206912 123440.53 7039141 27784.01
November. 2016 25907414 86330.54 6224349 20486.94
December, 2016 15418035 47484.34 2955803 9127.40
January, 2017 24543387 85090.10 5539350 19150.11
February, 2017 33182331 135064.49 6895086 28126.91
March, 2017 32903633 165180.00 6918394 34653.64
Total 422413825 1306308.27 91341557 283787.22
Outstanding GDRs/ ADRs/ Warrants/ Stock Options etc.
There are no outstanding GDRs/ ADRs/ Warrants for conversion into equity shares except 27,100 stock options granted to
the employees. Each stock option, upon exercise of the same, would be converted into one equity share of B10/- each fully
paid-up. These options vest in three tranches after one year from date of grant as mentioned in the Letter of Grant and can
be exercised during a period of two years or such extended period as the ESOP & Compensation Committee may decide
from the date of grant. The options unexercised during the exercise period would lapse.
There are no other convertible instruments outstanding, which could increase the paid up equity capital of the Company.
Plant locations
The Company has its manufacturing plants at the following locations:
1. Plot No. 18/4, Mathura Road, Faridabad - 121 007, Haryana
2. Plot No. 2, Sector 13, Faridabad - 121 007, Haryana
3. Plot No. 3, Sector 13, Faridabad - 121 007, Haryana
4. Plot No. 114-115, Sector 24, Faridabad - 121 003, Haryana
5. Plot No. 219, Sector – 58, Ballabhgarh, Faridabad – 121 004, Haryana
6. Plot No. 9, Sector 1, Integrated Industrial Estate, Pant Nagar, Rudrapur – 263 145, Uttrakhand

Escorts Limited92
Address for Correspondence
ESCORTS LIMITED
Registered Office
Corporate Secretarial & Law
15/5, Mathura Road, Faridabad – 121 003, Haryana
Tel.: 0129 – 2250222, Extension: 4275/ 4254
Fax: 0129 – 2250060
E-mail: [email protected]
Website: www.escortsgroup.com
Registrar and Transfer Agents
KARVY COMPUTERSHARE PRIVATE LIMITED
Karvy Selenium Tower B, Plot No. 31-32, Gachibowli,
Financial District, Nanakramguda, Hyderabad – 500 032
Tel.: 040 - 67162222 | Fax: 040 - 23420814
E-mail: [email protected] | Website: www.karvycomputershare.com
XVI. NON-MANDATORY REQUIREMENTS
The status/ extent of compliance with non mandatory requirements are as follows:
S. No. Non Mandatory Provisions Status
1. Maintenance of Non-Executive Chairman’s Office Not applicable as Chairman is Executive and also the
Managing Director of the Company.
2 Shareholders’ rights: Half-yearly financial performance
and summary of significant events may be sent to each
household of shareholders.
The said information is available on Company’s website.
3 Audit qualifications: The Company may move towards the
regime of unqualified financial statements.
Adopted
4 Separate Posts of Chairman and CEO Not applicable as Chairman and Managing Director is one.
5. Reporting of Internal Auditor The Internal Auditors reports to the Audit Committee from
time to time.
For and on behalf of the Board of Directors
Sd/-
Place: Faridabad RAJAN NANDA
Date: May 29, 2017 Chairman & Managing Director
71st Annual Report 2016-17 93
STRATEGIC REPORT GOVERNANCE FINANCIAL STATEMENTS OTHER INFORMATION
The Chairman and Managing Director and the Group Chief
Financial Officer of the Company give annual certification
to the Board on financial reporting and internal controls in
terms of Regulation 17 of the SEBI (Listing Obligation and
Disclosure Requirements) Regulations, 2015 pertaining to
CEO and CFO certification for the financial year ended on
March 31, 2017.
To,
The Board of Directors
Escorts Limited
Dear Sir,
We, Rajan Nanda, Chairman and Managing Director and
Bharat Madan, Group Chief Financial Officer certify to the
Board of Directors that:
a) We have reviewed financial statements and the cash
flow statement of Escorts Limited for the financial year
ended March 31, 2017 and to the best of our knowledge
and belief:
i these statements do not contain any materially
untrue statement or omit any material fact or contain
statements that might be misleading;
ii. these statements together present a true and fair
view of the Company’s affairs and are in compliance
with existing accounting standards, applicable laws
and regulations.
b) There are, to the best of our knowledge and belief, no
transactions entered into by the Company during the
financial year which are fraudulent, illegal or violative of
the Company’s Code of Conduct.
c) We accept responsibility for establishing and maintaining
internal controls for financial reporting and we have
evaluated the effectiveness of Company’s internal
control systems pertaining to financial reporting and we
have disclosed to the Auditors and the Audit Committee,
deficiencies in the design or operation of such internal
controls, if any, of which we are aware and the steps
we have taken or propose to take to rectify these
deficiencies.
d) We have indicated to the Auditors and the Audit
Committee:
i. significant changes in internal control over financial
reporting during the financial year;
ii. significant changes in accounting policies during the
financial year and that the same have been disclosed
in the notes to the financial statements; and
iii. instances of significant fraud of which we have
become aware and the involvement therein, if
any, of the management or an employee having a
significant role in the Company’s internal control
system over financial reporting.
Sd/- Sd/-
Place : Faridabad Bharat Madan Rajan Nanda
Date : May 29, 2017 Group Chief Financial Officer Chairman & Managing Director
CEO/CFO Certification
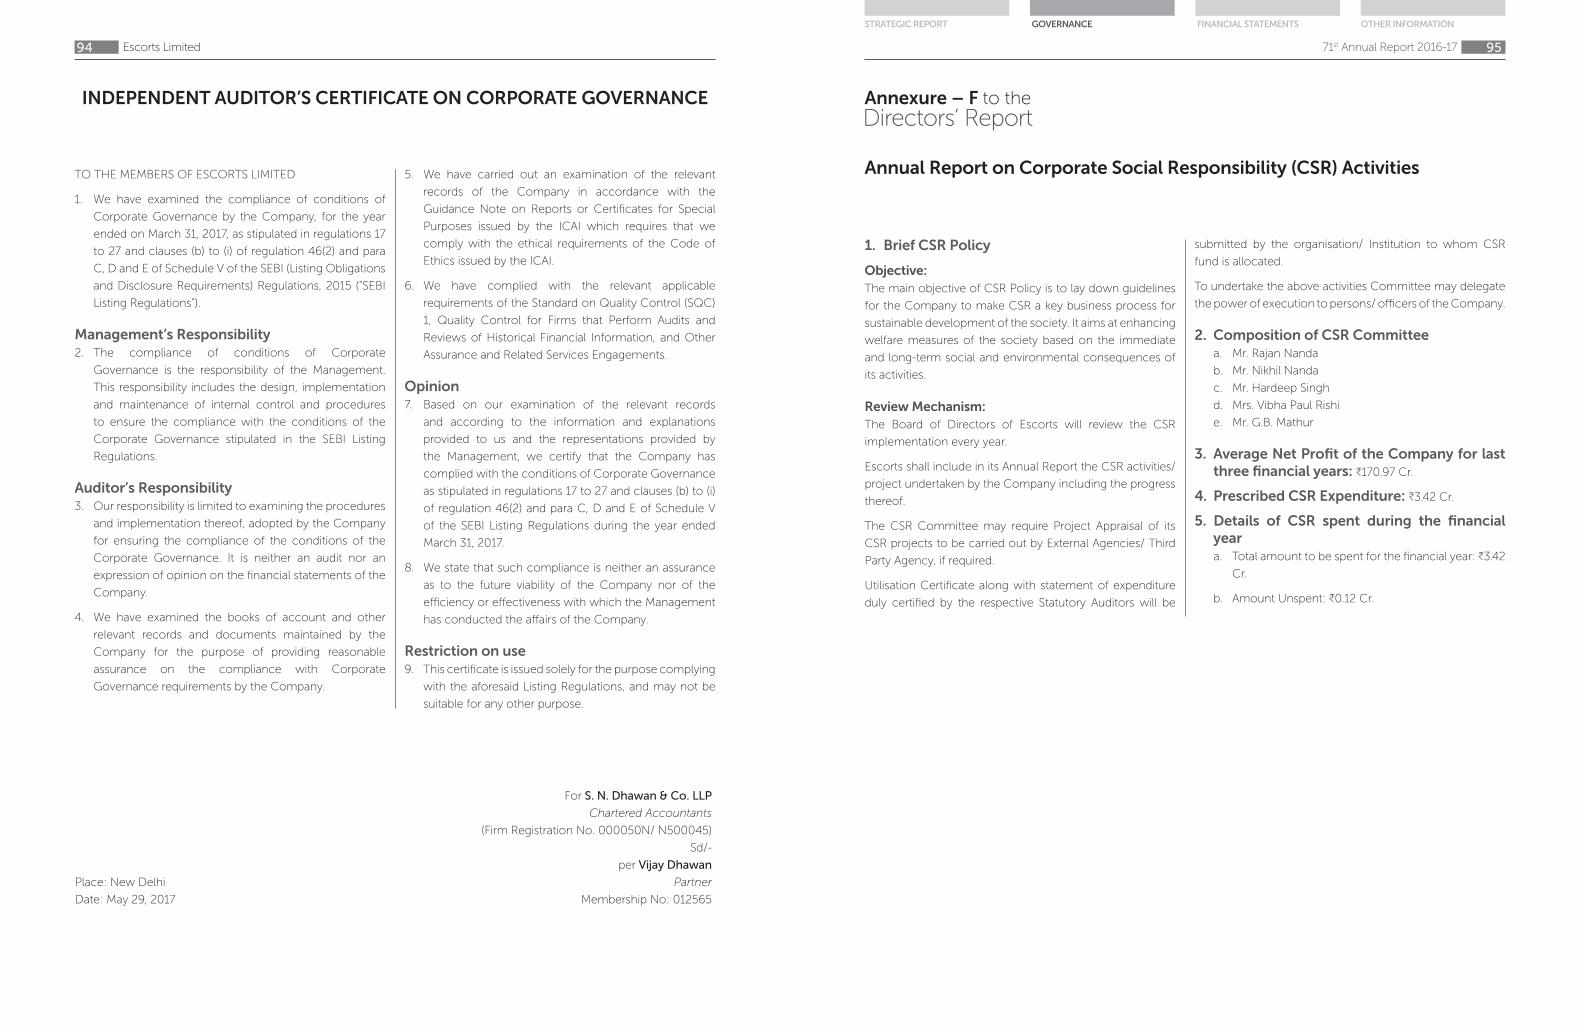
Escorts Limited94
TO THE MEMBERS OF ESCORTS LIMITED
1. We have examined the compliance of conditions of
Corporate Governance by the Company, for the year
ended on March 31, 2017, as stipulated in regulations 17
to 27 and clauses (b) to (i) of regulation 46(2) and para
C, D and E of Schedule V of the SEBI (Listing Obligations
and Disclosure Requirements) Regulations, 2015 (”SEBI
Listing Regulations”).
Management’s Responsibility
2. The compliance of conditions of Corporate
Governance is the responsibility of the Management.
This responsibility includes the design, implementation
and maintenance of internal control and procedures
to ensure the compliance with the conditions of the
Corporate Governance stipulated in the SEBI Listing
Regulations.
Auditor’s Responsibility
3. Our responsibility is limited to examining the procedures
and implementation thereof, adopted by the Company
for ensuring the compliance of the conditions of the
Corporate Governance. It is neither an audit nor an
expression of opinion on the financial statements of the
Company.
4. We have examined the books of account and other
relevant records and documents maintained by the
Company for the purpose of providing reasonable
assurance on the compliance with Corporate
Governance requirements by the Company.
5. We have carried out an examination of the relevant
records of the Company in accordance with the
Guidance Note on Reports or Certificates for Special
Purposes issued by the ICAI which requires that we
comply with the ethical requirements of the Code of
Ethics issued by the ICAI.
6. We have complied with the relevant applicable
requirements of the Standard on Quality Control (SQC)
1, Quality Control for Firms that Perform Audits and
Reviews of Historical Financial Information, and Other
Assurance and Related Services Engagements.
Opinion
7. Based on our examination of the relevant records
and according to the information and explanations
provided to us and the representations provided by
the Management, we certify that the Company has
complied with the conditions of Corporate Governance
as stipulated in regulations 17 to 27 and clauses (b) to (i)
of regulation 46(2) and para C, D and E of Schedule V
of the SEBI Listing Regulations during the year ended
March 31, 2017.
8. We state that such compliance is neither an assurance
as to the future viability of the Company nor of the
efficiency or effectiveness with which the Management
has conducted the affairs of the Company.
Restriction on use
9. This certificate is issued solely for the purpose complying
with the aforesaid Listing Regulations, and may not be
suitable for any other purpose.
For S. N. Dhawan & Co. LLP
Chartered Accountants
(Firm Registration No. 000050N/ N500045)
Sd/-
per Vijay Dhawan
Place: New Delhi Partner
Date: May 29, 2017 Membership No: 012565
INDEPENDENT AUDITOR’S CERTIFICATE ON CORPORATE GOVERNANCE
71st Annual Report 2016-17 95
STRATEGIC REPORT GOVERNANCE FINANCIAL STATEMENTS OTHER INFORMATION
1. Brief CSR Policy
Objective:
The main objective of CSR Policy is to lay down guidelines
for the Company to make CSR a key business process for
sustainable development of the society. It aims at enhancing
welfare measures of the society based on the immediate
and long-term social and environmental consequences of
its activities.
Review Mechanism:
The Board of Directors of Escorts will review the CSR
implementation every year.
Escorts shall include in its Annual Report the CSR activities/
project undertaken by the Company including the progress
thereof.
The CSR Committee may require Project Appraisal of its
CSR projects to be carried out by External Agencies/ Third
Party Agency, if required.
Utilisation Certificate along with statement of expenditure
duly certified by the respective Statutory Auditors will be
submitted by the organisation/ Institution to whom CSR
fund is allocated.
To undertake the above activities Committee may delegate
the power of execution to persons/ officers of the Company.
2. Composition of CSR Committee
a. Mr. Rajan Nanda
b. Mr. Nikhil Nanda
c. Mr. Hardeep Singh
d. Mrs. Vibha Paul Rishi
e. Mr. G.B. Mathur
3. Average Net Profit of the Company for last
three financial years: B170.97 Cr.
4. Prescribed CSR Expenditure: B3.42 Cr.
5. Details of CSR spent during the financial
year
a. Total amount to be spent for the financial year: B3.42
Cr.
b. Amount Unspent: B0.12 Cr.
Directors’ ReportAnnexure – F to the
Annual Report on Corporate Social Responsibility (CSR) Activities
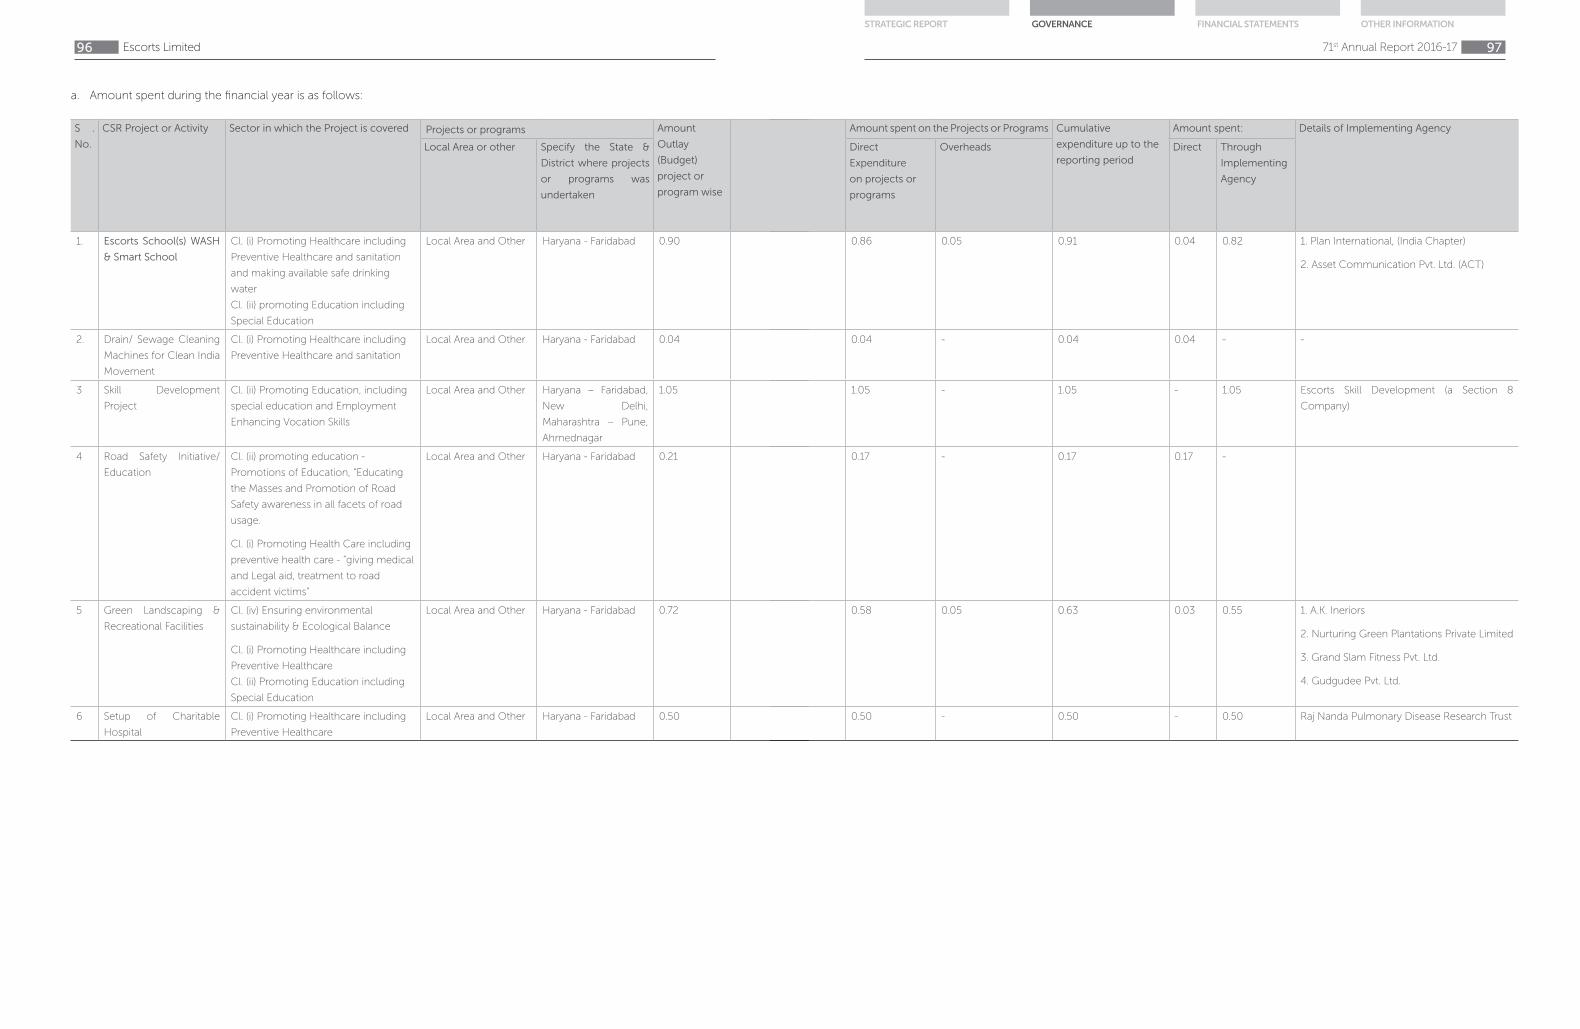
Escorts Limited96
a. Amount spent during the financial year is as follows:
S .
No.
CSR Project or Activity Sector in which the Project is covered Projects or programs Amount
Outlay
(Budget)
project or
program wise
Local Area or other Specify the State &
District where projects
or programs was
undertaken
1. Escorts School(s) WASH
& Smart School
Cl. (i) Promoting Healthcare including
Preventive Healthcare and sanitation
and making available safe drinking
water
Cl. (ii) promoting Education including
Special Education
Local Area and Other Haryana - Faridabad 0.90
2. Drain/ Sewage Cleaning
Machines for Clean India
Movement
Cl. (i) Promoting Healthcare including
Preventive Healthcare and sanitation
Local Area and Other Haryana - Faridabad 0.04
3 Skill Development
Project
Cl. (ii) Promoting Education, including
special education and Employment
Enhancing Vocation Skills
Local Area and Other Haryana – Faridabad,
New Delhi,
Maharashtra – Pune,
Ahmednagar
1.05
4 Road Safety Initiative/
Education
Cl. (ii) promoting education -
Promotions of Education, “Educating
the Masses and Promotion of Road
Safety awareness in all facets of road
usage.
Cl. (i) Promoting Health Care including
preventive health care - “giving medical
and Legal aid, treatment to road
accident victims”
Local Area and Other Haryana - Faridabad 0.21
5 Green Landscaping &
Recreational Facilities
Cl. (iv) Ensuring environmental
sustainability & Ecological Balance
Cl. (i) Promoting Healthcare including
Preventive Healthcare
Cl. (ii) Promoting Education including
Special Education
Local Area and Other Haryana - Faridabad 0.72
6 Setup of Charitable
Hospital
Cl. (i) Promoting Healthcare including
Preventive Healthcare
Local Area and Other Haryana - Faridabad 0.50
71st Annual Report 2016-17 97
STRATEGIC REPORT GOVERNANCE FINANCIAL STATEMENTS OTHER INFORMATION
Amount spent on the Projects or Programs Cumulative
expenditure up to the
reporting period
Amount spent: Details of Implementing Agency
Direct
Expenditure
on projects or
programs
Overheads Direct Through
Implementing
Agency
0.86 0.05 0.91 0.04 0.82 1. Plan International, (India Chapter)
2. Asset Communication Pvt. Ltd. (ACT)
0.04 - 0.04 0.04 - -
1.05 - 1.05 - 1.05 Escorts Skill Development (a Section 8
Company)
0.17 - 0.17 0.17 -
0.58 0.05 0.63 0.03 0.55 1. A.K. Ineriors
2. Nurturing Green Plantations Private Limited
3. Grand Slam Fitness Pvt. Ltd.
4. Gudgudee Pvt. Ltd.
0.50 - 0.50 - 0.50 Raj Nanda Pulmonary Disease Research Trust

Escorts Limited98
6. Reasons for not spending the amount:
The Company under the guidance and directions of
the CSR committee has spend 3.30 cr. in the financial
year 2016-17. The projects undertaken by the Company
have longer implementation period and are subject
to approvals of regulatory/ government bodies. The
Company expects to complete the projects undertaken
by it in the next Financial Year.
7. Statement of the CSR Committee: The
statement of the CSR Committee of the
Board of Directors of the Company, is
reproduced below:
“The implementation and monitoring of Corporate
Social Responsibility (CSR) Policy, is in compliance with
CSR objectives and policy of the Company.”
For and on behalf of the Board of Directors
Sd/-
Place: Faridabad RAJAN NANDA
Date: May 29, 2017 Chairman & Managing Director
& Chairman of CSR Committee
71st Annual Report 2016-17 99
STRATEGIC REPORT GOVERNANCE FINANCIAL STATEMENTS OTHER INFORMATION
For and on behalf of the Board of Directors
Sd/-
Place: Faridabad RAJAN NANDA
Date: May 29, 2017 Chairman & Managing Director
Directors’ ReportAnnexure – G to the
FORM NO. AOC-2
{Pursuant to clause (h) of sub-section (3) of Section 134 of the Act and Rule 8(2)
of the Companies (Accounts) Rules, 2014}
Form for disclosure of particulars of contracts/ arrangements entered into by the Company with related
parties referred to in sub-section (1) of Section 188 of the Companies Act, 2013 including certain arms length
transactions under third proviso thereto
1. Details of contracts or arrangements or transactions not at arm’s length basis
(a) Name(s) of the related party and nature of relationship NIL
(b) Nature of contracts/ arrangements/ transactions NIL
(c) Duration of the contracts/ arrangements/ transactions NIL
(d) Salient terms of the contracts or arrangements or transactions including the value, if any NIL
(e) Justification for entering into such contracts or arrangements or transactions NIL
(f) Date(s) of approval by the Board NIL
(g) Amount paid as advances, if any: NIL
(h) Date on which the special resolution was passed in general meeting as required under first proviso to Section 188. NIL
2. Details of material contracts or arrangement or transactions at arm’s length basis
(a) Name(s) of the related party and nature of relationship NIL
(b) Nature of contracts/ arrangements/ transactions NIL
(c) Duration of the contracts / arrangements/ transactions NIL
(d) Salient terms of the contracts or arrangements or transactions including the value, if any: NIL
(e) Date(s) of approval by the Board, if any: NIL
(f) Amount paid as advances, if any: NIL

Escorts Limited100
To,
The Members
ESCORTS LIMITED
15/5, Mathura Road,
Faridabad – 121003, Haryana
I have conducted the secretarial audit of the compliance of
applicable statutory provisions and the adherence to good
corporate practices by Escorts Limited (hereinafter called
“the Company”/“EL”). Secretarial Audit was conducted in a
manner that provided us a reasonable basis for evaluating
the corporate conducts/ statutory compliances and
expressing my opinion thereon.
Based on my verification of Escorts Limited’s books, papers,
minute books, forms and returns filed and other records
maintained by the Company and also the information
provided by the Company, its officers, agents and
authorized representatives during the conduct of secretarial
audit, I hereby report that in my opinion, the Company has,
during the audit period covering the Financial Year ended
on March 31, 2017, complied with the statutory provisions
listed hereunder and also that the Company has proper
Board processes and compliance-mechanism in place to
the extent, in the manner and subject to the reporting made
hereinafter:
I have examined the books, papers, minute books, forms
and returns filed and other records maintained by Escorts
Limited for the period ended on March 31, 2017 according
to the provisions of:
I. The Companies Act, 2013 (‘the Act’) and the Rules made
thereunder;
II. The Securities Contracts (Regulation) Act, 1956 (‘SCRA’)
and the rules made thereunder;
III. The Depositories Act, 1996 and the Regulations and
Bye-laws framed thereunder;
IV. Foreign Exchange Management Act, 1999 and the rules
and regulations made thereunder to the extent of
Foreign Direct Investment, Overseas Direct Investment
and External Commercial Borrowings;
V. The following Regulations and Guidelines prescribed
under the Securities and Exchange Board of India Act,
1992 (‘SEBI Act’):-
(a) The Securities and Exchange Board of India
(Substantial Acquisition of Shares and Takeovers)
Regulations, 2011;
(b) The Securities and Exchange Board of India
(Prohibition of Insider Trading) Regulations, 2015;
(c) The Securities and Exchange Board of India (Issue of
Capital and Disclosure Requirements) Regulations,
2009 (Not applicable to the Company during the
Audit Period);
(d) The Securities and Exchange Board of India (Share
Based Employee Benefits) Regulations, 2014;
(e) The Securities and Exchange Board of India (Issue
and Listing of Debt Securities) Regulations, 2008
(Not applicable to the Company during the Audit
Period);
(f) The Securities and Exchange Board of India
(Registrars to an Issue and Share Transfer Agents)
Regulations, 1993 regarding the Companies Act and
dealing with client;
(g) The Securities and Exchange Board of India (Delisting
of Equity Shares) Regulations, 2009 (Not applicable
to the Company during the Audit Period); and
(h) The Securities and Exchange Board of India (Buyback
of Securities) Regulations, 1998 (Not applicable to
the Company during the Audit Period); and
Directors’ ReportAnnexure – H to the
FORM NO. MR-3
SECRETARIAL AUDIT REPORT(For the Financial Year ended March 31, 2017)
[Pursuant to Section 204(1) of the Companies Act, 2013 and Rule No. 9 of the Companies (Appointment and
Remuneration of Managerial Personnel) Rules, 2014]
71st Annual Report 2016-17 101
STRATEGIC REPORT GOVERNANCE FINANCIAL STATEMENTS OTHER INFORMATION
(i) The Securities and Exchange Board of India
(Listing Obligations and Disclosure Requirements)
Regulations, 2015.
VI. I further report that, having regard to the compliance
system prevailing in the Company and based on the
representation made by the management of the
Company and on examination of the relevant documents
and records in pursuance thereof, the Company has
complied with the following laws applicable specifically
to the Company:
(a) The Motor Vehicles Act, 1988 and the Rules made
thereunder;
(b) The Aircraft Act, 1934 and Rules made thereunder;
and
(c) The Petroleum Act, 1934 and the Rules made
thereunder.
I have also examined compliance with the applicable
clauses of the following:
(i) Secretarial Standards issued by the Institute of Company
Secretaries of India;
(ii) The Listing Agreements entered into by the Company
with Stock Exchanges.
During the period under review the Company has generally
complied with the provisions of the Act, Rules, Regulations,
Guidelines, Standards etc. mentioned above.
I further report that compliance of applicable financial laws
including Direct and Indirect Tax laws by the Company
has not been reviewed in this Audit as same are subject
to review by the Statutory Auditors and other designated
professionals.
I further report that:
a. Subsequent to the resignation of an Independent
Director from the Board of Directors of the Company
on September 20, 2016, the Company is yet to appoint
an Independent Director to fill the vacancy created
and is in the process of identifying a suitable Director
for appointment on the Board. The constitution of the
Board is inconsistent with the Securities and Exchange
Board of India (Listing Obligations and Disclosure
Requirements) Regulations, 2015 for this duration.
b. The changes in the composition of the Board of
Directors that took place during the period under review
were carried out in compliance with the provisions of
the Act.
c. Adequate notice is given to all directors to schedule the
Board Meetings, agenda and detailed notes on agenda
were sent at least seven days in advance and a system
exists for seeking and obtaining further information and
clarifications on the agenda items before the meeting
and for meaningful participation at the meeting.
d. Majority decision is carried through while the dissenting
members’ views are captured and recorded as part of
the minutes.
I further report that there are adequate systems and
processes in the Company commensurate with the size
and operations of the Company to monitor and ensure
compliance with applicable laws, rules, regulations and
guidelines.
This report is to be read with my letter of even date which is
annexed as Annexure and forms integral part of this report.
For Jayant Gupta and Associates
(Jayant Gupta)
Practicing Company Secretary
FCS : 7288
CP : 9738
Place : New Delhi
Date : May 29, 2017

Escorts Limited102
For Jayant Gupta and Associates
(Jayant Gupta)
Practicing Company Secretary
FCS : 7288
CP : 9738
Place : New Delhi
Date : May 29, 2017
To,
The Members
ESCORTS LIMITED
Management Responsibility for Compliances
1. Maintenance of secretarial record is the responsibility of
the management of the Company. My responsibility is
to express an opinion on these secretarial records based
on my audit.
2. I have followed the audit practices and process as were
appropriate to obtain reasonable assurance about the
correctness of the contents of the secretarial records.
The verification was done on test basis to ensure that
correct facts are reflected in secretarial records. I believe
that the process and practices I followed provide a
reasonable basis for my opinion.
3. I have not verified the correctness and appropriateness
of financial records and Books of Accounts of the
Company.
4. Wherever required, I have obtained the Management
representation about the compliance of laws, rules and
regulations and happening of events etc.
5. The compliance of the provisions of Corporate and
other applicable laws, rules, regulations, standards is
the responsibility of management. My examination was
limited to the verification of procedure on test basis.
6. The Secretarial Audit report is neither an assurance as to
the future viability of the Company nor of the efficacy
or effectiveness with which the management has
conducted the affairs of the Company.
Annexure to the Secretarial Audit Report of Escorts Limited for financial
year ended March 31, 2017
71st Annual Report 2016-17 103
STRATEGIC REPORT GOVERNANCE FINANCIAL STATEMENTS OTHER INFORMATION
I. REGISTRATION AND OTHER DETAILS:i) CIN:- L74899HR1944PLC039088
ii) Registration Date: October 17, 1944
iii) Name of the Company: Escorts Limited
iv) Category / Sub-Category of the Company: Public Company/ Limited by Shares
v) Address of the Registered office and contact details: 15/5, Mathura Road, Faridabad – 121 003, Haryana, India
Tel.: 0129-2250222
vi) Whether Listed Company: Yes
vii) Name, Address and Contact details of Registrar and Transfer Agent, if any:
Karvy Computershare Private Limited,
Karvy Selenium Tower B, Plot 31-32, Gachibowli,
Financial District, Nanakramguda, Hyderabad – 500 032
Ph No 040-67162222; Fax 040-23420814
Email – [email protected]
II. PRINCIPAL BUSINESS ACTIVITIES OF THE COMPANY
All the business activities contributing 10 % or more of the total turnover of the Company shall be stated:-
Sl.
No.
Name and Description of main products
/ services
NIC Code of the Product/ service % to total turnover of the Company
1 Agricultural Tractors 28211 80.30%
2 Construction Equipments 2824 14.56%
III. PARTICULARS OF HOLDING, SUBSIDIARY AND ASSOCIATE COMPANIES
Sl.
No.
Name and address of the Company CIN/GLN Holding/
Subsidiary/
Associate
% of Shares
held
Applicable
Section
1 Escorts Securities Limited
Premises No.- 2/90, Block-P, Connaught Circus,
New Delhi – 110 001
U74899DL1994PLC062140 Subsidiary 49% 2(87)(i)
2 Escorts Asset Management Limited
Premises No.- 2/90, Block-P, Connaught Circus,
New Delhi – 110 001
U74899DL1995PLC074265 Subsidiary 30% 2(87)(i)
3 Eddal Credit Limited
18/4, Mathura Road, Faridabad – 121 007
U65929HR1995PLC032681 Subsidiary 99.86% 2(87)(ii)
4 Farmtrac Tractors Europe Sp. Zo.o
ul. Przemyslowa 11, 11-700 Mragowo
N.A. Subsidiary 100% 2(87)(ii)
5 Escorts Consumer Credit Limited
C-30, Friends Colony (East), New Delhi – 110 065
U65991DL1991PLC174993 Associate 29.41% 2(6)
6 Adico Escorts Agri Equipments Private Limited
Galaxy Oil Compound, Suvey No. 211/1-2,
Kothariaya, Rajkot – 360 003, Gujarat
U29211GJ2011PTC065867 Joint Venture 40% 2(6)
Directors’ ReportAnnexure – I to the
Form No. MGT-9EXTRACT OF ANNUAL RETURN
as on the financial year ended on March 31, 2017
[Pursuant to section 92(3) of the Companies Act, 2013 and rule 12(1) of the Companies (Management and
Administration) Rules, 2014]
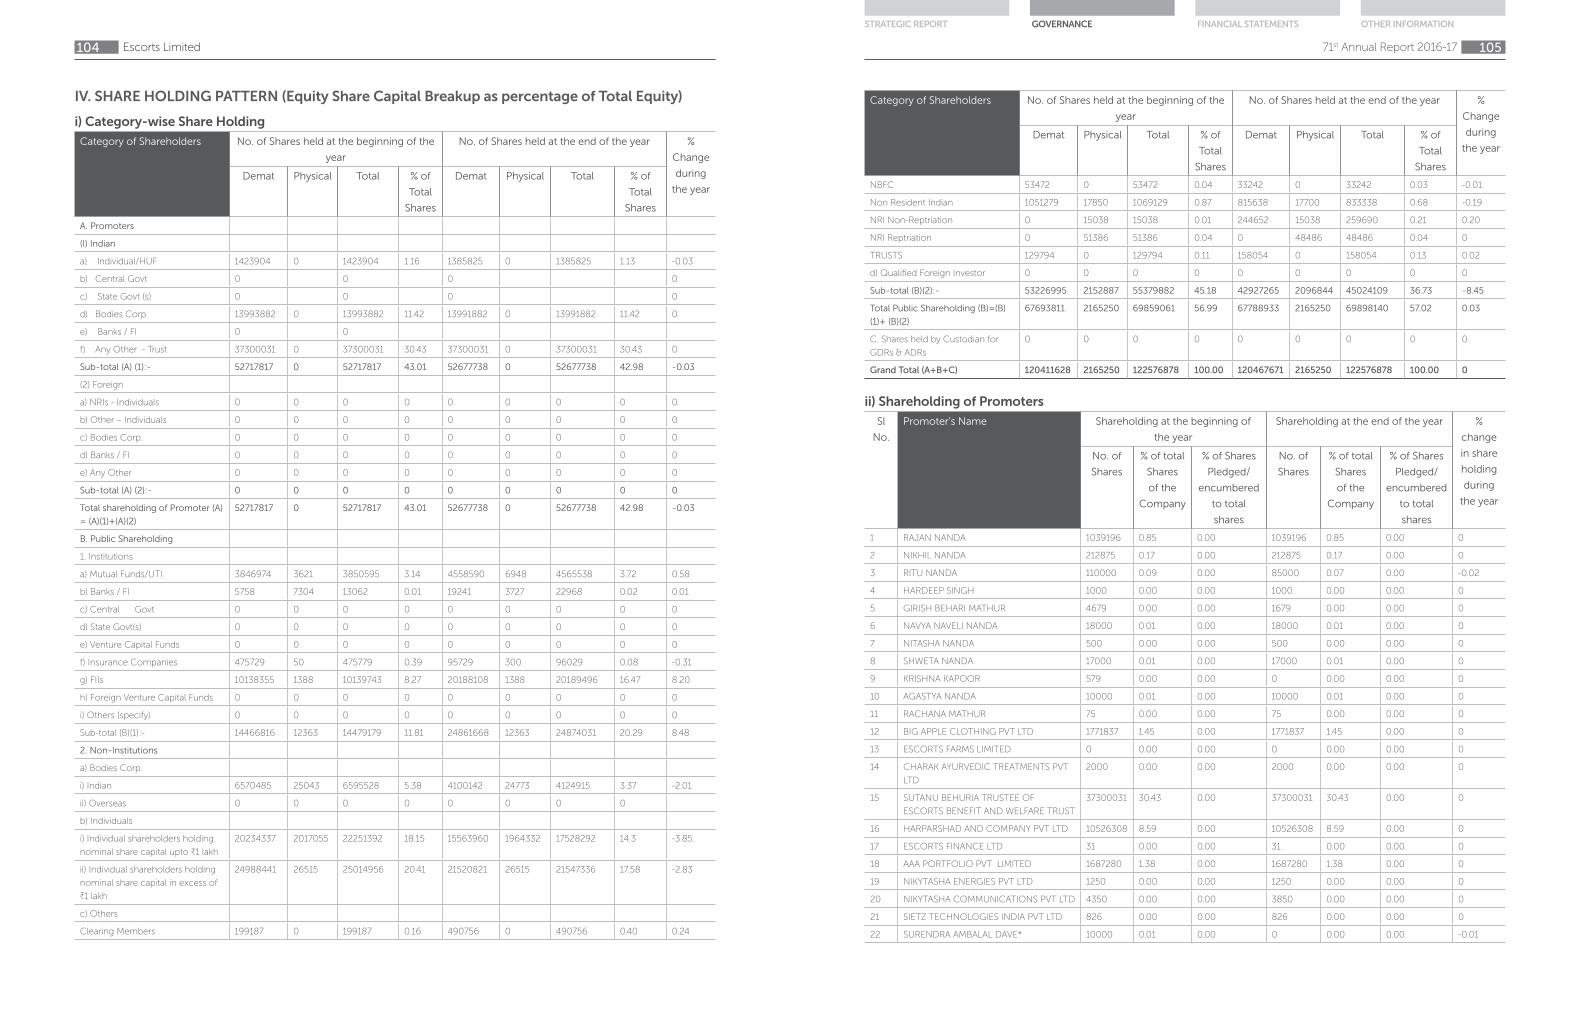
Escorts Limited104
IV. SHARE HOLDING PATTERN (Equity Share Capital Breakup as percentage of Total Equity)
i) Category-wise Share Holding
Category of Shareholders No. of Shares held at the beginning of the
year
No. of Shares held at the end of the year %
Change
during
the year
Demat Physical Total % of
Total
Shares
Demat Physical Total % of
Total
Shares
A. Promoters
(I) Indian
a) Individual/HUF 1423904 0 1423904 1.16 1385825 0 1385825 1.13 -0.03
b) Central Govt 0 0 0 0
c) State Govt (s) 0 0 0 0
d) Bodies Corp. 13993882 0 13993882 11.42 13991882 0 13991882 11.42 0
e) Banks / FI 0 0
f) Any Other - Trust 37300031 0 37300031 30.43 37300031 0 37300031 30.43 0
Sub-total (A) (1):- 52717817 0 52717817 43.01 52677738 0 52677738 42.98 -0.03
(2) Foreign
a) NRIs - Individuals 0 0 0 0 0 0 0 0 0
b) Other – Individuals 0 0 0 0 0 0 0 0 0
c) Bodies Corp. 0 0 0 0 0 0 0 0 0
d) Banks / FI 0 0 0 0 0 0 0 0 0
e) Any Other 0 0 0 0 0 0 0 0 0
Sub-total (A) (2):- 0 0 0 0 0 0 0 0 0
Total shareholding of Promoter (A)
= (A)(1)+(A)(2)
52717817 0 52717817 43.01 52677738 0 52677738 42.98 -0.03
B. Public Shareholding
1. Institutions
a) Mutual Funds/UTI 3846974 3621 3850595 3.14 4558590 6948 4565538 3.72 0.58
b) Banks / FI 5758 7304 13062 0.01 19241 3727 22968 0.02 0.01
c) Central Govt 0 0 0 0 0 0 0 0 0
d) State Govt(s) 0 0 0 0 0 0 0 0 0
e) Venture Capital Funds 0 0 0 0 0 0 0 0 0
f) Insurance Companies 475729 50 475779 0.39 95729 300 96029 0.08 -0.31
g) FIIs 10138355 1388 10139743 8.27 20188108 1388 20189496 16.47 8.20
h) Foreign Venture Capital Funds 0 0 0 0 0 0 0 0 0
i) Others (specify) 0 0 0 0 0 0 0 0 0
Sub-total (B)(1):- 14466816 12363 14479179 11.81 24861668 12363 24874031 20.29 8.48
2. Non-Institutions
a) Bodies Corp.
i) Indian 6570485 25043 6595528 5.38 4100142 24773 4124915 3.37 -2.01
ii) Overseas 0 0 0 0 0 0 0 0
b) Individuals
i) Individual shareholders holding
nominal share capital upto B1 lakh
20234337 2017055 22251392 18.15 15563960 1964332 17528292 14.3 -3.85
ii) Individual shareholders holding
nominal share capital in excess of
B1 lakh
24988441 26515 25014956 20.41 21520821 26515 21547336 17.58 -2.83
c) Others
Clearing Members 199187 0 199187 0.16 490756 0 490756 0.40 0.24
71st Annual Report 2016-17 105
STRATEGIC REPORT GOVERNANCE FINANCIAL STATEMENTS OTHER INFORMATION
Category of Shareholders No. of Shares held at the beginning of the
year
No. of Shares held at the end of the year %
Change
during
the year
Demat Physical Total % of
Total
Shares
Demat Physical Total % of
Total
Shares
NBFC 53472 0 53472 0.04 33242 0 33242 0.03 -0.01
Non Resident Indian 1051279 17850 1069129 0.87 815638 17700 833338 0.68 -0.19
NRI Non-Reptriation 0 15038 15038 0.01 244652 15038 259690 0.21 0.20
NRI Reptriation 0 51386 51386 0.04 0 48486 48486 0.04 0
TRUSTS 129794 0 129794 0.11 158054 0 158054 0.13 0.02
d) Qualified Foreign Investor 0 0 0 0 0 0 0 0 0
Sub-total (B)(2):- 53226995 2152887 55379882 45.18 42927265 2096844 45024109 36.73 -8.45
Total Public Shareholding (B)=(B)
(1)+ (B)(2)
67693811 2165250 69859061 56.99 67788933 2165250 69898140 57.02 0.03
C. Shares held by Custodian for
GDRs & ADRs
0 0 0 0 0 0 0 0 0
Grand Total (A+B+C) 120411628 2165250 122576878 100.00 120467671 2165250 122576878 100.00 0
ii) Shareholding of Promoters
Sl
No.
Promoter’s Name Shareholding at the beginning of
the year
Shareholding at the end of the year %
change
in share
holding
during
the year
No. of
Shares
% of total
Shares
of the
Company
% of Shares
Pledged/
encumbered
to total
shares
No. of
Shares
% of total
Shares
of the
Company
% of Shares
Pledged/
encumbered
to total
shares
1 RAJAN NANDA 1039196 0.85 0.00 1039196 0.85 0.00 0
2 NIKHIL NANDA 212875 0.17 0.00 212875 0.17 0.00 0
3 RITU NANDA 110000 0.09 0.00 85000 0.07 0.00 -0.02
4 HARDEEP SINGH 1000 0.00 0.00 1000 0.00 0.00 0
5 GIRISH BEHARI MATHUR 4679 0.00 0.00 1679 0.00 0.00 0
6 NAVYA NAVELI NANDA 18000 0.01 0.00 18000 0.01 0.00 0
7 NITASHA NANDA 500 0.00 0.00 500 0.00 0.00 0
8 SHWETA NANDA 17000 0.01 0.00 17000 0.01 0.00 0
9 KRISHNA KAPOOR 579 0.00 0.00 0 0.00 0.00 0
10 AGASTYA NANDA 10000 0.01 0.00 10000 0.01 0.00 0
11 RACHANA MATHUR 75 0.00 0.00 75 0.00 0.00 0
12 BIG APPLE CLOTHING PVT LTD 1771837 1.45 0.00 1771837 1.45 0.00 0
13 ESCORTS FARMS LIMITED 0 0.00 0.00 0 0.00 0.00 0
14 CHARAK AYURVEDIC TREATMENTS PVT
LTD
2000 0.00 0.00 2000 0.00 0.00 0
15 SUTANU BEHURIA TRUSTEE OF
ESCORTS BENEFIT AND WELFARE TRUST
37300031 30.43 0.00 37300031 30.43 0.00 0
16 HARPARSHAD AND COMPANY PVT LTD 10526308 8.59 0.00 10526308 8.59 0.00 0
17 ESCORTS FINANCE LTD 31 0.00 0.00 31 0.00 0.00 0
18 AAA PORTFOLIO PVT LIMITED 1687280 1.38 0.00 1687280 1.38 0.00 0
19 NIKYTASHA ENERGIES PVT LTD 1250 0.00 0.00 1250 0.00 0.00 0
20 NIKYTASHA COMMUNICATIONS PVT LTD 4350 0.00 0.00 3850 0.00 0.00 0
21 SIETZ TECHNOLOGIES INDIA PVT LTD 826 0.00 0.00 826 0.00 0.00 0
22 SURENDRA AMBALAL DAVE* 10000 0.01 0.00 0 0.00 0.00 -0.01

Escorts Limited106
Sl
No.
Promoter’s Name Shareholding at the beginning of
the year
Shareholding at the end of the year %
change
in share
holding
during
the year
No. of
Shares
% of total
Shares
of the
Company
% of Shares
Pledged/
encumbered
to total
shares
No. of
Shares
% of total
Shares
of the
Company
% of Shares
Pledged/
encumbered
to total
shares
Total 52717817 43.01 0.00 52678738 42.98 0.00 -0.03
*Resigned as Director w.e.f. September 20, 2016
(iii) Change in Promoters’ Shareholding
Sl
No.
Name Shareholding at the beginning
(01-04-2016) and at the end of
the year (31-03-2017)
Date Increase/
Decrease in
shareholding
Reason Cumulative Shareholding
during the year
No. of shares % of total
shares of the
Company
No. of
shares
% of total
shares
of the
Company
1 Ritu Nanda 110000 0.09 01/04/16
23/09/16 -10000 Transfer 100000
10/03/17 -15000 Transfer 85000
85000 0.07 31/03/17 85000 0.07
(iv) Shareholding Pattern of top ten Shareholders (other than Directors, Promoters and Holders of GDRs
and ADRs):
Sl
No.
Name Shareholding at the beginning
(01-04-2016) and at the end of
the year (31-03-2017)
Date Increase/
Decrease in
shareholding
Reason Cumulative Shareholding
during the year
No. of shares % of total
shares of the
Company
No. of
shares
% of total
shares
of the
Company
1 Jhunjhunwala
Rakesh
Radheshyam
11225000 9.16 01/04/16 11225000 9.16
23/09/16 750000 Transfer 11975000 9.77
23/09/16 -750000 Transfer 11225000 9.16
07/10/16 370000 Transfer 11595000 9.46
07/10/16 -370000 Transfer 11225000 9.16
10/02/17 50000 Transfer 11275000 9.20
10/02/17 -50000 Transfer 11225000 9.16
11225000 9.16 31/03/17 11225000 9.16
2 Girish Behari
Mathur,
Trustee of
Esos-2006
0 0.00 01/04/16 0 0.00
31/03/17 3101612 Transfer 3101612 2.53
3101612 2.53 31/03/17 3101612 2.53
3 Goldman
Sachs India
Fund Limited
3093211 2.52 01/04/16 3093211 2.52
17/06/16 227611 Transfer 3320822 2.71
31/03/17 85251 Transfer 3406073 2.78
3406073 2.78 31/03/17 3406073 2.78
71st Annual Report 2016-17 107
STRATEGIC REPORT GOVERNANCE FINANCIAL STATEMENTS OTHER INFORMATION
Sl
No.
Name Shareholding at the beginning
(01-04-2016) and at the end of
the year (31-03-2017)
Date Increase/
Decrease in
shareholding
Reason Cumulative Shareholding
during the year
No. of shares % of total
shares of the
Company
No. of
shares
% of total
shares
of the
Company
4 T. Rowe Price
International
Discovery
Fund
0 0.00 01/04/16 0 0.00
03/03/17 454681 Transfer 454681 0.37
10/03/17 872613 Transfer 1327294 1.08
17/03/17 84146 Transfer 1411440 1.15
24/03/17 471155 Transfer 1882595 1.54
31/03/17 407079 Transfer 2289674 1.87
2289674 1.87 31/03/17 2289674 1.87
5 Canara
Robeco
Mutual Fund
A/C Canara
Robeco
Emerging
Equity
2060506 1.68 01/04/16 2060506 1.68
08/04/16 -500000 Transfer 1560506 1.27
29/04/16 -96472 Transfer 1464034 1.19
06/05/16 -138735 Transfer 1325299 1.08
20/05/16 -20000 Transfer 1305299 1.06
27/05/16 -100000 Transfer 1205299 0.98
30/06/16 -20000 Transfer 1185299 0.97
08/07/16 -71265 Transfer 1114034 0.91
19/08/16 -110000 Transfer 1004034 0.82
16/09/16 14000 Transfer 1018034 0.83
16/09/16 -44000 Transfer 974034 0.79
16/12/16 -84000 Transfer 890034 0.73
30/12/16 78000 Transfer 968034 0.79
13/01/17 -57000 Transfer 911034 0.74
10/03/17 -70000 Transfer 841034 0.69
841034 0.69 31/03/17 841034 0.69
6 Abu Dhabi
Investment
Authority -
Behave
0 0.00 01/04/16 0 0.00
02/12/16 191085 Transfer 191085 0.16
09/12/16 266415 Transfer 457500 0.37
16/12/16 157990 Transfer 615490 0.50
23/12/16 554010 Transfer 1169500 0.95
30/12/16 619500 Transfer 1789000 1.46
1789000 1.46 31/03/17 1789000 1.46
7 HSBC Global
Investment
Funds - Asia
Ex Japan
Equity
0 0.00 01/04/16 0 0.00
02/12/16 170360 Transfer 170360 0.14
16/12/16 1430788 Transfer 1601148 1.31
20/01/17 80235 Transfer 1681383 1.37
10/02/17 166066 Transfer 1847449 1.51
10/03/17 -149560 Transfer 1697889 1.39
31/03/17 -149800 Transfer 1548089 1.26
1548089 1.26 31/03/17 1548089 1.26

Escorts Limited108
Sl
No.
Name Shareholding at the beginning
(01-04-2016) and at the end of
the year (31-03-2017)
Date Increase/
Decrease in
shareholding
Reason Cumulative Shareholding
during the year
No. of shares % of total
shares of the
Company
No. of
shares
% of total
shares
of the
Company
8 Schroder
International
Selection
Fund
Emerging Asia
0 0.00 01/04/16 0 0.00
17/02/17 534900 Transfer 534900 0.44
24/02/17 616359 Transfer 1151259 0.94
03/03/17 123171 Transfer 1274430 1.04
1274430 1.04 31/03/17 1274430 1.04
9 UTI Mid Cap
Fund
1034889 0.84 01/04/16 1034889 0.84
08/04/16 273594 Transfer 1308483 1.07
30/06/16 356583 Transfer 1665066 1.36
01/07/16 64901 Transfer 1729967 1.41
08/07/16 41505 Transfer 1771472 1.45
15/07/16 725673 Transfer 2497145 2.04
22/07/16 48423 Transfer 2545568 2.08
26/08/16 199598 Transfer 2745166 2.24
02/09/16 393178 Transfer 3138344 2.56
28/10/16 -63629 Transfer 3074715 2.51
27/01/17 97495 Transfer 3172210 2.59
17/02/17 244871 Transfer 3417081 2.79
3417081 2.79 31/03/17 3417081 2.79
10. Dimensional
Emerging
Markets Value
Fund
845361 0.69 01/04/16 845361 0.69
29/07/16 56574 Transfer 901935 0.74
05/08/16 55159 Transfer 957094 0.78
16/09/16 14785 Transfer 971879 0.79
04/11/16 -101070 Transfer 870809 0.71
11/11/16 -50945 Transfer 819864 0.67
819864 0.67 31/03/17 819864 0.67
(v) Shareholding of Directors & Key Managerial Personnel
Sl
No.
Name Shareholding at the
beginning (01-04-2016) and
at the end of the year (31-
03-2017)
Date Increase/
Decrease in
shareholding
Reason Cumulative Shareholding
during the year
No. of
shares
% of total
shares of the
Company
No. of
shares
% of total
shares
of the
Company
A Director’s
1 Rajan Nanda
Chairman &
Managing
Director
1039196 0.85 01/04/16
0Nil Movement
during the year1039196 0.85 31/03/17 1039196 0.85
71st Annual Report 2016-17 109
STRATEGIC REPORT GOVERNANCE FINANCIAL STATEMENTS OTHER INFORMATION
Sl
No.
Name Shareholding at the
beginning (01-04-2016) and
at the end of the year (31-
03-2017)
Date Increase/
Decrease in
shareholding
Reason Cumulative Shareholding
during the year
No. of
shares
% of total
shares of the
Company
No. of
shares
% of total
shares
of the
Company
2 Nikhil Nanda
Managing
Director
212875 0.17 01/04/16
0Nil Movement
during the year212875 0.17 31/03/17 212875 0.17
3 Nitasha Nanda
Whole-time
Director
500 0 01/04/16
0Nil Movement
during the year500 31/03/17 500 0
4 Hardeep Singh
Director
1000 0 01/04/160
Nil Movement
during the year1000 0 31/03/17 1000 0
5 Surendra Ambalal
Dave Director
(Resigned on
20/09/2016)
10000 0.01 01/04/16
Changed
during the year
0 05/08/16 -2000 8000 0.01
0 12/08/16 -1000 7000 0.01
7000 0.01 20/09/16 7000 0.01
6 Girish Behari
Mathur
Director
4679 0 01/04/16Changed
during the year12/08/16 -3000 1679 0.00
1679 0 31/03/17 1679 0
7 Sutanu Behuria
Director
0 0 12/08/16 0 Nil Movement
during the year
0 0
0 0 31/03/17
8 P H Ravikumar
Director
0 0 01/04/16 0 Nil Movement
during the year
0 0
0 0 31/03/17
9 Vibha Paul Rishi
Director
0 0 01/04/16 0 Nil Movement
during the year
0 0
0 0 31/03/17
10 Darius Jehangir
Kakalia
Director
0 0 01/04/16 0Nil Movement
during the year
0 0
0 0 31/03/17
B Key Managerial Personnel (KMP’s)
1 Bharat Madan
Group Chief
Financial Officer
0 0 01/04/16 0 0 0
31/08/16 15000 ESOS
Allotment
15000 0.01
11/11/16 -5940 Transfer 9060 0.01
18/11/16 600 Transfer 9660 0.01
02/12/16 -5744 Transfer 3916 0.00
09/12/16 8584 Transfer 12500 0.01
17/02/17 -2000 Transfer 10500 0.01
24/02/17 -400 Transfer 10100 0.01
10100 0.01 31/03/17 10100 0.01
2 Ajay Kumar
Sharma
Group General
Counsel &
Company
Secretary
0 0 01/04/16 0 Nil Movement
during the year
0 0
0 0 31/03/17

Escorts Limited110
V. INDEBTEDNESS
Indebtedness of the Company including interest outstanding/accrued but not due for payment
Secured Loans
excluding deposits
Unsecured
Loans
Deposits Total
Indebtedness
Indebtedness at the beginning of the financial year
i) Principal Amount 360.37 0.12 - 360.49
ii) Interest due but not paid 0.51 - - 0.51
iii) Interest accrued but not due - - - -
Change in Indebtedness during the financial year 360.88 0.12 - 361.00
• Addition 31.58 - - 31.58
• Reduction 129.77 - - 129.77
Net Change (98.19) - - (98.19)
Indebtedness at the beginning of the financial year
i) Principal Amount 262.69 0.12 - 262.81
ii) Interest due but not paid - - - -
iii) Interest accrued but not due - - - -
Total (i+ii+iii) 262.69 0.12 - 262.81
VI. REMUNERATION OF DIRECTORS AND KEY MANAGERIAL PERSONNEL
A. Remuneration to Managing Director, Whole-time Directors and/or Manager: B in Cr.
Sl.
No.
Particulars of Remuneration Name of MD/ WTD/ Manager Total
Amount Mr. Rajan
Nanda
Mr. Nikhil
Nanda
Ms. Nitasha
Nanda*
1 Gross Salary
a. Salary as per provisions contained in Section 17(1) of the
Income Tax Act, 1961
4.679 4.859 1.401 10.938
b. Value of perquisites u/s 17(2) of the Income Tax Act, 1961 0.080 0.008 0.007 0.095
c. Profits in lieu of salary u/s 17(3) of the Income Tax Act, 1961 - - - -
2 Stock Option - - - -
3 Sweat Equity - - - -
4 Commission -
-as % of profit - - - -
-others 3..500 3.500 1.000 8.000
5 Others 0.500 0.218 0.073 0.791
Total 8.759 8.584 2.482 19.825
Overall Ceiling as per the Act B23.433 Crore (being 10% of the net profits of the Company
calculated as per Section 198 of the Companies Act, 2013)
* Sitting fee paid to Nitasha Nanda is not included in above calculation
71st Annual Report 2016-17 111
STRATEGIC REPORT GOVERNANCE FINANCIAL STATEMENTS OTHER INFORMATION
B. Remuneration to Other Directors B in Cr..
Sl.
No.
Particulars of
Remuneration
Name of Directors Total
Amount Dr. S.A.
Dave*
Mr. P.H.
Ravikumar
Mrs.
Vibha Paul
Rishi
Dr. Sutanu
Behuria
Mr. D.J.
Kakalia**
Mr.
Hardeep
Singh
Mr. G.B.
Mathur***
1 Independent Directors
• Fee for attending
Board/ Committee
Meetings
0.022 0.054 0.034 0.042 0.015 - - 0.167
• Commission - 0.075 0.075 0.075 0.075 - - 0.300
• Others - - - - - - - -
Total (1) 0.022 0.129 0.109 0.117 0.090 - - 0.467
2 Other Non-Executive
Directors
• Fee for attending
Board/ Committee
Meetings
- - - - - 0.063 0.022 0.085
• Commission - - - - - 0.075 - 0.075
• Others - - - - - - - -
Total (2) - - - - - 0.138 0.022 0.160
Total (B) = (1+2) 0.022 0.129 0.109 0.117 0.090 0.138 0.022 0.627
Total Managerial
Remuneration (A+B)
20.452
Overall Ceiling as per the
Act
B2.343 Crore (being 1% of the net profits of the Company (calculated as per Section 198 of the
Companies Act, 2013)
* Ceased to be Director w.e.f. September 20, 2016** Appointed w.e.f. May 25, 2016 *** Professional fee paid to Mr. G.B. Mathur under Section 197(4) of the Act, is not included in above calculation
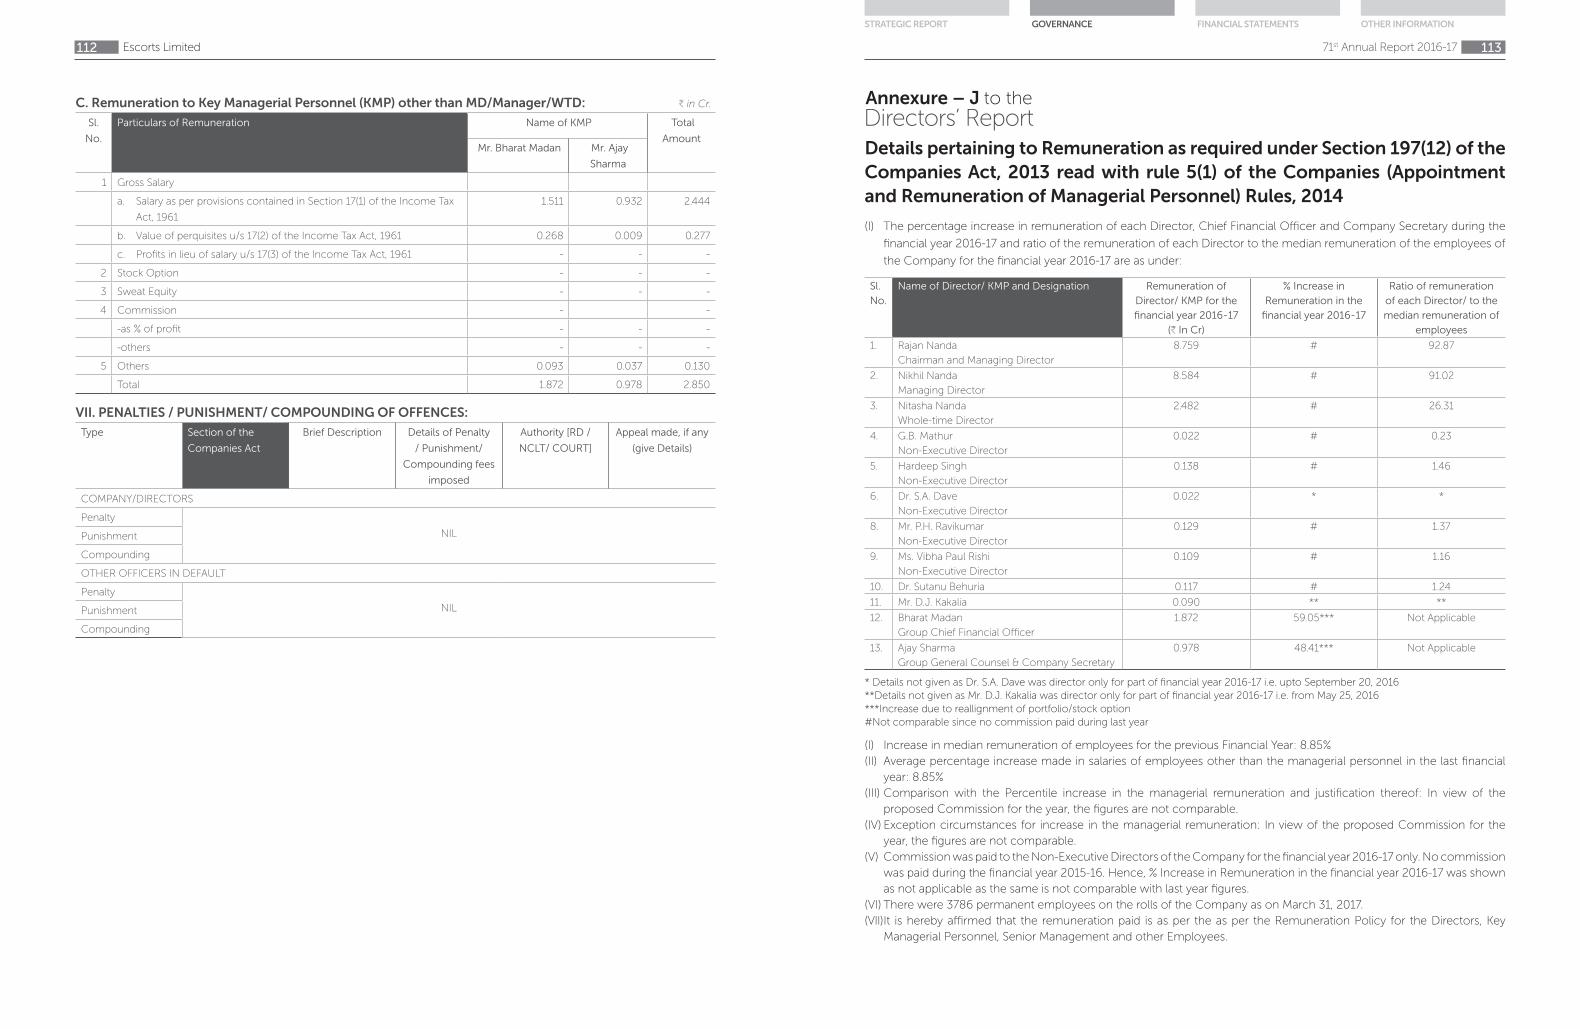
Escorts Limited112
C. Remuneration to Key Managerial Personnel (KMP) other than MD/Manager/WTD: B in Cr.
Sl.
No.
Particulars of Remuneration Name of KMP Total
Amount Mr. Bharat Madan Mr. Ajay
Sharma
1 Gross Salary
a. Salary as per provisions contained in Section 17(1) of the Income Tax
Act, 1961
1.511 0.932 2.444
b. Value of perquisites u/s 17(2) of the Income Tax Act, 1961 0.268 0.009 0.277
c. Profits in lieu of salary u/s 17(3) of the Income Tax Act, 1961 - - -
2 Stock Option - - -
3 Sweat Equity - - -
4 Commission - -
-as % of profit - - -
-others - - -
5 Others 0.093 0.037 0.130
Total 1.872 0.978 2.850
VII. PENALTIES / PUNISHMENT/ COMPOUNDING OF OFFENCES:
Type Section of the
Companies Act
Brief Description Details of Penalty
/ Punishment/
Compounding fees
imposed
Authority [RD /
NCLT/ COURT]
Appeal made, if any
(give Details)
COMPANY/DIRECTORS
Penalty
NILPunishment
Compounding
OTHER OFFICERS IN DEFAULT
Penalty
NILPunishment
Compounding
71st Annual Report 2016-17 113
STRATEGIC REPORT GOVERNANCE FINANCIAL STATEMENTS OTHER INFORMATION
(I) The percentage increase in remuneration of each Director, Chief Financial Officer and Company Secretary during the
financial year 2016-17 and ratio of the remuneration of each Director to the median remuneration of the employees of
the Company for the financial year 2016-17 are as under:
Sl.
No.
Name of Director/ KMP and Designation Remuneration of
Director/ KMP for the
financial year 2016-17
(B In Cr)
% Increase in
Remuneration in the
financial year 2016-17
Ratio of remuneration
of each Director/ to the
median remuneration of
employees
1. Rajan Nanda
Chairman and Managing Director
8.759 # 92.87
2. Nikhil Nanda
Managing Director
8.584 # 91.02
3. Nitasha Nanda
Whole-time Director
2.482 # 26.31
4. G.B. Mathur
Non-Executive Director
0.022 # 0.23
5. Hardeep Singh
Non-Executive Director
0.138 # 1.46
6. Dr. S.A. Dave
Non-Executive Director
0.022 * *
8. Mr. P.H. Ravikumar
Non-Executive Director
0.129 # 1.37
9. Ms. Vibha Paul Rishi
Non-Executive Director
0.109 # 1.16
10. Dr. Sutanu Behuria 0.117 # 1.24
11. Mr. D.J. Kakalia 0.090 ** **
12. Bharat Madan
Group Chief Financial Officer
1.872 59.05*** Not Applicable
13. Ajay Sharma
Group General Counsel & Company Secretary
0.978 48.41*** Not Applicable
* Details not given as Dr. S.A. Dave was director only for part of financial year 2016-17 i.e. upto September 20, 2016
**Details not given as Mr. D.J. Kakalia was director only for part of financial year 2016-17 i.e. from May 25, 2016
***Increase due to reallignment of portfolio/stock option
#Not comparable since no commission paid during last year
(I) Increase in median remuneration of employees for the previous Financial Year: 8.85%
(II) Average percentage increase made in salaries of employees other than the managerial personnel in the last financial
year: 8.85%
(III) Comparison with the Percentile increase in the managerial remuneration and justification thereof: In view of the
proposed Commission for the year, the figures are not comparable.
(IV) Exception circumstances for increase in the managerial remuneration: In view of the proposed Commission for the
year, the figures are not comparable.
(V) Commission was paid to the Non-Executive Directors of the Company for the financial year 2016-17 only. No commission
was paid during the financial year 2015-16. Hence, % Increase in Remuneration in the financial year 2016-17 was shown
as not applicable as the same is not comparable with last year figures.
(VI) There were 3786 permanent employees on the rolls of the Company as on March 31, 2017.
(VII) It is hereby affirmed that the remuneration paid is as per the as per the Remuneration Policy for the Directors, Key
Managerial Personnel, Senior Management and other Employees.
Directors’ ReportAnnexure – J to the
Details pertaining to Remuneration as required under Section 197(12) of the
Companies Act, 2013 read with rule 5(1) of the Companies (Appointment
and Remuneration of Managerial Personnel) Rules, 2014

Escorts Limited114
Independent Auditor’s Report
To the Members of Escorts Limited
Report on the Standalone Ind AS Financial Statements
We have audited the accompanying standalone Indian Accounting Standards (Ind AS) financial statements of Escorts Limited
(“the Company”), which comprise the Balance Sheet as at 31 March 2017, and the Statement of Profit and Loss (including
Other Comprehensive Income), the Statement of Cash Flows and the Statement of Changes in Equity for the year then
ended, and a summary of the significant accounting policies and other explanatory information.
Management’s Responsibility for the Standalone Ind AS Financial Statements
The Company’s Board of Directors is responsible for the matters stated in Section 134(5) of the Companies Act, 2013 (“the
Act”) with respect to the preparation of these standalone Ind AS financial statements that give a true and fair view of the state
of affairs(financial position), profit (financial performance including other comprehensive income), cash flows and changes
in equity of the Company in accordance with the accounting principles generally accepted in India, including the Ind AS
prescribed under section 133 of the Act.
This responsibility also includes maintenance of adequate accounting records in accordance with the provisions of the
Act for safeguarding the assets of the Company and for preventing and detecting frauds and other irregularities; selection
and application of appropriate accounting policies; making judgments and estimates that are reasonable and prudent; and
design, implementation and maintenance of adequate internal financial controls, that were operating effectively for ensuring
the accuracy and completeness of the accounting records, relevant to the preparation and presentation of the standalone
Ind AS financial statements that give a true and fair view and are free from material misstatement, whether due to fraud or
error.
Auditor’s Responsibility
Our responsibility is to express an opinion on these standalone Ind AS financial statements based on our audit.
We have taken into account the provisions of the Act, the accounting and auditing standards and matters which are required
to be included in the audit report under the provisions of the Act and the Rules made thereunder.
We conducted our audit of the standalone Ind AS financial statements in accordance with the Standards on Auditing specified
under Section 143(10) of the Act. Those Standards require that we comply with ethical requirements and plan and perform
the audit to obtain reasonable assurance about whether the standalone Ind AS financial statements are free from material
misstatement.
An audit involves performing procedures to obtain audit evidence about the amounts and the disclosures in the standalone
Ind AS financial statements. The procedures selected depend on the auditor’s judgment, including the assessment of the
risks of material misstatement of the standalone Ind AS financial statements, whether due to fraud or error. In making those
risk assessments, the auditor considers internal financial control relevant to the Company’s preparation of the standalone
Ind AS financial statements that give a true and fair view in order to design audit procedures that are appropriate in the
circumstances. An audit also includes evaluating the appropriateness of the accounting policies used and the reasonableness
of the accounting estimates made by the Company’s Directors, as well as evaluating the overall presentation of the standalone
Ind AS financial statements.
We believe that the audit evidence obtained by us is sufficient and appropriate to provide a basis for our audit opinion on the
standalone Ind AS financial statements.
Opinion
In our opinion and to the best of our information and according to the explanations given to us, the aforesaid standalone
Ind AS financial statements give the information required by the Act in the manner so required and give a true and fair view
in conformity with the accounting principles generally accepted in India including the Ind AS, of the state of affairs (financial
position) of the Company as at 31 March 2017, and its profit (financial performance including other comprehensive income),
its cash flows and the changes in equity for the year ended on that date.
71st Annual Report 2016-17 115
STRATEGIC REPORT GOVERNANCE FINANCIAL STATEMENTS OTHER INFORMATION
Report on Other Legal and Regulatory Requirements
1. As required by the Companies (Auditor’s Report) Order, 2016 (“the Order”) issued by the Central Government in terms
of Section 143(11) of the Act, we give in “Annexure A” a statement on the matters specified in paragraphs 3 and 4 of the
Order.
2. As required by Section 143(3) of the Act, we report that:
a) We have sought and obtained all the information and explanations which to the best of our knowledge and belief
were necessary for the purposes of our audit.
b) In our opinion, proper books of account as required by law have been kept by the Company so far as it appears from
our examination of those books;
c) The Balance Sheet, the Statement of Profit and Loss, the Cash Flow Statement and Statement of Changes in Equity
dealt with by this Report are in agreement with the books of account.
d) In our opinion, the aforesaid standalone Ind AS financial statements comply with the Indian Accounting Standards
prescribed under section 133 of the Act;
e) On the basis of the written representations received from the directors as on 31 March 2017 taken on record by the
Board of Directors, none of the directors is disqualified as on 31 March 2017 from being appointed as a director in
terms of Section 164(2) of the Act.
f) With respect to the adequacy of the internal financial controls over financial reporting of the Company and the
operating effectiveness of such controls, refer to our separate Report in “Annexure B”.
g) With respect to the other matters to be included in the Auditor’s Report in accordance with Rule 11 of the Companies
(Audit and Auditors) Rules, 2014 (as amended), in our opinion and to the best of our information and according to
the explanations given to us:
i. The Company has disclosed the impact of pending litigations on its financial position in its standalone Ind AS
financial statements – Refer Note 34 to the standalone Ind AS financial statements ;
ii. The Company has made provision, as required under the applicable law or accounting standards, for material
foreseeable losses, if any, on long-term contracts including derivative contracts – Refer Note 37 to the standalone
Ind AS financial statements ;
iii. There has been no delay in transferring amounts, required to be transferred, to the Investor Education and
Protection Fund by the Company and
iv. The Company has provided requisite disclosures in the financial statements as to holdings as well as dealings
in Specified Bank Notes during the period from 8 November 2016 to 30 December 2016. Based on audit
procedures and relying on the management representation we report that the disclosures are in accordance
with books of account maintained by the Company and as produced to us by the Management – Refer Note 13
to the standalone Ind AS financial statements.
For S.N. Dhawan & Co. LLP
Chartered Accountants
(Firm’s Registration No.:000050N/N500045)
per Vijay Dhawan
Place: New Delhi Partner
Date: 29 May 2017 Membership No.: 012565

Escorts Limited116
Annexure - A to the Independent Auditor’s Report
Referred to in Paragraph 1 under “Report on Other Legal and Regulatory Requirements” section of our report of even date
(i) (a) The Company has maintained proper records showing full particulars, including quantitative details and situation of
fixed assets (property, plant and equipment).
(b) The Company has a regular programme of physical verification of its fixed assets (property, plant and equipment)
by which fixed assets (property, plant and equipment) are verified in a phased manner over a period of three years.
In accordance with this programme, certain fixed assets (property, plant and equipment) were verified during the
year and no material discrepancies were noticed on such verification. In our opinion, this periodicity of physical
verification is reasonable having regard to the size of the Company and the nature of its assets.
(c) According to the information and explanations given to us and on the basis of our examination of the records of the
Company, the title deeds of immovable properties are held in the name of the Company.
(ii) In our opinion and according to the information and explanations given to us, the inventories have been physically
verified by the management at reasonable intervals during the year, except for materials lying with third parties for which
certificates confirming stocks held by them have been obtained in most of the cases. Discrepancies noticed on physical
verification of inventories as compared to book records were not material and have been properly dealt with in the books
of account.
(iii) In our opinion and according to the information and explanations given to us, the Company has not granted any
loans, secured or unsecured to companies, firms, Limited Liability Partnerships or other parties covered in the register
maintained under section 189 of the Act. Accordingly, paragraph 3(iii) of the Order is not applicable.
(iv) In our opinion and according to the information and explanations given to us, the Company in respect of loans,
investments, guarantees, and security has complied with the provisions of section 185 and 186 of the Act.
(v) In our opinion and according to the information and explanations given to us, the Company has not accepted any
deposits within the meaning of Sections 73 to 76 or any other relevant provisions of the Act and the rules framed
thereunder.
(vi) We have broadly reviewed the books of account maintained by the Company pursuant to the Rules made by the Central
Government for the maintenance of cost records under Section 148(1) of the Act in respect of the products manufactured
by the Company and are of the opinion that prima-facie the prescribed accounts have been made and maintained. We
have, however, not made a detailed examination of the records with a view to determine whether they are accurate and
complete.
(vii) (a) According to the information and explanations given to us and on the basis of our examination of the records,
the Company is generally regular in depositing with appropriate authorities undisputed statutory dues including
provident fund, employee’s state insurance, income-tax, sales-tax, service tax, duty of customs, duty of excise, value
added tax, cess and any other statutory dues applicable to it.
According to the information and explanations given to us, no undisputed amounts payable in respect of provident
fund, employees’ state insurance, income-tax, sales-tax, service tax, duty of customs, duty of excise, value added tax,
cess were in arrears, as at 31 March 2017 for a period of more than six months from the date they became payable.
(b) According to the information and explanations given to us, the details of income tax or sales tax or service tax or duty
of customs or duty of excise or value added tax which have not been deposited on account of any dispute are given
below:
71st Annual Report 2016-17 117
STRATEGIC REPORT GOVERNANCE FINANCIAL STATEMENTS OTHER INFORMATION
Name of the Statute Nature of Dues Amount*
(H Crores)
Period to which
the amount relates
Forum where dispute is pending
Sales Tax Acts Sales Tax 65.96 1992-2015 Adjudicating / Appellate Authority
6.19 2007-2013 High Court
1.55 2006-2013 Supreme court
Central Excise Act, 1944 Excise Duty 2.48 1992-2016 Adjudicating / Appellate Authority
Central Excise Act, 1944 Excise Duty 138.52 2004-2016 CESTAT
Finance Act, 1994 Service Tax 1.63 2006-2015 Adjudicating / Appellate Authority
Finance Act, 1994 Service Tax 1.69 2005-2012 CESTAT
Income Tax Act, 1961 Income Tax 22.05 2006-2007 CIT(A)
Haryana Local Area
Development Tax Act, 2000
Local Area
Development Tax 12.90 2006-2008 Supreme Court
*net of deposits
(viii) In our opinion and according to the information and explanations given to us, the Company has not defaulted in
repayment of loans or borrowings to a financial institution, bank and government. The Company does not have any
outstanding debentures during the year.
(ix) In our opinion and according to the information and explanations given to us, the Company did not raise any monies by
way of initial public offer or further public offer (including debt instruments) during the year and the term loans availed
by the Company were applied for the purposes for which they were raised.
(x) To the best of our knowledge and according to the information and explanations given to us, no fraud by the Company
or on the Company by its officers or employees has been noticed or reported during the period of our audit.
(xi) According to the information and explanations give to us and based on our examination of the records of the Company,
the Company has paid/provided for managerial remuneration in accordance with the requisite approvals mandated by
the provisions of section 197 read with Schedule V to the Act.
(xii) In our opinion and according to the information and explanations given to us, the Company is not a nidhi company.
Accordingly, paragraph 3(xii) of the Order is not applicable.
(xiii) According to the information and explanations given to us and based on our examination of the records of the Company,
transactions with the related parties are in compliance with sections 177 and 188 of the Act, where applicable and details
of such transactions have been disclosed in the notes to the standalone Ind AS financial statements as required by the
applicable accounting standards.
(xiv) According to the information and explanations given to us and based on our examination of the records of the Company,
the Company has not made any preferential allotment or private placement of shares or fully or partly convertible
debentures during the year. Accordingly, paragraph 3(xiv) of the Order is not applicable.
(xv) According to the information and explanations given to us and based on our examination of the records of the Company,
the Company has not entered into non-cash transactions with directors or persons connected with him. Accordingly,
paragraph 3(xv) of the Order is not applicable.
(xvi) The Company is not required to be registered under section 45-IA of the Reserve Bank of India Act 1934.
For S.N. Dhawan & Co. LLP
Chartered Accountants
(Firm’s Registration No.:000050N/N500045)
per Vijay Dhawan
Place: New Delhi Partner
Date: 29 May 2017 Membership No.: 012565
Escorts Limited118
Annexure - B to the Independent Auditor’s Report
Referred to in Paragraph 2(f) under “Report on Other Legal and Regulatory Requirements” section of our report of even date
Report on the Internal Financial Controls under Clause (i) of Sub-section 3 of Section 143 of the Companies Act, 2013
(“the Act”)
We have audited the internal financial controls over financial reporting of Escorts Limited (“the Company”) as of 31 March
2017 in conjunction with our audit of the standalone Ind AS financial statements of the Company for the year ended on that
date.
Management’s Responsibility for Internal Financial Controls
The Company’s management is responsible for establishing and maintaining internal financial controls based on the internal
control over financial reporting criteria established by the Company considering the essential components of internal
control stated in the Guidance Note on Audit of Internal Financial Controls over Financial Reporting issued by the Institute
of Chartered Accountants of India (‘ICAI’). These responsibilities include the design, implementation and maintenance of
adequate internal financial controls that were operating effectively for ensuring the orderly and efficient conduct of its
business, including adherence to company’s policies, the safeguarding of its assets, the prevention and detection of frauds
and errors, the accuracy and completeness of the accounting records, and the timely preparation of reliable financial
information, as required under the Companies Act, 2013.
Auditor’s Responsibility
Our responsibility is to express an opinion on the Company’s internal financial controls over financial reporting based on our
audit. We conducted our audit in accordance with the Guidance Note on Audit of Internal Financial Controls over Financial
Reporting (the “Guidance Note”) and the Standards on Auditing, issued by ICAI and deemed to be prescribed under section
143(10) of the Companies Act, 2013, to the extent applicable to an audit of internal financial controls, both applicable to an
audit of Internal Financial Controls and, both issued by the ICAI. Those Standards and the Guidance Note require that we
comply with ethical requirements and plan and perform the audit to obtain reasonable assurance about whether adequate
internal financial controls over financial reporting was established and maintained and if such controls operated effectively
in all material respects.
Our audit involves performing procedures to obtain audit evidence about the adequacy of the internal financial controls
system over financial reporting and their operating effectiveness. Our audit of internal financial controls over financial
reporting included obtaining an understanding of internal financial controls over financial reporting, assessing the risk that a
material weakness exists, and testing and evaluating the design and operating effectiveness of internal control based on the
assessed risk. The procedures selected depend on the auditor’s judgment, including the assessment of the risks of material
misstatement of the standalone Ind AS financial statements, whether due to fraud or error.
We believe that the audit evidence we have obtained is sufficient and appropriate to provide a basis for our audit opinion on
the Company’s internal financial controls system over financial reporting.
Meaning of Internal Financial Controls over Financial Reporting
A company’s internal financial control over financial reporting is a process designed to provide reasonable assurance
regarding the reliability of financial reporting and the preparation of financial statements for external purposes in accordance
with generally accepted accounting principles. A company’s internal financial control over financial reporting includes those
policies and procedures that (1) pertain to the maintenance of records that, in reasonable detail, accurately and fairly reflect the
transactions and dispositions of the assets of the company; (2) provide reasonable assurance that transactions are recorded
as necessary to permit preparation of financial statements in accordance with generally accepted accounting principles, and
that receipts and expenditures of the company are being made only in accordance with authorisations of management and
directors of the company; and (3) provide reasonable assurance regarding prevention or timely detection of unauthorised
acquisition, use, or disposition of the company’s assets that could have a material effect on the financial statements.
71st Annual Report 2016-17 119
STRATEGIC REPORT GOVERNANCE FINANCIAL STATEMENTS OTHER INFORMATION
Inherent Limitations of Internal Financial Controls Over Financial Reporting
Because of the inherent limitations of internal financial controls over financial reporting, including the possibility of collusion
or improper management override of controls, material misstatements due to error or fraud may occur and not be detected.
Also, projections of any evaluation of the internal financial controls over financial reporting to future periods are subject to
the risk that the internal financial control over financial reporting may become inadequate because of changes in conditions,
or that the degree of compliance with the policies or procedures may deteriorate.
Opinion
In our opinion, the Company has, in all material respects, an adequate internal financial controls system over financial
reporting and such internal financial controls over financial reporting were operating effectively as at 31 March 2017, based
on the internal control over financial reporting criteria established by the Company considering the essential components of
internal control stated in the Guidance Note on Audit of Internal Financial Controls Over Financial Reporting issued by the
ICAI.
For S.N. Dhawan & Co. LLP
Chartered Accountants
(Firm’s Registration No.:000050N/N500045)
per Vijay Dhawan
Place: New Delhi Partner
Date: 29 May 2017 Membership No.: 012565

Escorts Limited120
Standalone Balance Sheet as at 31 March 2017 (H crores)
Note As at
31 March 2017
As at
31 March 2016
As at
1 April 2015
ASSETS
Non-current assets
Property, plant and equipment 3 (i) 1,510.49 1,520.21 1,527.95
Capital work-in-progress 3 (ii) 26.56 21.36 19.40
Investment property 4 23.38 23.88 24.00
Intangible assets 5 (i) 43.89 15.21 15.98
Intangible assets under development 5 (ii) 8.14 36.83 36.07
Financial assets
Investments 6 (i) 418.66 410.90 401.83
Loans 7 (i) 4.17 4.17 4.95
Other financial assets 8 (i) - - -
Deferred tax assets (net) 9 47.04 40.88 32.35
Income tax assets (net) - 15.90 36.06
Other non current assets 10 (i) 13.36 11.24 11.91
Total non-current assets 2,095.69 2,100.58 2,110.50
Current assets
Inventories 11 429.48 396.98 423.36
Financial assets
Investments 6 (ii) 168.80 4.62 4.18
Trade receivables 12 458.02 390.07 372.90
Cash and cash equivalents 13 54.51 31.26 51.87
Bank balances other than above 14 173.89 218.36 190.89
Loans 7 (ii) 4.50 4.12 2.79
Other financial assets 8 (ii) 11.07 10.92 8.91
Other current assets 10 (ii) 102.33 102.37 151.87
Total current assets 1,402.60 1,158.70 1,206.77
Assets held for sale 15 14.86 9.00 9.00
Total assets 3,513.15 3,268.28 3,326.27
EQUITY AND LIABILITIES
Equity
Equity share capital 16 122.58 122.58 122.58
Other equity 17 1,868.58 1,715.10 1,640.06
Total equity 1,991.16 1,837.68 1,762.64
Liabilities
Non-current liabilities
Financial liabilities
Borrowings 18 (i) 56.25 87.46 105.62
Other financial liabilities 19 (i) 12.92 12.02 10.92
Provisions 21 (i) 19.36 26.65 98.08
Other non-current liabilities 20 (i) 16.91 16.89 18.48
Total non-current liabilities 105.44 143.02 233.10
Current liabilities
Financial Liabilities
Borrowings 18 (ii) 159.02 220.20 320.38
Trade payables 22 893.78 737.72 706.14
Other financial liabilities 19 (ii) 112.02 109.83 131.43
Other current liabilities 20 (ii) 116.54 87.16 105.15
Provisions 21 (ii) 131.46 132.67 67.43
Income tax liabities 3.73 - -
Total current liabilities 1,416.55 1,287.58 1,330.53
Total equity and liabilities 3,513.15 3,268.28 3,326.27
The accompanying notes (1 to 49) are integral part of the financial statements.
For and on behalf of the Board As per our Report of even date attached
RAJAN NANDA NIKHIL NANDA HARDEEP SINGH for S.N.DHAWAN & CO. LLP
Chairman and Managing Director Managing Director Director Chartered Accountants
(DIN: 00043256) (DIN: 00043432) (DIN: 00088096) (Firm Regn No. 000050N/N500045)
P.H. RAVIKUMAR BHARAT MADAN AJAY SHARMA VIJAY DHAWAN
Director Group Chief Financial Officer Group General Counsel Partner
(DIN: 00280010) & Company Secretary M No. 12565
Place : Faridabad
Date : 29 May 2017
71st Annual Report 2016-17 121
STRATEGIC REPORT GOVERNANCE FINANCIAL STATEMENTS OTHER INFORMATION
Standalone Statement of Profit and Loss for the year ended 31 March 2017 (H crores)
Note Year ended
31 March 2017
Year ended
31 March 2016
Revenue from operations 23 4,167.58 3,438.67
Other income 24 43.46 55.82
Total income 4,211.04 3,494.49
Expenses
Cost of material consumed 25 2,597.96 2,138.74
Purchases of stock-in-trade 244.12 222.09
Changes in inventories of finished goods, stock-in-trade
and work-in-progress
25 (49.66) (25.70)
Excise duty 74.42 71.91
Employee benefits expense 26 438.99 399.34
Finance costs 27 31.11 49.54
Depreciation and amortisation expense 28 63.07 57.50
Other expenses 29 538.04 455.56
Total expenses 3,938.05 3,368.98
Profit before exceptional items and tax 272.99 125.51
Exceptional items 30 (3.76) 12.29
Profit before tax from continiuing operations 276.75 113.22
Tax expense 9
Current tax 81.75 21.61
Deferred tax (credit)/charge (6.15) (9.11)
Total tax expense 75.60 12.50
Profit for the period from continuing operations 201.15 100.72
Discontinued operations
Loss from discontinued operations 31 (ii) (58.46) (25.96)
Tax expense of discontinued operations 31 (ii) (17.75) (8.99)
Loss from discontinued operations after tax (40.71) (16.97)
Net profit for the year 160.44 83.75
Other comprehensive income
Items that will not be reclassified to profit and loss
Net changes in fair values of equity instruments carried at fair value through other
comprehensive income
7.76 3.06
Re-measurements of defined employee benefit plans (2.64) 0.66
Income tax relating to items that will not be reclassified to profit or loss 0.02 (0.58)
Items that will be reclassified to profit or loss - -
Income tax relating to items that will be reclassified to profit or loss - -
Total other comprehensive income for the year 5.14 3.14
Total comprehensive income for the year 165.58 86.89
Earnings per equity share (for continuing operations): 32
Basic (H) 16.84 8.44
Diluted (H) 16.84 8.44
Earnings per equity share (for discontinued operations):
Basic (H) (3.41) (1.42)
Diluted (H) (3.41) (1.42)
Earnings per equity share (for discontinued and continuing operations):
Basic (H) 13.43 7.02
Diluted (H) 13.43 7.02
The accompanying notes (1 to 49) are integral part of the financial statements.
For and on behalf of the Board As per our Report of even date attached
RAJAN NANDA NIKHIL NANDA HARDEEP SINGH for S.N.DHAWAN & CO. LLP
Chairman and Managing Director Managing Director Director Chartered Accountants
(DIN: 00043256) (DIN: 00043432) (DIN: 00088096) (Firm Regn No. 000050N/N500045)
P.H. RAVIKUMAR BHARAT MADAN AJAY SHARMA VIJAY DHAWAN
Director Group Chief Financial Officer Group General Counsel Partner
(DIN: 00280010) & Company Secretary M No. 12565
Place : Faridabad
Date : 29 May 2017

Escorts Limited122
Cash Flow Statement for the year ended 31 March 2017(H crores)
Year ended
31 March 2017
Year ended
31 March 2016
A Cash flow from operating activities
Profit before tax from
Continuing operations 276.75 113.22
Discontinued operations (58.46) (25.96)
Profit before tax including discontinued operations 218.29 87.26
Adjustments for
Depreciation and amortisation expense 64.52 60.11
Bad debts and advances written off, allowance for
doubtful trade receivable, write backs and others (net)
34.10 11.69
Interest expense 35.03 52.86
Interest income (25.78) (30.92)
Distribution received from subsidiary (15.00) -
Gain on disposal of property, plant and equipment (net) (1.63) 0.22
Net gain on investments carried at fair value through profit or loss (4.62) (0.44)
Unrealised foreign exchange gain 0.45 (2.35)
Operating profit before working capital changes 305.36 178.43
Movement in working capital
Inventories (57.45) 21.63
Trade receivables (78.86) (15.01)
Other financial assets (4.30) (4.30)
Other assets (1.63) 46.22
Trade payables 155.44 42.07
Other financial liabilities 11.77 (2.53)
Other liabilities 14.84 (52.37)
Cash flow from operating activities post working capital changes 345.17 214.14
Income tax paid (net) (44.38) 7.55
Net cash flow from operating activities (A) 300.79 221.69
B Cash flows from investing activities
Purchase of property, plant and equipment (including capital advances) (65.87) (48.39)
Sale of property, plant and equipment 13.05 1.94
Purchase of intangible assets (12.57) (5.27)
Sale of intangible assets 0.09 -
Purchase of current investment (net) (159.56) (0.10)
Bank deposit (having original maturity of more than 3 months) 49.60 (6.49)
Margin/bank deposits (8.17) 1.90
Interest received 28.76 30.07
Distribution received from subsidiary 15.00 -
Net cash flows used in investing activities (B) (139.67) (26.34)
71st Annual Report 2016-17 123
STRATEGIC REPORT GOVERNANCE FINANCIAL STATEMENTS OTHER INFORMATION
Cash Flow Statement for the year ended 31 March 2017(H crores)
Year ended
31 March 2017
Year ended
31 March 2016
C Cash flows from financing activities
Proceeds from sale of treasury shares 0.71 0.91
Repayment of long term borrowings (53.31) (73.08)
Proceeds from long term borrowings 16.58 35.00
Repayment from short term borrowings (net) (61.21) (100.18)
Interest paid (27.78) (44.71)
Dividend and tax thereon paid (12.86) (12.83)
Net cash used in financing activities (C) (137.87) (194.89)
Increase in cash and cash equivalents (A+B+C) 23.25 0.46
Cash and cash equivalents at the beginning of the year (refer note 13) 31.26 29.87
Exchange difference on translation of foregin currency cash and cash equivalents - 0.93
Cash and cash equivalents at the end of the year (refer note 13) 54.51 31.26
Note: The above statement of Cash Flow has been prepared under the ‘Indirect Method’ as set out in Ind AS 7, ‘Statement of
Cash Flows’.
For and on behalf of the Board As per our Report of even date attached
RAJAN NANDA NIKHIL NANDA HARDEEP SINGH for S.N.DHAWAN & CO. LLP
Chairman and Managing Director Managing Director Director Chartered Accountants
(DIN: 00043256) (DIN: 00043432) (DIN: 00088096) (Firm Regn No. 000050N/N500045)
P.H. RAVIKUMAR BHARAT MADAN AJAY SHARMA VIJAY DHAWAN
Director Group Chief Financial Officer Group General Counsel Partner
(DIN: 00280010) & Company Secretary M No. 12565
Place : Faridabad
Date : 29 May 2017
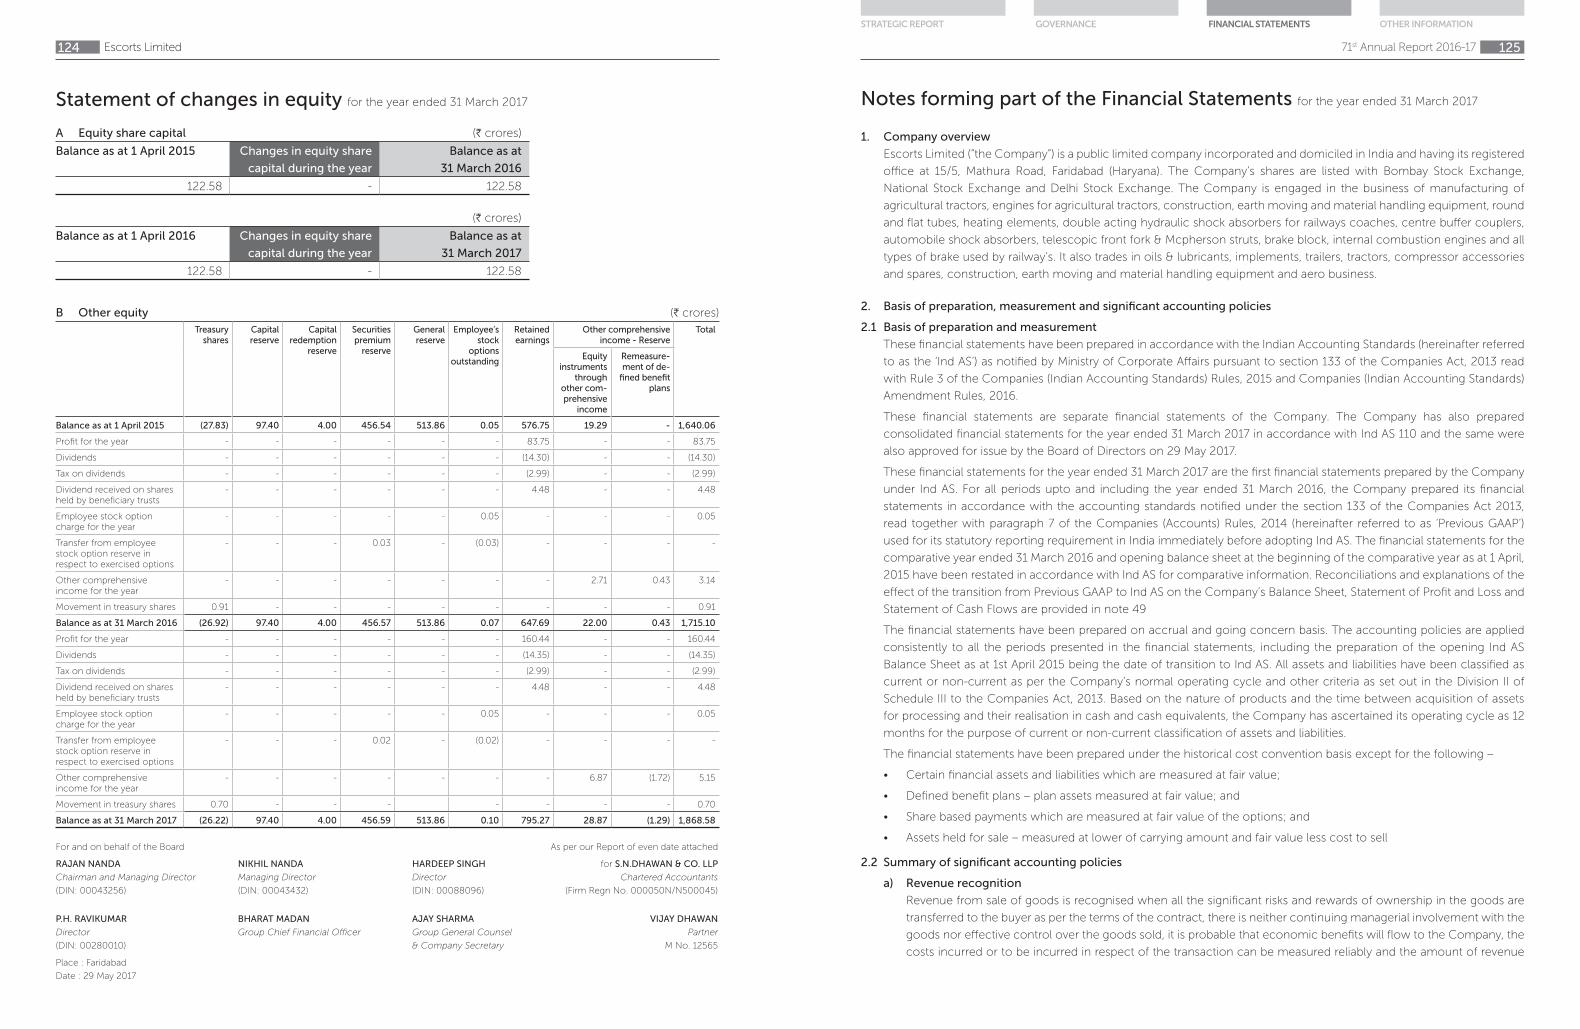
Escorts Limited124
Statement of changes in equity for the year ended 31 March 2017
A Equity share capital (H crores)
Balance as at 1 April 2015 Changes in equity share
capital during the year
Balance as at
31 March 2016
122.58 - 122.58
(H crores)
Balance as at 1 April 2016 Changes in equity share
capital during the year
Balance as at
31 March 2017
122.58 - 122.58
B Other equity (H crores)
Treasury shares
Capital reserve
Capital redemption
reserve
Securities premium
reserve
General reserve
Employee’s stock
options outstanding
Retained earnings
Other comprehensive income - Reserve
Total
Equity instruments
through other com-prehensive
income
Remeasure-ment of de-
fined benefit plans
Balance as at 1 April 2015 (27.83) 97.40 4.00 456.54 513.86 0.05 576.75 19.29 - 1,640.06
Profit for the year - - - - - - 83.75 - - 83.75
Dividends - - - - - - (14.30) - - (14.30)
Tax on dividends - - - - - - (2.99) - - (2.99)
Dividend received on shares held by beneficiary trusts
- - - - - - 4.48 - - 4.48
Employee stock option charge for the year
- - - - - 0.05 - - - 0.05
Transfer from employee stock option reserve in respect to exercised options
- - - 0.03 - (0.03) - - - -
Other comprehensive income for the year
- - - - - - - 2.71 0.43 3.14
Movement in treasury shares 0.91 - - - - - - - - 0.91
Balance as at 31 March 2016 (26.92) 97.40 4.00 456.57 513.86 0.07 647.69 22.00 0.43 1,715.10
Profit for the year - - - - - - 160.44 - - 160.44
Dividends - - - - - - (14.35) - - (14.35)
Tax on dividends - - - - - - (2.99) - - (2.99)
Dividend received on shares held by beneficiary trusts
- - - - - - 4.48 - - 4.48
Employee stock option charge for the year
- - - - - 0.05 - - - 0.05
Transfer from employee stock option reserve in respect to exercised options
- - - 0.02 - (0.02) - - - -
Other comprehensive income for the year
- - - - - - - 6.87 (1.72) 5.15
Movement in treasury shares 0.70 - - - - - - - 0.70
Balance as at 31 March 2017 (26.22) 97.40 4.00 456.59 513.86 0.10 795.27 28.87 (1.29) 1,868.58
For and on behalf of the Board As per our Report of even date attached
RAJAN NANDA NIKHIL NANDA HARDEEP SINGH for S.N.DHAWAN & CO. LLP
Chairman and Managing Director Managing Director Director Chartered Accountants
(DIN: 00043256) (DIN: 00043432) (DIN: 00088096) (Firm Regn No. 000050N/N500045)
P.H. RAVIKUMAR BHARAT MADAN AJAY SHARMA VIJAY DHAWAN
Director Group Chief Financial Officer Group General Counsel Partner
(DIN: 00280010) & Company Secretary M No. 12565
Place : Faridabad
Date : 29 May 2017
Notes forming part of the Financial Statements for the year ended 31 March 2017
71st Annual Report 2016-17 125
STRATEGIC REPORT GOVERNANCE FINANCIAL STATEMENTS OTHER INFORMATION
1. Company overview
Escorts Limited (“the Company”) is a public limited company incorporated and domiciled in India and having its registered
office at 15/5, Mathura Road, Faridabad (Haryana). The Company’s shares are listed with Bombay Stock Exchange,
National Stock Exchange and Delhi Stock Exchange. The Company is engaged in the business of manufacturing of
agricultural tractors, engines for agricultural tractors, construction, earth moving and material handling equipment, round
and flat tubes, heating elements, double acting hydraulic shock absorbers for railways coaches, centre buffer couplers,
automobile shock absorbers, telescopic front fork & Mcpherson struts, brake block, internal combustion engines and all
types of brake used by railway’s. It also trades in oils & lubricants, implements, trailers, tractors, compressor accessories
and spares, construction, earth moving and material handling equipment and aero business.
2. Basis of preparation, measurement and significant accounting policies
2.1 Basis of preparation and measurement
These financial statements have been prepared in accordance with the Indian Accounting Standards (hereinafter referred
to as the ‘Ind AS’) as notified by Ministry of Corporate Affairs pursuant to section 133 of the Companies Act, 2013 read
with Rule 3 of the Companies (Indian Accounting Standards) Rules, 2015 and Companies (Indian Accounting Standards)
Amendment Rules, 2016.
These financial statements are separate financial statements of the Company. The Company has also prepared
consolidated financial statements for the year ended 31 March 2017 in accordance with Ind AS 110 and the same were
also approved for issue by the Board of Directors on 29 May 2017.
These financial statements for the year ended 31 March 2017 are the first financial statements prepared by the Company
under Ind AS. For all periods upto and including the year ended 31 March 2016, the Company prepared its financial
statements in accordance with the accounting standards notified under the section 133 of the Companies Act 2013,
read together with paragraph 7 of the Companies (Accounts) Rules, 2014 (hereinafter referred to as ‘Previous GAAP’)
used for its statutory reporting requirement in India immediately before adopting Ind AS. The financial statements for the
comparative year ended 31 March 2016 and opening balance sheet at the beginning of the comparative year as at 1 April,
2015 have been restated in accordance with Ind AS for comparative information. Reconciliations and explanations of the
effect of the transition from Previous GAAP to Ind AS on the Company’s Balance Sheet, Statement of Profit and Loss and
Statement of Cash Flows are provided in note 49
The financial statements have been prepared on accrual and going concern basis. The accounting policies are applied
consistently to all the periods presented in the financial statements, including the preparation of the opening Ind AS
Balance Sheet as at 1st April 2015 being the date of transition to Ind AS. All assets and liabilities have been classified as
current or non-current as per the Company’s normal operating cycle and other criteria as set out in the Division II of
Schedule III to the Companies Act, 2013. Based on the nature of products and the time between acquisition of assets
for processing and their realisation in cash and cash equivalents, the Company has ascertained its operating cycle as 12
months for the purpose of current or non-current classification of assets and liabilities.
The financial statements have been prepared under the historical cost convention basis except for the following –
• Certain financial assets and liabilities which are measured at fair value;
• Defined benefit plans – plan assets measured at fair value; and
• Share based payments which are measured at fair value of the options; and
• Assets held for sale – measured at lower of carrying amount and fair value less cost to sell
2.2 Summary of significant accounting policies
a) Revenue recognition
Revenue from sale of goods is recognised when all the significant risks and rewards of ownership in the goods are
transferred to the buyer as per the terms of the contract, there is neither continuing managerial involvement with the
goods nor effective control over the goods sold, it is probable that economic benefits will flow to the Company, the
costs incurred or to be incurred in respect of the transaction can be measured reliably and the amount of revenue

Notes forming part of the Financial Statements for the year ended 31 March 2017
Escorts Limited126
can be measured reliably.
Revenue from services rendered is recognised in proportion to the stage of completion of the transaction at the
reporting date when the outcome of the transaction can be estimated reliably.
Revenues from the sale of extended warranties and maintenance contracts embedded in the original sales contracts
are recognized over the life of the contract and matched to related costs.
Income from export incentives are recognised on accrual basis.
Revenue is measured at fair value of the consideration received or receivable, after deduction of any trade discounts,
volume rebates and any taxes or duties collected on behalf of the government which are levied on sales such as sales
tax, value added tax, etc. In case of multi-element revenue arrangements, which involve delivery or performance of
multiple products, services, evaluation will be done of all deliverables in an arrangement to determine whether they
represent separate units of accounting at the inception of arrangement. Total arrangement consideration related to
the bundled contract is allocated among the different elements based on their relative fair values (i.e., ratio of the
fair value of each element to the aggregated fair value of the bundled deliverables). In case the relative fair value
of different components cannot be determined on a reasonable basis, the total consideration is allocated to the
different components based on residual value method.
Rental income
Rental income is recognised on a straight-line basis over the term of the lease, except for contingent rental income
which is recognised when it arises and where scheduled increase in rent compensates the lessor for expected
inflationary costs.
Interest Income
Interest income is recognized on time proportion basis taking into account the amount outstanding and rate
applicable.
For all Financial Assets measured at amortised cost (refer ‘h’ below), interest income is recorded using the effective
interest rate (EIR) i.e. the rate that exactly discounts estimated future cash receipts through the expected life of the
financial asset to the net carrying amount of the financial assets. The future cash flows include all other transaction
costs paid or received, premiums or discounts if any, etc.
Dividend income
Dividend income is recognised at the time when right to receive the payment is established, which is generally when
the shareholders approve the dividend.
b) Foreign currency translation
Functional and presentation currency
The financial statements are presented in Indian Rupee (‘H’) and are rounded to two decimal places of crores, which
is also the functional and presentation currency of the Company.
Transactions and balances
Foreign currency transactions are recorded in the functional currency, by applying to the exchange rate between the
functional currency and the foreign currency at the date of the transaction.
Foreign currency monetary items are converted to functional currency using the closing rate. Non-monetary items
denominated in a foreign currency which are carried at historical cost are reported using the exchange rate at the
date of the transactions.
Exchange differences arising on monetary items on settlement, or restatement as at reporting date, at rates different
from those at which they were initially recorded, are recognized in the statement of profit and loss in the year in
which they arise.
c) Borrowing costs
Borrowing costs directly attributable to the acquisition, construction or production of a qualifying asset are capitalised
Notes forming part of the Financial Statements for the year ended 31 March 2017
71st Annual Report 2016-17 127
STRATEGIC REPORT GOVERNANCE FINANCIAL STATEMENTS OTHER INFORMATION
during the period of time that is necessary to complete and prepare the asset for its intended use or sale. A qualifying
asset is one that necessarily takes substantial period of time to get ready for its intended use. Capitalisation of
borrowing costs is suspended in the period during which the active development is delayed due to, other than
temporary, interruption. All other borrowing costs are charged to the statement of profit and loss as incurred.
d) Property, plant and equipment
Recognition and initial measurement
Property, plant and equipment are stated at their cost of acquisition. The cost comprises purchase price, borrowing
cost if capitalisation criteria are met and directly attributable cost of bringing the asset to its working condition
for the intended use. Any trade discount and rebates are deducted in arriving at the purchase price. Subsequent
costs are included in the asset’s carrying amount or recognised as a separate asset, as appropriate, only when it is
probable that future economic benefits attributable to such subsequent cost associated with the item will flow to the
Company. All other repair and maintenance costs are recognised in statement of profit or loss as incurred.
In case an item of property, plant and equipment is acquired on deferred payment basis, interest expenses included
in deferred payment is recognised as interest expense and not included in cost of asset.
Subsequent measurement (depreciation and useful lives)
Depreciation on property, plant and equipment is provided on the straight-line method, computed on the basis of
useful lives mentioned below:
Asset category Estimated useful life (in years)
Factory buildings 30
Office buildings 60
Tubewells and fencing 5
Roads 10
Sheds 3
Plant and machinery 3-15*
Furniture and fixtures 5-10*
Office equipments 3-10
Vehicles 8-10
Leasehold improvements Over the effective term of the lease
Electrical appliances 10
IT equipments 6
Computers 3
*Based on technical evaluation, the management believes that the useful lives as given above best represent the
period over which management expects to use these assets. Hence, the useful lives for certain items within these
classes of assets is different from the useful lives as prescribed under Part C of Schedule II to the Companies Act,
2013.
The residual values, useful lives and method of depreciation are reviewed at each financial year end and adjusted
prospectively, if appropriate.
Where, during any financial year, any addition has been made to any asset, or where any asset has been sold,
discarded, demolished or destroyed, or significant components replaced; depreciation on such assets is calculated
on a pro rata basis as individual assets with specific useful life from the month of such addition or, as the case may
be, up to the month on which such asset has been sold, discarded, demolished or destroyed or replaced.
De-recognition
An item of property, plant and equipment and any significant part initially recognised is derecognised upon disposal
or when no future economic benefits are expected from its use or disposal. Any gain or loss arising on de-recognition
of the asset (calculated as the difference between the net disposal proceeds and the carrying amount of the asset)

Notes forming part of the Financial Statements for the year ended 31 March 2017
Escorts Limited128
is included in the income statement when the asset is derecognised.
e) Investment properties
Recognition and initial measurement
Investment properties are properties held to earn rentals or for capital appreciation, or both. Investment properties
are measured initially at their cost of acquisition. The cost comprises purchase price, borrowing cost if capitalisation
criteria are met and directly attributable cost of bringing the asset to its working condition for the intended use. Any
trade discount and rebates are deducted in arriving at the purchase price.
Subsequent costs are included in the asset’s carrying amount or recognised as a separate asset, as appropriate, only
when it is probable that future economic benefits associated with the item will flow to the Company. All other repair
and maintenance costs are recognised in statement of profit or loss as incurred.
Though the Company measures investment property using cost based measurement, the fair value of investment
property is disclosed in the notes to the financial statements. Fair values are determined based on an annual
evaluation performed by an accredited external independent valuer who holds a recognised and relevant professional
qualification and has recent experience in the location and category of the investment property being valued.
Subsequent measurement (depreciation and useful lives)
Depreciation on investment properties is provided on the straight-line method, computed on the basis of useful lives
prescribed under Part C of Schedule II to the Companies Act, 2013.
The residual values, useful lives and method of depreciation of are reviewed at each financial year end and adjusted
prospectively, if appropriate.
Where, during any financial year, any addition has been made to any asset, or where any asset has been sold,
discarded, demolished or destroyed, or significant components replaced; depreciation on such assets is calculated
on a pro rata basis as individual assets with specific useful life from the month of such addition or, as the case may
be, up to the month on which such asset has been sold, discarded, demolished or destroyed or replaced.
De-recognition
Investment properties are derecognised either when they have been disposed of or when they are permanently
withdrawn from use and no future economic benefit is expected from their disposal. The difference between the net
disposal proceeds and the carrying amount of the asset is recognised in profit or loss in the period of de-recognition.
f) Intangible assets
Recognition and initial measurement
Purchased Intangible assets are stated at cost less accumulated amortisation and impairment, if any.
Internally developed intangible assets
Expenditure on the research phase of projects is recognised as an expense as incurred.
Costs that are directly attributable to a project’s development phase are recognised as intangible assets, provided the
Company can demonstrate the following:
• the technical feasibility of completing the intangible asset so that it will be available for use.
• its intention to complete the intangible asset and use or sell it
• its ability to use or sell the intangible asset
• how the intangible asset will generate probable future economic benefits
• the availability of adequate technical, financial and other resources to complete the development and to use or
sell the intangible asset.
• its ability to measure reliably the expenditure attributable to the intangible asset during its development
Development costs not meeting these criteria for capitalisation are expensed as incurred.
Directly attributable costs include employee costs incurred on development of prototypes along with an appropriate
Notes forming part of the Financial Statements for the year ended 31 March 2017
71st Annual Report 2016-17 129
STRATEGIC REPORT GOVERNANCE FINANCIAL STATEMENTS OTHER INFORMATION
portion of relevant overheads and borrowing costs.
Subsequent measurement (amortisation)
All finite-lived intangible assets, including internally developed intangible assets, are accounted for using the cost
model whereby capitalised costs are amortised on a straight-line basis over their estimated useful lives. The estimated
useful life of an identifiable intangible asset is based on a number of factors including the effects of obsolescence,
demand, competition, and other economic factors (such as the stability of the industry, and known technological
advances), and the level of maintenance expenditures required to obtain the expected future cash flows from the
asset.
Residual values and useful lives are reviewed at each reporting date. The following useful lives are applied:
Asset category Estimated useful life (in years)
Software 6
Prototypes 4
Technical know how 6
g) Leases
Finance leases
Management applies judgement in considering the substance of a lease agreement and whether it transfers
substantially all the risks and rewards incidental to ownership of the leased asset. Key factors considered include i)
the length of the lease term in relation to the economic life of the asset, ii) the present value of the minimum lease
payments in relation to the asset’s fair value, and iii) whether the Company obtains ownership of the asset at the
end of the lease term. Where the Company is a lessee in this type of arrangement, the related asset is recognised
at the inception of the lease at the fair value of the leased asset or, if lower, the present value of the lease payments
plus incidental payments, if any. A corresponding amount is recognized as a finance lease liability. Assets held under
finance leases (including land) are depreciated over their estimated useful lives. The corresponding finance lease
liability is reduced by lease payments net of finance charges. The interest element of lease payments represents a
constant proportion of the outstanding capital balance and is charged to statement of profit and loss, as finance
costs over the period of the lease.
Refer note 2.2 (d) for the depreciation methods and useful lives for assets held under finance leases.
The interest element of lease payments is charged to profit or loss, as finance costs over the period of the lease.
Operating lease
All leases other than finance leases are treated as operating leases. Where the Company is a lessee, lease rental are
charged to statement of profit and loss on straight line basis except where scheduled increase in rent compensate
the lessor for expected inflationary costs. Associated costs, such as maintenance and insurance, are expensed as
incurred
Where the Company is a lessor, the respective leased assets are included in the balance sheet based on their nature.
Rental income is recognised on straight line basis over the lease term except where scheduled increase in rent
compensates the Company with expected inflationary costs.
h) Financial instruments
Financial instruments are recognised when the Company becomes a party to the contractual provisions of the
instrument and are measured initially at fair value adjusted for transaction costs, except for those carried at fair value
through profit or loss which are measured initially at fair value.
If the Company determines that the fair value at initial recognition differs from the transaction price, the Company
accounts for that instrument at that date as follows:
a) at the measurement basis mentioned above if that fair value is evidenced by a quoted price in an active market
for an identical asset or liability (i.e. a Level 1 input) or based on a valuation technique that uses only data from

Notes forming part of the Financial Statements for the year ended 31 March 2017
Escorts Limited130
observable markets. The Company recognises the difference between the fair value at initial recognition and the
transaction price as a gain or loss.
b) in all other cases, at the measurement basis mentioned above, adjusted to defer the difference between the
fair value at initial recognition and the transaction price. After initial recognition, the Company recognises that
deferred difference as a gain or loss only to the extent that it arises from a change in a factor (including time) that
market participants would take into account when pricing the asset or liability.
Subsequent measurement of financial assets and financial liabilities is described below.
Financial assets
Classification and subsequent measurement
For the purpose of subsequent measurement, financial assets are classified into the following categories upon initial
recognition:
i. Financial assets at amortised cost – a financial instrument is measured at amortised cost if both the following
conditions are met:
• The asset is held within a business model whose objective is to hold assets for collecting contractual cash
flows, and
• Contractual terms of the asset give rise on specified dates to cash flows that are solely payments of principal
and interest (SPPI) on the principal amount outstanding.
After initial measurement, such financial assets are subsequently measured at amortised cost using the effective
interest method.
ii. Investments in equity instruments of subsidiaries, joint ventures and associates - Investments in equity
instruments of subsidiaries, joint ventures and associates are accounted for at cost in accordance with Ind AS 27
Separate Financial Statements.
iii. Financial assets at fair value
• Investments in equity instruments other than above – All equity investments in scope of Ind AS 109 are
measured at fair value. Equity instruments which are held for trading are generally classified as at fair value
through profit and loss (FVTPL). For all other equity instruments, the Company decides to classify the same
either as at fair value through other comprehensive income (FVOCI) or fair value through profit and loss
(FVTPL). The Company makes such election on an instrument by instrument basis. The classification is made
on initial recognition and is irrevocable.
If the Company decides to classify an equity instrument as at FVOCI, then all fair value changes on the
instrument, excluding dividends, are recognised in the other comprehensive income (OCI). There is no
recycling of the amounts from OCI to P&L, even on sale of investment. However, the Company may transfer
the cumulative gain or loss within equity. Dividends on such investments are recognised in profit or loss
unless the dividend clearly represents a recovery of part of the cost of the investment.
Equity instruments included within the FVTPL category are measured at fair value with all changes recognised
in the P&L.
• Mutual funds – All mutual funds in scope of Ind-AS 109 are measured at fair value through profit and loss
(FVTPL).
De-recognition of financial assets
A financial asset is primarily de-recognised when the rights to receive cash flows from the asset have expired or the
Company has transferred its rights to receive cash flows from the asset.
Financial liabilities
Subsequent measurement
Notes forming part of the Financial Statements for the year ended 31 March 2017
71st Annual Report 2016-17 131
STRATEGIC REPORT GOVERNANCE FINANCIAL STATEMENTS OTHER INFORMATION
After initial recognition, the financial liabilities are subsequently measured at amortised cost using the effective
interest method.
Amortised cost is calculated by considering any discount or premium on acquisition and fees or costs that are an
integral part of the EIR. The effect of EIR amortisation is included as finance costs in the statement of profit and loss.
De-recognition of financial liabilities
A financial liability is de-recognised when the obligation under the liability is discharged or cancelled or expires. When
an existing financial liability is replaced by another from the same lender on substantially different terms, or the terms
of an existing liability are substantially modified, such an exchange or modification is treated as the de-recognition
of the original liability and the recognition of a new liability. The difference in the respective carrying amounts is
recognised in the statement of profit or loss.
Offsetting of financial instruments
Financial assets and financial liabilities are offset and the net amount is reported in the balance sheet if there is a
currently enforceable legal right to offset the recognised amounts and there is an intention to settle on a net basis,
to realise the assets and settle the liabilities simultaneously.
i) Impairment of financial assets
All financial assets except for those at FVTPL are subject to review for impairment at each reporting date to identify
whether there is any objective evidence that a financial asset or a group of financial assets is impaired. Different
criteria to determine impairment are applied for each category of financial assets.
In accordance with Ind AS 109, the Company applies expected credit loss (ECL) model for measurement and
recognition of impairment loss for financial assets carried at amortised cost.
ECL is the weighted average of difference between all contractual cash flows that are due to the Company in
accordance with the contract and all the cash flows that the Company expects to receive, discounted at the original
effective interest rate, with the respective risks of default occurring as the weights. When estimating the cash flows,
the Company is required to consider –
• All contractual terms of the financial assets (including prepayment and extension) over the expected life of the
assets.
• Cash flows from the sale of collateral held or other credit enhancements that are integral to the contractual
terms.
Trade receivables
(i) For debtors that are not past due – The Company applies approach permitted by Ind AS 109 ‘Financial Instruments’,
which requires lifetime expected credit losses to be recognised upon initial recognition of receivables. Lifetime
ECL are the expected credit losses resulting from all possible default events over the expected life of a financial
instrument.
Life time expected credit losses are assessed and accounted based on company’s historical counter party default
rates and forecast of macro-economic factors, by dividing receivables that are not considered to be individually
significant by reference to the business segment of the counter party and other shared credit risk characteristics
to evaluate the expected credit loss. The expected credit loss estimate is then based on recent historical counter
party default rates for each identified segment.
The Company defines default as an event when the financial asset is past due for more than 365 days. This
definition is based on management’s expectation of the time period beyond which if a receivable is outstanding,
it is an objective evidence of impairment.
(ii) For debtors considered past due – any enhancement in the accrual done for expected credit loss on individually
significant receivables is made to recognise any additional expected credit loss on amount recoverable. The

Notes forming part of the Financial Statements for the year ended 31 March 2017
Escorts Limited132
Company writes off trade receivables when there is no objective evidence that such amounts would not be
recovered. Financial assets that are written-off are still subject to enforcement activity by the Company.
Other financial assets
For recognition of impairment loss on other financial assets and risk exposure, the Company determines whether
there has been a significant increase in the credit risk since initial recognition. If the credit risk has not increased
significantly since initial recognition, the Company measures the loss allowance at an amount equal to 12 month
expected credit losses, else at an amount equal to the lifetime expected credit losses.
When making this assessment, the Company uses the change in the risk of a default occurring over the expected
life of the financial asset. To make that assessment, the Company compares the risk of a default occurring on the
financial asset as at the balance sheet date with the risk of a default occurring on the financial asset as at the date
of initial recognition and considers reasonable and supportable information, that is available without undue cost
or effort, that is indicative of significant increases in credit risk since initial recognition. The Company assumes
that the credit risk on a financial asset has not increased significantly since initial recognition if the financial asset is
determined to have low credit risk at the balance sheet date.
j) Impairment of non-financial assets
For impairment assessment purposes, assets are grouped at the lowest levels for which there are largely independent
cash inflows (cash generating units). As a result, some assets are tested individually for impairment and some are
tested at cash-generating unit level.
At each reporting date, the Company assesses whether there is any indication based on internal/external factors,
that an asset may be impaired. If any such indication exists, the Company estimates the recoverable amount of the
asset. If such recoverable amount of the asset or the recoverable amount of the cash generating unit to which the
asset belongs is less than its carrying amount, the carrying amount is reduced to its recoverable amount and the
reduction is treated as an impairment loss and is recognised in the statement of profit and loss. If, at the reporting
date there is an indication that a previously assessed impairment loss no longer exists, the recoverable amount is
reassessed which is the higher of fair value less costs of disposal and value-in-use and the asset is reflected at the
recoverable amount subject to a maximum of depreciated historical cost. Impairment losses previously recognized
are accordingly reversed in the statement of profit and loss.
To determine value-in-use, management estimates expected future cash flows from each cash-generating unit and
determines a suitable discount rate in order to calculate the present value of those cash flows. The data used for
impairment testing procedures are directly linked to the Group’s latest approved budget, adjusted as necessary to
exclude the effects of future re-organisations and asset enhancements. Discount factors are determined individually
for each cash-generating unit and reflect current market assessment of the time value of money and asset-specific
risk factors.
k) Fair value measurement
The Company measures certain financial instruments, such as, investments at fair value at each balance sheet date.
Fair value is the price that would be received to sell an asset or paid to transfer a liability in an orderly transaction
between market participants at the measurement date. The fair value measurement is based on the presumption that
the transaction to sell the asset or transfer the liability takes place either:
• In the principal market for the asset or liability, or
• In the absence of a principal market, in the most advantageous market for the asset or liability
The principal or the most advantageous market must be accessible by the Company.
The fair value of an asset or a liability is measured using the assumptions that market participants would use when
pricing the asset or liability, assuming that market participants act in their economic best interest.
Refer Note 37 for fair value hierarchy.
l) Inventories
Notes forming part of the Financial Statements for the year ended 31 March 2017
71st Annual Report 2016-17 133
STRATEGIC REPORT GOVERNANCE FINANCIAL STATEMENTS OTHER INFORMATION
Inventories are stated at the lower of cost and net realisable value. The cost of inventories comprises of all costs
of purchase, costs of conversion and other costs incurred in bringing the inventories to their present location and
condition. Costs of inventories are computed using the weighted average cost formula. Net realisable value is
the estimated selling price in the ordinary course of business less any applicable selling expenses. Provision for
obsolescence and slow moving inventory is made based on management’s best estimates of net realisable value of
such inventories.
m) Income taxes
Tax expense recognised in profit or loss comprises the sum of deferred tax and current tax not recognised in other
comprehensive income or directly in equity.
Current income tax is measured at the amount expected to be paid to the tax authorities in accordance with the
Income-tax Act, 1961. Current tax items are recognised in correlation to the underlying transaction either in other
comprehensive income or directly in equity.
Deferred tax liabilities are generally recognised in full for all taxable temporary differences. Deferred tax assets are
recognised to the extent that it is probable that the underlying tax loss, unused tax credits (Minimum alternate
tax credit entitlement) or deductible temporary difference will be utilised against future taxable income. This is
assessed based on the Company’s forecast of future operating results, adjusted for significant non-taxable income
and expenses and specific limits on the use of any unused tax loss or credit. Unrecognised deferred tax assets are
re-assessed at each reporting date and are recognised to the extent that it has become probable that future taxable
profits will allow deferred tax asset to be recovered.
Deferred tax assets and liabilities are measured at the tax rates that are expected to apply in the year when the asset
is realised or the liability is settled, based on tax rates (and tax laws) that have been enacted or substantively enacted
at the reporting date. Deferred tax items are recognised in correlation to the underlying transaction either in other
comprehensive income or directly in equity.
Current tax assets and current tax liabilities are offset when there is a legally enforceable right to set off the recognised
amounts and there is an intention to settle the asset and liability on a net basis. Deferred tax assets and deferred tax
liabilities are offset when there is a legally enforceable right to set off current tax assets against current tax liabilities;
and the deferred tax assets and the deferred tax liabilities relate to income taxes levied by the same taxation authority.
n) Investment in subsidiaries, joint ventures and associates
Investments in subsidiaries, joint ventures and associates are carried at cost less accumulated impairment losses,
if any. Where an indication of impairment exists, the carrying amount of the investment is assessed and written
down immediately to its recoverable amount. On disposal of these investments, the difference between net disposal
proceeds and the carrying amounts are recognised in the Statement of Profit and Loss.
o) Government grants
Government grants are recognised where there is reasonable assurance that the grant will be received and all
attached conditions will be complied with. When the grant relates to an expense item, it is recognised as income
on a systematic basis over the periods that the related costs, for which it is intended to compensate, are expensed.
When the grant relates to an asset, it is recognised as income in equal amounts over the expected useful life of the
related asset.
When the Company receives grants for non-monetary assets, the asset and the grant are recorded at fair value
amounts and released to profit or loss over the expected useful life in a pattern of consumption of the benefit of the
underlying asset i.e. by equal annual instalments.
p) Cash and cash equivalents
Cash and cash equivalents comprise cash in hand, demand deposits with banks/corporations and short-term highly
liquid investments (original maturity less than 3 months) that are readily convertible into known amount of cash and
are subject to an insignificant risk of change in value.
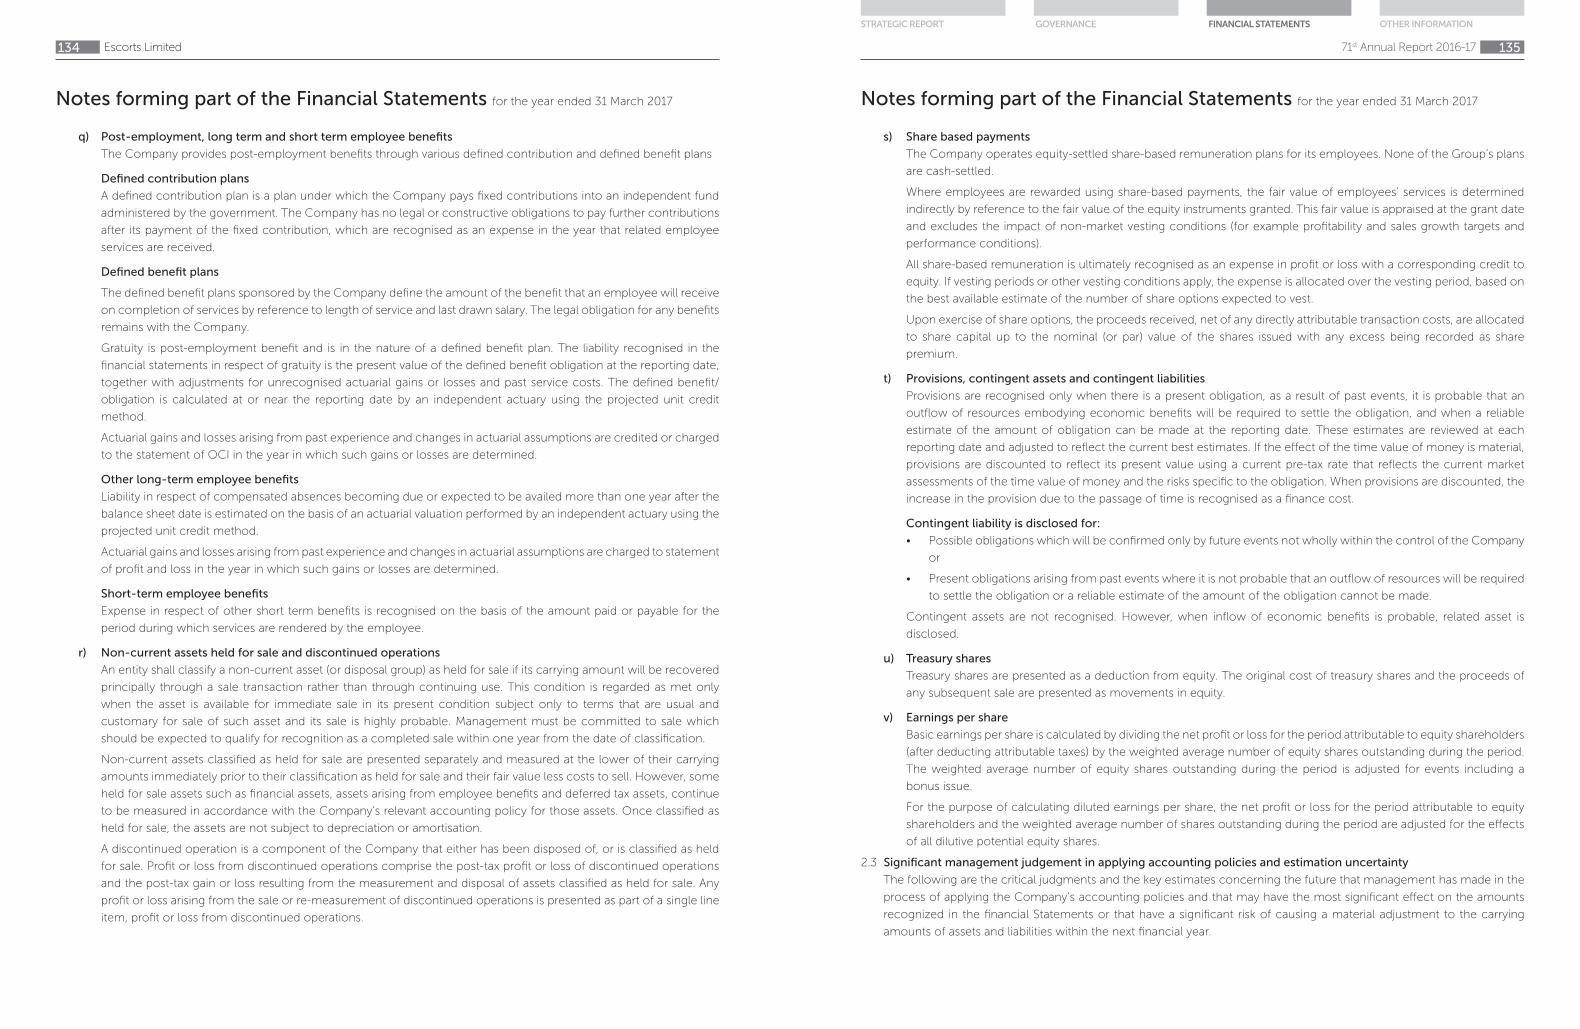
Notes forming part of the Financial Statements for the year ended 31 March 2017
Escorts Limited134
q) Post-employment, long term and short term employee benefits
The Company provides post-employment benefits through various defined contribution and defined benefit plans
Defined contribution plans
A defined contribution plan is a plan under which the Company pays fixed contributions into an independent fund
administered by the government. The Company has no legal or constructive obligations to pay further contributions
after its payment of the fixed contribution, which are recognised as an expense in the year that related employee
services are received.
Defined benefit plans
The defined benefit plans sponsored by the Company define the amount of the benefit that an employee will receive
on completion of services by reference to length of service and last drawn salary. The legal obligation for any benefits
remains with the Company.
Gratuity is post-employment benefit and is in the nature of a defined benefit plan. The liability recognised in the
financial statements in respect of gratuity is the present value of the defined benefit obligation at the reporting date,
together with adjustments for unrecognised actuarial gains or losses and past service costs. The defined benefit/
obligation is calculated at or near the reporting date by an independent actuary using the projected unit credit
method.
Actuarial gains and losses arising from past experience and changes in actuarial assumptions are credited or charged
to the statement of OCI in the year in which such gains or losses are determined.
Other long-term employee benefits
Liability in respect of compensated absences becoming due or expected to be availed more than one year after the
balance sheet date is estimated on the basis of an actuarial valuation performed by an independent actuary using the
projected unit credit method.
Actuarial gains and losses arising from past experience and changes in actuarial assumptions are charged to statement
of profit and loss in the year in which such gains or losses are determined.
Short-term employee benefits
Expense in respect of other short term benefits is recognised on the basis of the amount paid or payable for the
period during which services are rendered by the employee.
r) Non-current assets held for sale and discontinued operations
An entity shall classify a non-current asset (or disposal group) as held for sale if its carrying amount will be recovered
principally through a sale transaction rather than through continuing use. This condition is regarded as met only
when the asset is available for immediate sale in its present condition subject only to terms that are usual and
customary for sale of such asset and its sale is highly probable. Management must be committed to sale which
should be expected to qualify for recognition as a completed sale within one year from the date of classification.
Non-current assets classified as held for sale are presented separately and measured at the lower of their carrying
amounts immediately prior to their classification as held for sale and their fair value less costs to sell. However, some
held for sale assets such as financial assets, assets arising from employee benefits and deferred tax assets, continue
to be measured in accordance with the Company’s relevant accounting policy for those assets. Once classified as
held for sale, the assets are not subject to depreciation or amortisation.
A discontinued operation is a component of the Company that either has been disposed of, or is classified as held
for sale. Profit or loss from discontinued operations comprise the post-tax profit or loss of discontinued operations
and the post-tax gain or loss resulting from the measurement and disposal of assets classified as held for sale. Any
profit or loss arising from the sale or re-measurement of discontinued operations is presented as part of a single line
item, profit or loss from discontinued operations.
Notes forming part of the Financial Statements for the year ended 31 March 2017
71st Annual Report 2016-17 135
STRATEGIC REPORT GOVERNANCE FINANCIAL STATEMENTS OTHER INFORMATION
s) Share based payments
The Company operates equity-settled share-based remuneration plans for its employees. None of the Group’s plans
are cash-settled.
Where employees are rewarded using share-based payments, the fair value of employees’ services is determined
indirectly by reference to the fair value of the equity instruments granted. This fair value is appraised at the grant date
and excludes the impact of non-market vesting conditions (for example profitability and sales growth targets and
performance conditions).
All share-based remuneration is ultimately recognised as an expense in profit or loss with a corresponding credit to
equity. If vesting periods or other vesting conditions apply, the expense is allocated over the vesting period, based on
the best available estimate of the number of share options expected to vest.
Upon exercise of share options, the proceeds received, net of any directly attributable transaction costs, are allocated
to share capital up to the nominal (or par) value of the shares issued with any excess being recorded as share
premium.
t) Provisions, contingent assets and contingent liabilities
Provisions are recognised only when there is a present obligation, as a result of past events, it is probable that an
outflow of resources embodying economic benefits will be required to settle the obligation, and when a reliable
estimate of the amount of obligation can be made at the reporting date. These estimates are reviewed at each
reporting date and adjusted to reflect the current best estimates. If the effect of the time value of money is material,
provisions are discounted to reflect its present value using a current pre-tax rate that reflects the current market
assessments of the time value of money and the risks specific to the obligation. When provisions are discounted, the
increase in the provision due to the passage of time is recognised as a finance cost.
Contingent liability is disclosed for:
• Possible obligations which will be confirmed only by future events not wholly within the control of the Company
or
• Present obligations arising from past events where it is not probable that an outflow of resources will be required
to settle the obligation or a reliable estimate of the amount of the obligation cannot be made.
Contingent assets are not recognised. However, when inflow of economic benefits is probable, related asset is
disclosed.
u) Treasury shares
Treasury shares are presented as a deduction from equity. The original cost of treasury shares and the proceeds of
any subsequent sale are presented as movements in equity.
v) Earnings per share
Basic earnings per share is calculated by dividing the net profit or loss for the period attributable to equity shareholders
(after deducting attributable taxes) by the weighted average number of equity shares outstanding during the period.
The weighted average number of equity shares outstanding during the period is adjusted for events including a
bonus issue.
For the purpose of calculating diluted earnings per share, the net profit or loss for the period attributable to equity
shareholders and the weighted average number of shares outstanding during the period are adjusted for the effects
of all dilutive potential equity shares.
2.3 Significant management judgement in applying accounting policies and estimation uncertainty
The following are the critical judgments and the key estimates concerning the future that management has made in the
process of applying the Company’s accounting policies and that may have the most significant effect on the amounts
recognized in the financial Statements or that have a significant risk of causing a material adjustment to the carrying
amounts of assets and liabilities within the next financial year.

Notes forming part of the Financial Statements for the year ended 31 March 2017
Escorts Limited136
Allowance for doubtful debts – The allowance for doubtful debts reflects management’s estimate of losses inherent
in its credit portfolio. This allowance is based on Company’s estimate of the losses to be incurred, which derives from
past experience with similar receivables, current and historical past due amounts, dealer termination rates, write-offs
and collections, the careful monitoring of portfolio credit quality and current and projected economic and market
conditions. Should the present economic and financial situation persist or even worsen, there could be a further
deterioration in the financial situation of the Company’s debtors compared to that already taken into consideration
in calculating the allowances recognised in the financial statements.
Allowance for obsolete and slow-moving inventory- The allowance for obsolete and slow-moving inventory reflects
management’s estimate of the expected loss in value, and has been determined on the basis of past experience
and historical and expected future trends in the used vehicle market. A worsening of the economic and financial
situation could cause a further deterioration in conditions in the used vehicle market compared to that taken into
consideration in calculating the allowances recognized in the financial statements.
Product warranties - The Company makes provisions for estimated expenses related to product warranties at the
time products are sold. Management establishes these estimates based on historical information of the nature,
frequency and average cost of warranty claims. The Company seeks to improve vehicle quality and minimise warranty
expenses arising from claims. Warranty costs may differ from those estimated if actual claim rates are higher or lower
than historical rates.
Useful lives of depreciable/amortisable assets – Management reviews its estimate of the useful lives of depreciable/
amortisable assets at each reporting date, based on the expected utility of the assets. Uncertainties in these estimates
relate to technical and economic obsolescence that may change the utility of certain software, IT equipment and
other plant and equipment.
Defined benefit obligation (DBO) – Management’s estimate of the DBO is based on a number of critical underlying
assumptions such as standard rates of inflation, mortality, discount rate and anticipation of future salary increases.
Variation in these assumptions may significantly impact the DBO amount and the annual defined benefit expenses.
Capitalisation of internally developed intangible assets - Distinguishing the research and development phases for
new products and design enhancements determining whether the recognition requirements for the capitalisation of
development costs are met requires judgement. After capitalisation, management monitors whether the recognition
requirements continue to be met and whether there any indicators that capitalised costs may be impaired.
Evaluation of indicators for impairment of assets – The evaluation of applicability of indicators of impairment of
assets requires assessment of several external and internal factors which could result in deterioration of recoverable
amount of the assets.
Recognition of deferred tax assets - The extent to which deferred tax assets can be recognized is based on an
assessment of the probability of the future taxable income against which the deferred tax assets can be utilised.
Contingent liabilities – The Company is the subject of legal proceedings and tax issues covering a range of matters,
which are pending in various jurisdictions. Due to the uncertainty inherent in such matters, it is difficult to predict the
final outcome of such matters. The cases and claims against the Company often raise difficult and complex factual
and legal issues, which are subject to many uncertainties, including but not limited to the facts and circumstances of
each particular case and claim, the jurisdiction and the differences in applicable law. In the normal course of business
management consults with legal counsel and certain other experts on matters related to litigation and taxes. The
Company accrues a liability when it is determined that an adverse outcome is probable and the amount of the loss
can be reasonably estimated.
2.4 Standards issued but not yet effective
In March 2017, the Ministry of Corporate Affairs issued the Companies (Indian Accounting Standards) (Amendments)
Rules, 2017, notifying amendments to Ind AS 7, ‘Statement of cash flows’ and Ind AS 102, ‘Share-based payment.’ These
amendments are in accordance with the recent amendments made by International Accounting Standards Board (IASB)
Notes forming part of the Financial Statements for the year ended 31 March 2017
71st Annual Report 2016-17 137
STRATEGIC REPORT GOVERNANCE FINANCIAL STATEMENTS OTHER INFORMATION
to IAS 7, ‘Statement of cash flows’, and IFRS 2, ‘Share-based payment’, respectively. The amendments are applicable to
the Company from 1 April 2017.
Amendment to Ind AS 7:
The amendments to Ind AS 7 inter-alia require the entities to provide disclosures that enable users of financial statements
to evaluate changes in liabilities arising from financing activities, including both changes arising from cash flows and non-
cash changes, suggesting inclusion of a reconciliation between the opening and closing balances in the balance sheet
for liabilities arising from financing activities, to meet the disclosure requirement.
The Company is evaluating the requirements of the amendment and the effect on the financial statements is being
evaluated.
Amendment to Ind AS 102:
The amendments to Ind AS 102 inter-alia provide specific guidance to measurement of cash-settled awards, modification
of cash-settled awards and awards that include a net settlement feature in respect of withholding taxes.
It clarifies that the fair value of cash-settled awards is determined on a basis consistent with that used for equity-settled
awards. Market-based performance conditions and non-vesting conditions are reflected in the ‘fair values’, but non-market
performance conditions and service vesting conditions are reflected in the estimate of the number of awards expected to
vest. Also, the amendment clarifies that if the terms and conditions of a cash-settled share-based payment transaction are
modified with the result that it becomes an equity-settled share-based payment transaction, the transaction is accounted
for as such from the date of the modification. Further, the amendment requires the award that includes a net settlement
feature in respect of withholding taxes to be treated as equity-settled in its entirety. The cash payment to the tax authority
is treated as if it was part of an equity settlement.
The Company is evaluating the requirements of the amendment and the impact on the financial statements is being
evaluated.
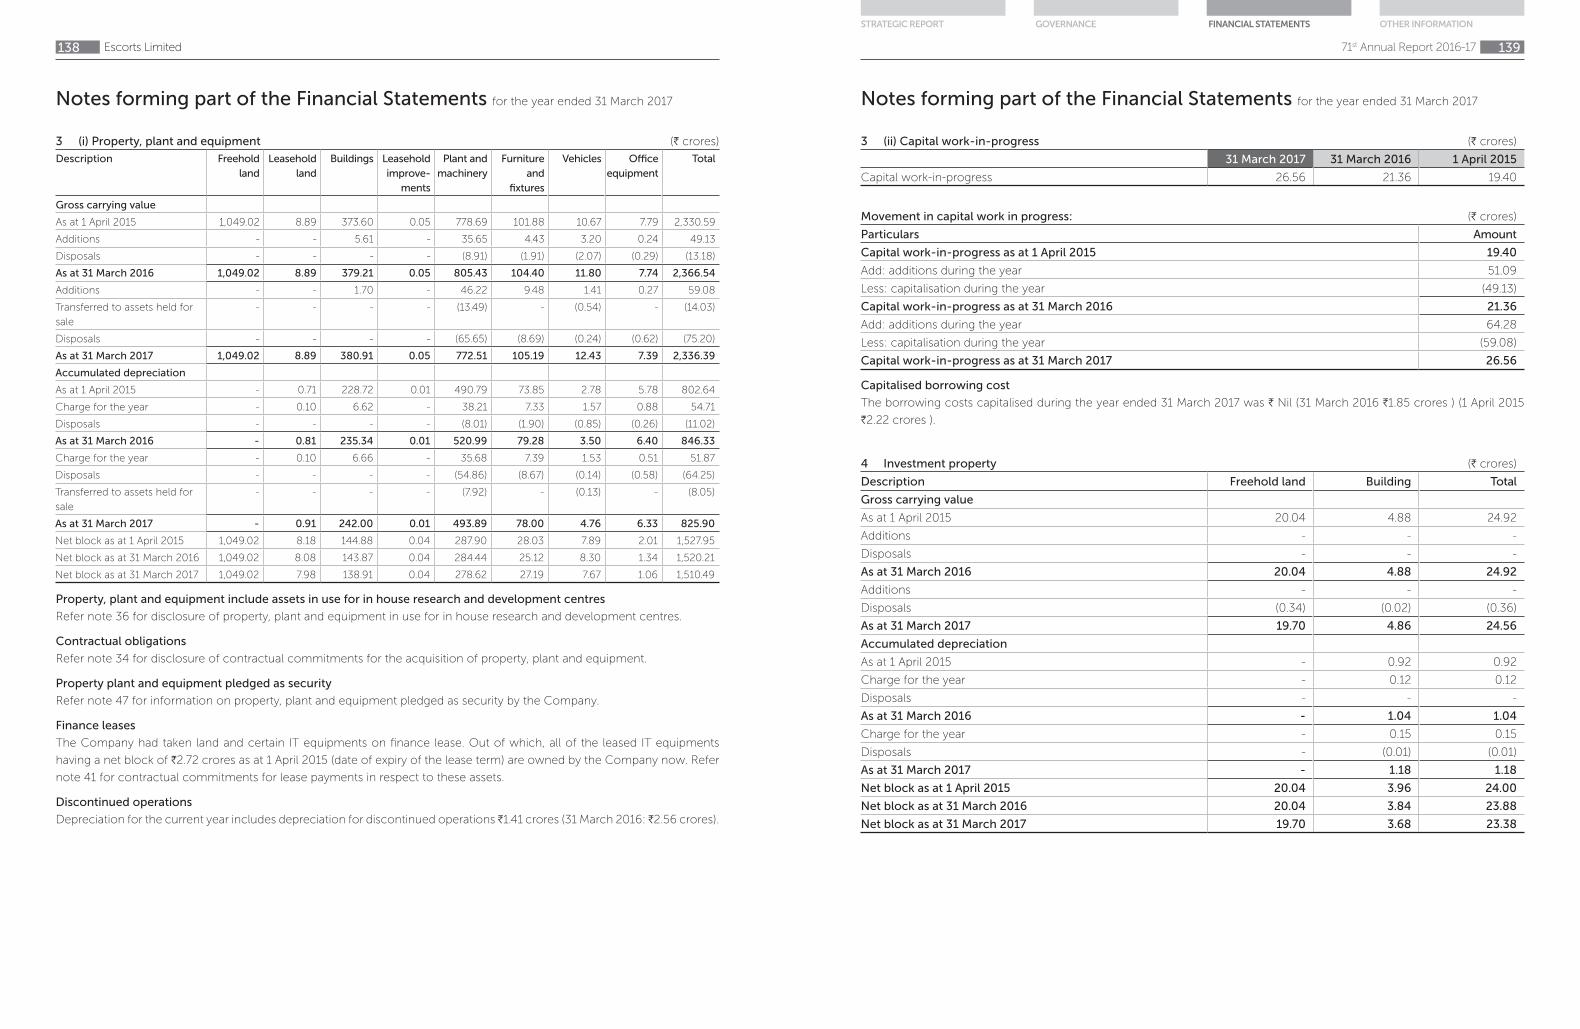
Notes forming part of the Financial Statements for the year ended 31 March 2017
Escorts Limited138
3 (i) Property, plant and equipment (H crores)
Description Freehold
land
Leasehold
land
Buildings Leasehold
improve-
ments
Plant and
machinery
Furniture
and
fixtures
Vehicles Office
equipment
Total
Gross carrying value
As at 1 April 2015 1,049.02 8.89 373.60 0.05 778.69 101.88 10.67 7.79 2,330.59
Additions - - 5.61 - 35.65 4.43 3.20 0.24 49.13
Disposals - - - - (8.91) (1.91) (2.07) (0.29) (13.18)
As at 31 March 2016 1,049.02 8.89 379.21 0.05 805.43 104.40 11.80 7.74 2,366.54
Additions - - 1.70 - 46.22 9.48 1.41 0.27 59.08
Transferred to assets held for
sale
- - - - (13.49) - (0.54) - (14.03)
Disposals - - - - (65.65) (8.69) (0.24) (0.62) (75.20)
As at 31 March 2017 1,049.02 8.89 380.91 0.05 772.51 105.19 12.43 7.39 2,336.39
Accumulated depreciation
As at 1 April 2015 - 0.71 228.72 0.01 490.79 73.85 2.78 5.78 802.64
Charge for the year - 0.10 6.62 - 38.21 7.33 1.57 0.88 54.71
Disposals - - - - (8.01) (1.90) (0.85) (0.26) (11.02)
As at 31 March 2016 - 0.81 235.34 0.01 520.99 79.28 3.50 6.40 846.33
Charge for the year - 0.10 6.66 - 35.68 7.39 1.53 0.51 51.87
Disposals - - - - (54.86) (8.67) (0.14) (0.58) (64.25)
Transferred to assets held for
sale
- - - - (7.92) - (0.13) - (8.05)
As at 31 March 2017 - 0.91 242.00 0.01 493.89 78.00 4.76 6.33 825.90
Net block as at 1 April 2015 1,049.02 8.18 144.88 0.04 287.90 28.03 7.89 2.01 1,527.95
Net block as at 31 March 2016 1,049.02 8.08 143.87 0.04 284.44 25.12 8.30 1.34 1,520.21
Net block as at 31 March 2017 1,049.02 7.98 138.91 0.04 278.62 27.19 7.67 1.06 1,510.49
Property, plant and equipment include assets in use for in house research and development centres
Refer note 36 for disclosure of property, plant and equipment in use for in house research and development centres.
Contractual obligations
Refer note 34 for disclosure of contractual commitments for the acquisition of property, plant and equipment.
Property plant and equipment pledged as security
Refer note 47 for information on property, plant and equipment pledged as security by the Company.
Finance leases
The Company had taken land and certain IT equipments on finance lease. Out of which, all of the leased IT equipments
having a net block of H2.72 crores as at 1 April 2015 (date of expiry of the lease term) are owned by the Company now. Refer
note 41 for contractual commitments for lease payments in respect to these assets.
Discontinued operations
Depreciation for the current year includes depreciation for discontinued operations H1.41 crores (31 March 2016: H2.56 crores).
Notes forming part of the Financial Statements for the year ended 31 March 2017
71st Annual Report 2016-17 139
STRATEGIC REPORT GOVERNANCE FINANCIAL STATEMENTS OTHER INFORMATION
3 (ii) Capital work-in-progress (H crores)
31 March 2017 31 March 2016 1 April 2015
Capital work-in-progress 26.56 21.36 19.40
Movement in capital work in progress: (H crores)
Particulars Amount
Capital work-in-progress as at 1 April 2015 19.40
Add: additions during the year 51.09
Less: capitalisation during the year (49.13)
Capital work-in-progress as at 31 March 2016 21.36
Add: additions during the year 64.28
Less: capitalisation during the year (59.08)
Capital work-in-progress as at 31 March 2017 26.56
Capitalised borrowing cost
The borrowing costs capitalised during the year ended 31 March 2017 was H Nil (31 March 2016 H1.85 crores ) (1 April 2015
H2.22 crores ).
4 Investment property (H crores)
Description Freehold land Building Total
Gross carrying value
As at 1 April 2015 20.04 4.88 24.92
Additions - - -
Disposals - - -
As at 31 March 2016 20.04 4.88 24.92
Additions - - -
Disposals (0.34) (0.02) (0.36)
As at 31 March 2017 19.70 4.86 24.56
Accumulated depreciation
As at 1 April 2015 - 0.92 0.92
Charge for the year - 0.12 0.12
Disposals - - -
As at 31 March 2016 - 1.04 1.04
Charge for the year - 0.15 0.15
Disposals - (0.01) (0.01)
As at 31 March 2017 - 1.18 1.18
Net block as at 1 April 2015 20.04 3.96 24.00
Net block as at 31 March 2016 20.04 3.84 23.88
Net block as at 31 March 2017 19.70 3.68 23.38

Notes forming part of the Financial Statements for the year ended 31 March 2017
Escorts Limited140
4 Investment property (contd.)
(i) Amount recognised in profit and loss for investment property
(H crores)
31 March 2017 31 March 2016
Rental income 0.36 0.36
Direct operating expenses that generated rental income 0.21 0.11
Direct operating expenses that did not generate rental income - -
Profit from leasing of investment properties 0.15 0.25
(ii) Leasing arrangements
Certain investment properties are leased to tenants under long-term operating leases with rentals payable monthly.
However all the leases are cancellable at the option of lessee, hence there is no lease disclosure as required by Ind AS 17
“Leases”.
(iii) Fair value of investment property
(H crores)
Particulars 31 March 2017 31 March 2016 1 April 2015
Fair value 23.75 33.87 39.36
The Company obtains independent valuations for its investment property annually. The best evidence of fair value is
current prices in an active market for similar properties.
Where such information is not available, the independent valuer consider information from a variety of sources including:
a) In case of valuation of land, current prices in an active market for similar properties of the same area and localities
have been taken. The rates of which are based on verbal enquiries from the property dealers of the areas and
localities;
b) In case of constructed building, rates derived from CPWD/CWC PARS as on 01-10-2010-12/1997 have been taken as
the basis of valuation.
These rates have further been modified to bring them at par with the present day price index and as per specifications
found at site. Necessary depreciation for age and life of the structure has been taken into account. Where the work is not
covered under any of the standard specifications the rates have been assessed as on the date of valuations.
5 (i) Intangible assets (H crores)
Description Prototypes Technical
know how
Software Total
Gross carrying value
As at 1 April 2015 3.07 7.73 30.42 41.22
Additions - 3.79 0.72 4.51
Disposals - - (1.00) (1.00)
As at 31 March 2016 3.07 11.52 30.14 44.73
Additions 28.49 6.34 6.42 41.25
Disposals - - (0.31) (0.31)
As at 31 March 2017 31.56 17.86 36.25 85.67
Notes forming part of the Financial Statements for the year ended 31 March 2017
71st Annual Report 2016-17 141
STRATEGIC REPORT GOVERNANCE FINANCIAL STATEMENTS OTHER INFORMATION
Contractual obligations
Refer note 34 for disclosure of contractual commitments for the acquisition of intangible assets.
Intangible assets include assets in use for in house Research and Development Centers
Refer note 36 for disclosure of intangible assets in use for in house Research and Development Centers.
Discontinued operations
Amortisation for the current year includes amortisation for discontinued operations H0.03 crores (31 March 2016: H0.05
crores).
5 (ii) Intangible assets under development (H crores)
31 March 2017 31 March 2016 1 April 2015
Intangible assets under development 8.14 36.83 36.07
Movement in intangible assets under development : (H crores)
Particulars Amount
Intangible assets under development as at 1 April 2015 36.07
Add: additions during the year 5.27
Less: capitalisation during the year (4.51)
Intangible assets under development as at 31 March 2016 36.83
Add: additions during the year 12.56
Less: capitalisation during the year (41.25)
Intangible assets under development as at 31 March 2017 8.14
5 (i) Intangible assets (H crores)
Description Prototypes Technical
know how
Software Total
Accumulated depreciation
As at 1 April 2015 2.10 6.91 16.23 25.24
Charge for the year 0.62 0.29 4.37 5.28
Disposals - - (1.00) (1.00)
As at 31 March 2016 2.72 7.20 19.60 29.52
Charge for the year 6.28 1.73 4.47 12.48
Disposals - - (0.22) (0.22)
As at 31 March 2017 9.00 8.93 23.85 41.78
Net block as at 1 April 2015 0.97 0.82 14.19 15.98
Net block as at 31 March 2016 0.35 4.32 10.54 15.21
Net block as at 31 March 2017 22.56 8.93 12.40 43.89
(contd.)

Notes forming part of the Financial Statements for the year ended 31 March 2017
Escorts Limited142
Non-current investments (H crores)
31 March 2017 31 March 2016 1 April 2015
In equity instruments*
Subsidiaries (quoted)
Escorts Finance Limited 3.12 3.12 3.12
3.12 3.12 3.12
Subsidiaries (unquoted)
Escorts Assets Management Limited 3.00 3.00 3.00
Escorts Securities Limited 1.96 1.96 1.96
Farmtrac Tractors Europe SP zoo, Poland (face value of 1000
PLN each)
8.35 8.35 8.35
EDDAL Credit Limited 0.05 0.05 0.05
Sole beneficiary interest in Escorts Benefit and Welfare Trust 358.93 358.93 358.93
372.29 372.29 372.29
Joint ventures and associates (unquoted)
Escorts Consumer Credit Limited 1.00 1.00 1.00
Adico Escorts Agri Equipment Private Limited 6.00 6.00 -
7.00 7.00 1.00
6 Investments
(i) Investments - Non-current (H crores)
As at
31 March 2017
As at
31 March 2016
As at
1 April 2015
Investment carried at cost
Subsidiary companies
Fully paid equity shares (quoted) 3.12 3.12 3.12
Fully paid equity shares (unquoted) 372.29 372.29 372.29
Joint ventures and associates
Fully paid equity shares (unquoted) 7.00 7.00 1.00
Investment carried at fair value through OCI
Fully paid equity shares (quoted) 0.52 0.42 0.44
Fully paid equity shares (unquoted) 35.73 28.07 24.98
418.66 410.90 401.83
The market value of quoted investments are: 5.26 1.92 2.03
(ii) Investments - Current (H crores)
As at
31 March 2017
As at
31 March 2016
As at
1 April 2015
Investment carried at fair value through profit or loss
Mutual funds (quoted) 168.79 4.61 4.17
Bonds (unquoted) 0.01 0.01 0.01
168.80 4.62 4.18
The market value of quoted investments is equal to the carrying value.
Details of investment is as follows:
Notes forming part of the Financial Statements for the year ended 31 March 2017
71st Annual Report 2016-17 143
STRATEGIC REPORT GOVERNANCE FINANCIAL STATEMENTS OTHER INFORMATION
Current investments (H crores)
31 March 2017 31 March 2016 1 April 2015
Mutual funds and others (quoted)
Birla Sun Life Corporate Bond Fund (Direct) (Growth) 0.81 - -
Birla Sun Life Dynamic Bond Fund (Growth) 2.70 2.45 2.28
Birla Sun Life Dynamic Bond Fund (Direct) (Growth) 24.62 - -
Birla Sun Life Medium Term Plan (Regular) (Growth) 0.05 - -
Birla Sun Life Medium Term Plan (Direct) (Growth) 37.60 - -
Fidelity Short Term Income Fund (Growth) - 0.72 -
HDFC Medium Term Opportunities (Direct) (Growth) 21.26 - -
ICICI Prudential Income Opportunities (Direct) (Growth) 37.52 - -
IDFC SSIF Short Term Plan (Growth) - 1.44 1.89
Kotak Medium Term Fund (Direct) (Growth) 20.37 - -
UTI Short Term Income Fund (Direct) (Growth) 23.86 - -
168.79 4.61 4.17
Bonds (unquoted)
ICICI deep discount bonds 0.01 0.01 0.01
0.01 0.01 0.01
Total 168.80 4.62 4.18
6 Investments (contd.)
Non-current investments (H crores)
31 March 2017 31 March 2016 1 April 2015
Others (quoted)
Asahi India Glass Limited (face value of H1 each) 0.41 0.30 0.27
Godavari Drugs Limited 0.07 0.07 0.11
Twenty First Century Medicare Limited 0.04 0.05 0.07
0.52 0.42 0.45
Others (unquoted)
Escorts Skill Development^ - - -
Hughes Communications India Limited. 34.47 27.16 24.16
Escorts Motors Limited 1.26 0.92 0.82
35.73 28.08 24.98
*All equity shares are of H10 each unless otherwise stated.
^Amount less than a lac

Notes forming part of the Financial Statements for the year ended 31 March 2017
Escorts Limited144
7 Loans
(i) Non-current loans (H crores)
As at
31 March 2017
As at
31 March 2016
As at
1 April 2015
Unsecured, considered good
Security deposits 4.17 4.17 4.95
4.17 4.17 4.95
(ii) Current loans (H crores)
As at
31 March 2017
As at
31 March 2016
As at
1 April 2015
Unsecured, considered good
Security deposits 4.50 4.12 2.79
4.50 4.12 2.79
Refer note 37 - Financial instruments for disclosure of fair values in respect of financial assets measured at amortised cost and
assessment of expected credit losses
8 Other financial assets
(i) Non-current financial assets (H crores)
As at
31 March 2017
As at
31 March 2016
As at
1 April 2015
Advances to related parties 2.93 2.93 2.93
2.93 2.93 2.93
Allowance for doubtful advances (2.93) (2.93) (2.93)
- - -
(ii) Current financial assets (H crores)
As at
31 March 2017
As at
31 March 2016
As at
1 April 2015
Export incentives receivable 4.85 3.94 4.31
Claims receivable 2.50 3.53 3.03
Other recoverable (refer note 48 for related party advances) 3.72 3.45 1.57
11.07 10.92 8.91
Refer note 37 - Financial instruments for disclosure of fair values in respect of financial assets measured at amortised cost and
assessment of expected credit losses
Notes forming part of the Financial Statements for the year ended 31 March 2017
71st Annual Report 2016-17 145
STRATEGIC REPORT GOVERNANCE FINANCIAL STATEMENTS OTHER INFORMATION
9 Income taxes
The income tax expense consists of the following: (H crores)
Year ended
31 March 2017
Year ended
31 March 2016
Current tax
Current tax expense for current year 74.51 24.37
Current tax expense / (benefit) pertaining to prior periods 7.24 (2.76)
81.75 21.61
Deferred tax expense / (benefit) (6.15) (9.11)
Total income tax expense recognised in the current year for continuing operations 75.60 12.50
Tax expense of discontinued operations (17.75) (8.99)
Total income tax expense 57.85 3.51
(i) The reconciliation of estimated income tax expense at statutory income tax rate to income tax expense reported in
statement of profit and loss is as follows:
(H crores)
Year ended
31 March 2017
Year ended
31 March 2016
Profit before income tax from continuing and discontinued operations 218.29 87.26
Statutory income tax rate 34.61% 34.61%
Expected income tax expense 75.55 30.20
Tax effect of adjustment to reconcile expected income tax expense to
reported income tax expense
Income exempted from tax (5.19) (0.15)
Tax on expense not eligible for deduction 1.62 7.88
Weighted and standard deduction under Income Tax Act,1961 (18.98) (20.68)
Tax pertaining to prior years 7.24 (2.76)
Changes in deferred tax and MAT credit entitlement due to assessments - (9.66)
Others (2.39) (1.32)
Total income tax expense 57.85 3.51
(ii) (a) Significant components of net deferred tax assets and liabilities for the year ended 31 March 2017 are as follows:
(H crores)
Opening balance Recognised /
reversed through
profit and loss
Recognised /
reversed from
OCI/equity
Closing balance
Deferred tax assets/(liabilities)
in relation to:
Property, plant and equipment,
investment property and intangible assets
(80.26) 1.27 - (78.99)
Receivables, financial assets and
liabilities at amortised cost
29.25 7.10 - 36.35
Provision for employee and others
liabilities deductible on actual payment
31.56 (0.91) 0.91 31.56
MAT credit entitlement 63.43 - - 63.43
Unrealised gain on investment carried
at fair value
(3.10) (1.31) (0.89) (5.31)
Net deferred tax assets/(liabilities) 40.88 6.15 0.02 47.04

Notes forming part of the Financial Statements for the year ended 31 March 2017
Escorts Limited146
(ii) (b) Significant components of net deferred tax assets and liabilities for the year ended 31 March 2016 are as follows:
(H crores)
Opening balance Recognised /
reversed through
profit and loss
Recognised /
reversed from
OCI/equity
Closing balance
Deferred tax assets/(liabilities) in
relation to:
Property, plant and equipment,
investment property and intangible assets
(81.91) 1.65 - (80.26)
Receivables, financial assets and
liabilities at amortised cost
38.70 (9.45) - 29.25
Provision for employee and others
liabilities deductible on actual payment
33.24 (1.46) (0.22) 31.56
MAT credit entitlement 45.09 18.34 - 63.43
Unrealised gain on investment carried
at fair value
(2.77) 0.03 (0.36) (3.10)
Net deferred tax assets/(liabilities) 32.35 9.11 (0.58) 40.88
9 Income taxes (contd.)
(iii) Unused tax losses and credits
(a) Minimum alternate tax
The Company had unused MAT credit amounting to H63.43 crores as at 31 March 2017 (31 March 2016: H63.43
crores) (1 April 2015: H45.09 crores). Such tax credits have been recognised on the basis that recovery is probable
in the foreseeable future. This recognised MAT credit expires, if unutilized, based on the year of origination as
follows:
Financial year ending (H crores)
31 March 2019 2.96
31 March 2020 0.93
31 March 2021 15.67
31 March 2022 9.34
31 March 2023 19.05
31 March 2024 4.84
31 March 2025 1.67
31 March 2026 8.97
63.43
(b) Capital losses
The Company has not recognised deferred tax of H13.23 crores on unused losses under the head Capital Gains as the
Company is not likely to generate taxable income under the same head in foreseeable future. The significant portion
of these losses will expire in financial year ending 31 March 2019.
Notes forming part of the Financial Statements for the year ended 31 March 2017
71st Annual Report 2016-17 147
STRATEGIC REPORT GOVERNANCE FINANCIAL STATEMENTS OTHER INFORMATION
10 Other assets
(i) Other non-current assets (H crores)
As at
31 March 2017
As at
31 March 2016
As at
1 April 2015
Prepaid expenses 0.12 0.04 0.09
Capital advances 7.35 5.76 8.47
Deposits with statutory authorities 7.40 6.33 4.08
14.87 12.13 12.64
Allowance for doubtful advances (1.51) (0.89) (0.73)
13.36 11.24 11.91
(ii) Other current assets (H crores)
As at
31 March 2017
As at
31 March 2016
As at
1 April 2015
Advances recoverable in kind 22.94 20.43 18.47
Advances to suppliers 16.34 8.13 24.45
Prepaid expenses 7.43 8.02 6.37
Balances with statutory authorities 81.60 107.46 142.68
128.31 144.04 191.97
Allowance for doubtful advances (25.98) (41.67) (40.10)
102.33 102.37 151.87
11 Inventories (H crores)
As at
31 March 2017
As at
31 March 2016
As at
1 April 2015
Raw materials and components 159.79 153.07 213.64
Goods-in-transit 3.03 0.72 0.46
Allowance for obsolete and slow moving (13.86) (10.53) (41.13)
148.96 143.26 172.97
Work-in-progress 35.16 35.25 36.73
Finished goods 142.45 122.42 134.57
Goods-in-transit 22.34 19.42 5.94
Allowance for obsolete and slow moving (0.92) (0.92) (1.02)
163.87 140.92 139.49
Stock-in-trade 68.88 58.55 53.59
Goods-in-transit 1.94 0.39 0.36
Allowance for obsolete and slow moving (11.43) (12.53) (16.96)
59.39 46.41 36.99
Stores and spares 13.26 20.59 25.13
Loose tools 8.84 10.55 13.64
Allowance for obsolete and slow moving - - (1.59)
8.84 10.55 12.05
429.48 396.98 423.36
Inventories have been pledged as security for liabilities, for details refer note 18 and 47.

Notes forming part of the Financial Statements for the year ended 31 March 2017
Escorts Limited148
12 Trade receivables (H crores)
As at
31 March 2017
As at
31 March 2016
As at
1 April 2015
Secured : considered good 52.40 39.02 32.94
Unsecured : considered good 420.25 366.83 360.21
: considered doubtful 42.84 49.01 63.95
515.49 454.86 457.10
Allowance for doubtful receivables
Unsecured : considered good (expected credit loss) (14.63) (15.78) (20.25)
: considered doubtful (42.84) (49.01) (63.95)
(57.47) (64.79) (84.20)
458.02 390.07 372.90
(i) Trade receivables have been pledged as security for liabilities, for details refer note 18 and 47.
(ii) Refer note 37 - Financial instruments for disclosure of fair values in respect of financial assets measured at amortised cost
and assessment of expected credit losses.
13 Cash and cash equivalents (H crores)
As at
31 March 2017
As at
31 March 2016
As at
1 April 2015
Balances with banks in current accounts 38.70 28.40 26.51
Cheques / drafts in hand 15.00 0.12 -
Cash on hand 0.31 0.23 0.32
Debit balance of cash credit accounts 0.50 2.51 3.04
Bank deposits with maturity less than 3 months - - 22.00
54.51 31.26 51.87
In accordance with the MCA notification G.S.R 308(E) dated March 30, 2017 details of Specified Bank Notes (SBN) and Other
Denomination Notes (ODN) held and transacted during the period from November 8, 2016 to December 30, 2016, is given
below:
(H)
Particulars SBNs ODN Total
Closing cash in hand as on November 8, 2016 45,27,500 1,94,844 47,22,344
(+) Permitted receipts - 4,28,249 4,28,249
(-) Permitted payments - (1,07,820 ) (1,07,820)
(-) Amount deposited in banks (45,27,500) - (45,27,500)
(+) Amount drawn from banks - 11,38,000 11,38,000
Closing cash in hand as on December 30, 2016 - 16,53,273 16,53,273
Notes forming part of the Financial Statements for the year ended 31 March 2017
71st Annual Report 2016-17 149
STRATEGIC REPORT GOVERNANCE FINANCIAL STATEMENTS OTHER INFORMATION
14 Other bank balances (H crores)
As at
31 March 2017
As at
31 March 2016
As at
1 April 2015
Earmarked bank balances 1.15 1.16 1.02
Fixed deposits maturity for more than 3 months but less than 12
months
44.56 96.66 67.04
Margin money deposits 0.42 0.40 11.20
Escrow account 127.76 120.14 111.63
173.89 218.36 190.89
(i) Earmarked balances with banks significantly pertains to unclaimed dividends.
(ii) H17.80 crores (31 March 2016: H27 crores), (1 April 2015: H Nil) representing deposits with original maturity for more than
3 months but less than 12 months, held by the entity that are not available for use by the Company, as these are pledged
against loans.
(iii) H0.10 crores (31 March 2016: H0.13 crores), (1 April 2015: H0.11 crore) representing margin money pledged with various
authorities.
(iv) There are no repatriation restrictions with respect to cash and bank balances as at the end of the reporting period and
prior periods
15 Assets held for sale (H crores)
As at
31 March 2017
As at
31 March 2016
As at
1 April 2015
Assets held for sale 14.86 9.00 9.00
14.86 9.00 9.00
Particulars
Land 9.00 9.00 9.00
Helicopter 5.57 - -
Vehicle 0.29 - -
Total 14.86 9.00 9.00
(i) The Company has executed an agreement to sell, for transfer of 25 acres of land at Plot No. 219, Sector 58, Balabhgarh,
Haryana for a consideration of H9.00 crores. The said transfer is subject to necessary approval from HUDA and accordingly
the consideration amount of H9.00 crores is being classified in other current liabilities.
(ii) The Company has executed an aircraft purchase and sale agreement for transfer of its Bell 407 helicopter for a
consideration of H8.75 crores. The said transfer is subject to deregistration from Indian Civil Aviation Authority. An advance
of H2.5 crores is being classified in other current liabilities.
(iii) The Company has executed a sale agreement for transfer of a vehicle for a consideration of H0.29 crores.
Non-recurring fair value measurements
Asset classified as held for sale during the reporting period was measured at the lower of its carrying amount and fair value
less costs to sell at the time of re-classification, resulting in the recognition of a total write down of H0.76 crores as impairment
loss in retained earnings and statement of profit and loss . This is Level 3 measurement as per fair value hierarchy set out in
fair value measurement disclosure (refer note 37).

Notes forming part of the Financial Statements for the year ended 31 March 2017
Escorts Limited150
16 Equity share capital (H crores)
As at
31 March 2017
As at
31 March 2016
As at
1 April 2015
Authorised
40,10,00,000 (previous year 40,10,00,000) equity shares of H10
each
401.00 401.00 401.00
88,80,00,000 (previous year 88,80,00,000) unclassified shares
of H10 each
888.00 888.00 888.00
1,289.00 1,289.00 1,289.00
Issued, Subscribed and Fully paid-up
12,25,76,878 (previous year 12,25,76,878) equity shares of H10
each
122.58 122.58 122.58
122.58 122.58 122.58
(a) Reconciliation of number of shares
As at 31 March 2017 As at 31 March 2016
No of shares H crores No of shares H crores
Equity shares at the beginning of the year 12,25,76,878 122.58 12,25,76,878 122.58
Changes during the year - - - -
Equity shares at the end of the year 12,25,76,878 122.58 12,25,76,878 122.58
(c) Details of shareholders holding more than 5% shares in the company
As at 31 March 2017 As at 31 March 2016
No of shares % holding No of shares % holding
Escorts Benefit and Welfare Trust 3,73,00,031 30.43 3,73,00,031 30.43
Harprasad and Company Private Limited 1,05,26,308 8.59 1,05,26,308 8.59
Jhunjhunwala Rakesh Radheyshyam 1,12,25,000 9.16 1,12,25,000 9.16
(d) Aggregate number of shares issued for consideration other than cash and shares bought back during the period of
five years immediately preceding the date 31 March 2017
As at
31 March 2017
As at
31 March 2016
As at
1 April 2015
No of shares No of shares No of shares
Equity shares allotted as fully paid pursuant to
consideration other than cash
1,69,58,842 1,69,58,842 2,82,55,770
In addition, the Company has issued total 5,10,000 (31 March 2016: 4,26,000) equity shares to employees (through
Escorts Employees Benefit and Welfare Trust) on exercise of option granted under the Employee Stock Option Scheme
2006, wherein part consideration was received in form of employee services.
(b) Rights/preferences/restrictions attached to equity shares
The Company has only one class of shares, i.e., equity shares having a face value of H10 per share. Each holder of
equity shares is entitled to one vote per share. Dividend is paid in Indian Rupees. The final dividend @ H1.50 per share,
recommended by the Board of Directors is subject to the approval of the shareholders at the ensuing Annual General
Meeting. In the event of liquidation of the Company, equity shareholders will be entitled to receive remaining assets of
the Company after distribution of all preferential amounts. The distribution will be in proportion to the number of equity
shares held by the shareholders.
Notes forming part of the Financial Statements for the year ended 31 March 2017
71st Annual Report 2016-17 151
STRATEGIC REPORT GOVERNANCE FINANCIAL STATEMENTS OTHER INFORMATION
17 Other equity (H crores)
As at
31 March 2017
As at
31 March 2016
Capital reserve 97.40 97.40
Capital redemption reserve 4.00 4.00
General reserve 513.86 513.86
Securities premium reserve
Opening balance 456.57 456.54
Transferred from Employee's stock option outstanding account 0.02 0.03
456.59 456.57
Employee stock option outstanding account
Opening balance 0.07 0.05
Charge for the year 0.05 0.05
Transferred to Securities premium reserve on exercise of options (0.02) (0.03)
0.10 0.07
Treasury shares
Opening balance (26.92) (27.83)
Changes during the year 0.70 0.91
(26.22) (26.92)
Retained earnings
Opening balance 647.69 576.75
Net profit for the year 160.44 83.75
Equity dividend (during FY 2016-17: H1.20 per share paid for FY 2015-16) (during FY
2015-16: H1.20 per share paid for FY 2014-15)
(14.35) (14.30)
Tax on equity dividend (2.99) (2.99)
Dividend received on shares held by Escorts Benefit and Welfare Trust [refer note 45] 4.48 4.48
795.27 647.69
Other comprehensive income, net of tax
Equity instruments classified as fair value through other comprehensive income
Opening balance 22.00 19.29
Changes during the year 6.87 2.71
28.87 22.00
Re-measurements of defined employee benefit plans
Opening balance 0.43 -
Changes during the year (1.72) 0.43
(1.29) 0.43
1,868.58 1,715.10
(e) Shares reserved for issue under options
As at
31 March 2017
As at
31 March 2016
As at
1 April 2015
No of shares No of shares No of shares
Under the Employee Stock Option Plan (ESOP) 2006,
equity shares of H10 each, at an excercise price of H85 per
share
31,01,612 31,85,612 32,93,612
For terms and other details refer note 40
16 Equity share capital (contd.)

Notes forming part of the Financial Statements for the year ended 31 March 2017
Escorts Limited152
17 Other equity (contd.)
Nature and purpose of other reserves
Securities premium reserve
Securities premium reserve represents premium received on issue of shares. The reserve is utilised in accordance with the
provisions of the Companies Act.
Employee's stock options outstanding account
The account is used to recognise the grant date value of options issued to employees under Employee stock option plan.
Capital redemption reserve
This reserve represents reserve created on redemption of preference shares. The reserve is utilised in accordance with the
provisions of the Companies Act.
Capital reserve
This reserve represents the excess of net assets taken, over the cost of consideration paid at the time of amalgamation done
previously. This reserve is not available for the distribution to the shareholders.
Treasury shares
This reserve represents Company's own equity shares held by the Escorts Employee Benefit and Welfare Trust which is
created under the Employee Stock Option Plan.
General reserve
The Company has transferred a portion of the net profit before declaring dividend to general reserve pursuant to the earlier
provsion of Companies Act 1956. Mandatory transfer to general reserve is not required under the Companies Act 2013
Other comprehensive income (OCI) reserve
(i) The Company has elected to recognise changes in the fair value of certain investments in equity securities in other
comprehensive income. These changes are accumulated within the FVOCI equity investments reserve within equity. The
Company transfers amounts from this reserve to retained earnings when the relevant equity securities are derecognised.
(ii) The Company has recognised remeasurements benefits on defined benefits plans through other comprehensive
income.
18 Borrowings
(i) Non-Current (H crores)
As at
31 March 2017
As at
31 March 2016
As at
1 April 2015
Secured
Term loans from banks 55.80 87.31 105.32
Other loans from financial institutions 0.33 0.03 0.18
Finance lease obligations 0.12 0.12 0.12
56.25 87.46 105.62
(a) Security and other details: (H crores)
31 March 2017 31 March 2016 1 April 2015
Total long term borrowings 56.25 87.46 105.62
Current maturities of long-term borrowings (refer note 19) 47.54 52.84 71.90
Current maturities of finance lease obligation (refer note 19) - - 0.33
103.79 140.30 177.85
Notes forming part of the Financial Statements for the year ended 31 March 2017
71st Annual Report 2016-17 153
STRATEGIC REPORT GOVERNANCE FINANCIAL STATEMENTS OTHER INFORMATION
Rate of interest - The Company’s borrowings from banks are at an effective weighted average rate of 10.80% (31 March
2016: 11.75%) (1 April 2015: 12.45%)
(H crores)
31 March 2017 31 March 2016 1 April 2015
(i) Term loan from State bank of India is secured by
exclusive first charge on the plant and machinery/
equipment acquired/to be acquired out of the said term
loan and the same is repaid till 30 September 2016
- 2.75 10.15
(ii) Term loan from Punjab national bank is secured by
exclusive charge on land and building and hypothecation
of plant and other assets of Escorts construction
equipment division excluding plant and machinery
specifically charged to other term lenders and the same
is repaid till 30 June 2015.
- - 3.57
(iii) Term loan from Industrial development bank of India is
secured by first charge by way of equitable mortgage of
freehold immovable property being a part of site no.2,
sector-13, Faridabad. The same is repayable in equal
quarterly installments till 1 July 2018.
52.50 80.00 95.00
(iv) Term loan from Oriental bank of commerce is secured
by first charge by way of equitable mortgage of freehold
immovable property being a part of site no.2, sector-13,
Faridabad. The same is repayable in equal quarterly
installments till 31 May 2016.
- 15.00 45.00
(v) Term loan from Oriental bank of commerce is secured
by exclusive first charge on the plant and machinery
acquired/to be acquired out of the said term loan
collaterised by first charge by way of equitable mortgage
of freehold immovable property being a part of site
no.2, sector-13, Faridabad. The same is repayable till 30
November 2016.
- 7.62 21.58
(vi) Term loan from State bank of India is secured by exclusive
first charge on the plant and machinery acquired/to be
acquired out of the said term loan and exclusive charge
by way of equitable mortgage of freehold immovable
property being a part of site no.2, sector-13, Faridabad.
The same is repayable in equal quarterly installments
after a moratorium of 24 months from the first date of
disbursement.
50.89 35.00 -
(vii) Finance lease obligations are secured by the
hypothecation of assets financed. Refer note 41 for
repayment schedule for these obligations.
0.12 0.12 0.45
(viii) These loans are secured by the hypothecation of
respective equipments and vehicles and are repayable
in equal monthly installments.
0.45 0.19 2.77
Less: Adjustment for processing fees on long term loans
recognised using effective interest rate
(0.17) (0.38) (0.67)
103.79 140.30 177.85
(b) Refer note 37 - Financial instruments for disclosure of fair values in respect of financial liabilities measured at amortised
cost and analysis of their maturity profiles.
18 Borrowings (contd.)
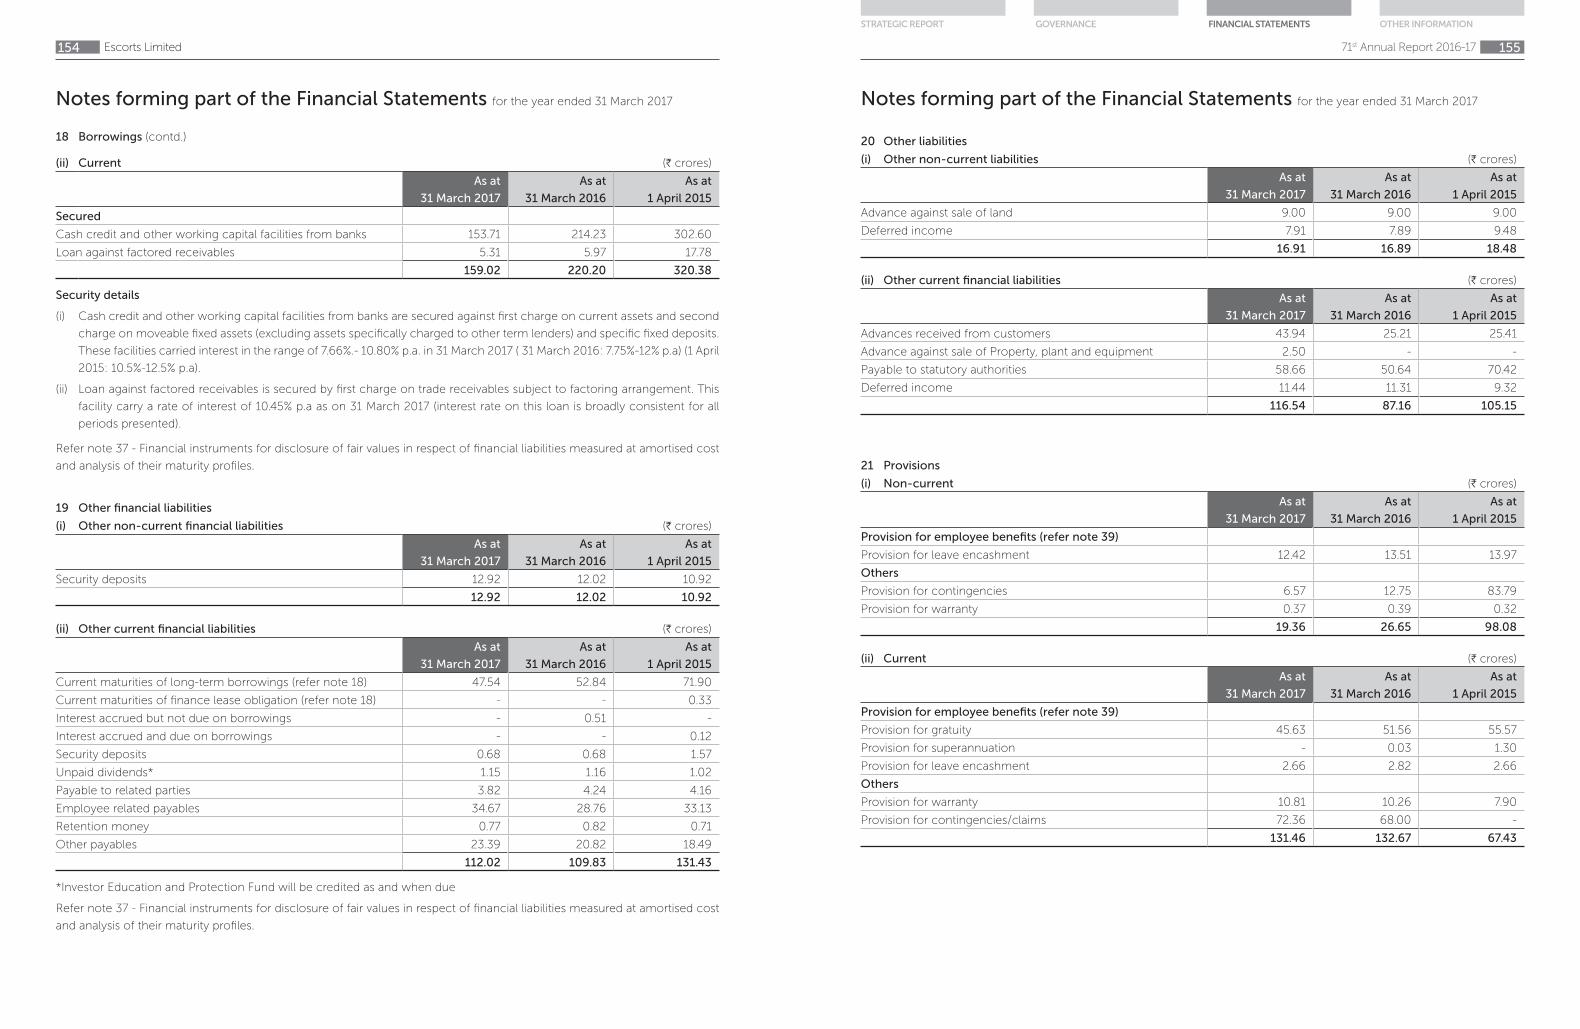
Notes forming part of the Financial Statements for the year ended 31 March 2017
Escorts Limited154
18 Borrowings (contd.)
(ii) Current (H crores)
As at
31 March 2017
As at
31 March 2016
As at
1 April 2015
Secured
Cash credit and other working capital facilities from banks 153.71 214.23 302.60
Loan against factored receivables 5.31 5.97 17.78
159.02 220.20 320.38
Security details
(i) Cash credit and other working capital facilities from banks are secured against first charge on current assets and second
charge on moveable fixed assets (excluding assets specifically charged to other term lenders) and specific fixed deposits.
These facilities carried interest in the range of 7.66%.- 10.80% p.a. in 31 March 2017 ( 31 March 2016: 7.75%-12% p.a) (1 April
2015: 10.5%-12.5% p.a).
(ii) Loan against factored receivables is secured by first charge on trade receivables subject to factoring arrangement. This
facility carry a rate of interest of 10.45% p.a as on 31 March 2017 (interest rate on this loan is broadly consistent for all
periods presented).
Refer note 37 - Financial instruments for disclosure of fair values in respect of financial liabilities measured at amortised cost
and analysis of their maturity profiles.
19 Other financial liabilities
(i) Other non-current financial liabilities (H crores)
As at
31 March 2017
As at
31 March 2016
As at
1 April 2015
Security deposits 12.92 12.02 10.92
12.92 12.02 10.92
(ii) Other current financial liabilities (H crores)
As at
31 March 2017
As at
31 March 2016
As at
1 April 2015
Current maturities of long-term borrowings (refer note 18) 47.54 52.84 71.90
Current maturities of finance lease obligation (refer note 18) - - 0.33
Interest accrued but not due on borrowings - 0.51 -
Interest accrued and due on borrowings - - 0.12
Security deposits 0.68 0.68 1.57
Unpaid dividends* 1.15 1.16 1.02
Payable to related parties 3.82 4.24 4.16
Employee related payables 34.67 28.76 33.13
Retention money 0.77 0.82 0.71
Other payables 23.39 20.82 18.49
112.02 109.83 131.43
*Investor Education and Protection Fund will be credited as and when due
Refer note 37 - Financial instruments for disclosure of fair values in respect of financial liabilities measured at amortised cost
and analysis of their maturity profiles.
Notes forming part of the Financial Statements for the year ended 31 March 2017
71st Annual Report 2016-17 155
STRATEGIC REPORT GOVERNANCE FINANCIAL STATEMENTS OTHER INFORMATION
20 Other liabilities
(i) Other non-current liabilities (H crores)
As at
31 March 2017
As at
31 March 2016
As at
1 April 2015
Advance against sale of land 9.00 9.00 9.00
Deferred income 7.91 7.89 9.48
16.91 16.89 18.48
(ii) Other current financial liabilities (H crores)
As at
31 March 2017
As at
31 March 2016
As at
1 April 2015
Advances received from customers 43.94 25.21 25.41
Advance against sale of Property, plant and equipment 2.50 - -
Payable to statutory authorities 58.66 50.64 70.42
Deferred income 11.44 11.31 9.32
116.54 87.16 105.15
21 Provisions
(i) Non-current (H crores)
As at
31 March 2017
As at
31 March 2016
As at
1 April 2015
Provision for employee benefits (refer note 39)
Provision for leave encashment 12.42 13.51 13.97
Others
Provision for contingencies 6.57 12.75 83.79
Provision for warranty 0.37 0.39 0.32
19.36 26.65 98.08
(ii) Current (H crores)
As at
31 March 2017
As at
31 March 2016
As at
1 April 2015
Provision for employee benefits (refer note 39)
Provision for gratuity 45.63 51.56 55.57
Provision for superannuation - 0.03 1.30
Provision for leave encashment 2.66 2.82 2.66
Others
Provision for warranty 10.81 10.26 7.90
Provision for contingencies/claims 72.36 68.00 -
131.46 132.67 67.43
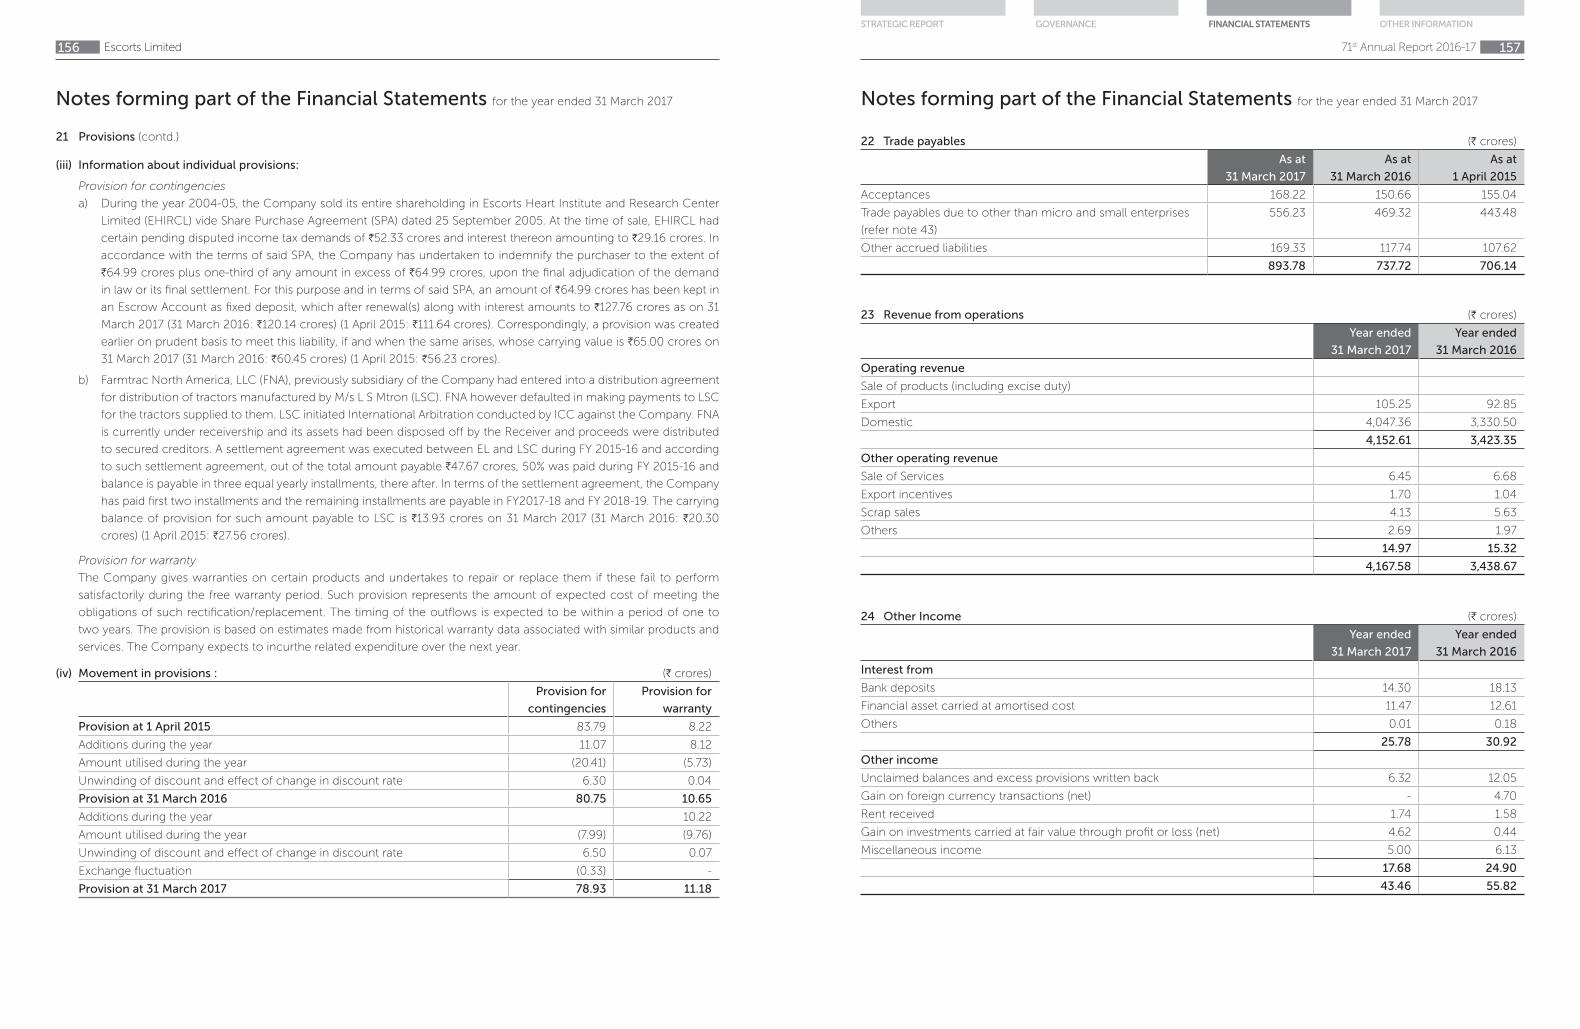
Notes forming part of the Financial Statements for the year ended 31 March 2017
Escorts Limited156
(iii) Information about individual provisions:
Provision for contingencies
a) During the year 2004-05, the Company sold its entire shareholding in Escorts Heart Institute and Research Center
Limited (EHIRCL) vide Share Purchase Agreement (SPA) dated 25 September 2005. At the time of sale, EHIRCL had
certain pending disputed income tax demands of H52.33 crores and interest thereon amounting to H29.16 crores. In
accordance with the terms of said SPA, the Company has undertaken to indemnify the purchaser to the extent of
H64.99 crores plus one-third of any amount in excess of H64.99 crores, upon the final adjudication of the demand
in law or its final settlement. For this purpose and in terms of said SPA, an amount of H64.99 crores has been kept in
an Escrow Account as fixed deposit, which after renewal(s) along with interest amounts to H127.76 crores as on 31
March 2017 (31 March 2016: H120.14 crores) (1 April 2015: H111.64 crores). Correspondingly, a provision was created
earlier on prudent basis to meet this liability, if and when the same arises, whose carrying value is H65.00 crores on
31 March 2017 (31 March 2016: H60.45 crores) (1 April 2015: H56.23 crores).
b) Farmtrac North America, LLC (FNA), previously subsidiary of the Company had entered into a distribution agreement
for distribution of tractors manufactured by M/s L S Mtron (LSC). FNA however defaulted in making payments to LSC
for the tractors supplied to them. LSC initiated International Arbitration conducted by ICC against the Company. FNA
is currently under receivership and its assets had been disposed off by the Receiver and proceeds were distributed
to secured creditors. A settlement agreement was executed between EL and LSC during FY 2015-16 and according
to such settlement agreement, out of the total amount payable H47.67 crores, 50% was paid during FY 2015-16 and
balance is payable in three equal yearly installments, there after. In terms of the settlement agreement, the Company
has paid first two installments and the remaining installments are payable in FY2017-18 and FY 2018-19. The carrying
balance of provision for such amount payable to LSC is H13.93 crores on 31 March 2017 (31 March 2016: H20.30
crores) (1 April 2015: H27.56 crores).
Provision for warranty
The Company gives warranties on certain products and undertakes to repair or replace them if these fail to perform
satisfactorily during the free warranty period. Such provision represents the amount of expected cost of meeting the
obligations of such rectification/replacement. The timing of the outflows is expected to be within a period of one to
two years. The provision is based on estimates made from historical warranty data associated with similar products and
services. The Company expects to incurthe related expenditure over the next year.
(iv) Movement in provisions : (H crores)
Provision for
contingencies
Provision for
warranty
Provision at 1 April 2015 83.79 8.22
Additions during the year 11.07 8.12
Amount utilised during the year (20.41) (5.73)
Unwinding of discount and effect of change in discount rate 6.30 0.04
Provision at 31 March 2016 80.75 10.65
Additions during the year 10.22
Amount utilised during the year (7.99) (9.76)
Unwinding of discount and effect of change in discount rate 6.50 0.07
Exchange fluctuation (0.33) -
Provision at 31 March 2017 78.93 11.18
21 Provisions (contd.)
Notes forming part of the Financial Statements for the year ended 31 March 2017
71st Annual Report 2016-17 157
STRATEGIC REPORT GOVERNANCE FINANCIAL STATEMENTS OTHER INFORMATION
22 Trade payables (H crores)
As at
31 March 2017
As at
31 March 2016
As at
1 April 2015
Acceptances 168.22 150.66 155.04
Trade payables due to other than micro and small enterprises
(refer note 43)
556.23 469.32 443.48
Other accrued liabilities 169.33 117.74 107.62
893.78 737.72 706.14
23 Revenue from operations (H crores)
Year ended
31 March 2017
Year ended
31 March 2016
Operating revenue
Sale of products (including excise duty)
Export 105.25 92.85
Domestic 4,047.36 3,330.50
4,152.61 3,423.35
Other operating revenue
Sale of Services 6.45 6.68
Export incentives 1.70 1.04
Scrap sales 4.13 5.63
Others 2.69 1.97
14.97 15.32
4,167.58 3,438.67
24 Other Income (H crores)
Year ended
31 March 2017
Year ended
31 March 2016
Interest from
Bank deposits 14.30 18.13
Financial asset carried at amortised cost 11.47 12.61
Others 0.01 0.18
25.78 30.92
Other income
Unclaimed balances and excess provisions written back 6.32 12.05
Gain on foreign currency transactions (net) - 4.70
Rent received 1.74 1.58
Gain on investments carried at fair value through profit or loss (net) 4.62 0.44
Miscellaneous income 5.00 6.13
17.68 24.90
43.46 55.82

Notes forming part of the Financial Statements for the year ended 31 March 2017
Escorts Limited158
25 Cost of materials consumed (H crores)
Year ended
31 March 2017
Year ended
31 March 2016
Cost of material consumed
Opening stock 153.79 214.10
Purchases 2,621.44 2,128.79
2,775.23 2,342.89
Closing stock (162.82) (153.79)
Less: cost of material consumed for discontinued operations (14.45) (50.36)
2,597.96 2,138.74
Changes in inventories of work-in-progress, stock-in-trade and finished goods
Opening stock
Finished goods 141.84 139.49
Work-in-progress 35.25 36.73
Stock-in-trade 58.94 36.99
236.03 213.21
Closing stock
Finished goods (164.80) (141.84)
Work-in-progress (35.16) (35.25)
Stock-in-trade (70.81) (58.94)
(270.77) (236.03)
Less: changes in inventories for discontinued operations (14.92) (2.88)
(49.66) (25.70)
26 Employee benefit expense (H crores)
Year ended
31 March 2017
Year ended
31 March 2016
Salaries, wages and bonus 381.23 343.26
Share based payments to employees (refer note 40) 0.05 0.05
Defined benefit plan expenses (refer note 39) 8.05 8.39
Contribution to provident and other funds (refer note 39) 16.22 16.56
Staff welfare 33.44 31.08
438.99 399.34
27 Finance costs (H crores)
Year ended
31 March 2017
Year ended
31 March 2016
Interest on
Long term loans 15.65 17.23
Cash credit and short term loans 8.22 25.74
Others 3.73 2.69
Finance and bank charges 5.32 5.62
Unwinding of discount on provisions and financial liabilities 7.43 7.20
40.35 58.48
Less: transfer for discontinued operations (9.24) (8.94)
31.11 49.54
Notes forming part of the Financial Statements for the year ended 31 March 2017
71st Annual Report 2016-17 159
STRATEGIC REPORT GOVERNANCE FINANCIAL STATEMENTS OTHER INFORMATION
28 Depreciation and amortisation (H crores)
Year ended
31 March 2017
Year ended
31 March 2016
Depreciation on
Property, plant and equipment 50.46 52.15
Investment property 0.15 0.12
Amortisation on
Intangible assets 12.46 5.23
63.07 57.50
29 Other expenses (H crores)
Year ended
31 March 2017
Year ended
31 March 2016
Stores and spares consumed 36.30 30.89
Power, fuel and electricity 38.46 35.67
Excise duty on increase/(decrease) in stock of finished goods (0.56) (0.45)
Repair and maintenance
Building 8.95 7.31
Machinery 17.43 15.97
Others 55.59 43.92
Warranties 14.18 18.22
Rent 7.01 4.94
Research and testing expense on projects 14.12 10.99
Rates and taxes 2.62 2.05
Insurance 3.62 3.36
Traveling and conveyance 45.54 41.60
Postage and telephones 6.63 6.13
Legal and professional (refer note 33) 55.55 49.85
Commission, discounts and sales incentive 19.36 17.76
Advertisement and promotional expenses 71.53 56.62
Royalty 20.39 16.82
Packing, freight and forwarding 67.58 56.61
Security charges 6.58 5.30
Printing and stationery 3.04 3.35
Loss on foreign currency transaction (net) 1.19 -
Director's sitting fees and commission 8.58 0.37
Corporate social responsibility (CSR) expenditure* 3.30 1.16
Provision for doubtful debts/advances and deposits 5.30 4.73
Bad debts and inventory written off 27.82 61.00
Less : Provision already held (27.82) (61.00)
Amounts/assets written off 0.69 1.22
Miscellaneous expenses 25.06 21.17
538.04 455.56
* CSR Expenditure
(i) Gross amount required to be spent by the company during the year 3.42 3.27
(ii) Amount spent (in cash) during the year on:
a) Construction/acquisition of any asset - -
b) For the purposes other than (a) above 3.30 1.16
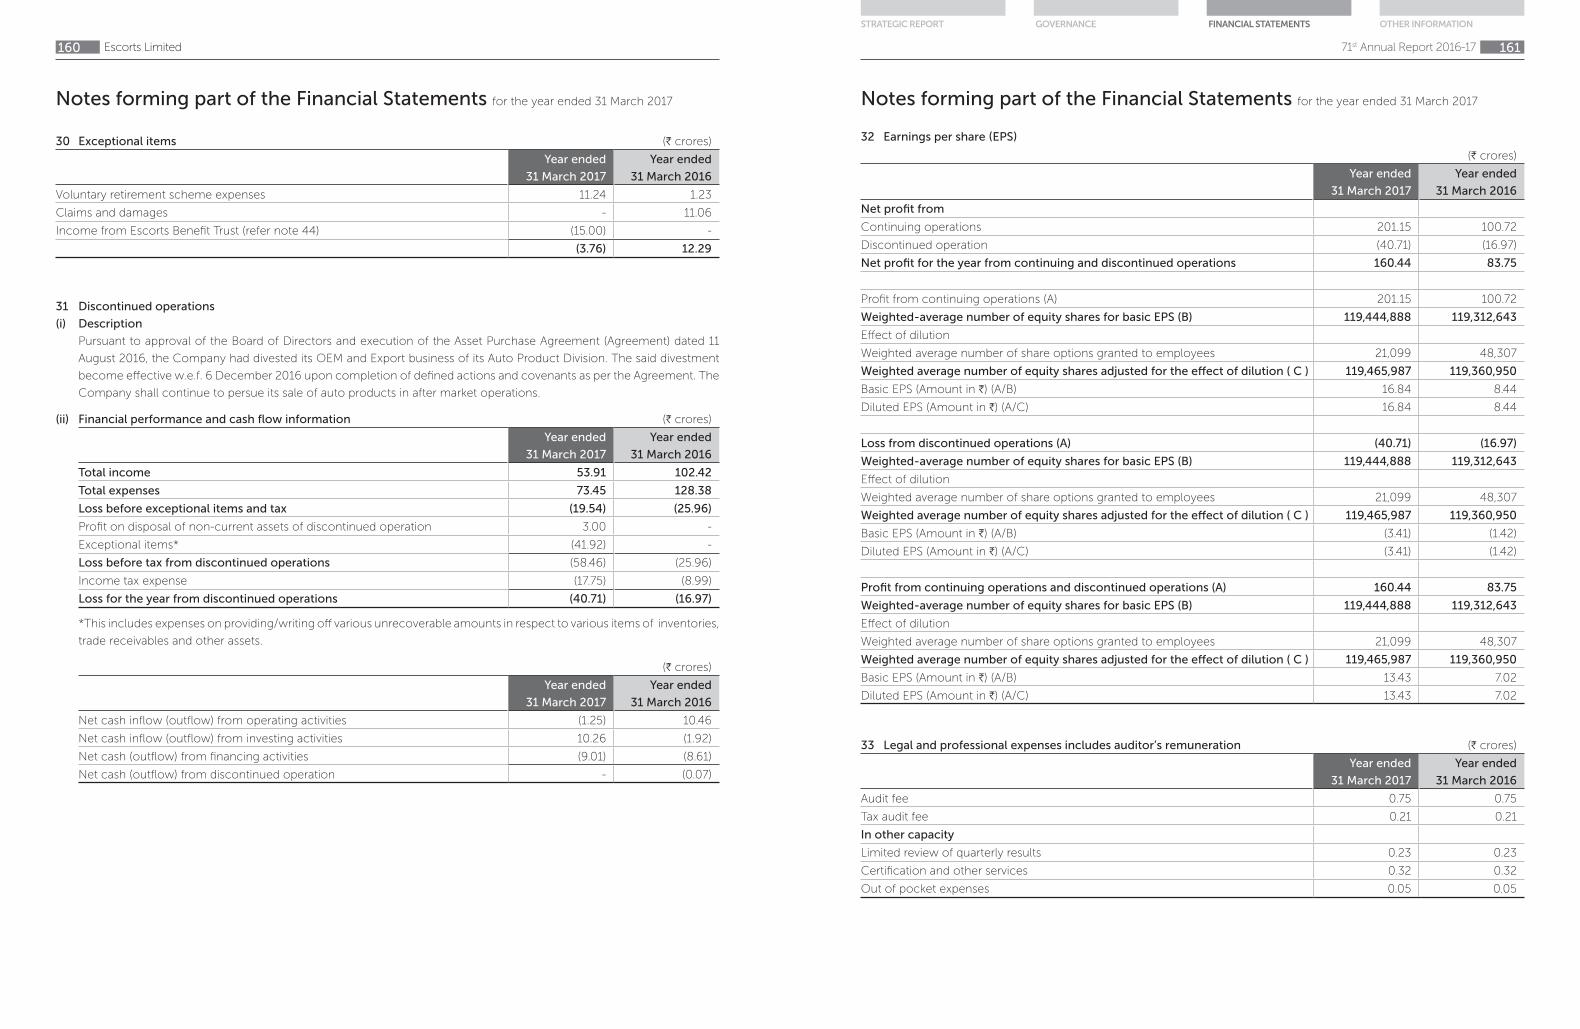
Notes forming part of the Financial Statements for the year ended 31 March 2017
Escorts Limited160
30 Exceptional items (H crores)
Year ended
31 March 2017
Year ended
31 March 2016
Voluntary retirement scheme expenses 11.24 1.23
Claims and damages - 11.06
Income from Escorts Benefit Trust (refer note 44) (15.00) -
(3.76) 12.29
31 Discontinued operations
(i) Description
Pursuant to approval of the Board of Directors and execution of the Asset Purchase Agreement (Agreement) dated 11
August 2016, the Company had divested its OEM and Export business of its Auto Product Division. The said divestment
become effective w.e.f. 6 December 2016 upon completion of defined actions and covenants as per the Agreement. The
Company shall continue to persue its sale of auto products in after market operations.
(ii) Financial performance and cash flow information (H crores)
Year ended
31 March 2017
Year ended
31 March 2016
Total income 53.91 102.42
Total expenses 73.45 128.38
Loss before exceptional items and tax (19.54) (25.96)
Profit on disposal of non-current assets of discontinued operation 3.00 -
Exceptional items* (41.92) -
Loss before tax from discontinued operations (58.46) (25.96)
Income tax expense (17.75) (8.99)
Loss for the year from discontinued operations (40.71) (16.97)
*This includes expenses on providing/writing off various unrecoverable amounts in respect to various items of inventories,
trade receivables and other assets.
(H crores)
Year ended
31 March 2017
Year ended
31 March 2016
Net cash inflow (outflow) from operating activities (1.25) 10.46
Net cash inflow (outflow) from investing activities 10.26 (1.92)
Net cash (outflow) from financing activities (9.01) (8.61)
Net cash (outflow) from discontinued operation - (0.07)
Notes forming part of the Financial Statements for the year ended 31 March 2017
71st Annual Report 2016-17 161
STRATEGIC REPORT GOVERNANCE FINANCIAL STATEMENTS OTHER INFORMATION
33 Legal and professional expenses includes auditor’s remuneration (H crores)
Year ended
31 March 2017
Year ended
31 March 2016
Audit fee 0.75 0.75
Tax audit fee 0.21 0.21
In other capacity
Limited review of quarterly results 0.23 0.23
Certification and other services 0.32 0.32
Out of pocket expenses 0.05 0.05
32 Earnings per share (EPS)
(H crores)
Year ended
31 March 2017
Year ended
31 March 2016
Net profit from
Continuing operations 201.15 100.72
Discontinued operation (40.71) (16.97)
Net profit for the year from continuing and discontinued operations 160.44 83.75
Profit from continuing operations (A) 201.15 100.72
Weighted-average number of equity shares for basic EPS (B) 119,444,888 119,312,643
Effect of dilution
Weighted average number of share options granted to employees 21,099 48,307
Weighted average number of equity shares adjusted for the effect of dilution ( C ) 119,465,987 119,360,950
Basic EPS (Amount in H) (A/B) 16.84 8.44
Diluted EPS (Amount in H) (A/C) 16.84 8.44
Loss from discontinued operations (A) (40.71) (16.97)
Weighted-average number of equity shares for basic EPS (B) 119,444,888 119,312,643
Effect of dilution
Weighted average number of share options granted to employees 21,099 48,307
Weighted average number of equity shares adjusted for the effect of dilution ( C ) 119,465,987 119,360,950
Basic EPS (Amount in H) (A/B) (3.41) (1.42)
Diluted EPS (Amount in H) (A/C) (3.41) (1.42)
Profit from continuing operations and discontinued operations (A) 160.44 83.75
Weighted-average number of equity shares for basic EPS (B) 119,444,888 119,312,643
Effect of dilution
Weighted average number of share options granted to employees 21,099 48,307
Weighted average number of equity shares adjusted for the effect of dilution ( C ) 119,465,987 119,360,950
Basic EPS (Amount in H) (A/B) 13.43 7.02
Diluted EPS (Amount in H) (A/C) 13.43 7.02
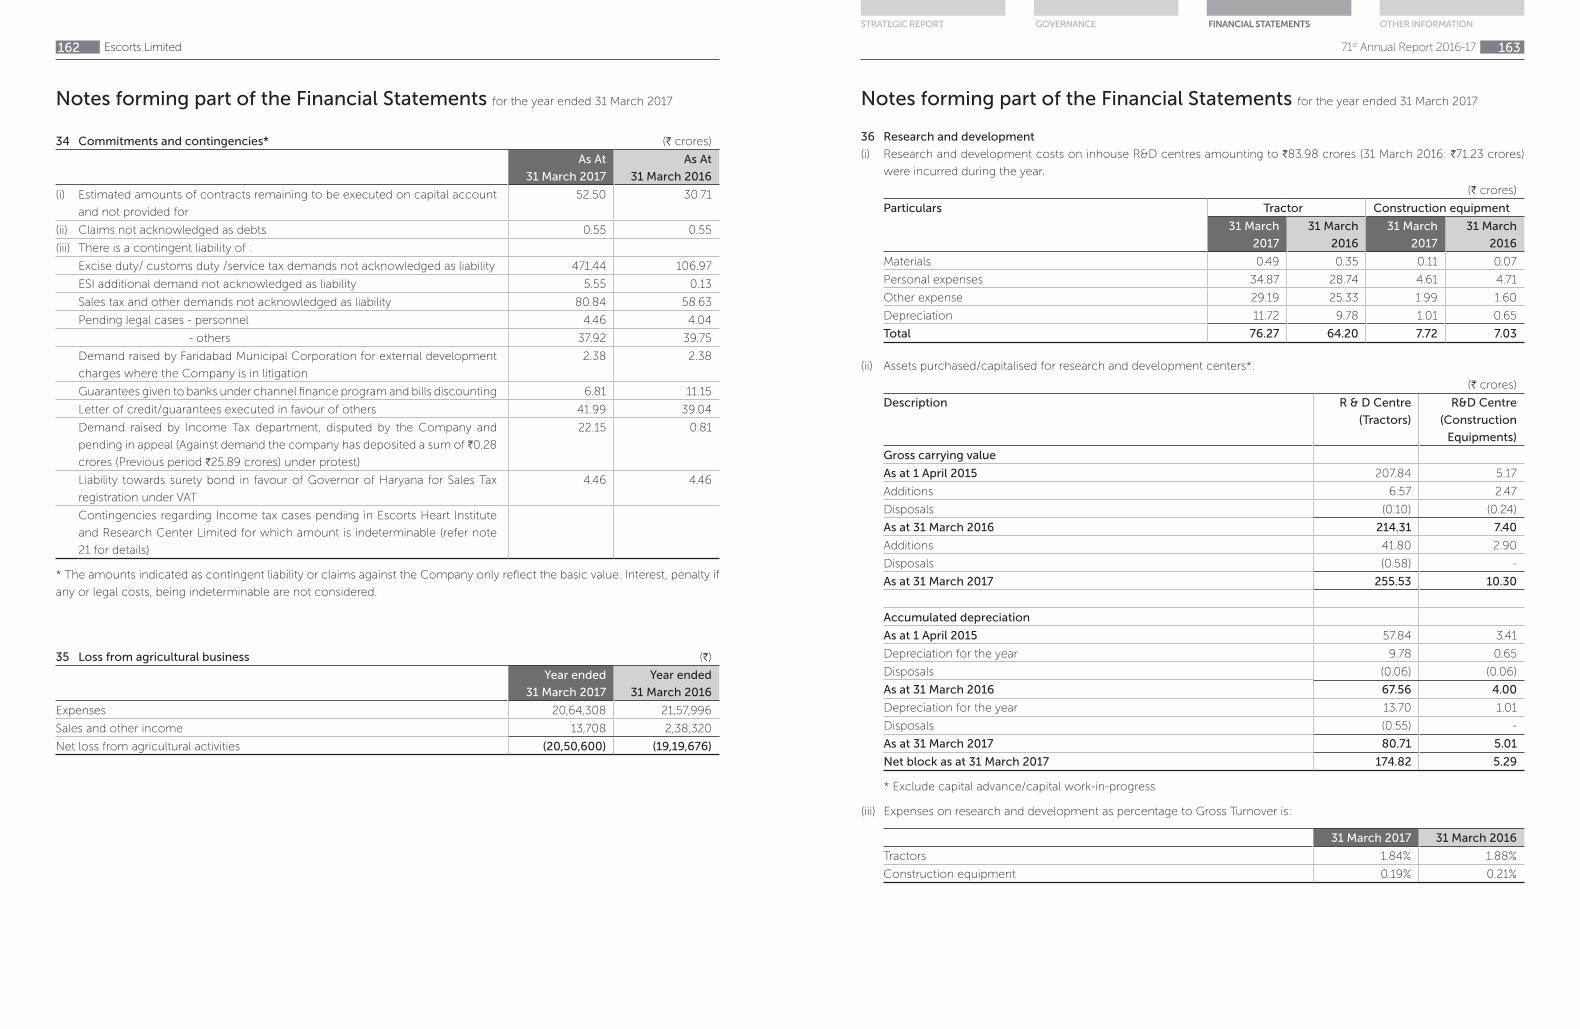
Notes forming part of the Financial Statements for the year ended 31 March 2017
Escorts Limited162
34 Commitments and contingencies* (H crores)
As At
31 March 2017
As At
31 March 2016
(i) Estimated amounts of contracts remaining to be executed on capital account
and not provided for
52.50 30.71
(ii) Claims not acknowledged as debts 0.55 0.55
(iii) There is a contingent liability of :
Excise duty/ customs duty /service tax demands not acknowledged as liability 471.44 106.97
ESI additional demand not acknowledged as liability 5.55 0.13
Sales tax and other demands not acknowledged as liability 80.84 58.63
Pending legal cases - personnel 4.46 4.04
- others 37.92 39.75
Demand raised by Faridabad Municipal Corporation for external development
charges where the Company is in litigation
2.38 2.38
Guarantees given to banks under channel finance program and bills discounting 6.81 11.15
Letter of credit/guarantees executed in favour of others 41.99 39.04
Demand raised by Income Tax department, disputed by the Company and
pending in appeal (Against demand the company has deposited a sum of H0.28
crores (Previous period H25.89 crores) under protest)
22.15 0.81
Liability towards surety bond in favour of Governor of Haryana for Sales Tax
registration under VAT
4.46 4.46
Contingencies regarding Income tax cases pending in Escorts Heart Institute
and Research Center Limited for which amount is indeterminable (refer note
21 for details)
* The amounts indicated as contingent liability or claims against the Company only reflect the basic value. Interest, penalty if
any or legal costs, being indeterminable are not considered.
35 Loss from agricultural business (H)
Year ended
31 March 2017
Year ended
31 March 2016
Expenses 20,64,308 21,57,996
Sales and other income 13,708 2,38,320
Net loss from agricultural activities (20,50,600) (19,19,676)
Notes forming part of the Financial Statements for the year ended 31 March 2017
71st Annual Report 2016-17 163
STRATEGIC REPORT GOVERNANCE FINANCIAL STATEMENTS OTHER INFORMATION
36 Research and development
(i) Research and development costs on inhouse R&D centres amounting to H83.98 crores (31 March 2016: H71.23 crores)
were incurred during the year.
(H crores)
Particulars Tractor Construction equipment
31 March
2017
31 March
2016
31 March
2017
31 March
2016
Materials 0.49 0.35 0.11 0.07
Personal expenses 34.87 28.74 4.61 4.71
Other expense 29.19 25.33 1.99 1.60
Depreciation 11.72 9.78 1.01 0.65
Total 76.27 64.20 7.72 7.03
(ii) Assets purchased/capitalised for research and development centers*:
(H crores)
Description R & D Centre
(Tractors)
R&D Centre
(Construction
Equipments)
Gross carrying value
As at 1 April 2015 207.84 5.17
Additions 6.57 2.47
Disposals (0.10) (0.24)
As at 31 March 2016 214.31 7.40
Additions 41.80 2.90
Disposals (0.58) -
As at 31 March 2017 255.53 10.30
Accumulated depreciation
As at 1 April 2015 57.84 3.41
Depreciation for the year 9.78 0.65
Disposals (0.06) (0.06)
As at 31 March 2016 67.56 4.00
Depreciation for the year 13.70 1.01
Disposals (0.55) -
As at 31 March 2017 80.71 5.01
Net block as at 31 March 2017 174.82 5.29
* Exclude capital advance/capital work-in-progress
(iii) Expenses on research and development as percentage to Gross Turnover is:
31 March 2017 31 March 2016
Tractors 1.84% 1.88%
Construction equipment 0.19% 0.21%
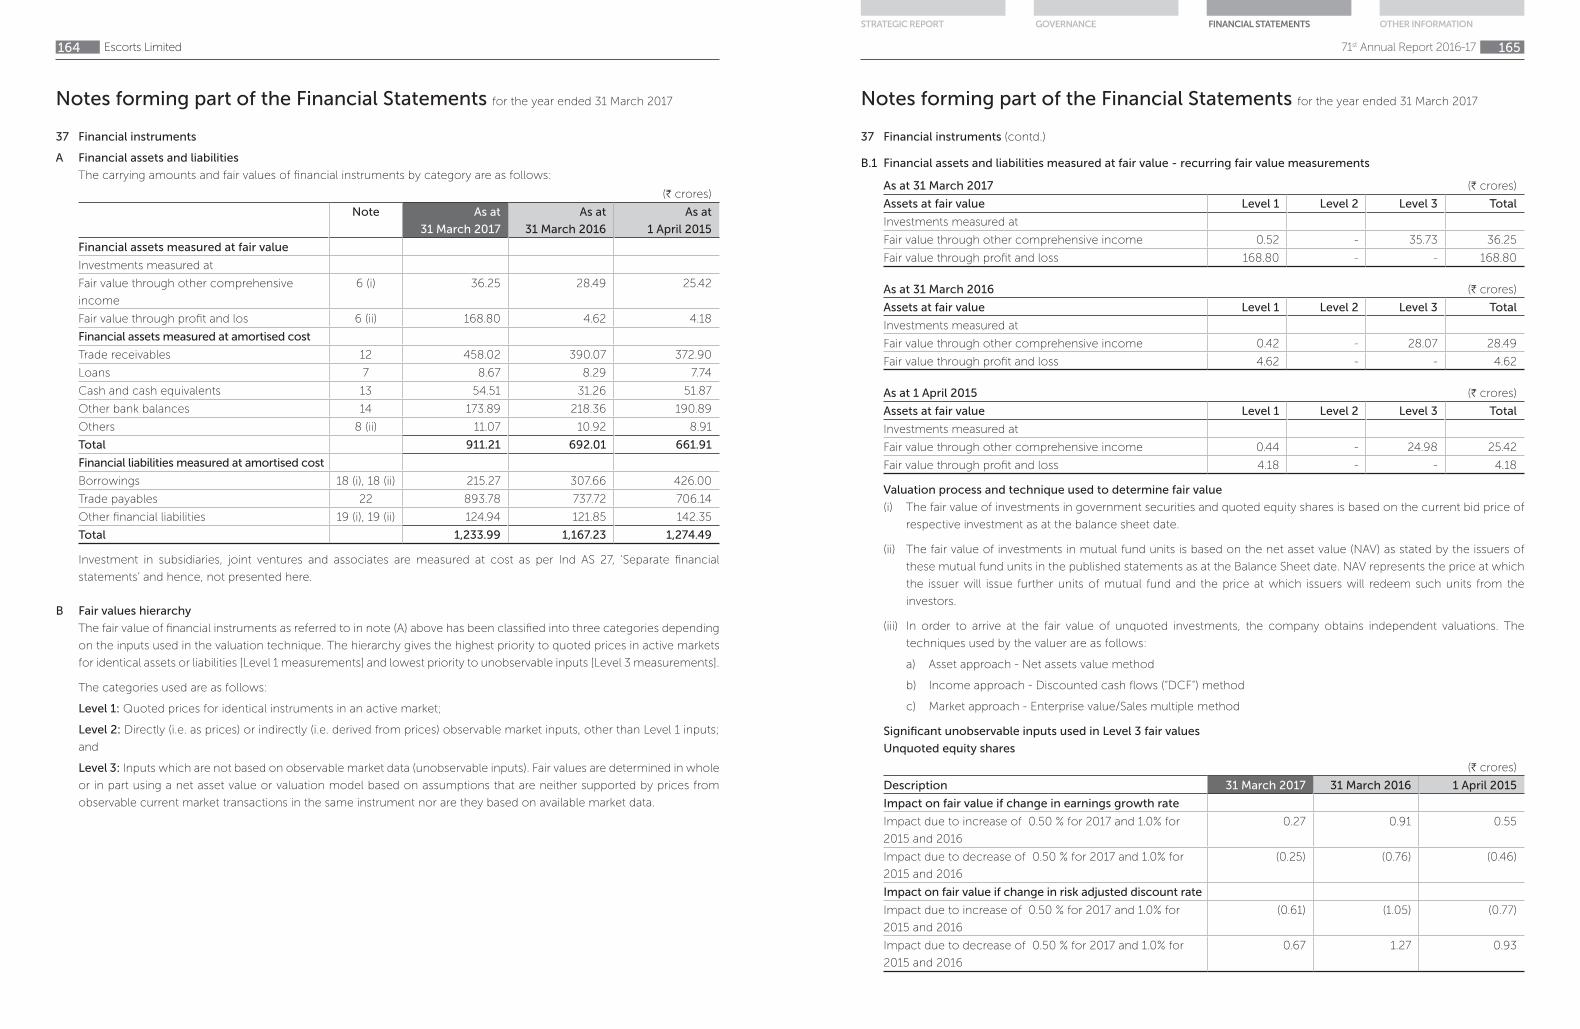
Notes forming part of the Financial Statements for the year ended 31 March 2017
Escorts Limited164
37 Financial instruments
A Financial assets and liabilities
The carrying amounts and fair values of financial instruments by category are as follows:
(H crores)
Note As at
31 March 2017
As at
31 March 2016
As at
1 April 2015
Financial assets measured at fair value
Investments measured at
Fair value through other comprehensive
income
6 (i) 36.25 28.49 25.42
Fair value through profit and los 6 (ii) 168.80 4.62 4.18
Financial assets measured at amortised cost
Trade receivables 12 458.02 390.07 372.90
Loans 7 8.67 8.29 7.74
Cash and cash equivalents 13 54.51 31.26 51.87
Other bank balances 14 173.89 218.36 190.89
Others 8 (ii) 11.07 10.92 8.91
Total 911.21 692.01 661.91
Financial liabilities measured at amortised cost
Borrowings 18 (i), 18 (ii) 215.27 307.66 426.00
Trade payables 22 893.78 737.72 706.14
Other financial liabilities 19 (i), 19 (ii) 124.94 121.85 142.35
Total 1,233.99 1,167.23 1,274.49
Investment in subsidiaries, joint ventures and associates are measured at cost as per Ind AS 27, ‘Separate financial
statements’ and hence, not presented here.
B Fair values hierarchy
The fair value of financial instruments as referred to in note (A) above has been classified into three categories depending
on the inputs used in the valuation technique. The hierarchy gives the highest priority to quoted prices in active markets
for identical assets or liabilities [Level 1 measurements] and lowest priority to unobservable inputs [Level 3 measurements].
The categories used are as follows:
Level 1: Quoted prices for identical instruments in an active market;
Level 2: Directly (i.e. as prices) or indirectly (i.e. derived from prices) observable market inputs, other than Level 1 inputs;
and
Level 3: Inputs which are not based on observable market data (unobservable inputs). Fair values are determined in whole
or in part using a net asset value or valuation model based on assumptions that are neither supported by prices from
observable current market transactions in the same instrument nor are they based on available market data.
Notes forming part of the Financial Statements for the year ended 31 March 2017
71st Annual Report 2016-17 165
STRATEGIC REPORT GOVERNANCE FINANCIAL STATEMENTS OTHER INFORMATION
37 Financial instruments (contd.)
B.1 Financial assets and liabilities measured at fair value - recurring fair value measurements
As at 31 March 2017 (H crores)
Assets at fair value Level 1 Level 2 Level 3 Total
Investments measured at
Fair value through other comprehensive income 0.52 - 35.73 36.25
Fair value through profit and loss 168.80 - - 168.80
As at 31 March 2016 (H crores)
Assets at fair value Level 1 Level 2 Level 3 Total
Investments measured at
Fair value through other comprehensive income 0.42 - 28.07 28.49
Fair value through profit and loss 4.62 - - 4.62
As at 1 April 2015 (H crores)
Assets at fair value Level 1 Level 2 Level 3 Total
Investments measured at
Fair value through other comprehensive income 0.44 - 24.98 25.42
Fair value through profit and loss 4.18 - - 4.18
Valuation process and technique used to determine fair value
(i) The fair value of investments in government securities and quoted equity shares is based on the current bid price of
respective investment as at the balance sheet date.
(ii) The fair value of investments in mutual fund units is based on the net asset value (NAV) as stated by the issuers of
these mutual fund units in the published statements as at the Balance Sheet date. NAV represents the price at which
the issuer will issue further units of mutual fund and the price at which issuers will redeem such units from the
investors.
(iii) In order to arrive at the fair value of unquoted investments, the company obtains independent valuations. The
techniques used by the valuer are as follows:
a) Asset approach - Net assets value method
b) Income approach - Discounted cash flows (“DCF”) method
c) Market approach - Enterprise value/Sales multiple method
Significant unobservable inputs used in Level 3 fair values
Unquoted equity shares
(H crores)
Description 31 March 2017 31 March 2016 1 April 2015
Impact on fair value if change in earnings growth rate
Impact due to increase of 0.50 % for 2017 and 1.0% for
2015 and 2016
0.27 0.91 0.55
Impact due to decrease of 0.50 % for 2017 and 1.0% for
2015 and 2016
(0.25) (0.76) (0.46)
Impact on fair value if change in risk adjusted discount rate
Impact due to increase of 0.50 % for 2017 and 1.0% for
2015 and 2016
(0.61) (1.05) (0.77)
Impact due to decrease of 0.50 % for 2017 and 1.0% for
2015 and 2016
0.67 1.27 0.93

Notes forming part of the Financial Statements for the year ended 31 March 2017
Escorts Limited166
37 Financial instruments (contd.)
The following table presents the changes in level 3 items for the periods ended 31 March 2017 and 31 March 2016:
(H crores)
Particulars Unquoted
equity shares
As at 1 April 2015 24.98
Gains recognised in other comprehensive income 3.09
As at 31 March 2016 28.07
Gains recognised in other comprehensive income 7.66
As at 31 March 2017 35.73
B.2 Fair value of instruments measured at amortised cost
Fair value of instruments measured at amortised cost for which fair value is disclosed is as follows, these fair values are
calculated using Level 3 inputs:
As at 31 March 2017 (H crores)
Carrying value Fair value
Loans 4.17 4.18
Security deposits received 12.92 14.34
As at 31 March 2016 (H crores)
Carrying value Fair value
Loans 4.17 4.17
Security deposits received 12.02 12.54
As at 1 April 2015 (H crores)
Carrying value Fair value
Loans 4.95 4.95
Security deposits received 10.92 10.92
The management assessed that fair values of cash and cash equivalents, trade receivables, other receivables, short term
borrowings, trade payables and other current financial liabilities approximate their respective carrying amounts largely
due to the short-term maturities of these instruments. The fair value of the financial assets and liabilities is included at
the amount at which the instrument could be exchanged in a current transaction between willing parties, other than in
a forced or liquidation sale. The following methods and assumptions were used to estimate the fair values:
(i) Long-term fixed-rate receivables are evaluated by the Company based on parameters such as interest rates, individual
creditworthiness of the customer and other market risk factors.
(ii) The fair values of the Company’s fixed interest-bearing, loans and receivables are determined by applying discounted
cash flows (‘DCF’) method, using discount rate that reflects the issuer’s borrowing rate as at the end of the reporting
period. The own non-performance risk as at 31 March 2017 was assessed to be insignificant.
(iii) All the long term borrowing facilities availed by the Company are variable rate facilities which are subject to changes
in underlying interest rate indices. Further, the credit spread on these facilities are subject to change with changes in
Company’s creditworthiness. The management believes that the current rate of interest on these loans are in close
approximation from market rates applicable to the Company. Therefore, the management estimates that the fair
value of these borrowings are approximate to their respective carrying values.
Notes forming part of the Financial Statements for the year ended 31 March 2017
71st Annual Report 2016-17 167
STRATEGIC REPORT GOVERNANCE FINANCIAL STATEMENTS OTHER INFORMATION
37 Financial instruments (contd.)
C Financial Risk Management
Risk Management
The Company’s activities expose it to market risk, liquidity risk and credit risk. The Company’s board of directors has
overall responsibility for the establishment and oversight of the Company’s risk management framework. This note
explains the sources of risk which the entity is exposed to and how the entity manages the risk and the related impact in
the financial statements.
C.1 Credit risk
Credit risk is the risk that a counterparty fails to discharge its obligation to the Company. The Company’s exposure
to credit risk is influenced mainly by cash and cash equivalents, trade receivables and financial assets measured at
amortised cost. The Company continuously monitors defaults of customers and other counterparties and incorporates
this information into its credit risk controls.
a) Credit risk management
The Company assesses and manages credit risk based on internal credit rating system. Internal credit rating is performed
for each class of financial instruments with different characteristics. The Company assigns the following credit ratings to
each class of financial assets based on the assumptions, inputs and factors specific to the class of financial assets.
(i) Low credit risk on financial reporting date
(ii) Moderate credit risk
(iii) High credit risk
The Company provides for expected credit loss based on the following:
Asset group Basis of categorisation Provision for expected credit loss
Low credit risk Cash and cash equivalents, other bank
balances, loans, trade receivables and
other financial assets
12 month expected credit loss
Moderate credit risk Trade receivables and other financial
assets
Life time expected credit loss or 12
month expected credit loss
High credit risk Trade receivables and other financial
assets
Life time expected credit loss
fully provided for
In respect of trade receivables, the company recognises a provision for lifetime expected credit loss.
Based on business environment in which the Company operates, a default on a financial asset is considered when the
counter party fails to make payments within the agreed time period as per contract. Loss rates reflecting defaults are
based on actual credit loss experience and considering differences between current and historical economic conditions.
Assets are written off when there is no reasonable expectation of recovery, such as a debtor failing to engage in a
repayment plan with the Company or debtor declaring bankruptcy or a litigation decided against the Company. The
Company continues to engage with parties whose balances are written off and attempts to enforce repayment.
Recoveries made are recognised in statement of profit and loss.
Financial assets that exposes the entity to credit risk (H crores)
As at
31 March 2017
As at
31 March 2016
As at
1 April 2015
(i) Low credit risk on financial reporting date
Loans 8.67 8.29 7.74
Trade receivables 52.40 39.02 32.94
Cash and cash equivalents 54.51 31.26 51.87

Notes forming part of the Financial Statements for the year ended 31 March 2017
Escorts Limited168
37 Financial instruments (contd.)
Financial assets that exposes the entity to credit risk (H crores)
As at
31 March 2017
As at
31 March 2016
As at
1 April 2015
Other bank balances 173.89 218.36 190.89
Other financial assets 11.07 10.92 8.91
(ii) Moderate credit risk
Trade receivables 420.25 366.83 360.21
(iii) High credit risk
Trade receivables 42.84 49.01 63.95
Other financial assets 2.93 2.93 2.93
Cash and cash equivalents and bank deposits
Credit risk related to cash and cash equivalents and bank deposits is managed by only accepting highly rated banks and
diversifying bank deposits and accounts in different banks across the country.
Trade receivables
Credit risk related to trade receivables are mitigated by taking bank guarantees/letter of credit, from customers where
credit risk is high. The Company closely monitors the credit-worthiness of the debtors through internal systems that
are configured to define credit limits of customers, thereby, limiting the credit risk to pre-calculated amounts. The
Company assesses increase in credit risk on an ongoing basis for amounts receivable that become past due and default
is considered to have occurred when amounts receivable become one year past due.
Other financial assets measured at amortised cost
Other financial assets measured at amortised cost includes loans and advances to employees, security deposits and
others. Credit risk related to these other financial assets is managed by monitoring the recoverability of such amounts
continuously.
b) Expected credit losses for financial assets other than trade receivables
i) Company provides for expected credit losses on loans and advances other than trade receivables by assessing individual
financial instruments for expectation of any credit losses. Since, the Company deals with only high-rated banks and
financial institutions, credit risk in respect of cash and cash equivalents, other bank balances and bank deposits is evaluated
as very low. In respect of loans, comprising of security deposits, credit risk is considered low because the Company is
in possession of the underlying asset. In respect of other financial assets, credit risk is evaluated based on Company’s
knowledge of the credit worthiness of those parties and loss allowance is measured as lifetime expected credit losses.
The Company does not have any expected loss based impairment recognised on such assets considering their low credit
risk nature, though incurred loss provisions are disclosed under each sub-category of such financial assets.
31 March 2017 (H crores)
Particulars Gross
carrying
amount
Expected
probability
of
default
Expected
credit
losses
Carrying
amount
net of
impairment
provision
Cash and cash equivalents 54.51 0% - 54.51
Other bank balances 173.89 0% - 173.89
Loans 8.67 0% - 8.67
Other financial assets 14.00 21.0% 2.93 11.07
Notes forming part of the Financial Statements for the year ended 31 March 2017
71st Annual Report 2016-17 169
STRATEGIC REPORT GOVERNANCE FINANCIAL STATEMENTS OTHER INFORMATION
37 Financial instruments (contd.)
31 March 2016 (H crores)
Particulars Gross
carrying
amount
Expected
probability
of
default
Expected
credit
losses
Carrying
amount
net of
impairment
provision
Cash and cash equivalents 31.26 0% - 31.26
Other bank balances 218.36 0% - 218.36
Loans 8.29 0% - 8.29
Other financial assets 13.85 21.2% 2.93 10.92
1 April 2015 (H crores)
Particulars Gross
carrying
amount
Expected
probability
of
default
Expected
credit
losses
Carrying
amount
net of
impairment
provision
Cash and cash equivalents 51.87 0% - 51.87
Other bank balances 190.89 0% - 190.89
Loans 7.74 0% - 7.74
Other financial assets 11.84 25.0% 2.93 8.91
ii) Expected credit loss for trade receivables under simplified approach
The company recognizes lifetime expected credit losses on trade receivables using a simplified approach, wherein
Company has defined percentage of provision by analysing historical trend of default relevant to each business segment
based on the criteria defined above and such provision percentage determined have been considered to recognise life
time expected credit losses on trade receivables (other than those where default criteria are met).
31 March 2017 (H crores)
Particulars Agri
machinery
Auto
products
Construction
equipment
Railway
products
Gross sales in respect of customers where no specific
default is occured
3,247.73 - 589.82 233.40
Expected loss rate 0.11% 0.00% 1.59% 0.78%
Expected credit loss (loss allowance provision) 3.46 - 9.35 1.82
Receivables due from customers where specific default has
occured
11.92 9.96 17.84 3.12
31 March 2016 (H crores)
Agri
machinery
Auto
products
Construction
equipment
Railway
products
Gross sales in respect of customers where no specific
default is occured
2,646.53 66.79 482.23 214.82
Expected loss rate 0.08% 2.14% 1.56% 2.19%
Expected credit loss( loss allowance provision) 2.15 1.43 7.51 4.70
Receivables due from customers where specific default has
occured
12.61 8.26 19.99 8.15

Notes forming part of the Financial Statements for the year ended 31 March 2017
Escorts Limited170
37 Financial instruments (contd.)
1 April 2015 (H crores)
Agri
machinery
Auto
products
Construction
equipment
Railway
products
Gross sales in respect of customers where no specific
default is occured
3,001.59 68.67 537.76 190.94
Expected loss rate 0.11% 1.29% 2.13% 2.35%
Expected credit loss( loss allowance provision) 3.40 0.89 11.48 4.49
Receivables due from customers where specific default has
occured
10.28 7.46 25.78 20.43
Reconciliation of loss allowance provision from beginning to end of reporting period: (H crores)
Reconciliation of loss allowance Trade receivables Other financial
assets
Loss allowance on 1 April 2015 84.20 (2.93)
Increase of provision due to assets originated during the year 0.16 -
Write-offs (19.57) -
Loss allowance on 31 March 2016 64.79 (2.93)
Assets originated or purchased 7.95 -
Loss allowance written back (0.30) -
Write-offs (14.97) -
Loss allowance on 31 March 2017 57.47 (2.93)
C.2 Liquidity risk
Liquidity risk is the risk that the Company will encounter difficulty in meeting the obligations associated with its financial
liabilities that are settled by delivering cash or another financial asset. The Company’s approach to managing liquidity is
to ensure as far as possible, that it will have sufficient liquidity to meet its liabilities when they are due.
Management monitors rolling forecasts of the Company’s liquidity position and cash and cash equivalents on the basis
of expected cash flows. The Company takes into account the liquidity of the market in which the entity operates.
(a) Financing arrangements
The Company had access to the following undrawn borrowing facilities at the end of the reporting period:
(H crores)
Floating rate 31 March 2017 31 March 2016 1 April 2015
Expiring within one year (cash credit and other facilities-
Fixed rate)
305.04 241.75 147.40
Expiring beyond one year (bank loans - Floating rate) 99.00 115.00 -
404.04 356.75 147.40
The bank overdraft facilities may be drawn at any time and may be terminated by the bank without notice. Subject to the
continuance of satisfactory credit ratings, the bank loan facilities can be drawn till 31 December 2017 in H and have an
average maturity of 6.5 years (31 March 2016: 7.5 years).
(b) Maturities of financial liabilities
The tables below analyse the Company’s financial liabilities into relevant maturity groupings based on their contractual
maturities.
The amounts disclosed in the table are the contractual undiscounted cash flows. Balances due within 12 months equal
their carrying balances as the impact of discounting is not significant.
Notes forming part of the Financial Statements for the year ended 31 March 2017
71st Annual Report 2016-17 171
STRATEGIC REPORT GOVERNANCE FINANCIAL STATEMENTS OTHER INFORMATION
37 Financial instruments (contd.)
31 March 2017 (H crores)
Less than
1 year
1-2 year 2-3 year More than
3 years
Total
Non-derivatives
Borrowings 215.61 45.99 14.10 0.16 275.86
Finance lease obligation 0.01 0.01 0.01 1.05 1.08
Trade payable 893.78 - - - 893.78
Security deposits 0.70 - 0.42 21.71 22.83
Other financial liabilities 63.80 - - - 63.80
Total 1,173.90 46.00 14.53 22.92 1,257.35
31 March 2016 (H crores)
Less than
1 year
1-2 year 2-3 year More than
3 years
Total
Non-derivatives
Borrowings 286.51 56.43 45.82 13.93 402.69
Finance lease obligation 0.01 0.01 0.01 1.06 1.09
Trade payable 737.72 - - - 737.72
Security deposits 0.68 0.20 - 20.68 21.56
Other financial liabilities 56.31 - - - 56.31
Total 1,081.23 56.64 45.83 35.67 1,219.37
1 April 2015 (H crores)
Less than
1 year
1-2 year 2-3 year More than
3 years
Total
Non-derivatives
Borrowings 411.34 66.31 56.43 59.75 593.83
Finance lease obligation 0.37 0.01 0.01 1.08 1.47
Trade payable 706.14 - - - 706.14
Security deposits 1.57 - - 21.16 22.73
Other financial liabilities 57.63 - - - 57.63
Total 1,177.05 66.32 56.44 81.99 1,381.80
C.3 Market risk
a) Foreign currency risk
The Company is exposed to foreign exchange risk arising from foreign currency transactions, primarily with respect to the
US Dollar, EURO and JPY . Foreign exchange risk arises from recognised assets and liabilities denominated in a currency
that is not the functional currency of the Company. Considering the low volume of foreign currency transactions, the
Company’s exposure to foreign currency risk is limited and the Company hence does not use any derivative instruments
to manage its exposure. Also, the Company does not use forward contracts and swaps for speculative purposes.
(i) Foreign currency risk exposure in USD:
The Company’s exposure to foreign currency risk at the end of the reporting period expressed in H, are as follows
(H crores)
Particulars 31 March 2017
USD
31 March 2016
USD
1 April 2015
USD
Financial assets 19.09 17.22 16.98
Financial liabilities 20.63 25.98 3.22
Net exposure to foreign currency risk (liabilities) (1.54) (8.76) 13.76
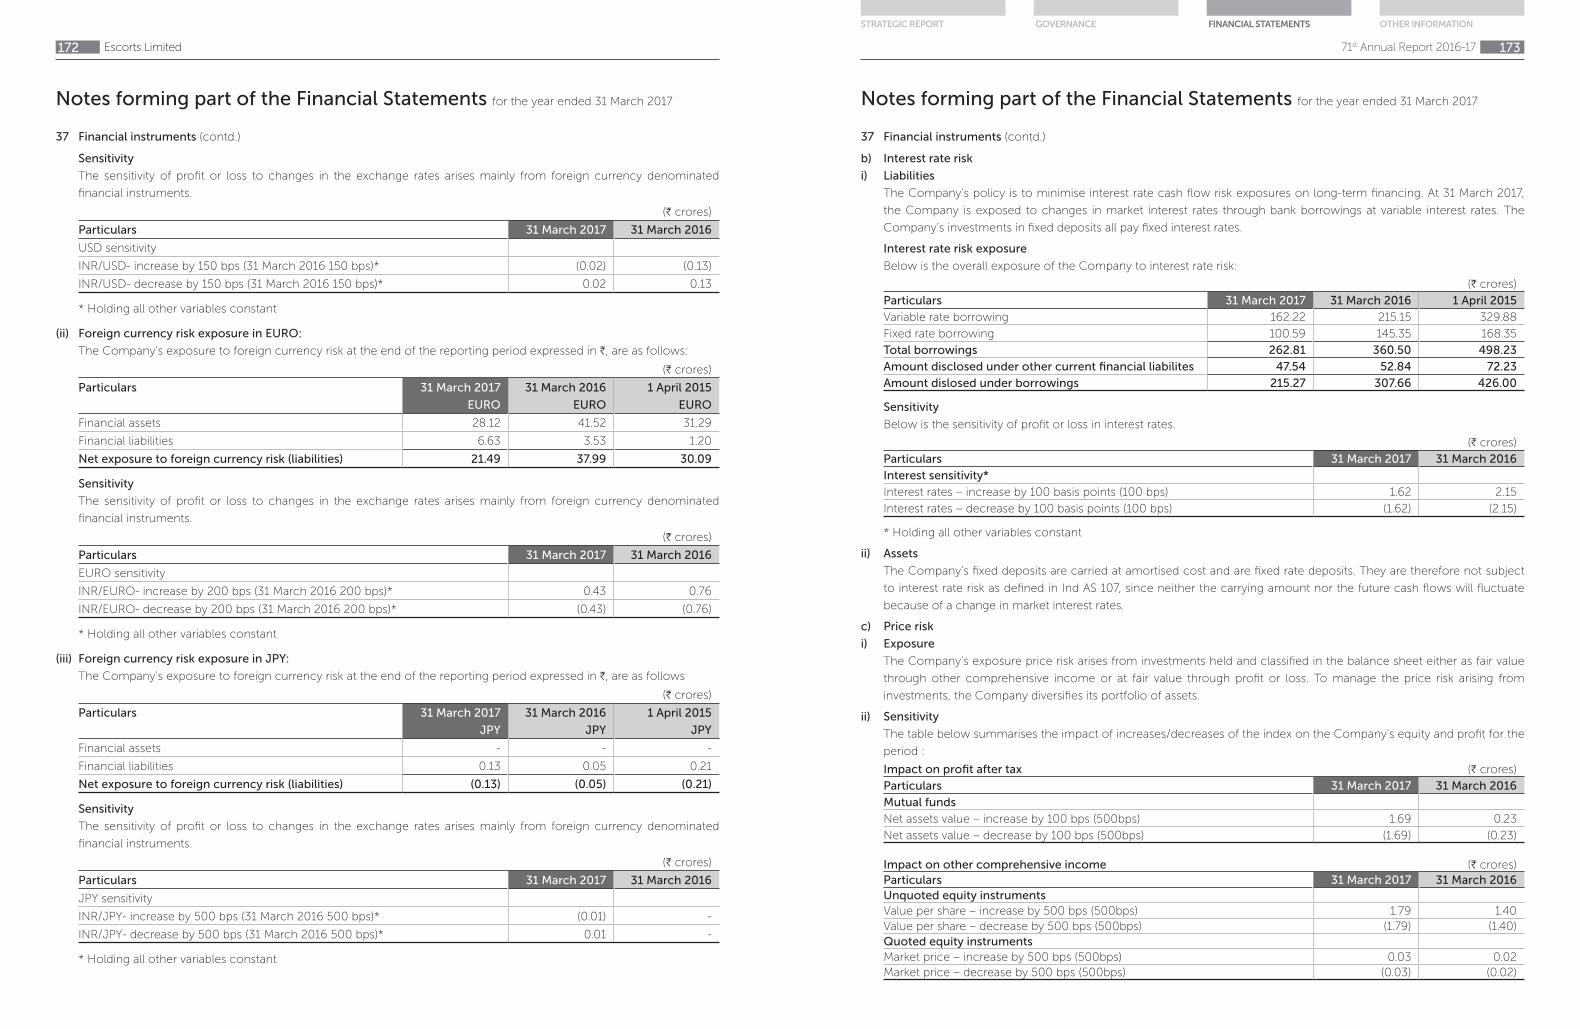
Notes forming part of the Financial Statements for the year ended 31 March 2017
Escorts Limited172
37 Financial instruments (contd.)
Sensitivity
The sensitivity of profit or loss to changes in the exchange rates arises mainly from foreign currency denominated
financial instruments.
(H crores)
Particulars 31 March 2017 31 March 2016
USD sensitivity
INR/USD- increase by 150 bps (31 March 2016 150 bps)* (0.02) (0.13)
INR/USD- decrease by 150 bps (31 March 2016 150 bps)* 0.02 0.13
* Holding all other variables constant
(ii) Foreign currency risk exposure in EURO:
The Company’s exposure to foreign currency risk at the end of the reporting period expressed in H, are as follows:
(H crores)
Particulars 31 March 2017
EURO
31 March 2016
EURO
1 April 2015
EURO
Financial assets 28.12 41.52 31.29
Financial liabilities 6.63 3.53 1.20
Net exposure to foreign currency risk (liabilities) 21.49 37.99 30.09
Sensitivity
The sensitivity of profit or loss to changes in the exchange rates arises mainly from foreign currency denominated
financial instruments.
(H crores)
Particulars 31 March 2017 31 March 2016
EURO sensitivity
INR/EURO- increase by 200 bps (31 March 2016 200 bps)* 0.43 0.76
INR/EURO- decrease by 200 bps (31 March 2016 200 bps)* (0.43) (0.76)
* Holding all other variables constant
(iii) Foreign currency risk exposure in JPY:
The Company’s exposure to foreign currency risk at the end of the reporting period expressed in H, are as follows
(H crores)
Particulars 31 March 2017
JPY
31 March 2016
JPY
1 April 2015
JPY
Financial assets - - -
Financial liabilities 0.13 0.05 0.21
Net exposure to foreign currency risk (liabilities) (0.13) (0.05) (0.21)
Sensitivity
The sensitivity of profit or loss to changes in the exchange rates arises mainly from foreign currency denominated
financial instruments.
(H crores)
Particulars 31 March 2017 31 March 2016
JPY sensitivity
INR/JPY- increase by 500 bps (31 March 2016 500 bps)* (0.01) -
INR/JPY- decrease by 500 bps (31 March 2016 500 bps)* 0.01 -
* Holding all other variables constant
Notes forming part of the Financial Statements for the year ended 31 March 2017
71st Annual Report 2016-17 173
STRATEGIC REPORT GOVERNANCE FINANCIAL STATEMENTS OTHER INFORMATION
37 Financial instruments (contd.)
b) Interest rate risk
i) Liabilities
The Company’s policy is to minimise interest rate cash flow risk exposures on long-term financing. At 31 March 2017,
the Company is exposed to changes in market interest rates through bank borrowings at variable interest rates. The
Company’s investments in fixed deposits all pay fixed interest rates.
Interest rate risk exposure
Below is the overall exposure of the Company to interest rate risk:
(H crores)
Particulars 31 March 2017 31 March 2016 1 April 2015
Variable rate borrowing 162.22 215.15 329.88
Fixed rate borrowing 100.59 145.35 168.35
Total borrowings 262.81 360.50 498.23
Amount disclosed under other current financial liabilites 47.54 52.84 72.23
Amount dislosed under borrowings 215.27 307.66 426.00
Sensitivity
Below is the sensitivity of profit or loss in interest rates.
(H crores)
Particulars 31 March 2017 31 March 2016
Interest sensitivity*
Interest rates – increase by 100 basis points (100 bps) 1.62 2.15
Interest rates – decrease by 100 basis points (100 bps) (1.62) (2.15)
* Holding all other variables constant
ii) Assets
The Company’s fixed deposits are carried at amortised cost and are fixed rate deposits. They are therefore not subject
to interest rate risk as defined in Ind AS 107, since neither the carrying amount nor the future cash flows will fluctuate
because of a change in market interest rates.
c) Price risk
i) Exposure
The Company’s exposure price risk arises from investments held and classified in the balance sheet either as fair value
through other comprehensive income or at fair value through profit or loss. To manage the price risk arising from
investments, the Company diversifies its portfolio of assets.
ii) Sensitivity
The table below summarises the impact of increases/decreases of the index on the Company’s equity and profit for the
period :
Impact on profit after tax (H crores)
Particulars 31 March 2017 31 March 2016
Mutual funds
Net assets value – increase by 100 bps (500bps) 1.69 0.23
Net assets value – decrease by 100 bps (500bps) (1.69) (0.23)
Impact on other comprehensive income (H crores)
Particulars 31 March 2017 31 March 2016
Unquoted equity instruments
Value per share – increase by 500 bps (500bps) 1.79 1.40
Value per share – decrease by 500 bps (500bps) (1.79) (1.40)
Quoted equity instruments
Market price – increase by 500 bps (500bps) 0.03 0.02
Market price – decrease by 500 bps (500bps) (0.03) (0.02)

Notes forming part of the Financial Statements for the year ended 31 March 2017
Escorts Limited174
38 Capital management
The Company’ s capital management objectives are
- to ensure the Company’s ability to continue as a going concern
- to provide an adequate return to shareholders
The Company monitors capital on the basis of the carrying amount of equity less cash and cash equivalents as presented on
the face of balance sheet.
Management assesses the Company’s capital requirements in order to maintain an efficient overall financing structure while
avoiding excessive leverage. This takes into account the subordination levels of the Company’s various classes of debt. The
Company manages the capital structure and makes adjustments to it in the light of changes in economic conditions and
the risk characteristics of the underlying assets. In order to maintain or adjust the capital structure, the Company may adjust
the amount of dividends paid to shareholders, return capital to shareholders, issue new shares, or sell assets to reduce debt.
(a) Debt equity ratio (H crores)
Particulars 31 March 2017 31 March 2016 1 April 2015
Net debts 262.81 360.50 498.23
Total equity 1,991.16 1,837.68 1,762.64
Net debt to equity ratio 13% 20% 28%
(b) Dividends (H crores)
Particulars 31 March 2017 31 March 2016
(i) Equity shares
Final dividend for the year ended 31 March 2016 of H1.20 per share
(excluding tax)
14.71 -
Final dividend for the year ended 31 March 2015 of H1.20 per share
(excluding tax)
- 14.71
(ii) Dividends not recognised at the end of the reporting period
In addition to the above dividends, since year end the directors have recommended the payment of a final dividend
of H1.50 per fully paid equity share. This proposed dividend is subject to the approval of shareholders in the ensuing
annual general meeting.
39 Employee benefits
Gratuity
The Company provides for gratuity for employees in India as per the Payment of Gratuity Act, 1972. Employees who are in
continuous service for a period of 5 years are eligible for gratuity. The amount of gratuity payable on retirement/termination
is the employees’ last drawn basic salary per month computed proportionately for 15 days salary multiplied for the number
of years of service.
(i) Amount recognised in the balance sheet is as under:
(H crores)
Particulars 31 March 2017 31 March 2016 1 April 2015
Current Non-current Current Non-current Current Non-current
Gratuity 45.63 - 51.56 - 55.57 -
Notes forming part of the Financial Statements for the year ended 31 March 2017
71st Annual Report 2016-17 175
STRATEGIC REPORT GOVERNANCE FINANCIAL STATEMENTS OTHER INFORMATION
(ii) Amount recognised in the statement of profit and loss is as under:
(H crores)
Description 31 March 2017 31 March 2016
Current service cost 4.26 4.50
Net interest cost 4.10 4.42
Net impact on profit (before tax) 8.36 8.92
Continuing operations 8.05 8.39
Discontinued operations 0.31 0.54
Actuarial loss/(gain) recognised during the year (Continuing operations) 2.64 (0.66)
Amount recognised in the statement of profit and loss 11.00 8.26
(iii) Movement in the present value of defined benefit obligation recognised in the balance sheet is as under:
(H crores)
Description 31 March 2017 31 March 2016
Present value of defined benefit obligation as at the start of the year 86.52 88.86
Current service cost 4.26 4.50
Interest cost 6.92 7.11
Actuarial loss/(gain) recognised during the year 2.69 (0.55)
Benefits paid (17.78) (13.40)
Present value of defined benefit obligation as at the end of the year 82.61 86.52
(iv) Movement in the plan assets recognised in the balance sheet is as under:
(H crores)
Description 31 March 2017 31 March 2016
Fair Value of plan assets at beginning of year 34.96 33.29
Expected return on plan assets 2.83 2.69
Employer's contribution 16.92 12.27
Benefits paid (17.78) (13.40)
Actuarial gain/(loss) on plan assets 0.05 0.11
Fair Value of plan assets at the end of the year 36.98 34.96
Actual return on plan assets 2.88 2.79
(v) Breakup of actuarial (gain)/loss:
(H crores)
Description 31 March 2017 31 March 2016
Actuarial (gain)/loss on arising from change in demographic assumption - -
Actuarial (gain)/loss on arising from change in financial assumption (0.20) (0.11)
Actuarial (gain)/loss on arising from experience adjustment 2.84 (0.55)
Total actuarial (gain)/loss 2.64 (0.66)
(vi) Actuarial assumptions
(H crores)
Description 31 March 2017 31 March 2016 1 April 2015
Discount rate 7.52% 8.00% 8.00%
Future salary increase 5.00% 5.50% 5.50%
Expected average remaining working lives of employees (years) 16.89 16.64 16.04
39 Employee benefits (contd.)

Notes forming part of the Financial Statements for the year ended 31 March 2017
Escorts Limited176
39 Employee benefits (contd.)
Gratuity is payable to the employees on death or resignation or on retirement at the attainment of superannuation age.
To provide for these eventualities, the Actuary has used Indian Assured Lives Mortality (2006-08) Ultimate table.
These assumptions were developed by management with the assistance of independent actuarial appraisers. Discount
factors are determined close to each year-end by reference to government bonds of relevant economic markets and
that have terms to maturity approximating to the terms of the related obligation. Other assumptions are based on
management’s historical experience.
(vii) Sensitivity analysis for gratuity liability
(H crores)
Description 31 March 2017 31 March 2016 1 April 2015
Impact of the change in discount rate
Present value of obligation at the end of the year 82.61 86.52 88.85
Impact due to increase of 0.50 % (2.17) (2.33) (2.38)
Impact due to decrease of 0.50 % 2.29 2.46 2.51
Impact of the change in salary increase
Present value of obligation at the end of the year 82.61 86.52 88.85
Impact due to increase of 0.50 % 2.34 2.50 2.56
Impact due to decrease of 0.50 % (2.23) (2.39) (2.45)
The above sensitivity analysis are based on a change in an assumption while holding all other assumptions constant.
In practice, this is unlikely to occur and changes in some of the assumptions may be correlated. When calculating the
sensitivity of the defined benefit obligation to significant actuarial assumptions the same method (present value of the
defined benefit obligation calculated with the projected unit credit method at the end of the reporting period) has been
applied which was applied while calculating the defined benefit obligation liability recognised in the balance sheet.
The methods and types of assumptions used in preparing the sensitivity analysis did not change compared to prior
period.
(viii) Maturity profile of defined benefit obligation
(H crores)
Description 31 March 2017 31 March 2016
Within next 12 months 11.99 11.56
Between 1-5 years 16.02 46.13
Beyond 5 years 54.60 28.82
(ix) Category of plan assets
(H crores)
Particulars 31 March 2017 31 March 2016 1 April 2015
LIC of India - Group Gratuity Cash Accumulation Fund 36.63 34.78 32.54
Others 0.35 0.18 0.75
Total 36.98 34.96 33.29
(x) The Company expects to contribute H7.66 crores (previous year H8.83) to its gratuity plan for the next year.
B Compensated absences (unfunded)
The leave obligations cover the Company’s liability for sick and earned leaves. The Company does not have an
unconditional right to defer settlement for the obligation shown as current provision balance above. However based
Notes forming part of the Financial Statements for the year ended 31 March 2017
71st Annual Report 2016-17 177
STRATEGIC REPORT GOVERNANCE FINANCIAL STATEMENTS OTHER INFORMATION
39 Employee benefits (contd.)
on past experience, the Company does not expect all employees to take the full amount of accrued leave or require
payment within the next 12 months, therefore based on the independent actuarial report, only a certain amount of
provision has been presented as current and remaining as non-current. Amount of H4.24 crores ( Previous year: H5.17
crores) has been recognised in the statement of profit and loss.
(H crores)
Particulars 31 March 2017 31 March 2016 1 April 2015
Current Non-current Current Non-current Current Non-current
Compensated absences
(unfunded)
2.66 12.42 2.82 13.51 2.66 13.97
C Defined contribution plans
The Company makes contributions, determined as a specified percentage of employee salaries, in respect of qualifying
employees towards Provident Fund and Employee State Insurance Scheme which are defined contribution plans. The
Company has no obligations other than to make the specified contributions. The contributions are charged to the
statement of profit and loss as they accrue. The amount recognised as an expense towards contribution to Provident
Fund for the year aggregated to H16.37 crores (Previous year: H17.05 crores) and contribution to Employee State Insurance
Scheme for the year aggregated to H0.35 crores (Previous year: H0.45 crores).
D The Company has taken an Insurance policy for medical benefits in respect of its retired and working employees. The
Insurance policy for on-roll employees is fully funded by the Company.
40 Share-based payments
The option plan is designed to provide incentives to employees of the Company. Under the plan, participants have been
granted options which will vest as follows:
Scheme Vesting conditions Exercise period Exercise price per share (H)
Employees Stock Option
Scheme, 2006
Vested after one year from
the date of grant
Two years from the date of
vesting
85.00
Options are granted under the plan for the consideration of H85 per share and carry no dividend or voting rights. When
exercisable, each option is convertible into one equity share. For the options which were vested before 31 March 2015, using
the Ind AS transition exemption (as explained in the accounting policies) the expense related to options is arrived at using
intrinsic value of the shares on the date of grant.
Set out below is a summary of options granted under the plan:
Particulars 31 March 2017 31 March 2016
Number of
options
Number of
options
Opening balance 1,11,100 1,92,000
Granted during the year - 2,56,000
Exercised during the year* 84,000 1,08,000
Lapsed during the year - 2,28,900
Closing balance 27,100 1,11,100
* The weighted average share price at the date of exercise of options during the year ended 31 March 2017 was H260 (31
March 2016 H153.30).
Weighted average remaining contractual life of options as at 31 March 2017 was 1.5 years (31 March 2016 : 0.99 years and 1
April 2015 : 1.5 years).
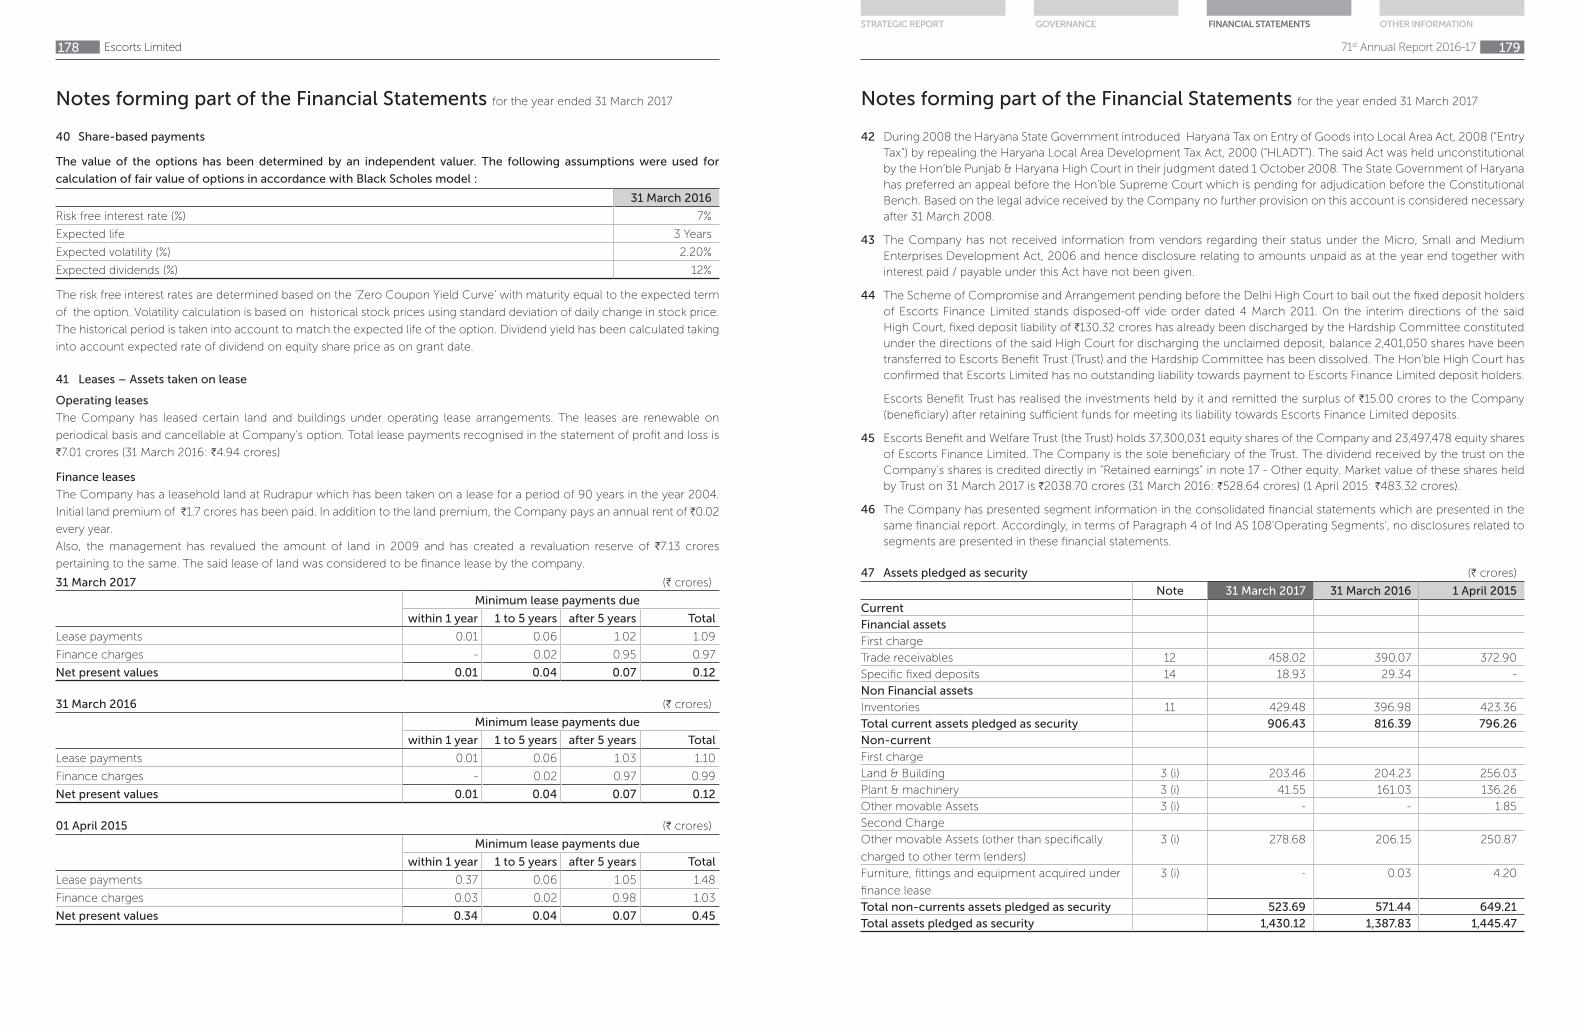
Notes forming part of the Financial Statements for the year ended 31 March 2017
Escorts Limited178
40 Share-based payments
The value of the options has been determined by an independent valuer. The following assumptions were used for
calculation of fair value of options in accordance with Black Scholes model :
31 March 2016
Risk free interest rate (%) 7%
Expected life 3 Years
Expected volatility (%) 2.20%
Expected dividends (%) 12%
The risk free interest rates are determined based on the ‘Zero Coupon Yield Curve’ with maturity equal to the expected term
of the option. Volatility calculation is based on historical stock prices using standard deviation of daily change in stock price.
The historical period is taken into account to match the expected life of the option. Dividend yield has been calculated taking
into account expected rate of dividend on equity share price as on grant date.
41 Leases – Assets taken on lease
Operating leases
The Company has leased certain land and buildings under operating lease arrangements. The leases are renewable on
periodical basis and cancellable at Company's option. Total lease payments recognised in the statement of profit and loss is
H7.01 crores (31 March 2016: H4.94 crores)
Finance leases
The Company has a leasehold land at Rudrapur which has been taken on a lease for a period of 90 years in the year 2004.
Initial land premium of H1.7 crores has been paid. In addition to the land premium, the Company pays an annual rent of H0.02
every year.
Also, the management has revalued the amount of land in 2009 and has created a revaluation reserve of H7.13 crores
pertaining to the same. The said lease of land was considered to be finance lease by the company.
31 March 2017 (H crores)
Minimum lease payments due
within 1 year 1 to 5 years after 5 years Total
Lease payments 0.01 0.06 1.02 1.09
Finance charges - 0.02 0.95 0.97
Net present values 0.01 0.04 0.07 0.12
31 March 2016 (H crores)
Minimum lease payments due
within 1 year 1 to 5 years after 5 years Total
Lease payments 0.01 0.06 1.03 1.10
Finance charges - 0.02 0.97 0.99
Net present values 0.01 0.04 0.07 0.12
01 April 2015 (H crores)
Minimum lease payments due
within 1 year 1 to 5 years after 5 years Total
Lease payments 0.37 0.06 1.05 1.48
Finance charges 0.03 0.02 0.98 1.03
Net present values 0.34 0.04 0.07 0.45
Notes forming part of the Financial Statements for the year ended 31 March 2017
71st Annual Report 2016-17 179
STRATEGIC REPORT GOVERNANCE FINANCIAL STATEMENTS OTHER INFORMATION
42 During 2008 the Haryana State Government introduced Haryana Tax on Entry of Goods into Local Area Act, 2008 (“Entry
Tax”) by repealing the Haryana Local Area Development Tax Act, 2000 (“HLADT”). The said Act was held unconstitutional
by the Hon’ble Punjab & Haryana High Court in their judgment dated 1 October 2008. The State Government of Haryana
has preferred an appeal before the Hon’ble Supreme Court which is pending for adjudication before the Constitutional
Bench. Based on the legal advice received by the Company no further provision on this account is considered necessary
after 31 March 2008.
43 The Company has not received information from vendors regarding their status under the Micro, Small and Medium
Enterprises Development Act, 2006 and hence disclosure relating to amounts unpaid as at the year end together with
interest paid / payable under this Act have not been given.
44 The Scheme of Compromise and Arrangement pending before the Delhi High Court to bail out the fixed deposit holders
of Escorts Finance Limited stands disposed-off vide order dated 4 March 2011. On the interim directions of the said
High Court, fixed deposit liability of H130.32 crores has already been discharged by the Hardship Committee constituted
under the directions of the said High Court for discharging the unclaimed deposit, balance 2,401,050 shares have been
transferred to Escorts Benefit Trust (Trust) and the Hardship Committee has been dissolved. The Hon’ble High Court has
confirmed that Escorts Limited has no outstanding liability towards payment to Escorts Finance Limited deposit holders.
Escorts Benefit Trust has realised the investments held by it and remitted the surplus of H15.00 crores to the Company
(beneficiary) after retaining sufficient funds for meeting its liability towards Escorts Finance Limited deposits.
45 Escorts Benefit and Welfare Trust (the Trust) holds 37,300,031 equity shares of the Company and 23,497,478 equity shares
of Escorts Finance Limited. The Company is the sole beneficiary of the Trust. The dividend received by the trust on the
Company's shares is credited directly in “Retained earnings” in note 17 - Other equity. Market value of these shares held
by Trust on 31 March 2017 is H2038.70 crores (31 March 2016: H528.64 crores) (1 April 2015: H483.32 crores).
46 The Company has presented segment information in the consolidated financial statements which are presented in the
same financial report. Accordingly, in terms of Paragraph 4 of Ind AS 108‘Operating Segments’, no disclosures related to
segments are presented in these financial statements.
47 Assets pledged as security (H crores)
Note 31 March 2017 31 March 2016 1 April 2015
Current
Financial assets
First charge
Trade receivables 12 458.02 390.07 372.90
Specific fixed deposits 14 18.93 29.34 -
Non Financial assets
Inventories 11 429.48 396.98 423.36
Total current assets pledged as security 906.43 816.39 796.26
Non-current
First charge
Land & Building 3 (i) 203.46 204.23 256.03
Plant & machinery 3 (i) 41.55 161.03 136.26
Other movable Assets 3 (i) - - 1.85
Second Charge
Other movable Assets (other than specifically
charged to other term lenders)
3 (i) 278.68 206.15 250.87
Furniture, fittings and equipment acquired under
finance lease
3 (i) - 0.03 4.20
Total non-currents assets pledged as security 523.69 571.44 649.21
Total assets pledged as security 1,430.12 1,387.83 1,445.47

Notes forming part of the Financial Statements for the year ended 31 March 2017
Escorts Limited180
48 Related party transactions
The Company’s related party transactions and outstanding balances are with its subsidiaries, associates and joint venture, key
management and others as described below.
A Relationships
Subsidiaries
Domestic Overseas
EDDAL Credit Limited Farmtrac Tractors Europe Sp. Z.o.o, Poland
Escorts Asset Management Limited
Escorts Securities Limited
Escorts Benefit and Welfare Trust
Escorts Finance Limited
Escorts Benefit Trust
Joint venture
Adico Escorts Agri Equipment Private Limited
Associates
Escorts Consumer Credit Limited
B Key management personnel and Directors
Mr. Rajan Nanda Chairman and Managing Director
Mr. Nikhil Nanda Managing Director
Mr. Bharat Madan Group Chief Financial Officer
Mr. Ajay Sharma Group General Counsel and Company Secretary
Other Directors
Ms. Nitasha Nanda
Mr. Hardeep Singh
Mr. P.H Ravikumar
Ms. Vibha Paul Rishi
Mr. Sutanu Behuria
Mr. Darius Jehangir Kakalia
Mr. G. B. Mathur
Enterprises over which key management personnel and relatives of such personnel exercise significant influence
Rimari India Private Limited Breeze Trading Private Limited
Tashaka India Private Limited Niky Tasha Electronics Limited
AAA Portfolios Private Limited Escorts Investment Trust Limited
Escorts Skill Development Sun & Moon Travels (India) Private Limited
Niky Tasha Energies Private Limited Charak Ayurvedic Treatments Private Limited
Rimari IT Solutions Private Limited Crystal Care Advisors Private Limited
Momento Communications Private Limited Sharak Healthcare Private Limited
Rakshak Health Service Private Limited Big Apple Clothing Private Limited
Har Parshad and Company Private Limited Sietz Technologies India Private Limited
Raksha TPA Private Limited Niky Tasha Communications Private Limited
Ritu Nanda Insurance Service Private Limited Sun & Moon Advisory Services Private Limited
Escolife IT Services Private Limited Escorts Employees Welfare Limited
Academy of Management and Financial Planing Private Limited Powermech Projects Limited
List of other related parties
Mrs. Ritu Nanda
Escorts Limited Employees' Group Gratuity Fund Trust (refer note 39 for transaction)
Notes forming part of the Financial Statements for the year ended 31 March 2017
71st Annual Report 2016-17 181
STRATEGIC REPORT GOVERNANCE FINANCIAL STATEMENTS OTHER INFORMATION
48 Related party transactions (contd.)
Key management personnel remuneration includes the following expenses:
(H crores)
31 March 2017 31 March 2016
Short-term employee benefits: 19.66 11.88
Post-employment benefits: 0.54 0.52
Total remuneration 20.20 12.40
C Transactions with related party
(i) Transactions with joint ventures
During 2016-17, Adico Escorts Agri Equipment Private Limited provided rental services valued at H0.01 crores (2015-16:
H0.01 crores) and sold tractors to Escorts Limited valued at H16.94 crores (2015-16: H13.14 crores) . There is a recoverable
outstanding on account of transactions as at 31 March 2017 of H0.02 crores (31 March 2016: Nil) (1 April 2015: Nil).
(ii) Transactions with associates
There is a payable outstanding on account of transactions as at 31 March 2017 of H2.09 crores (31 March 2016: H2.09
crores) (1 April 2015: Nil) against Escorts Consumer Credit Limited.
(iii) Transactions with Subsidiaries :
(H crores)
Nature of transactions* Sale of
goods
Discounting
Charges
Services
received
Purchase
of goods
Warranty
reimburse-
ments
Dividend
Paid**
Distribution
received
Debtors /
Receivables
Payables
Farmtrac Tractors Europe Sp.
Z.o.o, Poland
6.41 - 0.15 1.55 0.42 - - 27.97 0.37
(20.38) - (0.40) (0.13) (0.28) - - (34.98) (0.11)
EDDAL Credit Limited - 0.04 - - - - - - 1.72
- (0.12) - - - - - - (2.15)
Escorts Benefit Trust - - - - - - 15.00 - -
- - - - - - - - -
Escorts Benefit and Welfare Trust - - - - - 4.48 - - -
- - - - - (4.48) - - -
*Numbers in brackets represents financial year ending 31 March 2016
** The Company receives the same dividend back from Escorts Benefit and Welfare Trust in the same year as the
Company is the sole beneficiary of this trust (refer note 45)
(H crores)
Outstanding balances as at 1 April 2015 Debtors /
receivables
Payables
Farmtrac Tractors Europe Sp. Z.o.o, Poland 22.40 0.15
EDDAL Credit Limited - 2.07

Notes forming part of the Financial Statements for the year ended 31 March 2017
Escorts Limited182
48 Related party transactions (contd.)
(iii) Transactions with key management personnel, their relatives and entities in which they exercise control/significant
influence
(H crores)
Nature of transactions* Royalty Remunera-
tion / com-
mission
Rent
received
Rent paid Purchase
of goods
Sale of
goods and
services
Services
received
Dividend
paid
Advance
given
Debtors /
Receivables
Payables
Rajan Nanda - 8.76 - - - - - 0.12 - - 3.50
- (5.26) - - - - - (0.12) - - -
Ritu Nanda - - - 0.36 - - - 0.01 - - -
- - - (0.36) - - - (0.01) - - -
Nikhil Nanda - 8.58 0.49 - - - - 0.03 - - 3.50
- (5.13) (0.44) - - - - (0.03) - - -
Nitasha Nanda - 2.48 - 0.41 - - 0.02 - 0.06 - 1.00
- (1.46) - (0.39) - - (0.04) - (0.06) - -
Bharat Madan - 1.87 - - - - - - - - -
- (1.28) - - - - - - - - -
Ajay Sharma - 0.98 - - - - - - - - -
- (0.73) - - - - - - - - -
Girish Bihari Mathur - - - - - - 1.03 - - - 0.08
- - - - - - (1.81) - - - (0.07)
S.A. Dave - - - - - - 0.02 - - - -
- - - - - - (0.07) - - - -
Hardeep Singh - 0.08 - - - - 0.06 - - - 0.08
- - - - - - (0.08) - - - -
P.H Ravikumar - 0.08 - - - - 0.05 - - - 0.08
- - - - - - (0.03) - - - -
Vibha Paul Rishi - 0.08 - - - - 0.03 - - - 0.08
- - - - - - (0.03) - - - -
Sutanu Behuria - 0.08 - - - - 0.04 - - - 0.08
- - - - - - (0.03) - - - -
Darius Jehangir Kakalia - 0.08 - - - - 0.02 - - - 0.08
- - - - - - - - - - -
Harparshad & Co.Private Limited 20.62 - - - - - - 1.26 - - 0.22
(17.28) - - - - - - (1.26) - - (5.84)
Raksha TPA Private Limited - - 0.79 - - - - - 0.53 - -
- - (0.75) - - - - - (0.37) - -
Rimari India Private Limited - - - - - - 0.05 - 0.12 - -
- - - - - - (0.01) - (0.12) - (0.01)
Momento Communications
Private Limited
- - - - - - 0.37 - - - -
- - - - - - (0.15) - - - (0.03)
AAA Portfolios Private Limited - - - - - - - 0.20 - - -
- - - - - - - (0.20) - - -
Big Apple Clothing Private
Limited
- - - - - - - 0.21 - - -
- - - - - - - (0.21) - - -
Niky Tasha Communications
Private Limited
- - - - - - - - - - -
- - - - - - - - - - -
Niky Tasha Energies Private
Limited
- - - - - - - - - - -
- - - - - - - - - - -
Sietz Technologies India Private
Limited
- - 0.36 1.22 232.53 1.44 0.28 - 0.97 1.36 15.39
- - (0.36) (1.16) (190.22) (1.34) (0.25) - (0.65) (1.40) (11.50)
Sun & Moon Travels (India)
Private Limited
- - 0.02 - - - 11.25 - 0.51 - 0.74
- - (0.02) - - - (7.05) - (0.01) - (0.14)
Escorts Employee Welfare
Limited (gross of provisions)
- - - - - - - - 3.00 0.15 -
- - - - - - - - (3.00) - -
Escorts Skill Development - - - - - - 0.50 - - - 6.60
- - - - - - (0.50) - - - -
Powermech Projects Limited - - - - - 0.73 - - - 0.01 -
- - - - - (0.36) - - - (0.01) -
*Numbers in brackets represents financial year ending 31 March 2016
Notes forming part of the Financial Statements for the year ended 31 March 2017
71st Annual Report 2016-17 183
STRATEGIC REPORT GOVERNANCE FINANCIAL STATEMENTS OTHER INFORMATION
48 Related party transactions (contd.)
(H crores)
Outstanding balances as at 1 April 2015 Advance given Debtors /
receivables
Payables
Nitasha Nanda 0.06 - -
Harparshad & Co.Private Limited - - 7.21
Raksha TPA Private Limited 0.29 - 0.01
Rimari India Private Limited 0.12 - -
Sietz Technologies India Private Limited 0.37 1.21 9.14
Sun & Moon Travels (India) Private Limited - - 0.18
Escorts Employee Welfare Limited (gross of provisions) 3.04 - -
49 First time adoption of Ind AS
These are the Company’s first financial statements prepared in accordance with Ind AS.
The accounting policies set out in note 2.2 have been applied in preparing the financial statements for the year ended 31
March 2017, the comparative information presented in these financial statements for the year ended 31 March 2016 and in
the preparation of an opening Ind AS balance sheet at 1 April 2015 (the Company’s date of transition). An explanation of how
the transition from previous GAAP to Ind AS has affected the Company’s financial position, financial performance and cash
flows is set out in the following tables and notes.
A Ind AS optional exemptions
1 Deemed cost for property, plant and equipment, investment property and intangible assets
Ind AS 101 permits a first-time adopter to elect to continue with the carrying value for all of its property, plant and equipment
as recognised in the financial statements as at the date of transition to Ind AS, measured as per the previous GAAP and use
that as its deemed cost as at the date of transition after making necessary adjustments for de-commissioning liabilities.
This exemption can also be used for intangible assets covered by Ind AS 38 Intangible Assets and investment property
covered by Ind AS 40 Investment Properties. Accordingly, the Company has elected to measure all of its property, plant
and equipment, intangible assets and investment property at their Previous GAAP carrying value.
2 Designation of previously recognised financial instruments
Ind AS 101 allows an entity to designate investments in equity instruments at FVOCI on the basis of the facts and
circumstances at the date of transition to Ind AS. The Company has elected to apply this exemption for its investment in
equity investments.
3 Share based payments
Ind AS 102 Share based payments requires an entity to recognise the equity settled share based payment plans based
on fair value of the stock options granted to employees instead of intrinsic value. Ind AS 101 permits a first time adopter
to ignore such requirement for the options already vested as on transition date that is 01 April 2015. The Company has
elected to apply this exemptions for such vested options.
4 Assets held for sale
The company has elected to measure non-current assets held for sale at the lower of carrying value and fair value less
cost to sell at the date of transition and recognize directly in retained earnings any difference between that amount and
the carrying amount of those assets at the date of transition.
5 Deemed cost for investments in subsidiaries, associates and joint ventures
The Company has elected to continue with the carrying value of all of its investments in subsidiaries, joint ventures and
associates recognised as of 1 April 2015 (transition date) measured as per the Previous GAAP as its deemed cost as at the
date of transition.
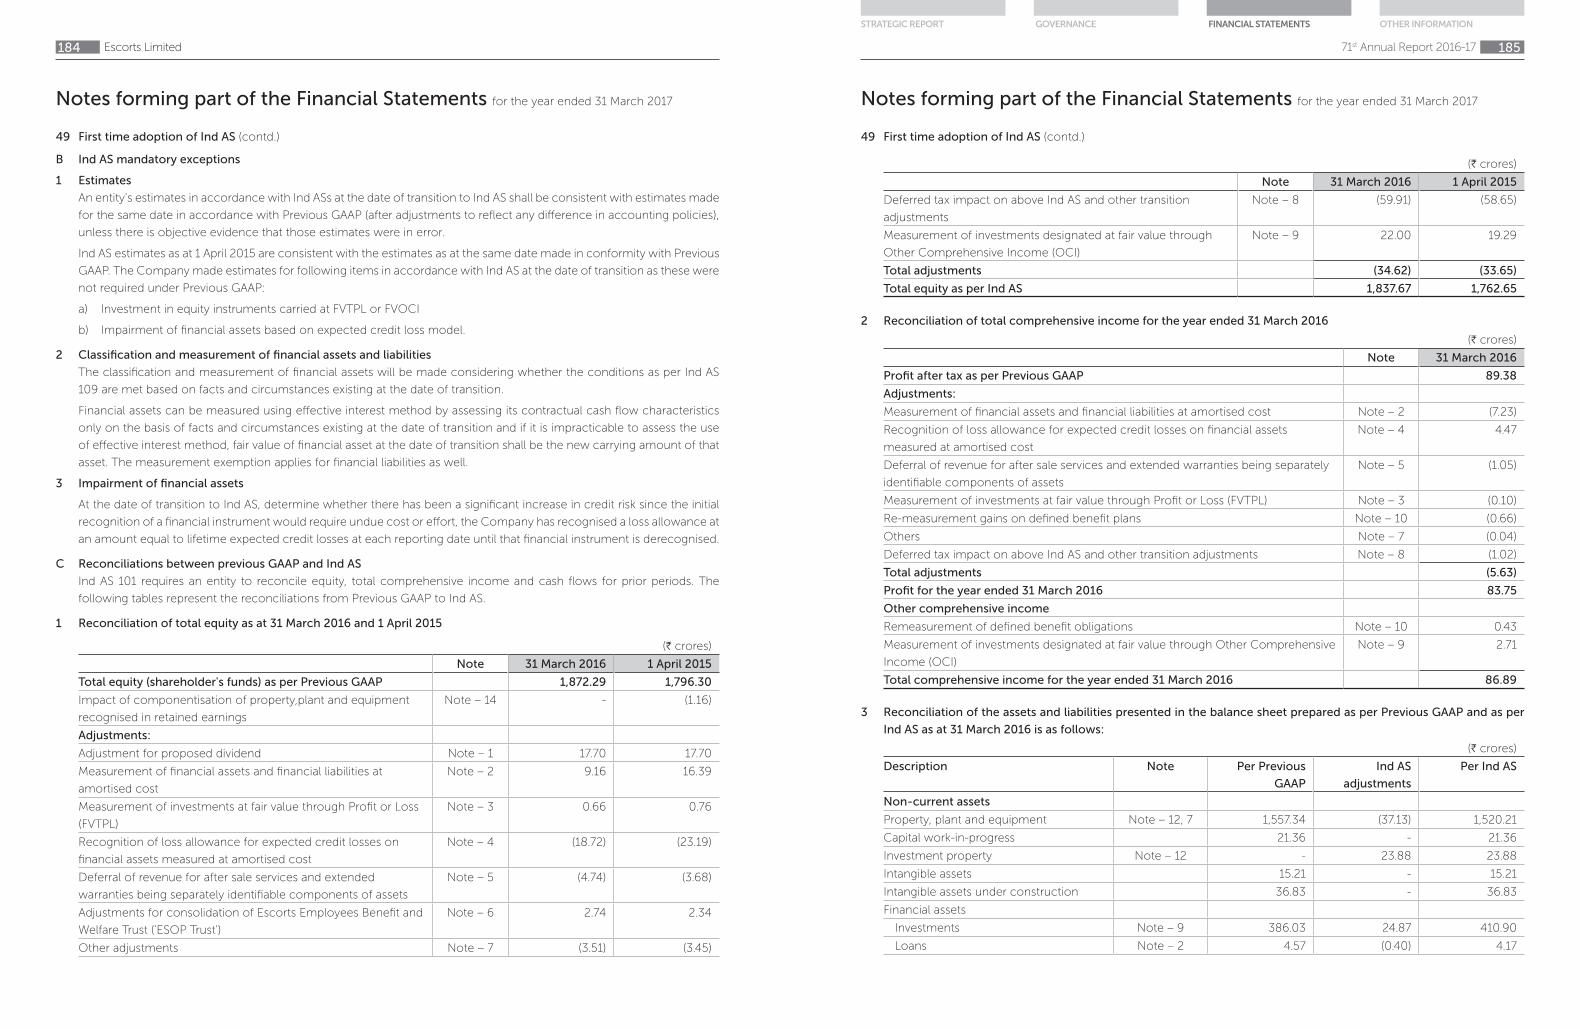
Notes forming part of the Financial Statements for the year ended 31 March 2017
Escorts Limited184
B Ind AS mandatory exceptions
1 Estimates
An entity’s estimates in accordance with Ind ASs at the date of transition to Ind AS shall be consistent with estimates made
for the same date in accordance with Previous GAAP (after adjustments to reflect any difference in accounting policies),
unless there is objective evidence that those estimates were in error.
Ind AS estimates as at 1 April 2015 are consistent with the estimates as at the same date made in conformity with Previous
GAAP. The Company made estimates for following items in accordance with Ind AS at the date of transition as these were
not required under Previous GAAP:
a) Investment in equity instruments carried at FVTPL or FVOCI
b) Impairment of financial assets based on expected credit loss model.
2 Classification and measurement of financial assets and liabilities
The classification and measurement of financial assets will be made considering whether the conditions as per Ind AS
109 are met based on facts and circumstances existing at the date of transition.
Financial assets can be measured using effective interest method by assessing its contractual cash flow characteristics
only on the basis of facts and circumstances existing at the date of transition and if it is impracticable to assess the use
of effective interest method, fair value of financial asset at the date of transition shall be the new carrying amount of that
asset. The measurement exemption applies for financial liabilities as well.
3 Impairment of financial assets
At the date of transition to Ind AS, determine whether there has been a significant increase in credit risk since the initial
recognition of a financial instrument would require undue cost or effort, the Company has recognised a loss allowance at
an amount equal to lifetime expected credit losses at each reporting date until that financial instrument is derecognised.
C Reconciliations between previous GAAP and Ind AS
Ind AS 101 requires an entity to reconcile equity, total comprehensive income and cash flows for prior periods. The
following tables represent the reconciliations from Previous GAAP to Ind AS.
1 Reconciliation of total equity as at 31 March 2016 and 1 April 2015
(H crores)
Note 31 March 2016 1 April 2015
Total equity (shareholder's funds) as per Previous GAAP 1,872.29 1,796.30
Impact of componentisation of property,plant and equipment
recognised in retained earnings
Note – 14 - (1.16)
Adjustments:
Adjustment for proposed dividend Note – 1 17.70 17.70
Measurement of financial assets and financial liabilities at
amortised cost
Note – 2 9.16 16.39
Measurement of investments at fair value through Profit or Loss
(FVTPL)
Note – 3 0.66 0.76
Recognition of loss allowance for expected credit losses on
financial assets measured at amortised cost
Note – 4 (18.72) (23.19)
Deferral of revenue for after sale services and extended
warranties being separately identifiable components of assets
Note – 5 (4.74) (3.68)
Adjustments for consolidation of Escorts Employees Benefit and
Welfare Trust ('ESOP Trust')
Note – 6 2.74 2.34
Other adjustments Note – 7 (3.51) (3.45)
49 First time adoption of Ind AS (contd.)
Notes forming part of the Financial Statements for the year ended 31 March 2017
71st Annual Report 2016-17 185
STRATEGIC REPORT GOVERNANCE FINANCIAL STATEMENTS OTHER INFORMATION
49 First time adoption of Ind AS (contd.)
(H crores)
Note 31 March 2016 1 April 2015
Deferred tax impact on above Ind AS and other transition
adjustments
Note – 8 (59.91) (58.65)
Measurement of investments designated at fair value through
Other Comprehensive Income (OCI)
Note – 9 22.00 19.29
Total adjustments (34.62) (33.65)
Total equity as per Ind AS 1,837.67 1,762.65
2 Reconciliation of total comprehensive income for the year ended 31 March 2016
(H crores)
Note 31 March 2016
Profit after tax as per Previous GAAP 89.38
Adjustments:
Measurement of financial assets and financial liabilities at amortised cost Note – 2 (7.23)
Recognition of loss allowance for expected credit losses on financial assets
measured at amortised cost
Note – 4 4.47
Deferral of revenue for after sale services and extended warranties being separately
identifiable components of assets
Note – 5 (1.05)
Measurement of investments at fair value through Profit or Loss (FVTPL) Note – 3 (0.10)
Re-measurement gains on defined benefit plans Note – 10 (0.66)
Others Note – 7 (0.04)
Deferred tax impact on above Ind AS and other transition adjustments Note – 8 (1.02)
Total adjustments (5.63)
Profit for the year ended 31 March 2016 83.75
Other comprehensive income
Remeasurement of defined benefit obligations Note – 10 0.43
Measurement of investments designated at fair value through Other Comprehensive
Income (OCI)
Note – 9 2.71
Total comprehensive income for the year ended 31 March 2016 86.89
3 Reconciliation of the assets and liabilities presented in the balance sheet prepared as per Previous GAAP and as per
Ind AS as at 31 March 2016 is as follows:
(H crores)
Description Note Per Previous
GAAP
Ind AS
adjustments
Per Ind AS
Non-current assets
Property, plant and equipment Note – 12, 7 1,557.34 (37.13) 1,520.21
Capital work-in-progress 21.36 - 21.36
Investment property Note – 12 - 23.88 23.88
Intangible assets 15.21 - 15.21
Intangible assets under construction 36.83 - 36.83
Financial assets
Investments Note – 9 386.03 24.87 410.90
Loans Note – 2 4.57 (0.40) 4.17
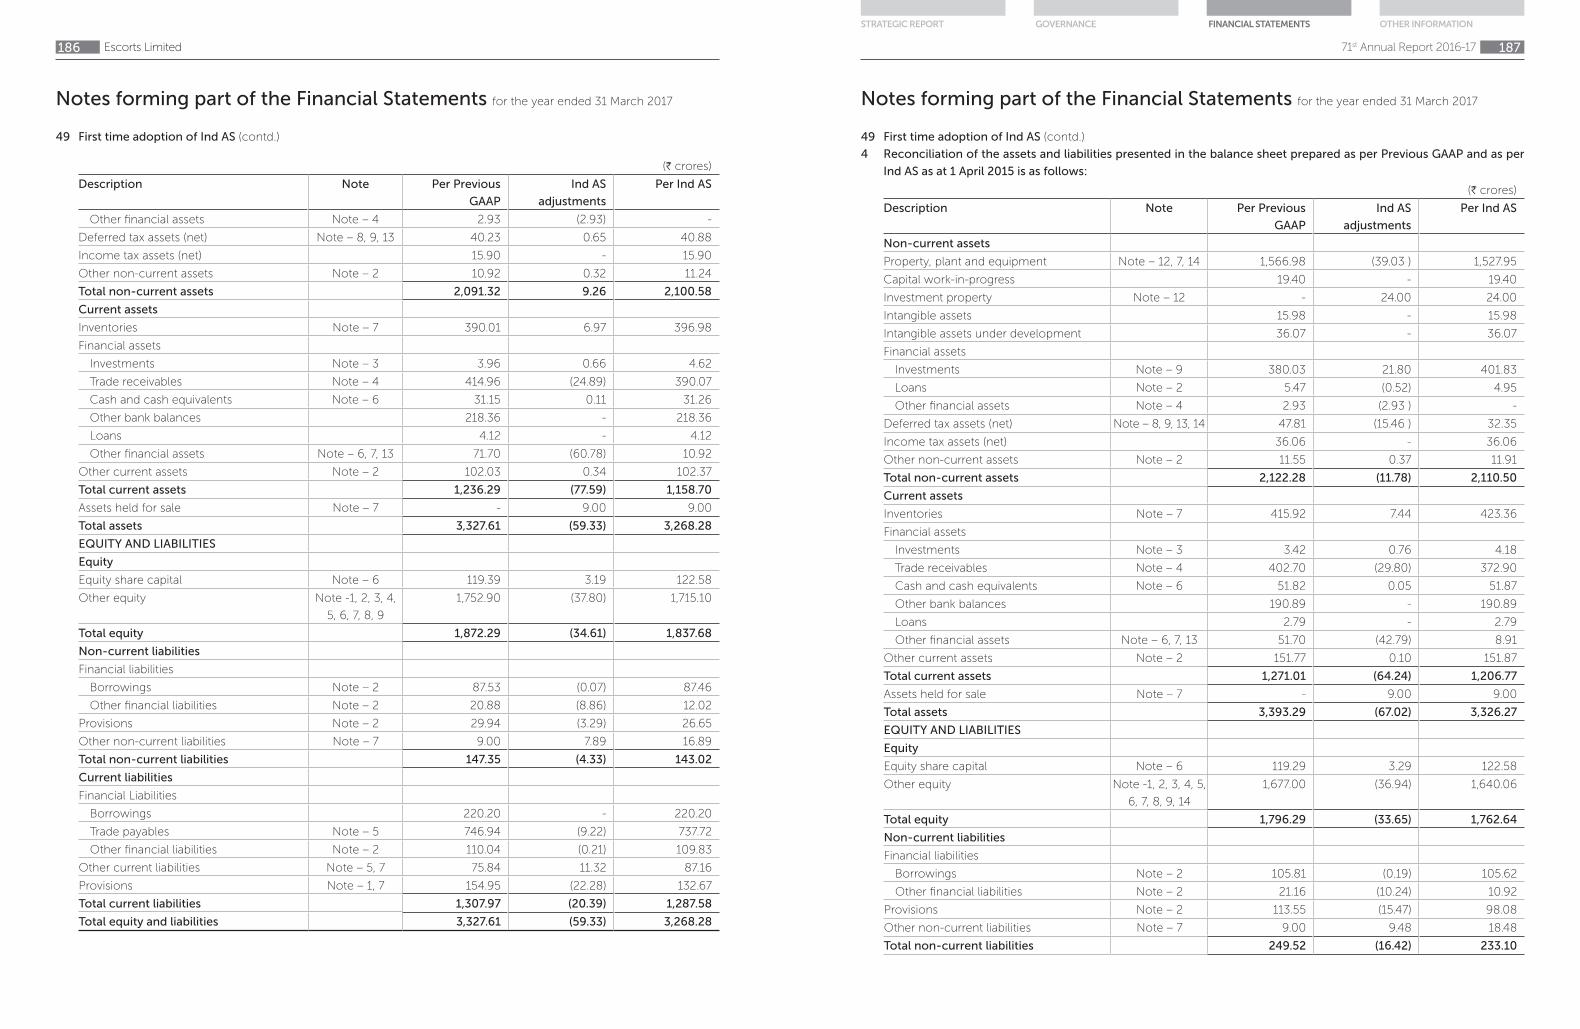
Notes forming part of the Financial Statements for the year ended 31 March 2017
Escorts Limited186
49 First time adoption of Ind AS (contd.)
(H crores)
Description Note Per Previous
GAAP
Ind AS
adjustments
Per Ind AS
Other financial assets Note – 4 2.93 (2.93) -
Deferred tax assets (net) Note – 8, 9, 13 40.23 0.65 40.88
Income tax assets (net) 15.90 - 15.90
Other non-current assets Note – 2 10.92 0.32 11.24
Total non-current assets 2,091.32 9.26 2,100.58
Current assets
Inventories Note – 7 390.01 6.97 396.98
Financial assets
Investments Note – 3 3.96 0.66 4.62
Trade receivables Note – 4 414.96 (24.89) 390.07
Cash and cash equivalents Note – 6 31.15 0.11 31.26
Other bank balances 218.36 - 218.36
Loans 4.12 - 4.12
Other financial assets Note – 6, 7, 13 71.70 (60.78) 10.92
Other current assets Note – 2 102.03 0.34 102.37
Total current assets 1,236.29 (77.59) 1,158.70
Assets held for sale Note – 7 - 9.00 9.00
Total assets 3,327.61 (59.33) 3,268.28
EQUITY AND LIABILITIES
Equity
Equity share capital Note – 6 119.39 3.19 122.58
Other equity Note -1, 2, 3, 4,
5, 6, 7, 8, 9
1,752.90 (37.80) 1,715.10
Total equity 1,872.29 (34.61) 1,837.68
Non-current liabilities
Financial liabilities
Borrowings Note – 2 87.53 (0.07) 87.46
Other financial liabilities Note – 2 20.88 (8.86) 12.02
Provisions Note – 2 29.94 (3.29) 26.65
Other non-current liabilities Note – 7 9.00 7.89 16.89
Total non-current liabilities 147.35 (4.33) 143.02
Current liabilities
Financial Liabilities
Borrowings 220.20 - 220.20
Trade payables Note – 5 746.94 (9.22) 737.72
Other financial liabilities Note – 2 110.04 (0.21) 109.83
Other current liabilities Note – 5, 7 75.84 11.32 87.16
Provisions Note – 1, 7 154.95 (22.28) 132.67
Total current liabilities 1,307.97 (20.39) 1,287.58
Total equity and liabilities 3,327.61 (59.33) 3,268.28
Notes forming part of the Financial Statements for the year ended 31 March 2017
71st Annual Report 2016-17 187
STRATEGIC REPORT GOVERNANCE FINANCIAL STATEMENTS OTHER INFORMATION
49 First time adoption of Ind AS (contd.)
4 Reconciliation of the assets and liabilities presented in the balance sheet prepared as per Previous GAAP and as per
Ind AS as at 1 April 2015 is as follows:
(H crores)
Description Note Per Previous
GAAP
Ind AS
adjustments
Per Ind AS
Non-current assets
Property, plant and equipment Note – 12, 7, 14 1,566.98 (39.03 ) 1,527.95
Capital work-in-progress 19.40 - 19.40
Investment property Note – 12 - 24.00 24.00
Intangible assets 15.98 - 15.98
Intangible assets under development 36.07 - 36.07
Financial assets
Investments Note – 9 380.03 21.80 401.83
Loans Note – 2 5.47 (0.52) 4.95
Other financial assets Note – 4 2.93 (2.93 ) -
Deferred tax assets (net) Note – 8, 9, 13, 14 47.81 (15.46 ) 32.35
Income tax assets (net) 36.06 - 36.06
Other non-current assets Note – 2 11.55 0.37 11.91
Total non-current assets 2,122.28 (11.78) 2,110.50
Current assets
Inventories Note – 7 415.92 7.44 423.36
Financial assets
Investments Note – 3 3.42 0.76 4.18
Trade receivables Note – 4 402.70 (29.80) 372.90
Cash and cash equivalents Note – 6 51.82 0.05 51.87
Other bank balances 190.89 - 190.89
Loans 2.79 - 2.79
Other financial assets Note – 6, 7, 13 51.70 (42.79) 8.91
Other current assets Note – 2 151.77 0.10 151.87
Total current assets 1,271.01 (64.24) 1,206.77
Assets held for sale Note – 7 - 9.00 9.00
Total assets 3,393.29 (67.02) 3,326.27
EQUITY AND LIABILITIES
Equity
Equity share capital Note – 6 119.29 3.29 122.58
Other equity Note -1, 2, 3, 4, 5,
6, 7, 8, 9, 14
1,677.00 (36.94) 1,640.06
Total equity 1,796.29 (33.65) 1,762.64
Non-current liabilities
Financial liabilities
Borrowings Note – 2 105.81 (0.19) 105.62
Other financial liabilities Note – 2 21.16 (10.24) 10.92
Provisions Note – 2 113.55 (15.47) 98.08
Other non-current liabilities Note – 7 9.00 9.48 18.48
Total non-current liabilities 249.52 (16.42) 233.10
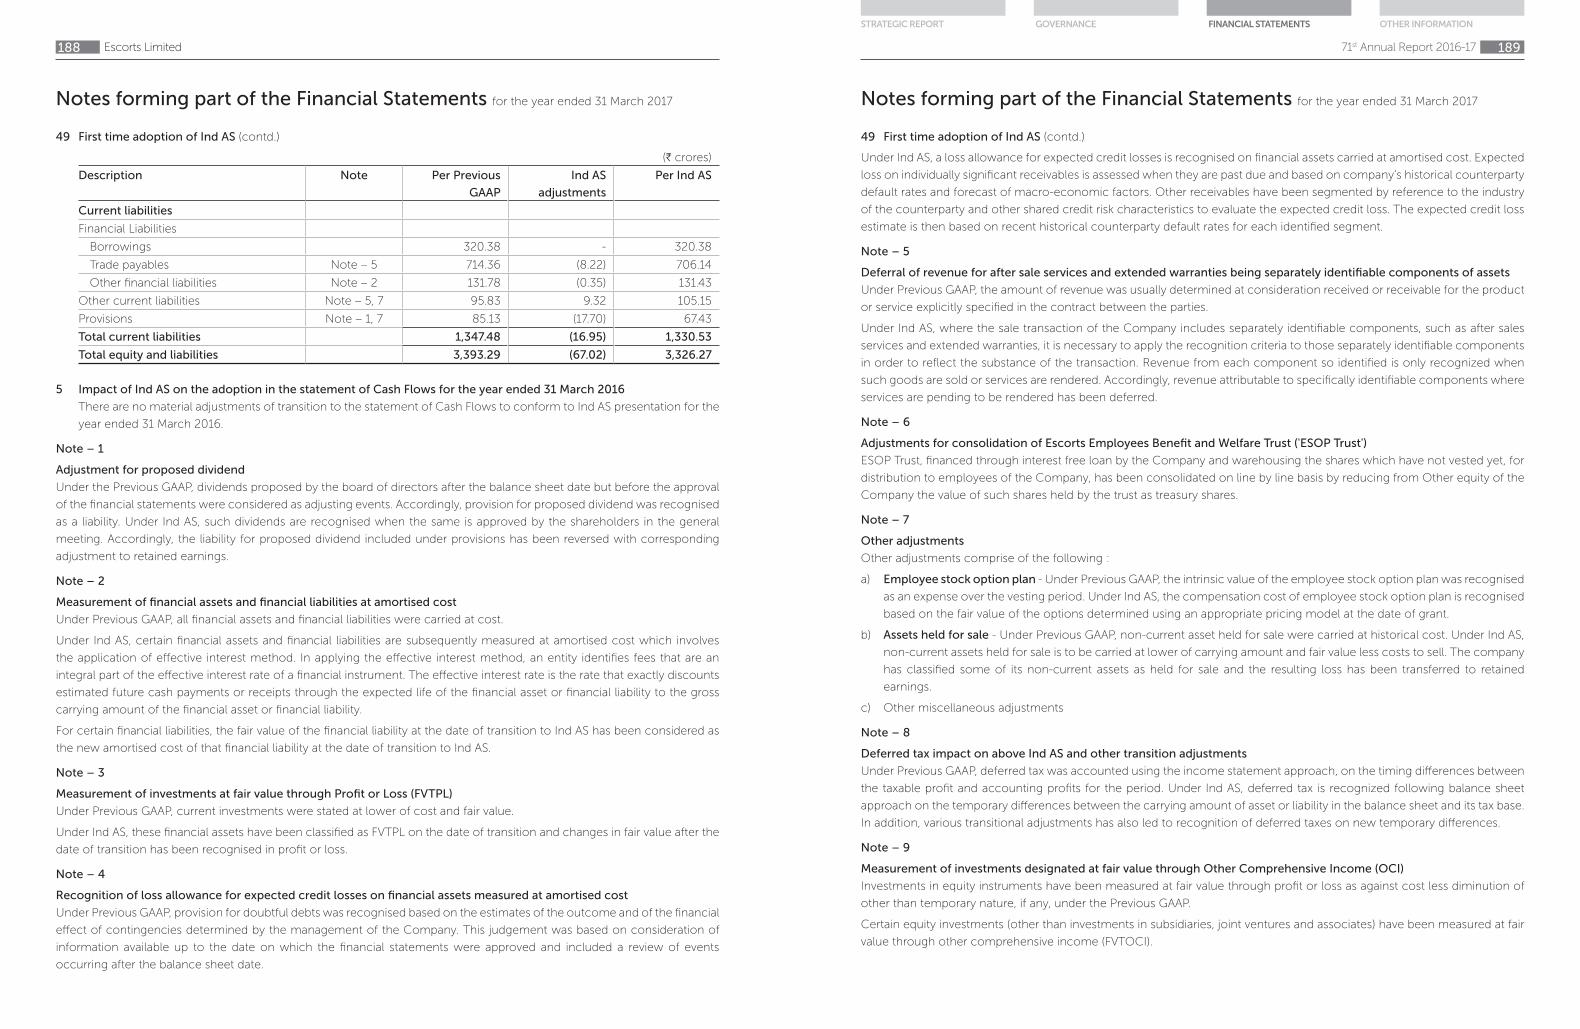
Notes forming part of the Financial Statements for the year ended 31 March 2017
Escorts Limited188
49 First time adoption of Ind AS (contd.)
(H crores)
Description Note Per Previous
GAAP
Ind AS
adjustments
Per Ind AS
Current liabilities
Financial Liabilities
Borrowings 320.38 - 320.38
Trade payables Note – 5 714.36 (8.22) 706.14
Other financial liabilities Note – 2 131.78 (0.35) 131.43
Other current liabilities Note – 5, 7 95.83 9.32 105.15
Provisions Note – 1, 7 85.13 (17.70) 67.43
Total current liabilities 1,347.48 (16.95) 1,330.53
Total equity and liabilities 3,393.29 (67.02) 3,326.27
5 Impact of Ind AS on the adoption in the statement of Cash Flows for the year ended 31 March 2016
There are no material adjustments of transition to the statement of Cash Flows to conform to Ind AS presentation for the
year ended 31 March 2016.
Note – 1
Adjustment for proposed dividend
Under the Previous GAAP, dividends proposed by the board of directors after the balance sheet date but before the approval
of the financial statements were considered as adjusting events. Accordingly, provision for proposed dividend was recognised
as a liability. Under Ind AS, such dividends are recognised when the same is approved by the shareholders in the general
meeting. Accordingly, the liability for proposed dividend included under provisions has been reversed with corresponding
adjustment to retained earnings.
Note – 2
Measurement of financial assets and financial liabilities at amortised cost
Under Previous GAAP, all financial assets and financial liabilities were carried at cost.
Under Ind AS, certain financial assets and financial liabilities are subsequently measured at amortised cost which involves
the application of effective interest method. In applying the effective interest method, an entity identifies fees that are an
integral part of the effective interest rate of a financial instrument. The effective interest rate is the rate that exactly discounts
estimated future cash payments or receipts through the expected life of the financial asset or financial liability to the gross
carrying amount of the financial asset or financial liability.
For certain financial liabilities, the fair value of the financial liability at the date of transition to Ind AS has been considered as
the new amortised cost of that financial liability at the date of transition to Ind AS.
Note – 3
Measurement of investments at fair value through Profit or Loss (FVTPL)
Under Previous GAAP, current investments were stated at lower of cost and fair value.
Under Ind AS, these financial assets have been classified as FVTPL on the date of transition and changes in fair value after the
date of transition has been recognised in profit or loss.
Note – 4
Recognition of loss allowance for expected credit losses on financial assets measured at amortised cost
Under Previous GAAP, provision for doubtful debts was recognised based on the estimates of the outcome and of the financial
effect of contingencies determined by the management of the Company. This judgement was based on consideration of
information available up to the date on which the financial statements were approved and included a review of events
occurring after the balance sheet date.
Notes forming part of the Financial Statements for the year ended 31 March 2017
71st Annual Report 2016-17 189
STRATEGIC REPORT GOVERNANCE FINANCIAL STATEMENTS OTHER INFORMATION
49 First time adoption of Ind AS (contd.)
Under Ind AS, a loss allowance for expected credit losses is recognised on financial assets carried at amortised cost. Expected
loss on individually significant receivables is assessed when they are past due and based on company’s historical counterparty
default rates and forecast of macro-economic factors. Other receivables have been segmented by reference to the industry
of the counterparty and other shared credit risk characteristics to evaluate the expected credit loss. The expected credit loss
estimate is then based on recent historical counterparty default rates for each identified segment.
Note – 5
Deferral of revenue for after sale services and extended warranties being separately identifiable components of assets
Under Previous GAAP, the amount of revenue was usually determined at consideration received or receivable for the product
or service explicitly specified in the contract between the parties.
Under Ind AS, where the sale transaction of the Company includes separately identifiable components, such as after sales
services and extended warranties, it is necessary to apply the recognition criteria to those separately identifiable components
in order to reflect the substance of the transaction. Revenue from each component so identified is only recognized when
such goods are sold or services are rendered. Accordingly, revenue attributable to specifically identifiable components where
services are pending to be rendered has been deferred.
Note – 6
Adjustments for consolidation of Escorts Employees Benefit and Welfare Trust ('ESOP Trust')
ESOP Trust, financed through interest free loan by the Company and warehousing the shares which have not vested yet, for
distribution to employees of the Company, has been consolidated on line by line basis by reducing from Other equity of the
Company the value of such shares held by the trust as treasury shares.
Note – 7
Other adjustments
Other adjustments comprise of the following :
a) Employee stock option plan - Under Previous GAAP, the intrinsic value of the employee stock option plan was recognised
as an expense over the vesting period. Under Ind AS, the compensation cost of employee stock option plan is recognised
based on the fair value of the options determined using an appropriate pricing model at the date of grant.
b) Assets held for sale - Under Previous GAAP, non-current asset held for sale were carried at historical cost. Under Ind AS,
non-current assets held for sale is to be carried at lower of carrying amount and fair value less costs to sell. The company
has classified some of its non-current assets as held for sale and the resulting loss has been transferred to retained
earnings.
c) Other miscellaneous adjustments
Note – 8
Deferred tax impact on above Ind AS and other transition adjustments
Under Previous GAAP, deferred tax was accounted using the income statement approach, on the timing differences between
the taxable profit and accounting profits for the period. Under Ind AS, deferred tax is recognized following balance sheet
approach on the temporary differences between the carrying amount of asset or liability in the balance sheet and its tax base.
In addition, various transitional adjustments has also led to recognition of deferred taxes on new temporary differences.
Note – 9
Measurement of investments designated at fair value through Other Comprehensive Income (OCI)
Investments in equity instruments have been measured at fair value through profit or loss as against cost less diminution of
other than temporary nature, if any, under the Previous GAAP.
Certain equity investments (other than investments in subsidiaries, joint ventures and associates) have been measured at fair
value through other comprehensive income (FVTOCI).

Notes forming part of the Financial Statements for the year ended 31 March 2017
Escorts Limited190
The difference between the fair value and Previous GAAP carrying value on transition date has been recognized as an
adjustment to separate component of other equity.
Note – 10
Re-measurement gains on defined benefit plans
Under Ind AS, Remeasurements i.e. actuarial gains and losses and the return on plan assets, excluding amounts included in
the net interest expense on the net defined liability, are recognized in other comprehensive income instead of profit or loss
in Previous GAAP.
Note – 11
Excise duty
Under Previous GAAP, revenue from sale of goods was presented net of excise duty whereas under Ind AS the revenue from
sale of goods is presented inclusive of excise duty. The excise duty is presented on the face of the Statement of profit and
loss as part of expenses.
Note – 12
Investment property
Under the Previous GAAP, investment properties were presented as part of property, plant and equipment. Under Ind AS,
investment properties are required to be separately presented on the face of the balance sheet. There is no impact on the
total equity or profit as a result of this adjustment.
Note – 13
Minimum Alternate Tax ('MAT')
Ind AS 12 requires classification of MAT credit as deferred tax asset. Accordingly, the Company has reclassified MAT credit
from loans and advances to deferred tax asset on each reporting date. There is no impact on the total equity or profit as a
result of this adjustment.
Note – 14
Componentisation
The Company had realigned the remaining useful life of a component of a item of its plant and machinery in accordance
with the provisions of component accounting prescribed under Schedule II to the Companies Act, 2013. Consequently,
the carrying value of the item of plant and machinery which has completed its useful life amounting to H1.16 crores (net of
deferred tax H0.62 crores) has been adjusted in opening retained earnings.
49 First time adoption of Ind AS (contd.)
For and on behalf of the Board As per our Report of even date attached
RAJAN NANDA NIKHIL NANDA HARDEEP SINGH for S.N.DHAWAN & CO. LLP
Chairman and Managing Director Managing Director Director Chartered Accountants
(DIN: 00043256) (DIN: 00043432) (DIN: 00088096) (Firm Regn No. 000050N/N500045)
P.H. RAVIKUMAR BHARAT MADAN AJAY SHARMA VIJAY DHAWAN
Director Group Chief Financial Officer Group General Counsel Partner
(DIN: 00280010) & Company Secretary M No. 12565
Place : Faridabad
Date : 29 May 2017
71st Annual Report 2016-17 191
STRATEGIC REPORT GOVERNANCE FINANCIAL STATEMENTS OTHER INFORMATION
Independent Auditor’s Report
To the Members of Escorts Limited
Report on the Consolidated Ind AS Financial Statements
We have audited the accompanying consolidated Indian Accounting Standard (Ind AS) financial statements of Escorts Limited,
(“the Holding Company”) and its subsidiaries (the Holding Company and its subsidiaries together referred to as “the Group”)
and jointly controlled entity, comprising of the Consolidated Balance Sheet as at March 31, 2017, the Consolidated Statement
of Profit and Loss including other comprehensive income, the Consolidated Statement of Cash Flows, the Consolidated
Statement of Changes in Equity, for the year then ended, and a summary of the significant accounting policies and other
explanatory information (herein after referred to as “the consolidated Ind AS financial statements”).
Management’s Responsibility for the Consolidated Ind AS Financial Statements
The Holding Company’s Board of Directors is responsible for the preparation of these consolidated Ind AS financial statements
in terms of the requirements of the Companies Act, 2013 ( “the Act”) that give a true and fair view of the consolidated
financial position, consolidated financial performance including other comprehensive income, consolidated cash flows and
consolidated statement of changes in equity of the Group including its jointly controlled entity in accordance with the
accounting principles generally accepted in India, including the Indian Accounting Standards specified under Section 133 of
the Act. The respective Board of Directors of the companies included in the group and of its jointly controlled entity (which
is incorporated in India) are responsible for maintenance of adequate accounting records in accordance with the provisions
of the act for safeguarding the assets of the group its jointly controlled entity and for preventing and detecting frauds and
other irregularities; selection and application of appropriate accounting policies; making judgments and estimates that are
reasonable and prudent; and the design, implementation and maintenance of adequate internal financial controls, that were
operating effectively for ensuring the accuracy and completeness of the accounting records, relevant to the preparation and
presentation of the financial statements that give a true and fair view and are free from material misstatement, whether due
to fraud or error, which have been used for the purpose of preparation of the consolidated Ind AS financial statements by the
directors of the Holding Company, as aforesaid.
Auditor’s Responsibility
Our responsibility is to express an opinion on these consolidated Ind AS financial statements based on our audit.
While conducting the audit, we have taken into account the provisions of the Act, the accounting and auditing standards and
matters which are required to be included in the audit report under the provisions of the Act and the Rules made thereunder.
We conducted our audit in accordance with the Standards on Auditing specified under Section 143(10) of the Act. Those
Standards require that we comply with ethical requirements and plan and perform the audit to obtain reasonable assurance
about whether the consolidated Ind AS financial statements are free from material misstatement.
An audit involves performing procedures to obtain audit evidence about the amounts and the disclosures in the consolidated
Ind AS financial statements. The procedures selected depend on the auditor’s judgment, including the assessment of the
risks of material misstatement of the consolidated Ind AS financial statements, whether due to fraud or error. In making
those risk assessments, the auditor considers internal financial controls relevant to the Holding Company’s preparation of
the consolidated Ind AS financial statements that give a true and fair view in order to design audit procedures that are
appropriate in the circumstances. An audit also includes evaluating the appropriateness of the accounting policies used and
the reasonableness of the accounting estimates made by the Holding Company’s Board of Directors, as well as evaluating
the overall presentation of the consolidated Ind AS financial statements.
We believe that the audit evidence obtained by us and the audit evidence obtained by the other auditors in terms of their
reports referred to in sub-paragraph (a) and (b) of the Other Matters paragraph below, is sufficient and appropriate to provide
a basis for our audit opinion on the consolidated Ind AS financial statements.
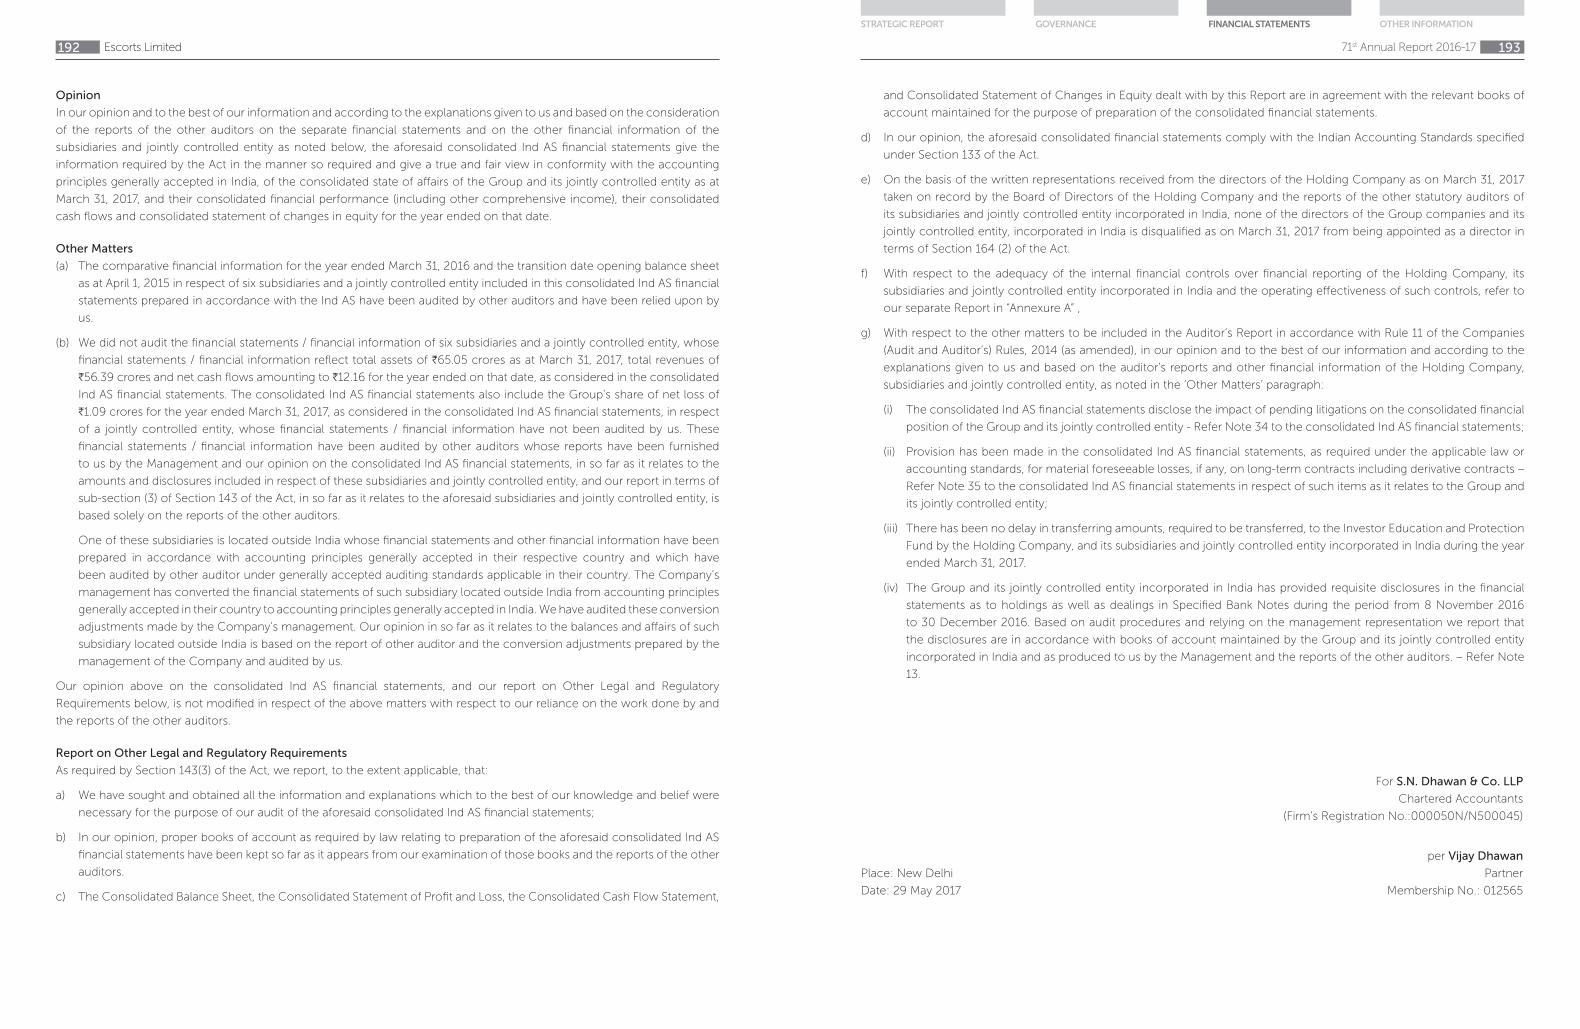
Escorts Limited192
Opinion
In our opinion and to the best of our information and according to the explanations given to us and based on the consideration
of the reports of the other auditors on the separate financial statements and on the other financial information of the
subsidiaries and jointly controlled entity as noted below, the aforesaid consolidated Ind AS financial statements give the
information required by the Act in the manner so required and give a true and fair view in conformity with the accounting
principles generally accepted in India, of the consolidated state of affairs of the Group and its jointly controlled entity as at
March 31, 2017, and their consolidated financial performance (including other comprehensive income), their consolidated
cash flows and consolidated statement of changes in equity for the year ended on that date.
Other Matters
(a) The comparative financial information for the year ended March 31, 2016 and the transition date opening balance sheet
as at April 1, 2015 in respect of six subsidiaries and a jointly controlled entity included in this consolidated Ind AS financial
statements prepared in accordance with the Ind AS have been audited by other auditors and have been relied upon by
us.
(b) We did not audit the financial statements / financial information of six subsidiaries and a jointly controlled entity, whose
financial statements / financial information reflect total assets of H65.05 crores as at March 31, 2017, total revenues of
H56.39 crores and net cash flows amounting to H12.16 for the year ended on that date, as considered in the consolidated
Ind AS financial statements. The consolidated Ind AS financial statements also include the Group’s share of net loss of
H1.09 crores for the year ended March 31, 2017, as considered in the consolidated Ind AS financial statements, in respect
of a jointly controlled entity, whose financial statements / financial information have not been audited by us. These
financial statements / financial information have been audited by other auditors whose reports have been furnished
to us by the Management and our opinion on the consolidated Ind AS financial statements, in so far as it relates to the
amounts and disclosures included in respect of these subsidiaries and jointly controlled entity, and our report in terms of
sub-section (3) of Section 143 of the Act, in so far as it relates to the aforesaid subsidiaries and jointly controlled entity, is
based solely on the reports of the other auditors.
One of these subsidiaries is located outside India whose financial statements and other financial information have been
prepared in accordance with accounting principles generally accepted in their respective country and which have
been audited by other auditor under generally accepted auditing standards applicable in their country. The Company’s
management has converted the financial statements of such subsidiary located outside India from accounting principles
generally accepted in their country to accounting principles generally accepted in India. We have audited these conversion
adjustments made by the Company’s management. Our opinion in so far as it relates to the balances and affairs of such
subsidiary located outside India is based on the report of other auditor and the conversion adjustments prepared by the
management of the Company and audited by us.
Our opinion above on the consolidated Ind AS financial statements, and our report on Other Legal and Regulatory
Requirements below, is not modified in respect of the above matters with respect to our reliance on the work done by and
the reports of the other auditors.
Report on Other Legal and Regulatory Requirements
As required by Section 143(3) of the Act, we report, to the extent applicable, that:
a) We have sought and obtained all the information and explanations which to the best of our knowledge and belief were
necessary for the purpose of our audit of the aforesaid consolidated Ind AS financial statements;
b) In our opinion, proper books of account as required by law relating to preparation of the aforesaid consolidated Ind AS
financial statements have been kept so far as it appears from our examination of those books and the reports of the other
auditors.
c) The Consolidated Balance Sheet, the Consolidated Statement of Profit and Loss, the Consolidated Cash Flow Statement,
71st Annual Report 2016-17 193
STRATEGIC REPORT GOVERNANCE FINANCIAL STATEMENTS OTHER INFORMATION
and Consolidated Statement of Changes in Equity dealt with by this Report are in agreement with the relevant books of
account maintained for the purpose of preparation of the consolidated financial statements.
d) In our opinion, the aforesaid consolidated financial statements comply with the Indian Accounting Standards specified
under Section 133 of the Act.
e) On the basis of the written representations received from the directors of the Holding Company as on March 31, 2017
taken on record by the Board of Directors of the Holding Company and the reports of the other statutory auditors of
its subsidiaries and jointly controlled entity incorporated in India, none of the directors of the Group companies and its
jointly controlled entity, incorporated in India is disqualified as on March 31, 2017 from being appointed as a director in
terms of Section 164 (2) of the Act.
f) With respect to the adequacy of the internal financial controls over financial reporting of the Holding Company, its
subsidiaries and jointly controlled entity incorporated in India and the operating effectiveness of such controls, refer to
our separate Report in “Annexure A” ,
g) With respect to the other matters to be included in the Auditor’s Report in accordance with Rule 11 of the Companies
(Audit and Auditor’s) Rules, 2014 (as amended), in our opinion and to the best of our information and according to the
explanations given to us and based on the auditor’s reports and other financial information of the Holding Company,
subsidiaries and jointly controlled entity, as noted in the ‘Other Matters’ paragraph:
(i) The consolidated Ind AS financial statements disclose the impact of pending litigations on the consolidated financial
position of the Group and its jointly controlled entity - Refer Note 34 to the consolidated Ind AS financial statements;
(ii) Provision has been made in the consolidated Ind AS financial statements, as required under the applicable law or
accounting standards, for material foreseeable losses, if any, on long-term contracts including derivative contracts –
Refer Note 35 to the consolidated Ind AS financial statements in respect of such items as it relates to the Group and
its jointly controlled entity;
(iii) There has been no delay in transferring amounts, required to be transferred, to the Investor Education and Protection
Fund by the Holding Company, and its subsidiaries and jointly controlled entity incorporated in India during the year
ended March 31, 2017.
(iv) The Group and its jointly controlled entity incorporated in India has provided requisite disclosures in the financial
statements as to holdings as well as dealings in Specified Bank Notes during the period from 8 November 2016
to 30 December 2016. Based on audit procedures and relying on the management representation we report that
the disclosures are in accordance with books of account maintained by the Group and its jointly controlled entity
incorporated in India and as produced to us by the Management and the reports of the other auditors. – Refer Note
13.
For S.N. Dhawan & Co. LLP
Chartered Accountants
(Firm’s Registration No.:000050N/N500045)
per Vijay Dhawan
Place: New Delhi Partner
Date: 29 May 2017 Membership No.: 012565

Escorts Limited194
Annexure - A to the Independent Auditor’s Report
Referred to in Paragraph (f) under “Report on Other Legal and Regulatory Requirements” section of our report of even date
Report on the Internal Financial Controls under Clause (i) of Sub-section 3 of Section 143 of the Companies Act, 2013
(“the Act”)
We have audited the internal financial controls over financial reporting of Escorts Limited (“the Holding Company”) and its
subsidiary companies which are companies incorporated in India, as of March 31, 2017 in conjunction with our audit of the
consolidated Ind AS financial statements of the Company for the year ended on that date.
Management’s Responsibility for Internal Financial Controls
The Respective Board of Directors of the Holding Company and its subsidiary companies, which are companies incorporated
in India, are responsible for establishing and maintaining internal financial controls based on the internal control over financial
reporting criteria established by the Company considering the essential components of internal control stated in the Guidance
Note on Audit of Internal Financial Controls over Financial Reporting issued by the Institute of Chartered Accountants of India
(‘ICAI’). These responsibilities include the design, implementation and maintenance of adequate internal financial controls that
were operating effectively for ensuring the orderly and efficient conduct of its business, including adherence to company’s
policies, the safeguarding of its assets, the prevention and detection of frauds and errors, the accuracy and completeness of
the accounting records, and the timely preparation of reliable financial information, as required under the Companies Act,
2013.
Auditor’s Responsibility
Our responsibility is to express an opinion on the Company’s internal financial controls over financial reporting based on our
audit. We conducted our audit in accordance with the Guidance Note on Audit of Internal Financial Controls over Financial
Reporting (the “Guidance Note”) and the Standards on Auditing, issued by ICAI and deemed to be prescribed under section
143(10) of the Companies Act, 2013, to the extent applicable to an audit of internal financial controls, both applicable to an
audit of Internal Financial Controls and, both issued by the ICAI. Those Standards and the Guidance Note require that we
comply with ethical requirements and plan and perform the audit to obtain reasonable assurance about whether adequate
internal financial controls over financial reporting was established and maintained and if such controls operated effectively
in all material respects.
Our audit involves performing procedures to obtain audit evidence about the adequacy of the internal financial controls
system over financial reporting and their operating effectiveness. Our audit of internal financial controls over financial
reporting included obtaining an understanding of internal financial controls over financial reporting, assessing the risk that a
material weakness exists, and testing and evaluating the design and operating effectiveness of internal control based on the
assessed risk. The procedures selected depend on the auditor’s judgment, including the assessment of the risks of material
misstatement of the consolidated Ind AS financial statements, whether due to fraud or error.
We believe that the audit evidence we have obtained is sufficient and appropriate to provide a basis for our audit opinion on
the Company’s internal financial controls system over financial reporting.
Meaning of Internal Financial Controls over Financial Reporting
A company’s internal financial control over financial reporting is a process designed to provide reasonable assurance
regarding the reliability of financial reporting and the preparation of financial statements for external purposes in accordance
with generally accepted accounting principles. A company’s internal financial control over financial reporting includes those
policies and procedures that (1) pertain to the maintenance of records that, in reasonable detail, accurately and fairly reflect the
transactions and dispositions of the assets of the company; (2) provide reasonable assurance that transactions are recorded
as necessary to permit preparation of financial statements in accordance with generally accepted accounting principles, and
that receipts and expenditures of the company are being made only in accordance with authorisations of management and
directors of the company; and (3) provide reasonable assurance regarding prevention or timely detection of unauthorised
acquisition, use, or disposition of the company’s assets that could have a material effect on the financial statements.
71st Annual Report 2016-17 195
STRATEGIC REPORT GOVERNANCE FINANCIAL STATEMENTS OTHER INFORMATION
Inherent Limitations of Internal Financial Controls Over Financial Reporting
Because of the inherent limitations of internal financial controls over financial reporting, including the possibility of collusion
or improper management override of controls, material misstatements due to error or fraud may occur and not be detected.
Also, projections of any evaluation of the internal financial controls over financial reporting to future periods are subject to
the risk that the internal financial control over financial reporting may become inadequate because of changes in conditions,
or that the degree of compliance with the policies or procedures may deteriorate.
Opinion
In our opinion, the Holding Company and its subsidiary companies, which are companies incorporated in India, have, in all
material respects, an adequate internal financial controls system over financial reporting and such internal financial controls
over financial reporting were operating effectively as at March 31, 2017, based on the internal control over financial reporting
criteria established by the Company considering the essential components of internal control stated in the Guidance Note
on Audit of Internal Financial Controls Over Financial Reporting issued by the ICAI.
For S.N. Dhawan & Co. LLP
Chartered Accountants
(Firm’s Registration No.:000050N/N500045)
per Vijay Dhawan
Place: New Delhi Partner
Date: 29 May 2017 Membership No.: 012565

Escorts Limited196
(H crores)
Note As at
31 March 2017
As at
31 March 2016
As at
1 April 2015
ASSETS
Non-current assets
Property, plant and equipment 3 (i) 1,513.43 1,523.66 1,531.32
Capital work-in-progress 3 (ii) 26.56 21.60 19.61
Investment property 4 23.38 23.88 24.00
Intangible assets 5 (i) 44.33 15.36 16.22
Intangible assets under development 5 (ii) 8.14 36.83 36.07
Investments accounted for using equity method 6 (i) 1.07 2.11 -
Financial assets
Investments 6 (i) 37.92 30.31 26.87
Loans 7 (i) 8.11 7.15 7.44
Other financial assets 8 (i) 10.30 9.32 2.24
Deferred tax assets (net) 9 51.50 46.90 37.27
Income tax assets (net) 0.81 17.41 37.47
Other non current assets 10 (i) 13.41 11.31 11.97
Total non-current assets 1,738.96 1,745.84 1,750.48
Current assets
Inventories 11 450.30 432.57 458.54
Financial assets
Investments 6 (ii) 173.35 7.36 6.01
Trade receivables 12 456.45 374.97 375.56
Cash and cash equivalents 13 69.22 33.12 55.86
Bank balances other than above 14 174.88 219.91 197.21
Loans 7 (ii) 4.99 4.19 2.85
Other financial assets 8 (ii) 13.67 14.49 16.73
Other current assets 10 (ii) 102.54 102.54 152.08
Total current assets 1,445.40 1,189.15 1,264.84
Assets held for sale 15 14.86 9.00 9.00
Total assets 3,199.22 2,943.99 3,024.32
EQUITY AND LIABILITIES
Equity
Equity share capital 16 122.58 122.58 122.58
Other equity 17 1,498.35 1,343.90 1,279.16
Total of equity (for shareholders of parent) 1,620.93 1,466.48 1,401.74
Non-controlling interests 18 1.74 1.88 1.73
Total equity 1,622.67 1,468.36 1,403.47
Liabilities
Non-current liabilities
Financial liabilities
Borrowings 19(i) 58.59 89.67 113.40
Other financial liabilities 20 (i) 13.05 12.18 11.08
Provisions 22 (i) 20.73 27.89 98.76
Other non-current liabilities 21 (i) 17.07 17.04 18.63
Total non-current liabilities 109.44 146.78 241.87
Current liabilities
Financial Liabilities
Borrowings 19 (ii) 159.30 225.61 320.38
Trade payables 23 910.14 750.75 729.68
Other financial liabilities 20 (ii) 143.48 129.47 153.01
Other current liabilities 21 (ii) 117.67 89.00 105.31
Provisions 22 (ii) 131.51 132.73 69.31
Income tax liabities 5.01 1.29 1.29
Total current liabilities 1,467.11 1,328.85 1,378.98
Total equity and liabilities 3,199.22 2,943.99 3,024.32
Consolidated Balance Sheet as at 31 March 2017
The accompanying notes (1 to 49) are integral part of the financial statements.
For and on behalf of the Board As per our Report of even date attached
RAJAN NANDA NIKHIL NANDA HARDEEP SINGH for S.N.DHAWAN & CO. LLP
Chairman and Managing Director Managing Director Director Chartered Accountants(DIN: 00043256) (DIN: 00043432) (DIN: 00088096) (Firm Regn No. 000050N/N500045)
P.H. RAVIKUMAR BHARAT MADAN AJAY SHARMA VIJAY DHAWAN
Director Group Chief Financial Officer Group General Counsel Partner(DIN: 00280010) & Company Secretary M No. 12565
Place : Faridabad
Date : 29 May 2017
71st Annual Report 2016-17 197
STRATEGIC REPORT GOVERNANCE FINANCIAL STATEMENTS OTHER INFORMATION
Consolidated Statement of Profit and Loss for the year ended 31 March 2017 (H crores)
Note Year ended
31 March 2017
Year ended
31 March 2016Revenue from operations 24 4,219.76 3,503.90
Other income 25 47.09 60.84
Total income 4,266.85 3,564.74
Expenses
Cost of material consumed 26 2,633.66 2,187.22
Purchases of stock-in-trade 244.12 222.09
Changes in inventories of finished goods, stock-in -trade and work-in-progress 26 (46.49) (24.88)
Excise duty 74.43 71.91
Employee benefits expense 27 451.01 411.74
Finance costs 28 32.21 51.06
Depreciation and amortisation expense 29 63.42 58.13
Other expenses 30 553.48 474.43
Total expenses 4,005.84 3,451.70
Profit before exceptional items, share of net profit of investment accounted for using the
equity method and tax
261.01 113.04
Share of loss of equity accounted investments (1.06) (1.36)
Profit before exceptional items and tax 259.95 111.68
Exceptional items 31 11.24 12.29
Profit before tax from continuing operations 248.71 99.39
Tax expense 9
Current tax 81.75 21.74
Deferred tax (credit)/charge (4.50) (9.47)
Total tax expense 77.25 12.27
Profit for the period from continuing operations 171.46 87.12
Discontinued operations
Loss from discontinued operations 32 (ii) (58.46) (25.96)
Tax expense of discontinued operations 32 (ii) (17.75) (8.99)
Loss from discontinued operations after tax (40.71) (16.97)
Net profit for the year 130.75 70.15
Other comprehensive income
Items that will not be reclassified to profit and loss
(a) Net changes in fair values of equity instruments carried at fair value through OCI 7.76 3.06
(b) Re-measurements of defined employee benefit plans (2.63) 0.67
Income tax relating to items that will not be reclassified to profit or loss 0.02 (0.59)
Items that will be reclassified to profit or loss
(a) Exchange differences on translation of foreign operations (0.07) 0.71
Income tax relating to items that will be reclassified to profit or loss - -
Total other comprehensive income for the year 5.08 3.85
Total comprehensive income for the year 135.83 74.00
Profit attributable to:
Owners 131.27 70.61
Non-controlling interests (0.52) (0.46)
Other comprehensive income attributable to:
Owners 5.08 3.85
Non-controlling interests - -
Total comprehensive income attributable to:
Owners 136.35 74.46
Non-controlling interests (0.52) (0.46)
Earnings per equity share (for continuing operations): 33
Basic (H) 20.94 10.77
Diluted (H) 20.93 10.76
Earnings per equity share (for discontinued operations):
Basic (H) (4.96) (2.09)
Diluted (H) (4.95) (2.09)
Earnings per equity share (for discontinued and continuing operations):
Basic (H) 15.98 8.68
Diluted (H) 15.98 8.68
The accompanying notes (1 to 49) are integral part of the financial statements.
For and on behalf of the Board As per our Report of even date attached
RAJAN NANDA NIKHIL NANDA HARDEEP SINGH for S.N.DHAWAN & CO. LLP
Chairman and Managing Director Managing Director Director Chartered Accountants
(DIN: 00043256) (DIN: 00043432) (DIN: 00088096) (Firm Regn No. 000050N/N500045)
P.H. RAVIKUMAR BHARAT MADAN AJAY SHARMA VIJAY DHAWAN
Director Group Chief Financial Officer Group General Counsel Partner
(DIN: 00280010) & Company Secretary M No. 12565
Place : Faridabad
Date : 29 May 2017

Escorts Limited198
Consolidated Cash Flow Statement for the year ended 31 March 2017(H crores)
Year ended
31 March 2017
Year ended
31 March 2016
A Cash flow from operating activities
Profit before tax from
Continuing operations 248.71 99.39
Discontinued operations (58.46) (25.96)
Profit before tax including discontinued operations 190.25 73.43
Adjustments for:
Depreciation and amortisation expense 64.87 60.74
Bad debts and advances written off, allowance for doubtful trade
receivable,writte backs & others (net)
34.15 12.09
Interest Expense 36.06 54.32
Interest Income (27.52) (32.65)
Share of loss of equity accounted investments 1.06 1.36
Gain on disposal of property,plant and equipment (net) (1.63) 0.03
Net gain on investment (4.41) (0.47)
Unrealised foreign exchange gain (0.15) (0.82)
Operating profit before working capital changes 292.68 168.03
Movement in working capital
Inventories (42.67) 21.21
Trade Receivable (92.48) 1.50
Other Financial Assets (5.69) (7.84)
Other Assets (1.66) 46.48
Trade Payables 159.23 31.56
Other Financial Liability 23.63 (4.45)
Other Liability 14.47 (51.57)
Cash flow from operating activities post working capital changes 347.51 204.92
Income tax paid (net) (43.68) 7.32
Net cash flow from operating activities (A) 303.83 212.24
B Cash flows from investing activities
Purchase of property, plant and equipment (including capital advances) (65.89) (48.69)
Sale of property, plant and equipment 13.40 2.20
Purchase of intangible assets (13.00) (5.51)
Sale of intangible assets 0.10 -
Purchase of investment (net) (161.48) (2.85)
Bank deposit (having original maturity of more than 3 months) 52.65 (24.85)
Margin/bank deposits others (10.78) 2.98
Interest received 30.41 31.67
Dividend received 0.01 0.03
Net cash flows used in investing activities (B) (154.58) (45.02)
71st Annual Report 2016-17 199
STRATEGIC REPORT GOVERNANCE FINANCIAL STATEMENTS OTHER INFORMATION
Consolidated Cash Flow Statement for the year ended 31 March 2017(H crores)
Year ended
31 March 2017
Year ended
31 March 2016
C Cash flows from financing activities
Proceeds from treasury shares 29.52 0.91
Proceeds/(repayment) of preference shares 1.90 (1.60)
Repayment of long term borrowings (53.32) (71.95)
Proceeds from long term borrowings 16.58 35.00
Repayment of short term borrowings (net) (66.34) (94.77)
Interest Paid (28.70) (45.73)
Dividend and tax thereon paid (12.76) (12.75)
Net cash used in financing activities (C) (113.12) (190.89)
Increase in cash and cash equivalents (A+B+C) 36.13 (23.67)
Cash and cash equivalents at the beginning of the year (refer note 13) 33.12 55.86
Exchange difference on translation of foreign currency cash and cash equivalents (0.03) 0.93
Cash and cash equivalents at the end of the year (refer note 13) 69.22 33.12
Note: The above statement of Cash Flow has been prepared under the ‘Indirect Method’ as set out in Ind AS 7,’Statement of
Cash Flows’.
For and on behalf of the Board As per our Report of even date attached
RAJAN NANDA NIKHIL NANDA HARDEEP SINGH for S.N.DHAWAN & CO. LLP
Chairman and Managing Director Managing Director Director Chartered Accountants
(DIN: 00043256) (DIN: 00043432) (DIN: 00088096) (Firm Regn No. 000050N/N500045)
P.H. RAVIKUMAR BHARAT MADAN AJAY SHARMA VIJAY DHAWAN
Director Group Chief Financial Officer Group General Counsel Partner
(DIN: 00280010) & Company Secretary M No. 12565
Place : Faridabad
Date : 29 May 2017
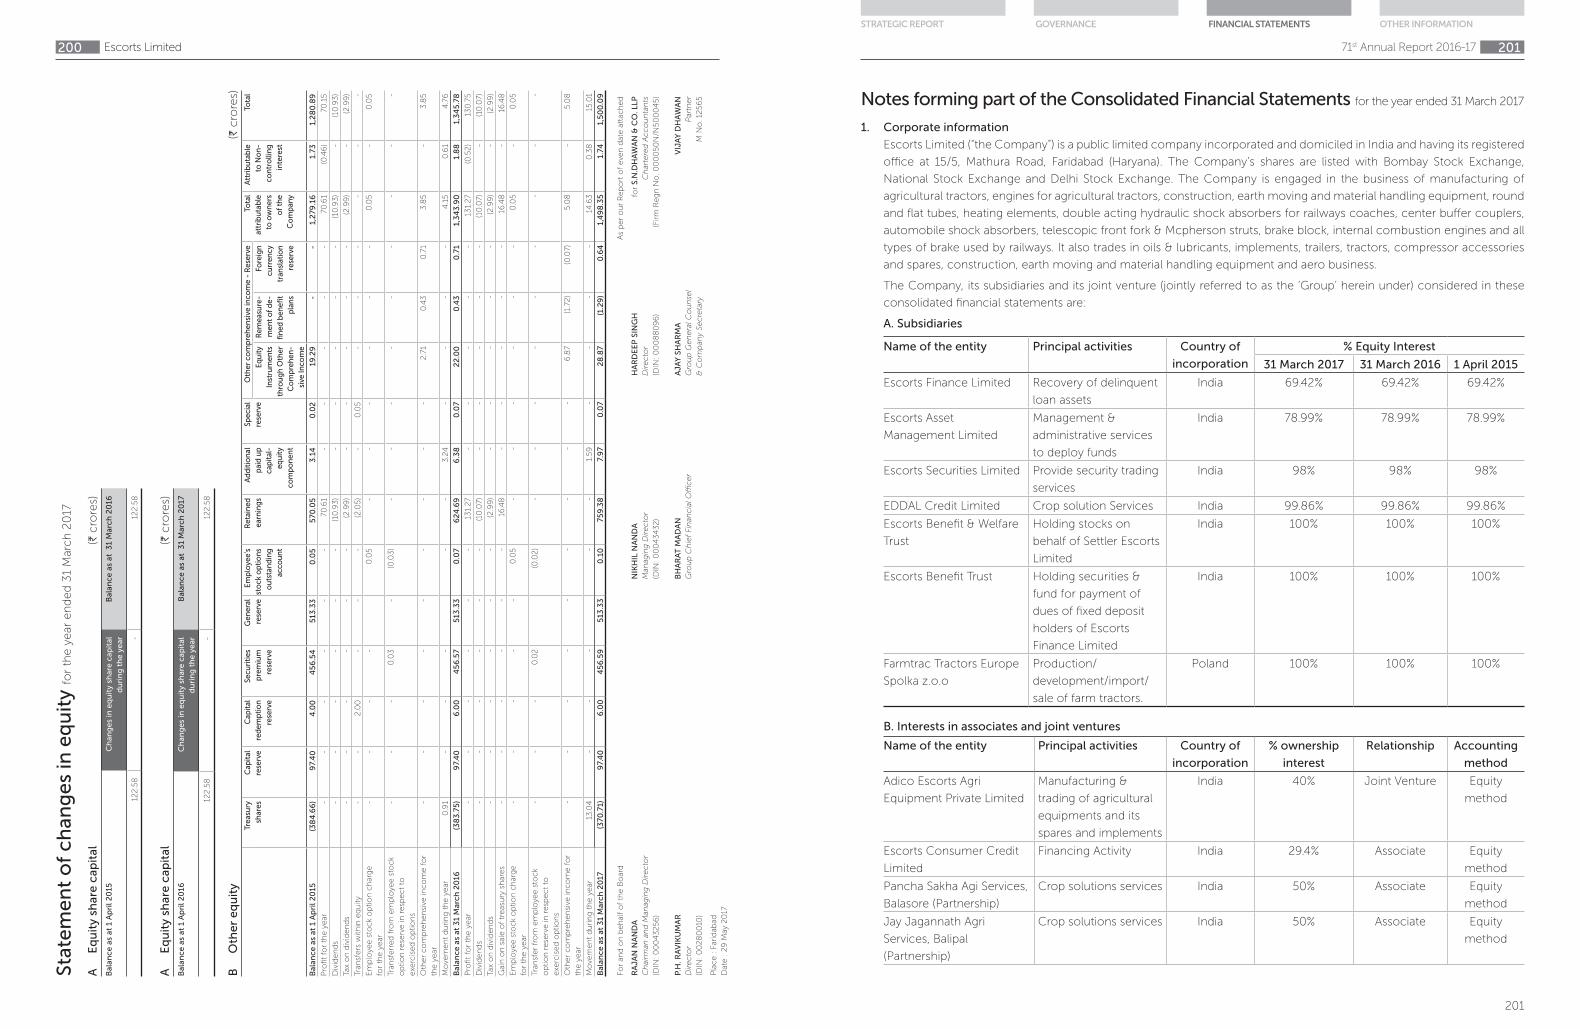
Escorts Limited200
Sta
tem
en
t o
f c
ha
ng
es
in e
qu
ity fo
r th
e y
ear
en
ded
31
Marc
h 2
017
A
Eq
uit
y s
ha
re c
ap
ita
l(H
cro
res)
Ba
lan
ce
as
at
1 A
pri
l 2
015
Ch
an
ge
s in
eq
uit
y s
ha
re c
ap
ita
l
du
rin
g t
he
ye
ar
Ba
lan
ce
as
at
31 M
arc
h 2
016
12
2.5
8
- 1
22
.58
A
Eq
uit
y s
ha
re c
ap
ita
l(H
cro
res)
Ba
lan
ce
as
at
1 A
pri
l 2
016
Ch
an
ge
s in
eq
uit
y s
ha
re c
ap
ita
l
du
rin
g t
he
ye
ar
Ba
lan
ce
as
at
31 M
arc
h 2
017
12
2.5
8
- 1
22
.58
B
Oth
er
eq
uit
y(H
cro
res)
Tre
asu
ry
sha
res
Ca
pit
al
rese
rve
Ca
pit
al
red
em
pti
on
rese
rve
Se
cu
riti
es
pre
miu
m
rese
rve
Ge
ne
ral
rese
rve
Em
plo
ye
e’s
sto
ck
op
tio
ns
ou
tsta
nd
ing
ac
co
un
t
Re
tain
ed
ea
rnin
gs
Ad
dit
ion
al
pa
id u
p
ca
pit
al-
eq
uit
y
co
mp
on
en
t
Sp
ec
ial
rese
rve
Oth
er
co
mp
reh
en
sive
inc
om
e -
Re
serv
eTo
tal
att
rib
uta
ble
to o
wn
ers
of
the
Co
mp
an
y
Att
rib
uta
ble
to N
on
-
co
ntr
ollin
g
inte
rest
Tota
l
Eq
uit
y
Inst
rum
en
ts
thro
ug
h O
the
r
Co
mp
reh
en
-
sive
In
co
me
Re
me
asu
re-
me
nt
of
de
-
fin
ed
be
ne
fit
pla
ns
Fo
reig
n
cu
rre
nc
y
tra
nsl
ati
on
rese
rve
Ba
lan
ce
as
at
1 A
pri
l 2
015
(3
84
.66
) 9
7.4
0
4.0
0
45
6.5
4
513
.33
0
.05
5
70
.05
3
.14
0.0
2
19
.29
-
-
1
,27
9.1
6
1.7
3
1,2
80
.89
Pro
fit
for
the y
ear
-
-
-
-
-
-
70
.61
-
-
-
-
-
70
.61
(0
.46
) 7
0.1
5
Div
iden
ds
-
-
-
-
-
-
(10
.93
) -
-
-
-
-
(10
.93
) -
(
10.9
3)
Tax o
n d
ivid
en
ds
-
-
-
-
-
-
(2
.99
) -
-
-
-
-
(2
.99
) -
(2
.99
)
Tran
sfers
with
in e
qu
ity
-
-
2.0
0
-
-
-
(2
.05
) -
0
.05
-
-
-
-
-
-
Em
plo
yee s
tock o
ptio
n c
harg
e
for
the y
ear
-
-
-
-
0.0
5
-
-
-
-
-
-
0.0
5
-
0.0
5
Tran
sferr
ed
fro
m e
mp
loyee s
tock
op
tio
n r
ese
rve in
resp
ect
to
exe
rcis
ed
op
tio
ns
-
-
-
0.0
3
-
(0
.03
) -
-
-
-
-
-
-
-
-
Oth
er
co
mp
reh
en
sive
in
co
me f
or
the y
ear
-
-
-
-
-
-
-
-
-
2.7
1 0
.43
0.7
1 3
.85
-
3.8
5
Mo
vem
en
t d
uri
ng
th
e y
ear
0.9
1 -
-
-
-
-
3.2
4 -
-
-
-
4
.15
0.6
1 4
.76
Ba
lan
ce
as
at
31 M
arc
h 2
016
(3
83
.75
) 9
7.4
0
6.0
0
45
6.5
7 5
13
.33
0
.07
6
24
.69
6
.38
0
.07
2
2.0
0
0.4
3 0
.71
1,3
43
.90
1
.88
1
,34
5.7
8
Pro
fit
for
the y
ear
-
-
-
-
-
-
13
1.2
7
-
-
-
-
-
13
1.2
7
(0
.52
) 1
30
.75
Div
iden
ds
-
-
-
-
-
-
(10
.07)
-
-
-
-
-
(10
.07)
-
(10
.07)
Tax o
n d
ivid
en
ds
-
-
-
-
-
-
(2
.99
) -
-
-
-
-
(2
.99
) -
(2
.99
)
Gain
on
sale
of
treasu
ry s
hare
s -
-
-
-
-
-
1
6.4
8
-
-
-
-
-
16
.48
-
1
6.4
8
Em
plo
yee s
tock o
ptio
n c
harg
e
for
the y
ear
-
-
-
-
-
0.0
5
-
-
-
-
-
-
0.0
5
-
0.0
5
Tran
sfer
fro
m e
mp
loyee s
tock
op
tio
n r
ese
rve in
resp
ect
to
exe
rcis
ed
op
tio
ns
-
-
-
0.0
2
(0
.02
) -
-
-
-
-
-
-
-
-
Oth
er
co
mp
reh
en
sive
in
co
me f
or
the y
ear
-
-
-
-
-
-
-
-
-
6.8
7
(1.
72
) (0
.07)
5.0
8
-
5.0
8
Mo
vem
en
t d
uri
ng
th
e y
ear
13.0
4
-
-
-
-
-
1.5
9
-
-
-
-
14
.63
0
.38
1
5.0
1
Ba
lan
ce
as
at
31 M
arc
h 2
017
(3
70
.71)
97.
40
6
.00
4
56
.59
5
13
.33
0
.10
7
59
.38
7
.97
0.0
7
28
.87
(
1.2
9)
0.6
4
1,4
98
.35
1
.74
1
,50
0.0
9
Fo
r an
d o
n b
eh
alf o
f th
e B
oard
A
s p
er
ou
r R
ep
ort
of
eve
n d
ate
att
ach
ed
RA
JA
N N
AN
DA
N
IKH
IL N
AN
DA
H
AR
DE
EP
SIN
GH
fo
r S
.N.D
HA
WA
N &
CO
. L
LP
Ch
airm
an a
nd
Man
agin
g D
irecto
r M
anag
ing
Directo
r D
irecto
r C
har
tere
d A
cco
un
tan
ts(D
IN:
00
04
32
56
) (D
IN:
00
04
34
32
)
(DIN
: 0
00
88
09
6)
(Fir
m R
eg
n N
o. 0
00
050
N/N
50
00
45)
P.H
. R
AV
IKU
MA
R
BH
AR
AT
MA
DA
N
AJ
AY
SH
AR
MA
V
IJA
Y D
HA
WA
N
Directo
r
Gro
up
Ch
ief
Fin
ancia
l Offi
cer
Gro
up
Gen
era
l Co
un
sel
Par
tner
(DIN
: 0
02
80
010
)
& C
om
pan
y Se
cre
tary
M
No
. 12
56
5
Pla
ce :
Fari
dab
ad
Date
: 2
9 M
ay 2
017
201
Notes forming part of the Consolidated Financial Statements for the year ended 31 March 2017
71st Annual Report 2016-17 201
STRATEGIC REPORT GOVERNANCE FINANCIAL STATEMENTS OTHER INFORMATION
1. Corporate information
Escorts Limited (“the Company”) is a public limited company incorporated and domiciled in India and having its registered
office at 15/5, Mathura Road, Faridabad (Haryana). The Company’s shares are listed with Bombay Stock Exchange,
National Stock Exchange and Delhi Stock Exchange. The Company is engaged in the business of manufacturing of
agricultural tractors, engines for agricultural tractors, construction, earth moving and material handling equipment, round
and flat tubes, heating elements, double acting hydraulic shock absorbers for railways coaches, center buffer couplers,
automobile shock absorbers, telescopic front fork & Mcpherson struts, brake block, internal combustion engines and all
types of brake used by railways. It also trades in oils & lubricants, implements, trailers, tractors, compressor accessories
and spares, construction, earth moving and material handling equipment and aero business.
The Company, its subsidiaries and its joint venture (jointly referred to as the ‘Group’ herein under) considered in these
consolidated financial statements are:
A. Subsidiaries
Name of the entity Principal activities Country of
incorporation
% Equity Interest
31 March 2017 31 March 2016 1 April 2015
Escorts Finance Limited Recovery of delinquent
loan assets
India 69.42% 69.42% 69.42%
Escorts Asset
Management Limited
Management &
administrative services
to deploy funds
India 78.99% 78.99% 78.99%
Escorts Securities Limited Provide security trading
services
India 98% 98% 98%
EDDAL Credit Limited Crop solution Services India 99.86% 99.86% 99.86%
Escorts Benefit & Welfare
Trust
Holding stocks on
behalf of Settler Escorts
Limited
India 100% 100% 100%
Escorts Benefit Trust Holding securities &
fund for payment of
dues of fixed deposit
holders of Escorts
Finance Limited
India 100% 100% 100%
Farmtrac Tractors Europe
Spolka z.o.o
Production/
development/import/
sale of farm tractors.
Poland 100% 100% 100%
B. Interests in associates and joint ventures
Name of the entity Principal activities Country of
incorporation
% ownership
interest
Relationship Accounting
method
Adico Escorts Agri
Equipment Private Limited
Manufacturing &
trading of agricultural
equipments and its
spares and implements
India 40% Joint Venture Equity
method
Escorts Consumer Credit
Limited
Financing Activity India 29.4% Associate Equity
method
Pancha Sakha Agi Services,
Balasore (Partnership)
Crop solutions services India 50% Associate Equity
method
Jay Jagannath Agri
Services, Balipal
(Partnership)
Crop solutions services India 50% Associate Equity
method
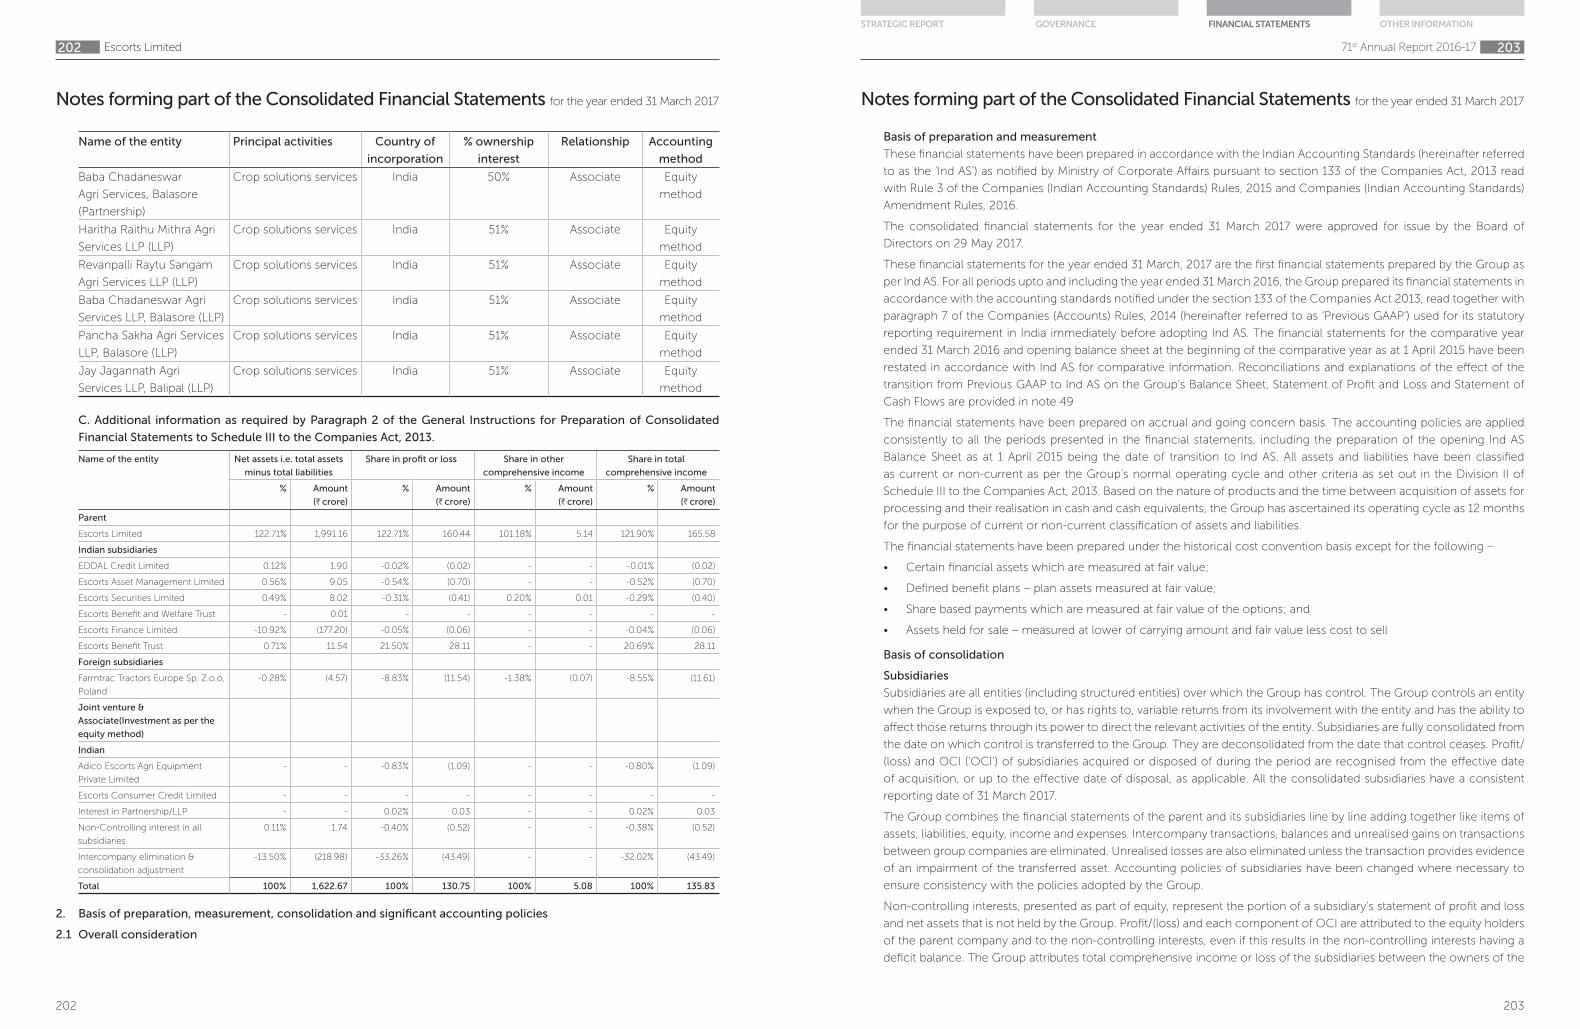
202
Notes forming part of the Consolidated Financial Statements for the year ended 31 March 2017
Escorts Limited202
Name of the entity Principal activities Country of
incorporation
% ownership
interest
Relationship Accounting
method
Baba Chadaneswar
Agri Services, Balasore
(Partnership)
Crop solutions services India 50% Associate Equity
method
Haritha Raithu Mithra Agri
Services LLP (LLP)
Crop solutions services India 51% Associate Equity
method
Revanpalli Raytu Sangam
Agri Services LLP (LLP)
Crop solutions services India 51% Associate Equity
method
Baba Chadaneswar Agri
Services LLP, Balasore (LLP)
Crop solutions services India 51% Associate Equity
method
Pancha Sakha Agri Services
LLP, Balasore (LLP)
Crop solutions services India 51% Associate Equity
method
Jay Jagannath Agri
Services LLP, Balipal (LLP)
Crop solutions services India 51% Associate Equity
method
C. Additional information as required by Paragraph 2 of the General Instructions for Preparation of Consolidated
Financial Statements to Schedule III to the Companies Act, 2013.
Name of the entity Net assets i.e. total assets
minus total liabilities
Share in profit or loss Share in other
comprehensive income
Share in total
comprehensive income
% Amount
(H crore)
% Amount
(H crore)
% Amount
(H crore)
% Amount
(H crore)
Parent
Escorts Limited 122.71% 1,991.16 122.71% 160.44 101.18% 5.14 121.90% 165.58
Indian subsidiaries
EDDAL Credit Limited 0.12% 1.90 -0.02% (0.02) - - -0.01% (0.02)
Escorts Asset Management Limited 0.56% 9.05 -0.54% (0.70) - - -0.52% (0.70)
Escorts Securities Limited 0.49% 8.02 -0.31% (0.41) 0.20% 0.01 -0.29% (0.40)
Escorts Benefit and Welfare Trust - 0.01 - - - - - -
Escorts Finance Limited -10.92% (177.20) -0.05% (0.06) - - -0.04% (0.06)
Escorts Benefit Trust 0.71% 11.54 21.50% 28.11 - - 20.69% 28.11
Foreign subsidiaries
Farmtrac Tractors Europe Sp. Z.o.o,
Poland
-0.28% (4.57) -8.83% (11.54) -1.38% (0.07) -8.55% (11.61)
Joint venture &
Associate(Investment as per the
equity method)
Indian
Adico Escorts Agri Equipment
Private Limited
- - -0.83% (1.09) - - -0.80% (1.09)
Escorts Consumer Credit Limited - - - - - - - -
Interest in Partnership/LLP - - 0.02% 0.03 - - 0.02% 0.03
Non-Controlling interest in all
subsidiaries
0.11% 1.74 -0.40% (0.52) - - -0.38% (0.52)
Intercompany elimination &
consolidation adjustment
-13.50% (218.98) -33.26% (43.49) - - -32.02% (43.49)
Total 100% 1,622.67 100% 130.75 100% 5.08 100% 135.83
2. Basis of preparation, measurement, consolidation and significant accounting policies
2.1 Overall consideration
203
Notes forming part of the Consolidated Financial Statements for the year ended 31 March 2017
71st Annual Report 2016-17 203
STRATEGIC REPORT GOVERNANCE FINANCIAL STATEMENTS OTHER INFORMATION
Basis of preparation and measurement
These financial statements have been prepared in accordance with the Indian Accounting Standards (hereinafter referred
to as the ‘Ind AS’) as notified by Ministry of Corporate Affairs pursuant to section 133 of the Companies Act, 2013 read
with Rule 3 of the Companies (Indian Accounting Standards) Rules, 2015 and Companies (Indian Accounting Standards)
Amendment Rules, 2016.
The consolidated financial statements for the year ended 31 March 2017 were approved for issue by the Board of
Directors on 29 May 2017.
These financial statements for the year ended 31 March, 2017 are the first financial statements prepared by the Group as
per Ind AS. For all periods upto and including the year ended 31 March 2016, the Group prepared its financial statements in
accordance with the accounting standards notified under the section 133 of the Companies Act 2013, read together with
paragraph 7 of the Companies (Accounts) Rules, 2014 (hereinafter referred to as ‘Previous GAAP’) used for its statutory
reporting requirement in India immediately before adopting Ind AS. The financial statements for the comparative year
ended 31 March 2016 and opening balance sheet at the beginning of the comparative year as at 1 April 2015 have been
restated in accordance with Ind AS for comparative information. Reconciliations and explanations of the effect of the
transition from Previous GAAP to Ind AS on the Group’s Balance Sheet, Statement of Profit and Loss and Statement of
Cash Flows are provided in note 49
The financial statements have been prepared on accrual and going concern basis. The accounting policies are applied
consistently to all the periods presented in the financial statements, including the preparation of the opening Ind AS
Balance Sheet as at 1 April 2015 being the date of transition to Ind AS. All assets and liabilities have been classified
as current or non-current as per the Group’s normal operating cycle and other criteria as set out in the Division II of
Schedule III to the Companies Act, 2013. Based on the nature of products and the time between acquisition of assets for
processing and their realisation in cash and cash equivalents, the Group has ascertained its operating cycle as 12 months
for the purpose of current or non-current classification of assets and liabilities.
The financial statements have been prepared under the historical cost convention basis except for the following –
• Certain financial assets which are measured at fair value;
• Defined benefit plans – plan assets measured at fair value;
• Share based payments which are measured at fair value of the options; and
• Assets held for sale – measured at lower of carrying amount and fair value less cost to sell
Basis of consolidation
Subsidiaries
Subsidiaries are all entities (including structured entities) over which the Group has control. The Group controls an entity
when the Group is exposed to, or has rights to, variable returns from its involvement with the entity and has the ability to
affect those returns through its power to direct the relevant activities of the entity. Subsidiaries are fully consolidated from
the date on which control is transferred to the Group. They are deconsolidated from the date that control ceases. Profit/
(loss) and OCI (‘OCI’) of subsidiaries acquired or disposed of during the period are recognised from the effective date
of acquisition, or up to the effective date of disposal, as applicable. All the consolidated subsidiaries have a consistent
reporting date of 31 March 2017.
The Group combines the financial statements of the parent and its subsidiaries line by line adding together like items of
assets, liabilities, equity, income and expenses. Intercompany transactions, balances and unrealised gains on transactions
between group companies are eliminated. Unrealised losses are also eliminated unless the transaction provides evidence
of an impairment of the transferred asset. Accounting policies of subsidiaries have been changed where necessary to
ensure consistency with the policies adopted by the Group.
Non-controlling interests, presented as part of equity, represent the portion of a subsidiary’s statement of profit and loss
and net assets that is not held by the Group. Profit/(loss) and each component of OCI are attributed to the equity holders
of the parent company and to the non-controlling interests, even if this results in the non-controlling interests having a
deficit balance. The Group attributes total comprehensive income or loss of the subsidiaries between the owners of the

204
Notes forming part of the Consolidated Financial Statements for the year ended 31 March 2017
Escorts Limited204
parent and the non-controlling interests based on their respective ownership interests.
The Group treats transactions with non-controlling interests that do not result in a loss of control as transactions with
equity owners of the group. Such a change in ownership interest results in an adjustment between the carrying amounts
of the controlling and non-controlling interests to reflect their relative interests in the subsidiary. Any difference between
the amount of the adjustment to non-controlling interests and any consideration paid or received is recognised within
equity.
Associates and joint ventures
Associates
Investment in entities in which there exists significant influence but not a controlling interest are accounted for under
the equity method i.e. the investment is initially recorded at cost, identifying any goodwill/capital reserve arising at the
time of acquisition, as the case may be, which will be inherent in investment. The carrying amount of the investment is
adjusted thereafter for the post acquisition change in the share of net assets of the investee, adjusted where necessary to
ensure consistency with the accounting policies of the Group. The consolidated statement of profit and loss includes the
Group’s share of the results of the operations of the investee. Dividends received or receivable from associate ventures
are recognised as a reduction in the carrying amount of the investment. Unrealised gains on transactions between the
Group and associates are eliminated to the extent of the Group’s interest in these entities.
Joint ventures
Investments in joint arrangements are classified as either Joint operations or Joint ventures. The classification depends
on the contractual rights and obligations of each investor, rather than the legal structure of the Joint arrangement.
Joint ventures – Interest in joint venture are accounted for using the equity method, after initially being recognised at
cost. The carrying amount of the investment is adjusted thereafter for the post acquisition change in the share of net
assets of the investee, adjusted where necessary to ensure consistency with the accounting policies of the Group. The
consolidated statement of profit and loss includes the Group’s share of the results of the operations of the investee.
Dividends received or receivable from joint ventures are recognised as a reduction in the carrying amount of the
investment. Unrealised gains on transactions between the Group and joint ventures are eliminated to the extent of the
Group’s interest in these entities.
When the Group’s share of losses in an equity-accounted investment equals or exceeds its interest in the entity, including
any other unsecured long-term receivables, the Group does not recognise further losses, unless it has incurred obligations
or made payments on behalf of the other entity.
2.2 Summary of significant accounting policies
a) Revenue recognition
Revenue from sale of goods is recognised when all the significant risks and rewards of ownership in the goods are
transferred to the buyer as per the terms of the contract, there is neither continuing managerial involvement with nor
effective control over the goods sold, it is probable that economic benefits will flow to the Group, the costs incurred
or to be incurred in respect of the transaction can be measured reliably and the amount of revenue can be measured
reliably.
Revenue from services rendered is recognised in proportion to the stage of completion of the transaction at the
reporting date when the outcome of the transaction can be estimated reliably.
Revenues from the sale of extended warranties and maintenance contracts embedded in the original sales contracts
are recognized over the life of the contract and matched to related costs.
Income from export incentives are recognised on accrual basis.
Revenue is measured at fair value of the consideration received or receivable, after deduction of any trade discounts,
volume rebates and any taxes or duties collected on behalf of the government which are levied on sales such as sales
tax, value added tax, etc. In case of multi-element revenue arrangements, which involve delivery or performance of
multiple products, services , evaluation will be done of all deliverables in an arrangement to determine whether they
205
Notes forming part of the Consolidated Financial Statements for the year ended 31 March 2017
71st Annual Report 2016-17 205
STRATEGIC REPORT GOVERNANCE FINANCIAL STATEMENTS OTHER INFORMATION
represent separate units of accounting at the inception of arrangement. Total arrangement consideration related to
the bundled contract is allocated among the different elements based on their relative fair values (i.e., ratio of the
fair value of each element to the aggregated fair value of the bundled deliverables). In case the relative fair value
of different components cannot be determined on a reasonable basis, the total consideration is allocated to the
different components based on residual value method.
Rental income
Rental income is recognised on a straight-line basis over the term of the lease, except for contingent rental income
which is recognised when it arises and where scheduled increase in rent compensates the lessor for expected
inflationary costs.
Interest Income
Interest income is recognized on time proportion basis taking into account the amount outstanding and rate
applicable. For all financial assets measured at amortised cost (refer ‘h’ below), interest income is recorded using the
effective interest rate (EIR) i.e. the rate that exactly discounts estimated future cash receipts through the expected
life of the financial asset to the net carrying amount of the financial assets. The future cash flows include all other
transaction costs paid or received, premiums or discounts if any, etc.
Dividend income
Dividend income is recognised at the time when right to receive the payment is established, which is generally when
the shareholders approve the dividend.
b) Foreign currency translation
Functional and presentation currency
The financial statements are presented in Indian Rupee (‘H’) and are rounded to two decimal places of crores, which
is also the functional and presentation currency of the Group.
Transactions and balances
Foreign currency transactions are recorded in the functional currency, by applying to the exchange rate between the
functional currency and the foreign currency at the date of the transaction.
Foreign currency monetary items are converted to functional currency using the closing rate. Non-monetary items
denominated in a foreign currency which are carried at historical cost are reported using the exchange rate at the
date of the transactions.
Exchange differences arising on monetary items on settlement, or restatement as at reporting date, at rates different
from those at which they were initially recorded, are recognized in the statement of profit and loss in the year in
which they arise.
Foreign operations
In the Group’s financial statements, all assets, liabilities and transactions of the Group entities with functional currency
other than the Indian Rupee are translated into Indian Rupee upon consolidation. The functional currency of the
entities in the Group has remained unchanged during the reporting period. On consolidation, assets and liabilities
have been translated into Indian Rupee at the closing rate at the reporting date. Fair value adjustments arising on the
acquisition of a foreign entity have been treated as assets and liabilities of the foreign entity and translated into Indian
Rupee at the closing rate. Income and expenses have been translated into Indian Rupee at the average rate over
the reporting period. Exchange differences are charged/ credited to other comprehensive income and recognized
in the currency translation reserve in equity. On disposal of a foreign operation, the related cumulative translation
differences recognized in equity are reclassified to the statement of profit or loss and are recognized as part of the
gain or loss on disposal.
c) Borrowing costs

206
Notes forming part of the Consolidated Financial Statements for the year ended 31 March 2017
Escorts Limited206
Borrowing costs directly attributable to the acquisition, construction or production of a qualifying asset are capitalized
during the period of time that is necessary to complete and prepare the asset for its intended use or sale. A qualifying
asset is one that necessarily takes substantial period of time to get ready for its intended use. Capitalisation of
borrowing costs is suspended in the period during which the active development is delayed due to, other than
temporary, interruption. All other borrowing costs are charged to the statement of profit and loss as incurred.
d) Property, plant and equipment
Recognition and initial measurement
Property, plant and equipment are stated at their cost of acquisition. The cost comprises purchase price, borrowing
cost if capitalization criteria are met and directly attributable cost of bringing the asset to its working condition for
the intended use. Any trade discount and rebates are deducted in arriving at the purchase price. Subsequent costs
are included in the asset’s carrying amount or recognised as a separate asset, as appropriate, only when it is probable
that future economic benefits attributable to such subsequent cost associated with the item will flow to the Group.
All other repair and maintenance costs are recognised in statement of profit and loss as incurred.
In case an item of property, plant and equipment is acquired on deferred payment basis, interest expenses included
in deferred payment is recognised as interest expense and not included in cost of asset.
Subsequent measurement (depreciation and useful lives)
Depreciation on property, plant and equipment is provided on the straight-line method, computed on the basis of
useful lives mentioned below:
Asset category Estimated useful life (in years)
Factory buildings 30
Office buildings 60
Tubewells and fencing 5
Roads 10
Sheds 3
Plant and machinery 3-25*
Furniture and fixtures 5-10*
Office equipment 3-10
Vehicles 8-20
Leasehold improvements Over the effective term of the lease
Electrical appliances 10
IT equipments 6
Computers 3
*Based on technical evaluation, the management believes that the useful lives as given above best represent the
period over which management expects to use these assets. Hence, the useful lives for certain items within these
classes of assets is different from the useful lives as prescribed under Part C of Schedule II to the Companies Act
2013.
The residual values, useful lives and method of depreciation are reviewed at each financial year end and adjusted
prospectively, if appropriate.
Where, during any financial year, any addition has been made to any asset, or where any asset has been sold,
discarded, demolished or destroyed, or significant components replaced; depreciation on such assets is calculated
on a pro rata basis as individual assets with specific useful life from the month of such addition or, as the case may
be, up to the month on which such asset has been sold, discarded, demolished or destroyed or replaced.
De-recognition
207
Notes forming part of the Consolidated Financial Statements for the year ended 31 March 2017
71st Annual Report 2016-17 207
STRATEGIC REPORT GOVERNANCE FINANCIAL STATEMENTS OTHER INFORMATION
An item of property, plant and equipment and any significant part initially recognised is derecognised upon disposal
or when no future economic benefits are expected from its use or disposal. Any gain or loss arising on de-recognition
of the asset (calculated as the difference between the net disposal proceeds and the carrying amount of the asset)
is included in the income statement when the asset is derecognised.
e) Investment properties
Recognition and initial measurement
Investment properties are properties held to earn rentals or for capital appreciation, or both. Investment properties
are measured initially at their cost of acquisition. The cost comprises purchase price, borrowing cost if capitalization
criteria are met and directly attributable cost of bringing the asset to its working condition for the intended use. Any
trade discount and rebates are deducted in arriving at the purchase price.
Subsequent costs are included in the asset’s carrying amount or recognised as a separate asset, as appropriate, only
when it is probable that future economic benefits associated with the item will flow to the Group. All other repair and
maintenance costs are recognised in statement of profit and loss as incurred.
Though the Group measures investment property using cost based measurement, the fair value of investment
property is disclosed in the notes to the financial statements. Fair values are determined based on an annual
evaluation performed by an accredited external independent valuer who holds a recognised and relevant professional
qualification and has recent experience in the location and category of the investment property being valued.
Subsequent measurement (depreciation and useful lives)
Depreciation on investment properties is provided on the straight-line method, computed on the basis of useful lives
prescribed under Part C of Schedule II to the Companies Act, 2013.
The residual values, useful lives and method of depreciation are reviewed at each financial year end and adjusted
prospectively, if appropriate.
Where during any financial year, any addition has been made to any asset, or where any asset has been sold,
discarded, demolished or destroyed, or significant components replaced; depreciation on such assets is calculated
on a pro rata basis as individual assets with specific useful life from the month of such addition or, as the case may
be, up to the month on which such asset has been sold, discarded, demolished or destroyed or replaced.
De-recognition
Investment properties are derecognised either when they have been disposed of or when they are permanently
withdrawn from use and no future economic benefit is expected from their disposal. The difference between the net
disposal proceeds and the carrying amount of the asset is recognised in profit or loss in the period of de-recognition.
f) Intangible assets
Recognition and initial measurement
Purchased intangible assets are stated at cost less accumulated amortization and impairment, if any.
Internally developed intangible assets
Expenditure on the research phase of projects is recognised as an expense as incurred.
Costs that are directly attributable to a project’s development phase are recognised as intangible assets, provided the
Group can demonstrate the following:
• the technical feasibility of completing the intangible asset so that it will be available for use.
• its intention to complete the intangible asset and use or sell it
• its ability to use or sell the intangible asset
• how the intangible asset will generate probable future economic benefits
• the availability of adequate technical, financial and other resources to complete the development and to use or

208
Notes forming part of the Consolidated Financial Statements for the year ended 31 March 2017
Escorts Limited208
sell the intangible asset.
• its ability to measure reliably the expenditure attributable to the intangible asset during its development
Development costs not meeting these criteria for capitalisation are expensed as incurred.
Directly attributable costs include employee costs incurred on development of prototypes along with an appropriate
portion of relevant overheads and borrowing costs.
Subsequent measurement (amortisation)
All finite-lived intangible assets, including internally developed intangible assets, are accounted for using the cost
model whereby capitalised costs are amortised on a straight-line basis over their estimated useful lives. The estimated
useful life of an identifiable intangible asset is based on a number of factors including the effects of obsolescence,
demand, competition, and other economic factors (such as the stability of the industry, and known technological
advances), and the level of maintenance expenditures required to obtain the expected future cash flows from the
asset
Residual values and useful lives are reviewed at each reporting date. The following useful lives are applied:
Asset category Estimated useful life (in years)
Software 6
Prototypes 4
Technical know how 6
g) Leases
Finance leases
Management applies judgement in considering the substance of a lease agreement and whether it transfers
substantially all the risks and rewards incidental to ownership of the leased asset. Key factors considered include i)
the length of the lease term in relation to the economic life of the asset ii) the present value of the minimum lease
payments in relation to the asset’s fair value, and iii) whether the Group obtains ownership of the asset at the end
of the lease term. Where the Group is a lessee in this type of arrangement, the related asset is recognised at the
inception of the lease at the fair value of the leased asset or, if lower, the present value of the lease payments plus
incidental payments, if any. A corresponding amount is recognized as a finance lease liability. Assets held under
finance leases (including land) are depreciated over their estimated useful lives. The corresponding finance lease
liability is reduced by lease payments net of finance charges. The interest element of lease payments represents a
constant proportion of the outstanding capital balance and is charged to statement of profit and loss, as finance
costs over the period of the lease.
Refer note 2.2 (d) for the depreciation methods and useful lives for assets held under finance leases.
The interest element of lease payments is charged to profit or loss, as finance costs over the period of the lease.
Operating lease
All leases other than finance leases are treated as operating leases. Where the Group is a lessee, lease rentals are
charged to statement of profit and loss on straight line basis except where scheduled increase in rent compensate
the lessor for expected inflationary costs. Associated costs, such as maintenance and insurance, are expensed as
incurred.
Where the Group is a lessor, the respective leased assets are included in the balance sheet based on their nature.
Rental income is recognized on straight line basis over the lease term except where scheduled increase in rent
compensates the Group with expected inflationary costs.
h) Financial instruments
Financial instruments are recognised when the Group becomes a party to the contractual provisions of the instrument
and are measured initially at fair value adjusted for transaction costs, except for those carried at fair value through
profit or loss which are measured initially at fair value.
If the Group determines that the fair value at initial recognition differs from the transaction price, the Group accounts
209
Notes forming part of the Consolidated Financial Statements for the year ended 31 March 2017
71st Annual Report 2016-17 209
STRATEGIC REPORT GOVERNANCE FINANCIAL STATEMENTS OTHER INFORMATION
for that instrument at that date as follows:
a) at the measurement basis mentioned above if that fair value is evidenced by a quoted price in an active market
for an identical asset or liability (i.e. a Level 1 input) or based on a valuation technique that uses only data from
observable markets. The Group recognises the difference between the fair value at initial recognition and the
transaction price as a gain or loss.
b) in all other cases, at the measurement basis mentioned above, adjusted to defer the difference between the fair
value at initial recognition and the transaction price. After initial recognition, the Group recognises that deferred
difference as a gain or loss only to the extent that it arises from a change in a factor (including time) that market
participants would take into account when pricing the asset or liability.
Subsequent measurement of financial assets and financial liabilities is described below.
Financial assets
Classification and subsequent measurement
For the purpose of subsequent measurement, financial assets are classified into the following categories upon initial
recognition:
i. Financial assets at amortised cost – the financial instrument is measured at amortised cost if both the following
conditions are met:
• The asset is held within a business model whose objective is to hold assets for collecting contractual cash
flows, and
• Contractual terms of the asset give rise on specified dates to cash flows that are solely payments of principal
and interest (SPPI) on the principal amount outstanding.
After initial measurement, such financial assets are subsequently measured at amortised cost using the effective
interest method.
ii. Investments in equity instruments of subsidiaries, joint ventures and associates - Investments in equity
instruments of subsidiaries, joint ventures and associates are accounted for at cost in accordance with Ind AS 27
Separate Financial Statements.
iii. Financial assets at fair value
• Investments in equity instruments other than above – All equity investments in scope of Ind AS 109 are
measured at fair value. Equity instruments which are held for trading are generally classified as at fair value
through profit and loss (FVTPL). For all other equity instruments, the Group decides to classify the same
either as at fair value through other comprehensive income (FVOCI) or fair value through profit and loss
(FVTPL). The Group makes such election on an instrument by instrument basis. The classification is made
on initial recognition and is irrevocable.
If the Group decides to classify an equity instrument as at FVOCI, then all fair value changes on the instrument,
excluding dividends, are recognized in the other comprehensive income (OCI). There is no recycling of the
amounts from OCI to P&L, even on sale of investment. However, the Group may transfer the cumulative
gain or loss within equity. Dividends on such investments are recognised in profit or loss unless the dividend
clearly represents a recovery of part of the cost of the investment.
Equity instruments included within the FVTPL category are measured at fair value with all changes recognized
in the P&L.
• Mutual funds – All mutual funds in scope of Ind-AS 109 are measured at fair value through profit and loss
(FVTPL).
De-recognition of financial assets
A financial asset is primarily de-recognised when the rights to receive cash flows from the asset have expired or the
Group has transferred its rights to receive cash flows from the asset.
Financial liabilities

210
Notes forming part of the Consolidated Financial Statements for the year ended 31 March 2017
Escorts Limited210
Subsequent measurement
After initial recognition, the financial liabilities are subsequently measured at amortised cost using the effective
interest method.
Amortised cost is calculated by considering any discount or premium on acquisition and fees or costs that are an
integral part of the EIR. The effect of EIR amortisation is included as finance costs in the statement of profit and loss.
De-recognition of financial liabilities
A financial liability is de-recognised when the obligation under the liability is discharged or cancelled or expires. When
an existing financial liability is replaced by another from the same lender on substantially different terms, or the terms
of an existing liability are substantially modified, such an exchange or modification is treated as the de-recognition
of the original liability and the recognition of a new liability. The difference in the respective carrying amounts is
recognised in the statement of profit and loss.
Offsetting of financial instruments
Financial assets and financial liabilities are offset and the net amount is reported in the balance sheet if there is a
currently enforceable legal right to offset the recognised amounts and there is an intention to settle on a net basis,
to realise the assets and settle the liabilities simultaneously.
i) Impairment of financial assets
All financial assets except for those at FVTPL are subject to review for impairment at least at each reporting date
to identify whether there is any objective evidence that a financial asset or a group of financial assets is impaired.
Different criteria to determine impairment are applied for each category of financial assets.
In accordance with Ind-AS 109, the Group applies expected credit loss (ECL) model for measurement and recognition
of impairment loss for financial assets carried at amortised cost.
ECL is the weighted average of difference between all contractual cash flows that are due to the Group in accordance
with the contract and all the cash flows that the Group expects to receive, discounted at the original effective interest
rate, with the respective risks of default occurring as the weights. When estimating the cash flows, the Group is
required to consider –
• All contractual terms of the financial assets (including prepayment and extension) over the expected life of the
assets.
• Cash flows from the sale of collateral held or other credit enhancements that are integral to the contractual
terms.
Trade receivables
(i) For debtors that are not past due – The Group applies approach permitted by Ind AS 109 Financial Instruments,
which requires lifetime expected credit losses to be recognised upon initial recognition of receivables. Lifetime
ECL are the expected credit losses resulting from all possible default events over the expected life of a financial
instrument.
Life time expected credit losses are assessed and accounted based on group’s historical counter party default
rates and forecast of macro-economic factors, by dividing receivables that are not considered to be individually
significant by reference to the business segment of the counter party and other shared credit risk characteristics
to evaluate the expected credit loss. The expected credit loss estimate is then based on recent historical counter
party default rates for each identified segment.
The Group defines default as an event when the financial asset is past due for more than 365 days. This definition
is based on management’s expectation of the time period beyond which if a receivable is outstanding, it is an
objective evidence of impairment.
(ii) For debtors considered past due – any enhancement in the accrual done for expected credit loss on individually
significant receivables is made to recognise any additional expected credit loss on amount recoverable. The
211
Notes forming part of the Consolidated Financial Statements for the year ended 31 March 2017
71st Annual Report 2016-17 211
STRATEGIC REPORT GOVERNANCE FINANCIAL STATEMENTS OTHER INFORMATION
Group writes off trade receivables when there is no objective evidence that such amounts would not be
recovered. Financial assets that are written-off are still subject to enforcement activity by the Group.
Other financial assets
For recognition of impairment loss on other financial assets and risk exposure, the Group determines whether there
has been a significant increase in the credit risk since initial recognition. If the credit risk has not increased significantly
since initial recognition, the Group measures the loss allowance at an amount equal to 12-month expected credit
losses, else at an amount equal to the lifetime expected credit losses.
When making this assessment, the Group uses the change in the risk of a default occurring over the expected life
of the financial asset. To make that assessment, the Group compares the risk of a default occurring on the financial
asset as at the balance sheet date with the risk of a default occurring on the financial asset as at the date of initial
recognition and considers reasonable and supportable information, that is available without undue cost or effort, that
is indicative of significant increases in credit risk since initial recognition. The Group assumes that the credit risk on a
financial asset has not increased significantly since initial recognition if the financial asset is determined to have low
credit risk at the balance sheet date.
j) Impairment of non-financial assets
For impairment assessment purposes, assets are grouped at the lowest levels for which there are largely independent
cash inflows (cash generating units). As a result, some assets are tested individually for impairment and some are
tested at cash-generating unit level.
At each reporting date, the Group assesses whether there is any indication based on internal/external factors, that an
asset may be impaired. If any such indication exists, the Group estimates the recoverable amount of the asset. If such
recoverable amount of the asset or the recoverable amount of the cash generating unit to which the asset belongs
is less than its carrying amount, the carrying amount is reduced to its recoverable amount and the reduction is
treated as an impairment loss and is recognised in the statement of profit and loss. If, at the reporting date there is an
indication that a previously assessed impairment loss no longer exists, the recoverable amount is reassessed which
is the higher of fair value less costs of disposal and value-in-use and the asset is reflected at the recoverable amount
subject to a maximum of depreciated historical cost. Impairment losses previously recognized are accordingly
reversed in the statement of profit and loss.
To determine value-in-use, management estimates expected future cash flows from each cash-generating unit and
determines a suitable discount rate in order to calculate the present value of those cash flows. The data used for
impairment testing procedures are directly linked to the Group’s latest approved budget, adjusted as necessary to
exclude the effects of future re-organisations and asset enhancements. Discount factors are determined individually
for each cash-generating unit and reflect current market assessment of the time value of money and asset-specific
risk factors.
k) Fair value measurement
The Group measures certain financial instruments, such as, investments at fair value at each balance sheet date.
Fair value is the price that would be received to sell an asset or paid to transfer a liability in an orderly transaction
between market participants at the measurement date. The fair value measurement is based on the presumption that
the transaction to sell the asset or transfer the liability takes place either:
• In the principal market for the asset or liability, or
• In the absence of a principal market, in the most advantageous market for the asset or liability
The principal or the most advantageous market must be accessible by the Group.
The fair value of an asset or a liability is measured using the assumptions that market participants would use when
pricing the asset or liability, assuming that market participants act in their economic best interest.
Refer Note 35 for fair value hierarchy.
l) Inventories
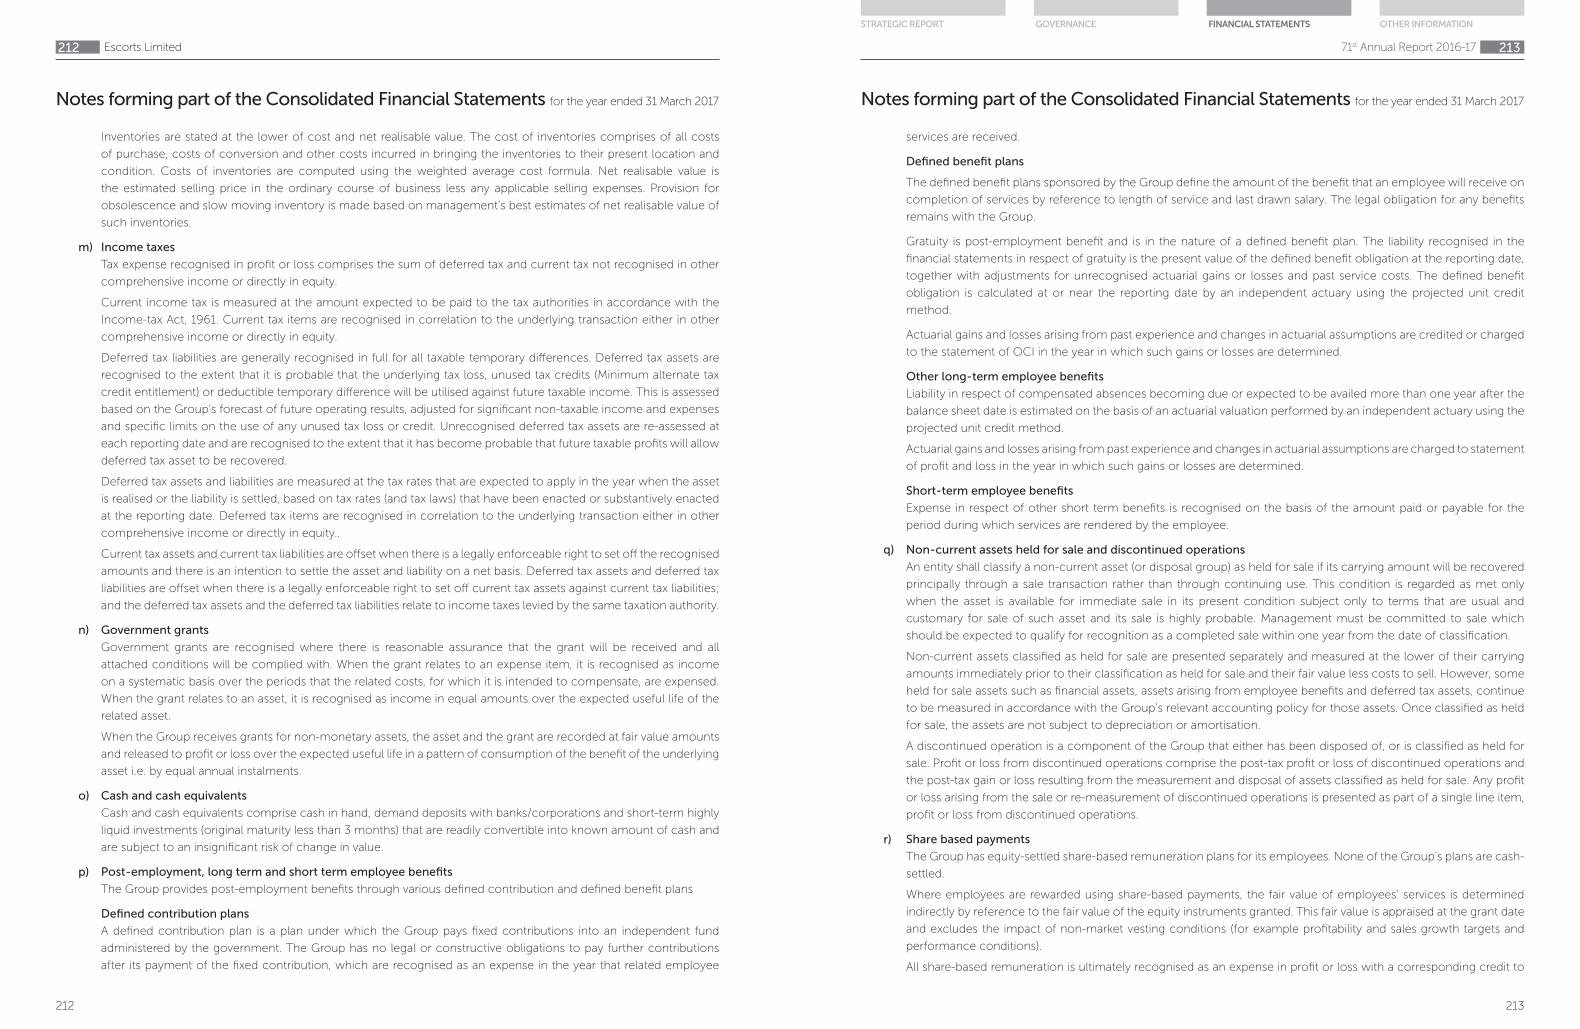
212
Notes forming part of the Consolidated Financial Statements for the year ended 31 March 2017
Escorts Limited212
Inventories are stated at the lower of cost and net realisable value. The cost of inventories comprises of all costs
of purchase, costs of conversion and other costs incurred in bringing the inventories to their present location and
condition. Costs of inventories are computed using the weighted average cost formula. Net realisable value is
the estimated selling price in the ordinary course of business less any applicable selling expenses. Provision for
obsolescence and slow moving inventory is made based on management’s best estimates of net realisable value of
such inventories.
m) Income taxes
Tax expense recognised in profit or loss comprises the sum of deferred tax and current tax not recognised in other
comprehensive income or directly in equity.
Current income tax is measured at the amount expected to be paid to the tax authorities in accordance with the
Income-tax Act, 1961. Current tax items are recognised in correlation to the underlying transaction either in other
comprehensive income or directly in equity.
Deferred tax liabilities are generally recognised in full for all taxable temporary differences. Deferred tax assets are
recognised to the extent that it is probable that the underlying tax loss, unused tax credits (Minimum alternate tax
credit entitlement) or deductible temporary difference will be utilised against future taxable income. This is assessed
based on the Group’s forecast of future operating results, adjusted for significant non-taxable income and expenses
and specific limits on the use of any unused tax loss or credit. Unrecognised deferred tax assets are re-assessed at
each reporting date and are recognised to the extent that it has become probable that future taxable profits will allow
deferred tax asset to be recovered.
Deferred tax assets and liabilities are measured at the tax rates that are expected to apply in the year when the asset
is realised or the liability is settled, based on tax rates (and tax laws) that have been enacted or substantively enacted
at the reporting date. Deferred tax items are recognised in correlation to the underlying transaction either in other
comprehensive income or directly in equity..
Current tax assets and current tax liabilities are offset when there is a legally enforceable right to set off the recognised
amounts and there is an intention to settle the asset and liability on a net basis. Deferred tax assets and deferred tax
liabilities are offset when there is a legally enforceable right to set off current tax assets against current tax liabilities;
and the deferred tax assets and the deferred tax liabilities relate to income taxes levied by the same taxation authority.
n) Government grants
Government grants are recognised where there is reasonable assurance that the grant will be received and all
attached conditions will be complied with. When the grant relates to an expense item, it is recognised as income
on a systematic basis over the periods that the related costs, for which it is intended to compensate, are expensed.
When the grant relates to an asset, it is recognised as income in equal amounts over the expected useful life of the
related asset.
When the Group receives grants for non-monetary assets, the asset and the grant are recorded at fair value amounts
and released to profit or loss over the expected useful life in a pattern of consumption of the benefit of the underlying
asset i.e. by equal annual instalments.
o) Cash and cash equivalents
Cash and cash equivalents comprise cash in hand, demand deposits with banks/corporations and short-term highly
liquid investments (original maturity less than 3 months) that are readily convertible into known amount of cash and
are subject to an insignificant risk of change in value.
p) Post-employment, long term and short term employee benefits
The Group provides post-employment benefits through various defined contribution and defined benefit plans
Defined contribution plans
A defined contribution plan is a plan under which the Group pays fixed contributions into an independent fund
administered by the government. The Group has no legal or constructive obligations to pay further contributions
after its payment of the fixed contribution, which are recognised as an expense in the year that related employee
213
Notes forming part of the Consolidated Financial Statements for the year ended 31 March 2017
71st Annual Report 2016-17 213
STRATEGIC REPORT GOVERNANCE FINANCIAL STATEMENTS OTHER INFORMATION
services are received.
Defined benefit plans
The defined benefit plans sponsored by the Group define the amount of the benefit that an employee will receive on
completion of services by reference to length of service and last drawn salary. The legal obligation for any benefits
remains with the Group.
Gratuity is post-employment benefit and is in the nature of a defined benefit plan. The liability recognised in the
financial statements in respect of gratuity is the present value of the defined benefit obligation at the reporting date,
together with adjustments for unrecognised actuarial gains or losses and past service costs. The defined benefit
obligation is calculated at or near the reporting date by an independent actuary using the projected unit credit
method.
Actuarial gains and losses arising from past experience and changes in actuarial assumptions are credited or charged
to the statement of OCI in the year in which such gains or losses are determined.
Other long-term employee benefits
Liability in respect of compensated absences becoming due or expected to be availed more than one year after the
balance sheet date is estimated on the basis of an actuarial valuation performed by an independent actuary using the
projected unit credit method.
Actuarial gains and losses arising from past experience and changes in actuarial assumptions are charged to statement
of profit and loss in the year in which such gains or losses are determined.
Short-term employee benefits
Expense in respect of other short term benefits is recognised on the basis of the amount paid or payable for the
period during which services are rendered by the employee.
q) Non-current assets held for sale and discontinued operations
An entity shall classify a non-current asset (or disposal group) as held for sale if its carrying amount will be recovered
principally through a sale transaction rather than through continuing use. This condition is regarded as met only
when the asset is available for immediate sale in its present condition subject only to terms that are usual and
customary for sale of such asset and its sale is highly probable. Management must be committed to sale which
should be expected to qualify for recognition as a completed sale within one year from the date of classification.
Non-current assets classified as held for sale are presented separately and measured at the lower of their carrying
amounts immediately prior to their classification as held for sale and their fair value less costs to sell. However, some
held for sale assets such as financial assets, assets arising from employee benefits and deferred tax assets, continue
to be measured in accordance with the Group’s relevant accounting policy for those assets. Once classified as held
for sale, the assets are not subject to depreciation or amortisation.
A discontinued operation is a component of the Group that either has been disposed of, or is classified as held for
sale. Profit or loss from discontinued operations comprise the post-tax profit or loss of discontinued operations and
the post-tax gain or loss resulting from the measurement and disposal of assets classified as held for sale. Any profit
or loss arising from the sale or re-measurement of discontinued operations is presented as part of a single line item,
profit or loss from discontinued operations.
r) Share based payments
The Group has equity-settled share-based remuneration plans for its employees. None of the Group’s plans are cash-
settled.
Where employees are rewarded using share-based payments, the fair value of employees’ services is determined
indirectly by reference to the fair value of the equity instruments granted. This fair value is appraised at the grant date
and excludes the impact of non-market vesting conditions (for example profitability and sales growth targets and
performance conditions).
All share-based remuneration is ultimately recognised as an expense in profit or loss with a corresponding credit to

214
Notes forming part of the Consolidated Financial Statements for the year ended 31 March 2017
Escorts Limited214
equity. If vesting periods or other vesting conditions apply, the expense is allocated over the vesting period, based on
the best available estimate of the number of share options expected to vest.
Upon exercise of share options, the proceeds received, net of any directly attributable transaction costs, are allocated
to share capital up to the nominal (or par) value of the shares issued with any excess being recorded as share
premium.
s) Provisions, contingent assets and contingent liabilities
Provisions are recognized only when there is a present obligation, as a result of past events, it is probable that an
outflow of resources embodying economic benefits will be required to settle the obligation, and when a reliable
estimate of the amount of obligation can be made at the reporting date. These estimates are reviewed at each
reporting date and adjusted to reflect the current best estimates. If the effect of the time value of money is material,
provisions are discounted to reflect its present value using a current pre-tax rate that reflects the current market
assessments of the time value of money and the risks specific to the obligation. When provisions are discounted, the
increase in the provision due to the passage of time is recognised as a finance cost.
Contingent liability is disclosed for:
• Possible obligations which will be confirmed only by future events not wholly within the control of the Group or
• Present obligations arising from past events where it is not probable that an outflow of resources will be required
to settle the obligation or a reliable estimate of the amount of the obligation cannot be made.
Contingent assets are not recognized. However, when inflow of economic benefits is probable, related asset is
disclosed.
t) Treasury shares
Treasury shares are presented as a deduction from equity. The original cost of treasury shares and the proceeds of
any subsequent sale are presented as movements in equity.
u) Segment Reporting
Operating segments are reported in a manner consistent with the internal reporting provided to the chief operating
decision maker.
The board of directors assess the financial performance and position of the Group, and makes strategic decisions
and therefore the board would be the chief operating decision maker.
The Group has the following operating/reportable segments: Agri machinery, Construction equipment, Railway
equipment and Auto ancillary products (Discontinued in financial year 2016-17). In identifying these operating
segments, management generally follows the Group’s service lines representing its main products and services.
Each of these operating segments is managed separately as each requires different technologies, marketing
approaches and other resources. All inter-segment transfers are carried out at arm’s length prices based on prices
charged to unrelated customers in standalone sales of identical goods or services.
For management purposes, the Group uses the same measurement policies as those used in its financial statements.
In addition, corporate assets which are not directly attributable to the business activities of any operating segment
are not allocated to a segment.
v) Earnings per share
Basic earnings per share is calculated by dividing the net profit or loss for the period attributable to equity shareholders
(after deducting attributable taxes) by the weighted average number of equity shares outstanding during the period.
The weighted average number of equity shares outstanding during the period is adjusted for events including a
bonus issue.
For the purpose of calculating diluted earnings per share, the net profit or loss for the period attributable to equity
shareholders and the weighted average number of shares outstanding during the period are adjusted for the effects
of all dilutive potential equity shares.
215
Notes forming part of the Consolidated Financial Statements for the year ended 31 March 2017
71st Annual Report 2016-17 215
STRATEGIC REPORT GOVERNANCE FINANCIAL STATEMENTS OTHER INFORMATION
2.3 Significant management judgement in applying accounting policies and estimation uncertainty
The following are the critical judgments and the key estimates concerning the future that management has made in
the process of applying the Group’s accounting policies and that may have the most significant effect on the amounts
recognized in the financial Statements or that have a significant risk of causing a material adjustment to the carrying
amounts of assets and liabilities within the next financial year.
Allowance for doubtful debts – The allowance for doubtful debts reflects management’s estimate of losses inherent
in its credit portfolio. This allowance is based on the Group’s estimate of the losses to be incurred, which derives from
past experience with similar receivables, current and historical past due amounts, dealer termination rates, write-offs and
collections, the careful monitoring of portfolio credit quality and current and projected economic and market conditions.
Should the present economic and financial situation persist or even worsen, there could be a further deterioration in the
financial situation of the Group’s debtors compared to that already taken into consideration in calculating the allowances
recognized in the financial statements.
Allowance for obsolete and slow-moving inventory - The allowance for obsolete and slow-moving inventory reflects
management’s estimate of the expected loss in value, and has been determined on the basis of past experience and
historical and expected future trends in the used vehicle market. A worsening of the economic and financial situation
could cause a further deterioration in conditions in the used vehicle market compared to that taken into consideration in
calculating the allowances recognized in the financial statements.
Product warranties - The Group makes provisions for estimated expenses related to product warranties at the time
products are sold. Management establishes these estimates based on historical information of the nature, frequency and
average cost of warranty claims. The Group seeks to improve vehicle quality and minimize warranty expenses arising
from claims. Warranty costs may differ from those estimated if actual claim rates are higher or lower than historical rates.
Useful lives of depreciable/amortisable assets – Management reviews its estimate of the useful lives of depreciable/
amortisable assets at each reporting date, based on the expected utility of the assets. Uncertainties in these estimates
relate to technical and economic obsolescence that may change the utility of certain software, IT equipment and other
plant and equipment.
Defined benefit obligation (DBO) – Management’s estimate of the DBO is based on a number of critical underlying
assumptions such as standard rates of inflation, mortality, discount rate and anticipation of future salary increases.
Variation in these assumptions may significantly impact the DBO amount and the annual defined benefit expenses.
Capitalisation of internally developed intangible assets - Distinguishing the research and development phases for
new products and design enhancements determining whether the recognition requirements for the capitalisation of
development costs are met requires judgement. After capitalisation, management monitors whether the recognition
requirements continue to be met and whether there any indicators that capitalised costs may be impaired.
Evaluation of indicators for impairment of assets - The evaluation of applicability of indicators of impairment of assets
requires assessment of several external and internal factors which could result in deterioration of recoverable amount of
the assets.
Recognition of deferred tax assets - The extent to which deferred tax assets can be recognized is based on an assessment
of the probability of the future taxable income against which the deferred tax assets can be utilized.
Non-consolidation of Farmtrac North America LLC (FNA) – At the behest of the creditors of FNA (subsidiary under
Previous GAAP), the authorities had appointed receiver who has taken over all the assets, books and records of FNA.
Therefore, the Group has lost its control on the relevant activities of FNA, hence the Group has not considered FNA for
consolidation in these financial statements.
Contingent liabilities – The Group is the subject of legal proceedings and tax issues covering a range of matters, which are
pending in various jurisdictions. Due to the uncertainty inherent in such matters, it is difficult to predict the final outcome
of such matters. The cases and claims against the Group often raise difficult and complex factual and legal issues, which
are subject to many uncertainties, including but not limited to the facts and circumstances of each particular case and
claim, the jurisdiction and the differences in applicable law. In the normal course of business management consults with

216
Notes forming part of the Consolidated Financial Statements for the year ended 31 March 2017
Escorts Limited216
legal counsel and certain other experts on matters related to litigation and taxes. The Group accrues a liability when it is
determined that an adverse outcome is probable and the amount of the loss can be reasonably estimated.
2.4 Standards issued but not yet effective
In March 2017, the Ministry of Corporate Affairs issued the Companies (Indian Accounting Standards) (Amendments)
Rules, 2017, notifying amendments to Ind AS 7, ‘Statement of cash flows’ and Ind AS 102, ‘Share-based payment.’ These
amendments are in accordance with the recent amendments made by International Accounting Standards Board (IASB)
to IAS 7, Statement of cash flows, and IFRS 2, Share-based payment, respectively. The amendments are applicable to the
Group from 1 April 2017.
Amendment to Ind AS 7:
The amendments to Ind AS 7 inter-alia require the entities to provide disclosures that enable users of financial statements
to evaluate changes in liabilities arising from financing activities, including both changes arising from cash flows and non-
cash changes, suggesting inclusion of a reconciliation between the opening and closing balances in the balance sheet
for liabilities arising from financing activities, to meet the disclosure requirement.
The Group is evaluating the requirements of the amendment and the effect on the financial statements is being evaluated.
Amendment to Ind AS 102:
The amendments to Ind AS 102 inter-alia provide specific guidance to measurement of cash-settled awards, modification
of cash-settled awards and awards that include a net settlement feature in respect of withholding taxes.
It clarifies that the fair value of cash-settled awards is determined on a basis consistent with that used for equity-settled
awards. Market-based performance conditions and non-vesting conditions are reflected in the ‘fair values’, but non-market
performance conditions and service vesting conditions are reflected in the estimate of the number of awards expected to
vest. Also, the amendment clarifies that if the terms and conditions of a cash-settled share-based payment transaction are
modified with the result that it becomes an equity-settled share-based payment transaction, the transaction is accounted
for as such from the date of the modification. Further, the amendment requires the award that includes a net settlement
feature in respect of withholding taxes to be treated as equity-settled in its entirety. The cash payment to the tax authority
is treated as if it was part of an equity settlement.
The Group is evaluating the requirements of the amendment and the impact on the financial statements is being
evaluated.
217
Notes forming part of the Consolidated Financial Statements for the year ended 31 March 2017
71st Annual Report 2016-17 217
STRATEGIC REPORT GOVERNANCE FINANCIAL STATEMENTS OTHER INFORMATION
3 (i) Property, plant and equipment (H crores)
Description Freehold
land
Leasehold
land
Buildings Leasehold
improve-
ments
Plant and
machinery
Furniture
and
fixtures
Vehicles Office
equipment
Total
Gross carrying value
As at 1 April 2015 1,049.04 9.28 375.59 0.05 779.18 102.18 10.88 9.83 2,336.03
Additions - - 5.61 - 35.68 4.53 3.20 0.39 49.41
Disposals - - - - (8.91) (2.07) (2.07) (0.98) (14.03)
Exchange differences - 0.02 0.12 - 0.03 0.01 0.01 - 0.19
As at 31 March 2016 1,049.04 9.30 381.32 0.05 805.98 104.65 12.02 9.24 2,371.60
Additions - - 1.70 - 46.22 9.57 1.41 0.43 59.33
Transfer to assets held for sale - - - - (13.49) - (0.54) - (14.03)
Disposals - - - - (65.99) (8.69) (0.24) (0.62) (75.54)
Exchange differences - (0.02) (0.13) - (0.01) (0.02) (0.01) - (0.19)
As at 31 March 2017 1,049.04 9.28 382.89 0.05 772.71 105.51 12.64 9.05 2,341.17
Accumulated depreciation
As at 1 April 2015 - 0.71 228.72 0.01 490.80 74.02 2.78 7.67 804.71
Charge for the year - 0.10 6.71 - 38.26 7.35 1.63 0.96 55.01
Disposals - - - - (8.00) (2.03) (0.85) (0.90) (11.78)
As at 31 March 2016 - 0.81 235.43 0.01 521.06 79.34 3.56 7.73 847.94
Charge for the year - 0.10 6.76 - 35.73 7.41 1.58 0.53 52.11
Disposals - - - - (54.86) (8.67) (0.14) (0.58) (64.25)
Transfer to assets held for sale - - - - (7.92) - (0.13) - (8.05)
Exchange differences - - (0.01) - - - - - (0.01)
As at 31 March 2017 - 0.91 242.18 0.01 494.01 78.08 4.87 7.68 827.74
Net block as at 1 April 2015 1,049.04 8.57 146.87 0.04 288.38 28.16 8.10 2.16 1,531.32
Net block as at 31 March 2016 1,049.04 8.49 145.89 0.04 284.92 25.31 8.46 1.51 1,523.66
Net block as at 31 March 2017 1,049.04 8.37 140.71 0.04 278.70 27.43 7.77 1.37 1,513.43
Contractual obligations
Refer note 34 for disclosure of contractual commitments for the acquisition of property, plant and equipment.
Property plant and equipment pledged as security
Refer note 46 for information on property, plant and equipment pledged as security by the Group.
Finance leases
The Group had taken land and certain IT equipments on finance lease. Out of which, all of the leased IT equipments having a
net block of H2.72 crores as at 1 April 2015 (Date of expiry of the lease term) are owned by the Group now. Refer note 41 for
contractual commitments for lease payments in respect to these assets.
Discontinued operations
Depreciation for the current year includes depreciation for discontinued operations H1.41 crores (31 March 2016: H2.56 crores).

218
Notes forming part of the Consolidated Financial Statements for the year ended 31 March 2017
Escorts Limited218
3 (ii) Capital work-in-progress (H crores)
31 March 2017 31 March 2016 1 April 2015
Capital work-in-progress 26.56 21.60 19.61
Movement in capital work in progress: (H crores)
Particulars Amount
Capital work-in-progress as at 1 April 2015 19.61
Add: additions during the year 51.12
Less: capitalisation during the year (49.13)
Capital work-in-progress as at 31 March 2016 21.60
Add: additions during the year 64.28
Less: Foreign exchange translation (0.01)
Less: capitalisation during the year (59.31)
Capital work-in-progress as at 31 March 2017 26.56
Capitalised borrowing cost
The borrowing costs capitalised during the year ended 31 March 2017 was H Nil (31 March 2016 H1.85 crores ) (1 April 2015
H2.22 crores ).
4 Investment property (H crores)
Description Freehold land Building Total
Gross carrying value
As at 1 April 2015 20.04 4.88 24.92
Additions - - -
Disposals - - -
As at 31 March 2016 20.04 4.88 24.92
Additions - - -
Disposals (0.34) (0.02) (0.36)
As at 31 March 2017 19.70 4.86 24.56
Accumulated depreciation
As at 1 April 2015 - 0.92 0.92
Charge for the year - 0.12 0.12
Disposals - - -
As at 31 March 2016 - 1.04 1.04
Charge for the year - 0.15 0.15
Disposals - (0.01) (0.01)
As at 31 March 2017 - 1.18 1.18
Net block as at 1 April 2015 20.04 3.96 24.00
Net block as at 31 March 2016 20.04 3.84 23.88
Net block as at 31 March 2017 19.70 3.68 23.38
219
Notes forming part of the Consolidated Financial Statements for the year ended 31 March 2017
71st Annual Report 2016-17 219
STRATEGIC REPORT GOVERNANCE FINANCIAL STATEMENTS OTHER INFORMATION
4 Investment property (contd.)
(i) Amount recognised in profit and loss for investment property
(H crores)
31 March 2017 31 March 2016
Rental income 0.36 0.36
Direct operating expenses that generated rental income 0.21 0.11
Direct operating expenses that did not generate rental income - -
Profit from leasing of investment properties 0.15 0.25
(ii) Leasing arrangements
Certain investment properties are leased to tenants under long-term operating leases with rentals payable monthly.
However all the leases are cancellable at the option of lessee, hence there is no lease disclosure as required by Ind AS 17
“Leases”.
(iii) Fair value of investment property
(H crores)
Particulars 31 March 2017 31 March 2016 1 April 2015
Fair value 23.75 33.87 39.36
The Group obtains independent valuations for its investment property at least annually. The best evidence of fair value is
current prices in an active market for similar properties.
Where such information is not available, the independent valuer consider information from a variety of sources including:
a) In case of valuation of land, current prices in an active market for similar properties of the same area and localities
have been taken. The rates of which are based on verbal enquiries from the property dealers of the areas and
localities;
b) in case of constructed building, rates derived from CPWD/CWC PARS as on 01-10-2010-12/1997 have been taken as
the basis of valuation.
These rates have further been modified to bring them at par with the present day price index and as per specifications
found at site. Necessary depreciation for age and life of the structure has been taken into account. Where the work is not
covered under any of the standard specifications the rates have been assessed as on the date of valuations.
5 (i) Intangible assets (H crores)
Description Prototypes Technical
know how
Software Total
Gross carrying value
As at 1 April 2015 3.07 7.91 31.21 42.19
Additions - 4.02 0.72 4.74
Disposals - - (1.00) (1.00)
Exchange differences - 0.02 - 0.02
As at 31 March 2016 3.07 11.95 30.93 45.95
Additions 28.49 6.77 6.42 41.68
Disposals - - (0.31) (0.31)
Exchange differences - (0.04) - (0.04)
As at 31 March 2017 31.56 18.68 37.04 87.28

220
Notes forming part of the Consolidated Financial Statements for the year ended 31 March 2017
Escorts Limited220
Contractual obligations
Refer note 34 for disclosure of contractual commitments for the acquisition of intangible assets.
Discontinued operations
Amortisation for the current year includes amortisation for discontinued operations H0.03 crores (31 March 2016: H0.05
crores).
5 (ii) Intangible assets under development (H crores)
31 March 2017 31 March 2016 1 April 2015
Intangible assets under development 8.14 36.83 36.07
Movement in intangible assets under development : (H crores)
Particulars Amount
Intangible assets under development as at 1 April 2015 36.07
Add: additions during the year 5.27
Less: capitalisation during the year (4.51)
Intangible assets under development as at 31 March 2016 36.83
Add: additions during the year 12.56
Less: capitalisation during the year (41.25)
Intangible assets under development as at 31 March 2017 8.14
5 (i) Intangible assets (H crores)
Description Prototypes Technical
know how
Software Total
Accumulated amortisation
As at 1 April 2015 2.10 6.91 16.96 25.97
Charge for the year 0.62 0.60 4.39 5.61
Disposals - - (1.00) (1.00)
Exchange differences - 0.01 - 0.01
As at 31 March 2016 2.72 7.52 20.35 30.59
Charge for the year 6.28 1.85 4.47 12.60
Disposals - - (0.22) (0.22)
Exchange differences - (0.02) - (0.02)
As at 31 March 2017 9.00 9.35 24.60 42.95
Net block as at 1 April 2015 0.97 1.00 14.25 16.22
Net block as at 31 March 2016 0.35 4.43 10.58 15.36
Net block as at 31 March 2017 22.56 9.33 12.44 44.33
(contd.)
221
Notes forming part of the Consolidated Financial Statements for the year ended 31 March 2017
71st Annual Report 2016-17 221
STRATEGIC REPORT GOVERNANCE FINANCIAL STATEMENTS OTHER INFORMATION
6 Investments
(i) Investments - Non-current (H crores)
As at
31 March 2017
As at
31 March 2016
As at
1 April 2015
Investments accounted for using equity method
Fully paid equity shares (unquoted) 1.02 2.11 -
Interest in partnership firms (refer note 1B) 0.05 - -
Investment carried at fair value through OCI
Fully paid equity shares (quoted) 0.52 0.42 0.45
Fully paid equity shares (unquoted) 35.73 28.07 24.98
Investment carried at fair value through profit and loss
Fully paid equity shares (quoted) 0.10 0.03 0.04
Debt instruments quoted at amortised cost
Fully paid preference shares (unquoted) 1.57 1.79 1.40
38.99 32.42 26.87
The market value of quoted investments is equal to the carrying value.
(ii) Investments - Current (H crores)
As at
31 March 2017
As at
31 March 2016
As at
1 April 2015
Investment carried at fair value through profit or loss
Investment in equity shares (quoted) 1.00 1.26 1.37
Debentures (quoted) 0.39 0.47 0.46
Mutual funds (quoted) 171.95 5.62 4.17
Bonds (unquoted) 0.01 0.01 0.01
173.35 7.36 6.01
The market value of quoted investments is equal to the carrying value.
Details of investment is as follows:
Non-current investments (H crores)
31 March 2017 31 March 2016 1 April 2015
In equity instruments^
Joint ventures and associates (unquoted)
Adico Escorts Agri Equipment Private Limited 1.02 2.11 -
Interest in partnership firms (refer note 1B) 0.05 - -
Escorts Consumer Credit Limited - - -
1.07 2.11 -
Others (quoted)
Asahi India Glass Limited (face value of H1 each) 0.41 0.30 0.28
Godavari Drugs Limited 0.07 0.07 0.11
Twenty First Century Medicare Limited 0.04 0.05 0.07
Tamilnadu Newsprints & Papers Limited* - - -
Nagarjuna Fertilizers and Chemicals Limited (face value of H1
each)
0.06 - -
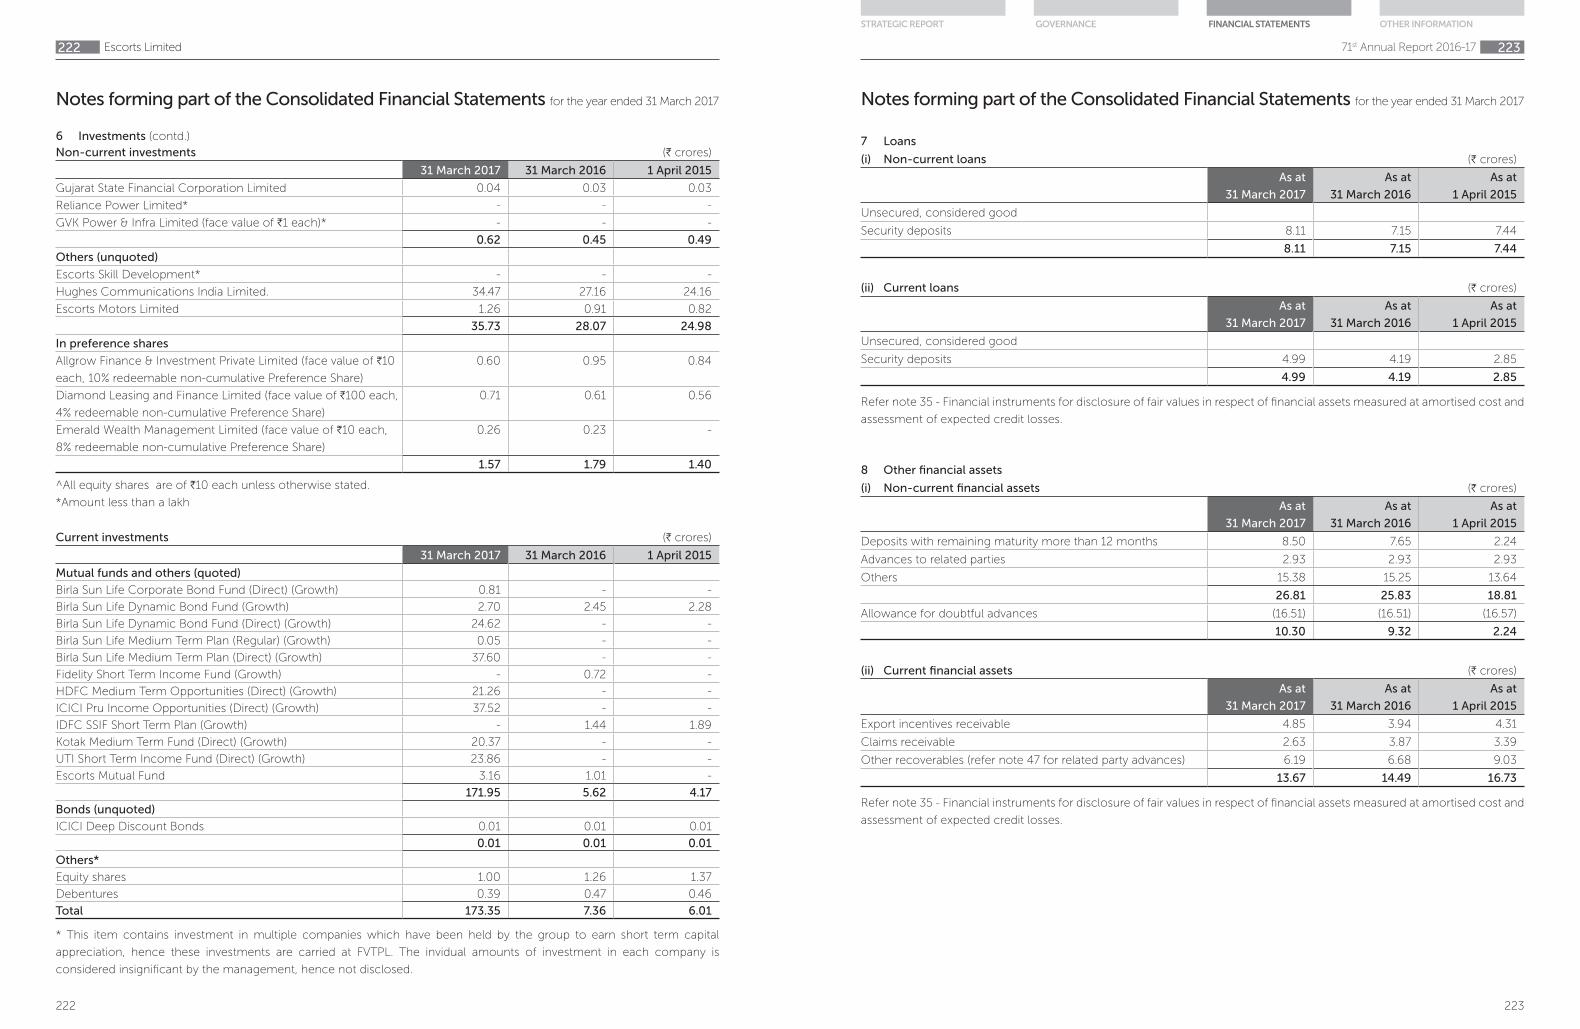
222
Notes forming part of the Consolidated Financial Statements for the year ended 31 March 2017
Escorts Limited222
Current investments (H crores)
31 March 2017 31 March 2016 1 April 2015
Mutual funds and others (quoted)
Birla Sun Life Corporate Bond Fund (Direct) (Growth) 0.81 - -
Birla Sun Life Dynamic Bond Fund (Growth) 2.70 2.45 2.28
Birla Sun Life Dynamic Bond Fund (Direct) (Growth) 24.62 - -
Birla Sun Life Medium Term Plan (Regular) (Growth) 0.05 - -
Birla Sun Life Medium Term Plan (Direct) (Growth) 37.60 - -
Fidelity Short Term Income Fund (Growth) - 0.72 -
HDFC Medium Term Opportunities (Direct) (Growth) 21.26 - -
ICICI Pru Income Opportunities (Direct) (Growth) 37.52 - -
IDFC SSIF Short Term Plan (Growth) - 1.44 1.89
Kotak Medium Term Fund (Direct) (Growth) 20.37 - -
UTI Short Term Income Fund (Direct) (Growth) 23.86 - -
Escorts Mutual Fund 3.16 1.01 -
171.95 5.62 4.17
Bonds (unquoted)
ICICI Deep Discount Bonds 0.01 0.01 0.01
0.01 0.01 0.01
Others*
Equity shares 1.00 1.26 1.37
Debentures 0.39 0.47 0.46
Total 173.35 7.36 6.01
* This item contains investment in multiple companies which have been held by the group to earn short term capital
appreciation, hence these investments are carried at FVTPL. The invidual amounts of investment in each company is
considered insignificant by the management, hence not disclosed.
6 Investments (contd.)
Non-current investments (H crores)
31 March 2017 31 March 2016 1 April 2015
Gujarat State Financial Corporation Limited 0.04 0.03 0.03
Reliance Power Limited* - - -
GVK Power & Infra Limited (face value of H1 each)* - - -
0.62 0.45 0.49
Others (unquoted)
Escorts Skill Development* - - -
Hughes Communications India Limited. 34.47 27.16 24.16
Escorts Motors Limited 1.26 0.91 0.82
35.73 28.07 24.98
In preference shares
Allgrow Finance & Investment Private Limited (face value of H10
each, 10% redeemable non-cumulative Preference Share)
0.60 0.95 0.84
Diamond Leasing and Finance Limited (face value of H100 each,
4% redeemable non-cumulative Preference Share)
0.71 0.61 0.56
Emerald Wealth Management Limited (face value of H10 each,
8% redeemable non-cumulative Preference Share)
0.26 0.23 -
1.57 1.79 1.40
^All equity shares are of H10 each unless otherwise stated.
*Amount less than a lakh
223
Notes forming part of the Consolidated Financial Statements for the year ended 31 March 2017
71st Annual Report 2016-17 223
STRATEGIC REPORT GOVERNANCE FINANCIAL STATEMENTS OTHER INFORMATION
7 Loans
(i) Non-current loans (H crores)
As at
31 March 2017
As at
31 March 2016
As at
1 April 2015
Unsecured, considered good
Security deposits 8.11 7.15 7.44
8.11 7.15 7.44
(ii) Current loans (H crores)
As at
31 March 2017
As at
31 March 2016
As at
1 April 2015
Unsecured, considered good
Security deposits 4.99 4.19 2.85
4.99 4.19 2.85
Refer note 35 - Financial instruments for disclosure of fair values in respect of financial assets measured at amortised cost and
assessment of expected credit losses.
8 Other financial assets
(i) Non-current financial assets (H crores)
As at
31 March 2017
As at
31 March 2016
As at
1 April 2015
Deposits with remaining maturity more than 12 months 8.50 7.65 2.24
Advances to related parties 2.93 2.93 2.93
Others 15.38 15.25 13.64
26.81 25.83 18.81
Allowance for doubtful advances (16.51) (16.51) (16.57)
10.30 9.32 2.24
(ii) Current financial assets (H crores)
As at
31 March 2017
As at
31 March 2016
As at
1 April 2015
Export incentives receivable 4.85 3.94 4.31
Claims receivable 2.63 3.87 3.39
Other recoverables (refer note 47 for related party advances) 6.19 6.68 9.03
13.67 14.49 16.73
Refer note 35 - Financial instruments for disclosure of fair values in respect of financial assets measured at amortised cost and
assessment of expected credit losses.

224
Notes forming part of the Consolidated Financial Statements for the year ended 31 March 2017
Escorts Limited224
9 Income taxes
The income tax expense consists of the following: (H crores)
Year ended
31 March 2017
Year ended
31 March 2016
Current tax:
Current tax expense for current year 74.51 24.50
Current tax expense / (benefit) pertaining to prior periods 7.24 (2.76)
81.75 21.74
Deferred tax expense / (benefit) (4.50) (9.47)
Total income tax expense recognised in the current year for continuing operations 77.25 12.27
Tax expense of discontinued operations (17.75) (8.99)
Total income tax expense 59.50 3.28
(i) The reconciliation of estimated income tax expense at statutory income tax rate to income tax expense reported in
statement of profit and loss is as follows:
(H crores)
Year ended
31 March 2017
Year ended
31 March 2016
Profit before income tax from continuing and discontinued operations 190.25 73.43
Statutory income tax rate 34.61% 34.61%
Expected income tax expense 65.84 25.41
Tax effect of adjustment to reconcile expected income tax expense to
reported income tax expense
Tax on expense not eligible for deduction 1.62 7.88
Weighted and standard deduction under Income Tax Act,1961 (18.98) (20.68)
Tax pertaining to prior years 7.24 (2.76)
Changes in deferred tax and MAT credit entitlement due to assessments of tax returns - (9.66)
Tax rate differences in respect of foreign subsidiary 1.50 1.61
Tax losses on which no deferred tax is recognised 1.82 1.96
Others 0.46 (0.48)
Total income tax expense 59.50 3.28
(ii) (a) Significant components of net deferred tax assets and liabilities for the year ended 31 March 2017 are as follows:
(H crores)
Opening
balance
Recognised /
reversed through
profit and loss
Recognised /
reversed from
OCI/equity
Closing balance
Deferred tax assets/(liabilities) in relation to:
Property, plant and equipment, investment
property and intangible assets
(80.28) 1.27 - (79.00)
Receivables, financial assets and liabilities at
amortised cost
32.91 5.03 0.10 38.04
Provision for employee & others liabilities
deductible on actual payment
32.18 (1.25) 0.90 31.81
MAT credit entitlement 63.60 - - 63.60
Unrealised gain on investment carried at fair value (3.16) (1.24) (0.89) (5.30)
Unabsorbed losses 1.65 0.69 - 2.35
Net deferred tax assets/(liabilities) 46.90 4.50 0.11 51.50
225
Notes forming part of the Consolidated Financial Statements for the year ended 31 March 2017
71st Annual Report 2016-17 225
STRATEGIC REPORT GOVERNANCE FINANCIAL STATEMENTS OTHER INFORMATION
(iv) Unrecognised temporary difference
(H crores)
Year ended
31 March 2017
Year ended
31 March 2016
Temporary difference relating to investment in subsidiaries for which deffered
tax liability have not been recognised
Undistributed earnings 1.19 1.56
Unrecognised deferred tax liabilities relating to the above temporary difference 0.24 0.32
A subsidiary of the group have undistributed earnings which, if paid out as dividends, would be subject to tax in the hands
of recipient. An assessable temporary difference exists, but no deffered tax liability has been recognised as the parent
entity is able to control the timing of distributions from a subsidiary and is not expected to distribute these profits in the
foreseeable future.
(ii) (b) Significant components of net deferred tax assets and liabilities for the year ended 31 March 2016 are as follows:
(H crores)
Opening
balance
Recognised /
reversed through
profit and loss
Recognised /
reversed from
OCI/equity
Closing
balance
Deferred tax assets/(liabilities) in relation to:
Property, plant and equipment, investment property
and intangible assets
(81.86) 1.58 - (80.28)
Receivables, financial assets and liabilities at
amortised cost
41.46 (9.27) 0.72 32.91
Provision for employee & others liabilities
deductible on actual payment
33.81 (1.43) (0.20) 32.18
MAT credit entitlement 45.20 18.40 - 63.60
Unrealised gain on investment carried at fair value (2.84) 0.04 (0.36) (3.16)
Unabsorbed losses 1.50 0.15 - 1.65
Net deferred tax assets/(liabilities) 37.27 9.47 0.16 46.90
9 Income taxes (contd.)
(iii) Unused tax losses and credits
(a) Minimum alternate tax
The Group had unused MAT credit amounting to H63.60 crores as at 31 March 2017 (31 March 2016: H63.60 crores)
(1 April 2015: H45.20 crores). Such tax credits have been recognised on the basis that recovery is probable in the
foreseeable future. This recognised MAT credit expires, if unutilized, based on the year of origination as follows:
Financial year ending (H crores)
31 March 2019 2.96
31 March 2020 0.93
31 March 2021 15.67
31 March 2022 9.44
31 March 2023 19.05
31 March 2024 4.84
31 March 2025 1.67
31 March 2026 9.04
63.60
(b) Capital losses
The Group has not recognised deferred tax asset of H13.23 crores on unused losses under the head Capital Gains as
the Group is not likely to generate taxable income under the same head in foreseeable future. The significant portion
of these losses will expire in financial year ending 31 March 2019.

226
Notes forming part of the Consolidated Financial Statements for the year ended 31 March 2017
Escorts Limited226
10 Other assets
(i) Other non-current assets (H crores)
As at
31 March 2017
As at
31 March 2016
As at
1 April 2015
Prepaid expenses 0.13 0.06 0.10
Capital advances 7.35 5.76 8.47
Deposits with statutory authorities 7.44 6.38 4.13
14.92 12.20 12.70
Allowance for doubtful advances (1.51) (0.89) (0.73)
13.41 11.31 11.97
(ii) Other current assets (H crores)
As at
31 March 2017
As at
31 March 2016
As at
1 April 2015
Advances recoverable in kind 22.96 20.49 18.53
Advances to suppliers 16.38 8.13 24.45
Prepaid expenses 7.50 8.15 6.53
Balances with statutory authorities 81.68 107.49 142.72
128.52 144.26 192.23
Allowance for doubtful advances (25.98) (41.72) (40.15)
102.54 102.54 152.08
11 INVENTORIES (H crores)
As at
31 March 2017
As at
31 March 2016
As at
1 April 2015
Raw materials and components 174.78 179.19 238.89
Goods-in-transit 3.03 0.72 0.46
Allowance for obsolete and slow moving (14.06) (10.74) (41.13)
163.75 169.17 198.22
Work-in-progress 36.15 37.18 38.43
Finished goods 147.49 130.17 142.79
Goods-in-transit 22.35 19.42 5.95
Allowance for obsolete and slow moving (0.92) (0.92) (1.02)
168.92 148.67 147.72
Stock-in-trade 68.88 58.55 55.47
Goods-in-transit 1.94 0.39 0.36
Allowance for obsolete and slow moving (11.43) (12.53) (18.84)
59.39 46.41 36.99
Stores and spares 13.25 20.59 25.13
Loose tools 8.84 10.55 13.64
Allowance for obsolete and slow moving - - (1.59)
8.84 10.55 12.05
450.30 432.57 458.54
Inventories have been pledged as security for liabilties, for details refer note 19 and 46
227
Notes forming part of the Consolidated Financial Statements for the year ended 31 March 2017
71st Annual Report 2016-17 227
STRATEGIC REPORT GOVERNANCE FINANCIAL STATEMENTS OTHER INFORMATION
12 Trade receivables (H crores)
As at
31 March 2017
As at
31 March 2016
As at
1 April 2015
Secured : considered good 57.56 52.00 32.94
Unsecured : considered good 413.52 338.75 362.87
: considered doubtful 53.05 59.17 74.28
524.13 449.92 470.09
Allowance for doubtful receivables
Unsecured : considered good (expected credit loss) (14.63) (15.78) (20.25)
: considered doubtful (53.05) (59.17) (74.28)
(67.68) (74.95) (94.53)
456.45 374.97 375.56
(i) Trade receivables have been pledged as security for liabilities, for details refer note 19 and 46.
(ii) Refer note 35 - Financial instruments for disclosure of fair values in respect of financial assets measured at amortised cost
and assessment of expected credit losses.
13 Cash and cash equivalents (H crores)
As at
31 March 2017
As at
31 March 2016
As at
1 April 2015
Balances with banks in current accounts 53.31 30.15 30.48
Cheques / drafts in hand 15.00 0.12 -
Cash on hand 0.41 0.34 0.34
Debit balance of cash credit accounts 0.50 2.51 3.04
Bank deposits with maturity less than 3 months - - 22.00
69.22 33.12 55.86
In accordance with the MCA notification G.S.R 308(E) dated March 30, 2017 details of Specified Bank Notes (SBN) and Other
Denomination Notes (ODN) held and transacted during the period from November 8, 2016 to December 30, 2016, is given
below:
(H)
Particulars SBNs ODN Total
Closing cash in hand as on November 8, 2016 45,27,500 1,94,844 47,22,344
(+) Permitted receipts - 4,28,249 4,28,249
(-) Permitted payments - (1,07,820 ) (1,07,820)
(-) Amount deposited in banks (45,27,500) - (45,27,500)
(+) Amount drawn from banks - 11,38,000 11,38,000
Closing cash in hand as on December 30, 2016 - 16,53,273 16,53,273
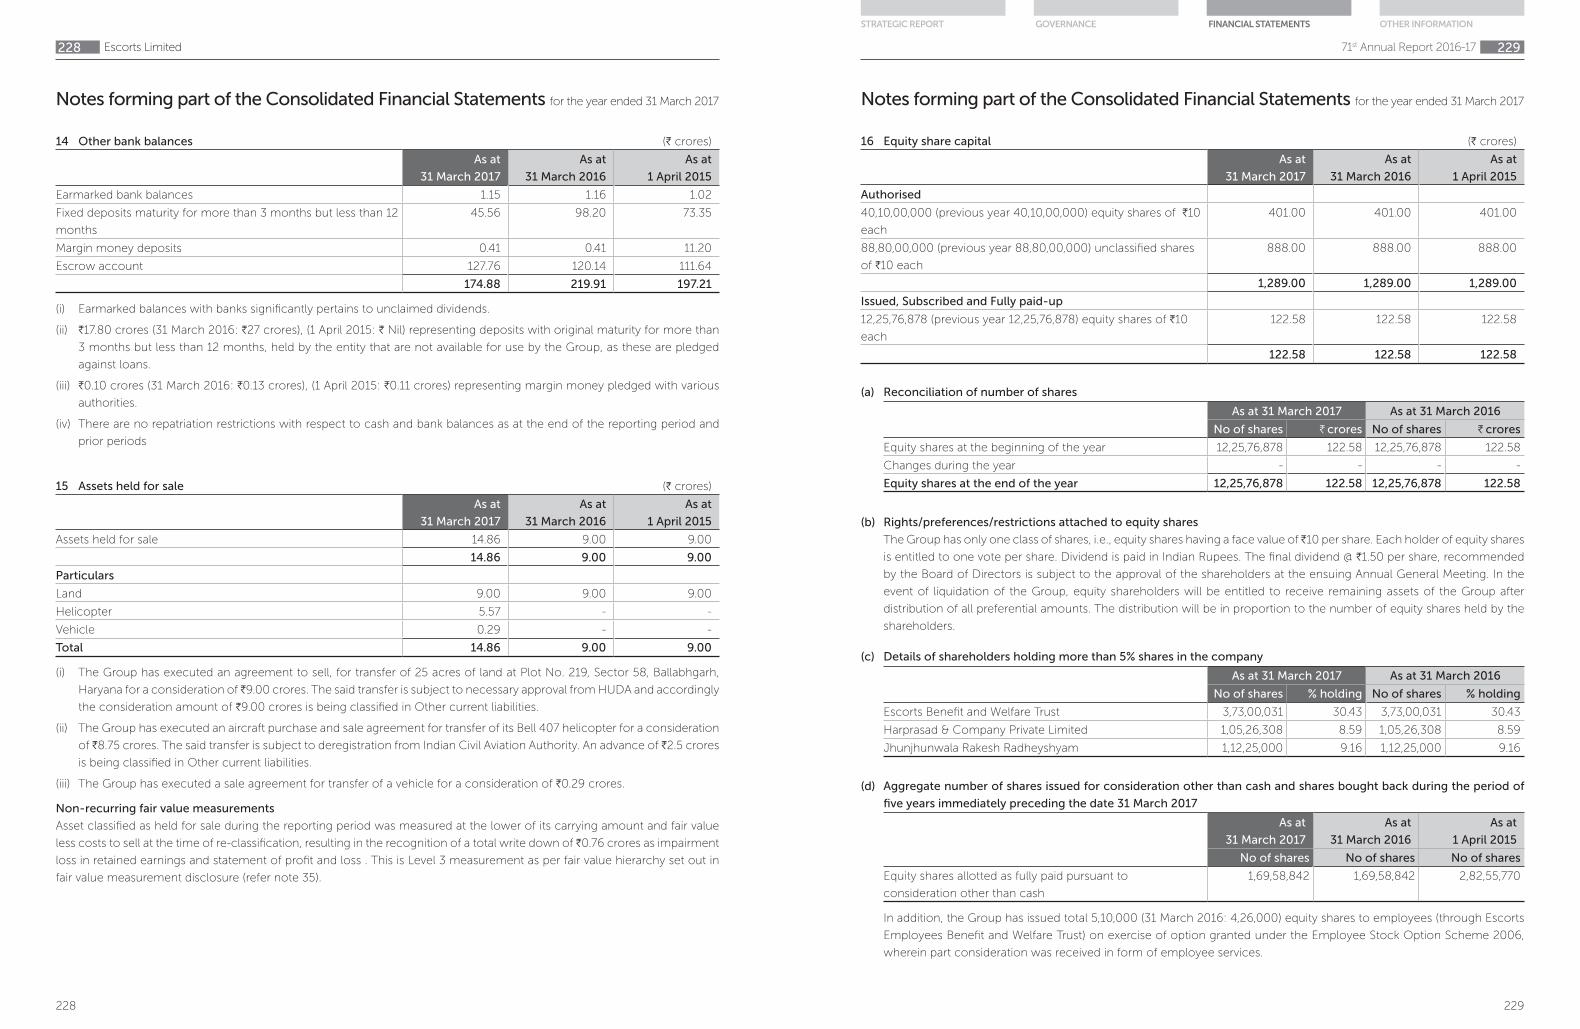
228
Notes forming part of the Consolidated Financial Statements for the year ended 31 March 2017
Escorts Limited228
14 Other bank balances (H crores)
As at
31 March 2017
As at
31 March 2016
As at
1 April 2015
Earmarked bank balances 1.15 1.16 1.02
Fixed deposits maturity for more than 3 months but less than 12
months
45.56 98.20 73.35
Margin money deposits 0.41 0.41 11.20
Escrow account 127.76 120.14 111.64
174.88 219.91 197.21
(i) Earmarked balances with banks significantly pertains to unclaimed dividends.
(ii) H17.80 crores (31 March 2016: H27 crores), (1 April 2015: H Nil) representing deposits with original maturity for more than
3 months but less than 12 months, held by the entity that are not available for use by the Group, as these are pledged
against loans.
(iii) H0.10 crores (31 March 2016: H0.13 crores), (1 April 2015: H0.11 crores) representing margin money pledged with various
authorities.
(iv) There are no repatriation restrictions with respect to cash and bank balances as at the end of the reporting period and
prior periods
15 Assets held for sale (H crores)
As at
31 March 2017
As at
31 March 2016
As at
1 April 2015
Assets held for sale 14.86 9.00 9.00
14.86 9.00 9.00
Particulars
Land 9.00 9.00 9.00
Helicopter 5.57 - -
Vehicle 0.29 - -
Total 14.86 9.00 9.00
(i) The Group has executed an agreement to sell, for transfer of 25 acres of land at Plot No. 219, Sector 58, Ballabhgarh,
Haryana for a consideration of H9.00 crores. The said transfer is subject to necessary approval from HUDA and accordingly
the consideration amount of H9.00 crores is being classified in Other current liabilities.
(ii) The Group has executed an aircraft purchase and sale agreement for transfer of its Bell 407 helicopter for a consideration
of H8.75 crores. The said transfer is subject to deregistration from Indian Civil Aviation Authority. An advance of H2.5 crores
is being classified in Other current liabilities.
(iii) The Group has executed a sale agreement for transfer of a vehicle for a consideration of H0.29 crores.
Non-recurring fair value measurements
Asset classified as held for sale during the reporting period was measured at the lower of its carrying amount and fair value
less costs to sell at the time of re-classification, resulting in the recognition of a total write down of H0.76 crores as impairment
loss in retained earnings and statement of profit and loss . This is Level 3 measurement as per fair value hierarchy set out in
fair value measurement disclosure (refer note 35).
229
Notes forming part of the Consolidated Financial Statements for the year ended 31 March 2017
71st Annual Report 2016-17 229
STRATEGIC REPORT GOVERNANCE FINANCIAL STATEMENTS OTHER INFORMATION
16 Equity share capital (H crores)
As at
31 March 2017
As at
31 March 2016
As at
1 April 2015
Authorised
40,10,00,000 (previous year 40,10,00,000) equity shares of H10
each
401.00 401.00 401.00
88,80,00,000 (previous year 88,80,00,000) unclassified shares
of H10 each
888.00 888.00 888.00
1,289.00 1,289.00 1,289.00
Issued, Subscribed and Fully paid-up
12,25,76,878 (previous year 12,25,76,878) equity shares of H10
each
122.58 122.58 122.58
122.58 122.58 122.58
(a) Reconciliation of number of shares
As at 31 March 2017 As at 31 March 2016
No of shares H crores No of shares H crores
Equity shares at the beginning of the year 12,25,76,878 122.58 12,25,76,878 122.58
Changes during the year - - - -
Equity shares at the end of the year 12,25,76,878 122.58 12,25,76,878 122.58
(c) Details of shareholders holding more than 5% shares in the company
As at 31 March 2017 As at 31 March 2016
No of shares % holding No of shares % holding
Escorts Benefit and Welfare Trust 3,73,00,031 30.43 3,73,00,031 30.43
Harprasad & Company Private Limited 1,05,26,308 8.59 1,05,26,308 8.59
Jhunjhunwala Rakesh Radheyshyam 1,12,25,000 9.16 1,12,25,000 9.16
(d) Aggregate number of shares issued for consideration other than cash and shares bought back during the period of
five years immediately preceding the date 31 March 2017
As at
31 March 2017
As at
31 March 2016
As at
1 April 2015
No of shares No of shares No of shares
Equity shares allotted as fully paid pursuant to
consideration other than cash
1,69,58,842 1,69,58,842 2,82,55,770
In addition, the Group has issued total 5,10,000 (31 March 2016: 4,26,000) equity shares to employees (through Escorts
Employees Benefit and Welfare Trust) on exercise of option granted under the Employee Stock Option Scheme 2006,
wherein part consideration was received in form of employee services.
(b) Rights/preferences/restrictions attached to equity shares
The Group has only one class of shares, i.e., equity shares having a face value of H10 per share. Each holder of equity shares
is entitled to one vote per share. Dividend is paid in Indian Rupees. The final dividend @ H1.50 per share, recommended
by the Board of Directors is subject to the approval of the shareholders at the ensuing Annual General Meeting. In the
event of liquidation of the Group, equity shareholders will be entitled to receive remaining assets of the Group after
distribution of all preferential amounts. The distribution will be in proportion to the number of equity shares held by the
shareholders.

230
Notes forming part of the Consolidated Financial Statements for the year ended 31 March 2017
Escorts Limited230
17 Other equity (H crores)
As at
31 March 2017
As at
31 March 2016
Capital reserve 97.40 97.40
General reserve 513.33 513.33
Capital redemption reserve
Opening balance 6.00 4.00
Transferred from retained earnings - 2.00
6.00 6.00
Securities premium reserve
Opening balance 456.57 456.54
Transferred from Employee's stock option outstanding account 0.02 0.03
456.59 456.57
Employee stock option outstanding account
Opening balance 0.07 0.05
Charge for the year 0.05 0.05
Transferred to Securities premium reserve on exercise of options (0.02) (0.03)
0.10 0.07
Treasury Shares
Opening balance (383.75) (384.66)
Changes during the year 13.04 0.91
(370.71) (383.75)
Retained earnings
Opening balance 624.69 570.05
Net profit for the year 131.27 70.61
Equity dividend (net of dividend on treasury shares) (10.07) (10.93)
Tax on equity dividend (2.99) (2.99)
Gain on sale of treasury shares 16.48 -
Transferred to capital redemption reserve - (2.00)
Transferred to special reserve - (0.05)
759.38 624.69
Additional paid up capital-equity component
Opening balance 6.38 3.14
Changes during the year 1.59 3.24
7.97 6.38
Special reserve
Opening balance 0.07 0.02
Changes during the year - 0.05
0.07 0.07
(e) Shares reserved for issue under options
As at
31 March 2017
As at
31 March 2016
As at
1 April 2015
No of shares No of shares No of shares
Under the Employee stock option plan (ESOP) 2006, equity
share of H10 each, at an exercise price of H85 per share
31,01,612 31,85,612 32,93,612
For terms and other details refer note 40
16 Equity share capital (contd.)
231
Notes forming part of the Consolidated Financial Statements for the year ended 31 March 2017
71st Annual Report 2016-17 231
STRATEGIC REPORT GOVERNANCE FINANCIAL STATEMENTS OTHER INFORMATION
17 Other equity (H crores)
As at
31 March 2017
As at
31 March 2016
Other comprehensive income, net of tax
Equity instruments classified as fair value through other comprehensive income
Opening balance 22.00 19.29
Changes during the year 6.87 2.71
28.87 22.00
Re-measurements of defined employee benefit plans
Opening balance 0.43 -
Changes during the year (1.72) 0.43
(1.29) 0.43
Foreign currency translation reserve
Opening balance 0.71 -
Changes during the year (0.07) 0.71
0.64 0.71
1,498.35 1,343.90
(contd.)
Nature and purpose of other reserves
Securities premium reserve
Securities premium reserve represents premium received on issue of shares. The reserve is utilised in accordance with the
provisions of the Companies Act.
Employee's stock options outstanding account
The account is used to recognise the grant date value of options issued to employees under Employee stock option plan.
Capital redemption reserve
This reserve represents reserve created on redemption of preference shares. The reserve is utilised in accordance with the
provisions of the Companies Act.
Capital reserve
This reserve represents the excess of net assets taken, over the cost of consideration paid at the time of amalgamation done
previously. This reserve is not available for the distribution to the shareholders.
Treasury shares
This reserve represents the cost of parent company’s own equity shares held by the Employee Stock Option (“ESOP”) Trust,
Escorts Benefit and Welfare Trust and Escorts Benefit Trust which has been consolidated in these financial statements. During
the year, shares held by Escorts Benefit Trust are sold and the surplus funds are transferred to the parent company.
General reserve
The Group has transferred a portion of the net profit of the group before declaring dividend to general reserve pursuant to
the earlier provision of Companies Act 1956. Mandatory transfer to general reserve is not required under the Companies Act
2013.
Other comprehensive income (OCI) reserve
(i) The Group has elected to recognise changes in the fair value of certain investments in equity securities in other
comprehensive income. These changes are accumulated within the FVOCI equity investments reserve within equity. The
Group transfers amounts from this reserve to retained earnings when the relevant equity securities are derecognised.
(ii) The Group has recognised remeasurements benefits on defined benefits plans through other comprehensive income.
(iii) The Group recognised exchange differences arising on translation of the foreign operations in other comprehensive
income and accumulated in foreign currency translation reserve in other equity.

232
Notes forming part of the Consolidated Financial Statements for the year ended 31 March 2017
Escorts Limited232
19 Borrowings
(i) Non-Current (H crores)
As at
31 March 2017
As at
31 March 2016
As at
1 April 2015
Secured
Term loans from banks 55.80 87.31 105.32
Other loans from financial institutions 0.33 0.03 0.18
Finance lease obligations 0.12 0.12 0.12
Unsecured
Liability portion of compound instruments 2.34 2.21 7.78
58.59 89.67 113.40
(a) Security and other details: (H crores)
31 March 2017 31 March 2016 1 April 2015
Total long term borrowings 58.59 89.67 113.40
Current maturities of long-term borrowings (refer note 20) 47.54 52.84 71.90
Current maturities of finance lease obligation (refer note 20) - - 0.33
106.13 142.51 185.63
Rate of interest - The Group borrowings from banks are at an effective weighted average rate of 10.80% (31 March 2016:
11.75%) (1 April 2015: 12.45%)
(H crores)
31 March 2017 31 March 2016 1 April 2015
(i) Term loan from State bank of India is secured by
exclusive first charge on the plant and machinery/
equipment acquired/to be acquired out of the said term
loan and the same is repaid till 30 September 2016
- 2.75 10.15
(ii) Term loan from Punjab national bank is secured by
exclusive charge on land and building and hypothecation
of plant and other assets of Escorts construction
equipment division excluding plant and machinery
specifically charged to other term lenders and the same
is repaid till 30 June 2015.
- - 3.57
(iii) Term loan from Industrial development bank of India is
secured by first charge by way of equitable mortgage of
freehold immovable property being a part of site no.2,
sector-13, Faridabad. The same is repayable in equal
quarterly installments till 1 July 2018.
52.50 80.00 95.00
18 Non-controlling interest (H crores)
Year ended
31 March 2017
Year ended
31 March 2016
Opening balance 1.88 1.73
Additions during the year 0.38 0.61
Share of profit/(loss) for the year (0.52) (0.46)
Closing non-controlling interest 1.74 1.88
Refer note 38 for summarised financial information of subsidiary that has non-controlling interest that are material to the
Group
233
Notes forming part of the Consolidated Financial Statements for the year ended 31 March 2017
71st Annual Report 2016-17 233
STRATEGIC REPORT GOVERNANCE FINANCIAL STATEMENTS OTHER INFORMATION
19 Borrowings (contd.)
(H crores)
31 March 2017 31 March 2016 1 April 2015
(iv) Term loan from Oriental bank of commerce is secured
by first charge by way of equitable mortgage of freehold
immovable property being a part of site no.2, sector-13,
Faridabad. The same is repayable in equal quarterly
installments till 31 May 2016.
- 15.00 45.00
(v) Term loan from Oriental bank of commerce is secured
by exclusive first charge on the plant and machinery
acquired/to be acquired out of the said term loan
collaterised by first charge by way of equitable mortgage
of freehold immovable property being a part of site
no.2, sector-13, Faridabad. The same is repayable till 30
November 2016.
- 7.62 21.58
(vi) Term loan from State bank of India is secured by exclusive
first charge on the plant and machinery acquired/to be
acquired out of the said term loan and exclusive charge
by way of equitable mortgage of freehold immovable
property being a part of site no.2, sector-13, Faridabad.
The same is repayable in equal quarterly installments
after a moratorium of 24 months from the first date of
disbursement.
50.89 35.00 -
(vii) Finance lease obligations are secured by the
hypothecation of assets financed. Refer note 41 for
repayment schedule for these obligations.
0.12 0.12 0.45
(viii) These loans are secured by the hypothecation of
respective equipments and vehicles and are repayable
in equal monthly installments.
0.45 0.19 2.77
(ix) Unsecured - liability portion of compound instruments
in respect to:
2.34 2.21 7.78
- 9% non cumulative redeemable Preference Shares,
Payable in October 2035
- 9.5% non cumulative redeemable Preference Shares,
Payable in September 2036
- 7% non cumulative redeemable Preference Shares,
Payable in April 2021
- 7% non cumulative redeemable Preference Shares,
Payable in February 2036
- 8% non cumulative redeemable Preference Shares,
Payable in July 2023
Less: Adjustment for processing fees on long term loans
recognised using effective interest rate
(0.17) (0.38) (0.67)
106.13 142.51 185.63
(b) Refer note 35 - Financial instruments for disclosure of fair values in respect of financial liabilities measured at amortised
cost and analysis of their maturity profiles.
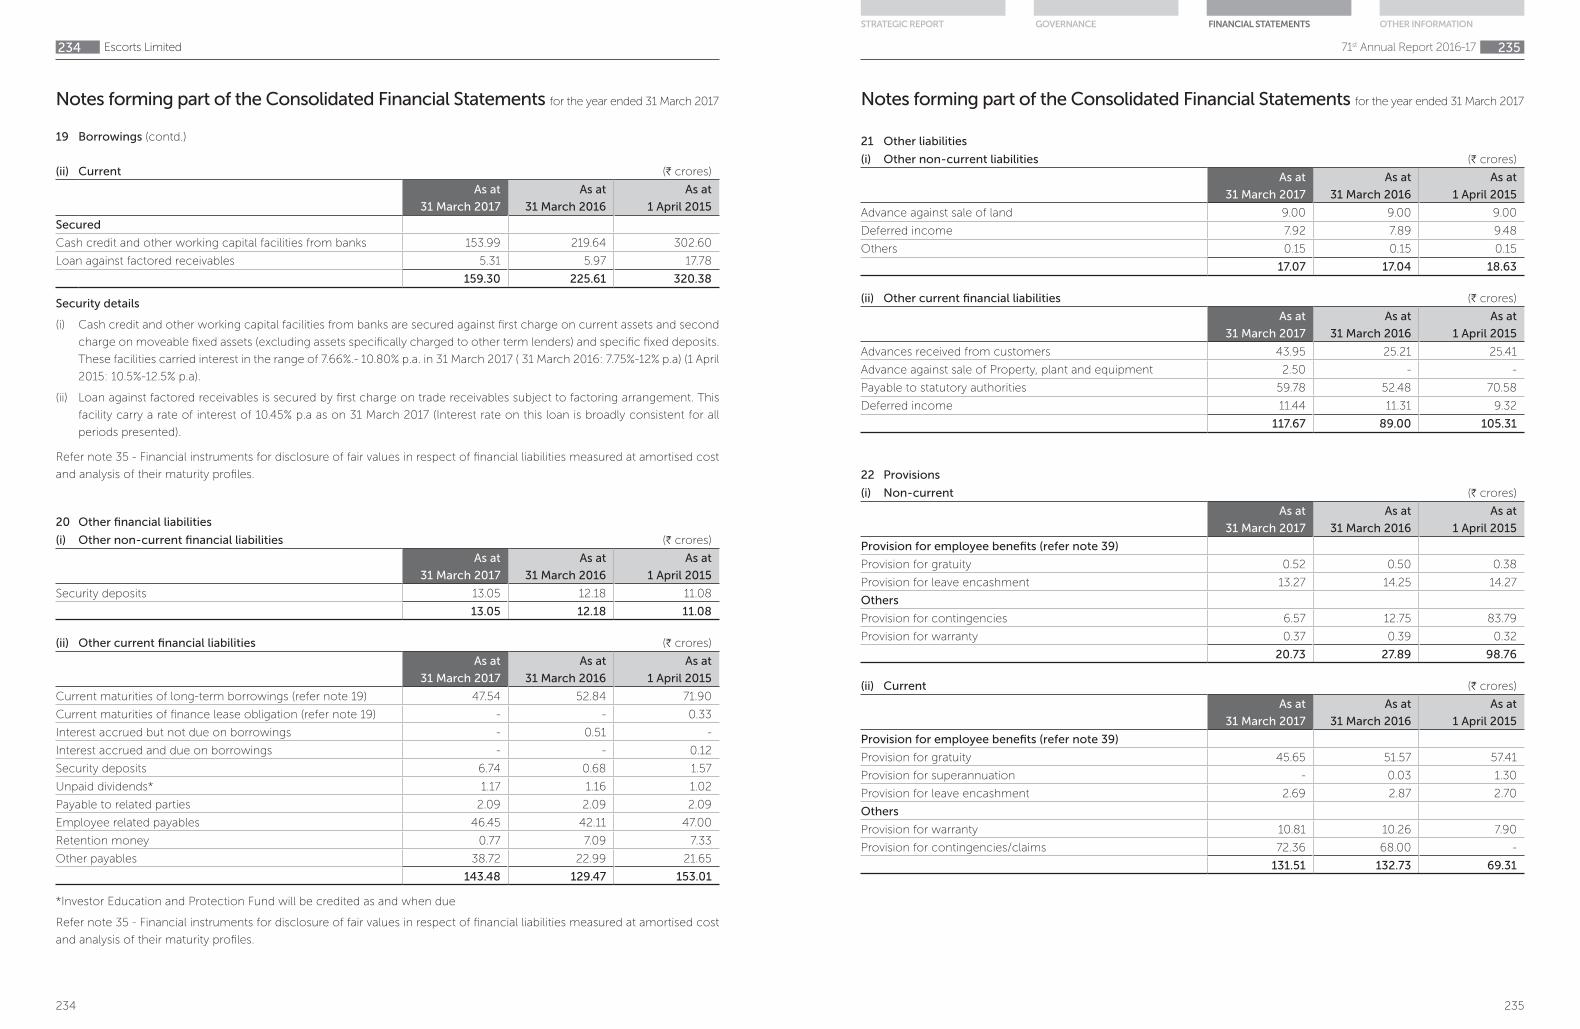
234
Notes forming part of the Consolidated Financial Statements for the year ended 31 March 2017
Escorts Limited234
19 Borrowings (contd.)
20 Other financial liabilities
(i) Other non-current financial liabilities (H crores)
As at
31 March 2017
As at
31 March 2016
As at
1 April 2015
Security deposits 13.05 12.18 11.08
13.05 12.18 11.08
(ii) Other current financial liabilities (H crores)
As at
31 March 2017
As at
31 March 2016
As at
1 April 2015
Current maturities of long-term borrowings (refer note 19) 47.54 52.84 71.90
Current maturities of finance lease obligation (refer note 19) - - 0.33
Interest accrued but not due on borrowings - 0.51 -
Interest accrued and due on borrowings - - 0.12
Security deposits 6.74 0.68 1.57
Unpaid dividends* 1.17 1.16 1.02
Payable to related parties 2.09 2.09 2.09
Employee related payables 46.45 42.11 47.00
Retention money 0.77 7.09 7.33
Other payables 38.72 22.99 21.65
143.48 129.47 153.01
*Investor Education and Protection Fund will be credited as and when due
Refer note 35 - Financial instruments for disclosure of fair values in respect of financial liabilities measured at amortised cost
and analysis of their maturity profiles.
(ii) Current (H crores)
As at
31 March 2017
As at
31 March 2016
As at
1 April 2015
Secured
Cash credit and other working capital facilities from banks 153.99 219.64 302.60
Loan against factored receivables 5.31 5.97 17.78
159.30 225.61 320.38
Security details
(i) Cash credit and other working capital facilities from banks are secured against first charge on current assets and second
charge on moveable fixed assets (excluding assets specifically charged to other term lenders) and specific fixed deposits.
These facilities carried interest in the range of 7.66%.- 10.80% p.a. in 31 March 2017 ( 31 March 2016: 7.75%-12% p.a) (1 April
2015: 10.5%-12.5% p.a).
(ii) Loan against factored receivables is secured by first charge on trade receivables subject to factoring arrangement. This
facility carry a rate of interest of 10.45% p.a as on 31 March 2017 (Interest rate on this loan is broadly consistent for all
periods presented).
Refer note 35 - Financial instruments for disclosure of fair values in respect of financial liabilities measured at amortised cost
and analysis of their maturity profiles.
235
Notes forming part of the Consolidated Financial Statements for the year ended 31 March 2017
71st Annual Report 2016-17 235
STRATEGIC REPORT GOVERNANCE FINANCIAL STATEMENTS OTHER INFORMATION
21 Other liabilities
(i) Other non-current liabilities (H crores)
As at
31 March 2017
As at
31 March 2016
As at
1 April 2015
Advance against sale of land 9.00 9.00 9.00
Deferred income 7.92 7.89 9.48
Others 0.15 0.15 0.15
17.07 17.04 18.63
(ii) Other current financial liabilities (H crores)
As at
31 March 2017
As at
31 March 2016
As at
1 April 2015
Advances received from customers 43.95 25.21 25.41
Advance against sale of Property, plant and equipment 2.50 - -
Payable to statutory authorities 59.78 52.48 70.58
Deferred income 11.44 11.31 9.32
117.67 89.00 105.31
22 Provisions
(i) Non-current (H crores)
As at
31 March 2017
As at
31 March 2016
As at
1 April 2015
Provision for employee benefits (refer note 39)
Provision for gratuity 0.52 0.50 0.38
Provision for leave encashment 13.27 14.25 14.27
Others
Provision for contingencies 6.57 12.75 83.79
Provision for warranty 0.37 0.39 0.32
20.73 27.89 98.76
(ii) Current (H crores)
As at
31 March 2017
As at
31 March 2016
As at
1 April 2015
Provision for employee benefits (refer note 39)
Provision for gratuity 45.65 51.57 57.41
Provision for superannuation - 0.03 1.30
Provision for leave encashment 2.69 2.87 2.70
Others
Provision for warranty 10.81 10.26 7.90
Provision for contingencies/claims 72.36 68.00 -
131.51 132.73 69.31

236
Notes forming part of the Consolidated Financial Statements for the year ended 31 March 2017
Escorts Limited236
(iii) Information about individual provisions and significant estimates
Provision for contingencies
a) During the year 2004-05, the Company sold its entire shareholding in Escorts Heart Institute and Research Center
Limited (EHIRCL) vide Share Purchase Agreement (SPA) dated 25 September 2005. At the time of sale, EHIRCL had
certain pending disputed income tax demands of H52.33 crores and interest thereon amounting to H29.16 crores. In
accordance with the terms of said SPA, the Company has undertaken to indemnify the purchaser to the extent of
H64.99 crores plus one-third of any amount in excess of H64.99 crores, upon the final adjudication of the demand
in law or its final settlement. For this purpose and in terms of said SPA, an amount of H64.99 crores has been kept in
an Escrow Account as fixed deposit, which after renewal(s) along with interest amounts to H127.76 crores as on 31
March 2017 (31 March 2016: H120.14 crores) (1 April 2015: H111.64 crores). Correspondingly, a provision was created
earlier on prudent basis to meet this liability, if and when the same arises, whose carrying value is H65.00 crores on
31 March 2017 (31 March 2016: H60.45 crores) (1 April 2015: H56.23 crores).
b) Farmtrac North America, LLC (FNA), previously subsidiary of the Company had entered into a distribution agreement
for distribution of tractors manufactured by M/s L S Mtron (LSC). FNA however defaulted in making payments to LSC
for the tractors supplied to them. LSC initiated International Arbitration conducted by ICC against the Company. FNA
is currently under receivership and its assets had been disposed off by the Receiver and proceeds were distributed
to secured creditors. A settlement agreement was executed between EL and LSC during FY 2015-16 and according
to such settlement agreement, out of the total amount payable H47.67 crores, 50% was paid during FY 2015-16 and
balance is payable in three equal yearly installments, there after. In terms of the settlement agreement, the Company
has paid first two installments and the remaining installments are payable in FY2017-18 and FY 2018-19. The carrying
balance of provision for such amount payable to LSC is H13.93 crores on 31 March 2017 (31 March 2016: H20.30
crores) (1 April 2015: H27.56 crores).
Provision for warranty
The Group gives warranties on certain products and undertakes to repair or replace them if these fail to perform
satisfactorily during the free warranty period. Such provision represents the amount of expected cost of meeting the
obligations of such rectification/replacement. The timing of the outflows is expected to be within a period of one to
two years. The provision is based on estimates made from historical warranty data associated with similar products and
services. The Group expects to incur the related expenditure over the next year.
(iv) Movement in provisions : (H crores)
Provision for
contingencies
Provision for
warranty
Provision at 1 April 2015 83.79 8.22
Additions during the year 11.07 8.12
Amounts used during the year (20.41) (5.73)
Unwinding of discount and effect of change in discount rate 6.30 0.04
Provision at 31 March 2016 80.75 10.65
Additions during the year - 10.22
Amounts used during the year (7.99) (9.76)
Unwinding of discount and effect of change in discount rate 6.50 0.07
Exchange fluctuation (0.33) -
Provision at 31 March 2017 78.93 11.18
22 Provisions (contd.)
237
Notes forming part of the Consolidated Financial Statements for the year ended 31 March 2017
71st Annual Report 2016-17 237
STRATEGIC REPORT GOVERNANCE FINANCIAL STATEMENTS OTHER INFORMATION
23 Trade payables (H crores)
As at
31 March 2017
As at
31 March 2016
As at
1 April 2015
Acceptances 168.22 150.66 155.04
Trade payables due to other than micro and small enterprises
(refer note 43)
571.43 480.77 466.77
Other accrued liabilities 170.49 119.32 107.87
910.14 750.75 729.68
24 Revenue from operations (H crores)
Year ended
31 March 2017
Year ended
31 March 2016
Operating revenue
Sale of products (including excise duty)
Export 109.85 91.11
Domestic 4,087.87 3,390.27
4,197.72 3,481.38
Other operating revenue
Sale of Services 6.45 6.68
Export incentives 1.70 1.04
Scrap sales 4.13 5.63
Management Fee/Brokerage income 5.58 4.71
Others 4.18 4.46
22.04 22.52
4,219.76 3,503.90
25 Other income (H crores)
Year ended
31 March 2017
Year ended
31 March 2016
Interest from
Bank deposits 15.15 19.28
Financial asset carried at amortised cost 12.29 13.13
Others 0.07 0.24
27.51 32.65
Other income
Unclaimed balances and excess provisions written back 6.58 12.65
Gain on foreign currency transactions (net) - 2.83
Rent received 1.88 1.58
Gain on investments carried at fair value through profit or loss (net) 4.73 0.44
Miscellaneous income 6.39 10.69
19.58 28.19
47.09 60.84

238
Notes forming part of the Consolidated Financial Statements for the year ended 31 March 2017
Escorts Limited238
26 Cost of materials consumed (H crores)
Year ended
31 March 2017
Year ended
31 March 2016
Cost of material consumed
Opening stock 179.91 239.35
Purchases 2,647.32 2,176.58
2,827.23 2,415.93
Closing Stock (177.81) (179.91)
Foreign currency translation (1.31) 1.56
Less: cost of material consumed for discontinued operations (14.45) (50.36)
2,633.66 2,187.22
Changes in inventories of work-in-progress, stock-in-trade and finished goods
Opening stock
Finished goods 149.59 147.72
Work-in-progress 37.18 38.43
Stock-in-trade 58.94 36.99
245.71 223.14
Closing stock
Finished goods (169.84) (149.59)
Work-in-progress (36.15) (37.18)
Stock-in-trade (70.82) (58.94)
(276.81) (245.71)
Foreign currency translation (0.47) 0.57
Adjustment/transfer for discontinued operations (14.92) (2.88)
(46.49) (24.88)
27 Employee benefit expense (H crores)
Year ended
31 March 2017
Year ended
31 March 2016
Salaries, wages and bonus 392.81 355.30
Share based payments to employees (refer note 40) 0.05 0.05
Defined benefit plan expenses (refer note 39) 8.14 8.48
Contribution to provident and other funds (refer note 39) 16.38 16.71
Staff welfare 33.63 31.20
451.01 411.74
28 Finance costs (H crores)
Year ended
31 March 2017
Year ended
31 March 2016
Interest on
Long term loans 16.33 17.64
Cash credit and short term loans 8.22 25.74
Others 4.09 3.74
Finance and bank charges 5.38 5.68
Unwinding of discount on provisions and financial liabilities 7.43 7.20
41.45 60.00
Less: transfer for discontinued operations (9.24) (8.94)
32.21 51.06
239
Notes forming part of the Consolidated Financial Statements for the year ended 31 March 2017
71st Annual Report 2016-17 239
STRATEGIC REPORT GOVERNANCE FINANCIAL STATEMENTS OTHER INFORMATION
29 Depreciation and amortisation (H crores)
Year ended
31 March 2017
Year ended
31 March 2016
Depreciation on
Property, plant and equipment 50.70 52.45
Investment property 0.15 0.12
Amortisation on
Intangible assets 12.57 5.56
63.42 58.13
30 Other expenses (H crores)
Year ended
31 March 2017
Year ended
31 March 2016
Stores and spares consumed 36.33 30.92
Power, fuel and electricity 38.84 36.01
Excise duty on increase/(decrease) in stock of finished goods (0.56) (0.45)
Repair and maintenance
Building 9.07 7.31
Machinery 17.47 15.97
Others 55.91 44.62
Warranties 14.79 19.38
Rent 7.40 5.20
Research and testing expense on projects 14.11 10.97
Rates and taxes 3.41 2.64
Insurance 3.70 3.47
Traveling and conveyance 46.29 42.47
Postage and telephones 7.18 6.65
Legal and professional 57.71 52.68
Commission, discounts and sales incentive 19.73 17.76
Advertisement and promotional expenses 72.45 59.21
Royalty 20.39 16.82
Packing, freight and forwarding 68.15 57.89
Security charges 6.44 5.16
Printing and stationery 3.23 3.54
Director's sitting fees and commission 8.69 0.59
Corporate social responsibility (CSR) expenditure * 3.30 1.16
Provision for doubtful debts/advances and deposits 6.26 5.00
Bad debts & inventory written off 28.32 61.00
Less : Provision already held (28.32) (61.00)
Amounts/assets written off 0.69 1.26
Miscellaneous expenses 32.50 28.20
553.48 474.43
* CSR Expenditure
(i) Gross amount required to be spent by the company during the year 3.42 3.27
(ii) Amount spent (in cash) during the year on:
a) Construction/acquisition of any asset - -
b) For the purposes other than (a) above 3.30 1.16
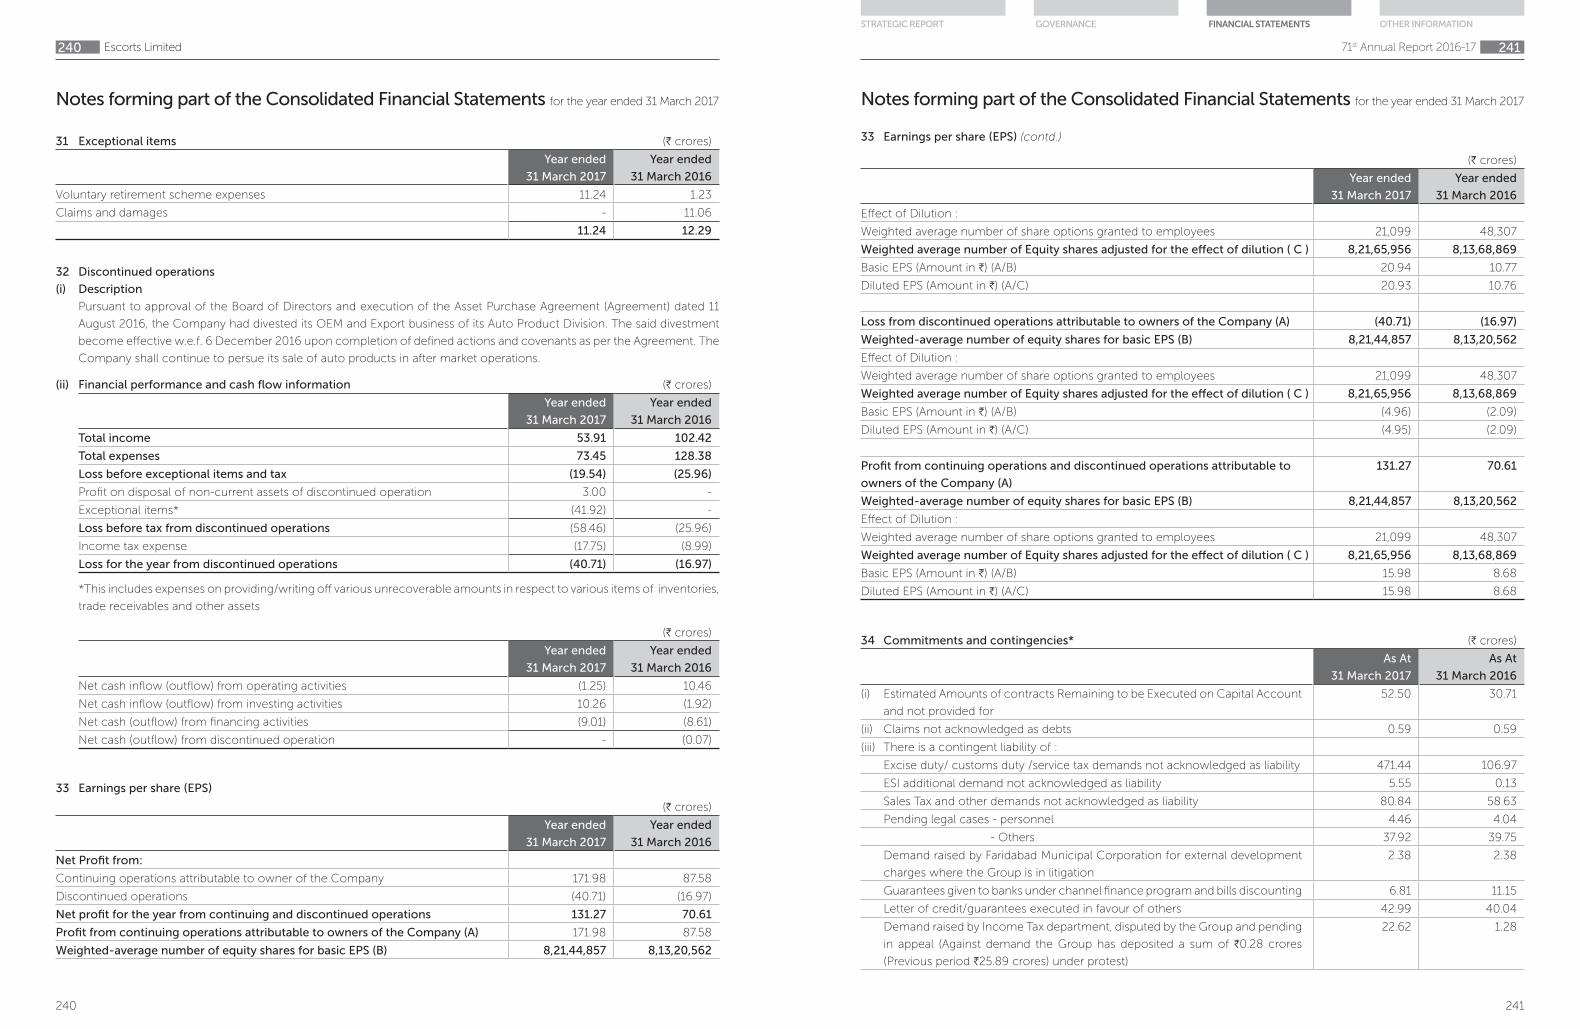
240
Notes forming part of the Consolidated Financial Statements for the year ended 31 March 2017
Escorts Limited240
31 Exceptional items (H crores)
Year ended
31 March 2017
Year ended
31 March 2016
Voluntary retirement scheme expenses 11.24 1.23
Claims and damages - 11.06
11.24 12.29
32 Discontinued operations
(i) Description
Pursuant to approval of the Board of Directors and execution of the Asset Purchase Agreement (Agreement) dated 11
August 2016, the Company had divested its OEM and Export business of its Auto Product Division. The said divestment
become effective w.e.f. 6 December 2016 upon completion of defined actions and covenants as per the Agreement. The
Company shall continue to persue its sale of auto products in after market operations.
(ii) Financial performance and cash flow information (H crores)
Year ended
31 March 2017
Year ended
31 March 2016
Total income 53.91 102.42
Total expenses 73.45 128.38
Loss before exceptional items and tax (19.54) (25.96)
Profit on disposal of non-current assets of discontinued operation 3.00 -
Exceptional items* (41.92) -
Loss before tax from discontinued operations (58.46) (25.96)
Income tax expense (17.75) (8.99)
Loss for the year from discontinued operations (40.71) (16.97)
*This includes expenses on providing/writing off various unrecoverable amounts in respect to various items of inventories,
trade receivables and other assets
(H crores)
Year ended
31 March 2017
Year ended
31 March 2016
Net cash inflow (outflow) from operating activities (1.25) 10.46
Net cash inflow (outflow) from investing activities 10.26 (1.92)
Net cash (outflow) from financing activities (9.01) (8.61)
Net cash (outflow) from discontinued operation - (0.07)
33 Earnings per share (EPS)
(H crores)
Year ended
31 March 2017
Year ended
31 March 2016
Net Profit from:
Continuing operations attributable to owner of the Company 171.98 87.58
Discontinued operations (40.71) (16.97)
Net profit for the year from continuing and discontinued operations 131.27 70.61
Profit from continuing operations attributable to owners of the Company (A) 171.98 87.58
Weighted-average number of equity shares for basic EPS (B) 8,21,44,857 8,13,20,562
241
Notes forming part of the Consolidated Financial Statements for the year ended 31 March 2017
71st Annual Report 2016-17 241
STRATEGIC REPORT GOVERNANCE FINANCIAL STATEMENTS OTHER INFORMATION
34 Commitments and contingencies* (H crores)
As At
31 March 2017
As At
31 March 2016
(i) Estimated Amounts of contracts Remaining to be Executed on Capital Account
and not provided for
52.50 30.71
(ii) Claims not acknowledged as debts 0.59 0.59
(iii) There is a contingent liability of :
Excise duty/ customs duty /service tax demands not acknowledged as liability 471.44 106.97
ESI additional demand not acknowledged as liability 5.55 0.13
Sales Tax and other demands not acknowledged as liability 80.84 58.63
Pending legal cases - personnel 4.46 4.04
- Others 37.92 39.75
Demand raised by Faridabad Municipal Corporation for external development
charges where the Group is in litigation
2.38 2.38
Guarantees given to banks under channel finance program and bills discounting 6.81 11.15
Letter of credit/guarantees executed in favour of others 42.99 40.04
Demand raised by Income Tax department, disputed by the Group and pending
in appeal (Against demand the Group has deposited a sum of H0.28 crores
(Previous period H25.89 crores) under protest)
22.62 1.28
(H crores)
Year ended
31 March 2017
Year ended
31 March 2016
Effect of Dilution :
Weighted average number of share options granted to employees 21,099 48,307
Weighted average number of Equity shares adjusted for the effect of dilution ( C ) 8,21,65,956 8,13,68,869
Basic EPS (Amount in H) (A/B) 20.94 10.77
Diluted EPS (Amount in H) (A/C) 20.93 10.76
Loss from discontinued operations attributable to owners of the Company (A) (40.71) (16.97)
Weighted-average number of equity shares for basic EPS (B) 8,21,44,857 8,13,20,562
Effect of Dilution :
Weighted average number of share options granted to employees 21,099 48,307
Weighted average number of Equity shares adjusted for the effect of dilution ( C ) 8,21,65,956 8,13,68,869
Basic EPS (Amount in H) (A/B) (4.96) (2.09)
Diluted EPS (Amount in H) (A/C) (4.95) (2.09)
Profit from continuing operations and discontinued operations attributable to
owners of the Company (A)
131.27 70.61
Weighted-average number of equity shares for basic EPS (B) 8,21,44,857 8,13,20,562
Effect of Dilution :
Weighted average number of share options granted to employees 21,099 48,307
Weighted average number of Equity shares adjusted for the effect of dilution ( C ) 8,21,65,956 8,13,68,869
Basic EPS (Amount in H) (A/B) 15.98 8.68
Diluted EPS (Amount in H) (A/C) 15.98 8.68
33 Earnings per share (EPS) (contd.)

242
Notes forming part of the Consolidated Financial Statements for the year ended 31 March 2017
Escorts Limited242
34 Commitments and contingencies* (H crores)
As At
31 March 2017
As At
31 March 2016
Liability towards surety bond in favour of Governor of Haryana for Sales Tax
registration under VAT
4.46 4.46
Contingencies regarding Income tax cases pending in Escorts Heart Institute
and Research Center Limited for which amount is indeterminable (refer note
22 for details)
* The amounts indicated as contingent liability or claims against the Group only reflect the basic value. Interest, penalty if any
or legal costs, being indeterminable are not considered.
(contd.)
35 Financial instruments
A Financial assets and liabilities
The carrying amounts and fair values of financial instruments by class are as follows:
(H crores)
Note As at
31 March 2017
As at
31 March 2016
As at
1 April 2015
Financial assets measured at fair value
Investments measured at
Fair value through other comprehensive
income
6 (i) 36.25 28.49 25.43
Fair value through profit and los 6 (ii) 173.45 7.39 6.05
Financial assets measured at amortised cost
Investments 6 (i) 1.57 1.79 1.40
Trade receivables 12 456.45 374.97 375.56
Loans 7 13.10 11.34 10.29
Cash and cash equivalents 13 69.22 33.12 55.86
Other bank balances 14 174.88 219.91 197.21
Others 8 23.97 23.81 18.97
Total 948.89 700.82 690.77
Financial liabilities measured at amortised cost
Borrowings 19 217.89 315.28 433.78
Trade payables 23 910.14 750.75 729.68
Other financial liabilities 20 156.53 141.65 164.09
Total 1,284.56 1,207.68 1,327.55
Investment in joint ventures and associates are measured using equity method and hence, not presented here.
B Fair values hierarchy
The fair value of financial instruments as referred to in note (A) above has been classified into three categories depending
on the inputs used in the valuation technique. The hierarchy gives the highest priority to quoted prices in active markets
for identical assets or liabilities [Level 1 measurements] and lowest priority to unobservable inputs [Level 3 measurements].
The categories used are as follows:
Level 1: Quoted prices for identical instruments in an active market;
Level 2: Directly (i.e. as prices) or indirectly (i.e. derived from prices) observable market inputs, other than Level 1 inputs;
and
Level 3: Inputs which are not based on observable market data (unobservable inputs). Fair values are determined in whole
or in part using a net asset value or valuation model based on assumptions that are neither supported by prices from
observable current market transactions in the same instrument nor are they based on available market data.
243
Notes forming part of the Consolidated Financial Statements for the year ended 31 March 2017
71st Annual Report 2016-17 243
STRATEGIC REPORT GOVERNANCE FINANCIAL STATEMENTS OTHER INFORMATION
35 Financial instruments (contd.)
B.1 Financial assets and liabilities measured at fair value - recurring fair value measurements
As at 31 March 2017 (H crores)
Assets at fair value Level 1 Level 2 Level 3 Total
Investments measured at
Fair value through other comprehensive income 0.52 - 35.73 36.25
Fair value through profit and loss 173.45 - - 173.45
As at 31 March 2016 (H crores)
Assets at fair value Level 1 Level 2 Level 3 Total
Investments measured at
Fair value through other comprehensive income 0.42 - 28.07 28.49
Fair value through profit and loss 7.39 - - 7.39
As at 1 April 2015 (H crores)
Assets at fair value Level 1 Level 2 Level 3 Total
Investments measured at
Fair value through other comprehensive income 0.45 - 24.98 25.43
Fair value through profit and loss 6.05 - - 6.05
Valuation process and technique used to determine fair value
(i) The fair value of investments in government securities and quoted equity shares is based on the current bid price of
respective investment as at the balance sheet date.
(ii) The fair value of investments in mutual fund units is based on the net asset value (NAV) as stated by the issuers of
these mutual fund units in the published statements as at the Balance Sheet date. NAV represents the price at which
the issuer will issue further units of mutual fund and the price at which issuers will redeem such units from the
investors.
(iii) In order to arrive at the fair value of unquoted investments, the Group obtains independent valuations. The techniques
used by the valuer are as follows:
a) Asset approach - Net assets value method
b) Income approach - Discounted cash flows (“DCF”) method
c) Market approach - Enterprise value/Sales multiple method
Significant unobservable inputs used in Level 3 fair values
Unquoted equity shares
(H crores)
Description 31 March 2017 31 March 2016 1 April 2015
Impact on fair value if change in earnings growth rate
Impact due to increase of 0.50 % for 2017 and 1.0% for
2015 and 2016
0.27 0.91 0.55
Impact due to decrease of 0.50 % for 2017 and 1.0% for
2015 and 2016
(0.25) (0.76) (0.46)
Impact on fair value if change in risk adjusted discount rate
Impact due to increase of 0.50 % for 2017 and 1.0% for
2015 and 2016
(0.61) (1.05) (0.77)
Impact due to decrease of 0.50 % for 2017 and 1.0% for
2015 and 2016
0.67 1.27 0.93

244
Notes forming part of the Consolidated Financial Statements for the year ended 31 March 2017
Escorts Limited244
35 Financial instruments (contd.)
The following table presents the changes in level 3 items for the periods ended 31 March 2017 and 31 March 2016:
(H crores)
Particulars Unquoted
equity shares
As at 1 April 2015 24.98
Gains recognised in other comprehensive income 3.09
As at 31 March 2016 28.07
Gains recognised in other comprehensive income 7.66
As at 31 March 2017 35.73
B.2 Fair value of instruments measured at amortised cost
Fair value of instruments measured at amortised cost for which fair value is disclosed is as follows, these fair values are
calculated using Level 3 inputs:
As at 31 March 2017 (H crores)
Carrying value Fair value
Loans 8.11 8.12
Liability portion of compound instruments 2.34 3.49
Investments 1.57 1.72
Security deposits received 13.05 14.48
As at 31 March 2016 (H crores)
Carrying value Fair value
Loans 7.15 7.18
Liability portion of compound instruments 2.21 2.29
Investments 1.79 1.85
Security deposits received 12.18 12.70
As at 1 April 2015 (H crores)
Carrying value Fair value
Loans 7.44 7.43
Liability portion of compound instruments 7.78 7.74
Investments 1.40 1.39
Security deposits received 11.08 11.05
The management assessed that fair values of cash and cash equivalents, trade receivables, other receivables, short term
borrowings, trade payables and other current financial liabilities approximate their respective carrying amounts largely
due to the short-term maturities of these instruments. The fair value of the financial assets and liabilities is included at
the amount at which the instrument could be exchanged in a current transaction between willing parties, other than in
a forced or liquidation sale. The following methods and assumptions were used to estimate the fair values:
(i) Long-term fixed-rate receivables are evaluated by the Group based on parameters such as interest rates, individual
creditworthiness of the customer and other market risk factors.
(ii) The fair values of the Group’s fixed interest-bearing loans and receivables are determined by applying discounted
cash flows (‘DCF’) method, using discount rate that reflects the issuer’s borrowing rate as at the end of the reporting
period. The own non-performance risk as at 31 March 2017 was assessed to be insignificant.
245
Notes forming part of the Consolidated Financial Statements for the year ended 31 March 2017
71st Annual Report 2016-17 245
STRATEGIC REPORT GOVERNANCE FINANCIAL STATEMENTS OTHER INFORMATION
35 Financial instruments (contd.)
(iii) All the other long term borrowing facilities availed by the Group are variable rate facilities which are subject to
changes in underlying Interest rate indices. Further, the credit spread on these facilities are subject to change with
changes in Group creditworthiness. The management believes that the current rate of interest on these loans are in
close approximation from market rates applicable to the Group. Therefore, the management estimates that the fair
value of these borrowings are approximate to their respective carrying values.
C Financial Risk Management
Risk Management
The Group’s activities expose it to market risk, liquidity risk and credit risk. The Group’s board of directors has overall
responsibility for the establishment and oversight of the Group risk management framework. This note explains the
sources of risk which the entity is exposed to and how the entity manages the risk and the related impact in the financial
statements.
C.1 Credit risk
Credit risk is the risk that a counterparty fails to discharge its obligation to the Group. The Group exposure to credit risk is
influenced mainly by cash and cash equivalents, trade receivables and financial assets measured at amortised cost. The
Group continuously monitors defaults of customers and other counterparties and incorporates this information into its
credit risk controls.
a) Credit risk management
The Group assesses and manages credit risk based on internal credit rating system. Internal credit rating is performed for
each class of financial instruments with different characteristics. The Group assigns the following credit ratings to each
class of financial assets based on the assumptions, inputs and factors specific to the class of financial assets.
(i) Low credit risk on financial reporting date
(ii) Moderate credit risk
(iii) High credit risk
The Company provides for expected credit loss based on the following:
Asset group Basis of categorisation Provision for expected credit loss
Low credit risk Cash and cash equivalents, other bank
balances, loans, trade receivables and
other financial assets
12 month expected credit loss
Moderate credit risk Trade receivables and other financial
assets
Life time expected credit loss or 12
month expected credit loss
High credit risk Trade receivables and other financial
assets
Life time expected credit loss
fully provided for
In respect of trade receivables, the Group recognises a provision for lifetime expected credit loss.
Based on business environment in which the Group operates, a default on a financial asset is considered when the
counter party fails to make payments within the agreed time period as per contract. Loss rates reflecting defaults are
based on actual credit loss experience and considering differences between current and historical economic conditions.
Assets are written off when there is no reasonable expectation of recovery, such as a debtor declaring bankruptcy or a
litigation decided against the Group. The Group continues to engage with parties whose balances are written off and
attempts to enforce repayment. Recoveries made are recognised in statement of profit and loss.

246
Notes forming part of the Consolidated Financial Statements for the year ended 31 March 2017
Escorts Limited246
35 Financial instruments (contd.)
Financial assets that expose the entity to credit risk (H crores)
As at
31 March 2017
As at
31 March 2016
As at
1 April 2015
(i) Low credit risk on financial reporting date
Loans 13.10 11.34 10.29
Investments 1.96 2.26 1.86
Trade receivables 57.56 52.00 32.94
Cash and cash equivalents 69.22 33.12 55.86
Other bank balances 174.88 219.91 197.21
Other financial assets 23.97 23.81 18.97
(ii) Moderate credit risk
Trade receivables 413.52 338.75 362.87
(iii) High credit risk
Trade receivables 53.05 59.17 74.28
Other financial assets 16.51 16.51 16.57
Cash & cash equivalents and bank deposits
Credit risk related to cash and cash equivalents and bank deposits is managed by only accepting highly rated banks and
diversifying bank deposits and accounts in different banks across the country.
Trade receivables
Credit risk related to trade receivables are mitigated by taking bank guarantees/letter of credit, from customers where
credit risk is high. The Group closely monitors the credit-worthiness of the debtors through internal systems that are
configured to define credit limits of customers, thereby, limiting the credit risk to pre-calculated amounts. The Group
assesses increase in credit risk on an ongoing basis for amounts receivable that become past due and default is considered
to have occurred when amounts receivable become one year past due.
Other financial assets measured at amortised cost
Other financial assets measured at amortized cost includes loans and advances to employees, security deposits and
others. Credit risk related to these other financial assets is managed by monitoring the recoverability of such amounts
continuously.
b) Expected credit losses for financial assets other than trade receivables
i) Group provides for expected credit losses on loans and advances other than trade receivables by assessing individual
financial instruments for expectation of any credit losses. Since the Group deals with only high-rated banks and financial
institutions, credit risk in respect of cash and cash equivalents, other bank balances and bank deposits is evaluated as very
low. In respect of loans, comprising of security deposits, credit risk is considered low because the Group is in possession
of the underlying asset. In respect of other financial assets, credit risk is evaluated based on Group knowledge of the
credit worthiness of those parties and loss allowance is measured as lifetime expected credit losses.
The Group does not have any expected loss based impairment recognised on such assets considering their low credit
risk nature, though incurred loss provisions are disclosed under each sub-category of such financial assets.
247
Notes forming part of the Consolidated Financial Statements for the year ended 31 March 2017
71st Annual Report 2016-17 247
STRATEGIC REPORT GOVERNANCE FINANCIAL STATEMENTS OTHER INFORMATION
35 Financial instruments (contd.)
31 March 2017 (H crores)
Particulars Gross
carrying
amount
Expected
probability
of
default
Expected
credit
losses
Carrying
amount
net of
impairment
provision
Cash and cash equivalents 69.22 0% - 69.22
Other bank balances 174.88 0% - 174.88
Loans 13.10 0% - 13.10
Other financial assets 40.48 40.8% 16.51 23.97
31 March 2016 (H crores)
Particulars Gross
carrying
amount
Expected
probability
of
default
Expected
credit
losses
Carrying
amount
net of
impairment
provision
Cash and cash equivalents 33.12 0% - 33.12
Other bank balances 219.91 0% - 219.91
Loans 11.34 0% - 11.34
Other financial assets 40.32 40.9% 16.51 23.81
1 April 2015 (H crores)
Particulars Gross
carrying
amount
Expected
probability
of
default
Expected
credit
losses
Carrying
amount
net of
impairment
provision
Cash and cash equivalents 55.86 0% - 55.86
Other bank balances 197.21 0% - 197.21
Loans 10.29 0% - 10.29
Other financial assets 35.54 47% 16.57 18.97
ii) Expected credit loss for trade receivables under simplified approach
The Group recognizes lifetime expected credit losses on trade receivables using a simplified approach, wherein Group
has defined percentage of provision by analysing historical trend of default relevant to each business segment based
on the criteria defined above and such provision percentage determined have been considered to recognise life time
expected credit losses on trade receivables (other than those where default criteria are met).
31 March 2017 (H crores)
Particulars Agri
machinery
Auto
products
Construction
equipment
Railway
products
Financing &
Others
Gross sales in respect of customers where no
specific default has occurred
3,247.73 - 589.82 233.40 -
Expected loss rate 0.11% 0% 1.59% 0.78% -
Receivables due from customers where specific
default has occurred
14.59 9.96 17.84 3.12 7.55
Expected credit loss( loss allowance provision) 3.46 - 9.35 1.82 -

248
Notes forming part of the Consolidated Financial Statements for the year ended 31 March 2017
Escorts Limited248
35 Financial instruments (contd.)
31 March 2016 (H crores)
Particulars Agri
machinery
Auto
products
Construction
equipment
Railway
products
Financing &
Others
Gross amount of trade receivables where no
default (as defined above) has occurred
2,646.53 66.79 482.23 214.82 -
Expected loss rate 0.08% 2.14% 1.56% 2.19% -
Receivables due from customers where specific
default has occurred
14.46 8.26 19.99 8.15 8.31
Expected credit loss( loss allowance provision) 2.15 1.43 7.51 4.70 -
1 April 2015 (H crores)
Particulars Agri
machinery
Auto
products
Construction
equipment
Railway
products
Financing &
Others
Gross amount of trade receivables where no
default (as defined above) has occurred
3,001.59 68.67 537.76 190.94 -
Expected loss rate 0.11% 1.29% 2.13% 2.35% 0%
Receivables due from customers where specific
default has occurred
11.76 7.46 25.78 20.43 8.84
Expected credit loss( loss allowance provision) 3.40 0.89 11.48 4.49 -
Reconciliation of loss allowance provision from beginning to end of reporting period: (H crores)
Reconciliation of loss allowance Trade receivables Other financial
assets
Loss allowance on 1 April 2015 94.53 16.57
Increase of provision due to assets originated during the year 0.53 -
Loss allowance written back (0.54) -
Write – offs (19.56) (0.06)
Loss allowance on 31 March 2016 74.96 16.51
Assets originated or purchased 8.90 -
Loss allowance written back (0.57) -
Write – offs (15.61) -
Loss allowance on 31 March 2017 67.68 16.51
C.2 Liquidity risk
Liquidity risk is the risk that the Group will encounter difficulty in meeting the obligations associated with its financial
liabilities that are settled by delivering cash or another financial asset. The Group’s approach to managing liquidity is to
ensure as far as possible, that it will have sufficient liquidity to meet its liabilities when they are due.
Management monitors rolling forecasts of the Group liquidity position and cash and cash equivalents on the basis of
expected cash flows. The Group takes into account the liquidity of the market in which the entity operates.
(a) Financing arrangements
The Group had access to the following undrawn borrowing facilities at the end of the reporting period:
249
Notes forming part of the Consolidated Financial Statements for the year ended 31 March 2017
71st Annual Report 2016-17 249
STRATEGIC REPORT GOVERNANCE FINANCIAL STATEMENTS OTHER INFORMATION
35 Financial instruments (contd.)
(H crores)
Floating rate 31 March 2017 31 March 2016 1 April 2015
- Expiring within one year (cash credit and other facilities-
Fixed rate)
305.27 242.40 147.40
- Expiring beyond one year (bank loans - Floating rate) 99.00 115.00 -
404.27 357.40 147.40
The bank overdraft facilities may be drawn at any time and may be terminated by the bank without notice. Subject to the
continuance of satisfactory credit ratings, the bank loan facilities can be drawn till 31 December 2017 in H and have an
average maturity of 6.5 years (31 March 2016: 7.5 years).
(b) Maturities of financial liabilities
The tables below analyse the Group financial liabilities into relevant maturity groupings based on their contractual
maturities.
The amounts disclosed in the table are the contractual undiscounted cash flows. Balances due within 12 months equal
their carrying balances as the impact of discounting is not significant
31 March 2017 (H crores)
Less than
1 year
1-2 year 2-3 year More than
3 years
Total
Non-derivatives
Borrowings 215.61 45.99 14.10 10.56 286.26
Finance lease obligation 0.01 0.01 0.01 1.05 1.08
Trade payable 910.14 - - - 910.14
Security deposits 0.70 - 0.42 21.85 22.97
Other financial liabilities 89.20 89.20
Total 1,215.66 46.00 14.53 33.46 1,309.65
31 March 2016 (H crores)
Less than
1 year
1-2 year 2-3 year More than
3 years
Total
Non-derivatives
Borrowings 286.51 56.43 46.82 21.43 411.19
Finance lease obligation 0.01 0.01 0.01 1.06 1.09
Trade payable 750.75 - - - 750.75
Security deposits 0.68 0.20 - 20.84 21.72
Other financial liabilities 75.95 75.95
Total 1,113.90 56.64 46.83 43.33 1,260.70
1 April 2015 (H crores)
Less than
1 year
1-2 year 2-3 year More than
3 years
Total
Non-derivatives
Borrowings 411.34 68.31 56.43 69.85 605.93
Finance lease obligation 0.37 0.01 0.01 1.08 1.47
Trade payable 729.68 729.68
Security deposits 1.57 - - 21.29 22.86
Other financial liabilities 79.21 79.21
Total 1,222.17 68.32 56.44 92.22 1,439.15

250
Notes forming part of the Consolidated Financial Statements for the year ended 31 March 2017
Escorts Limited250
35 Financial instruments (contd.)
C.3 Market risk
a) Foreign currency risk
The Group is exposed to foreign exchange risk arising from foreign currency transactions, primarily with respect to the
US Dollar, EURO, GBP and JPY . Foreign exchange risk arises from recognised assets and liabilities denominated in a
currency that is not the functional currency of the Group. Considering the low volume of foreign currency transactions,
the Group’s exposure to foreign currency risk is limited and the Group hence does not use any derivative instruments to
manage its exposure. Also, the Group does not use forward contracts and swaps for speculative purposes.
(i) Foreign currency risk exposure in USD:
The Group exposure to foreign currency risk at the end of the reporting period expressed in H, are as follows
(H crores)
Particulars 31 March 2017
USD
31 March 2016
USD
1 April 2015
USD
Financial assets 19.09 17.22 16.98
Financial liabilities 20.63 25.98 3.22
Net exposure to foreign currency risk (liabilities) (1.54) (8.76) 13.76
Sensitivity
The sensitivity of profit or loss to changes in the exchange rates arises mainly from foreign currency denominated
financial instruments.
(H crores)
Particulars 31 March 2017 31 March 2016
USD sensitivity
INR/USD- increase by 150 bps (31 March 2016 150 bps)* (0.02) (0.13)
INR/USD- decrease by 150 bps (31 March 2016 150 bps)* 0.02 0.13
* Holding all other variables constant
(ii) Foreign currency risk exposure in EURO:
The Group’s exposure to foreign currency risk at the end of the reporting period expressed in H, are as follows:
(H crores)
Particulars 31 March 2017
EURO
31 March 2016
EURO
1 April 2015
EURO
Financial assets 0.15 6.54 8.90
Financial liabilities 5.92 3.06 0.82
Net exposure to foreign currency risk (liabilities) (5.77) 3.48 8.08
Sensitivity
The sensitivity of profit or loss to changes in the exchange rates arises mainly from foreign currency denominated
financial instruments.
(H crores)
Particulars 31 March 2017 31 March 2016
EURO sensitivity
INR/EURO- increase by 200 bps (31 March 2016 200 bps)* (0.12) 0.07
INR/EURO- decrease by 200 bps (31 March 2016 200 bps)* 0.12 (0.07)
* Holding all other variables constant
251
Notes forming part of the Consolidated Financial Statements for the year ended 31 March 2017
71st Annual Report 2016-17 251
STRATEGIC REPORT GOVERNANCE FINANCIAL STATEMENTS OTHER INFORMATION
35 Financial instruments (contd.)
(iii) Foreign currency risk exposure in JPY:
The Group’s exposure to foreign currency risk at the end of the reporting period expressed in H, are as follows
(H crores)
Particulars 31 March 2017
JPY
31 March 2016
JPY
1 April 2015
JPY
Financial assets - - -
Financial liabilities 0.13 0.05 0.21
Net exposure to foreign currency risk (liabilities) (0.13) (0.05) (0.21)
Sensitivity
The sensitivity of profit or loss to changes in the exchange rates arises mainly from foreign currency denominated
financial instruments.
(H crores)
Particulars 31 March 2017 31 March 2016
JPY sensitivity
INR/JPY- increase by 500 bps (31 March 2016 500 bps)* (0.01) -
INR/JPY- decrease by 500 bps (31 March 2016 500 bps)* 0.01 -
* Holding all other variables constant
(iv) Foreign currency risk exposure in GBP:
The Group’s exposure to foreign currency risk at the end of the reporting period expressed in H are as follows
(H crores)
Particulars 31 March 2017
GBP
31 March 2016
GBP
1 April 2015
GBP
Financial assets 0.04 0.04 0.03
Financial liabilities 0.05 - 0.68
Net exposure to foreign currency risk (liabilities) (0.01) 0.04 (0.65)
Sensitivity
The sensitivity of profit or loss to changes in the exchange rates arises mainly from foreign currency denominated
financial instruments.
(H crores)
Particulars 31 March 2017 31 March 2016
GBP sensitivity
INR/GBP- increase by 150 bps (31 March 2016 150 bps)* - -
INR/GBP- decrease by 150 bps (31 March 2016 150 bps)* - -
* Holding all other variables constant
b) Interest rate risk
i) Liabilities
The Group’s policy is to minimise interest rate cash flow risk exposures on long-term financing. At 31 March 2017, the
Group is exposed to changes in market interest rates through bank borrowings at variable interest rates. The Group’s
investments in fixed deposits all pay fixed interest rates.
Interest rate risk exposure
Below is the overall exposure of the Group to interest rate risk:
(H crores)
Particulars 31 March 2017 31 March 2016 1 April 2015
Variable rate borrowing 162.50 220.56 329.88
Fixed rate borrowing 102.94 147.55 176.13
Total borrowings 265.44 368.11 506.01
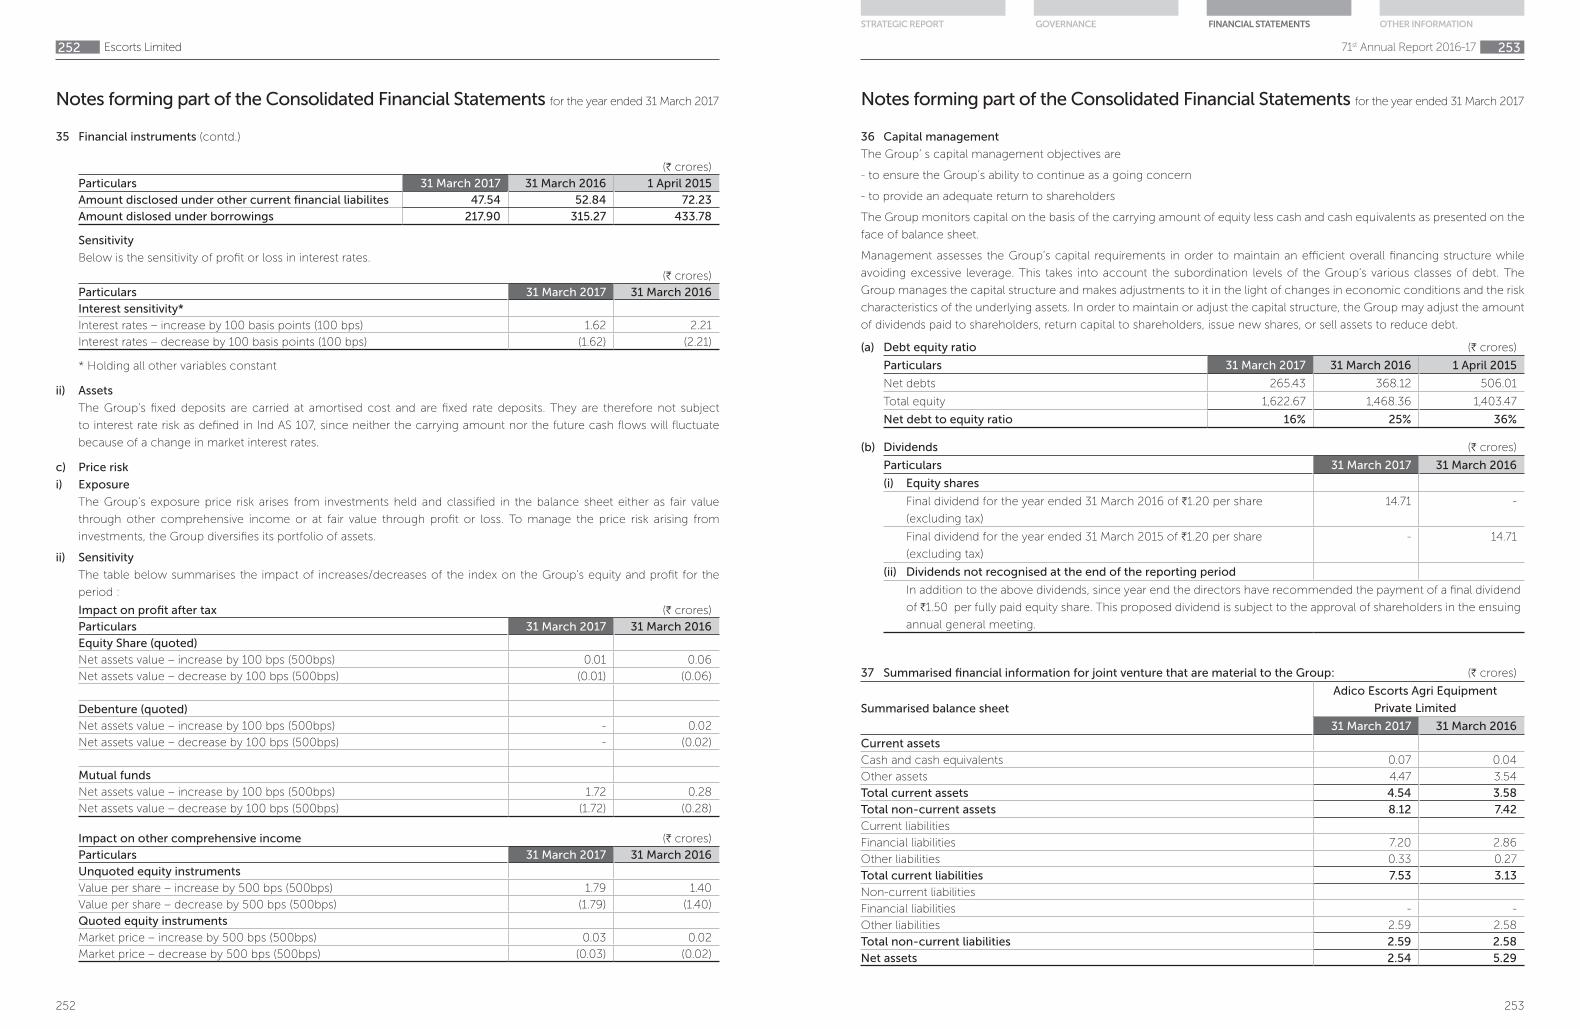
252
Notes forming part of the Consolidated Financial Statements for the year ended 31 March 2017
Escorts Limited252
(H crores)
Particulars 31 March 2017 31 March 2016 1 April 2015
Amount disclosed under other current financial liabilites 47.54 52.84 72.23
Amount dislosed under borrowings 217.90 315.27 433.78
Sensitivity
Below is the sensitivity of profit or loss in interest rates.
(H crores)
Particulars 31 March 2017 31 March 2016
Interest sensitivity*
Interest rates – increase by 100 basis points (100 bps) 1.62 2.21
Interest rates – decrease by 100 basis points (100 bps) (1.62) (2.21)
* Holding all other variables constant
ii) Assets
The Group’s fixed deposits are carried at amortised cost and are fixed rate deposits. They are therefore not subject
to interest rate risk as defined in Ind AS 107, since neither the carrying amount nor the future cash flows will fluctuate
because of a change in market interest rates.
c) Price risk
i) Exposure
The Group’s exposure price risk arises from investments held and classified in the balance sheet either as fair value
through other comprehensive income or at fair value through profit or loss. To manage the price risk arising from
investments, the Group diversifies its portfolio of assets.
ii) Sensitivity
The table below summarises the impact of increases/decreases of the index on the Group’s equity and profit for the
period :
Impact on profit after tax (H crores)
Particulars 31 March 2017 31 March 2016
Equity Share (quoted)
Net assets value – increase by 100 bps (500bps) 0.01 0.06
Net assets value – decrease by 100 bps (500bps) (0.01) (0.06)
Debenture (quoted)
Net assets value – increase by 100 bps (500bps) - 0.02
Net assets value – decrease by 100 bps (500bps) - (0.02)
Mutual funds
Net assets value – increase by 100 bps (500bps) 1.72 0.28
Net assets value – decrease by 100 bps (500bps) (1.72) (0.28)
Impact on other comprehensive income (H crores)
Particulars 31 March 2017 31 March 2016
Unquoted equity instruments
Value per share – increase by 500 bps (500bps) 1.79 1.40
Value per share – decrease by 500 bps (500bps) (1.79) (1.40)
Quoted equity instruments
Market price – increase by 500 bps (500bps) 0.03 0.02
Market price – decrease by 500 bps (500bps) (0.03) (0.02)
35 Financial instruments (contd.)
253
Notes forming part of the Consolidated Financial Statements for the year ended 31 March 2017
71st Annual Report 2016-17 253
STRATEGIC REPORT GOVERNANCE FINANCIAL STATEMENTS OTHER INFORMATION
36 Capital management
The Group’ s capital management objectives are
- to ensure the Group’s ability to continue as a going concern
- to provide an adequate return to shareholders
The Group monitors capital on the basis of the carrying amount of equity less cash and cash equivalents as presented on the
face of balance sheet.
Management assesses the Group’s capital requirements in order to maintain an efficient overall financing structure while
avoiding excessive leverage. This takes into account the subordination levels of the Group’s various classes of debt. The
Group manages the capital structure and makes adjustments to it in the light of changes in economic conditions and the risk
characteristics of the underlying assets. In order to maintain or adjust the capital structure, the Group may adjust the amount
of dividends paid to shareholders, return capital to shareholders, issue new shares, or sell assets to reduce debt.
(a) Debt equity ratio (H crores)
Particulars 31 March 2017 31 March 2016 1 April 2015
Net debts 265.43 368.12 506.01
Total equity 1,622.67 1,468.36 1,403.47
Net debt to equity ratio 16% 25% 36%
(b) Dividends (H crores)
Particulars 31 March 2017 31 March 2016
(i) Equity shares
Final dividend for the year ended 31 March 2016 of H1.20 per share
(excluding tax)
14.71 -
Final dividend for the year ended 31 March 2015 of H1.20 per share
(excluding tax)
- 14.71
(ii) Dividends not recognised at the end of the reporting period
In addition to the above dividends, since year end the directors have recommended the payment of a final dividend
of H1.50 per fully paid equity share. This proposed dividend is subject to the approval of shareholders in the ensuing
annual general meeting.
37 Summarised financial information for joint venture that are material to the Group: (H crores)
Summarised balance sheet
Adico Escorts Agri Equipment
Private Limited
31 March 2017 31 March 2016
Current assets
Cash and cash equivalents 0.07 0.04
Other assets 4.47 3.54
Total current assets 4.54 3.58
Total non-current assets 8.12 7.42
Current liabilities
Financial liabilities 7.20 2.86
Other liabilities 0.33 0.27
Total current liabilities 7.53 3.13
Non-current liabilities
Financial liabilities - -
Other liabilities 2.59 2.58
Total non-current liabilities 2.59 2.58
Net assets 2.54 5.29

254
Notes forming part of the Consolidated Financial Statements for the year ended 31 March 2017
Escorts Limited254
37 Summarised financial information for joint venture that are material to the Group: (contd.) (H crores)
Reconciliation to carrying amounts
Adico Escorts Agri Equipment
Private Limited
31 March 2017 31 March 2016
Opening net assets 5.29 8.70
Profit/(loss) for the year (2.75) (3.41)
Other comprehensive income - -
Closing net assets 2.54 5.29
Group's share in % 40% 40%
Group's share in Indian Rupees 1.02 2.11
Carrying amount 1.02 2.11
(H crores)
Summarised statement of profit and loss
Adico Escorts Agri Equipment
Private Limited
31 March 2017 31 March 2016
Revenue 18.00 13.20
Profit/(loss) for the year (2.75) (3.41)
Total comprehensive income/(loss) (2.75) (3.41)
38 Summarised financial information for subsidiary that has non-controlling interest that are material to the Group:
(H crores)
Summarised balance sheetEscorts Asset Management Limited
31 March 2017 31 March 2016
Current assets 3.82 2.49
Current liabilities 1.45 1.02
Net current assets 2.37 1.47
Non-current assets 7.86 7.62
Non-current liabilities 1.17 0.85
Net non-current assets 6.69 6.77
Net assets 9.06 8.24
Accumulated NCI 1.90 1.73
(H crores)
Summarised statement of profit and lossEscorts Asset Management Limited
31 March 2017 31 March 2016
Revenue 1.56 1.59
Profit/(loss) for the year (0.70) (0.59)
Other comprehensive income/(loss) - -
Total comprehensive income/(loss) (0.70) (0.59)
Profit/(loss) allocated to NCI (0.15) (0.12)
(H crores)
Summarised cash flowsEscorts Asset Management Limited
31 March 2017 31 March 2016
Cash flows from operating activities (0.71) 1.78
Cash flows from investing activities 0.12 (1.78)
Cash flows from financing activities 2.00 -
Net increase/ (decrease) in cash and cash equivalents 1.41 -
255
Notes forming part of the Consolidated Financial Statements for the year ended 31 March 2017
71st Annual Report 2016-17 255
STRATEGIC REPORT GOVERNANCE FINANCIAL STATEMENTS OTHER INFORMATION
39 Employee benefits
Gratuity
The Group provides for gratuity for employees in India as per the Payment of Gratuity Act, 1972. Employees who are in
continuous service for a period of 5 years are eligible for gratuity. The amount of gratuity payable on retirement/termination
is the employees last drawn basic salary per month computed proportionately for 15 days salary multiplied for the number
of years of service.
(i) Amount recognised in the balance sheet is as under:
(H crores)
Particulars 31 March 2017 31 March 2016 1 April 2015
Current Non-current Current Non-current Current Non-current
Gratuity 45.65 0.52 51.57 0.50 57.41 0.38
(ii) Amount recognised in the statement of profit and loss is as under:
(H crores)
Description 31 March 2017 31 March 2016
Current service cost 4.31 4.56
Net interest cost 4.14 4.45
Net impact on profit (before tax) 8.45 9.02
Continuing operations 8.14 8.48
Discontinued operations 0.31 0.54
Actuarial loss/(gain) recognised during the year (Continuing operations) 2.63 (0.67)
Amount recognised in the statement of profit and loss 11.08 8.35
(iii) Movement in the present value of defined benefit obligation recognised in the balance sheet is as under:
(H crores)
Description 31 March 2017 31 March 2016
Present value of defined benefit obligation as at the start of the year 86.94 89.22
Current service cost 4.31 4.56
Interest cost 6.96 7.14
Actuarial loss/(gain) recognised during the year 2.69 (0.56)
Benefits paid (17.81) (13.42)
Present value of defined benefit obligation as at the end of the year 83.09 86.94
(iv) Movement in the plan assets recognised in the balance sheet is as under:
(H crores)
Description 31 March 2017 31 March 2016
Fair value of plan assets at beginning of year 34.96 33.29
Expected return on plan assets 2.83 2.69
Employer's contribution 16.95 12.29
Benefits paid (17.81) (13.42)
Actuarial gain/(loss) on plan assets 0.05 0.11
Fair value of plan Assets at the end of the year 36.98 34.96
Actual return on plan assets 2.88 2.79

256
Notes forming part of the Consolidated Financial Statements for the year ended 31 March 2017
Escorts Limited256
39 Employee benefits (contd.)
(v) Breakup of actuarial (gain)/loss:
(H crores)
Description 31 March 2017 31 March 2016
Actuarial (gain)/loss on arising from change in demographic assumption - -
Actuarial (gain)/loss on arising from change in financial assumption (0.20) (0.11)
Actuarial (gain)/loss on arising from experience adjustment 2.83 (0.56)
Total actuarial (gain)/loss 2.63 (0.67)
(vi) Actuarial assumptions
(H crores)
Description 31 March 2017 31 March 2016 1 April 2015
Discount rate 7.52% 8.00% 8.00%
Future salary increase 5.00% 5.50% 5.50%
Expected average remaining working lives of employees (years) 16.89 16.64 16.04
Gratuity is payable to the employees on death or resignation or on retirement at the attainment of superannuation age.
To provide for these eventualities, the Actuary has used Indian Assured Lives Mortality (2006-08) Ultimate table.
These assumptions were developed by management with the assistance of independent actuarial appraisers. Discount
factors are determined close to each year-end by reference to government bonds and that have terms to maturity
approximating to the terms of the related obligation. Other assumptions are based on management’s historical experience.
(vii) Sensitivity analysis for gratuity liability
(H crores)
Description 31 March 2017 31 March 2016 1 April 2015
Impact of the change in discount rate
Present value of obligation at the end of the year 83.09 86.94 88.85
- Impact due to increase of 0.50 % (2.17) (2.33) (2.38)
- Impact due to decrease of 0.50 % 2.29 2.46 2.51
Impact of the change in salary increase
Present value of obligation at the end of the year 83.09 86.94 88.85
- Impact due to increase of 0.50 % 2.34 2.50 2.56
- Impact due to decrease of 0.50 % (2.23) (2.39) (2.45)
The above sensitivity analysis are based on a change in an assumption while holding all other assumptions constant.
In practice, this is unlikely to occur and changes in some of the assumptions may be correlated. When calculating the
sensitivity of the defined benefit obligation to significant actuarial assumptions the same method (present value of the
defined benefit obligation calculated with the projected unit credit method at the end of the reporting period) has been
applied which was applied while calculating the defined benefit obligation recognised in the balance sheet.
The methods and types of assumptions used in preparing the sensitivity analysis did not change compared to prior
period.
257
Notes forming part of the Consolidated Financial Statements for the year ended 31 March 2017
71st Annual Report 2016-17 257
STRATEGIC REPORT GOVERNANCE FINANCIAL STATEMENTS OTHER INFORMATION
39 Employee benefits (contd.)
(viii) Maturity profile of defined benefit obligation
(H crores)
Description 31 March 2017 31 March 2016
Within next 12 months 11.99 11.56
Between 1-5 years 16.02 46.13
Beyond 5 years 54.60 28.82
(ix) Category of plan assets
(H crores)
Particulars 31 March 2017 31 March 2016 1 April 2015
LIC of India - Group gratuity cash accumulation fund 36.63 34.78 32.54
Others 0.35 0.18 0.75
Total 36.98 34.96 33.29
(x) The Company expects to contribute H7.66 crores (previous year H8.83) to its gratuity plan for the next year.
B Compensated absences (unfunded)
The leave obligations cover the Company’s liability for sick and earned leaves. The Company does not have an
unconditional right to defer settlement for the obligation shown as current provision balance above. However based
on past experience, the Company does not expect all employees to take the full amount of accrued leave or require
payment within the next 12 months, therefore based on the independent actuarial report, only a certain amount of
provision has been presented as current and remaining as non-current. Amount of H4.24 crores (previous year: H5.17
crores) has been recognised in the statement of profit and loss.
(H crores)
Particulars 31 March 2017 31 March 2016 1 April 2015
Current Non-current Current Non-current Current Non-current
Compensated absences
(unfunded)
2.69 13.27 2.87 14.25 2.70 14.27
C Defined contribution plans
The Group makes contributions, determined as a specified percentage of employee salaries, in respect of qualifying
employees towards Provident Fund and Employee State Insurance Scheme which are defined contribution plans. The
Group has no obligations other than to make the specified contributions. The contributions are charged to the statement
of profit and loss as they accrue. The amount recognised as an expense towards contribution to Provident Fund for the
year aggregated to H16.53 crores (Previous year: H17.20 crores) and contribution to Employee State Insurance Scheme
for the year aggregated to H0.35 crores (Previous year: H0.46 crores).
D The Group has taken an Insurance policy for medical benefits in respect of its retired and working employees. The
Insurance policy for on-roll employees is fully funded by the Group.

258
Notes forming part of the Consolidated Financial Statements for the year ended 31 March 2017
Escorts Limited258
40 SHARE-BASED PAYMENTS
The option plan is designed to provide incentives to employees of the Company. Under the plan, participants have been
granted options which will vest as follows –
Scheme Vesting conditions Exercise period Exercise price per share (H)
Employees Stock Option
Scheme, 2006
Vested after one year from
the date of grant
Two years from the date of
vesting
85.00
Options are granted under the plan for the consideration of H85 per share and carry no dividend or voting rights. When
exercisable, each option is convertible into one equity share. For the options which were vested before 31 March 2015, using
the Ind AS transition exemption (as explained in the accounting policies above) the expense related to options is arrived at
using intrinsic value of the shares on the date of grant.
Set out below is a summary of options granted under the plan:
Particulars 31 March 2017 31 March 2016
Number of
options
Number of
options
Opening balance 1,11,100 1,92,000
Granted during the year - 2,56,000
Exercised during the year* 84,000 1,08,000
Lapsed during the period - 2,28,900
Closing balance 27,100 1,11,100
* The weighted average share price at the date of exercise of options during the year ended 31 March 2017 was H260 (31
March 2016 H153.30).
Weighted average remaining contractual life of options as at 31 March 2017 was 1.5 years (31 March 2016 : 0.99 years and 1
April 2015 : 1.5 years).
The value of the options has been determined by an independent valuer. The following assumptions were used for
calculation of fair value of options in accordance with Black Scholes model :
31 March 2016
Risk free interest rate (%) 7%
Expected life 3 Years
Expected volatility (%) 2.20%
Expected dividends (%) 12%
The risk free interest rates are determined based on the ‘Zero Coupon Yield Curve’ with maturity equal to the expected term
of the option. Volatility calculation is based on historical stock prices using standard deviation of daily change in stock price.
The historical period is taken into account to match the expected life of the option. Dividend yield has been calculated taking
into account expected rate of dividend on equity share price as on grant date.
259
Notes forming part of the Consolidated Financial Statements for the year ended 31 March 2017
71st Annual Report 2016-17 259
STRATEGIC REPORT GOVERNANCE FINANCIAL STATEMENTS OTHER INFORMATION
41 Leases – Assets taken on lease
Operating leases
The Company has leased certain land and buildings under operating lease arrangements. The leases are renewable on
periodical basis and cancellable at Company’s option. Total lease payments recognised in the statement of profit and loss is
H7.01 crores (31 March 2016: H4.94 crores)
Finance leases
The Company has a leasehold land at Rudrapur which has been taken on a lease for a period of 90 years in the year 2004.
Initial land premium of H1.7 crores has been paid. In addition to the land premium, the Company pays an annual rent of H0.02
every year.
Also, the management has revalued the amount of land in 2009 and has created a revaluation reserve of H7.13 crores
pertaining to the same. The said lease of land was considered to be finance lease by the company.
31 March 2017 (H crores)
Minimum lease payments due
within 1 year 1 to 5 years after 5 years Total
Lease payments 0.01 0.06 1.02 1.09
Finance charges - 0.02 0.95 0.97
Net present values 0.01 0.04 0.07 0.12
31 March 2016 (H crores)
Minimum lease payments due
within 1 year 1 to 5 years after 5 years Total
Lease payments 0.01 0.06 1.03 1.10
Finance charges - 0.02 0.96 0.98
Net present values 0.01 0.04 0.07 0.12
01 April 2015 (H crores)
Minimum lease payments due
within 1 year 1 to 5 years after 5 years Total
Lease payments 0.37 0.06 1.05 1.48
Finance charges 0.03 0.02 0.98 1.03
Net present values 0.34 0.04 0.07 0.45
42 During 2008 the Haryana State Government introduced Haryana Tax on Entry of Goods into Local Area Act, 2008 (“Entry
Tax”) by repealing the Haryana Local Area Development Tax Act, 2000 (“HLADT”). The said Act was held unconstitutional
by the Hon’ble Punjab & Haryana High Court in their judgment dated 1 October 2008. The State Government of Haryana
has preferred an appeal before the Hon’ble Supreme Court which is pending for adjudication before the Constitutional
Bench. Based on the legal advice received by the Company no further provision on this account is considered necessary
after 31 March 2008.
43 The Company has not received information from vendors regarding their status under the Micro, Small and Medium
Enterprises Development Act, 2006 and hence disclosure relating to amounts unpaid as at the year end together with
interest paid / payable under this Act have not been given.

260
Notes forming part of the Consolidated Financial Statements for the year ended 31 March 2017
Escorts Limited260
44 The Scheme of Compromise and Arrangement pending before the Delhi High Court to bail out the fixed deposit holders
of Escorts Finance Limited stands disposed-off vide order dated 4 March 2011. On the interim directions of the said
High Court, fixed deposit liability of H130.32 crores has already been discharged by the Hardship Committee constituted
under the directions of the said High Court for discharging the unclaimed deposit, balance 2,401,050 shares have been
transferred to Escorts Benefit Trust (Trust) and the Hardship Committee has been dissolved. The Hon’ble High Court has
confirmed that Escorts Limited has no outstanding liability towards payment to Escorts Finance Limited deposit holders.
Escorts Benefit Trust has realised the investments held by it and remitted the surplus of H15.00 crores to the Company
(beneficiary) after retaining sufficient funds for meeting its liability towards Escorts Finance Limited deposits.
45 Escorts Benefit and Welfare Trust (the Trust) holds 37,300,031 equity shares of the Company and 23,497,478 equity shares
of Escorts Finance Limited. The Company is the sole beneficiary of the Trust. The dividend received by the trust on the
Company’s shares is credited directly in “Retained earnings” in note 17 - Other equity. Market value of these shares held
by Trust on 31 March 2017 is H2038.70 crores (31 March 2016: H528.64 crores) (1 April 2015: H483.32 crores).
46 Assets pledged as security (H crores)
Note 31 March 2017 31 March 2016 1 April 2015
Current
Financial assets
First charge
Trade receivables 12 456.45 374.97 375.56
Specific fixed deposits 14 18.93 29.34 -
Non Financial assets
Inventories 11 450.30 432.57 458.54
Total current assets pledged as security 925.68 836.88 834.10
Non-current
First charge
Land and Building 3 (i) 203.46 204.23 256.03
Plant and machinery 3 (i) 41.55 161.03 136.26
Other movable Assets 3 (i) - - 1.85
Second Charge
Other movable assets (other than specifically
charged to other term lenders)
3 (i) 278.68 206.15 250.87
Furniture, fittings and equipment acquired under
finance lease
3 (i) - 0.03 4.20
Total non-currents assets pledged as security 523.69 571.44 649.21
Total assets pledged as security 1,449.37 1,408.32 1,483.31
261
Notes forming part of the Consolidated Financial Statements for the year ended 31 March 2017
71st Annual Report 2016-17 261
STRATEGIC REPORT GOVERNANCE FINANCIAL STATEMENTS OTHER INFORMATION
47 Related party transactions
A Joint venture
Adico Escorts Agri Equipment Private Limited
B Associates
Escorts Consumer Credit Limited
Pancha Sakha Agri Services, Balasore (Partnership)
Jay Jagannath Agri Services, Balipal (Partnership)
Baba Chadaneswar Agri Services, Balasore (Partnership)
Haritha Raithu Mithra Agri Services (LLP)
Revanpalli Raytu Sangam Agri Services (LLP)
Baba Chadaneswar Agri Services, Balasore (LLP)
Pancha Sakha Agri Services, Balasore (LLP)
Jay Jagannath Agri Services, Balipal (LLP)
C Key managerial personnel and Directors (specified persons) and close members of their family in the Group:
Mr. Rajan Nanda Chairman and Managing Director
Mr. Nikhil Nanda Managing Director
Mr. Bharat Madan Group Chief Financial Officer
Mr. Ajay Sharma Group General Counsel and Company Secretary
Mr. Ashok Aggarwal Managing Director/Whole Time Director
Ms. Pushpa Rai Director
Mr. Priyank Kalra Director
Mr. Sachin Tyagi Director
Ms. Sunjit Sahel Company Secretary
Mr. Pradeep Kumar Jain Company Secretary
Mr. Vicky Chauhan Company Secretary
Mr. Sushant Arora Finance controller
Mr. P. K. Marwah Manager (ceased to be exists w.e.f. 10th October 2016)
Mr. Donald Fernandez Chief Financial Officer
Other Directors in the Group
Ms. Nitasha Nanda
Mrs. Ritu Nanda
Mr. Hardeep Singh
Mr. P.H Ravikumar
Ms. Vibha Paul Rishi
Mr. Sutanu Behuria
Mr. Darius Jehangir Kakalia
Mr. G. B. Mathur
Enterprises over which key management personnel and relatives of such personnel exercise significant influence
Rimari India Private Limited Breeze Trading Private Limited
Tashaka India Private Limited Niky Tasha Electronics Limited
AAA Portfolios Private Limited Escorts Investment Trust Limited
Escorts Skill Development Sun & Moon Travels (India) Private Limited
Niky Tasha Energies Private Limited Charak Ayurvedic Treatments Private Limited
Rimari IT Solutions Private Limited Crystal Care Advisors Private Limited
Momento Communications Private Limited Sharak Healthcare Private Limited

262
Notes forming part of the Consolidated Financial Statements for the year ended 31 March 2017
Escorts Limited262
47 Related party transactions (contd.)
Key management personnel remuneration includes the following expenses:
(H crores)
31 March 2017 31 March 2016
Short-term employee benefits: 21.98 13.32
Post-employment benefits: 0.56 0.54
Total remuneration 22.54 13.86
(i) Transactions with joint ventures
During 2016-17, Adico Escorts Agri Equipment Private Limited provided rental services valued at H0.01 crores (2015-16:
H0.01 crores) and sold tractors to Escorts Limited valued at H16.94 crores (2015-16: H13.14 crores) . There is a payable
outstanding on account of transactions as at 31 March 2017 of H(0.02) crores (31 March 2016: Nil; 1 April 2015: Nil).
(ii) Transactions with associates
a) There is a payable outstanding on account of transactions as at 31 March 2017 of H2.09 crores (31 March 2016: H 2.09
crores; 1 April 2015: Nil) against Escorts Consumer Credit Limited.
b) During the year, EDDAL Credit Limited (subsidiary of Escorts Ltd.) have taken interest in partnerships & LLP’s of H2
lacs.
Rakshak Health Service Private Limited Big Apple Clothing Private Limited
Har Parshad And Company Private Limited Sietz Technologies India Private Limited
Raksha TPA Private Limited Niky Tasha Communications Private Limited
Ritu Nanda Insurance Service Private Limited Sun & Moon Advisory Services Private Limited
Escolife IT Services Private Limited Escorts Employees Welfare Limited
Academy of Management and Financial Planing Private Limited Pleasure Trading Private Limited
BR Holdings Private Limited Powermech Projects Limited
List of other related parties
Mrs. Ritu Nanda
Escorts Limited Employees’ Group Gratuity Fund Trust (refer note 39 for transaction)
263
71st Annual Report 2016-17 263
STRATEGIC REPORT GOVERNANCE FINANCIAL STATEMENTS OTHER INFORMATION
No
tes
form
ing
part
of
the
Co
nso
lidate
d F
inan
cia
l Sta
tem
en
ts fo
r th
e y
ear
en
ded 3
1 M
arc
h 2
017
47
R
ela
ted
pa
rty t
ran
sac
tio
ns
(co
ntd
.)
(iii)
Tra
nsa
cti
on
s w
ith
ke
y m
an
ag
em
en
t p
ers
on
ne
l, t
he
ir r
ela
tive
s a
nd
en
titi
es
in w
hic
h t
he
y e
xe
rcis
e c
on
tro
l/si
gn
ific
an
t in
flu
en
ce
(H c
rore
s)
Na
ture
of
tra
nsa
cti
on
s*R
oya
lty
Re
mu
-
ne
rati
on
/
co
mm
is-
sio
n
Re
nt
rec
eiv
ed
Re
nt
pa
idP
urc
ha
se
of
go
od
s
Sa
le o
f
go
od
s a
nd
serv
ice
s
Se
rvic
es
rec
eiv
ed
Inte
rest
Inc
om
e
Div
ide
nd
pa
id
Ad
va
nc
e
giv
en
De
bto
rs /
Re
ce
iva
ble
s
Re
de
mp
tio
n
of
Pre
fere
nc
e
Sh
are
s
Issu
e o
f
Pre
fere
nc
e
Sh
are
s
Pa
ya
ble
s
Raja
n N
an
da
-
8.7
6
-
-
-
-
-
-
0.1
2
-
-
-
-
3.5
0
-
(5.2
6)
-
-
-
-
-
-
(0
.12
) -
-
-
-
-
Ritu
Nan
da
-
-
-
0.3
6
-
-
- -
0
.01
-
-
-
-
-
-
-
-
(0
.36
) -
-
(0
.01)
-
(0
.01)
-
-
-
-
-
Nik
hil
Nan
da
-
8.5
8
0.4
9
-
-
-
-
-
0.0
3
-
-
-
-
3.5
0
-
(5.1
3)
(0
.44
) -
-
-
-
-
(0
.03
) -
-
-
-
-
Nitash
a N
an
da
-
2.4
8
-
0.4
1 -
-
0
.03
-
-
0.0
6
-
-
-
1.0
0
-
(1.
46
) -
(0
.39
) -
-
(0
.05)
-
- (
0.0
6)
-
-
-
-
Bh
ara
t M
ad
an
-
1.8
7
-
-
-
-
-
-
-
-
-
-
-
-
-
(1.
28
) -
-
-
-
-
-
-
-
-
-
-
-
Aja
y S
harm
a -
0
.98
-
-
-
-
-
-
-
-
-
-
-
-
-
(0
.73
) -
-
-
-
-
-
-
-
-
-
-
-
S.A
. D
ave
-
-
-
-
-
-
0.0
2
-
-
-
-
-
-
-
-
-
-
-
-
-
(0
.07)
-
-
-
-
-
-
-
Hard
eep
Sin
gh
-
0.0
8
-
-
-
-
0.0
6
-
- -
-
-
-
0
.08
-
-
-
-
-
-
(0
.08
) -
-
-
-
-
-
-
P.H
Ravi
ku
mar
-
0.0
8
-
-
-
-
0.0
5
-
-
-
-
-
-
0.0
8
-
-
-
-
-
-
(0
.03
) -
-
-
-
-
-
-
Vib
ha P
au
l R
ish
i -
0
.08
-
-
-
-
0
.03
-
-
-
-
-
-
0
.08
-
-
-
-
-
-
(0
.03
) -
-
-
-
-
-
-
Su
tan
u B
eh
uri
a -
0
.08
-
-
-
-
0
.04
-
-
-
-
-
-
0
.08
-
-
-
-
-
-
(0
.03
) -
-
-
-
-
-
-
Dari
us
Jeh
an
gir
Kakalia
-
0.0
8
-
-
-
-
0.0
2
-
-
-
-
-
-
0.0
8
-
-
-
-
-
-
-
-
-
-
-
-
-
-
Harp
ars
had
& C
o.P
riva
te
Lim
ited
20
.62
-
-
-
-
-
-
-
1
.26
-
-
-
-
0
.22
(17
.28
) -
-
-
-
-
-
-
(1.
26
) -
-
-
-
(5.8
4)
Gir
ish
Bih
ari
Math
ur
-
-
-
-
-
-
1.0
3
-
- -
-
-
-
0
.08
-
-
-
-
-
-
(1.
81)
-
- -
-
-
-
(
0.0
7)
Raksh
a T
PA
Pri
vate
Lim
ited
-
-
0.7
9
-
-
-
-
-
-
0.5
3
-
-
-
-
-
-
(0
.75)
-
-
-
-
-
-
(0
.37)
-
-
-
-
Rim
ari
In
dia
Pri
vate
Lim
ited
-
-
-
-
-
-
0.0
5
-
-
0.1
2
-
-
-
-
-
-
-
-
-
-
(0
.01)
-
-
(0
.12
) -
-
-
(
0.0
1)
Mo
men
to C
om
mu
nic
atio
ns
Pri
vate
Lim
ited
-
-
-
-
-
-
0.3
7
-
-
-
-
-
-
-
-
-
-
-
-
-
(0
.15)
-
-
-
-
-
-
(0
.03
)
AA
A P
ort
folio
s P
riva
te L
imited
-
-
-
- -
-
-
-
0
.20
-
-
-
-
-
-
-
-
- -
-
-
-
(0
.20
) -
-
-
-
-
Big
Ap
ple
Clo
thin
g P
riva
te
Lim
ited
-
-
-
-
-
-
-
-
0.2
1 -
-
-
-
-
-
-
-
-
-
-
-
-
(0
.21)
-
-
-
-
-

264
Escorts Limited264
No
tes
form
ing
part
of
the
Co
nso
lidate
d F
inan
cia
l Sta
tem
en
ts fo
r th
e y
ear
en
ded 3
1 M
arc
h 2
017
47
R
ela
ted
pa
rty t
ran
sac
tio
ns
(co
ntd
.)
(H c
rore
s)
Na
ture
of
tra
nsa
cti
on
s*R
oya
lty
Re
mu
-
ne
rati
on
/
co
mm
is-
sio
n
Re
nt
rec
eiv
ed
Re
nt
pa
idP
urc
ha
se
of
go
od
s
Sa
le o
f
go
od
s a
nd
serv
ice
s
Se
rvic
es
rec
eiv
ed
Inte
rest
Inc
om
e
Div
ide
nd
pa
id
Ad
va
nc
e
giv
en
De
bto
rs /
Re
ce
iva
ble
s
Re
de
mp
tio
n
of
Pre
fere
nc
e
Sh
are
s
Issu
e o
f
Pre
fere
nc
e
Sh
are
s
Pa
ya
ble
s
Nik
y T
ash
a C
om
mu
nic
atio
ns
Pri
vate
Lim
ited
-
-
-
-
-
-
-
-
-
-
-
-
-
-
-
-
-
-
-
-
-
-
-
-
-
-
-
-
Nik
y T
ash
a E
nerg
ies
Pri
vate
Lim
ited
-
-
-
-
-
-
-
-
-
-
-
-
-
-
-
-
-
-
-
-
-
-
-
-
-
-
-
-
Sie
tz T
ech
no
logie
s In
dia
Priva
te
Lim
ited
-
-
0.3
6
1.2
2 2
32
.53
1
.44
0
.28
-
-
0
.97
1.3
6
-
-
15.3
9
-
-
(0
.36
)(1
.16
) (19
0.2
2)
(1.
34
) (0
.25)
-
-
(0
.65)
(1.
40
) -
-
(11
.50
)
Su
n &
Mo
on
Tra
vels
(In
dia
)
Pri
vate
Lim
ited
-
-
0.0
2
-
-
-
11.
27
-
-
0.5
1 -
-
-
0
.75
-
-
(0
.02
) -
-
-
(7.
06
) -
-
(
0.0
1) -
-
-
(
0.1
4)
Esc
ort
s E
mp
loyee W
elfare
Lim
ited
(G
ross
of
pro
visi
on
s)
-
-
-
-
-
-
-
-
-
3.0
0
0.1
5 -
-
-
-
-
-
-
-
-
-
-
-
(3.0
0)
-
-
-
-
Esc
ort
s Skill
Deve
lop
men
t -
-
-
-
-
-
0
.50
-
-
-
-
-
-
6
.60
-
-
-
-
-
-
(0
.50
) -
-
-
-
-
-
-
Po
werm
ech
Pro
jects
Lim
ited
-
-
-
-
-
0.7
3
-
-
-
-
0.0
1 -
-
-
-
-
-
-
-
(0
.36
) -
-
-
-
(
0.0
1) -
-
-
Dr. A
sho
k A
gg
arw
al
-
0.5
5
-
-
-
-
-
-
-
-
-
-
-
-
-
(0
.45
) -
-
-
-
-
-
-
-
-
-
-
-
Ms.
Pu
shp
a R
ai
-
0.1
6
-
-
-
-
-
-
-
-
-
-
-
-
-
(0
.02
) -
-
-
-
-
-
-
-
-
-
-
-
Ms.
Su
njit
Sah
el
-
0.0
9
-
-
-
-
-
-
-
-
-
-
-
-
-
(0
.08
) -
-
-
-
-
-
-
-
-
-
-
-
Ch
ara
k A
yu
rved
ic T
reatm
en
ts
Pri
vate
Lim
ited
-
-
-
-
-
-
-
-
-
-
-
-
-
-
-
-
-
-
-
-
-
-
-
-
-
(3.0
5)
(1.
20
) -
Pra
deep
Ku
mar
Jain
-
0.1
4
-
-
-
-
-
-
-
-
-
-
-
-
-
(0
.14
) -
-
-
-
-
-
-
-
-
-
-
-
Su
shan
t A
rora
-
0.1
1 -
-
-
-
-
-
-
-
-
-
-
-
-
-
-
-
-
-
-
-
-
-
-
-
-
-
Pri
yan
k K
alr
a-
0.7
2-
--
--
--
--
--
-
-(0
.18
)-
--
--
--
--
--
-
Sach
in T
yag
i-
0.5
1-
--
--
--
--
--
-
-(0
.53
)-
--
--
--
--
--
-
Do
nald
Fern
an
dez
-0
.06
--
--
--
--
--
--
-(0
.06
)-
--
--
--
--
--
-
*N
um
bers
in
bra
cke
ts r
ep
rese
nts
fin
an
cia
l year
en
din
g 3
1 M
arc
h 2
016
265
Notes forming part of the Consolidated Financial Statements for the year ended 31 March 2017
71st Annual Report 2016-17 265
STRATEGIC REPORT GOVERNANCE FINANCIAL STATEMENTS OTHER INFORMATION
47 Related party transactions (contd.)
(H crores)
Outstanding balances as at 1 April 2015 Advance given Debtors /
receivables
Payables
Nitasha Nanda 0.06 - -
Harparshad & Co. Private Limited - - 7.21
Raksha TPA Private Limited 0.29 - 0.01
Rimari India Private Limited 0.12 - -
Sietz Technologies India Private Limited 0.37 1.21 9.14
Sun & Moon Travels (India) Private Limited - - 0.18
Escorts Employee Welfare Limited (Gross of provisions) 3.04 - -
48 Segment information
The Group has determined following reportable segments based on the information reviewed by the Group's manaagement:
i Agri machinery products
ii Construction equipments
iii Railway equipments
iv Auto ancillary products (discontinued operation)
v Others

266
Escorts Limited266
No
tes
form
ing
part
of
the
Co
nso
lidate
d F
inan
cia
l Sta
tem
en
ts fo
r th
e y
ear
en
ded 3
1 M
arc
h 2
017
A
Se
gm
en
t re
ve
nu
e a
nd
re
sult
s
(H c
rore
s)
Pa
rtic
ula
rs3
1 M
arc
h 2
017
31 M
arc
h 2
016
Ag
ri
ma
ch
ine
ry
pro
du
cts
Co
nst
ruc
-
tio
n
eq
uip
me
nts
Ra
ilw
ay
eq
uip
me
nts
Au
to
an
cilla
ry
pro
du
cts
(dis
co
n-
tin
ue
d
op
era
tio
n)
Oth
ers
U
na
llo
-
ca
ted
In
ter
seg
me
nt
ad
just
me
nt
To
tal
Ag
ri
ma
ch
ine
ry
pro
du
cts
Co
nst
ruc
-
tio
n
eq
uip
me
nts
Ra
ilw
ay
eq
uip
me
nts
Au
to
an
cil
lary
pro
du
cts
(dis
co
n-
tin
ue
d
op
era
tio
n)
Oth
ers
U
na
llo
-
ca
ted
In
ter
seg
me
nt
ad
just
me
nt
To
tal
Re
ve
nu
e 3
,39
2.5
4
60
6.7
6
24
2.4
7
51.
34
5
.65
2
.03
(2
9.6
8)
4,2
71.
11
2,7
94
.07
49
6.5
2
22
7.76
1
00
.54
5
.44
1
.79
(2
1.6
8)
3,6
04
.44
Se
gm
en
t re
sult
be
fore
inte
rest
in
co
me
un
all
oc
ab
le, e
xc
ep
tio
na
l
ite
ms,
fin
an
ce
co
st
an
d t
ax
33
6.4
3
(13
.82
) 3
0.6
7
(10
.29
) (0
.89
) (73.4
9)
-
26
8.6
1 2
13.1
5
(2
5.7
3)
22
.45
(17
.02
) 1
.96
(6
6.0
3)
-
12
8.7
8
Ad
d:
Inte
rest
in
co
me
un
allo
cab
le
14
.31
18
.30
Less
: Fin
an
ce c
ost
(4
1.4
5)
(6
0.0
0)
Less
: E
xcep
tio
nal item
s (5
0.1
6)
(12
.29
)
Ad
d:
Sh
are
of
pro
fit
or
(lo
ss) fr
om
ass
ocia
tes
an
d
join
t ve
ntu
res
(1.
06
) (1.
36
)
Pro
fit
be
fore
ta
x 1
90
.25
7
3.4
3
Less
: Tax e
xp
en
se 5
9.5
0
3.2
8
Pro
fit
aft
er
tax
13
0.7
5 7
0.1
5
Oth
er
co
mp
reh
en
sive
inco
me/
(lo
ss)
5.0
8
3.8
5
To
tal
oth
er
co
mp
reh
en
sive
in
co
me
13
5.8
3 7
4.0
0
48
S
eg
me
nt
info
rma
tio
n (co
ntd
.)
267
Notes forming part of the Consolidated Financial Statements for the year ended 31 March 2017
71st Annual Report 2016-17 267
STRATEGIC REPORT GOVERNANCE FINANCIAL STATEMENTS OTHER INFORMATION
B Other information
Particulars Segment assets Segment liabilities
As on
31 March 2017
As on
31 March 2016
As on
31 March 2017
As on
31 March 2016
Agri machinery products 1,924.05 1,756.33 1,036.53 918.26
Construction equipments 309.45 287.08 255.14 248.04
Railway equipments 149.12 154.93 77.19 61.61
Auto ancillary products (discontinued operation) 7.25 104.51 15.37 86.37
Others 64.62 43.70 53.86 34.80
Unallocated 746.46 599.58 140.18 128.69
Total 3,200.95 2,946.13 1,578.27 1,477.77
C Additional information by geographies
(H crores)
Year ended
31 March 2017
Year ended
31 March 2016
Revenue by geographical market
India 4,218.16 3,524.27
Outside India 52.95 80.17
4,271.11 3,604.44
Carrying amount of segment assets
India 3,171.11 2,888.12
Outside India 29.84 58.01
3,200.95 2,946.13
Notes:
i Operating segments have been identified by the Group taking into account nature of services, associated risks and
returns and internal reporting system that reflects the manner in which operating results are regularly reviewed by the
Chief Operating Decision Maker for purpose of making decisions on resources to be allocated to such segments and
assess their performance.
ii Segment revenue, segment results, segment assets and segment liabilities include the respective amount identifiable for
each operating segment.
48 Segment information (contd.)

268
Notes forming part of the Consolidated Financial Statements for the year ended 31 March 2017
Escorts Limited268
49 First time adoption of Ind AS
These are the Group’s first financial statements prepared in accordance with Ind AS.
The accounting policies set out in note 2.2 have been applied in preparing the financial statements for the year ended 31
March 2017, the comparative information presented in these financial statements for the year ended 31 March 2016 and in
the preparation of an opening Ind AS balance sheet at 1 April 2015 (the Group’s date of transition). An explanation of how the
transition from Previous GAAP to Ind AS has affected the Group’s financial position, financial performance and cash flows is
set out in the following tables and notes.
A Ind AS optional exemptions
1 Deemed cost for property, plant and equipment, investment property and intangible assets
Ind AS 101 permits a first-time adopter to elect to continue with the carrying value for all of its property, plant and
equipment as recognised in the financial statements as at the date of transition to Ind AS, measured as per the Previous
GAAP and use that as its deemed cost as at the date of transition after making necessary adjustments for de-commissioning
liabilities. This exemption can also be used for intangible assets covered by Ind AS 38 Intangible Assets and investment
property covered by Ind AS 40 Investment Property. Accordingly, the Group has elected to measure all of its property,
plant and equipment, intangible assets and investment property at their Previous GAAP carrying value.
2 Designation of previously recognised financial instruments
Ind AS 101 allows an entity to designate investments in equity instruments at FVOCI on the basis of the facts and
circumstances at the date of transition to Ind AS. The Company has elected to apply this exemption for its investment in
equity instruments.
3 Foreign currency translation reserve
The Group has deemed the cumulative translation differences for foreign operations at the date of transition to be zero.
Adjustments to give effect to this are recorded against opening equity. After the date of transition, translation differences
arising on translation of foreign operations are recognised in other comprehensive income and included in a separate
translation reserve within equity.
4 Share based payments
Ind AS 102 Share based payments requires an entity to recognise the equity settled shared based payment plans based
on fair value of the stock options granted to employees instead of intrinsic value. Ind AS 101 permits a first time adopter
to ignore such requirement for the options already vested as on transition date that is 01 April 2015. The Company has
elected to apply this exemptions for such vested options.
5 Assets held for sale
The Group has elected to measure non-current assets held for sale at the lower of carrying value and fair value less cost
to sell at the date of transition and recognize directly in retained earnings any difference between that amount and the
carrying amount of those assets at the date of transition.
6 Deemed cost for investments in subsidiaries, associates and joint ventures
The Group has elected to continue with the carrying value of all of its investments in subsidiaries, joint ventures and
associates recognised as of 1 April 2015 (transition date) measured as per the Previous GAAP as its deemed cost as at the
date of transition.
B Ind AS mandatory exemptions
1 Estimates
An entity’s estimates in accordance with Ind ASs at the date of transition to Ind AS shall be consistent with estimates made
for the same date in accordance with Previous GAAP (after adjustments to reflect any difference in accounting policies),
unless there is objective evidence that those estimates were in error.
Ind AS estimates as at 1 April 2015 are consistent with the estimates as at the same date made in conformity with Previous
269
Notes forming part of the Consolidated Financial Statements for the year ended 31 March 2017
71st Annual Report 2016-17 269
STRATEGIC REPORT GOVERNANCE FINANCIAL STATEMENTS OTHER INFORMATION
49 First time adoption of Ind AS (contd.)
GAAP. The Group made estimates for following items in accordance with Ind AS at the date of transition as these were
not required under Previous GAAP:
a) Investment in equity instruments carried at FVTPL or FVOCI
b) Impairment of financial assets based on expected credit loss model.
2 Classification and measurement of financial assets and liabilities
The classification and measurement of financial assets will be made considering whether the conditions as per Ind AS
109 are met based on facts and circumstances existing at the date of transition.
Financial assets can be measured using effective interest method by assessing its contractual cash flow characteristics
only on the basis of facts and circumstances existing at the date of transition and if it is impracticable to assess elements
of modified time value of money i.e. the use of effective interest method, fair value of financial asset at the date of
transition shall be the new carrying amount of that asset. The measurement exemption applies for financial liabilities as
well.
Applying a requirement is impracticable when the entity cannot apply it after making every reasonable effort to do so. It
is impracticable to apply the changes retrospectively if:
a) The effects of the retrospective application or retrospective restatement are not determinable;
b) The retrospective application or restatement requires assumptions about what management’s intent would have
been in that period;
The retrospective application or retrospective restatement requires significant estimates of amounts and it is impossible
to distinguish objectively information about those estimates that existed at that time.
3 De-recognition of financial assets and liabilities
Ind AS 101 requires a first-time adopter to apply the de-recognition provisions of Ind AS 109 prospectively for transactions
occurring on or after the date of transition to Ind AS. However, Ind AS 101 allows a first-time adopter to apply the de-
recognition requirements in Ind AS 109 retrospectively from a date of the entity’s choosing, provided that the information
needed to apply Ind AS 109 to financial assets and financial liabilities derecognised as a result of past transactions was
obtained at the time of initially accounting for those transactions.
The Group has elected to apply the de-recognition provisions of Ind AS 109 prospectively from the date of transition to
Ind AS.
C Reconciliations between previous GAAP and Ind AS
Ind AS 101 requires an entity to reconcile equity, total comprehensive income and cash flows for prior periods. The
following tables represent the reconciliations from Previous GAAP to Ind AS.
1 Reconciliation of total equity as at 31 March 2016 and 1 April 2015
(H crores)
Note 31 March 2016 1 April 2015
Total equity (shareholder's funds) as per Previous GAAP 1,882.48 1,845.34
Impact of componentisation of property,plant and equipment
recognised in retained earnings
Note – 15 - (1.16)
Adjustments:
Adjustment for proposed dividend Note – 1 17.70 17.70
Measurement of financial assets and financial liabilities at
amortised cost
Note – 2 6.28 12.04
Measurement of investments at fair value through Profit or Loss
(FVTPL)
Note – 3 0.27 0.78

270
Notes forming part of the Consolidated Financial Statements for the year ended 31 March 2017
Escorts Limited270
49 First time adoption of Ind AS (contd.)
(H crores)
Note 31 March 2016 1 April 2015
Recognition of loss allowance for expected credit losses on
financial assets measured at amortised cost
Note – 4 (18.72) (23.19)
Deferral of revenue for after sale services and extended
warranties being separately identifiable components of assets
Note – 5 (4.74) (3.68)
Impact on change of group structure upon transition Note – 6 (28.57) (51.82)
Treasury shares adjusted in equity Note – 6 (344.50) (344.50)
Equity instruments under Previous GAAP classified as Financial
liabilities measured at amortised cost (net of ditsributions)
Note – 7 (1.35) (5.61)
Other GAAP and consolidation adjustments Note – 8 (3.30) (3.59)
Deferred tax impact on above Ind AS and other transition
adjustments
Note – 9 (59.19) (58.13)
Measurement of investments designated at fair value through
Other Comprehensive Income (OCI)
Note – 10 22.00 19.29
Total adjustments (414.12) (441.87)
Total equity as per Ind AS 1,468.36 1,403.47
2 Reconciliation of total comprehensive income for the year ended 31 March 2016
(H crores)
Note 31 March 2016
Profit after tax as per Previous GAAP 76.70
Adjustments:
Measurement of financial assets and financial liabilities at amortised cost Note – 2 (5.76)
Recognition of loss allowance for expected credit losses on financial assets
measured at amortised cost
Note – 4 4.47
Deferral of revenue for after sale services and extended warranties being separately
identifiable components of assets
Note – 5 (1.05)
Measurement of investments at fair value through Profit or Loss (FVTPL) Note – 3 (0.52)
Subsidiary companies consolidated for the first time under Ind AS Note – 6 0.36
Re-measurement gains on defined benefit plans Note – 11 (0.67)
Others Note – 8 (2.55)
Tax impact on above adjustments Note – 9 (0.83)
Total adjustments (6.55)
Profit for the year ended 31 March 2016 70.15
Other comprehensive income (net of tax)
Foreign currency translation reserve 0.71
Remeasurement of the net defined benefit plans Note – 11 0.43
Measurement of investments designated at fair value through Other Comprehensive
Income (OCI)
Note – 10 2.71
Total comprehensive income for the year ended 31 March 2016 74.00
271
Notes forming part of the Consolidated Financial Statements for the year ended 31 March 2017
71st Annual Report 2016-17 271
STRATEGIC REPORT GOVERNANCE FINANCIAL STATEMENTS OTHER INFORMATION
49 First time adoption of Ind AS (contd.)
3 Reconciliation of the assets and liabilities presented in the balance sheet prepared as per Previous GAAP and as per
Ind AS as at 31 March 2016 is as follows:
(H crores)
Description Note Per Previous
GAAP
Ind AS
adjustments
Per Ind AS
Non-current assets
Property, plant and equipment Note – 13, 8, 6 1,562.00 (38.34) 1,523.66
Capital work-in-progress 21.60 - 21.60
Investment property Note – 13 - 23.88 23.88
Intangible assets Note – 6 15.53 (0.17) 15.36
Intangible assets under development 36.83 - 36.83
Investments accounted for using equity
method
Note – 6 - 2.11 2.11
Financial assets -
Investments Note – 6, 10 370.75 (340.44) 30.31
Loans Note – 2 7.61 (0.46) 7.15
Other financial assets Note – 4 12.25 (2.93) 9.32
Deferred tax assets (net) Note – 9, 10, 14 46.08 0.82 46.90
Income tax assets (net) 17.41 - 17.41
Other non-current assets Note – 2, 6 10.92 0.39 11.31
Total non-current assets 2,100.98 (355.14) 1,745.84
Current assets
Inventories Note – 6, 8 426.51 6.06 432.57
Financial assets -
Investments Note – 3, 6 7.62 (0.26) 7.36
Trade receivables Note – 4 399.85 (24.88) 374.97
Cash and cash equivalents Note – 6 32.71 0.41 33.12
Other bank balances Note – 6 219.91 - 219.91
Loans 4.19 - 4.19
Other financial assets Note – 6, 8, 14 72.72 (58.23) 14.49
Other current assets Note – 2, 6 102.69 (0.15) 102.54
Total current assets 1,266.20 (77.05) 1,189.15
Assets held for sale Note – 8 - 9.00 9.00
Total assets 3,367.18 (423.19) 2,943.99
EQUITY AND LIABILITIES
Equity
Equity share capital Note – 6 119.39 3.19 122.58
Other equity Note – 1, 2, 3, 4,
5, 6, 7, 8, 9, 10, 15
1,750.39 (406.49) 1,343.90
Total of equity (for shareholders of
parent)
1,869.78 (403.30) 1,466.48
Non-controlling interest Note – 6, 7 12.69 (10.81) 1.88
Total equity 1,882.47 (414.11) 1,468.36
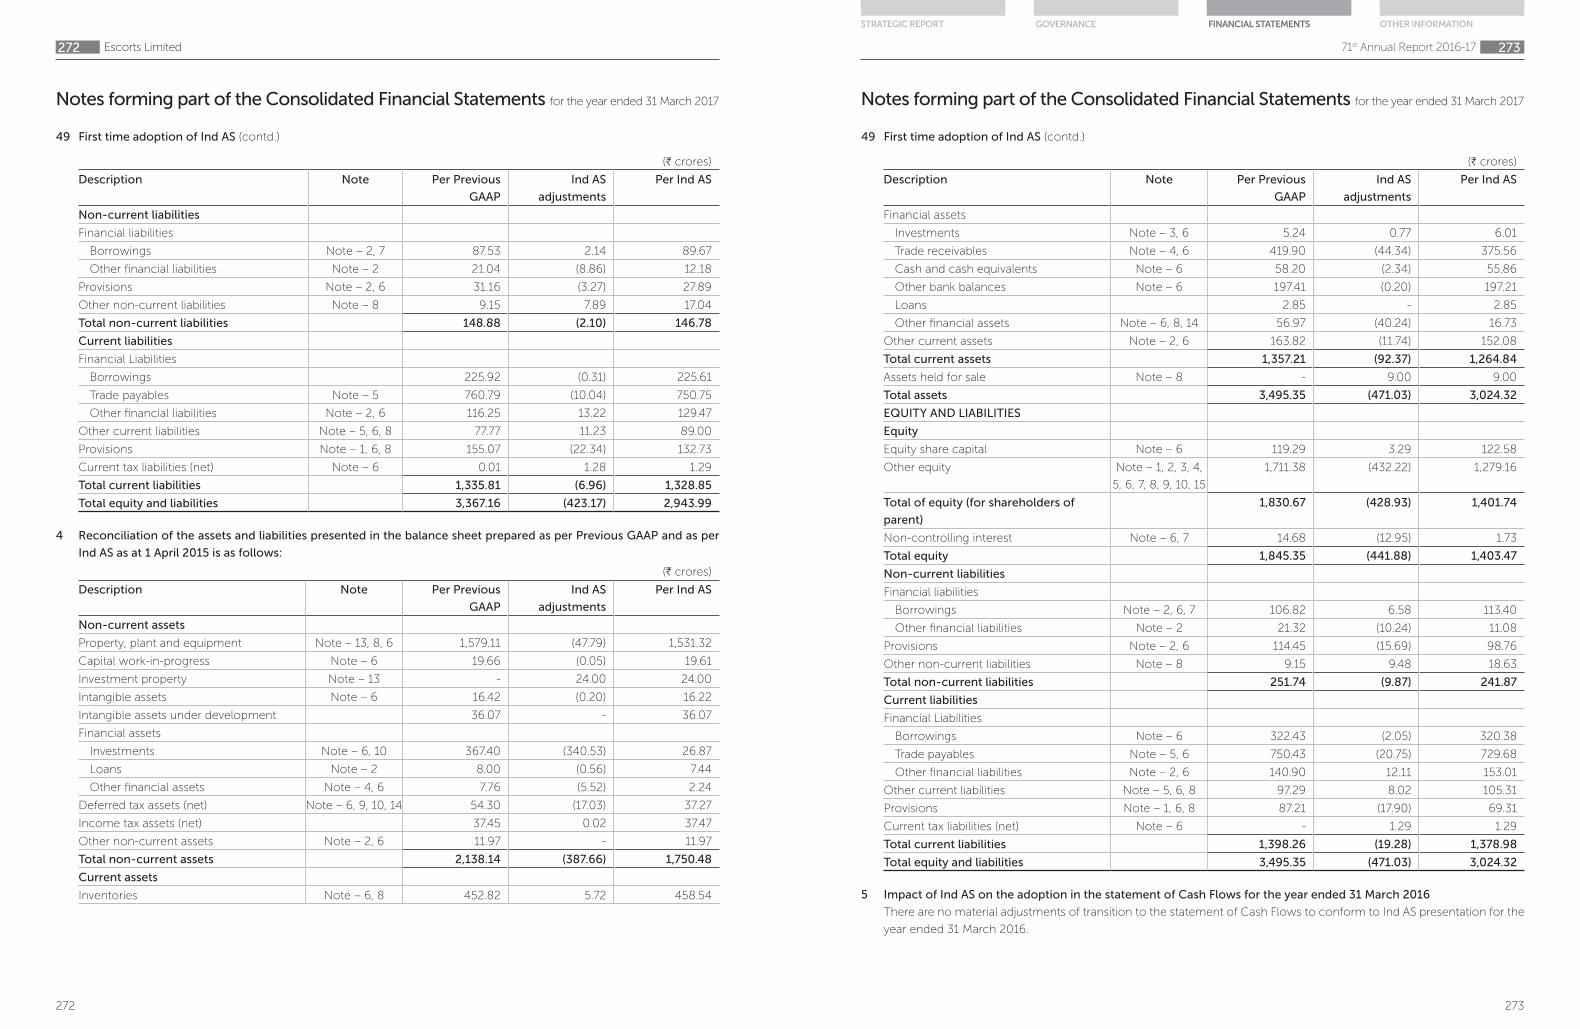
272
Notes forming part of the Consolidated Financial Statements for the year ended 31 March 2017
Escorts Limited272
(H crores)
Description Note Per Previous
GAAP
Ind AS
adjustments
Per Ind AS
Non-current liabilities
Financial liabilities
Borrowings Note – 2, 7 87.53 2.14 89.67
Other financial liabilities Note – 2 21.04 (8.86) 12.18
Provisions Note – 2, 6 31.16 (3.27) 27.89
Other non-current liabilities Note – 8 9.15 7.89 17.04
Total non-current liabilities 148.88 (2.10) 146.78
Current liabilities
Financial Liabilities
Borrowings 225.92 (0.31) 225.61
Trade payables Note – 5 760.79 (10.04) 750.75
Other financial liabilities Note – 2, 6 116.25 13.22 129.47
Other current liabilities Note – 5, 6, 8 77.77 11.23 89.00
Provisions Note – 1, 6, 8 155.07 (22.34) 132.73
Current tax liabilities (net) Note – 6 0.01 1.28 1.29
Total current liabilities 1,335.81 (6.96) 1,328.85
Total equity and liabilities 3,367.16 (423.17) 2,943.99
4 Reconciliation of the assets and liabilities presented in the balance sheet prepared as per Previous GAAP and as per
Ind AS as at 1 April 2015 is as follows:
(H crores)
Description Note Per Previous
GAAP
Ind AS
adjustments
Per Ind AS
Non-current assets
Property, plant and equipment Note – 13, 8, 6 1,579.11 (47.79) 1,531.32
Capital work-in-progress Note – 6 19.66 (0.05) 19.61
Investment property Note – 13 - 24.00 24.00
Intangible assets Note – 6 16.42 (0.20) 16.22
Intangible assets under development 36.07 - 36.07
Financial assets
Investments Note – 6, 10 367.40 (340.53) 26.87
Loans Note – 2 8.00 (0.56) 7.44
Other financial assets Note – 4, 6 7.76 (5.52) 2.24
Deferred tax assets (net) Note – 6, 9, 10, 14 54.30 (17.03) 37.27
Income tax assets (net) 37.45 0.02 37.47
Other non-current assets Note – 2, 6 11.97 - 11.97
Total non-current assets 2,138.14 (387.66) 1,750.48
Current assets
Inventories Note – 6, 8 452.82 5.72 458.54
49 First time adoption of Ind AS (contd.)
273
Notes forming part of the Consolidated Financial Statements for the year ended 31 March 2017
71st Annual Report 2016-17 273
STRATEGIC REPORT GOVERNANCE FINANCIAL STATEMENTS OTHER INFORMATION
(H crores)
Description Note Per Previous
GAAP
Ind AS
adjustments
Per Ind AS
Financial assets
Investments Note – 3, 6 5.24 0.77 6.01
Trade receivables Note – 4, 6 419.90 (44.34) 375.56
Cash and cash equivalents Note – 6 58.20 (2.34) 55.86
Other bank balances Note – 6 197.41 (0.20) 197.21
Loans 2.85 - 2.85
Other financial assets Note – 6, 8, 14 56.97 (40.24) 16.73
Other current assets Note – 2, 6 163.82 (11.74) 152.08
Total current assets 1,357.21 (92.37) 1,264.84
Assets held for sale Note – 8 - 9.00 9.00
Total assets 3,495.35 (471.03) 3,024.32
EQUITY AND LIABILITIES
Equity
Equity share capital Note – 6 119.29 3.29 122.58
Other equity Note – 1, 2, 3, 4,
5, 6, 7, 8, 9, 10, 15
1,711.38 (432.22) 1,279.16
Total of equity (for shareholders of
parent)
1,830.67 (428.93) 1,401.74
Non-controlling interest Note – 6, 7 14.68 (12.95) 1.73
Total equity 1,845.35 (441.88) 1,403.47
Non-current liabilities
Financial liabilities
Borrowings Note – 2, 6, 7 106.82 6.58 113.40
Other financial liabilities Note – 2 21.32 (10.24) 11.08
Provisions Note – 2, 6 114.45 (15.69) 98.76
Other non-current liabilities Note – 8 9.15 9.48 18.63
Total non-current liabilities 251.74 (9.87) 241.87
Current liabilities
Financial Liabilities
Borrowings Note – 6 322.43 (2.05) 320.38
Trade payables Note – 5, 6 750.43 (20.75) 729.68
Other financial liabilities Note – 2, 6 140.90 12.11 153.01
Other current liabilities Note – 5, 6, 8 97.29 8.02 105.31
Provisions Note – 1, 6, 8 87.21 (17.90) 69.31
Current tax liabilities (net) Note – 6 - 1.29 1.29
Total current liabilities 1,398.26 (19.28) 1,378.98
Total equity and liabilities 3,495.35 (471.03) 3,024.32
5 Impact of Ind AS on the adoption in the statement of Cash Flows for the year ended 31 March 2016
There are no material adjustments of transition to the statement of Cash Flows to conform to Ind AS presentation for the
year ended 31 March 2016.
49 First time adoption of Ind AS (contd.)

274
Notes forming part of the Consolidated Financial Statements for the year ended 31 March 2017
Escorts Limited274
49 First time adoption of Ind AS (contd.)
Note – 1
Adjustment for proposed dividend
Under the Previous GAAP, dividends proposed by the board of directors after the balance sheet date but before the approval
of the financial statements were considered as adjusting events. Accordingly, provision for proposed dividend was recognised
as a liability. Under Ind AS, such dividends are recognised when the same is approved by the shareholders in the general
meeting. Accordingly, the liability for proposed dividend included under provisions has been reversed with corresponding
adjustment to retained earnings.
Note – 2
Measurement of financial assets and financial liabilities at amortised cost
Under Previous GAAP, all financial assets and financial liabilities were carried at cost.
Under Ind AS, certain financial assets and financial liabilities are subsequently measured at amortised cost which involves
the application of effective interest method. In applying the effective interest method, an entity identifies fees that are an
integral part of the effective interest rate of a financial instrument. The effective interest rate is the rate that exactly discounts
estimated future cash payments or receipts through the expected life of the financial asset or financial liability to the gross
carrying amount of the financial asset or financial liability.
For certain financial liabilities, the fair value of the financial liability at the date of transition to Ind AS has been considered as
the new amortised cost of that financial liability at the date of transition to Ind AS.
Note – 3
Measurement of investments at fair value through Profit or Loss (FVTPL)
Under Previous GAAP, current investments were stated at lower of cost and fair value.
Under Ind AS, these financial assets have been classified as FVTPL on the date of transition and changes in fair value after the
date of transition has been recognised in profit or loss.
Note – 4
Recognition of loss allowance for expected credit losses on financial assets measured at amortised cost
Under Previous GAAP, provision for doubtful debts was recognised based on the estimates of the outcome and of the financial
effect of contingencies determined by the management of the Company. This judgement was based on consideration of
information available up to the date on which the financial statements were approved and included a review of events
occurring after the balance sheet date.
Under Ind AS, a loss allowance for expected credit losses is recognised on financial assets carried at amortised cost. Expected
loss on individually significant receivables is assessed when they are past due and based on company’s historical counterparty
default rates and forecast of macro-economic factors. Other receivables have been segmented by reference to the industry
of the counterparty and other shared credit risk characteristics to evaluate the expected credit loss. The expected credit loss
estimate is then based on recent historical counterparty default rates for each identified segment.
Note – 5
Deferral of revenue for after sale services and extended warranties being separately identifiable components of assets
Under Previous GAAP, the amount of revenue was usually determined at consideration received or receivable for the product
or service explicitly specified in the contract between the parties.
Under Ind AS, where the sale transaction of the Company includes separately identifiable components, such as after sales
services and extended warranties, it is necessary to apply the recognition criteria to those separately identifiable components
in order to reflect the substance of the transaction. Revenue from each component so identified is only recognized when
such goods are sold or services are rendered. Accordingly, revenue attributable to specifically identifiable components where
services are pending to be rendered has been deferred.
275
Notes forming part of the Consolidated Financial Statements for the year ended 31 March 2017
71st Annual Report 2016-17 275
STRATEGIC REPORT GOVERNANCE FINANCIAL STATEMENTS OTHER INFORMATION
Note – 6
Impact on change of group structure upon transition
6.1 Under Previous GAAP, one entity controls another entity when it has the ownership of more than one-half of the voting
power of the other entity or control of the composition of the board of directors so as to obtain economic benefits from
its activities. Based on the control assessment carried out by the group under Ind AS 110, the following companies have
been assessed as subsidiaries of the group:
a. Escorts Finance Limited
b. Escorts Benefit and Welfare Trust
c. Escorts Benefit Trust”
6.2 Under Previous GAAP, Hughes Communications India Limited was classified as joint venture for consolidating 31 March
2015 financials and accounted for using the proportionate consolidation method. Under Ind AS, based on the control
assessment carried out Hughes Communications India Limited has not been consolidated in these financials.
Under Previous GAAP, Adico Escorts Agri Equipment Pvt. Limited was classified as joint venture and accounted for using
the proportionate consolidation. Under Ind AS, the entity has been consolidated using the equity method.
Note – 7
Equity instruments under Previous GAAP classified as Financial liabilities measured at amortised cost (net of ditsributions)
Redeemable preference shares issued by the Group have been classified as borrowings and recognized at amortised cost
on transition date as against part of Minority interest under previous GAAP. The difference on the transition date has been
recognized in other equity. Interest charge at effective interest rate on such instruments has been recognized as finance cost
in subsequent periods.
Note – 8
Other adjustments
Other adjustments comprise of the following :
a) Employee stock option plan - Under Previous GAAP, the intrinsic value of the employee stock option plan was recognised
as an expense over the vesting period. Under Ind AS, the compensation cost of employee stock option plan is recognised
based on the fair value of the options determined using an appropriate pricing model at the date of grant.
b) Assets held for sale - Under Previous GAAP, non-current asset held for sale were carried at historical cost. Under Ind AS,
non-current assets held for sale is to be carried at lower of carrying amount and fair value less costs to sell. The company
has classified some of its non-current assets as held for sale and the resulting loss has been transferred to retained
earnings.
c) Other miscellaneous adjustments
Note – 9
Deferred tax impact on above Ind AS and other transition adjustments
Under Previous GAAP, deferred tax was accounted using the income statement approach, on the timing differences between
the taxable profit and accounting profits for the period. Under Ind AS, deferred tax is recognized following balance sheet
approach on the temporary differences between the carrying amount of asset or liability in the balance sheet and its tax base.
In addition, various transitional adjustments has also led to recognition of deferred taxes on new temporary differences.
Note – 10
Measurement of investments designated at fair value through Other Comprehensive Income (OCI)
Investments in equity instruments have been measured at fair value through profit or loss as against cost less diminution of
other than temporary nature, if any, under the Previous GAAP.
Certain equity investments (other than investments in subsidiaries, joint ventures and associates) have been measured at fair
value through other comprehensive income (FVTOCI).
49 First time adoption of Ind AS (contd.)
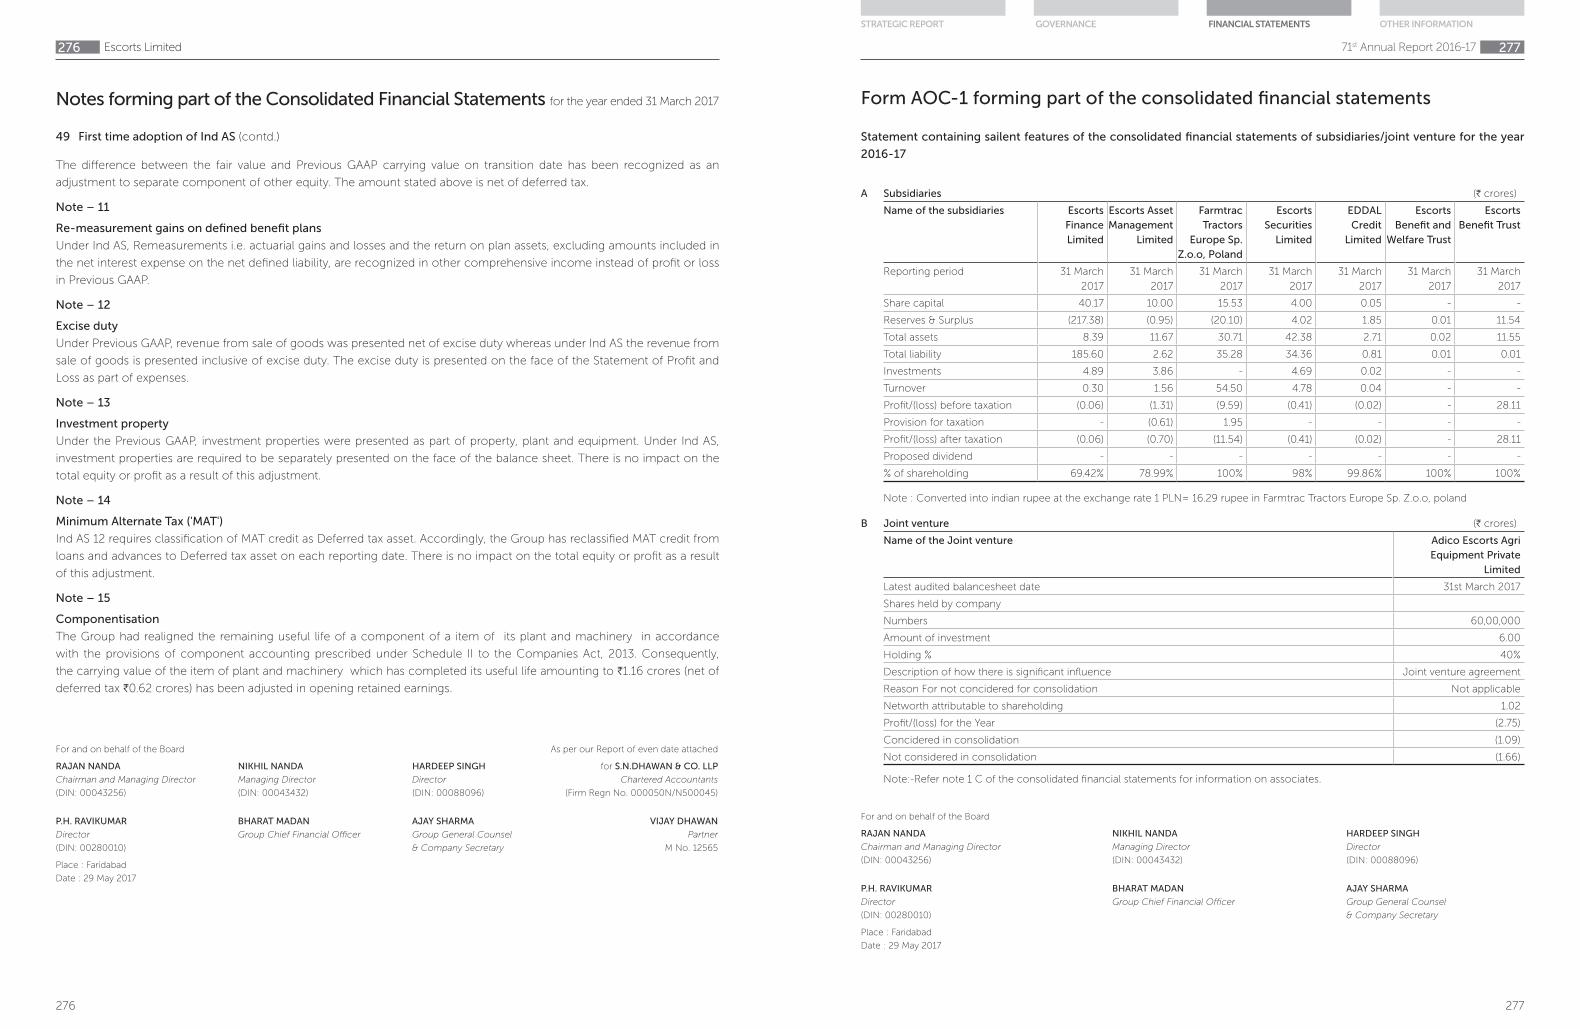
276
Notes forming part of the Consolidated Financial Statements for the year ended 31 March 2017
Escorts Limited276
For and on behalf of the Board As per our Report of even date attached
RAJAN NANDA NIKHIL NANDA HARDEEP SINGH for S.N.DHAWAN & CO. LLP
Chairman and Managing Director Managing Director Director Chartered Accountants
(DIN: 00043256) (DIN: 00043432) (DIN: 00088096) (Firm Regn No. 000050N/N500045)
P.H. RAVIKUMAR BHARAT MADAN AJAY SHARMA VIJAY DHAWAN
Director Group Chief Financial Officer Group General Counsel Partner
(DIN: 00280010) & Company Secretary M No. 12565
Place : Faridabad
Date : 29 May 2017
The difference between the fair value and Previous GAAP carrying value on transition date has been recognized as an
adjustment to separate component of other equity. The amount stated above is net of deferred tax.
Note – 11
Re-measurement gains on defined benefit plans
Under Ind AS, Remeasurements i.e. actuarial gains and losses and the return on plan assets, excluding amounts included in
the net interest expense on the net defined liability, are recognized in other comprehensive income instead of profit or loss
in Previous GAAP.
Note – 12
Excise duty
Under Previous GAAP, revenue from sale of goods was presented net of excise duty whereas under Ind AS the revenue from
sale of goods is presented inclusive of excise duty. The excise duty is presented on the face of the Statement of Profit and
Loss as part of expenses.
Note – 13
Investment property
Under the Previous GAAP, investment properties were presented as part of property, plant and equipment. Under Ind AS,
investment properties are required to be separately presented on the face of the balance sheet. There is no impact on the
total equity or profit as a result of this adjustment.
Note – 14
Minimum Alternate Tax ('MAT')
Ind AS 12 requires classification of MAT credit as Deferred tax asset. Accordingly, the Group has reclassified MAT credit from
loans and advances to Deferred tax asset on each reporting date. There is no impact on the total equity or profit as a result
of this adjustment.
Note – 15
Componentisation
The Group had realigned the remaining useful life of a component of a item of its plant and machinery in accordance
with the provisions of component accounting prescribed under Schedule II to the Companies Act, 2013. Consequently,
the carrying value of the item of plant and machinery which has completed its useful life amounting to H1.16 crores (net of
deferred tax H0.62 crores) has been adjusted in opening retained earnings.
49 First time adoption of Ind AS (contd.)
277
71st Annual Report 2016-17 277
STRATEGIC REPORT GOVERNANCE FINANCIAL STATEMENTS OTHER INFORMATION
Form AOC-1 forming part of the consolidated financial statements
For and on behalf of the Board
RAJAN NANDA NIKHIL NANDA HARDEEP SINGH
Chairman and Managing Director Managing Director Director
(DIN: 00043256) (DIN: 00043432) (DIN: 00088096)
P.H. RAVIKUMAR BHARAT MADAN AJAY SHARMA
Director Group Chief Financial Officer Group General Counsel
(DIN: 00280010) & Company Secretary
Place : Faridabad
Date : 29 May 2017
Statement containing sailent features of the consolidated financial statements of subsidiaries/joint venture for the year
2016-17
A Subsidiaries (H crores)
Name of the subsidiaries Escorts
Finance
Limited
Escorts Asset
Management
Limited
Farmtrac
Tractors
Europe Sp.
Z.o.o, Poland
Escorts
Securities
Limited
EDDAL
Credit
Limited
Escorts
Benefit and
Welfare Trust
Escorts
Benefit Trust
Reporting period 31 March
2017
31 March
2017
31 March
2017
31 March
2017
31 March
2017
31 March
2017
31 March
2017
Share capital 40.17 10.00 15.53 4.00 0.05 - -
Reserves & Surplus (217.38) (0.95) (20.10) 4.02 1.85 0.01 11.54
Total assets 8.39 11.67 30.71 42.38 2.71 0.02 11.55
Total liability 185.60 2.62 35.28 34.36 0.81 0.01 0.01
Investments 4.89 3.86 - 4.69 0.02 - -
Turnover 0.30 1.56 54.50 4.78 0.04 - -
Profit/(loss) before taxation (0.06) (1.31) (9.59) (0.41) (0.02) - 28.11
Provision for taxation - (0.61) 1.95 - - - -
Profit/(loss) after taxation (0.06) (0.70) (11.54) (0.41) (0.02) - 28.11
Proposed dividend - - - - - - -
% of shareholding 69.42% 78.99% 100% 98% 99.86% 100% 100%
Note : Converted into indian rupee at the exchange rate 1 PLN= 16.29 rupee in Farmtrac Tractors Europe Sp. Z.o.o, poland
B Joint venture (H crores)
Name of the Joint venture Adico Escorts Agri
Equipment Private
Limited
Latest audited balancesheet date 31st March 2017
Shares held by company
Numbers 60,00,000
Amount of investment 6.00
Holding % 40%
Description of how there is significant influence Joint venture agreement
Reason For not concidered for consolidation Not applicable
Networth attributable to shareholding 1.02
Profit/(loss) for the Year (2.75)
Concidered in consolidation (1.09)
Not considered in consolidation (1.66)
Note:-Refer note 1 C of the consolidated financial statements for information on associates.

Notes Notes
Notes
A PRODUCT
GROUP GENERAL COUNSEL AND COMPANY SECRETARY
Mr. Ajay Sharma
SECRETARIAL AUDITORS
M/s. Jayant Gupta & Associates
INTERNAL AUDITORS
Ernst & Young LLP
STATUTORY AUDITORS
M/s S. N. Dhawan & Co.
COST AUDITORS
M/s. Ramanath Iyer & Co.
CORPORATE CENTRE & REGISTERED OFFICE
15/5, Mathura Road, Faridabad -121003,
Haryana, India
BANKERS
Axis Bank
IDBI Bank
ICICI Bank
IndusInd Bank
Oriental Bank of Commerce
Punjab National Bank
State Bank of India
The Hongkong and Shanghai Banking Corporation Limited
Corporate Information
Mr. Rajan Nanda,
Chairman and Managing
Director
Mr. Nikhil Nanda,
Managing Director
Mr. Hardeep Singh,
Director
Mr. P.H. Ravikumar,
Director
Dr. Sutanu Behuria,
Director
Mr. D. J. Kakalia,
Director
Mrs. Vibha Paul Rishi,
Director
Ms. Nitasha Nanda,
Director
Mr. G. B. Mathur,
Director
Board of Directors

Escorts Limited
Corporate Centre & Registered Office
15/5 Mathura Road
Faridabad -121003, Haryana, India
Website: www.escortsgroup.com


