Enterprise AgreementValue Assessment

I.T. Driving Strategic Differentiationand Delivering Business Value
2
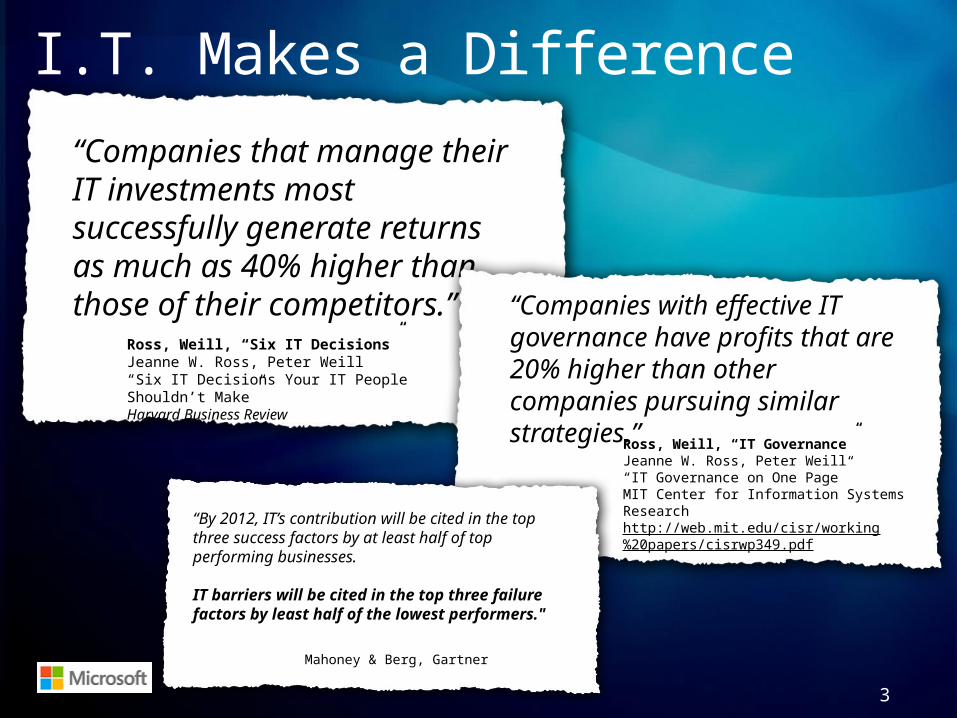
“Companies that manage their IT investments most successfully generate returns as much as 40% higher than those of their competitors.”
Ross, Weill, “Six IT Decisions”Jeanne W. Ross, Peter Weill “Six IT Decisions Your IT People Shouldn’t Make”Harvard Business Review
“Companies with effective IT governance have profits that are 20% higher than other companies pursuing similar strategies.”
Ross, Weill, “IT Governance”Jeanne W. Ross, Peter Weill “IT Governance on One Page”MIT Center for Information Systems Researchhttp://web.mit.edu/cisr/working%20papers/cisrwp349.pdf
I.T. Makes a Difference
3
“By 2012, IT’s contribution will be cited in the top three success factors by at least half of top performing businesses.
IT barriers will be cited in the top three failure factors by least half of the lowest performers."
Mahoney & Berg, Gartner

Calculate Impact on business revenue / expense from I.T. enabled business initiatives
I.T. Enabled Business Outcomes*
a. Retaining customers and enhancing existing relationships
b. Maintaining competitive advantagec. Attracting new businessd. Attracting and retaining skilled workers/talente. Reducing costs via better efficiencies
* Gartner—Early findings from the 2010 Gartner CEO and Business Executive Survey
4
1

Business Value of I.T. Executive Summary
6
(Customer Name) Profit & Loss Business Value
Yr1 Yr2 Yr3Revenue
Revenue Growth & Retention
Revenue via Competitive Differentiation
New Business Revenue
Revenue Growth resulting from Staff Retention
Expense
Cost Reduction via Competitive Differentiation
Cost Reduction via Business Efficiency
Cost Reduction from Staff Retention
Estimated Value Years 1 – 3 (provide a Low – High estimate for each year)
a b
b
c d e
d e
1
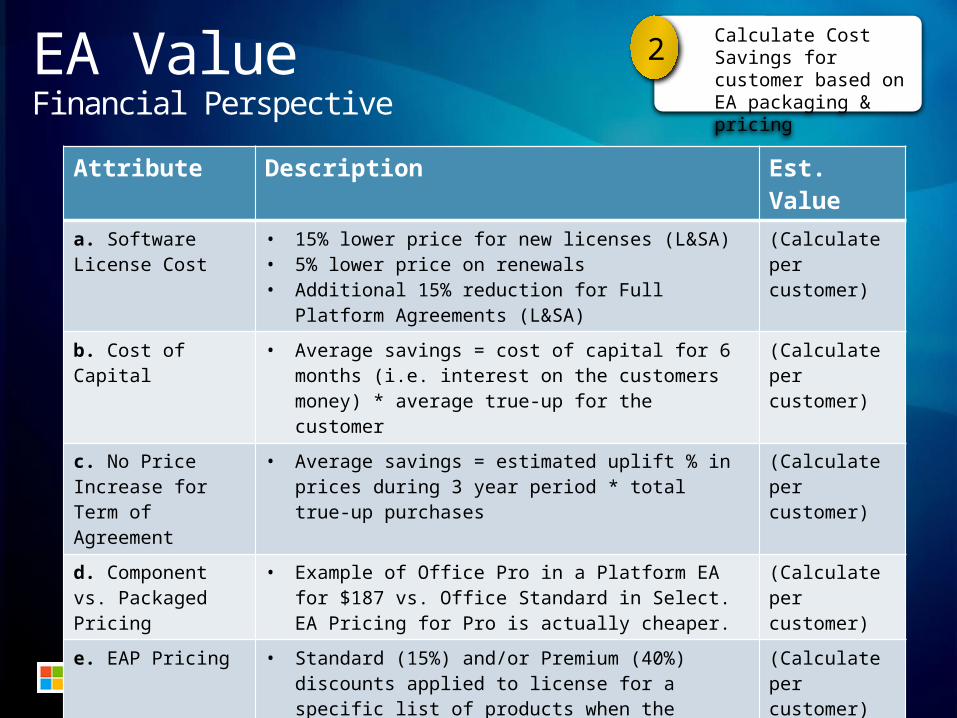
EA Value Financial Perspective
7
Attribute Description Est. Valuea. Software License Cost
• 15% lower price for new licenses (L&SA)• 5% lower price on renewals • Additional 15% reduction for Full Platform Agreements
(L&SA)
(Calculate per customer)
b. Cost of Capital • Average savings = cost of capital for 6 months (i.e. interest on the customers money) * average true-up for the customer
(Calculate per customer)
c. No Price Increase for Term of Agreement
• Average savings = estimated uplift % in prices during 3 year period * total true-up purchases
(Calculate per customer)
d. Component vs. Packaged Pricing
• Example of Office Pro in a Platform EA for $187 vs. Office Standard in Select. EA Pricing for Pro is actually cheaper.
(Calculate per customer)
e. EAP Pricing • Standard (15%) and/or Premium (40%) discounts applied to license for a specific list of products when the customer makes an enterprise commitment
(Calculate per customer)
f. ECI Pricing • Enrollment for Core Infrastructure (ECI) packaging provides an additional 20% discount when purchasing Windows Server and Systems Center together
(Calculate per customer)
Calculate Cost Savings for customer based on EA packaging & pricing
2

EA Value Technology Access / Usage
13
Attribute Description Est. Valuea. Workforce Profiling Develop 2 – 3 employee profiles and related software
requirements. Model costs of CALs for these different groups over term of EA. (Pricing impact: component EAs are priced 15% higher than full platform for L&SA and 5% higher for SA only. Modeling of benefits required.)
(Calculate per customer)
b. Multi-Vendor Maintenance & Education
Time and budget invested to maintain and manage multiple I.T. Infrastructure or Productivity products.
Calculate cost of multi-vendor IT environment
Calculate Cost Savings based on custom user profiles & integrated vendor environment
3

EA Value Business Management
16
Attribute Description Est. ValueBudget Retention EA commitment requires regular payment and maintenance of
software vs. sporadic purchase process / timeline. Result is typically a more consistent / dependable I.T. budget for the customer
Soft
Software License Management
EA requires less administration based on annual true-up Soft
Technology Access EA includes licensing options for the following software, not available in Select: • Windows Intune • Office 365 • Virtual Desktop • MDOP • BitLocker • Roaming Use Rights • Windows To Go • Companion Rights for Windows RT
Soft
Technology Access EA includes immediate access to new product releases during the term of your EA agreement.
Soft
Summarize soft benefits to ensure customer understanding & value
4
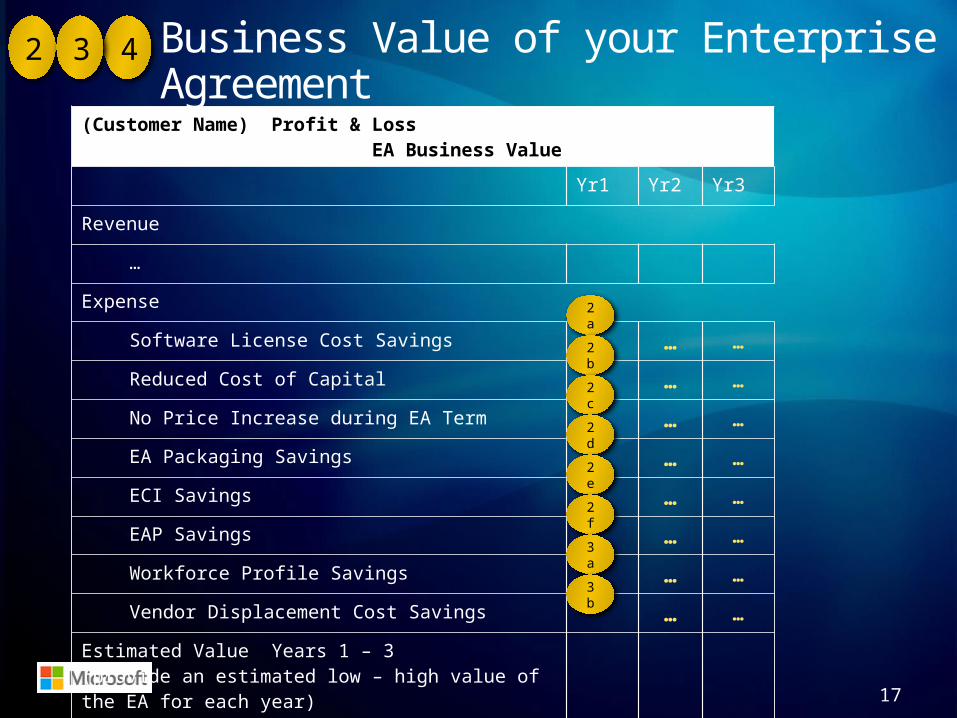
Business Value of your Enterprise AgreementExecutive Summary
17
(Customer Name) Profit & Loss EA Business Value
Yr1 Yr2 Yr3
Revenue
…
Expense
Software License Cost Savings … …
Reduced Cost of Capital … …
No Price Increase during EA Term … …
EA Packaging Savings … …
ECI Savings … …
EAP Savings … …
Workforce Profile Savings … …
Vendor Displacement Cost Savings … …
Estimated Value Years 1 – 3 (provide an estimated low – high value of the EA for each year)
42 3
2a
2b
2c
2d
2e
2f
3a
3b
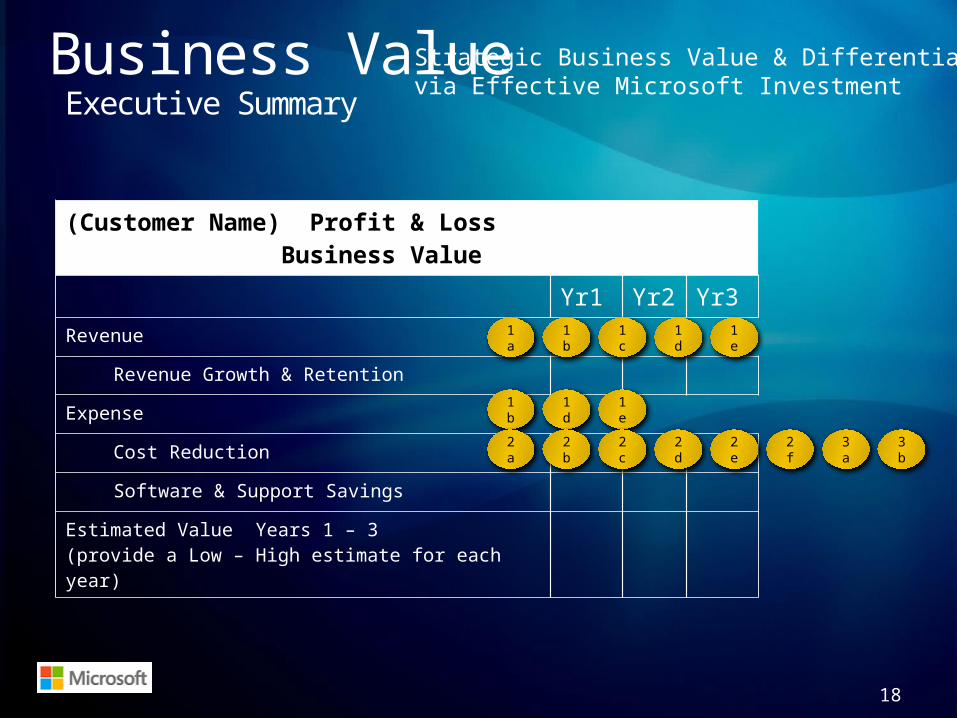
Business Value Executive Summary
18
(Customer Name) Profit & Loss Business Value
Yr1 Yr2 Yr3Revenue
Revenue Growth & Retention
Expense
Cost Reduction
Software & Support Savings
Estimated Value Years 1 – 3 (provide a Low – High estimate for each year)
1a
1b
1b
1c
1d
1e
1d
1e
Strategic Business Value & Differentiationvia Effective Microsoft Investment
2a
2b
2c
2d
2e
2f3a
3b
EA Value Additional Resources
19
SMSG Readiness: “Selling the Absolute Value of an EA”; Link
Gartner: “Choosing Between Microsoft’s Select and Enterprise Agreements”, Link
Gartner: “Profiling Users Can Reduce Costs in Your Microsoft Enterprise Agreement” Link
Gartner: “Microsoft Makes Windows SA More Compelling for Some, Less for Others”, Link
Appendix

Robust IT infrastructure is a key driver of productivity
and growth.
Information technology gives managers more insight
and control.
Firms with better IT have more productive
employees.
Linking IT to Business Performance
Isolating the impact of all IT functions on productivity shows that IT infrastructure is a key determinant of superior productivity.
Information technology fuels profitable revenue
growth.
Companies in the top 25% of IT capability grew revenue 6.8% faster per year than their peers in the bottom 25% of IT capability.
Managers in firms that are supported by better information systems have significantly better insight into, and control over, key dimensions of their business.
The firms in the top 25% of IT capability enjoy 23% higher revenue per employee than their peers in the bottom 25% of IT capability.
Harvard Business School, Keystone Strategy, Inc., March 2006
21

IO Capability IO Subcapability B S R D
Core IO
Identity and Access Management
Identity and Access Management
Desktop, Device, and Server Management
Desktop Management
Virtualization
Server Management
Mobile Device Management
Security and Networking Security and Networking
Data Protection and Recovery Data Protection and Recovery
Core Infrastructure
22

IO Capability IO Subcapability B S R D
BP IO
Unified Communications
MessagingInstant Messaging and PresenceVoiceConferencing
CollaborationCollaborative Workspaces & PortalsSocial Computing
Enterprise Content Management
Document & Records ManagementWeb Content ManagementForms
Enterprise Search Enterprise Search
Business IntelligencePerformance ManagementReporting and AnalysisData Warehousing
BPIO (People Productivity)
23

IO Capability IO Subcapability B S R D
AppPlat
User Experience Client and Web DevelopmentSOA and Business Process
Process, Workflow, and Integration
Data Management Data Infrastructure—Custom LOB/ISV LOB
Development Dev Platform, App Life Cycle Mgmt and Custom Apps
Application Platform
24


