
MARCH 26, 2020
COVID-19 response
Epidemic Projections
1 Copyrig
ht
© 2
020
by B
ost
on C
onsu
ltin
g G
roup. All
rig
hts
rese
rved.
Context• This document represents estimates as of 3/25/2020, based on BCG predictive modelling leveraging John Hopkins University data; full
modelling constraints are detailed in the following pages
• We have deep dived on top 20 markets to project the evolution of two main variables1 :– # of daily new cases– Total 'active' infected patients (excludes people infected and, either quarantined, recovered or dead)
• The current projected evolution of cases does not assume a second wave of infections vs. prior crises such as SARS or the Spanish flu –fuller confidence in this variable still TBD as data develops
• Where needed, we have leveraged this fact base to put a draft estimate of timing for the start of a potential lockdown, the estimated peak of infections, and the end of a potential lockdown (short and long), leveraging:
– Latest projected epidemic curves for that country– Analogs from countries further along in the infection curve– External press searches/reports on government activity– Quantitative ratings/factors that help triangulate efficacy of response (e.g., hospital infrastructure, regulatory quality indices,
government effectiveness etc)
• To facilitate planning activities, we anchored each 'moment' of the epidemic on specific weeks – those weeks are not meant to predict the exact timing of each 'moment' and are subject to changes in external environment (e.g. new government measures)
1. Includes asymptomatic cases which, depending on testing policy of each country, might result in higher numbers than reported
Currently fine tuning epidemic curves of selected countries (e.g. Mexico)
2 Copyrig
ht
© 2
020
by B
ost
on C
onsu
ltin
g G
roup. All
rig
hts
rese
rved.
Legal context regarding our support
The situation surrounding COVID-19 is dynamic and rapidly evolving, on a daily basis. Although
we have taken great care prior to producing this presentation, it represents BCG’s view at a
particular point in time.
This presentation is not intended to:
(i) constitute medical or safety advice, nor be a substitute for the same; nor
(ii) be seen as a formal endorsement or recommendation of a particular response.
As such you are advised to make your own assessment as to the appropriate course of action to
take, use this presentation as guidance. Please carefully consider local laws and guidance in
your area, particularly the most recent advice issued by your local (and national) health
authorities, before making any decision.

3 Copyrig
ht
© 2
020
by B
ost
on C
onsu
ltin
g G
roup. All
rig
hts
rese
rved.
Important caveats (at 25 March 2020)
The outputs of the modelling are not for publication or public dissemination
The model should be considered a 'beta' version: a more detailed model is under development
Much is still unknown or uncertain about the virus• We have, where available, used assumptions from published academic sources. The lag time in research and publication of
journals means that understanding of the virus is moving faster than refereed research• This model is built using standard epidemiological modelling techniques, but given the relatively early stage of our understanding
of this virus, it is possible that the virus does not behave in a way that makes such techniques applicable• In particular, asymptomatic transmission is highly likely. The model seeks to account for this however the treatment of this may
not be fully accurate. It is possible that asymptomatic carriers may remain infectious for an extended period of time• The transmission of the virus and progress of the disease in people of different ages remains an area of emerging research. This
version of the model does not yet incorporate an age stratification or other features that correct for differing demographicsbetween geographies
There are very significant differences in access to testing and rates of testing and/or the timeliness and reliability of the reporting of infections across different geographies
• As with any model, the availability and quality of data will have a material impact on the quality and reliability of outputs
Government policy interventions have a significant lag time• Given the time between infection, incubation, development of symptoms, access to testing and results, the impact of a particular
government policy intervention taken today is unlikely to change the shape of the curve for at least 5-7 days, and possibly materially longer
• A future version of the model which will attempt to allow scenario modelling of different interventions is under development.This version does not attempt to do so
4 Copyrig
ht
© 2
020
by B
ost
on C
onsu
ltin
g G
roup. All
rig
hts
rese
rved.
Scenario modelling disclaimer
This is a work-in-progress scenario model of a highly dynamic situation. The modelling depends on a number of assumptions, which may or may not be supported to varying extents in your geography. The results are scenarios for consideration, not BCG forecasts about the future. Please understand the assumptions, including the following:
'Reported cases' is a lower bound on what the actual levels of COVID-19 may be• The modelling here is calibrated assuming that all cases are detected on average
over time. This is unlikely to be true as many cases are currently going unreported and therefore do not flow through into the data that informs the modelling. The reported case limits set a lower bound on the true prevalence of COVID-19. The discrepancy may be worse in countries with less developed public health care systems or where inadequate testing has occurred
Government/personal actions may drive further containment than what is modelled• This modelling includes an elasticity-like term that seeks to quantify the fact that
increasingly large case counts typically drive progressively more aggressive containment strategies. The coefficient for this is calibrated automatically during the model fitting, and the resultant 'future reproduction number' modelled is shown in these pages, but its exact value is uncertain. We do not explicitly model the effect of specific government interactions in the future – for which the timing and efficacy is highly uncertain.
"PREDICTING THINGS IS VERY HARD…
…PARTICULARLY ABOUT THE FUTURE"
- NIELS BOHR
5 Copyrig
ht
© 2
020
by B
ost
on C
onsu
ltin
g G
roup. All
rig
hts
rese
rved.
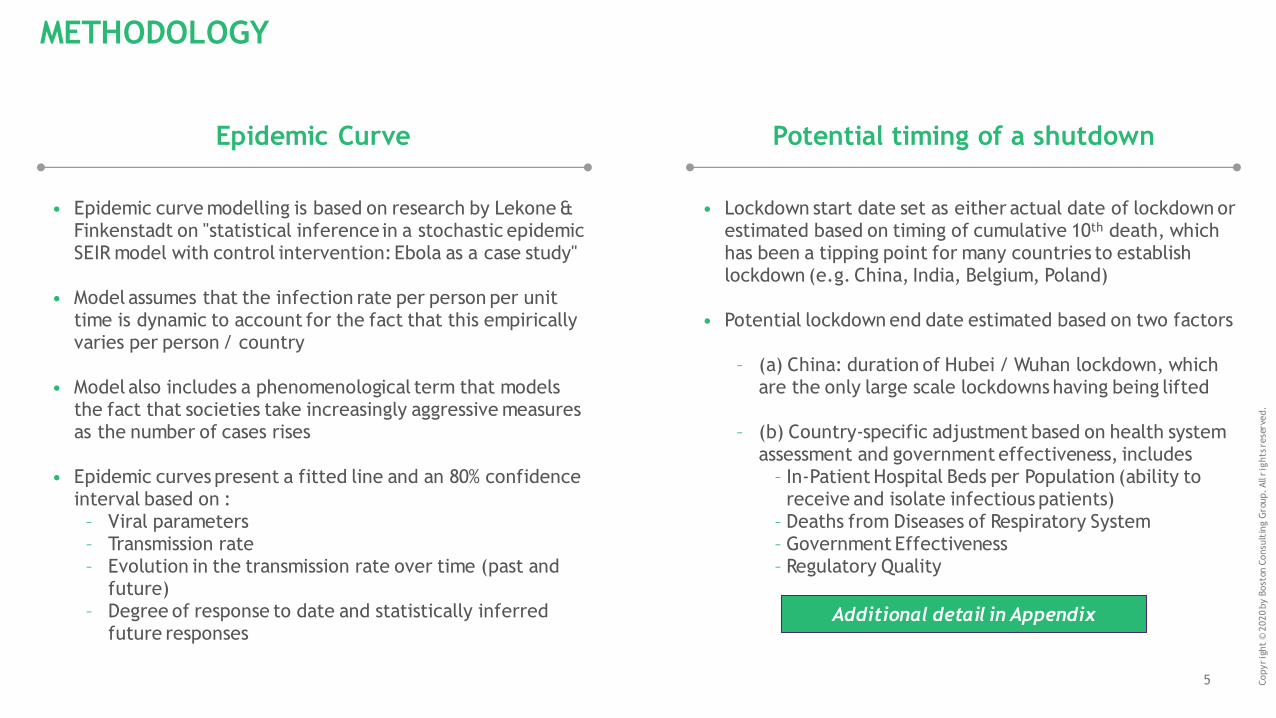
METHODOLOGY
• Epidemic curve modelling is based on research by Lekone & Finkenstadt on "statistical inference in a stochastic epidemic SEIR model with control intervention: Ebola as a case study"
• Model assumes that the infection rate per person per unit time is dynamic to account for the fact that this empirically varies per person / country
• Model also includes a phenomenological term that models the fact that societies take increasingly aggressive measures as the number of cases rises
• Epidemic curves present a fitted line and an 80% confidence interval based on :
– Viral parameters– Transmission rate– Evolution in the transmission rate over time (past and
future)– Degree of response to date and statistically inferred
future responses
Epidemic Curve Potential timing of a shutdown
• Lockdown start date set as either actual date of lockdown or estimated based on timing of cumulative 10th death, which has been a tipping point for many countries to establish lockdown (e.g. China, India, Belgium, Poland)
• Potential lockdown end date estimated based on two factors
– (a) China: duration of Hubei / Wuhan lockdown, which are the only large scale lockdowns having being lifted
– (b) Country-specific adjustment based on health system assessment and government effectiveness, includes
– In-Patient Hospital Beds per Population (ability to receive and isolate infectious patients)
– Deaths from Diseases of Respiratory System– Government Effectiveness– Regulatory Quality
Additional detail in Appendix
6 Copyrig
ht
© 2
020
by B
ost
on C
onsu
ltin
g G
roup. All
rig
hts
rese
rved.
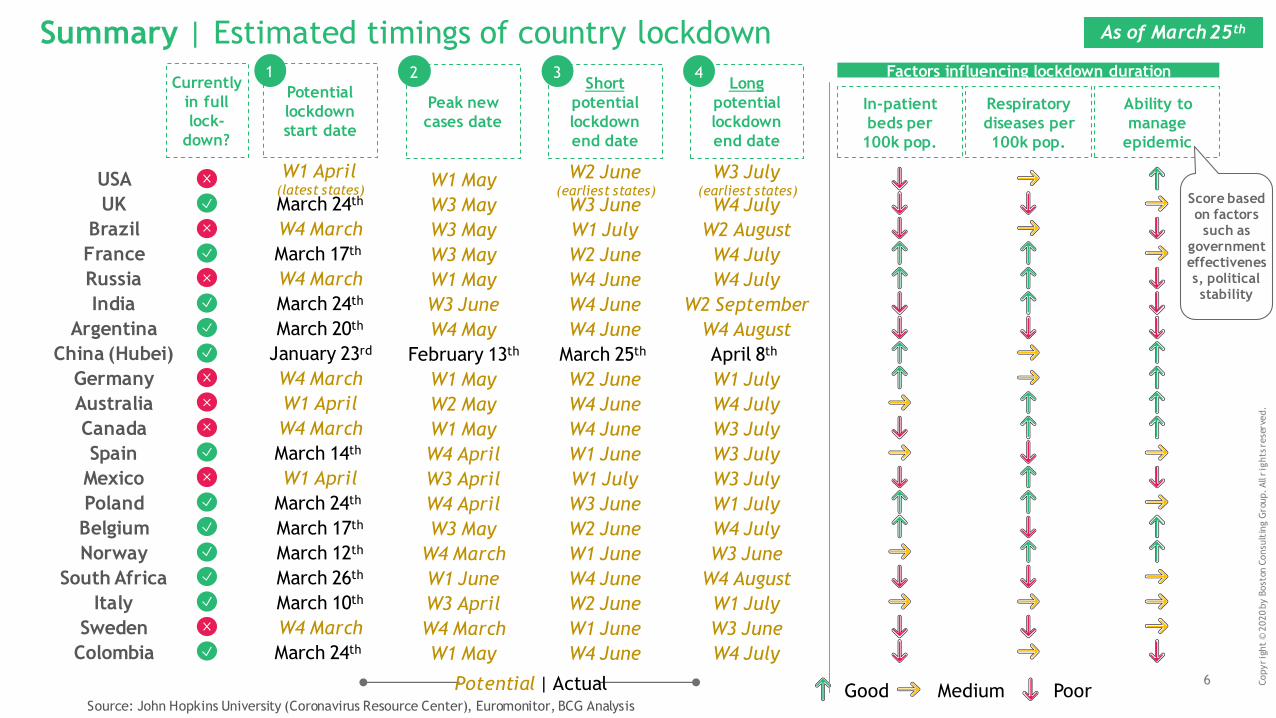
Potential | Actual
Summary | Estimated timings of country lockdown
USA
UK
Brazil
France
Colombia
Currently
in full
lock-
down?
Factors influencing lockdown duration
In-patient
beds per
100k pop.
Respiratory
diseases per
100k pop.
Russia
India
Germany
Argentina
China (Hubei)
Australia
South Africa
Italy
Sweden
Norway
Belgium
Canada
Spain
Mexico
Poland
Good Medium Poor
Ability to
manage
epidemic
Score based on factors
such as government effectiveness, political stability
Potential
lockdown
start date
W1 April (latest states)March 24th
W4 March
March 24th
March 17th
W4 March
W4 March
March 17th
W4 March
March 24th
January 23rd
March 20th
March 10th
March 12th
March 26th
W1 April
W4 March
W1 April
March 14th
March 24th
1
Peak new
cases date
W1 May
W3 May
W3 May
W1 May
W3 May
W4 March
W1 May
W3 May
W1 May
W3 June
February 13th
W4 May
W3 April
W4 March
W1 June
W2 May
W1 May
W3 April
W4 April
W4 April
2Short
potential
lockdown
end date
W2 June(earliest states)
W3 June
W1 July
W4 June
W2 June
W1 June
W2 June
W2 June
W4 June
W4 June
March 25th
W4 June
W2 June
W1 June
W4 June
W4 June
W4 June
W1 July
W1 June
W3 June
3
Source: John Hopkins University (Coronavirus Resource Center), Euromonitor, BCG Analysis
Long
potential
lockdown
end date
W3 July(earliest states)
W4 July
W2 August
W4 July
W4 July
W3 June
W1 July
W4 July
W4 July
W2 September
April 8th
W4 August
W1 July
W3 June
W4 August
W4 July
W3 July
W3 July
W3 July
W1 July
4
As of March 25th
7 Copyrig
ht
© 2
020
by B
ost
on C
onsu
ltin
g G
roup. All
rig
hts
rese
rved.
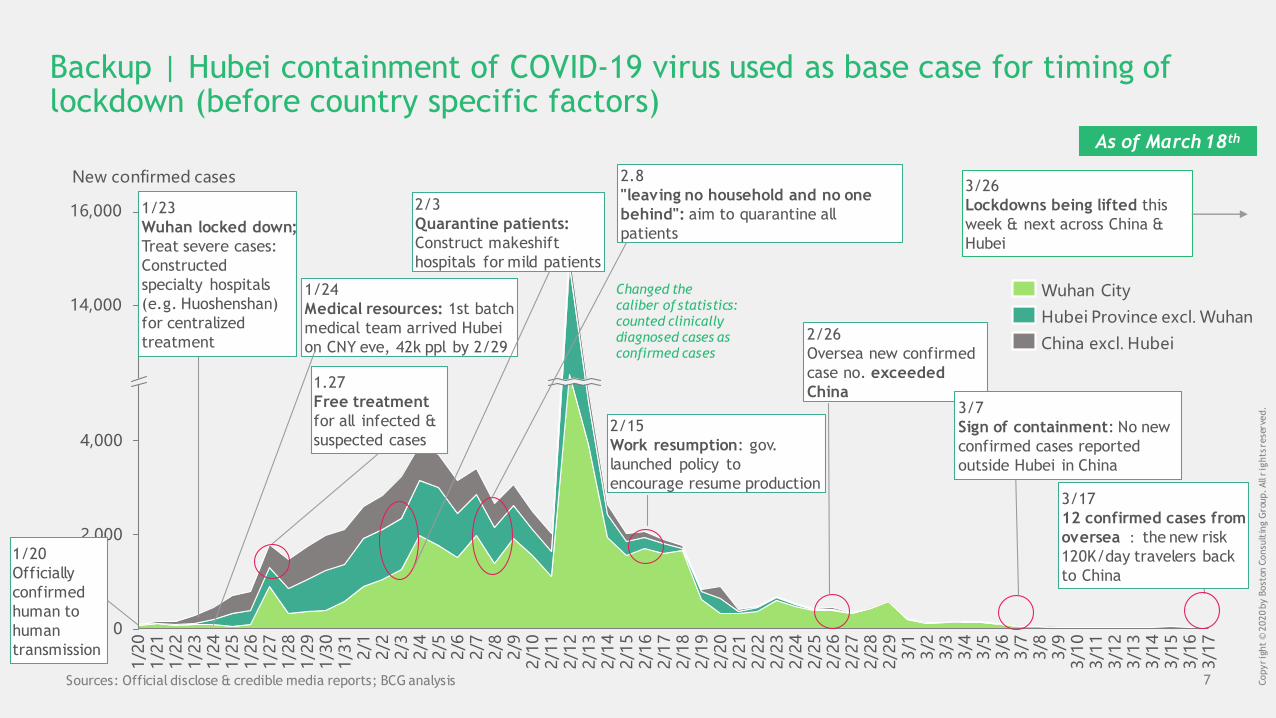
Backup | Hubei containment of COVID-19 virus used as base case for timing of lockdown (before country specific factors)
2/15
Work resumption: gov.
launched policy to
encourage resume production
4,000
0
2,000
14,000
16,000
2/2
3
2/2
1/2
4
1/2
2
3/1
5
2/1
0
3/1
7
2/1
6
1/3
1
2/2
4
New confirmed cases
1/2
01
/21
1/2
3
1/2
51
/26
1/2
7
2/2
7
1/2
8
2/2
9
2/1
9
1/2
9
2/2
5
1/3
0
3/2
2/1
2/3
2/4
2/1
2
2/9
2/5
2/2
2
2/6
2/1
8
2/7
2/8
3/4
2/1
1
2/1
32
/14
2/2
8
3/6
2/1
5
2/1
7
2/2
02
/21
2/2
6
3/1
3/3
3/5
3/7
3/8
3/9
3/1
03
/11
3/1
23
/13
3/1
4
3/1
6
2/26
Oversea new confirmed
case no. exceeded
China
1/24
Medical resources: 1st batch
medical team arrived Hubei
on CNY eve, 42k ppl by 2/29 China excl. Hubei
Hubei Province excl. Wuhan
Wuhan City
2/3
Quarantine patients:
Construct makeshift
hospitals for mild patients
1.27
Free treatment
for all infected &
suspected cases
1/20
Officially
confirmed
human to
human
transmission
2.8
"leaving no household and no one
behind": aim to quarantine all
patients
Changed the caliber of statistics: counted clinically diagnosed cases as confirmed cases
3/7
Sign of containment: No new
confirmed cases reported
outside Hubei in China
Sources: Official disclose & credible media reports; BCG analysis
1/23
Wuhan locked down;
Treat severe cases:
Constructed
specialty hospitals
(e.g. Huoshenshan)
for centralized
treatment
As of March 18th
3/26
Lockdowns being lifted this
week & next across China &
Hubei
3/17
12 confirmed cases from
oversea : the new risk
120K/day travelers back
to China
8
Detail of epidemic scenarios by country
9 Copyrig
ht
© 2
020
by B
ost
on C
onsu
ltin
g G
roup. All
rig
hts
rese
rved.
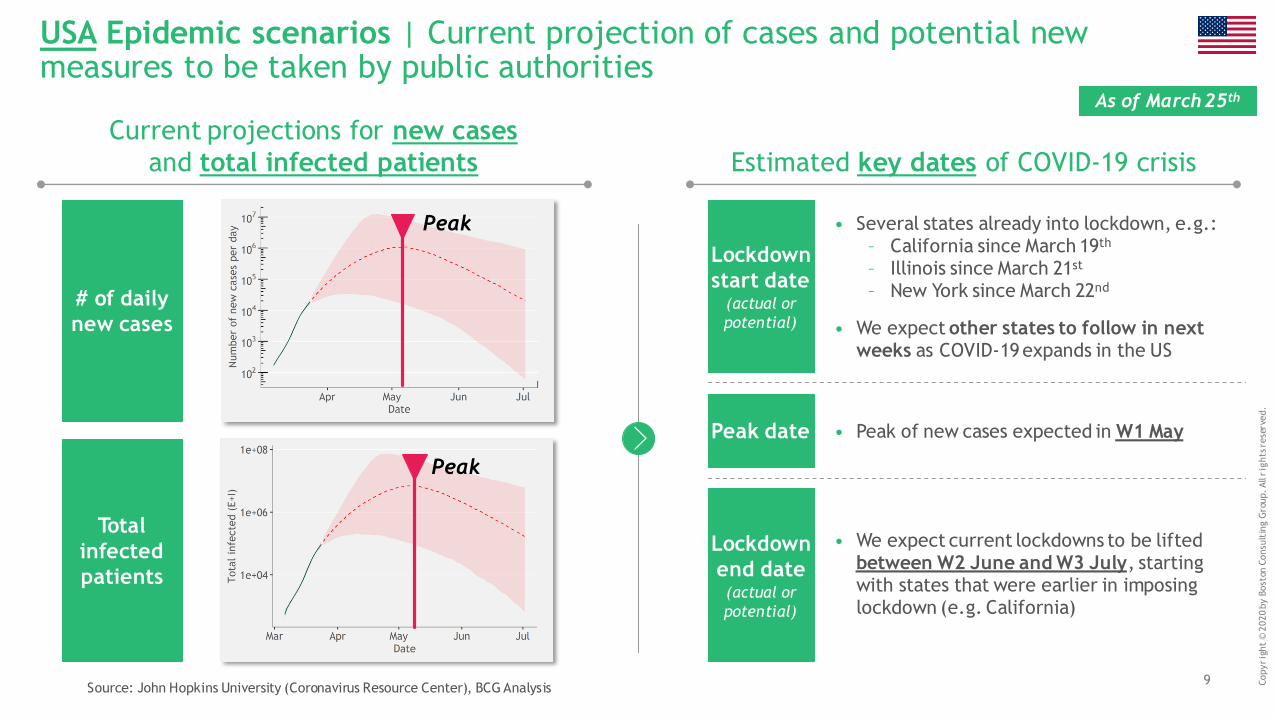
USA Epidemic scenarios | Current projection of cases and potential new measures to be taken by public authorities
• Peak of new cases expected in W1 May
Current projections for new cases
and total infected patients Estimated key dates of COVID-19 crisis
# of daily
new cases
Total
infected
patients
As of March 25th
Source: John Hopkins University (Coronavirus Resource Center), BCG Analysis
Lockdown
start date(actual or
potential)
Peak date
Lockdown
end date(actual or
potential)
• Several states already into lockdown, e.g.:– California since March 19th
– Illinois since March 21st
– New York since March 22nd
• We expect other states to follow in next weeks as COVID-19 expands in the US
Peak
Peak
• We expect current lockdowns to be liftedbetween W2 June and W3 July, starting with states that were earlier in imposing lockdown (e.g. California)
10 Copyrig
ht
© 2
020
by B
ost
on C
onsu
ltin
g G
roup. All
rig
hts
rese
rved.
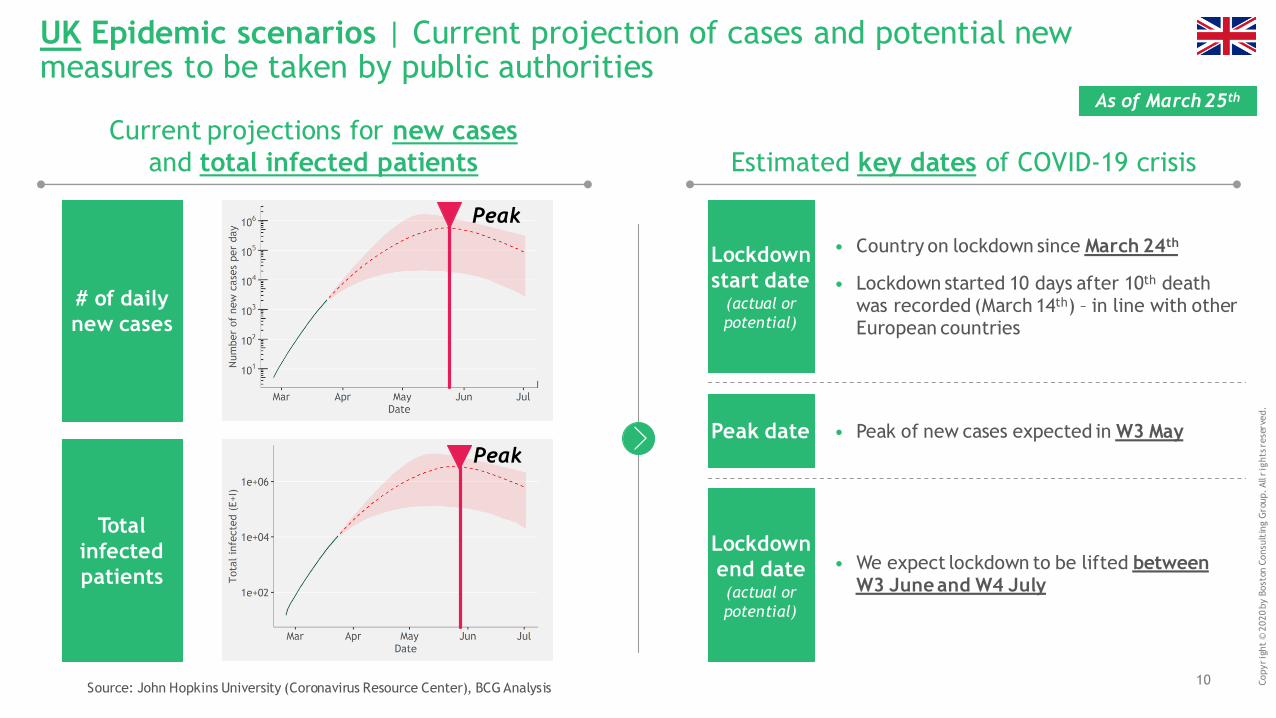
UK Epidemic scenarios | Current projection of cases and potential new measures to be taken by public authorities
• Peak of new cases expected in W3 May
Peak
Peak
• Country on lockdown since March 24th
• Lockdown started 10 days after 10th death was recorded (March 14th) – in line with other European countries
• We expect lockdown to be lifted between W3 June and W4 July
Source: John Hopkins University (Coronavirus Resource Center), BCG Analysis
Current projections for new cases
and total infected patients Estimated key dates of COVID-19 crisis
# of daily
new cases
Total
infected
patients
As of March 25th
Lockdown
start date(actual or
potential)
Peak date
Lockdown
end date(actual or
potential)
11 Copyrig
ht
© 2
020
by B
ost
on C
onsu
ltin
g G
roup. All
rig
hts
rese
rved.
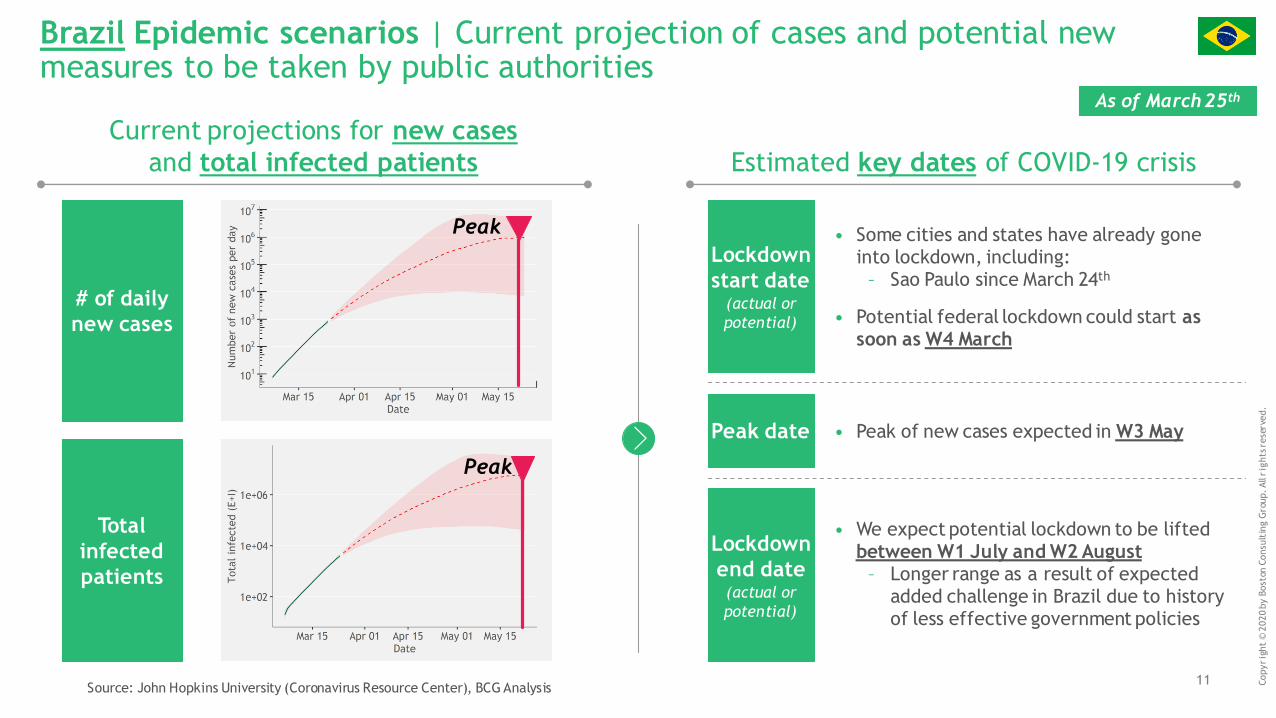
Brazil Epidemic scenarios | Current projection of cases and potential new measures to be taken by public authorities
• Peak of new cases expected in W3 May
• Some cities and states have already gone into lockdown, including:
– Sao Paulo since March 24th
• Potential federal lockdown could start as soon as W4 March
Peak
Peak
• We expect potential lockdown to be lifted between W1 July and W2 August
– Longer range as a result of expected added challenge in Brazil due to history of less effective government policies
Source: John Hopkins University (Coronavirus Resource Center), BCG Analysis
Current projections for new cases
and total infected patients Estimated key dates of COVID-19 crisis
# of daily
new cases
Total
infected
patients
As of March 25th
Lockdown
start date(actual or
potential)
Peak date
Lockdown
end date(actual or
potential)
12 Copyrig
ht
© 2
020
by B
ost
on C
onsu
ltin
g G
roup. All
rig
hts
rese
rved.
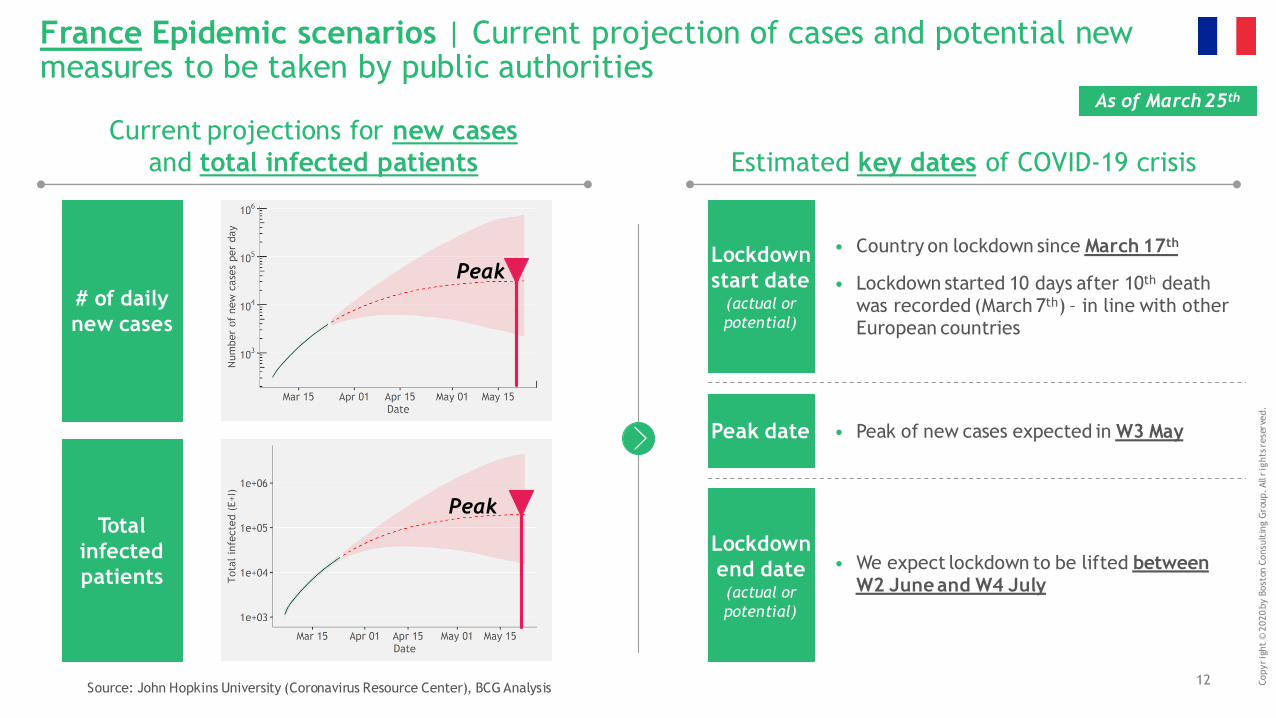
France Epidemic scenarios | Current projection of cases and potential new measures to be taken by public authorities
Peak
Peak
• Peak of new cases expected in W3 May
• Country on lockdown since March 17th
• Lockdown started 10 days after 10th death was recorded (March 7th) – in line with other European countries
• We expect lockdown to be lifted between W2 June and W4 July
Source: John Hopkins University (Coronavirus Resource Center), BCG Analysis
Current projections for new cases
and total infected patients Estimated key dates of COVID-19 crisis
# of daily
new cases
Total
infected
patients
As of March 25th
Lockdown
start date(actual or
potential)
Peak date
Lockdown
end date(actual or
potential)
13 Copyrig
ht
© 2
020
by B
ost
on C
onsu
ltin
g G
roup. All
rig
hts
rese
rved.
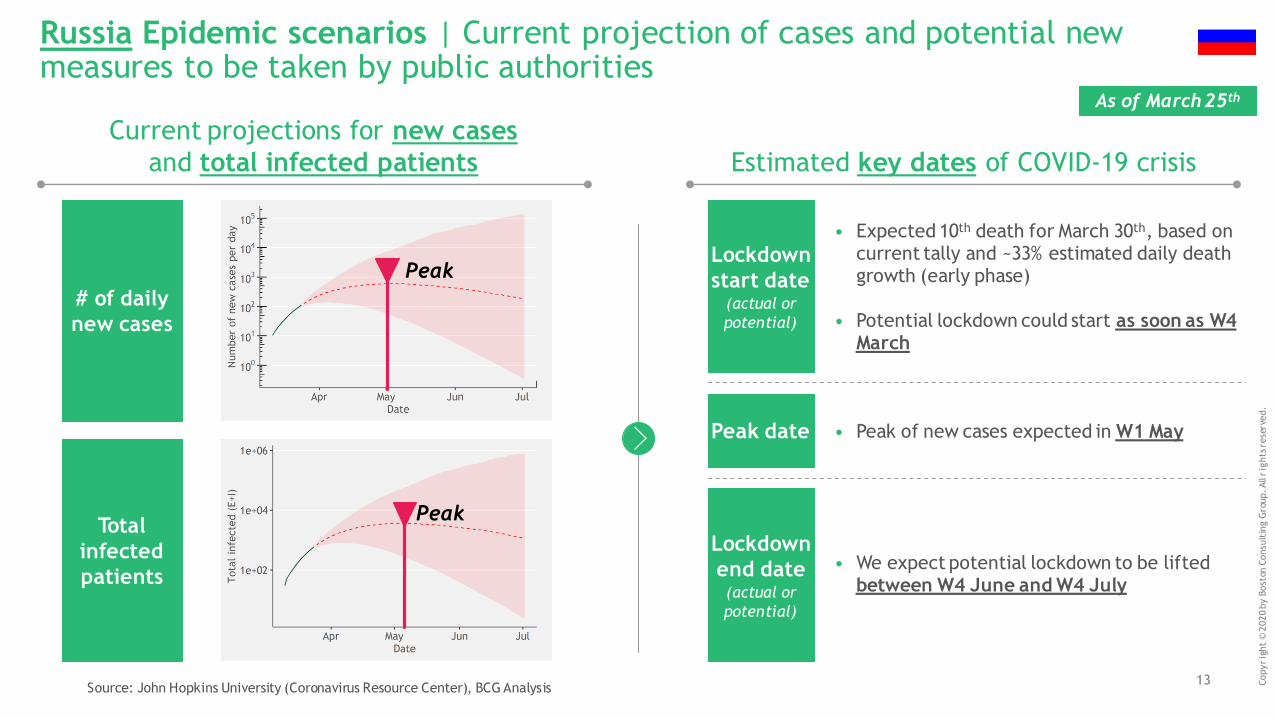
Russia Epidemic scenarios | Current projection of cases and potential new measures to be taken by public authorities
• Peak of new cases expected in W1 May
Peak
Peak
• Expected 10th death for March 30th, based on current tally and ~33% estimated daily death growth (early phase)
• Potential lockdown could start as soon as W4 March
• We expect potential lockdown to be lifted between W4 June and W4 July
Source: John Hopkins University (Coronavirus Resource Center), BCG Analysis
Current projections for new cases
and total infected patients Estimated key dates of COVID-19 crisis
# of daily
new cases
Total
infected
patients
As of March 25th
Lockdown
start date(actual or
potential)
Peak date
Lockdown
end date(actual or
potential)
14 Copyrig
ht
© 2
020
by B
ost
on C
onsu
ltin
g G
roup. All
rig
hts
rese
rved.
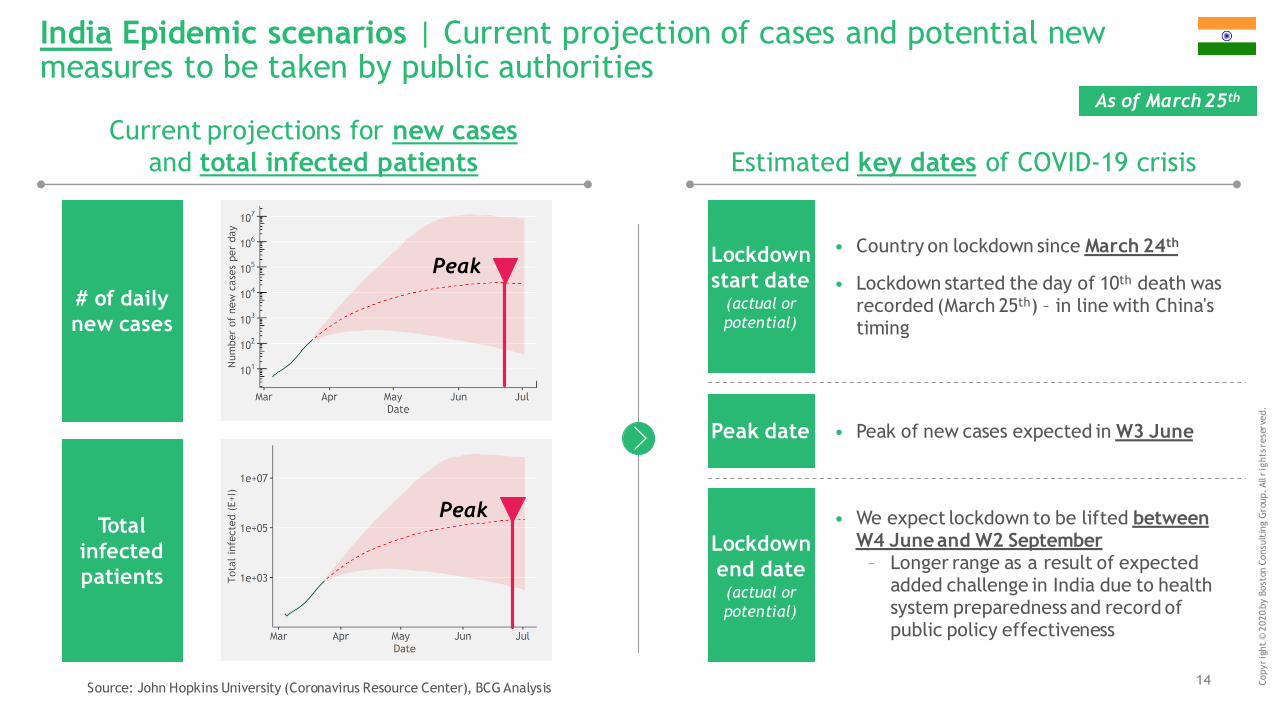
India Epidemic scenarios | Current projection of cases and potential new measures to be taken by public authorities
• Peak of new cases expected in W3 June
• Country on lockdown since March 24th
• Lockdown started the day of 10th death was recorded (March 25th) – in line with China's timing
Peak
Peak • We expect lockdown to be lifted between W4 June and W2 September
– Longer range as a result of expected added challenge in India due to health system preparedness and record of public policy effectiveness
Source: John Hopkins University (Coronavirus Resource Center), BCG Analysis
Current projections for new cases
and total infected patients Estimated key dates of COVID-19 crisis
# of daily
new cases
Total
infected
patients
As of March 25th
Lockdown
start date(actual or
potential)
Peak date
Lockdown
end date(actual or
potential)
15 Copyrig
ht
© 2
020
by B
ost
on C
onsu
ltin
g G
roup. All
rig
hts
rese
rved.
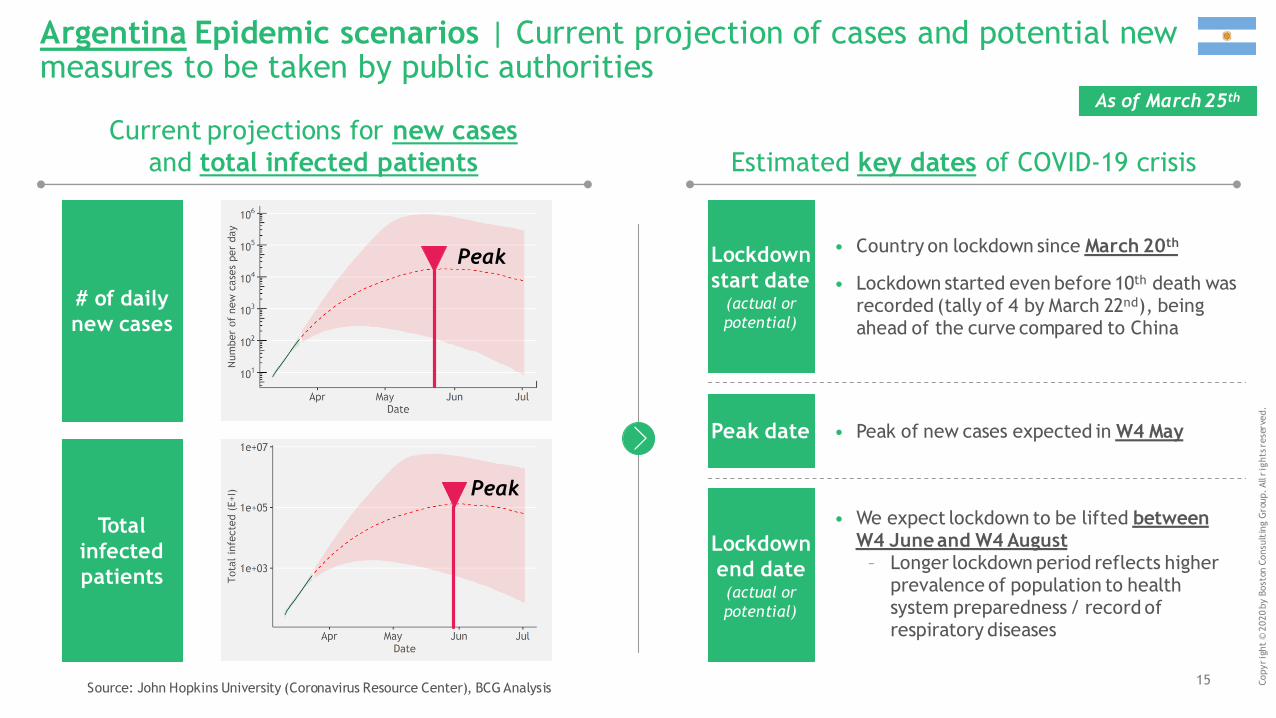
Argentina Epidemic scenarios | Current projection of cases and potential new measures to be taken by public authorities
• Peak of new cases expected in W4 May
Peak
Peak
• Country on lockdown since March 20th
• Lockdown started even before 10th death was recorded (tally of 4 by March 22nd), being ahead of the curve compared to China
• We expect lockdown to be lifted between W4 June and W4 August
– Longer lockdown period reflects higher prevalence of population to health system preparedness / record of respiratory diseases
Source: John Hopkins University (Coronavirus Resource Center), BCG Analysis
Current projections for new cases
and total infected patients Estimated key dates of COVID-19 crisis
# of daily
new cases
Total
infected
patients
As of March 25th
Lockdown
start date(actual or
potential)
Peak date
Lockdown
end date(actual or
potential)
16 Copyrig
ht
© 2
020
by B
ost
on C
onsu
ltin
g G
roup. All
rig
hts
rese
rved.
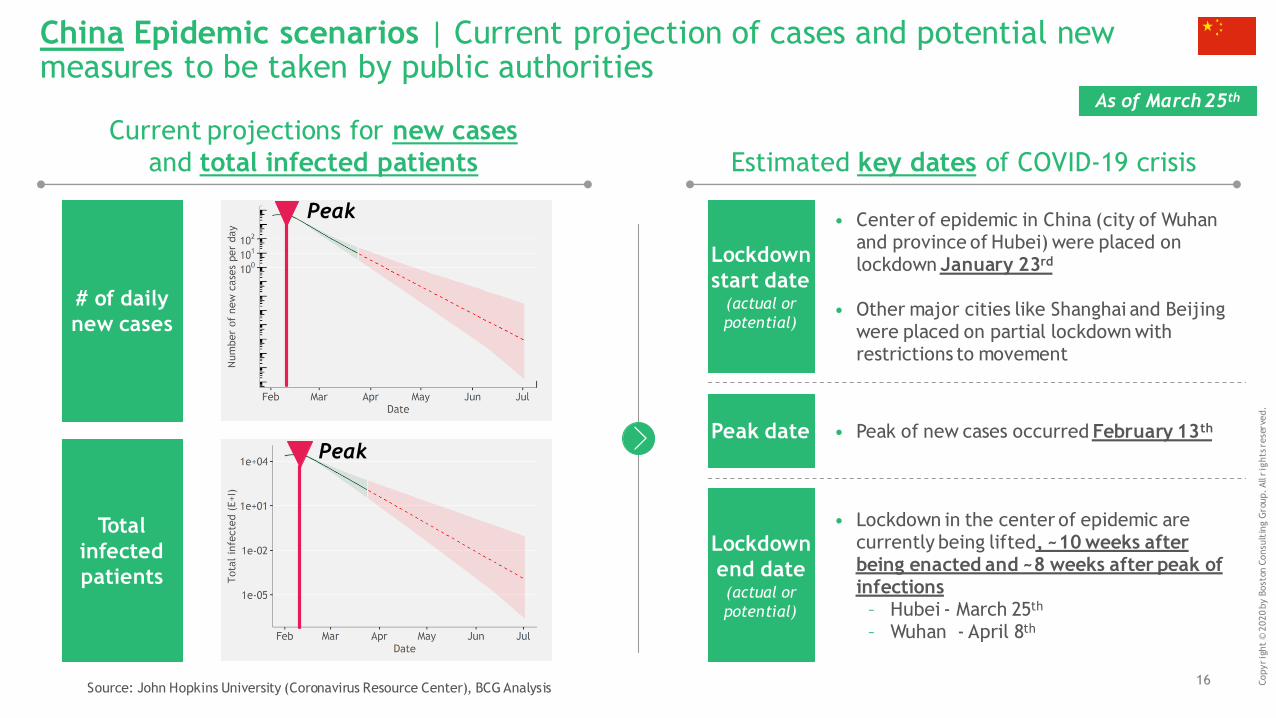
China Epidemic scenarios | Current projection of cases and potential new measures to be taken by public authorities
• Center of epidemic in China (city of Wuhan and province of Hubei) were placed on lockdown January 23rd
• Other major cities like Shanghai and Beijing were placed on partial lockdown with restrictions to movement
Peak
Peak
• Lockdown in the center of epidemic are currently being lifted, ~10 weeks after being enacted and ~8 weeks after peak of infections
– Hubei - March 25th
– Wuhan - April 8th
Source: John Hopkins University (Coronavirus Resource Center), BCG Analysis
• Peak of new cases occurred February 13th
Current projections for new cases
and total infected patients Estimated key dates of COVID-19 crisis
# of daily
new cases
Total
infected
patients
As of March 25th
Lockdown
start date(actual or
potential)
Peak date
Lockdown
end date(actual or
potential)
17 Copyrig
ht
© 2
020
by B
ost
on C
onsu
ltin
g G
roup. All
rig
hts
rese
rved.
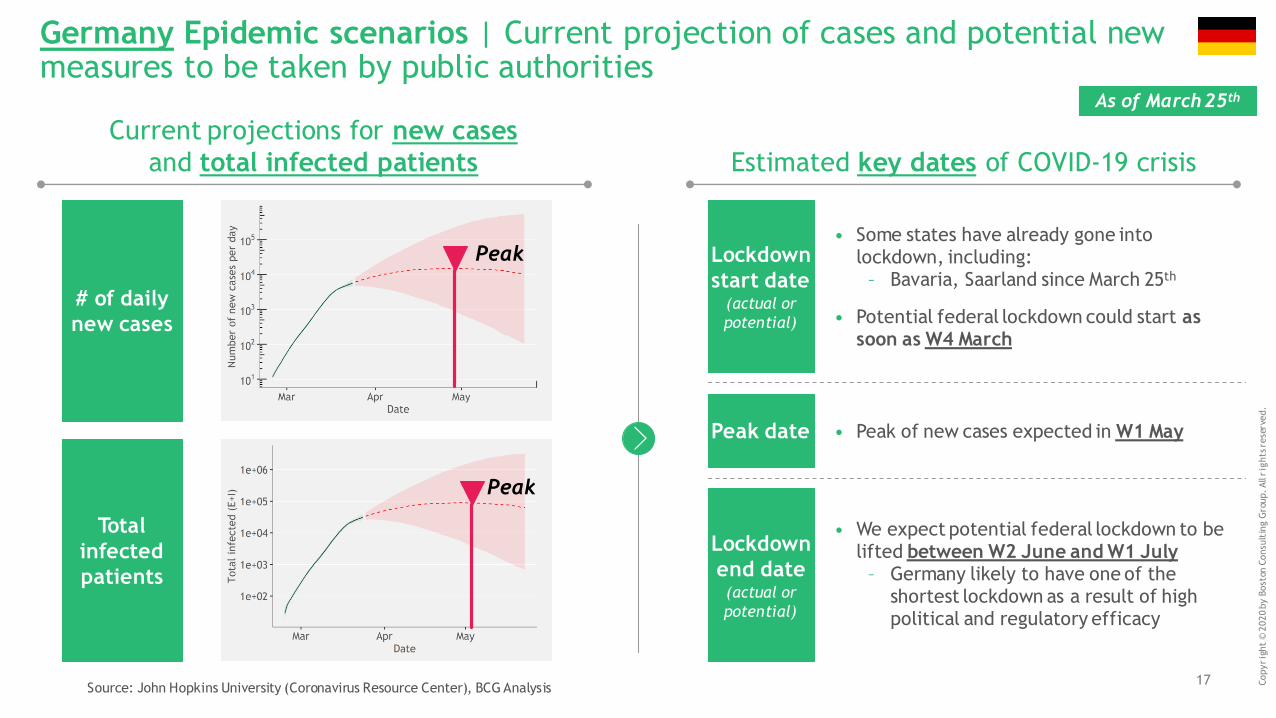
Germany Epidemic scenarios | Current projection of cases and potential new measures to be taken by public authorities
• Peak of new cases expected in W1 May
Peak
Peak
• Some states have already gone into lockdown, including:
– Bavaria, Saarland since March 25th
• Potential federal lockdown could start as soon as W4 March
• We expect potential federal lockdown to be lifted between W2 June and W1 July
– Germany likely to have one of the shortest lockdown as a result of high political and regulatory efficacy
Source: John Hopkins University (Coronavirus Resource Center), BCG Analysis
Current projections for new cases
and total infected patients Estimated key dates of COVID-19 crisis
# of daily
new cases
Total
infected
patients
As of March 25th
Lockdown
start date(actual or
potential)
Peak date
Lockdown
end date(actual or
potential)
18 Copyrig
ht
© 2
020
by B
ost
on C
onsu
ltin
g G
roup. All
rig
hts
rese
rved.
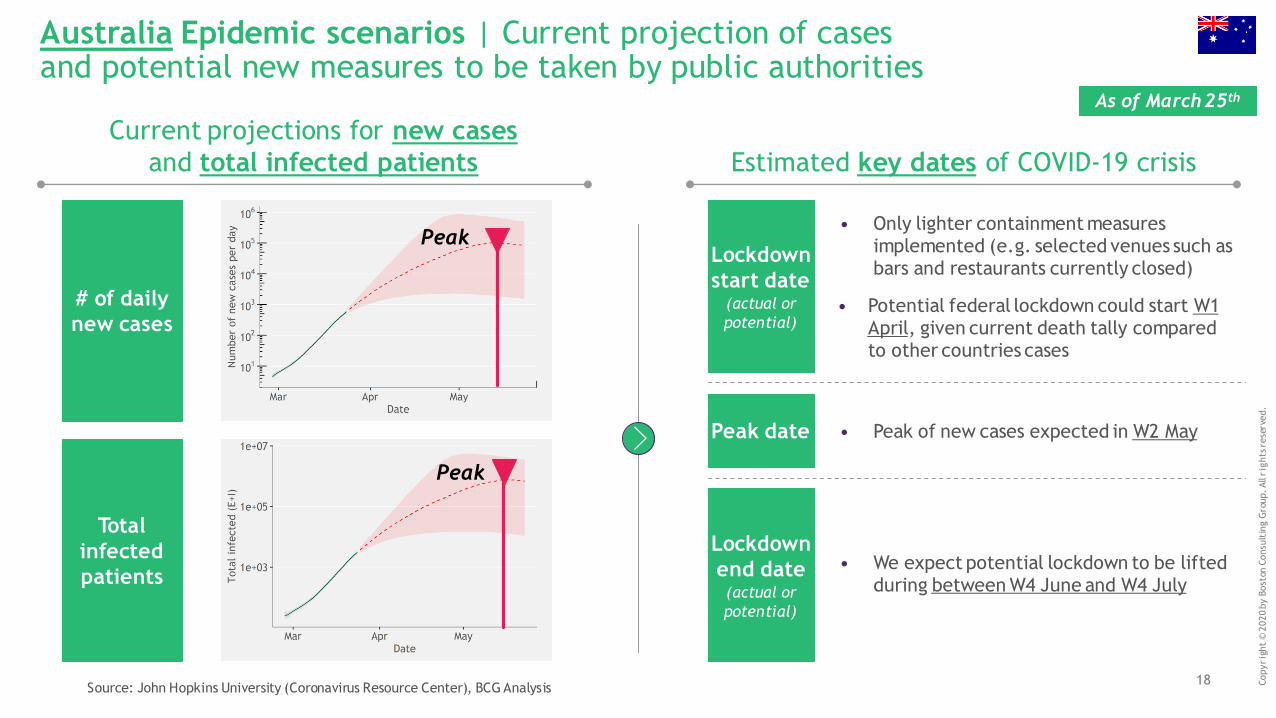
Australia Epidemic scenarios | Current projection of cases and potential new measures to be taken by public authorities
• Peak of new cases expected in W2 May
Peak
Peak
• Only lighter containment measures implemented (e.g. selected venues such as bars and restaurants currently closed)
• Potential federal lockdown could start W1 April, given current death tally compared to other countries cases
• We expect potential lockdown to be lifted during between W4 June and W4 July
Source: John Hopkins University (Coronavirus Resource Center), BCG Analysis
Current projections for new cases
and total infected patients Estimated key dates of COVID-19 crisis
# of daily
new cases
Total
infected
patients
As of March 25th
Lockdown
start date(actual or
potential)
Peak date
Lockdown
end date(actual or
potential)
19 Copyrig
ht
© 2
020
by B
ost
on C
onsu
ltin
g G
roup. All
rig
hts
rese
rved.
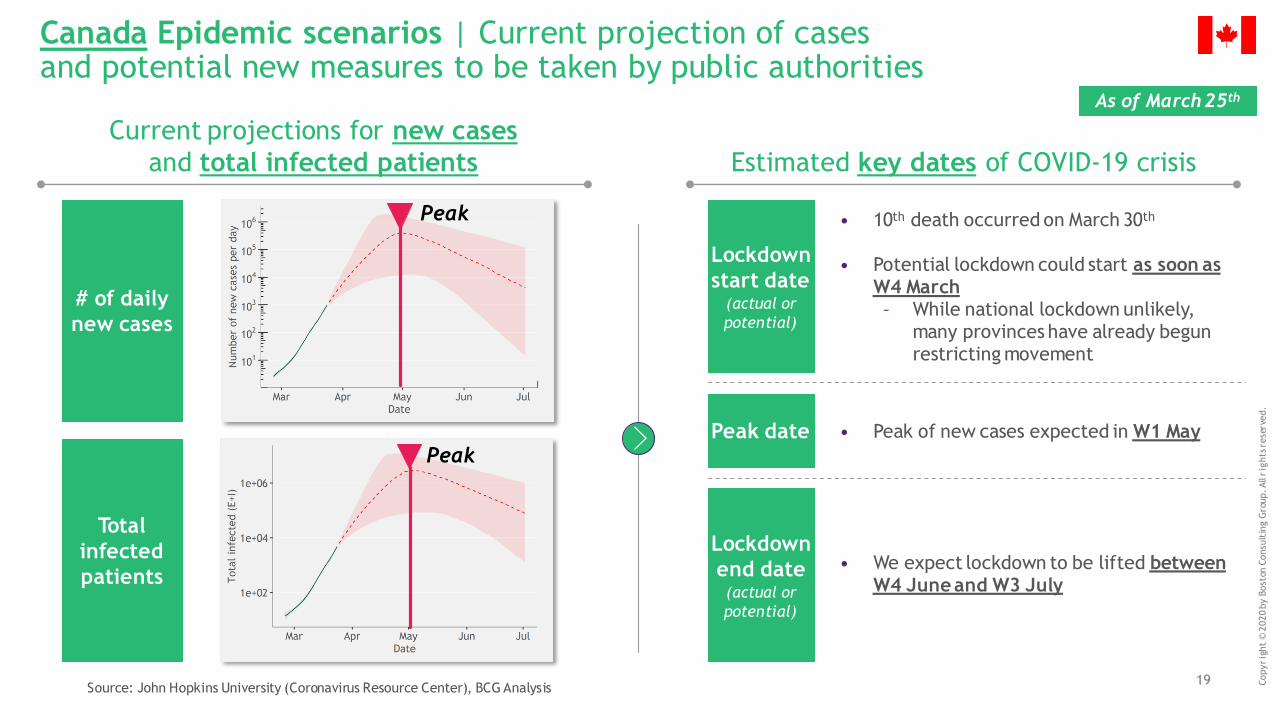
Canada Epidemic scenarios | Current projection of cases and potential new measures to be taken by public authorities
Peak
Peak
• We expect lockdown to be lifted betweenW4 June and W3 July
• Peak of new cases expected in W1 May
• 10th death occurred on March 30th
• Potential lockdown could start as soon as W4 March– While national lockdown unlikely,
many provinces have already begun restricting movement
Source: John Hopkins University (Coronavirus Resource Center), BCG Analysis
Current projections for new cases
and total infected patients Estimated key dates of COVID-19 crisis
# of daily
new cases
Total
infected
patients
As of March 25th
Lockdown
start date(actual or
potential)
Peak date
Lockdown
end date(actual or
potential)
20 Copyrig
ht
© 2
020
by B
ost
on C
onsu
ltin
g G
roup. All
rig
hts
rese
rved.
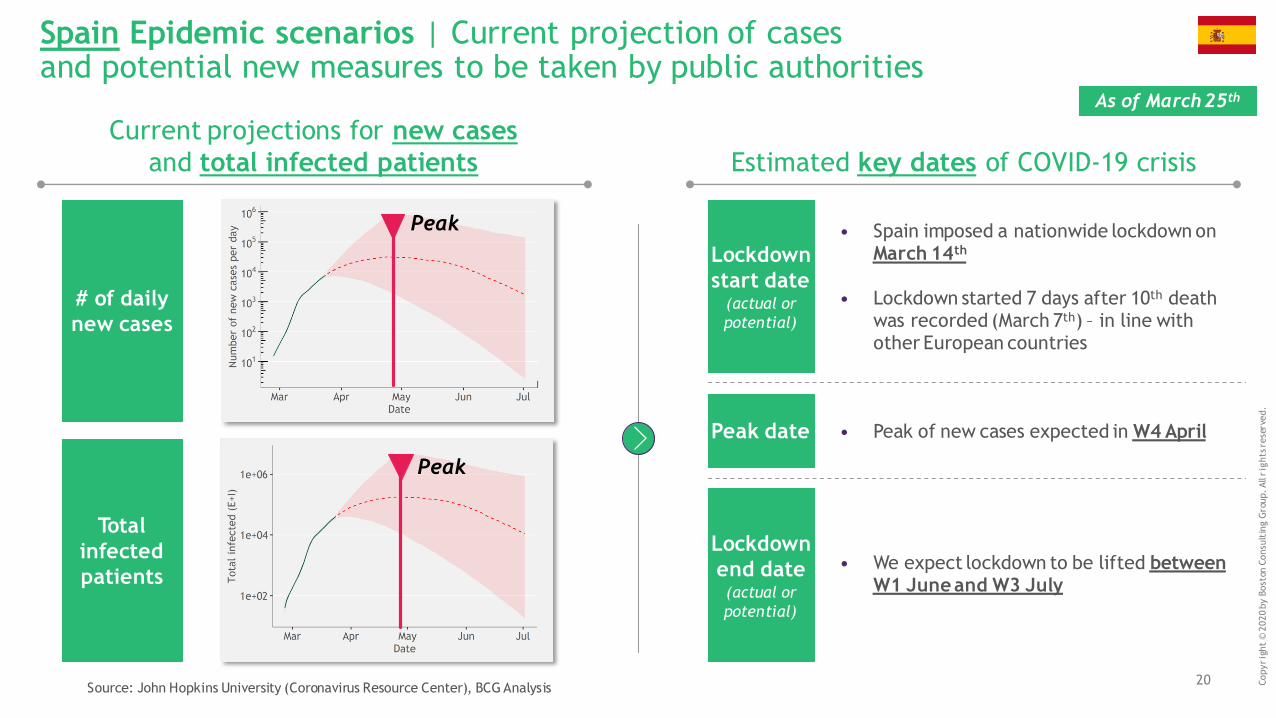
Spain Epidemic scenarios | Current projection of cases and potential new measures to be taken by public authorities
• Peak of new cases expected in W4 April
• Spain imposed a nationwide lockdown on March 14th
• Lockdown started 7 days after 10th death was recorded (March 7th) – in line with other European countries
Peak
Peak
• We expect lockdown to be lifted betweenW1 June and W3 July
Source: John Hopkins University (Coronavirus Resource Center), BCG Analysis
Current projections for new cases
and total infected patients Estimated key dates of COVID-19 crisis
# of daily
new cases
Total
infected
patients
As of March 25th
Lockdown
start date(actual or
potential)
Peak date
Lockdown
end date(actual or
potential)
21 Copyrig
ht
© 2
020
by B
ost
on C
onsu
ltin
g G
roup. All
rig
hts
rese
rved.
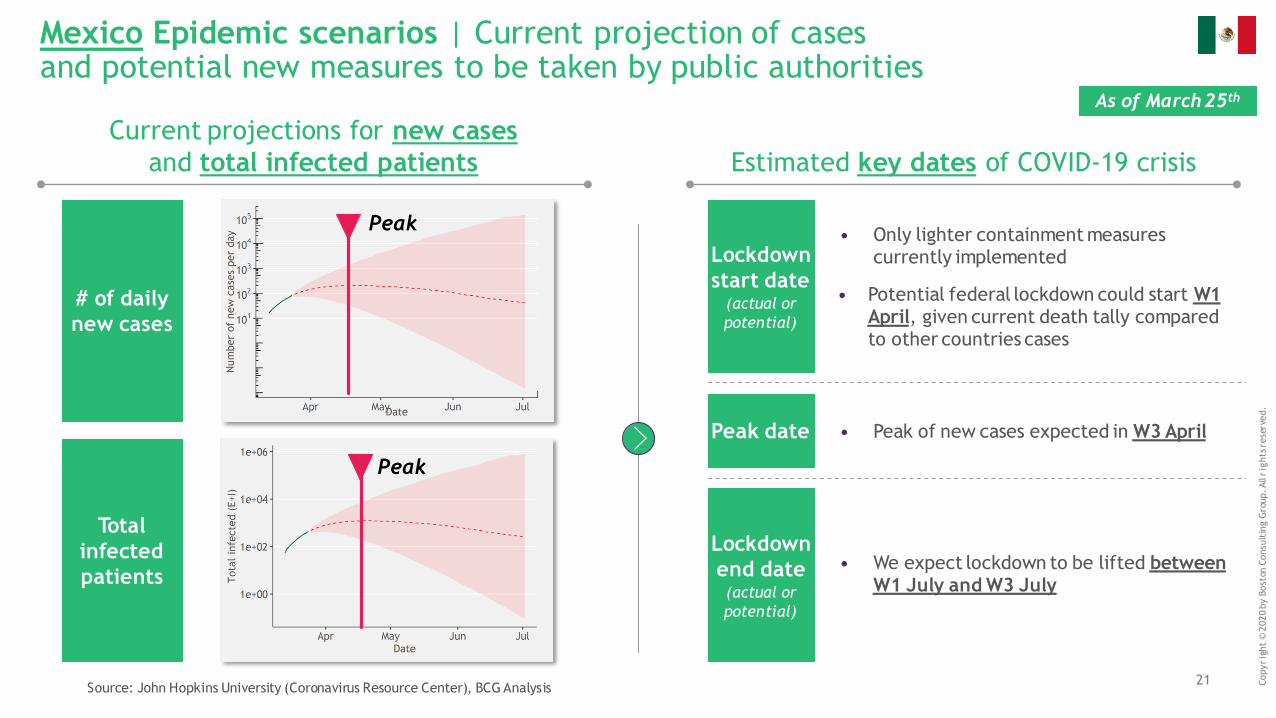
• We expect lockdown to be lifted betweenW1 July and W3 July
Mexico Epidemic scenarios | Current projection of cases and potential new measures to be taken by public authorities
• Peak of new cases expected in W3 April
As of March 25th
• Only lighter containment measures currently implemented
• Potential federal lockdown could start W1 April, given current death tally compared to other countries cases
Peak
Peak
Source: John Hopkins University (Coronavirus Resource Center), BCG Analysis
Current projections for new cases
and total infected patients Estimated key dates of COVID-19 crisis
# of daily
new cases
Total
infected
patients
As of March 25th
Lockdown
start date(actual or
potential)
Peak date
Lockdown
end date(actual or
potential)
22 Copyrig
ht
© 2
020
by B
ost
on C
onsu
ltin
g G
roup. All
rig
hts
rese
rved.
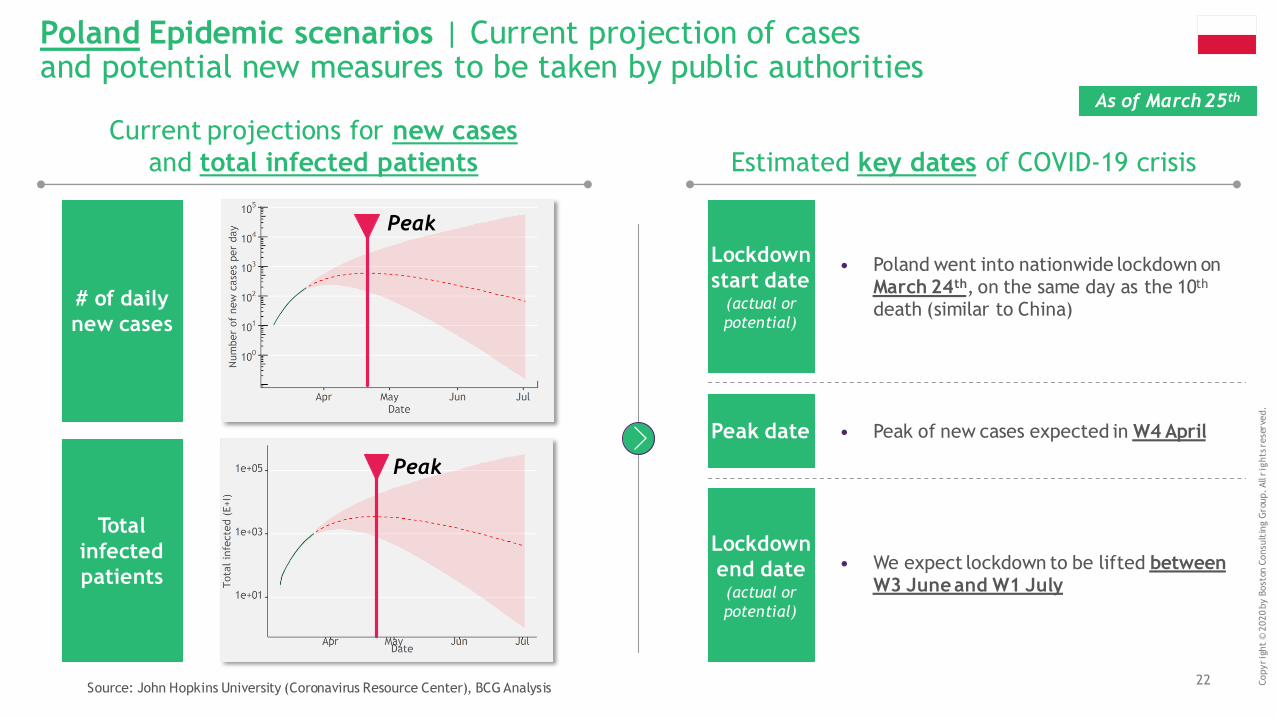
• We expect lockdown to be lifted between W3 June and W1 July
Poland Epidemic scenarios | Current projection of cases and potential new measures to be taken by public authorities
• Peak of new cases expected in W4 April
• Poland went into nationwide lockdown on March 24th, on the same day as the 10th
death (similar to China)
Peak
Peak
Source: John Hopkins University (Coronavirus Resource Center), BCG Analysis
Current projections for new cases
and total infected patients Estimated key dates of COVID-19 crisis
# of daily
new cases
Total
infected
patients
As of March 25th
Lockdown
start date(actual or
potential)
Peak date
Lockdown
end date(actual or
potential)

23 Copyrig
ht
© 2
020
by B
ost
on C
onsu
ltin
g G
roup. All
rig
hts
rese
rved.
• We expect lockdown to be lifted between W2 June and W4 July
Belgium Epidemic scenarios | Current projection of cases and potential new measures to be taken by public authorities
• Peak of new cases expected in W3 May
• Belgium went into nationwide lockdown on March 17th, on the same day as the 10th death (similar to China)
Peak
Peak
Source: John Hopkins University (Coronavirus Resource Center), BCG Analysis
Current projections for new cases
and total infected patients Estimated key dates of COVID-19 crisis
# of daily
new cases
Total
infected
patients
As of March 25th
Lockdown
start date(actual or
potential)
Peak date
Lockdown
end date(actual or
potential)
24 Copyrig
ht
© 2
020
by B
ost
on C
onsu
ltin
g G
roup. All
rig
hts
rese
rved.
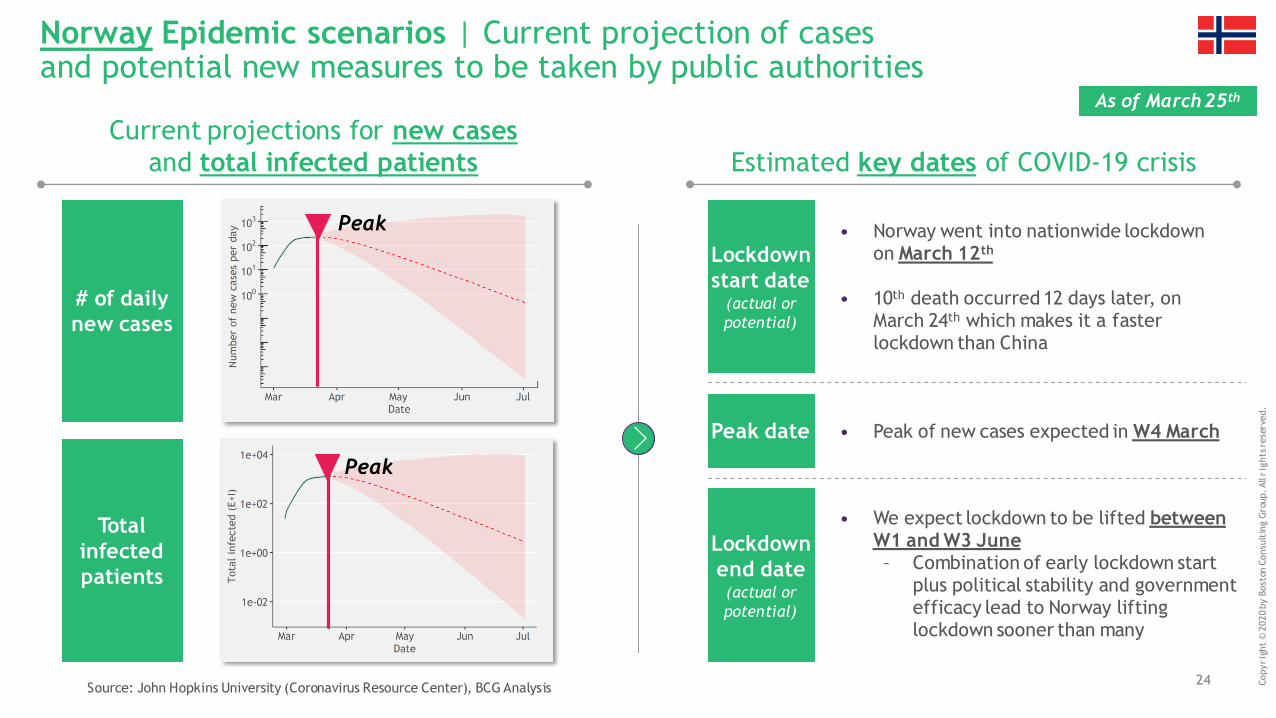
Norway Epidemic scenarios | Current projection of cases and potential new measures to be taken by public authorities
• Peak of new cases expected in W4 March
• Norway went into nationwide lockdown on March 12th
• 10th death occurred 12 days later, on March 24th which makes it a faster lockdown than China
Peak
Peak
• We expect lockdown to be lifted between W1 and W3 June– Combination of early lockdown start
plus political stability and government efficacy lead to Norway lifting lockdown sooner than many
Source: John Hopkins University (Coronavirus Resource Center), BCG Analysis
Current projections for new cases
and total infected patients Estimated key dates of COVID-19 crisis
# of daily
new cases
Total
infected
patients
As of March 25th
Lockdown
start date(actual or
potential)
Peak date
Lockdown
end date(actual or
potential)
25 Copyrig
ht
© 2
020
by B
ost
on C
onsu
ltin
g G
roup. All
rig
hts
rese
rved.
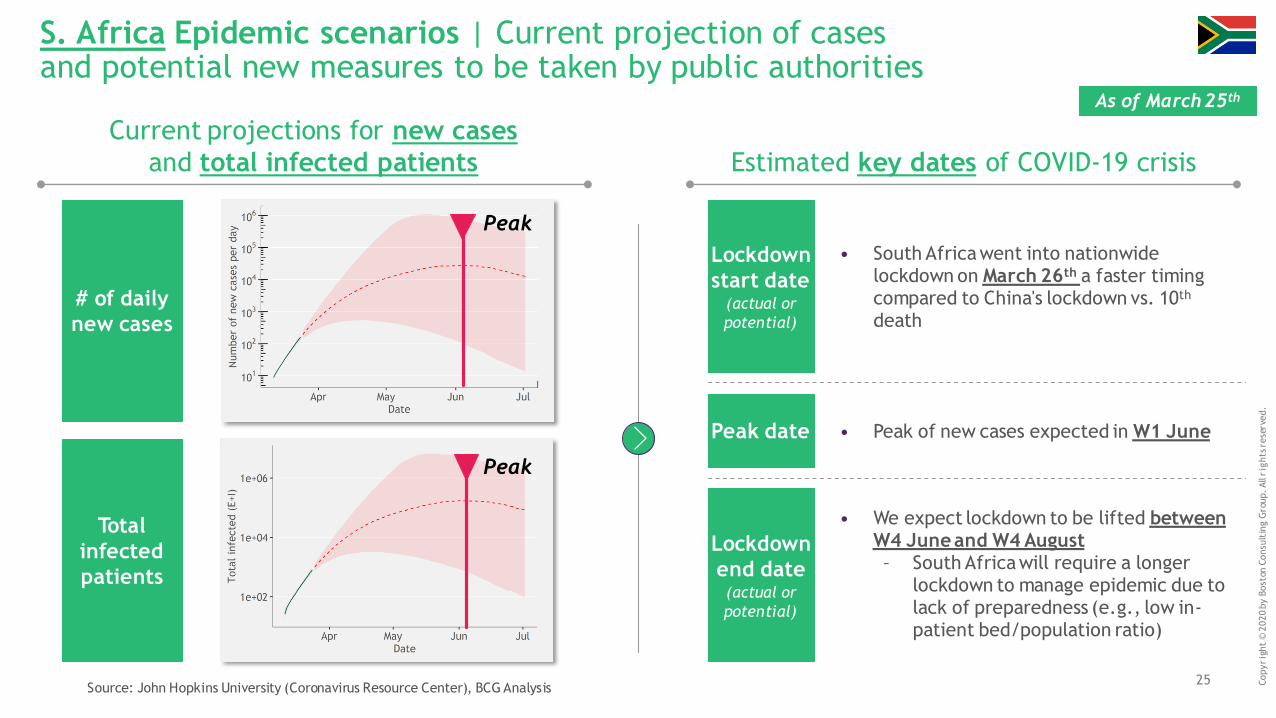
• We expect lockdown to be lifted between W4 June and W4 August– South Africa will require a longer
lockdown to manage epidemic due to lack of preparedness (e.g., low in-patient bed/population ratio)
S. Africa Epidemic scenarios | Current projection of cases and potential new measures to be taken by public authorities
• Peak of new cases expected in W1 June
• South Africa went into nationwide lockdown on March 26th a faster timing compared to China's lockdown vs. 10th
death
Peak
Peak
Source: John Hopkins University (Coronavirus Resource Center), BCG Analysis
Current projections for new cases
and total infected patients Estimated key dates of COVID-19 crisis
# of daily
new cases
Total
infected
patients
As of March 25th
Lockdown
start date(actual or
potential)
Peak date
Lockdown
end date(actual or
potential)
26 Copyrig
ht
© 2
020
by B
ost
on C
onsu
ltin
g G
roup. All
rig
hts
rese
rved.
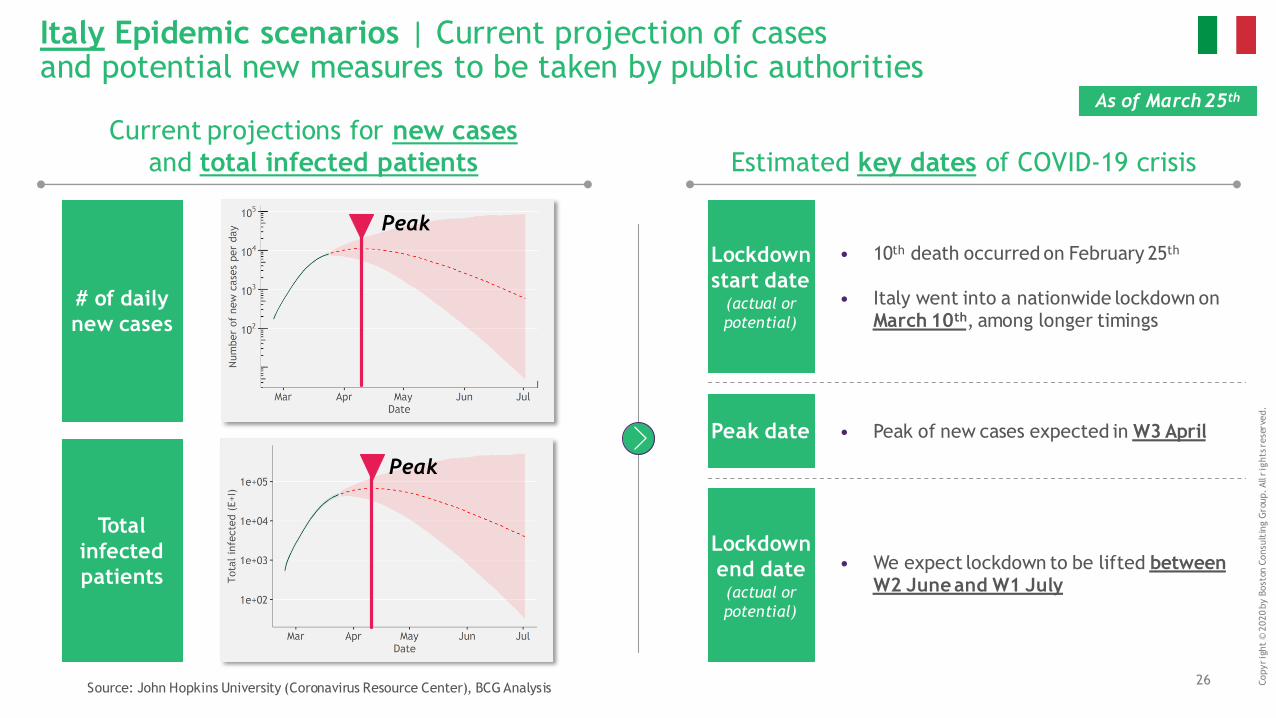
• We expect lockdown to be lifted betweenW2 June and W1 July
Italy Epidemic scenarios | Current projection of cases and potential new measures to be taken by public authorities
• Peak of new cases expected in W3 April
• 10th death occurred on February 25th
• Italy went into a nationwide lockdown on March 10th, among longer timings
Peak
Peak
Source: John Hopkins University (Coronavirus Resource Center), BCG Analysis
Current projections for new cases
and total infected patients Estimated key dates of COVID-19 crisis
# of daily
new cases
Total
infected
patients
As of March 25th
Lockdown
start date(actual or
potential)
Peak date
Lockdown
end date(actual or
potential)
27 Copyrig
ht
© 2
020
by B
ost
on C
onsu
ltin
g G
roup. All
rig
hts
rese
rved.
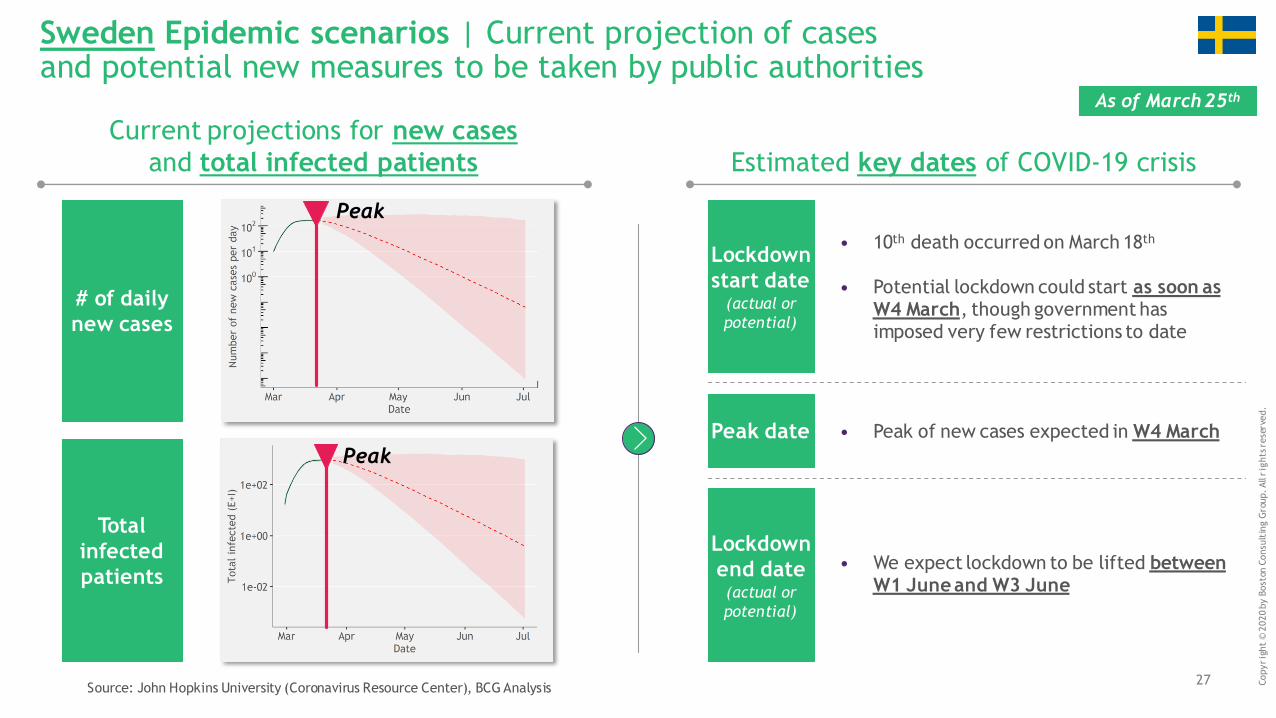
Sweden Epidemic scenarios | Current projection of cases and potential new measures to be taken by public authorities
• Peak of new cases expected in W4 March
• 10th death occurred on March 18th
• Potential lockdown could start as soon as W4 March, though government has imposed very few restrictions to date
Peak
Peak
• We expect lockdown to be lifted between W1 June and W3 June
Source: John Hopkins University (Coronavirus Resource Center), BCG Analysis
Current projections for new cases
and total infected patients Estimated key dates of COVID-19 crisis
# of daily
new cases
Total
infected
patients
As of March 25th
Lockdown
start date(actual or
potential)
Peak date
Lockdown
end date(actual or
potential)
28 Copyrig
ht
© 2
020
by B
ost
on C
onsu
ltin
g G
roup. All
rig
hts
rese
rved.
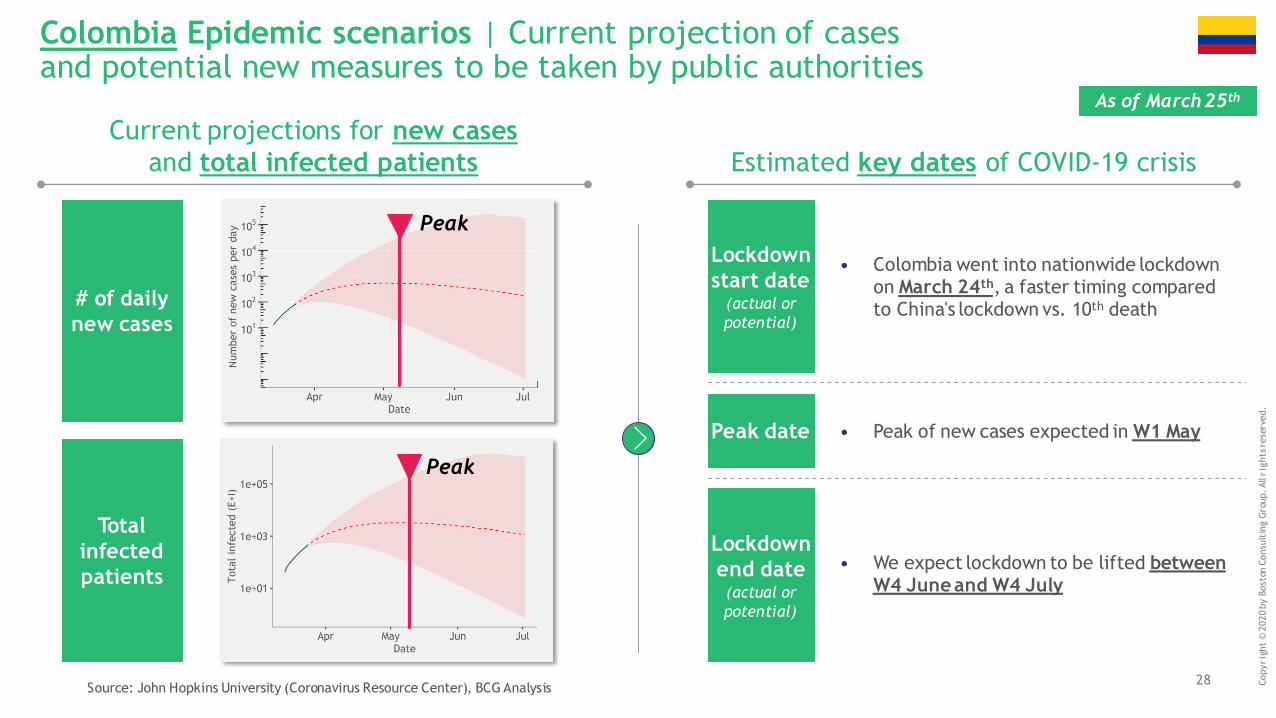
Colombia Epidemic scenarios | Current projection of casesand potential new measures to be taken by public authorities
• Peak of new cases expected in W1 May
• Colombia went into nationwide lockdown on March 24th, a faster timing compared to China's lockdown vs. 10th death
Peak
Peak
• We expect lockdown to be lifted between W4 June and W4 July
Source: John Hopkins University (Coronavirus Resource Center), BCG Analysis
Current projections for new cases
and total infected patients Estimated key dates of COVID-19 crisis
# of daily
new cases
Total
infected
patients
As of March 25th
Lockdown
start date(actual or
potential)
Peak date
Lockdown
end date(actual or
potential)
29 Copyrig
ht
© 2
020
by B
ost
on C
onsu
ltin
g G
roup. All
rig
hts
rese
rved.
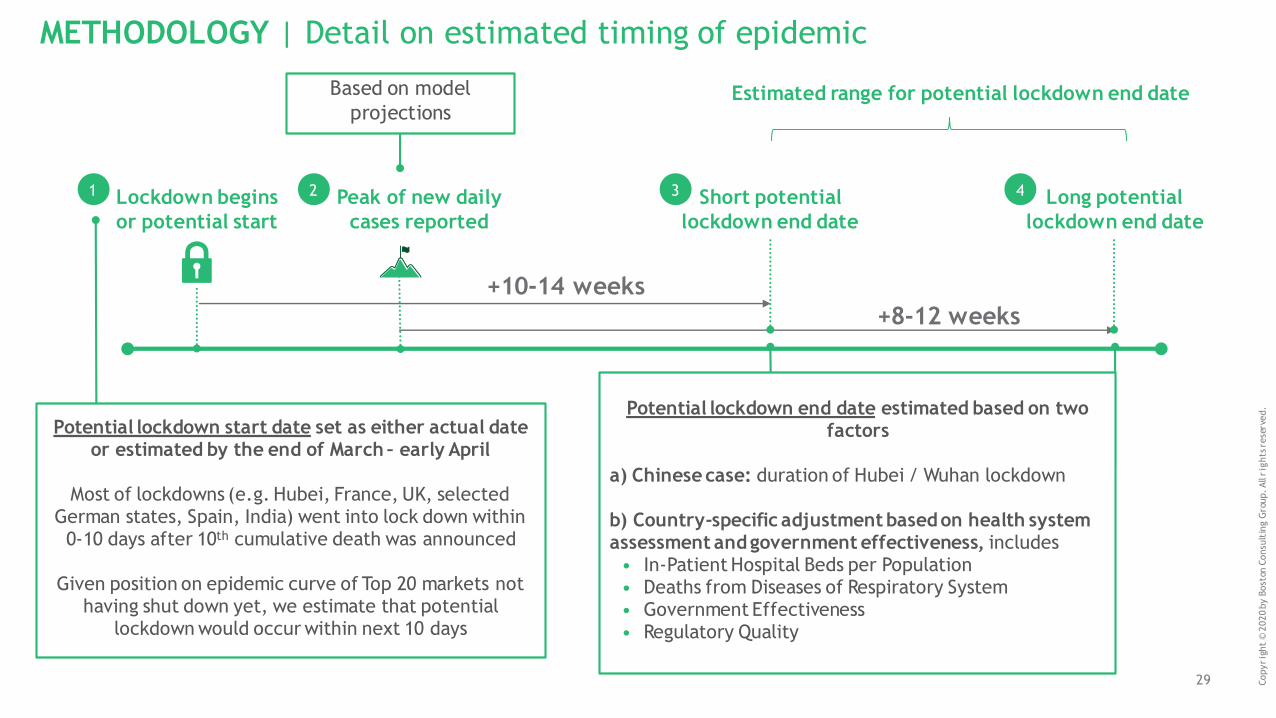
METHODOLOGY | Detail on estimated timing of epidemic
Lockdown begins
or potential start
Peak of new daily
cases reported
+10-14 weeks
+8-12 weeks
Long potential
lockdown end date
Estimated range for potential lockdown end date
Short potential
lockdown end date
Based on model
projections
Potential lockdown start date set as either actual date or estimated by the end of March – early April
Most of lockdowns (e.g. Hubei, France, UK, selected German states, Spain, India) went into lock down within
0-10 days after 10th cumulative death was announced
Given position on epidemic curve of Top 20 markets not having shut down yet, we estimate that potential
lockdown would occur within next 10 days
1 2 3
Potential lockdown end date estimated based on two factors
a) Chinese case: duration of Hubei / Wuhan lockdown
b) Country-specific adjustment based on health system assessment and government effectiveness, includes
• In-Patient Hospital Beds per Population• Deaths from Diseases of Respiratory System• Government Effectiveness• Regulatory Quality
4

30
The services and materials provided by Boston Consulting Group (BCG) are subject to BCG's Standard Terms
(a copy of which is available upon request) or such other agreement as may have been previously executed by BCG.
BCG does not provide legal, accounting, or tax advice. The Client is responsible for obtaining independent advice
concerning these matters. This advice may affect the guidance given by BCG. Further, BCG has made no undertaking
to update these materials after the date hereof, notwithstanding that such information may become outdated
or inaccurate.
The materials contained in this presentation are designed for the sole use by the board of directors or senior
management of the Client and solely for the limited purposes described in the presentation. The materials shall not be
copied or given to any person or entity other than the Client (“Third Party”) without the prior written consent of BCG.
These materials serve only as the focus for discussion; they are incomplete without the accompanying oral commentary
and may not be relied on as a stand-alone document. Further, Third Parties may not, and it is unreasonable for any
Third Party to, rely on these materials for any purpose whatsoever. To the fullest extent permitted by law (and except
to the extent otherwise agreed in a signed writing by BCG), BCG shall have no liability whatsoever to any Third Party,
and any Third Party hereby waives any rights and claims it may have at any time against BCG with regard to the
services, this presentation, or other materials, including the accuracy or completeness thereof. Receipt and review
of this document shall be deemed agreement with and consideration for the foregoing.
BCG does not provide fairness opinions or valuations of market transactions, and these materials should not be relied
on or construed as such. Further, the financial evaluations, projected market and financial information, and conclusions
contained in these materials are based upon standard valuation methodologies, are not definitive forecasts, and are not
guaranteed by BCG. BCG has used public and/or confidential data and assumptions provided to BCG by the Client.
BCG has not independently verified the data and assumptions used in these analyses. Changes in the underlying data
or operating assumptions will clearly impact the analyses and conclusions.
Copyrig
ht
© 2
020
by B
ost
on C
onsu
ltin
g G
roup. All
rig
hts
rese
rved.
31 Copyrig
ht
© 2
020
by B
ost
on C
onsu
ltin
g G
roup. All
rig
hts
rese
rved.
The situation surrounding COVID-19 is dynamic and rapidly evolving, on a daily basis. Although we have taken great care
prior to producing this presentation, it represents BCG’s view at a particular point in time. This presentation is not
intended to: (i) constitute medical or safety advice, nor be a substitute for the same; nor (ii) be seen as a formal
endorsement or recommendation of a particular response. As such you are advised to make your own assessment as to
the appropriate course of action to take, using this presentation as guidance. Please carefully consider local laws and
guidance in your area, particularly the most recent advice issued by your local (and national) health authorities, before
making any decision.

bcg.com


