
EPRI’s Green Transmission Efficiency InitiativeRegional Workshop Series
Southwest RegionSponsored by:
Embassy Suites Outdoor WorldDallas Fort Worth, TexasMay 20, 2009


EPRI’s Green Transmission Efficiency InitiativeRegional Workshop Series
Executive Perspectives on Improving Transmission Efficiency
Nick Brown, President & CEO, Southwest Power Pool Mike Heyeck, Sr. V.P. Transmission, American Electric Power

5© 2009 Electric Power Research Institute, Inc. All rights reserved.
Engaging the Industry: Transmission Efficiency
• Drivers & Key Issues: Executive Perspectives
• National Drivers & Motivation for Improving Efficiency
• Industry Approaches and Response to Improving Transmission Efficiency
• Example Technologies for Improving Transmission Efficiency
• Roundtable Designing a Green Transmission Efficiency Demonstration Project
• A Call to Action & Next Steps

End to End Efficiency ConceptGreen Transmission Workshop Southwest Region
Arshad Mansoor, Ph.D.Vice PresidentPower Delivery & UtilizationElectric Power Research Institute
May 20, 2009

7© 2009 Electric Power Research Institute, Inc. All rights reserved.
Which Industry is the Single Largest User of Electricity?
1. Aluminum
2. Steel
3. Data Centers
4. Automotive and Support Industries
5. None of the Above

8© 2009 Electric Power Research Institute, Inc. All rights reserved.
Transmission Substation
FarmsHomesBuildings
Distribution Substation
Distribution(7.2 to 34.5 kV)
Industrial Service
Sub-Transmission(35 to 138 kV)
Large Industrial Service
Transmission(69 to 765 kV)
Generation
Answer: None of the Above

9© 2009 Electric Power Research Institute, Inc. All rights reserved.
Transmission Substation
FarmsHomesBuildings
Distribution Substation
Distribution(7.2 to 34.5 kV)
Industrial Service
Sub-Transmission(35 to 138 kV)
Large Industrial Service
Transmission(69 to 765 kV)
Generation
Answer: None of the Above
Electricity Sector is the Single Largest User of Electricity

10© 2009 Electric Power Research Institute, Inc. All rights reserved.
Opportunities for Improving Efficiency
Generation Transmission Distribution
~6% ~3% ~5%
EPRI is Engaging Industry to Develop an End-to-End Energy Efficiency Framework

11© 2009 Electric Power Research Institute, Inc. All rights reserved.
Back of Envelop Potential for T&D Efficiency
1. Reducing distribution circuit losses2. Distribution transformers3. Re-conductoring, phase balancing4. Capacitor placement, var control strategy5. Future opportunities to use automation for
reconfiguration6. Voltage optimization...1. Raising transmission line nominal voltage2. Transmission voltage profile optimization3. Use of advanced or lower loss conductors4. Re-directing power flow5. Bundle optimization6. Corona losses as impacted by line volts,
conductor size and bundle7. Shield wire segmentation & Insulation losses8. Low loss transformers9. Selective conversion to DC, bipole and tripole10. Switching or cycling out of service equipment
not needed for current operation11. EHV Overlay...
Potential for T&D EE (by 2020)
20% improvement in T&D Losses
70 TWh
Additional Improvement from Distribution Voltage
Optimization
(estimated 50% distribution substations have smart control)
17 TWh

12© 2009 Electric Power Research Institute, Inc. All rights reserved.
EPRI Distribution Green Circuits(75 circuits, 26 states and 3 countries)
Version 7: 05/18/09

13© 2009 Electric Power Research Institute, Inc. All rights reserved.
The Next Frontier: Transmission EfficiencyIndustry Workshops May/June 2009
West CoastWorkshop (June 12, 2009)Hosted by CAISO, SCEExecutive Champions: Executive Champions: Yakout Yakout MansourMansour (CAISO), (CAISO), Pedro Pizarro (SCE)Pedro Pizarro (SCE)
Mid Atlantic or Ohio Workshop (May 4, 2009)Hosted by PJM and AEPExecutive Champions: Terry Boston (PJM), Executive Champions: Terry Boston (PJM), Michael Heyeck (AEP)Michael Heyeck (AEP)
Dallas Workshop (May 20, 2009)Hosted by SPP, AEPExecutive Champions: Nick Executive Champions: Nick Brown (SPP), Mike Heyeck, AEP)Brown (SPP), Mike Heyeck, AEP)
Northeast Workshop (April 29, 2009)Hosted by NYISO, Con Ed, NYPA, LIPA Executive Champions: Steve Whitley Executive Champions: Steve Whitley (NYISO), Steve DeCarlo (NYPA), Lou (NYISO), Steve DeCarlo (NYPA), Lou Rana (Con Ed), Mike Hervey (LIPA)Rana (Con Ed), Mike Hervey (LIPA)
Southeast Workshop (June 15, 2009)Hosted by Rob Manning (TVA) and Hosted by Rob Manning (TVA) and Leslie Leslie SibertSibert (Southern)(Southern)
International Workshop (June 2, 2009)Hosted by PSE Operator, ESKOM, National Grid Executive Champions: Executive Champions: MagdaMagdaWasilukWasiluk HassaHassa (PSE Operator), (PSE Operator), Barry Barry MacCollMacColl (ESKOM), Ian Welch (ESKOM), Ian Welch (NG), Michael Heyeck (AEP)(NG), Michael Heyeck (AEP)
FERC Chairman Jon Wellinghoff Leading
the Executive Leadership Team

14© 2009 Electric Power Research Institute, Inc. All rights reserved.
Progress through Two Sessions
• 130 Participants in NY and Maryland:– FERC, NERC, DOE, EEI, ISO’s, OEM’s Transmission Owners, Vertically Integrated
Utilities, media, academia, EPRI
• Insights:– Reliability is still King, but now is time for thinking differently
– Green T built on the shoulders of a New T, Smart T
– Making the business case solely on efficiency savings is challenging & need regulatory framework to support
• Potential projects:– Hierarchical dynamic voltage control strategies
– Dynamic voltage compensation
– High voltage AC and DC overlay
– Substation equipment efficiencies
• …Opportunistic efficiency in new construction

15© 2009 Electric Power Research Institute, Inc. All rights reserved.
In Conclusion….
• We need to look for all opportunities to more efficiently use electricity
• Significant opportunity to improve energy efficiency of the Electricity Sector
• Need enabling technology and supporting regulatory framework to unlock the potential
Putting Great Minds Together to Design a Set of Regional Transmission Efficiency Projects


EPRI’s Green Transmission Efficiency InitiativeRegional Workshop Series
National Drivers and Motivation for Improving Transmission Efficiency
Lisa Wood, EEIJohn Schnagl, DOE

New efficiency standards and carbon reduction goals will drive investment in end-use energy
efficiency and T&D efficiency
Lisa WoodEPRI Green Transmission Conference
May 20, 2009

19
Proposed federal energy legislation will regulate carbon and more!
Waxman-Markey climate change bill – HR 2454 (introduced May 15, 2009)– Combined RES and EERS: 20% by 2020
• 1/4 can be met by energy efficiency (5% of the 20%)• Governors can petition for up to 2/5 (8% of the 20%) to be met by
EE in a given year• 18 states already have EERS• 29 states (including DC) have RPS
– Carbon reduction goals• 17% below 2005 levels by 2020• 42% below 2005 levels by 2030
Need all available sources – demand- and supply-side to reduce carbon and meet goals
19

20
Waxman-Markey EERS: 15% energy efficiency by 2020 (draft bill)
20
0
500
1000
1500
2000
2500
3000
3500
4000
4500
W-M EE Savings vs. EIA Forecast EPRI RAP Scenario vs. EIA Forecast
487207
TWh
Energy Efficiency Targets by 2020 vs. EIA Electricity Sales Forecast
Forecast = 4127 TWh

21
Four components eligible for energy savings under Waxman-Markey draft bill
21
EE Savings, EPRI RAP Scenario
207 TWh
Codes & Standards
?
Distribution Efficiency
?
CHP?
Distribution of Energy Savings Under the Waxman-Markey Draft Goals (2020)Total = 487 TWh
Transmission Efficiency to be added?

For more information, contact:
Lisa WoodExecutive Director
Institute for Electric EfficiencyThe Edison Foundation701 Pennsylvania Ave., N.W.Washington, D.C. 20004-2696202.508.5550


National Activities to Support Increased Transmission Efficiency-Partnering with
Industry
John SchnaglDirector Transmission Adequacy
Grapevine, TexasMay 20, 2009
EPRI Green Transmission Initiative Workshop – Implementing Transmission Efficiency

25
Office of Electricity Delivery and Energy Reliability (OE)
OE Mission: Lead National efforts to modernize the electric grid, enhance the security and reliability of the energy infrastructure, and facilitate recovery from disruptions to the energy supply
Permitting, Siting,
& Analysis (PSA)
Infrastructure Security & Energy Restoration
(ISER)
Research & Development (R&D)
OE

26
Grid Modernization
• Capacity
• Flexibility
• Functionality

27
Economic and Environmental Responsibility
• Support developable renewable energy
• Expedite integration of renewable generation
• Identify efficient and economic delivery solutions
• Maintain options for an uncertain future

28
For More InformationOffice of Electricity Delivery and Energy Reliability
WWW.OE.ENERGY.GOV
[email protected] (202) 586-1056


EPRI’s Green Transmission Efficiency InitiativeRegional Workshop Series
Industry Approaches & Response to Improving Transmission Efficiency
Jay Caspary, SPPMike Heyeck, AEP Ralph Luciani, CRA InternationalSharma Kolluri, Entergy

SPP.org 3131

Real Time Dynamic Ratings to Enable Efficiency & Improve Asset Utilization
EPRI Green Transmission Initiative Workshop
Grapevine, Texas
May 20, 2009

SPP.org 33
Why Consider Real Time Ratings?
• Real time (or dynamic) ratings for critical network elements are a low cost, relatively simple, proven and mobile technology which can enable System Operators to reliably maximize and manage the power transfer capacity of the grid.
• Real time ratings can be used to increase the value of existing transmission assets and potential applications like FACTS devices to create an effective and efficient Smart Grid.

SPP.org 34
Real Time Ratings… (cont.)
• are NOT an alternative to transmission expansion, but do provide a means to improve asset utilization during the build out of major transmission projects,
• have been used effectively in SPP by members to manage flows and curtailments while system upgrades are being approved and completed,
• have been considered by SPP’s Transmission Working Group which affirmed the technical merits, but rejected its application due to existing conflicts with current rules in 2006,
• may be required to effectively accommodate increased wind development and deliveries much like ERCOT

SPP.org 35
SPP White Paper
• SPP Staff prepared a white paper entitled “Mitigation of SPP Transmission Constraints in Areas with Relatively Higher Wind Velocities” which is available at www.spp.org
• After much discussion, Transmission Working Group reviewed the report in 2006 and affirmed the technical merits but rejected its application for sale of firm transmission service as a violation of SPP Criteria.

SPP.org 36
• LaCygne-Stilwell Flowgate in Southwest Power Pool
• 345 KV, 32 miles
• 1251 MVA static rating
• 1 of top 5 bottlenecks on Central U.S. North-South power corridor
• Access to low cost power limited by the LaCygne-Stilwell flowgate
Summer – Lower cost power in North flows to South to meet cooling demand
Winter – Lower cost power in South flows to North to meet heating demand
Stilwell
LaCygne
KCPL – Congestion Relief

SPP.org 37
• In advance of live reconductor in early 2003, the line was allowed to be loaded under contingency above its traditional static limit for 167 hours during the summer 2002 load season:
• KCPL avoided “a significant amount” of energy redispatch
• Calculated less than 3-month payback for total installed cost of CAT-1 devices to provide real time ratings
8% to 16%above static
More than 16%above static
Up to 8%above static
KCPL – Congestion Relief

SPP.org 38
• The power output of several wind farms is concentrated at the McCamey transmission hub
• The amount of wind power that can be delivered to load centers in East Texas is limited by the rating of the 138 kV transmission line from McCamey to Big Lake
Big Lake
McCamey
Abilene DFW
345 kV138 kVWind
Not To Scale
McCamey Area Wind Power Hub
AEP West Texas – Wind Farm Integration

SPP.org 39
Real time ratings on the McCamey-Big Lake line deliver a minimum of 10-15% above static rating when needed to accommodate wind power
American Electric Power Company, Big Lake - McCamey LineDynamic Rating vs. Static Rating, May 2006
100
110
120
130
140
150
160
170
180
190
200
210
220
230
240
250
0.0% 10.0% 20.0% 30.0% 40.0% 50.0% 60.0% 70.0% 80.0% 90.0% 100.0%
Percent Probability
Rat
ing
(MVA
)
Dynamic rating Static rating Alternate static rating
147.0
168.7
15%
AEP West Texas – Wind Farm Integration

SPP.org 40
Transmission Expansion
• Reliability and economics are inseparable
• A few reliability constraints are being managed using dynamic ratings, other applications may be warranted
• Major transmission projects being installed now that may create challenges in operations, e.g., Northwest – Woodward District EHV 345 kV

SPP.org 41
Approved BP

SPP.org 42
What’s a National RES mean to SPP?
• Eastern Wind Integration and Transmission Study (EWITS) sponsored by DOE/NREL is investigating transmission needs and operational impacts for 3-20% and a single 30% National Renewable Electricity Standard (RES) scenarios.
• Latest projections show 60 - 95 GW of incremental wind development in SPP with up to 25 GW in Nebraska.

SPP.org 43
SPP.org 44
Real Time Ratings
• Topic that may warrant additional consideration by SPP and others to ensure the effective and efficient operations and planning of the existing and planned bulk power system and leverage information to create a smarter transmission grid
• Not a way to defer or displace necessary EHV expansion projects, but a potential bridge to manage congestion particularly for near term wind integration and deliveries
• Wind speeds for turbine operations are significantly higher than assumptions for conductor ratings providing generation interconnections and outlet


47
Improving Efficiency through Infrastructure Design & Operation
Michael HeyeckSenior Vice President, Transmission
American Electric Power
EPRI’s Green Transmission Efficiency WorkshopDallas Fort Worth, Texas
May 20, 2009

48
Improving Transmission Efficiency . . .
. . . In design and operation
• Transmission losses are significant, about ½ share of T&D losses– USA T&D loss estimated at 60 GW (peak), 250 TWh/yr
• USA Generation auxiliary use estimated to be as large
• Where are the losses?• What can we do to be more efficient?
– In planning and operation? – In engineering, design, and procurement? – Through applying more intelligent sensors and tools?

49
Where are System Losses at AEP?
Demand Loss
(D) No Load12%
(T) No Load8%
(T) Load46%
(D) Load34%
Transmission has about half of T&D losses; No load loss is surprisingly large
Energy Loss
(D) Load21%
(T) Load37%
(T) No Load15%
(D) No Load27%
Annual Energy Losses (GWh)
Sub XFMR Pri lines Line XFMR Sec lines Services
LoadNo Load
T&D No Load Loss20% of peak loss
42% of energy loss
Losses at Peak Load (MW)
Sub XFMR Pri lines Line XFMR Sec lines Services
LoadNo Load

50
Efficient Transmission System Examples
• Reduce system losses with– EHV overlay
• US 765 kV overlay could save 10 GW in losses– Improved voltage coordination
• Reduce line losses by conductor selection, design– One 500 mi 765 kV line using ACSR/TW saves 8 MW, 36 GWh/yr over
standard ACSR– Employ open loop ground wire system
• Installed on 5 AEP lines (533 miles total), saves 3 MW, 4.5 GWh/yr– Optimize conductor bundling to reduce corona losses (and AN) – Insulate/transpose ground wires
• Reduce equipment losses– Reinforce loss evaluation for equipment– Enable switching out equipment when unneeded

51
Moving Transmission Efficiency Forward
• Reinforce efficiency assessments– Plan, engineer, design, and procure new facilities/equipment
with efficiency as greater priority– Focus on “going forward” positions
• Apply more efficient solutions while adding, replacing, or improving facilities – don’t repeat sins of the past!!
• Save energy through advanced technologies– Advanced diagnostics to reduce losses
• Minimize outages to avoid increased losses on other facilities
– Advanced system tools to enable more efficient loading patterns– What other technologies can improve efficient utilization?

52
EHV Overlay ConceptReduces peak losses & supply needs by 20 GW
*


First Two Loops of SPP EHV Overlay Transmission Expansion
Analysis of Benefits and Costs
Performed on behalf of Electric Transmission America, OGE Energy Corp. and Westar Energy
September 2008
55 Use of this material requires the express written consent of Electric Transmission America or its partners.
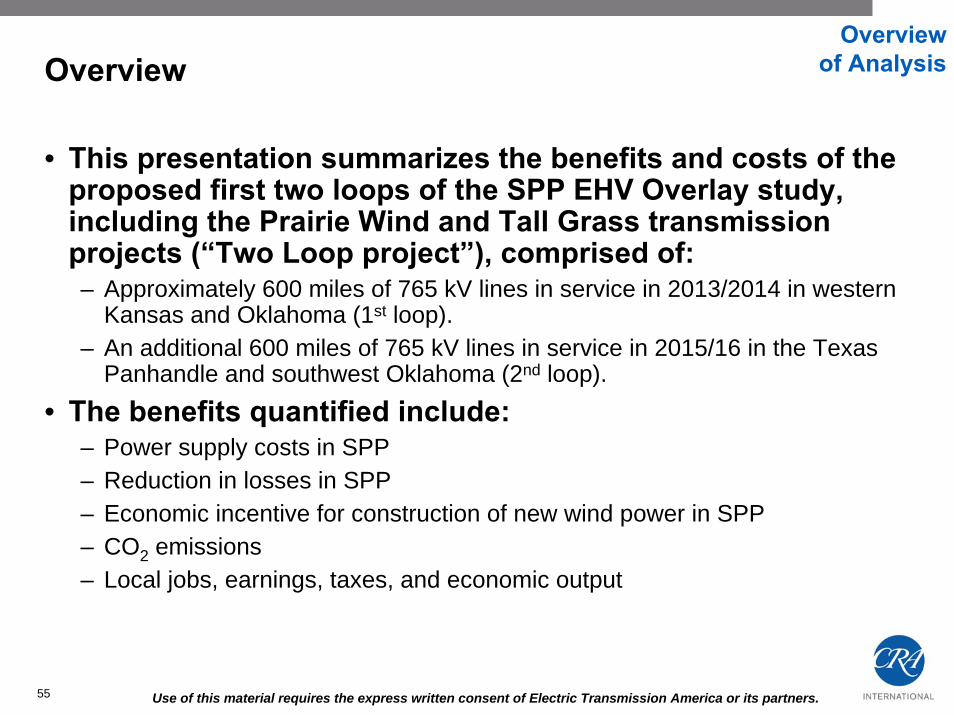
Overview
• This presentation summarizes the benefits and costs of the proposed first two loops of the SPP EHV Overlay study, including the Prairie Wind and Tall Grass transmission projects (“Two Loop project”), comprised of:– Approximately 600 miles of 765 kV lines in service in 2013/2014 in western
Kansas and Oklahoma (1st loop).– An additional 600 miles of 765 kV lines in service in 2015/16 in the Texas
Panhandle and southwest Oklahoma (2nd loop).• The benefits quantified include:
– Power supply costs in SPP– Reduction in losses in SPP– Economic incentive for construction of new wind power in SPP– CO2 emissions– Local jobs, earnings, taxes, and economic output
Overview of Analysis

56 Use of this material requires the express written consent of Electric Transmission America or its partners.
New Transmission Lines in Base CaseOverview
of Analysis
Sooner
Rose Hill
Summit
Elk City
LES
Hitchland
Wichita
Woodward
Briscoe
Finney SpearvilleMedicineLodge
Potter
Northwest
Base
Sooner
Rose Hill
Summit
Elk City
LES
Hitchland
Wichita
Woodward
Briscoe
Finney SpearvilleMedicineLodge
Potter
Northwest
Base

57 Use of this material requires the express written consent of Electric Transmission America or its partners.
New Transmission Lines in Change CaseOverview
of Analysis
Sooner
Rose Hill
Summit
Elk City
LES
Hitchland
Wichita
Woodward
Briscoe
Finney SpearvilleMedicineLodge
Potter
Base
Northwest
Step 1
Step 2
Sooner
Rose Hill
Summit
Elk City
LES
Hitchland
Wichita
Woodward
Briscoe
Finney SpearvilleMedicineLodge
Potter
Base
Northwest
Step 1
Step 2

58 Use of this material requires the express written consent of Electric Transmission America or its partners.
Wind Power Assumptions
• 14 GW of new wind power in SPP not already under construction was included in the Change Case using active SPP generation requests.
• Given physical constraints on the SPP system, no additional new wind not already under construction was included in the Base Case.– 2.5 GW of wind currently in operation or under construction in SPP was
included in both the Base Case and the Change Case.
New SPP Wind Power in Change Case
Overview of Analysis
Wind (MW) Kansas 5,601 Missouri 701 New Mexico 480 Oklahoma 3,268 Texas 4,026 Total 14,075

59 Use of this material requires the express written consent of Electric Transmission America or its partners.
Change Case: New Wind Locations
Note: Wind Capacity locations are grouped by one or more counties.
Overview of Analysis
Sooner
Rose Hill
Summit
Elk City
LES
Hitchland
Wichita
Woodward
Briscoe
Finney SpearvilleMedicineLodge
Potter
Base
Northwest
Step 1
Step 2
750
Wind MW14,075
469
330
828
700
150
696525
393
834
5501982010 255 551
400
200
210
1250
1466
1010
150 150

60 Use of this material requires the express written consent of Electric Transmission America or its partners.
Summary of Benefits and Costs
• Benefits:– SPP Power Supply Cost Benefits: $2.8 billion (08$) annually
- CO2: Nearly 30 million tons of CO2 emissions per year avoided.– Losses: An additional $100 million benefit in reduced power losses in SPP.– RPS: More than 20% of SPP demand supplied by renewable energy.– Local impacts: Over 10,000 SPP jobs during construction, and 5,000 during
operation; $60 million per year in property taxes, and $500 million per year in economic output.
• Costs:– Cost of the EHV Overlay facilities needed to complete the Two Loop
Project: $400 to $500 million per year– New wind costs: $1.75 billion per year net of production tax credit
• We conclude that the Two Loop project yields substantial net benefits to SPP.
Costs and Benefits

61 Use of this material requires the express written consent of Electric Transmission America or its partners.
Summary of Benefits and Costs
• Breakdown of Net Power Supply Cost Benefits of the Two Loop project:
• Wind energy revenues are more than sufficient to cover the fixed cost of the new wind capacity.
– The wind production tax credit is an important factor in the Power Supply Cost benefits to SPP.– RPS considerations would make the economic comparison more favorable to the Two Loop
project as the cost of the new wind would be compared to the cost of other renewable capacity.• Local economic impacts and the public benefits of responding to current and
potential future state RPS standards are in addition to the Power Supply Cost benefits.
Costs and Benefits
Net Power Supply Benefits (millions)+ Energy Benefits/(Costs)
Supply Cost Savings $2,766Reduced Loss Benefits $96Wind Energy Revenue ($1,867)
Total $995+ Wind Cost Credit/(Shortfall)
Wind Energy Revenue $1,867Wind Revenue Requirement ($2,447)Wind Production Tax Credit $713
Wind Market Revenue net of Cost $133- Transmission Cost $400 - $500
= Net Benefits $628 - $728


“Static and Dynamic VAR Compensation”
Sharma KolluriEntergy Services Inc
EPRI Green Transmission System Efficiency Regional Workshop
Dallas, TXMay 20, 2009

Reactive Power ManagementWhat is Reactive Power Management?
• Effective control/balancing of reactive power devices in a power system in order to achieve reduction in system losses and voltage control.
Benefits of Reactive Power Management:
• Better voltage control/ improved voltage profile.• Improved efficiency of power delivery.• Improved utilization of transmission assets.• Reduced congestion and increase in power transfer capability.• Improved system security.
Reactive Power Issues
• Difficult to transport/losses increase significantly with distance
• Takes up capacity on transmission line• Static versus dynamic requirements• Margin/Reserve requirements• Managing Reactive Power/Voltage schedule• Reactive Power Coordination

Transmission Line Real and Reactive Power Losses vs. Line Loading
Source: B. Kirby and E. Hirst 1997, Ancillary-Service Details: Voltage Control,ORNL/CON-453, Oak Ridge National Laboratory, Oak Ridge, Tenn., December 1997.

Static and Dynamic VAR Support
• Static Reactive Power Devices– Slow acting– Reactive power production level drops when the voltage level drops– Low cost – Discrete mode of operation– Examples include capacitors and inductors.
• Dynamic Reactive Power Devices– Fast acting – operates in few cycles– High Cost– Continuous mode of operation– Examples include static VAR compensators (SVC), synchronous
condensers, and generators.

Technology Applications at Entergy to Address Reactive Power Issues
Texas
North Arkansas
Southeast LouisianaWestern Region
Mississippi
Southwest LA
Large Shunt Capacitor Banks
Series Compensation
SVC
Coordinated Capacitor Bank Control
DVAR
AVR

Key Concerns in Voltage Stability
Minimize motor tripping
Maintain healthy voltage profile
Voltage (pu)

Porter SVC - 300 MVAR

Porter Static Var Compensator (SVC)
Required for dynamic voltage support
Controls capacitor banks on the transmission system.

Coordinated Capacitor Bank Control
CONROE BULK2 – 36 MVAr Banks
PORTER1 – 36 MVAr Bank
OAK RIDGE1 – 36 MVAr Bank
METRO1 – 25.2 MVAr Bank1 – 24 MVAr Bank
GOSLIN2 – 36 MVAr Banks TAMINA
1 – 36 MVAr Bank
10.8 Miles
10 Miles
SVC
Maintains dynamic VAR reserves in SVC under high load conditions.
Relieves the operators from performing capacitor bank switching.
Maintain a healthy voltage profile in the region.

Series Capacitor –Dayton Bulk 230kV Station
70% compensated, 1880 amps, 24 ohms

DSMES Unit
Stores Energy in a superconducting coil
Automatically releases energy to the system when needed to ride through voltage dips caused by faults. This unit improves power quality and reduces customer loss of production.

Industry Issues
• Coordination of reactive power between regions• No clearly defined requirements for reactive
power reserves• Proper tools for optimizing reactive power
requirements• Incentive to reduce losses• Wide Area Control

Western Region – Overview
≤ 230 kV Tie Lines
Generation
Load Center

77© 2009 Electric Power Research Institute, Inc. All rights reserved.
Q&A Discussions
• Questions?

78© 2009 Electric Power Research Institute, Inc. All rights reserved.
Lunch is Served

EPRI’s Green Transmission Efficiency InitiativeRegional Workshop Series
Technologies to Support Improving Transmission Efficiency
Mark Laufenberg, PowerWorld Corp.Abder Zouaghi, ABBMack Grady, University of Texas Austin

80OPTIMALPOWERFLOW
May 20, 2009Mark LaufenbergPowerWorld Corporation
81
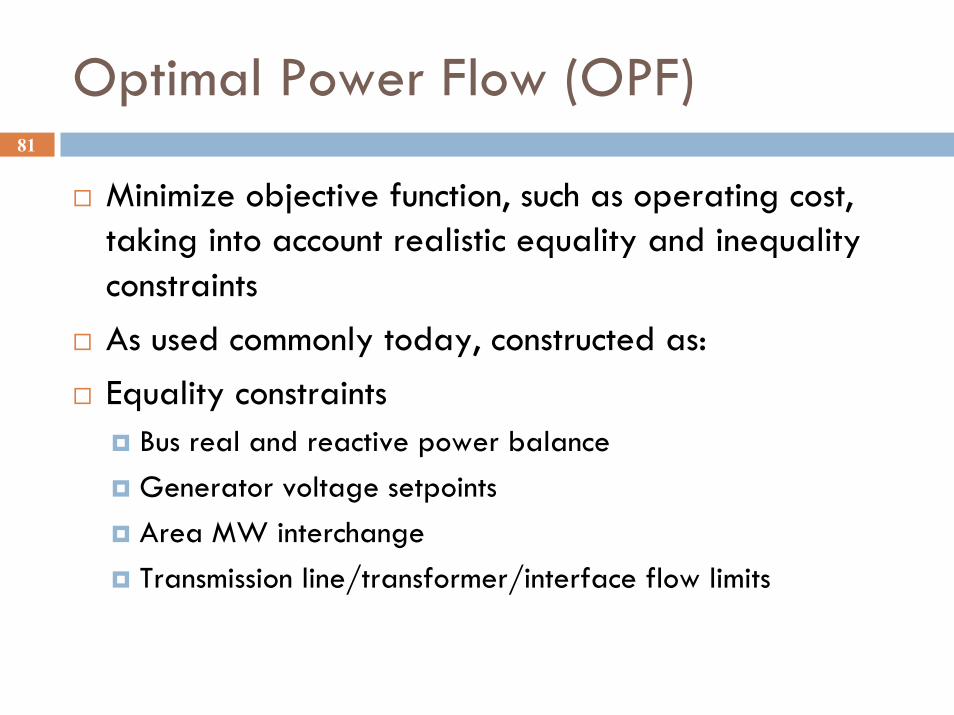
Optimal Power Flow (OPF)
Minimize objective function, such as operating cost, taking into account realistic equality and inequality constraintsAs used commonly today, constructed as:Equality constraints
Bus real and reactive power balanceGenerator voltage setpointsArea MW interchangeTransmission line/transformer/interface flow limits

82
Optimal Power Flow (OPF)
Inequality constraintsTransmission line/transformer/interface flow limitsGenerator MW limitsGenerator reactive power capability curves
Available ControlsGenerator MW outputsLoad MW demandsPhase shiftersArea Transactions
Tool for calculation of Locational Marginal Prices

83
OPF Use Today
Largely used for LMP calculation my ISOs, RTOs, in the market mechanisms (real time and day ahead)Used extensively by power traders to make bets on LMPs (through FTR and CCR auctions)Use in Planning and Operations is not none, but almost none
Some use in setting up cases with certain flow patterns which are then used for regular power flow runs

84
Future Development of OPF
Change the objective functionMinimize losses – VAR optimizationMinimize emissions
Constraints changedBus voltage magnitudes
New ControlsTap ratios at Tap Changing TransformersSwitched shunt optimizationSystem wide generator voltage setpoint (raise voltages to reduce current and losses)

85
Research Topics
FACTS DevicesDistributed FACTS devices have the ability to change line impedances in response to a control signal from a centralized OPF algorithmEarly research indicates you need a lot of devices to significantly change losses
How much can you reduce losses in transmission system through better (optimal) operation?
20% with existing devices would be outstandingGenerally speaking, easier to implement than putting in new equipmentPoint of transmission could be to facilitate a greener generation mix


Power Transformer EfficiencyAbderaahmane Zouaghi PhD. Eng
Contents
Transformer Efficiency
Losses in the Transformer
Material Performance and Cost
Design Techniques
Loss evaluation and Design Optimization
Size and other factors
Transformer EfficiencyIN
PU
T (M
VA
)
NLL (KW)
OU
TPU
T (M
VA)
LL (KW)
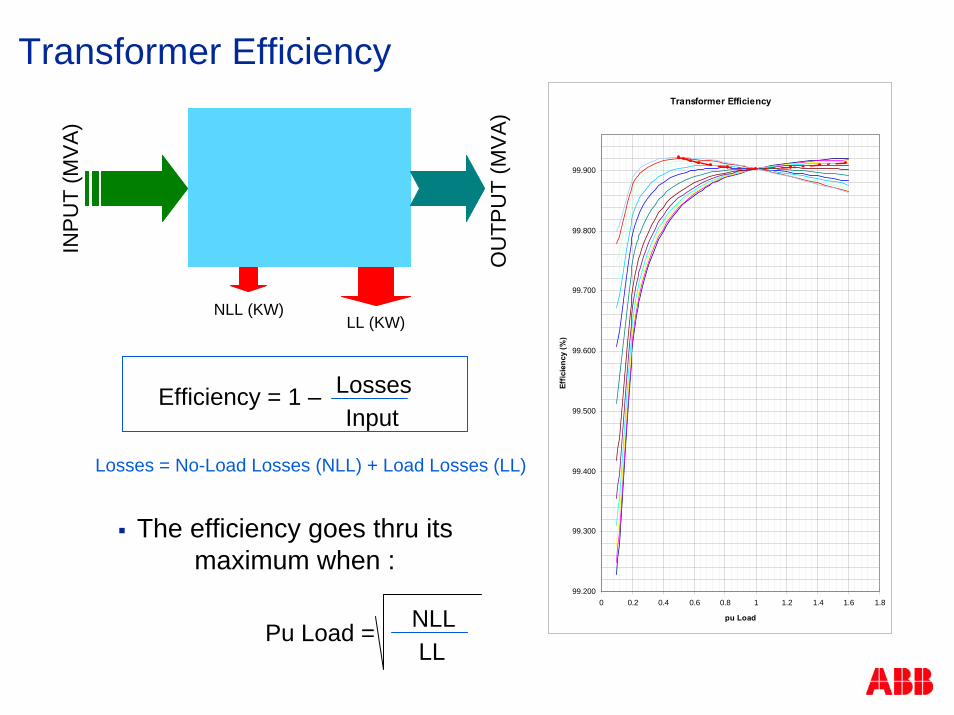
Transformer Efficiency
99.200
99.300
99.400
99.500
99.600
99.700
99.800
99.900
0 0.2 0.4 0.6 0.8 1 1.2 1.4 1.6 1.8
pu Load
Effic
ienc
y (%
)
Efficiency = 1 –
Losses = No-Load Losses (NLL) + Load Losses (LL)
The efficiency goes thru its maximum when :
NLLLL
Pu Load =
InputLosses

Losses in the Transformer?
Hysteresis LossEddy Current Loss
RI2
Eddy Current LossStray Eddy Loss
Transformer
No-Load Losses Load Losses
Energized Loaded
Quality of the core material
Flux Density
Frequency
Frequency
Flux Density
Sheet thickness
Insulation between sheets
Material and Shielding Quality
Winding Geometry
Leakage Flux Density
Strand Size axial and Radial
Leakage flux density
Insulation between strands
Winding Material
Current Density

Material Performances Improvements
Lower Iron loss of core steelReduction of thickness
Higher grain orientation
Domain Refining / Laser Scribing
Improved coatingLower iron loss
Improved sensitivity of iron loss to mechanical stress (handling / clamping)
Reduction of Core interlamiar loss
Improved Core joint designI – Joint => 45 – Lap joint => Step - Lap joints
Φ
i
D
B
CA
B
Ic
A A
View A-A
Conventional Step lap

Material Performances Improvements
The continuously transposed cable is an important tool for the control of eddy current losses.
Glue

Design Techniques
Non-shielded shielded turret cover
Completely shielded turret cover
Pmax~ 14.6 kW/m2
Pmax~ 2.3 kW/m2
With nowadays computers, Engineers master stray losses better than ever.
3D calculations fast and precise
Material performance well simulated
Shielding correctly applied
Results as expected
Loss Evaluation and Design Optimization
0.00
0.20
0.40
0.60
0.80
1.00
1.20
1.40
1.60
1 2 3 4 5
Optimization cycle
Cos
t p.u
.
0
50
100
150
200
250
300
350
400
450
Loss
es [k
W] M
ass
[T]
Production costActive part cost ApcTransformer mass [T]Total losses
Opt
imum
Sel
ecte
d lo
sses
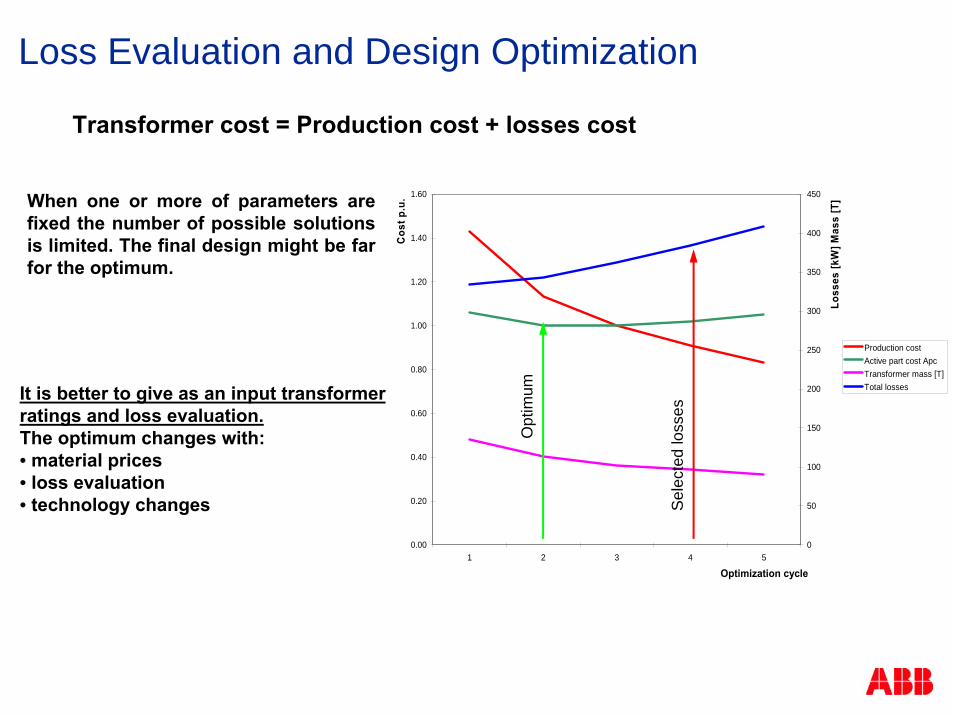
It is better to give as an input transformer
Transformer cost = Production cost + losses cost
ratings and loss evaluation. The optimum changes with:• material prices• loss evaluation• technology changes
When one or more of parameters are fixed the number of possible solutions is limited. The final design might be far for the optimum.

Size and other factors
Other consideration may affect the transformer Efficiency such as:
Overall size of the transformers
Transportation
Replacement Units
....
However, the transformer will be the most efficient under these considerations!...


98
Why are Synchrophasors Important?Here’s All You Need to Remember
Average Power Flow P Through a Mostly Inductive Transmission Line (138kV and above)
)sin( 1121 δδ −=
XVVP
11 δ∠V 22 δ∠V
jX
+
─
+
─ground
These are about 1pu
For small x, sin(x) = x

99
Every time you solve a loadflow, or run a stability study, the solution computes voltage
phase angles
Until GPS time stamping, we’ve not known if those computed angles were right or not
With synchrophasors, you actually measure the phase angles, 30 times per second

100
Suppose You Command the Control Center to Reduce
Losses Right NowFine, but how much are the losses Right Now?
Sum of generation minus sum of substation loads - yes
Ah - the classical efficiency measurement problem –Pgen pretty accurate, Pload fairly accurate, but (Pgen –
Pload) not very accurate due to subtraction errors
Did you action really decrease losses?
The key – take state estimators to the next level of accuracy, that is “state measurement.” Voltage phase angles can provide the necessary input to accurately
t l

101
Satellite Receiver
SynchrophasorVector Processor and Multi-PMU
Data ConcentratorSEL 421
Relay/PMU
Display Clock
Processing Software and
Display
UT Austin Power Lab, Nov. 26, 2008. Just in time for Thanksgiving, Schweitzer Engineer Andrew Swinghamerinstalls and makes operational the main station and one remote PMU for the UT Austin – Schweitzer SynchrophasorMeasurement Network

The U.T. Austin – Schweitzer Partnership(base station was installed by Schweitzer in late November)
Schweitzer donated thirty 421’s to us two years ago, to upgrade our power teaching lab. Value $320k.
Goes in our power teaching lab

UT McDonald Observatory
UT Austin
The Texas Synchrophasor Network
SchweitzerBoerne
UT Tyler
Blue boxes -added soon
UT Pan Am
SchweitzerDallas
SchweitzerHouston
Austin Energy
SchweitzerPullman
EPRIKnoxvilleCharlotteLennox
CloudcroftGrady cabin
104
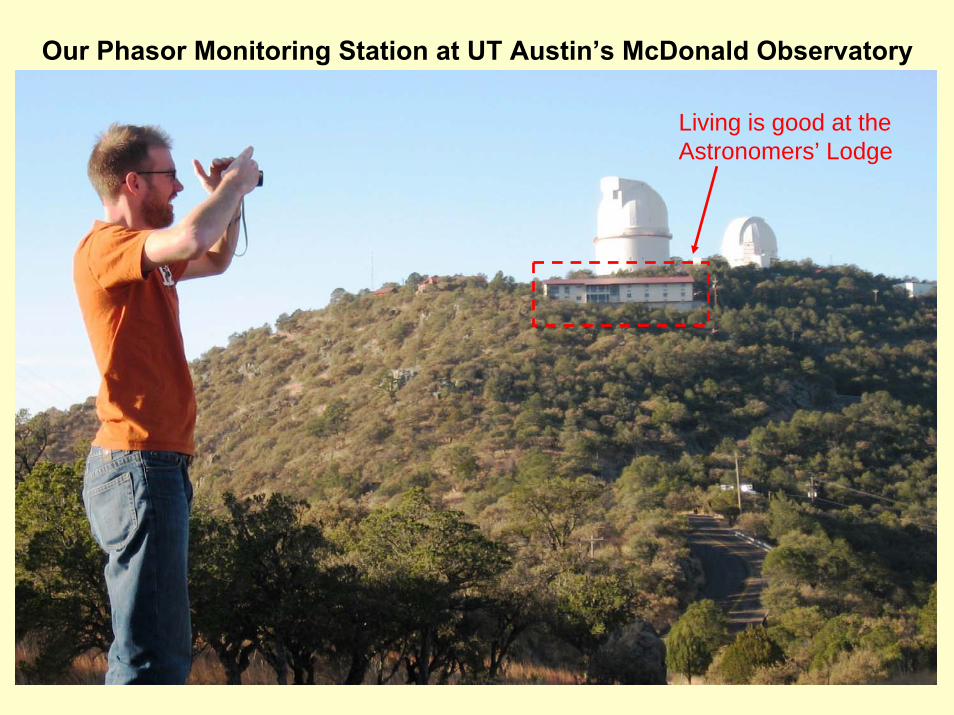
Our Phasor Monitoring Station at UT Austin’s McDonald Observatory
Living is good at the Astronomers’ Lodge

105
What Do We Do With the Data?• There is no substitute for real data
• Voltage magnitude and angle data stream in over the public internet from every PMU, 30 readings per second
• 2 million lines of Excel file data are archived every day
• We learn, and our students learn through assignments. Each student gets “their own day.”
• We write weekly observation reports and post them on my web page www.ece.utexas.edu/~grady

106
What Do Synchrophasors Have To Do With This Workshop?
• A green grid must be healthy and efficient
• Synchrophasors are an important new source for evaluating the health of a grid
• Synchrophasors give a clear indication that the grid is responding to events as it should
• Synchrophasor technology is already here and an “add-on” to existing relays
• The real problem is how to digest the tsunami of data (e.g., 2 million lines per day)

107
Some ExamplesWind Generation in ERCOT (Percent of Total Generation), Mar. 10, 2009
0
2
4
6
8
10
12
14
16
18
20
0 3 6 9 12 15 18 21 24
Hour of Day
Perc
ent W
ind
Up 1850 MW
Down 2000 MW

108
Up 36º Down 43º
23:00 – Midnight
23:00 – 23:10
23:50 – Midnight
23:27 – 23:37
In One Hour, the West Texas Phase Angle with respect to U.T. Austin, Advances by 36º, and then Drops by 43º

109
20% by 2030 – Why Wait So Long?
Central Daylight Time
Wind Generation in ERCOT (Percent of Total Generation), Mar. 18, 2009
0
5
10
15
20
25
0 3 6 9 12 15 18 21 24
Hour of Day
Perc
ent W
ind
Peak
Min
The corresponding West Texas phase angle drop with respect to U.T. Austin was a whopping 88º

110
Wind Generation in ERCOT (Percent of Total Generation), Mar. 12, 2009
0
5
10
15
20
25
0 3 6 9 12 15 18 21 24
Hour of Day
Perc
ent W
ind
20% by 2030 – Well, Maybe Not Every Day!

111
Case 2
≈ 2.5 º
≈ 0.65 Hz
≈ 3.5 º
Synchrophasors clearly show the response of the grid to step changes such as generator trips. Here we have a healthy second-order underdamped response.

112
High Wind Generation Seems to Create New Frequency Modes of Oscillation
2 Hz Cluster
March 18, 02:00 – 03:00 Wind Generation > 20%
March 12, 02:00 – 03:00 Wind Generation ≈ 2%

113
59.9
60.0
60.1
0 2 4 6 8 10 12 14 16 18 20
Tuesday, March 31, 2009, 20 Minute Window Beginning 12:53 AM CDT Superimposed Frequency Measurements Taken at
UT Austin (in black) and McDonald Observatory (in red)
20-minute window
Here’s Something You Don’t See Every Day

114
60.0
60.1
11 11.1 11.2 11.3 11.4 11.5
30-Second Zoom-In of the 11th Minute
15 sec period, corresponding to 0.067 Hz
30-second window
0.06 Hzpeak-to-peak
A 30-Second Zoom-In. What Caused This Strange 0.067 Hz Oscillation for 15 Minutes?

115
McDonald Observatory Phase Angle with respect to UT Austin(2-minute window beginning 11:45pm, April 9, 2009)
41.2
41.4
41.6
41.8
42.0
42.2
McDonald Observatory Phase Angle with respect to Boerne(2-minute window beginning 11:45pm, April 9, 2009)
43.0
43.2
43.4
43.6
43.8
44.0
McDonald Observatory Phase Angle with respect to Houston(2-minute window beginning 11:45pm, April 9, 2009)
36.2
36.4
36.6
36.8
37.0
37.2

116
0.75
0.85
0.95
1.05
1500 1800 2100 2400 2700
Vpu
10 sec
0.75
0.8
0.85
0.9
0.95
1
1.05
1530 1560 1590 1620
1 sec
Vpu
Let’s Not Forget PMU’s Vrms Capabilities – Here is the McDonald Observatory Triple Dip

117
Conclusions
• Synchrophasors are a powerful new tool
• Every day has surprises - I’ve shown only a few
• The challenge is how to find the interesting and useful events and responses in the 2 million lines of Excel file data archived every day,
• and then to use what we learn to improve grid health and efficiency


EPRI’s Green Transmission Efficiency InitiativeRegional Workshop Series
Designing a Nationwide Green Transmission Efficiency Program
Rich Lordan, EPRI

120© 2009 Electric Power Research Institute, Inc. All rights reserved.
2009/2010 The Next Frontier – TransmissionComplimenting EPRI’s Core T&D Efficiency Research
• Expand EPRI’s Demonstration Efforts to include both Distribution & Transmission Green Efficiency
• Assembled Executive Leadership Team
• Conduct Workshops May/June 2009
• Explore & Formulate Regional Demonstration Projects To Improve Transmission Efficiency
121© 2009 Electric Power Research Institute, Inc. All rights reserved.
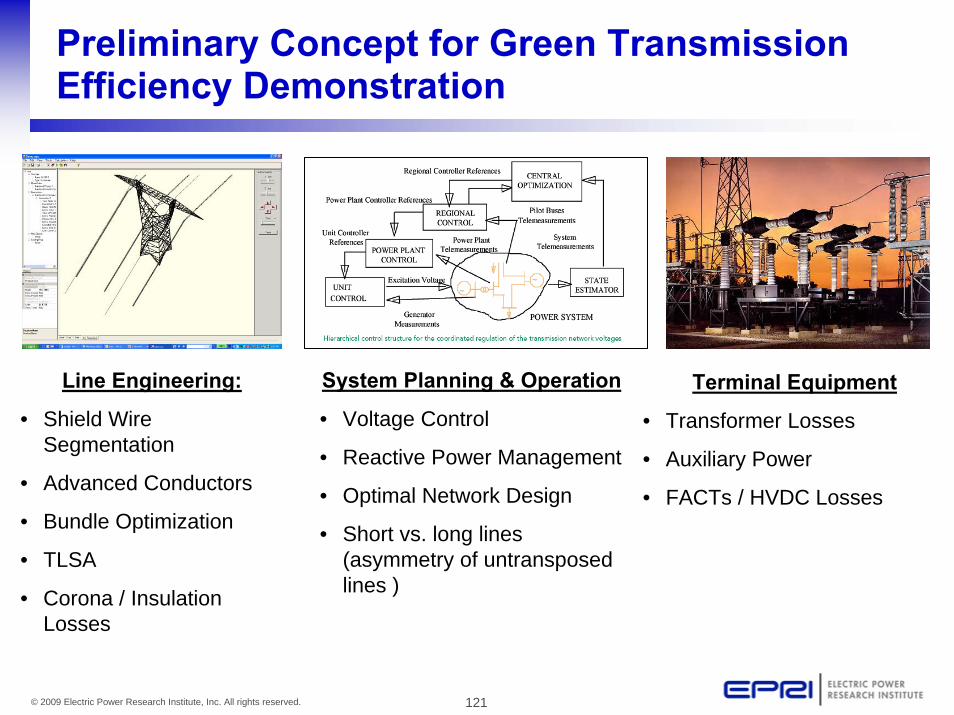
Preliminary Concept for Green Transmission Efficiency Demonstration
Line Engineering:
• Shield Wire Segmentation
• Advanced Conductors
• Bundle Optimization
• TLSA
• Corona / Insulation Losses
System Planning & Operation
• Voltage Control
• Reactive Power Management
• Optimal Network Design
• Short vs. long lines (asymmetry of untransposedlines )
Terminal Equipment
• Transformer Losses
• Auxiliary Power
• FACTs / HVDC Losses

122© 2009 Electric Power Research Institute, Inc. All rights reserved.
Advanced Conductors
3M Composite Core
Gap-TypeCarbon CoreACSS

123© 2009 Electric Power Research Institute, Inc. All rights reserved.
Reconductoring As Efficiency Option
Efficiency Source: Lower R Lower I2R lossesOther Benefits:
– Increased ampacity– Increased transmission capacity
Assumptions for Example Efficiency Calculations:
• Additional capacity not utilized
• Conductor loading unchanged
Economic analysis based only on benefit from loss and emissions reduction
124© 2009 Electric Power Research Institute, Inc. All rights reserved.
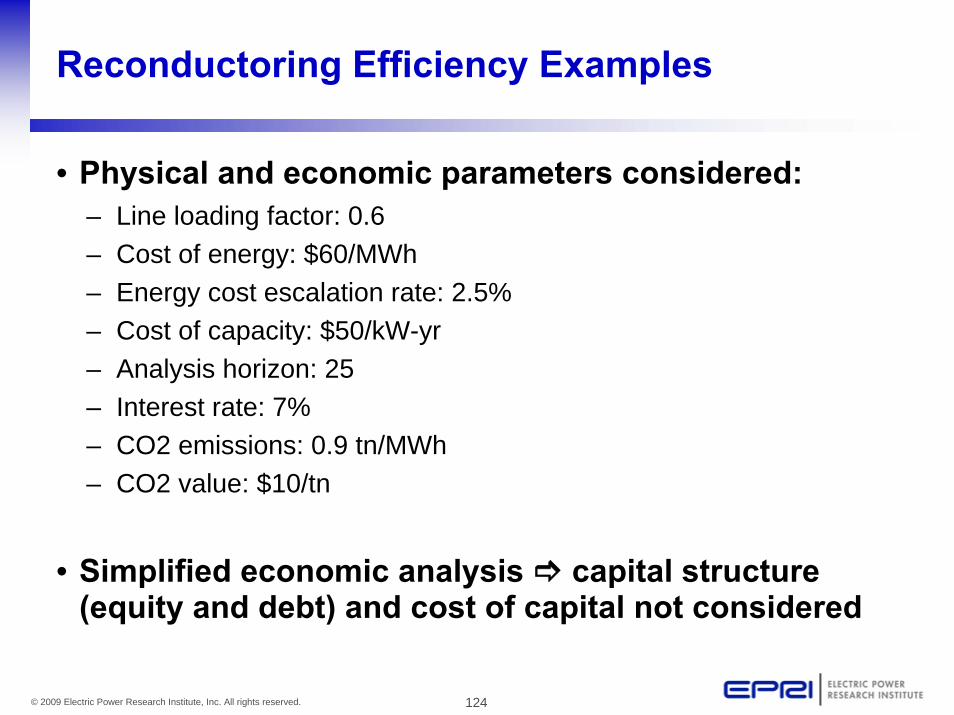
Reconductoring Efficiency Examples
• Physical and economic parameters considered:– Line loading factor: 0.6– Cost of energy: $60/MWh– Energy cost escalation rate: 2.5%– Cost of capacity: $50/kW-yr– Analysis horizon: 25– Interest rate: 7%– CO2 emissions: 0.9 tn/MWh– CO2 value: $10/tn
• Simplified economic analysis capital structure (equity and debt) and cost of capital not considered
125© 2009 Electric Power Research Institute, Inc. All rights reserved.
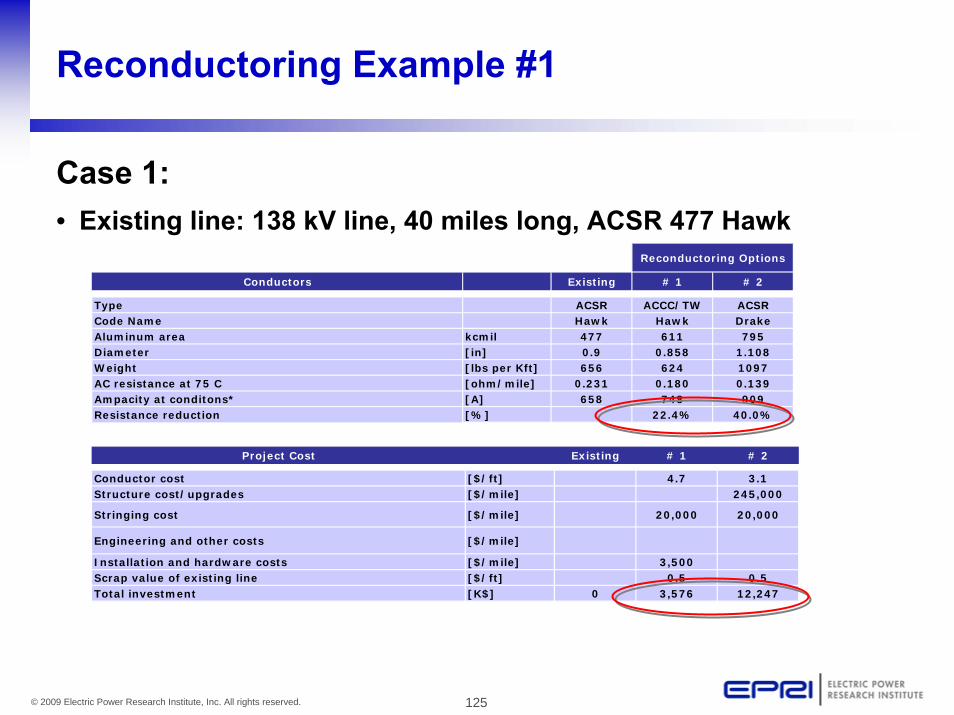
Reconductoring Example #1
Case 1:• Existing line: 138 kV line, 40 miles long, ACSR 477 Hawk
Reconductoring Options
Conductors Existing # 1 # 2
Type ACSR ACCC/TW ACSRCode Name Hawk Hawk DrakeAluminum area kcmil 477 611 795Diameter [in] 0.9 0.858 1.108Weight [lbs per Kft] 656 624 1097AC resistance at 75 C [ohm/mile] 0.231 0.180 0.139Ampacity at conditons* [A] 658 748 909Resistance reduction [%] 22.4% 40.0%
Project Cost Existing # 1 # 2
Conductor cost [$/ft] 4.7 3.1Structure cost/upgrades [$/mile] 245,000
Stringing cost [$/mile] 20,000 20,000
Engineering and other costs [$/mile]
Installation and hardware costs [$/mile] 3,500Scrap value of existing line [$/ft] 0.5 0.5Total investment [K$] 0 3,576 12,247

126© 2009 Electric Power Research Institute, Inc. All rights reserved.
Reconductoring Example #1 Results
Case 1: ResultsRESULTS Base # 1 # 2
Energy and Emission Savings
Average annual losses [MWh/yr] 37,655 29,230 22,610
Annual energy loss saving [MWh/yr] 8,425 15,045
Annual energy loss saving [%] 22% 40%
Average annual emissions [tn/yr] 33,889 26,307 20,349
Annual emission saving [tn/yr] 7,583 13,540
Annual emission saving [%] 22% 40%
Economic analysis
NPV (energy+capacity+emission+investment) [K$] 41,013 28,269 12,389
Levelized savings (energy + capacity) [K$/yr] 700.0 1,250.3
Levelized CO2 savings [K$/yr] 86.8 155.0
Levelized overall savings (energy + capacity + CO2) [K$/yr] 786.7 1,405.3
Levelized saving per invested dollar [$/$] 2.56 1.34
Pay-back Period (Energy+Capacity Saving) [yr] 9.0 19
Pay-back Period (Energy +Cap+Emissions Saving) [yr] 8.0 16
Internal Rate of Return (Energy+Capacity Saving) [%] 16% 9%
Internal Rate of Return (Energy+Cap.+Emissions Saving) [%] 18% 10%
Average peak demand reduction [MW] 2.41 4.31
Average cost of demand reduction [$/kW] 1,484 2,839
Levelized cost of energy loss reduction [$/MWh-yr] 36.42 69.86
Results based on
selected example
and assumed cost
data.
Quantifying Actual
Eff. Gains Requires
Specific System/Cost
Data.
Results based on
selected example
and assumed cost
data.
Quantifying Actual
Eff. Gains Requires
Specific System/Cost
Data.

127© 2009 Electric Power Research Institute, Inc. All rights reserved.
Reconductoring Example #1 Sensitivity Analysis
Parameter sensitivity - Option 1
0%
5%
10%
15%
20%
25%
30%
35%
40%
-50% -30% -10% 10% 30% 50%
Parameter Variation [%]
IRR
[%]
Load Factor Energy Cost Energy Cost Escalation Rate Capacity Cost CO2 value
Key Drivers to Economic Viability
-- Load Factor
-- Energy Cost
Marginal Impact:
-- Energy Escalation Rate
-- CO2 Value
-- Capacity Cost
Key Drivers to Economic Viability
-- Load Factor
-- Energy Cost
Marginal Impact:
-- Energy Escalation Rate
-- CO2 Value
-- Capacity Cost

128© 2009 Electric Power Research Institute, Inc. All rights reserved.
Reconductoring Examples (System Studies)
Case 2 & 3:• Based on the Test System Model:
– Reduced order model of existing transmission system in the North-East region
– Transmission lines: 765 kV, 500 kV, 345 kV and 138 kV– Peak demand: 4977.8 MW– Generation: 5182.8 MW– Total loss: 200.6 MW
• Sensitivity factors (losses over resistance) are used to select candidate lines– Case 2: 345 kV line, 81 miles long, ACSR 1275, 1 bundle conductor
– Case 3: 345 kV line, 84 miles long, ACSR 2303, 1 bundle conductor
• Physical and economic parameters as in Case 1
RPL ΔΔ

129© 2009 Electric Power Research Institute, Inc. All rights reserved.
Reconductoring Examples
Case 2:• 345 kV line, 81 miles long, ACSR 1272, 1 bundle conductor
Need significant structure modification
Reconductoring Options
Conductors Base # 1 # 2
Type ACSR ACCC/TW ACSRCode Name Bittern Bittern ChuckarAluminum area kcmil 1272 1572 1780Diameter [in] 1.345 1.345 1.601Weight [lbs per Kft] 1,432 1,554 2,071AC resistance at 75 C [ohm/mile] 0.090 0.073 0.066Ampacity at conditons* [A] 1189 1323 1456Resistance reduction [%] 19.3% 26.9%Conductors bundle [nr.] 1 1 1
Project Cost Base # 1 # 2
Conductor cost [$/ft] 10.0 6.2Structure cost/upgrades [$/mile] 250,000
Stringing cost [$/mile] 30,000 30,000
Engineering and other costs [$/mile]
Installation and hardware costs [$/mile] 3,500 3,500Scrap value of existing line [$/ft] 0.5 0.5Total investment [K$] 0 15,637 31,660

130© 2009 Electric Power Research Institute, Inc. All rights reserved.
Shield Wire Segmentation
• Cause and characteristics: • Shield wires has relatively high resistance • Induced currents in shield wire due to coupling from
the phase conductors• Induced currents in shield wires can circulate through
the towers to ground• Possible solutions:
• Breaking the conductive path in the shield wiresShield Wire Segmentation
• Reducing the mutual coupling with the phase conductors possible in double circuit lines
• Insulating shield wire from towers

131© 2009 Electric Power Research Institute, Inc. All rights reserved.
Shield Wire Segmentation - Example
• 500 kV transmission line
• Single circuit
• Phase conductors separation: 35 ft
• 2 shield wires:
½ inch steel cable
horizontal separation: 52 ft
Vertical position: 33.5 ft above the phase conductors

132© 2009 Electric Power Research Institute, Inc. All rights reserved.
Shield Wire Segmentation - Example
Results:
Loss Reduction Achieved by Ground Wire Segmentation (kW)(Per Mile of Un-Transposed Transmission Line)
0.00
2.00
4.00
6.00
8.00
10.00
12.00
14.00
16.00
18.00
20.00
500
1041
1561
2081
2496
Power Transfer (MW)
Loss
Red
uctio
n (k
W p
er m
ile)
Simplified analysis:
• 1000 MW, 100 miles
-Loss reduction about 3 kW/mile
-Annual saving
-If cost of energy is $ 100 /MWh:
$262,800 /yr saved for 100 miles of transmission line
• Results are obtained by detailed electromagnetic transient simulations

133© 2009 Electric Power Research Institute, Inc. All rights reserved.
Insulator losses
• Insulator losses are due to resistive leakage current:
- Negligible with clean insulators
- Increase if pollutants and moisture are deposited on the insulator surface
- Leakage current vary significantly on a daily basis with weather conditions

134© 2009 Electric Power Research Institute, Inc. All rights reserved.
Insulator losses = Neglegible
• Measures to mitigating line insulator losses:• Insulator replacement• Cleaning of insulators by clean water under pressure• Application of silicon grease, usually by hand.• Spray on a silicon rubber coating to achieve a hydrophobic surface.• Add creepage extenders to lengthen the creepage distance.
0.00 6.00 12.00 18.00 24.00
5.0
10.0
7.5
2.5
Insu
lato
r lea
kage
cur
rent
(m
A)
• Losses over day 3 kWh each insulator:– 3 insulator string per tower, 5
towers per mile:– 4.5 MWh for the total line– If $100/MWh $450/day

135© 2009 Electric Power Research Institute, Inc. All rights reserved.
Corona Loss Reduction - Examples
• Benefit of reducing voltage:
– Under heavy rain if line loading < 0.9 pu
– Under medium rain if loading < 0.6 pu
– No benefit under light rain
• Benefits are present only on the sections of the line where it is raining
• Energy loss reduction depends on the number of days under rain conditions Simplified calculation:
Voltage along the line is usually not constant

136© 2009 Electric Power Research Institute, Inc. All rights reserved.
Roundtable

137© 2009 Electric Power Research Institute, Inc. All rights reserved.
Q&A Discussions
• Questions?


EPRI’s Green Transmission Efficiency InitiativeRegional Workshop Series
Call to Action and Next Steps
Karen Forsten, EPRI

140© 2009 Electric Power Research Institute, Inc. All rights reserved.
The Next Frontier: Transmission EfficiencyIndustry Workshops May/June 2009
West CoastWorkshop (June 12, 2009)Hosted by CAISO, SCEExecutive Champions: Executive Champions: Yakout Yakout MansourMansour (CAISO), (CAISO), Pedro Pizarro (SCE)Pedro Pizarro (SCE)
Mid Atlantic or Ohio Workshop (May 4, 2009)Hosted by PJM and AEPExecutive Champions: Terry Boston (PJM), Executive Champions: Terry Boston (PJM), Michael Heyeck (AEP)Michael Heyeck (AEP)
Dallas Workshop (May 20, 2009)Hosted by SPP, AEPExecutive Champions: Nick Executive Champions: Nick Brown (SPP), Mike Heyeck, AEP)Brown (SPP), Mike Heyeck, AEP)
Northeast Workshop (April 29, 2009)Hosted by NYISO, Con Ed, NYPA, LIPA Executive Champions: Steve Whitley Executive Champions: Steve Whitley (NYISO), Steve DeCarlo (NYPA), Lou (NYISO), Steve DeCarlo (NYPA), Lou Rana (Con Ed), Mike Hervey (LIPA)Rana (Con Ed), Mike Hervey (LIPA)
Southeast Workshop (June 15, 2009)Hosted by Rob Manning (TVA) and Hosted by Rob Manning (TVA) and Leslie Leslie SibertSibert (Southern)(Southern)
International Workshop (June 2, 2009)Hosted by PSE Operator, ESKOM, National Grid Executive Champions: Executive Champions: MagdaMagdaWasilukWasiluk HassaHassa (PSE Operator), (PSE Operator), Barry Barry MacCollMacColl (ESKOM), Ian Welch (ESKOM), Ian Welch (NG), Michael Heyeck (AEP)(NG), Michael Heyeck (AEP)
FERC Chairman Jon Wellinghoff Leading
the Executive Leadership Team

141© 2009 Electric Power Research Institute, Inc. All rights reserved.
Next Steps
• Compile key insights from regional
workshops
• Scope draft demonstration project
based on feedback
• Vet Draft with Executive and Technical
Steering Committees
• Assess Stimulus Opportunities
• Describe Opportunities at Sector council
Meetings Chicago Fall 2009

142© 2009 Electric Power Research Institute, Inc. All rights reserved.
Possible Green Transmission Timeline
09Q3 -10Q1 ???
Line Selection/ System (Region) Selection
Baseline Assessment (power flow, losses, etc.)
Evaluate candidate countermeasures
Estimate Energy, Demand, Equivalent CO2
Savings Estimate Capital & O&M Cost
Design, Engineering & Construction
Measurement & Verification Plan
Framework & Guideline
Project Meetings, Green Transmission Workshop & Conference

143© 2009 Electric Power Research Institute, Inc. All rights reserved.
EPRI T&D Efficiency Research & Demonstrations
Together we will … challenge ourselves as an industryto transform how we efficiently transmit & distribute
electricity while enabling our customers to better manage energy

144© 2009 Electric Power Research Institute, Inc. All rights reserved.Image from Image from NASA Visible EarthNASA Visible Earth


