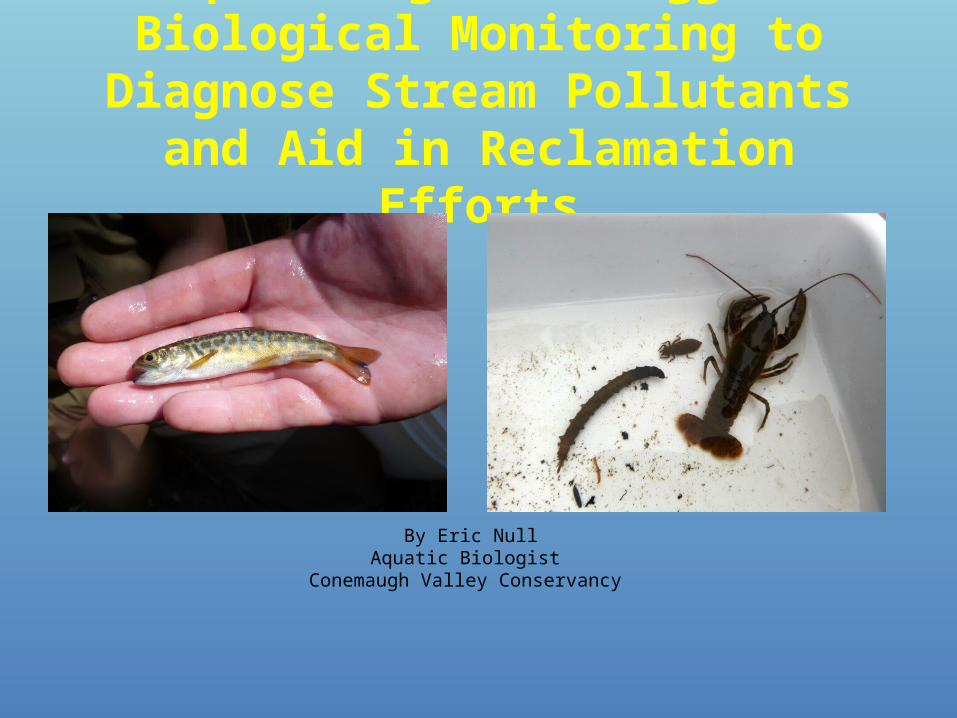
Incorporating Data Logger and Biological Monitoring to Diagnose Stream Pollutants
and Aid in Reclamation Efforts
By Eric NullAquatic Biologist
Conemaugh Valley Conservancy
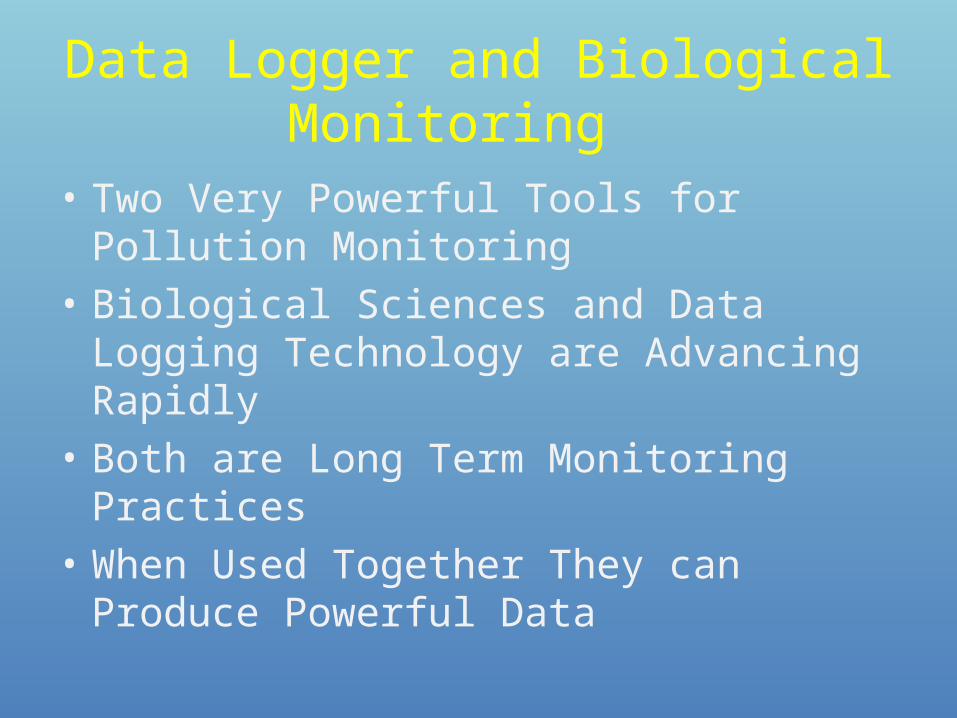
Data Logger and Biological Monitoring
• Two Very Powerful Tools for Pollution Monitoring
• Biological Sciences and Data Logging Technology are Advancing Rapidly
• Both are Long Term Monitoring Practices • When Used Together They can Produce
Powerful Data
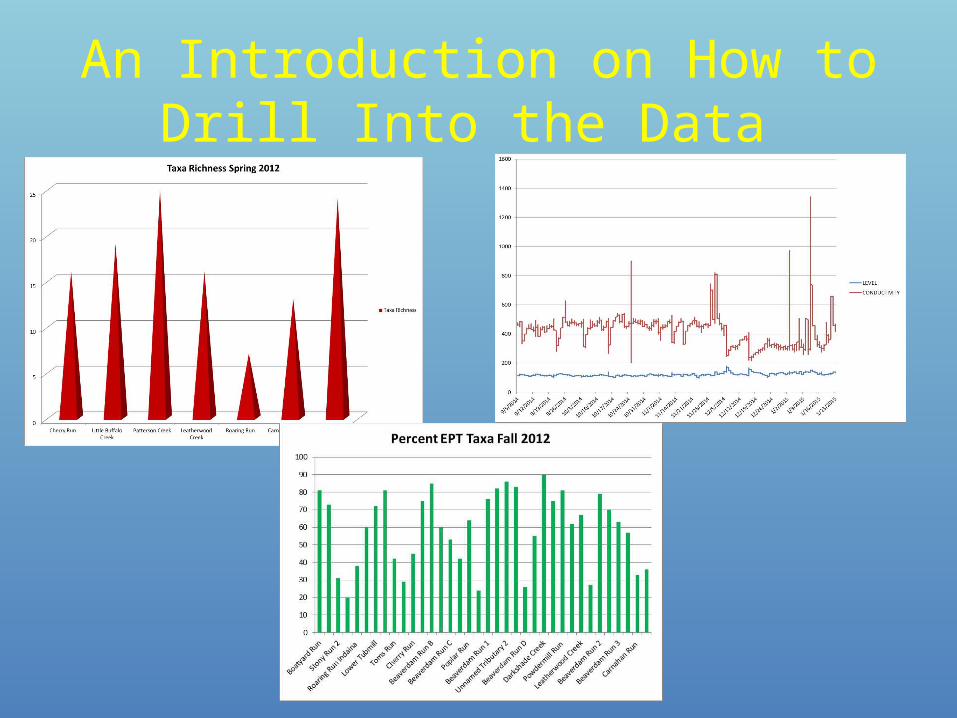
An Introduction on How to Drill Into the Data
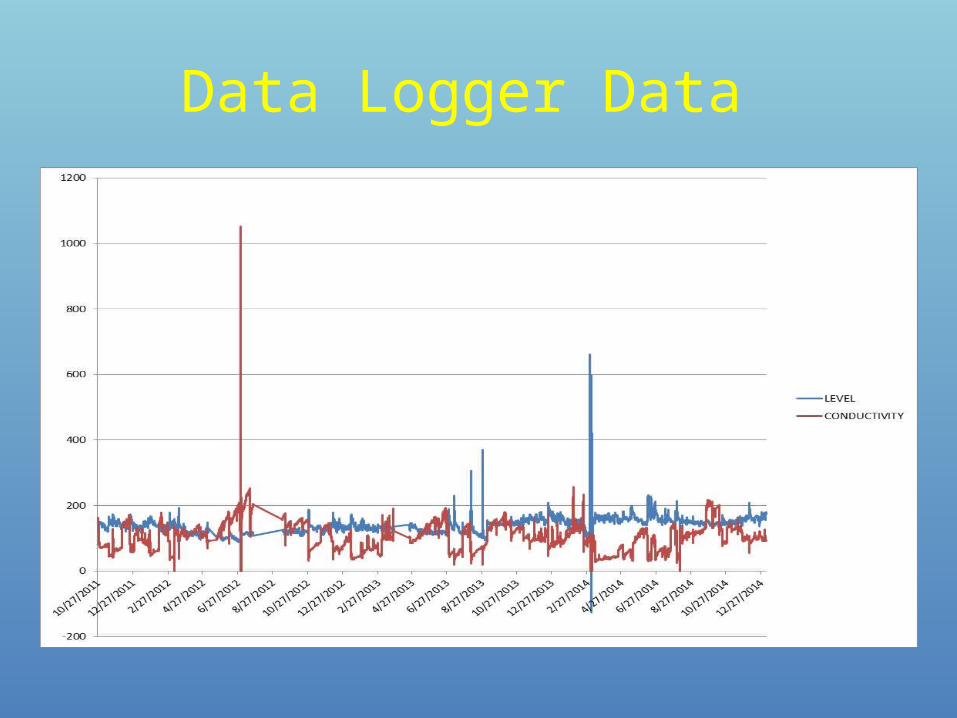
Data Logger Data
The Unique Qualities of Data Logger Data
• Data Logger Data Sets are Immense • Logging Intervals Must Be Short To Capture
Episodes (15 min)• This Data can not be Looked at Like Grab Data • Averages Change Drastically • Full Stream Behavior is Seen • Eyes Going Crossed and Migraines are
Symptoms
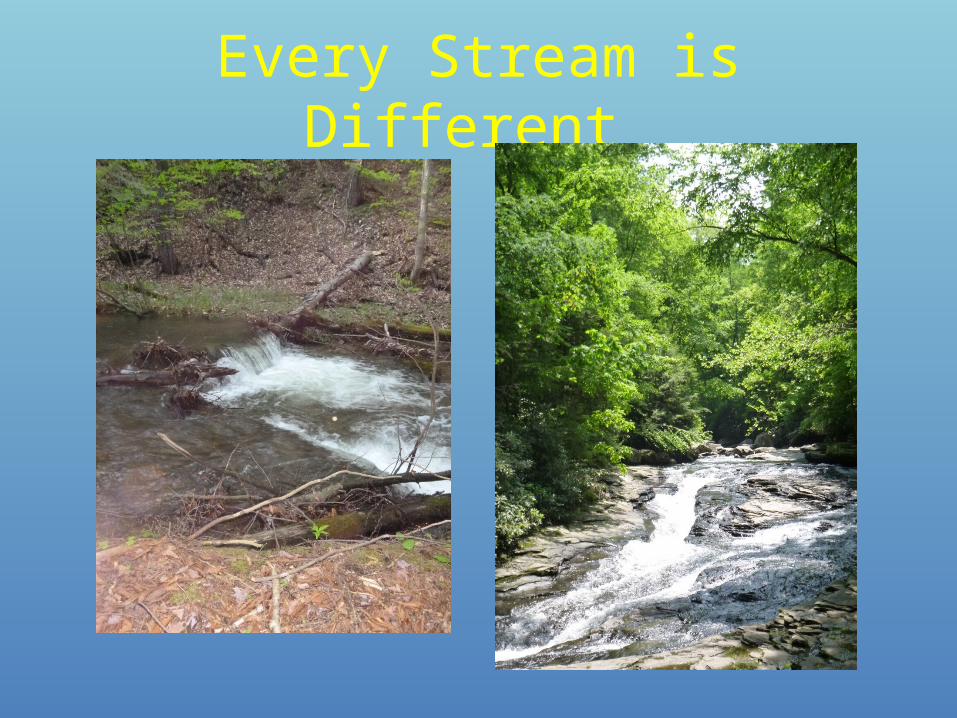
Every Stream is Different
Spikes and Valleys
• Can be Caused Naturally or by Disturbance • Frequency and Duration can Determine
Between Causes
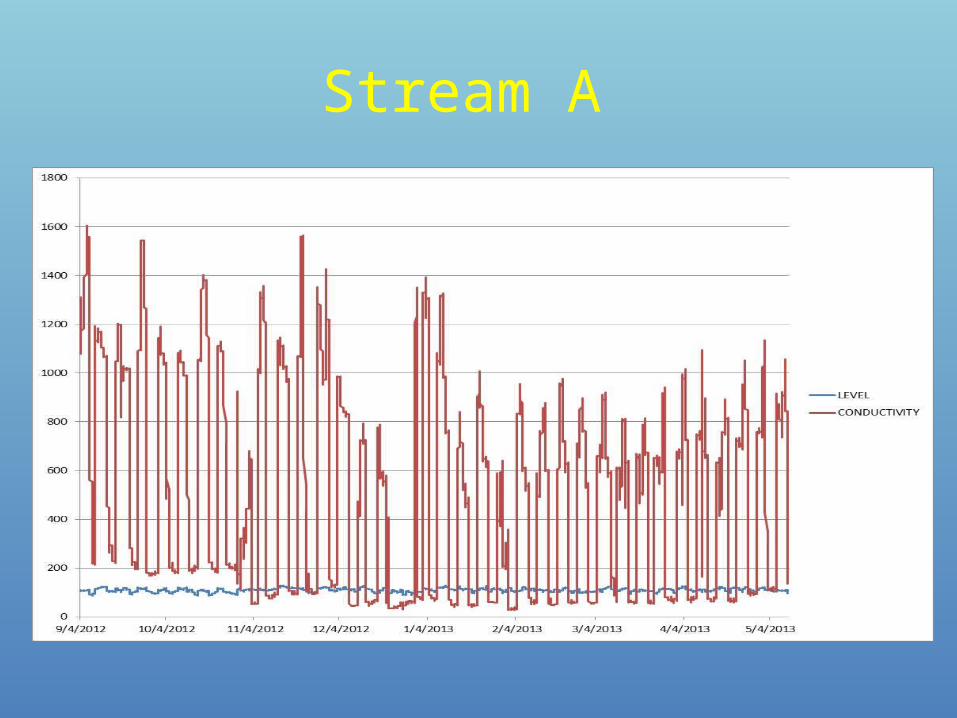
Stream A
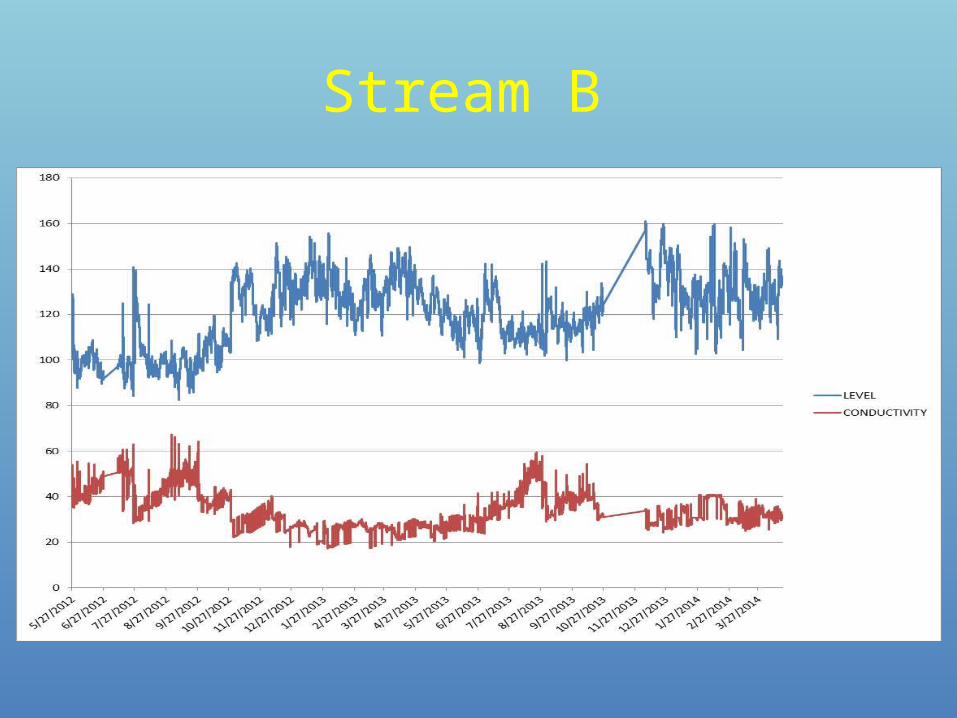
Stream B
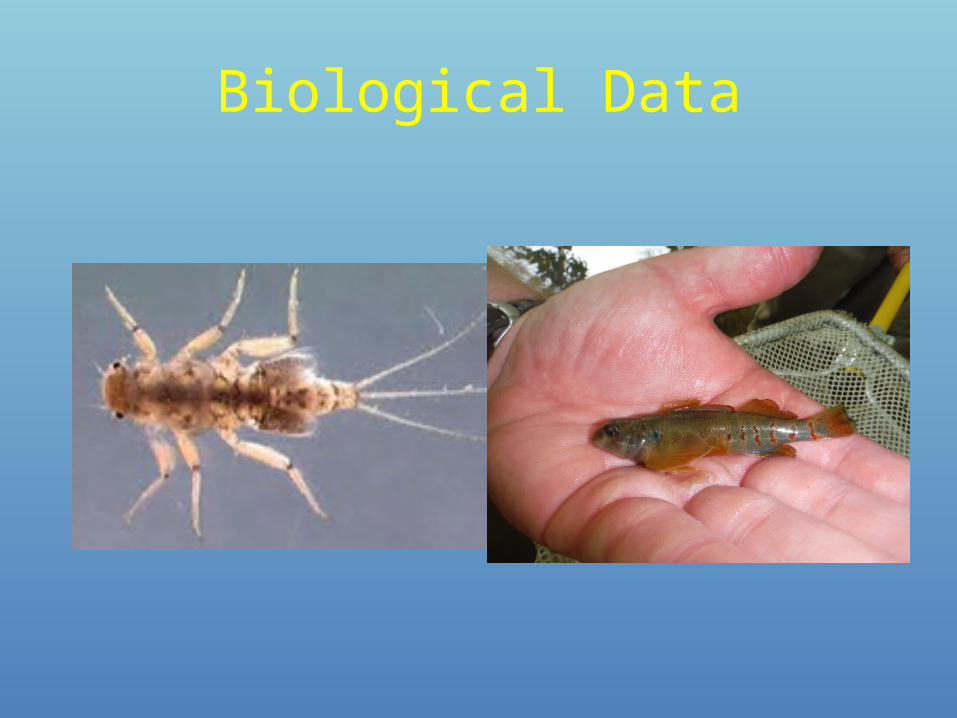
Biological Data
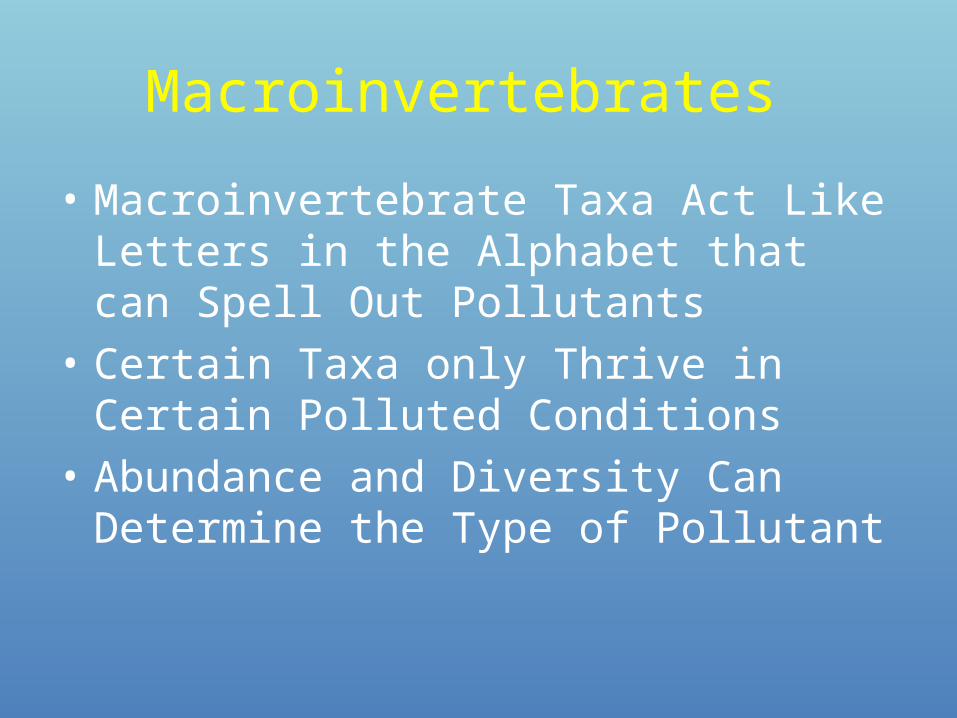
Macroinvertebrates
• Macroinvertebrate Taxa Act Like Letters in the Alphabet that can Spell Out Pollutants
• Certain Taxa only Thrive in Certain Polluted Conditions
• Abundance and Diversity Can Determine the Type of Pollutant
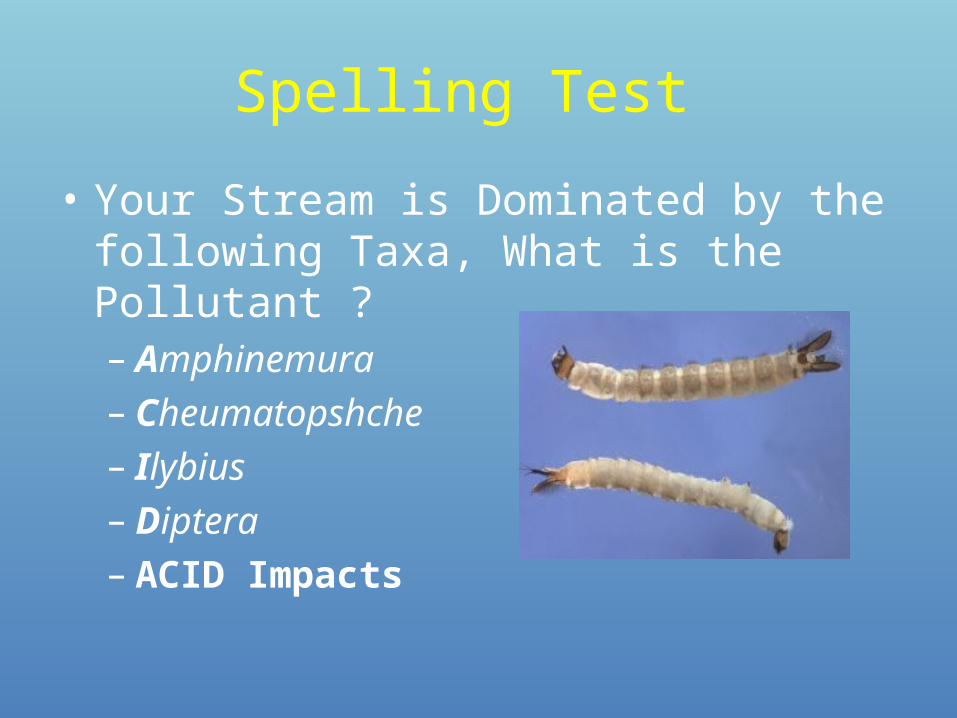
Spelling Test
• Your Stream is Dominated by the following Taxa, What is the Pollutant ?– Amphinemura– Cheumatopshche – Ilybius – Diptera – ACID Impacts
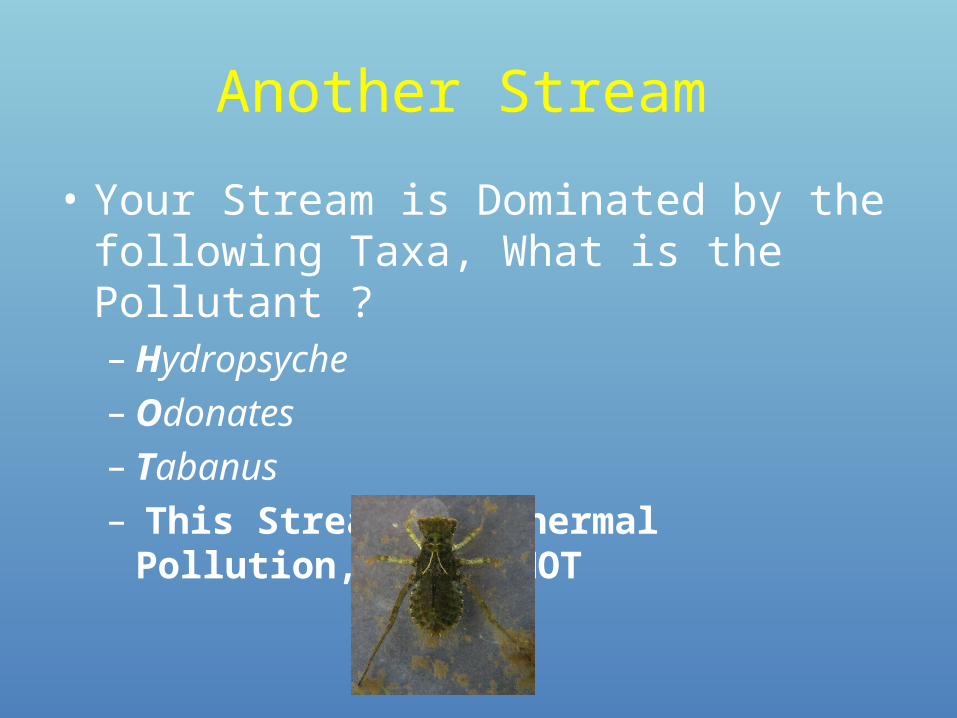
Another Stream
• Your Stream is Dominated by the following Taxa, What is the Pollutant ?– Hydropsyche – Odonates – Tabanus – This Stream has Thermal Pollution, It is HOT

One More
• Take a Guess what is Wrong Here – Psilotreta – Oligochaeta – Ochlerotatus– You guessed it Organics and Sewage
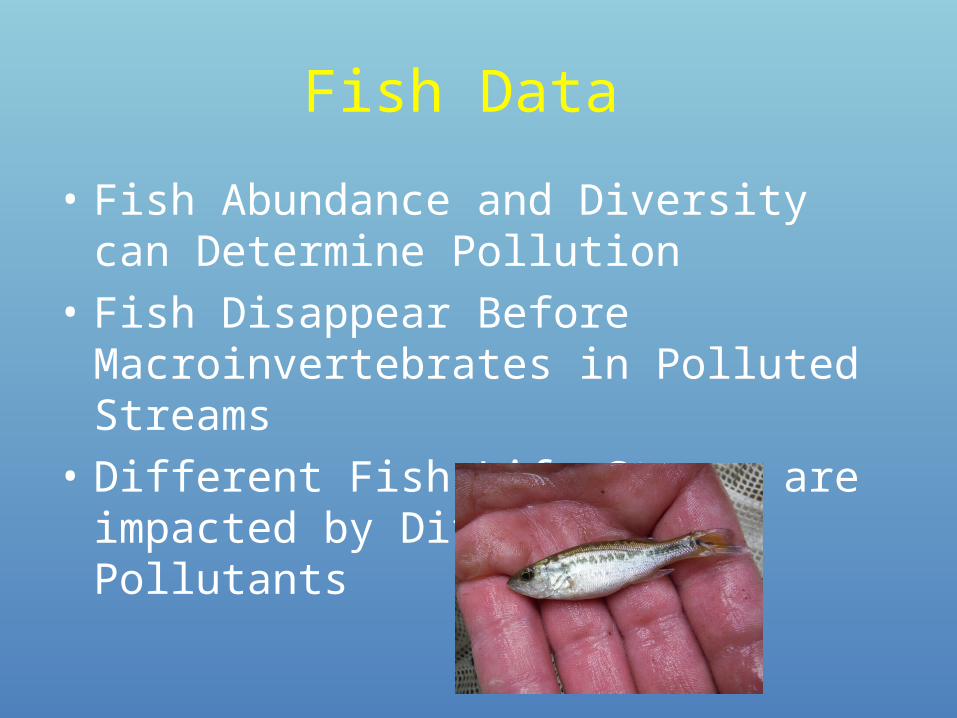
Fish Data
• Fish Abundance and Diversity can Determine Pollution
• Fish Disappear Before Macroinvertebrates in Polluted Streams
• Different Fish Life Stages are impacted by Different Pollutants

Cross Referencing Biological and Data Logger Data to Diagnose the Pollutant • This is When Both Make More Sense • Conductivity and Other Parameters Influence
Community Structure • The Community Structure Indicates What is
causing the Conductivity and Other Parameters to Behave the way they are Behaving
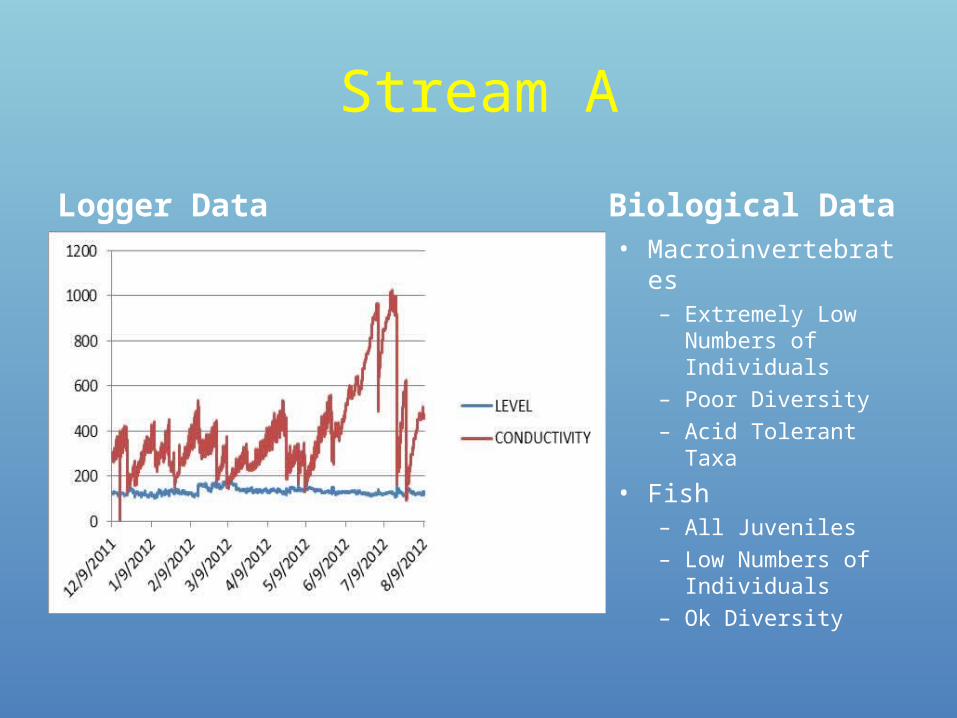
Stream A
Logger Data Biological Data • Macroinvertebrates
– Extremely Low Numbers of Individuals
– Poor Diversity – Acid Tolerant Taxa
• Fish – All Juveniles – Low Numbers of
Individuals – Ok Diversity
Stream A
• Pulsing Spikes with a Constant Occurrence• Depressed Biological Communities • No Adult Fish • Pollution Tolerant Macroinvertebrates • ACID and METALS
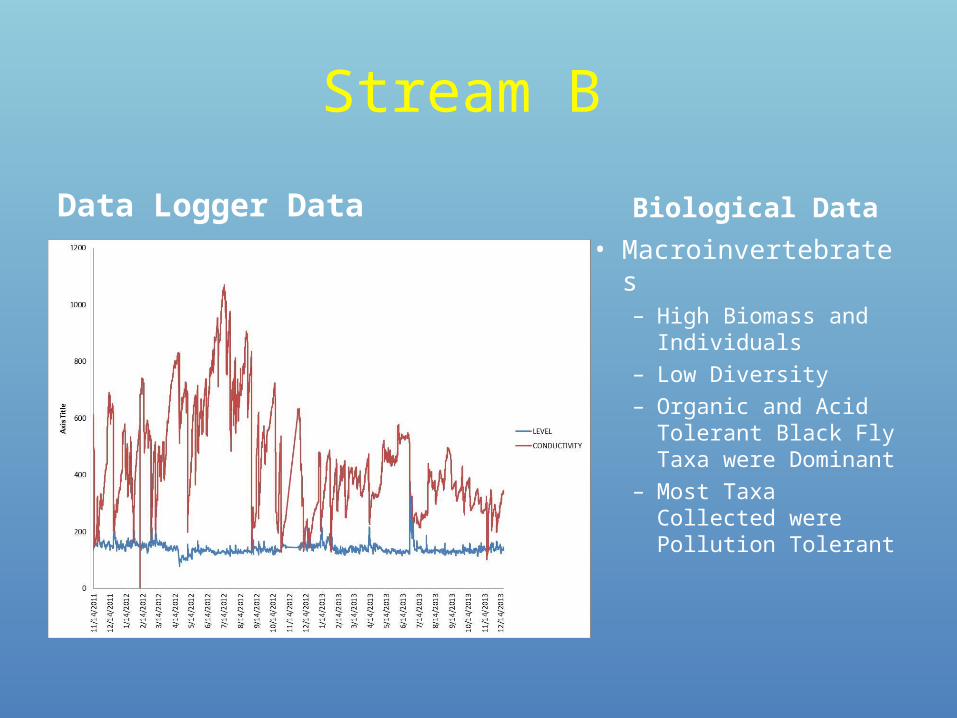
Stream B
Data Logger Data Biological Data • Macroinvertebrates
– High Biomass and Individuals
– Low Diversity – Organic and Acid
Tolerant Black Fly Taxa were Dominant
– Most Taxa Collected were Pollution Tolerant
Stream B
• Large Conductivity Spikes • High Biomass and Abundance • Low Diversity of Macros • Acidophilic Macroinvertebrates • ORGANICS AND ACID

Stream C (The Hard One)
Data Logger Data Biological Data • Macroinvertebrates
– Low Diversity and Numbers
– Acid Tolerant Taxa
• Fish– Low Diversity – Acid Tolerant Taxa – White Sucker/Creek
Chub
Stream C
• Consistent Mid Level Conductivity • Low Macroinvertebrate Diversity and
Abundance • Low Fish Abundance and Diversity • Pollution Tolerant Taxa (Fish and Macros)• Episodic Acidification with Alkalinity
Replacement by Metals and Acidity
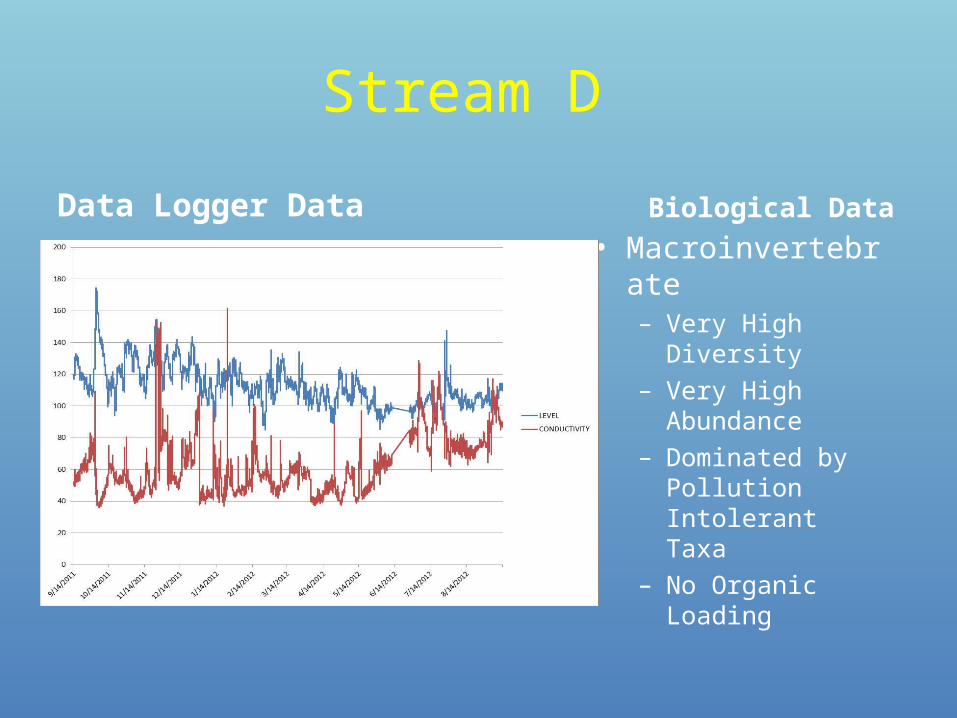
Stream D
Data Logger Data Biological Data • Macroinvertebrate
– Very High Diversity – Very High
Abundance – Dominated by
Pollution Intolerant Taxa
– No Organic Loading

Stream D
• Very Consistent and Low Conductivity • Very Diverse Macroinvertebrate Community • Volunteers and Staff Very Excited to
Electrofish in 2015 • HIGH QUALITY H2O
Conclusions
• Data Logger and Biological Data on their Own are Powerful Assessment Tools
• When Combined they can be used Very Effectively to Isolate Individual Pollutants
• Data Sets May Appear Confusing at First, but Over Time Become Easier to Interpret
• Using Both can Better Interpret Each Individual Data Set
Questions?


