Download - es_33_kostecki LBNL
8/8/2019 es_33_kostecki LBNL
http://slidepdf.com/reader/full/es33kostecki-lbnl 1/20
Interfacial Processes – Diagnostics
Robert Kostecki
Lawrence Berkeley National Laboratory
Berkeley, California 94720
May 21, 2009
This presentation does not contain any proprietary, confidential, or otherwise restricted informationProject ID es_33_kostecki
8/8/2019 es_33_kostecki LBNL
http://slidepdf.com/reader/full/es33kostecki-lbnl 2/20
Overview
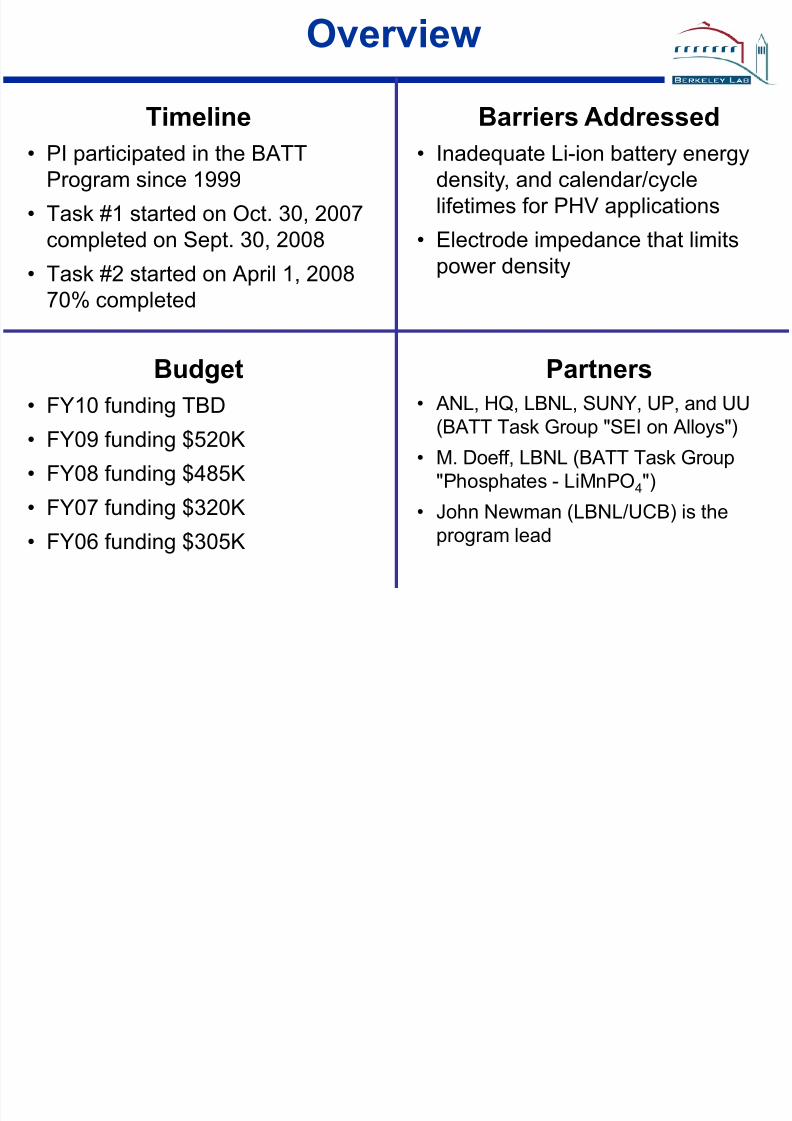
Timeline
• PI participated in the BATTProgram since 1999
• Task #1 started on Oct. 30, 2007completed on Sept. 30, 2008
• Task #2 started on April 1, 2008
70% completed
Budget
• FY10 funding TBD• FY09 funding $520K
• FY08 funding $485K
• FY07 funding $320K• FY06 funding $305K
Barriers Addressed
• Inadequate Li-ion battery energydensity, and calendar/cycle
lifetimes for PHV applications• Electrode impedance that limits
power density
Partners
• ANL, HQ, LBNL, SUNY, UP, and UU(BATT Task Group "SEI on Alloys")
• M. Doeff, LBNL (BATT Task Group"Phosphates - LiMnPO4")
• John Newman (LBNL/UCB) is theprogram lead
8/8/2019 es_33_kostecki LBNL
http://slidepdf.com/reader/full/es33kostecki-lbnl 3/20
Project Objectives
Establish direct correlations between BATT baseline electrodessurface chemistry, interfacial phenomena morphology, topology, anddegradation mechanisms
Evaluate and improve the capacity and cycle life of intermetallicanodes
Determine physico-chemical properties of the SEI i.e., chemical
composition, reactions kinetics, morphology, ionic/electronicconductivity etc.
Investigate electrocatalytic behavior of intermetallic anodes in organicelectrolytes
Characterize degradation modes, improve SEI long-term stability inhigh-energy Li-ion systems
Evaluate the effect of surface composition and architecture on
electrochemical behavior of the electrode Provide remedies to interface instability e.g., new alloys and/or
structures, electrolyte additives, co-deposition of other metals etc.
8/8/2019 es_33_kostecki LBNL
http://slidepdf.com/reader/full/es33kostecki-lbnl 4/20
Milestones
1. Preliminary results of the Li transport studyin the Devanathan-Stachurski cell (04-2008)
Accomplished on time. Novel experimental methodology developed
and applied to study of Li diffusion in graphitic carbons
2. Evaluate surface phenomena on Sn anodes and their impacton the electrochemical behavior of the electrode. (08-2008)
Accomplished on time. Preliminary in situ AFM studies completed
3. Preliminary results of ellipsometric and optical spectroscopystudies of the SEI formation on Sn anodes (09-2009)
Work in progress ~70% completed
4. Evaluate surface and bulk phenomena in LiMnPO4 cathodes
(07-2009) Work in progress ~50% completed
8/8/2019 es_33_kostecki LBNL
http://slidepdf.com/reader/full/es33kostecki-lbnl 5/20
Study of Lithium Diffusionin Graphitic Carbons
Approach
• Design and use an electrochemical cell of the Devanathan-Stachurski typeto study mass and charge transfer mechanism in graphite
• Develop a time-dependent mass transport model to validate the observedexperimental behavior and determine Li transport parameters in graphite
• Apply in situ and ex situ Raman and FTIR spectroscopy, spectroscopic
ellipsometry, AFM, SEM, HRTEM, and electrochemical techniques todetect and characterize surface processes in graphite anodes
Accomplishments
• Two different mechanisms of Li diffusion in graphite were revealed andquantified
• New nano- and micro-designs of high performance carbonaceousmaterials were proposed

8/8/2019 es_33_kostecki LBNL
http://slidepdf.com/reader/full/es33kostecki-lbnl 6/20
Study of Lithium Diffusionin Graphitic Carbons
Reported lithium diffusion coefficients in graphite vary from 10-6 to 10-14 cm2s-1
J. Phys. Chem. Sol. 67 882 (2006)
Type of Graphite DLi (cm2 s-1) Technique Reference
Natural Graphite 10-7 – 10-9 EIS Takami et al. J Electrochem Soc (1995)
Artificial Graphite 10-7.5 – 10-9.4 EIS Takami et al. J Electrochem Soc (1995)
Graphite powder 10-12 – 9.3x10-
14 PITT, EISYu et al. J Electrochem Soc (1999)
MCMB 10-6 – 10-10 EIS Umeda et al. Electrochim Acta (2001)
Natural Graphite 10-10 – 10-11 CV Shim et al. J Power Sources (2004)
HOPG 10-11 – 10-12 EIS NuLi et al. J Phys Chem Sol (2006)
What causes this disparity of results?
8/8/2019 es_33_kostecki LBNL
http://slidepdf.com/reader/full/es33kostecki-lbnl 7/20
Study of Lithium Diffusionin Graphitic Carbons
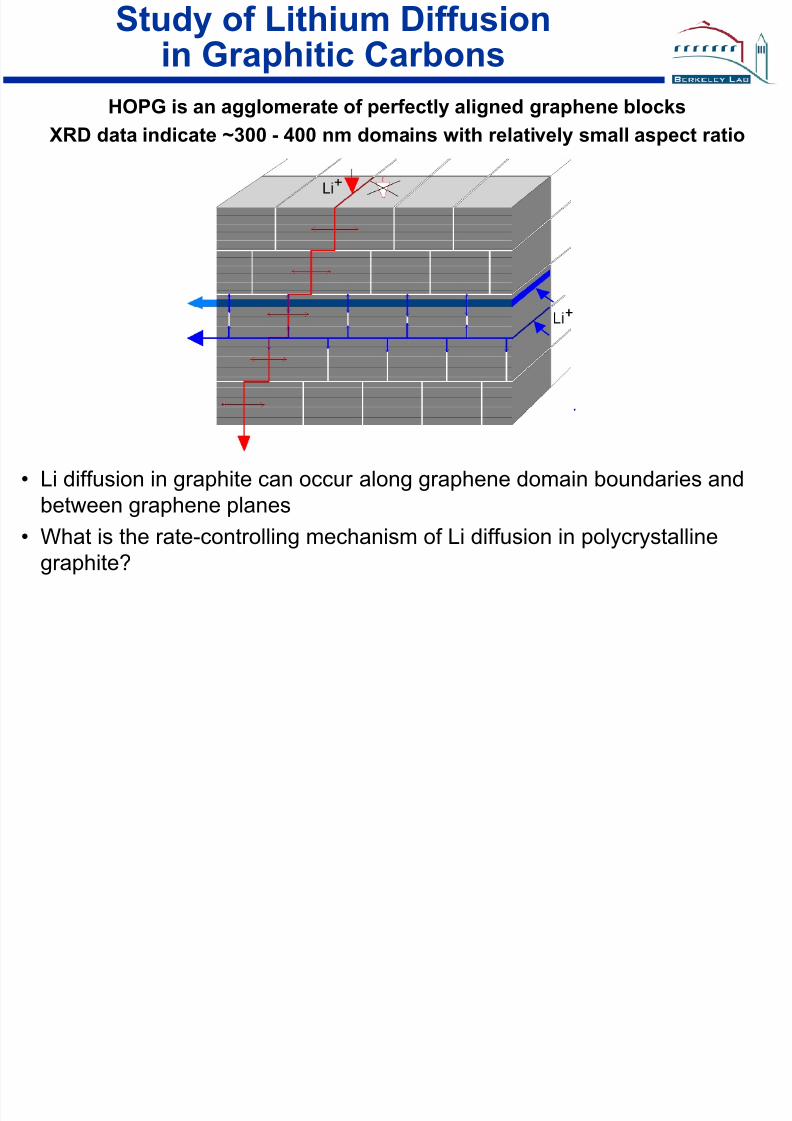
• Li diffusion in graphite can occur along graphene domain boundaries andbetween graphene planes
• What is the rate-controlling mechanism of Li diffusion in polycrystallinegraphite?
HOPG is an agglomerate of perfectly aligned graphene blocks
XRD data indicate ~300 - 400 nm domains with relatively small aspect ratio
8/8/2019 es_33_kostecki LBNL
http://slidepdf.com/reader/full/es33kostecki-lbnl 8/20
Study of Lithium Diffusionin Graphitic Carbons
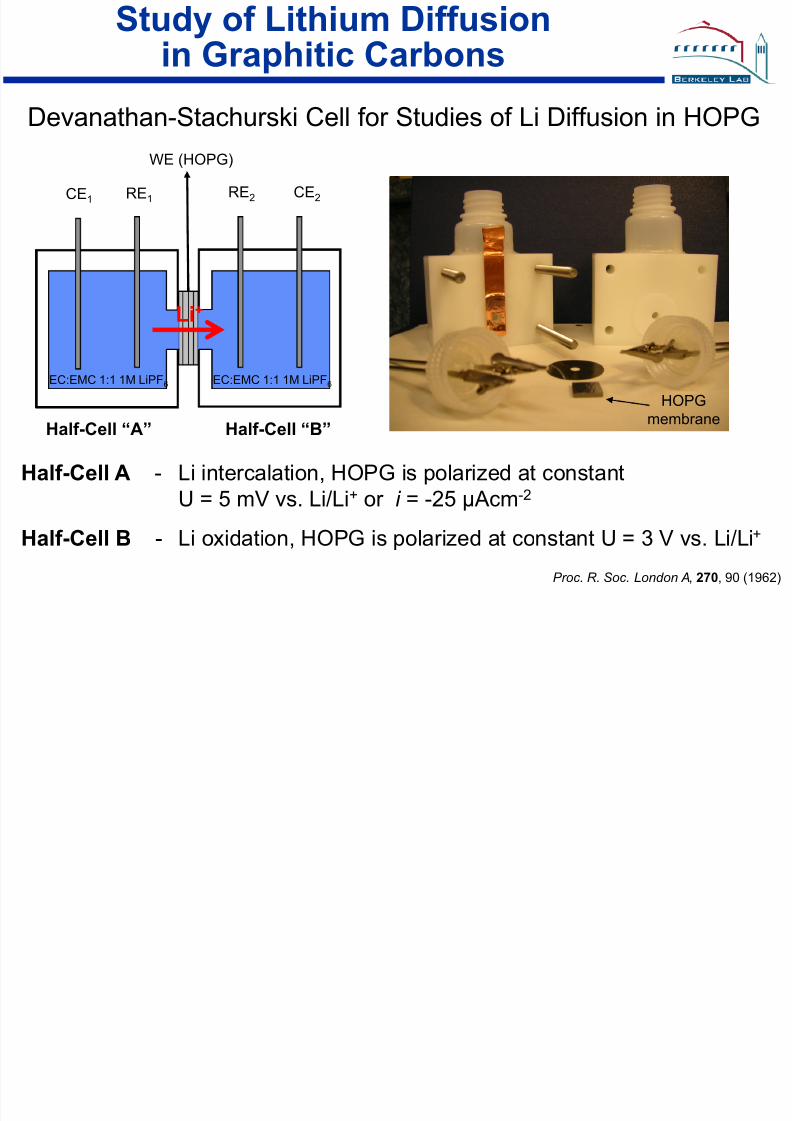
Half-Cell A - Li intercalation, HOPG is polarized at constantU = 5 mV vs. Li/Li+ or i = -25 µAcm-2
Half-Cell B - Li oxidation, HOPG is polarized at constant U = 3 V vs. Li/Li+
Proc. R. Soc. London A, 270, 90 (1962)
WE (HOPG)
•Lithium metal
CE2RE1CE1RE2
Half-Cell “A” Half-Cell “B”
EC:EMC 1:1 1M LiPF6 EC:EMC 1:1 1M LiPF6
Li+
HOPG
membrane
Devanathan-Stachurski Cell for Studies of Li Diffusion in HOPG
8/8/2019 es_33_kostecki LBNL
http://slidepdf.com/reader/full/es33kostecki-lbnl 9/20
Time/ h0 50 100 150
P o t e n t i a l ( V )
v s .
L i / L i +
0.0
0.5
1.0
1.5
2.0
2.5
C u r r e n t ( m
A g - 1 )
0.0
0.1
0.2
0.3
0.4
0.5
cell "B"
cell "A"
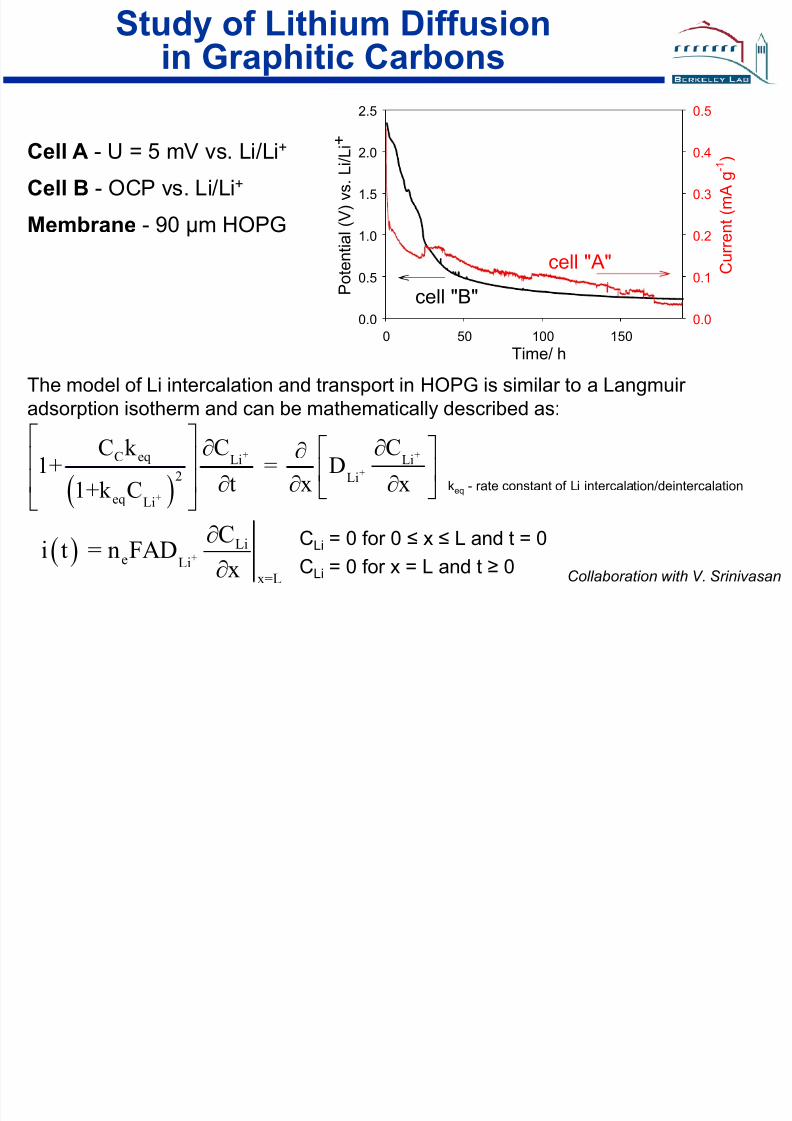
Study of Lithium Diffusionin Graphitic Carbons
The model of Li intercalation and transport in HOPG is similar to a Langmuir
adsorption isotherm and can be mathematically described as:
( )
+ +
+
+
C eq Li Li
2 Li
eq Li
C CC k 1+ = D
t x x1+k C
⎡ ⎤ ∂ ∂⎡ ⎤∂⎢ ⎥ ⎢ ⎥⎢ ⎥ ∂ ∂ ∂⎣ ⎦⎣ ⎦
( ) +
Lie Li
x=L
Ci t = n FAD
x
∂∂
keq - rate constant of Li intercalation/deintercalation
Cell A - U = 5 mV vs. Li/Li+
Cell B - OCP vs. Li/Li+
Membrane - 90 μm HOPG
CLi = 0 for 0 ≤ x ≤ L and t = 0
CLi = 0 for x = L and t ≥ 0Collaboration with V. Srinivasan
8/8/2019 es_33_kostecki LBNL
http://slidepdf.com/reader/full/es33kostecki-lbnl 10/20
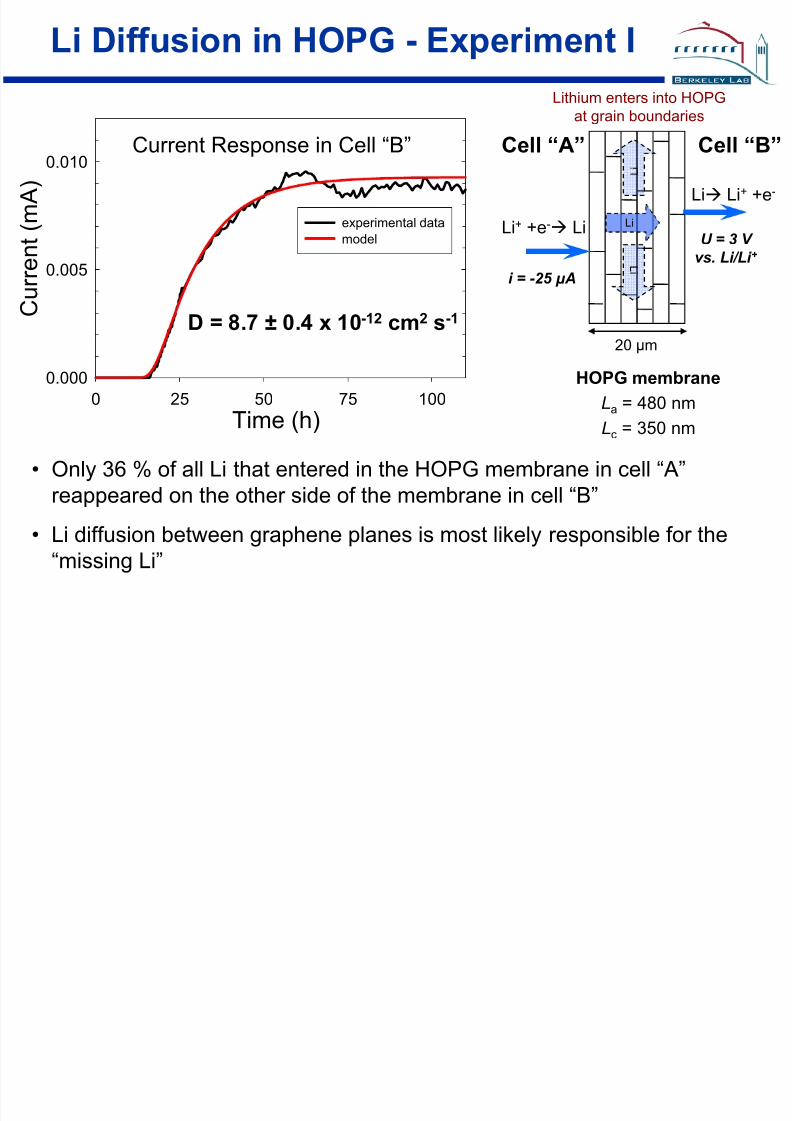
Li Diffusion in HOPG - Experiment I
Time (h)0 25 50 75 100
C
u r r e n t ( m A )
0.000
0.005
0.010
experimental data
model
Current Response in Cell “B”
Li+ +e- Li
Li Li+ +e-
Li
Cell “A” Cell “B”
20 μm
HOPG membrane
La
= 480 nm
Lc = 350 nm
i = -25 μ A
U = 3 V
vs. Li/Li +
• Only 36 % of all Li that entered in the HOPG membrane in cell “A”reappeared on the other side of the membrane in cell “B”
• Li diffusion between graphene planes is most likely responsible for the“missing Li”
Lithium enters into HOPGat grain boundaries
D = 8.7 ± 0.4 x 10⁻¹² cm2 s-1
L i
L i
8/8/2019 es_33_kostecki LBNL
http://slidepdf.com/reader/full/es33kostecki-lbnl 11/20
time (h)0.0 0.2 0.4 0.6 0.8 1.0
C
u r r e n t ( m A
)
0.00
0.01
0.02
0.03
experimental data
model
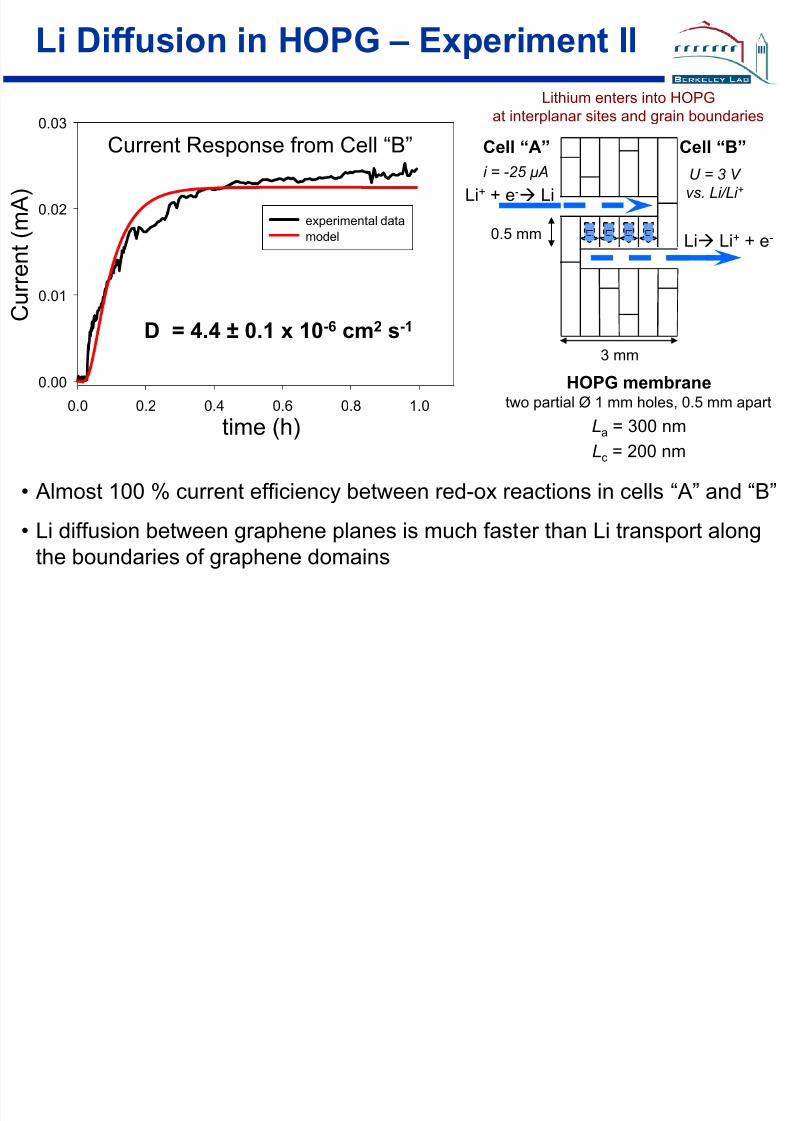
Li Diffusion in HOPG – Experiment II
D = 4.4 ± 0.1 x 10⁻⁶ cm2 s-1
Current Response from Cell “B”
HOPG membranetwo partial Ø 1 mm holes, 0.5 mm apart
La = 300 nm
Lc = 200 nm
L i
Li+ + e- Li
Li Li+ + e-0.5 mmL i
L i
L i
Cell “A” Cell “B”
Lithium enters into HOPGat interplanar sites and grain boundaries
U = 3 V
vs. Li/Li +i = -25 μ A
3 mm
• Almost 100 % current efficiency between red-ox reactions in cells “A” and “B”
• Li diffusion between graphene planes is much faster than Li transport alongthe boundaries of graphene domains
8/8/2019 es_33_kostecki LBNL
http://slidepdf.com/reader/full/es33kostecki-lbnl 12/20
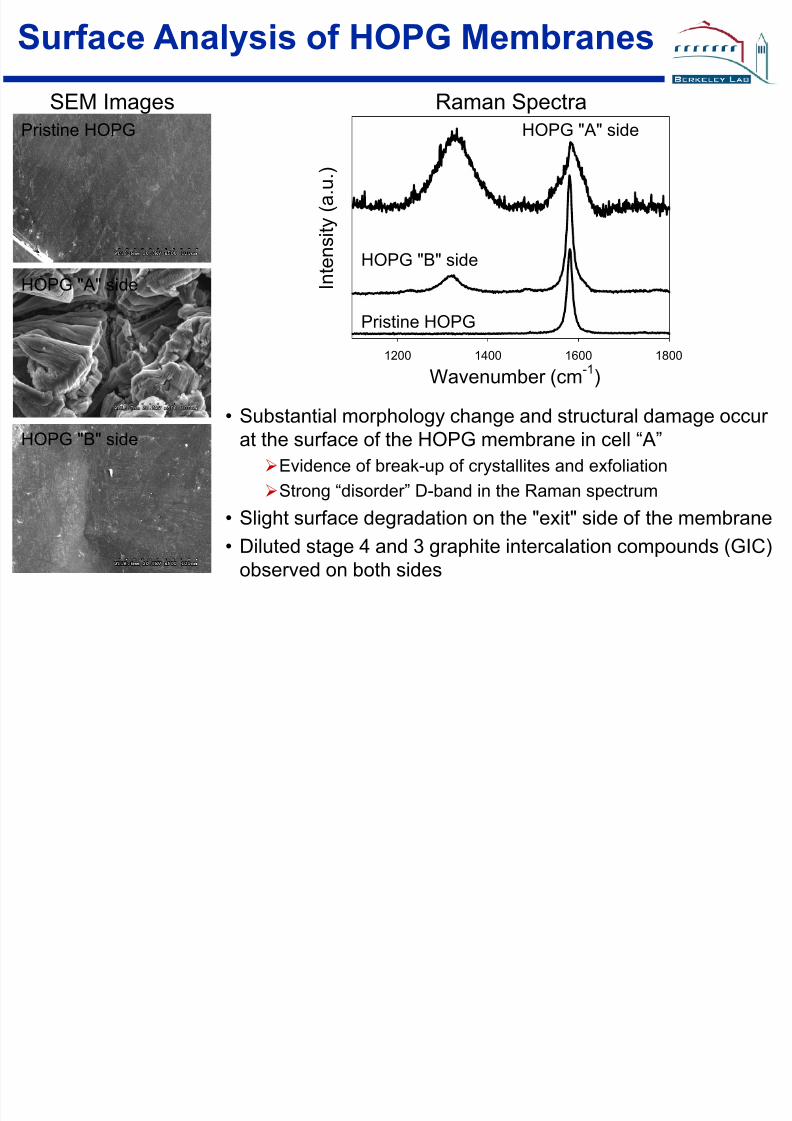
Surface Analysis of HOPG Membranes
SEM ImagesPristine HOPG
HOPG "B" side
HOPG "A" side
Wavenumber (cm-1
)1200 1400 1600 1800
I n t e n s i t y ( a . u . )
• Substantial morphology change and structural damage occur at the surface of the HOPG membrane in cell “A”
Evidence of break-up of crystallites and exfoliation
Strong “disorder” D-band in the Raman spectrum
• Slight surface degradation on the "exit" side of the membrane• Diluted stage 4 and 3 graphite intercalation compounds (GIC)
observed on both sides
Raman Spectra
Pristine HOPG
HOPG "A" side
HOPG "B" side
8/8/2019 es_33_kostecki LBNL
http://slidepdf.com/reader/full/es33kostecki-lbnl 13/20
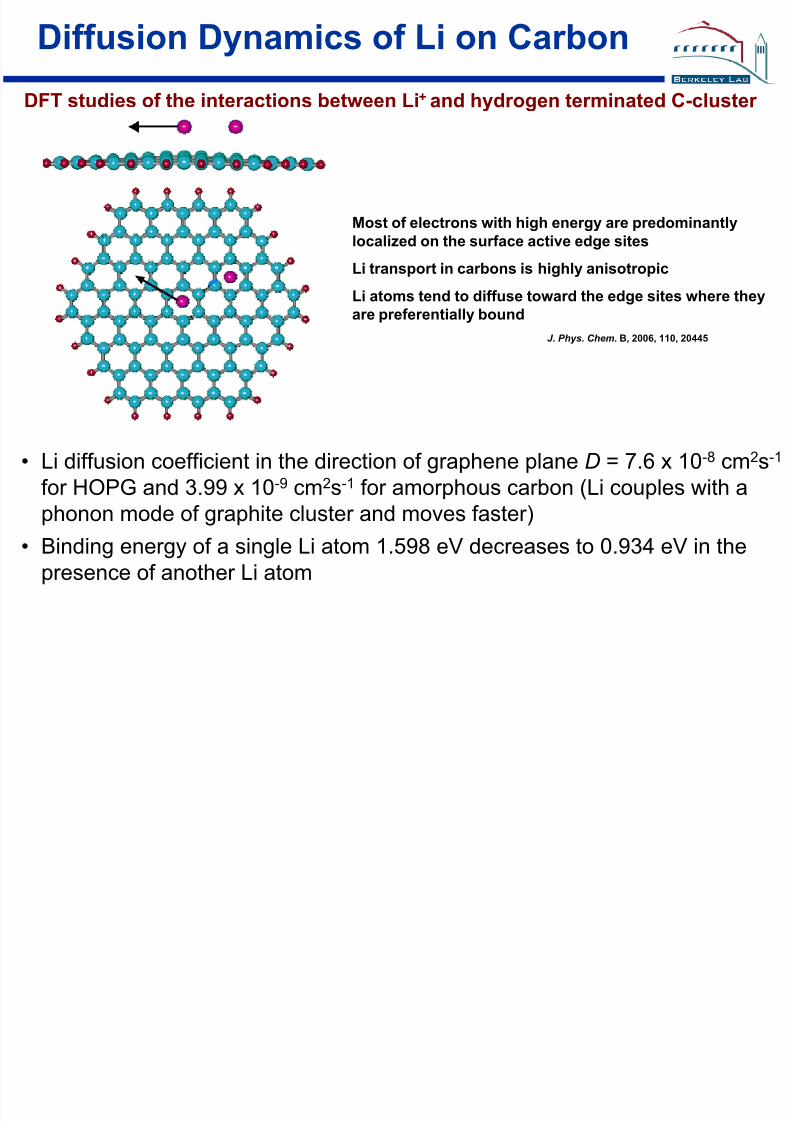
Diffusion Dynamics of Li on Carbon
• Li diffusion coefficient in the direction of graphene plane D = 7.6 x 10⁻⁸ cm2s-1
for HOPG and 3.99 x 10⁻⁹ cm2s-1 for amorphous carbon (Li couples with a
phonon mode of graphite cluster and moves faster)• Binding energy of a single Li atom 1.598 eV decreases to 0.934 eV in the
presence of another Li atom
Most of electrons with high energy are predominantly
localized on the surface active edge sites
Li transport in carbons is highly anisotropic
Li atoms tend to diffuse toward the edge sites where they
are preferentially bound
J. Phys. Chem. B, 2006, 110, 20445
DFT studies of the interactions between Li+
and hydrogen terminated C-cluster
8/8/2019 es_33_kostecki LBNL
http://slidepdf.com/reader/full/es33kostecki-lbnl 14/20
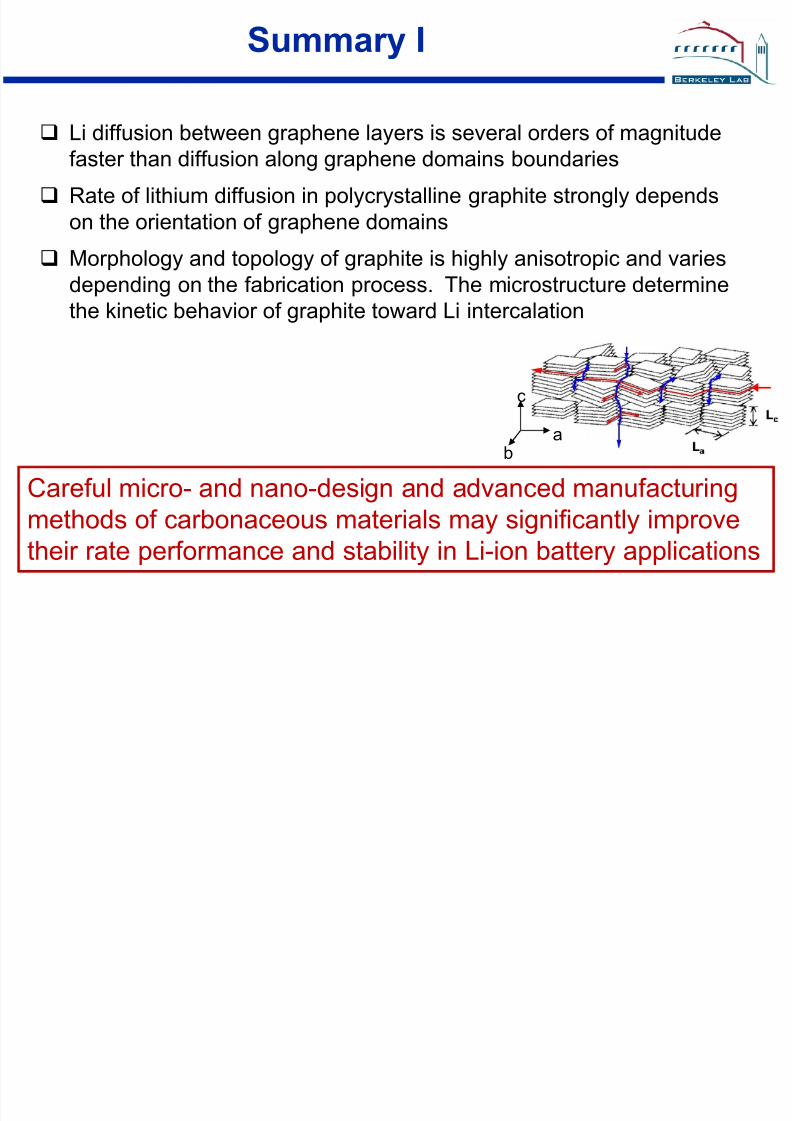
Summary I
Li diffusion between graphene layers is several orders of magnitudefaster than diffusion along graphene domains boundaries
Rate of lithium diffusion in polycrystalline graphite strongly dependson the orientation of graphene domains
Morphology and topology of graphite is highly anisotropic and variesdepending on the fabrication process. The microstructure determine
the kinetic behavior of graphite toward Li intercalation
Careful micro- and nano-design and advanced manufacturing
methods of carbonaceous materials may significantly improvetheir rate performance and stability in Li-ion battery applications
c
ab
St d f I t f i l Ph
8/8/2019 es_33_kostecki LBNL
http://slidepdf.com/reader/full/es33kostecki-lbnl 15/20
Study of Interfacial Phenomenaat Sn Anodes
Approach• Apply in situ and ex situ Raman and FTIR spectroscopy, spectroscopic
ellipsometry, AFM, SEM, HRTEM, and electrochemical techniques to
detect and characterize surface processes at intermetallic anodes• Manufacture and use model mirror-finished Sn electrodes to detect and
monitor early stages of the SEI formation
• Determine the nature and kinetics of surface phenomena and their
implications for long–term electrochemical performance of the intermetallicanodes in high-energy Li-ion systems
Accomplishments
• Preliminary assessment of interfacial processes on Sn electrode wascompleted
In situ studies revealed that an effective SEI layer never forms on Snin EC-based electrolytes
• Effective strategies to suppress unwanted surface reactions on Snelectrodes were proposed
Collaboration with BATT Task Group "SEI on Alloys"
St d f I t f i l Ph
8/8/2019 es_33_kostecki LBNL
http://slidepdf.com/reader/full/es33kostecki-lbnl 16/20
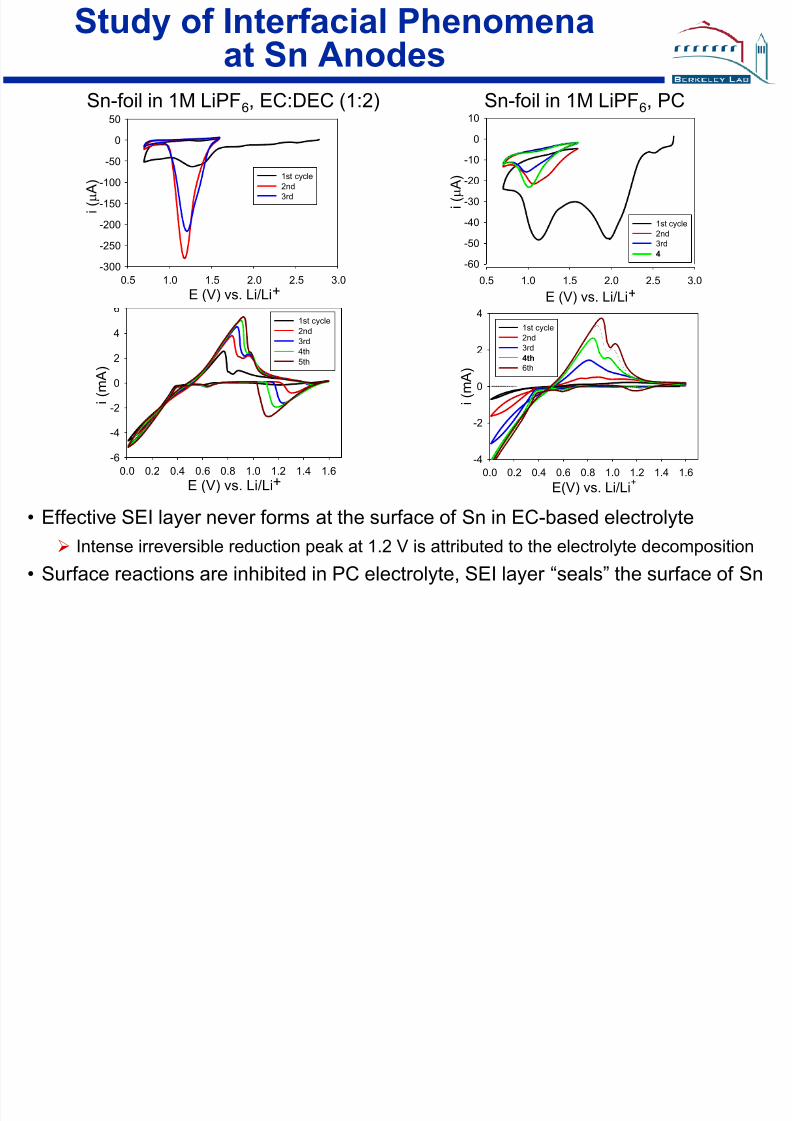
Study of Interfacial Phenomenaat Sn Anodes
• Effective SEI layer never forms at the surface of Sn in EC-based electrolyte Intense irreversible reduction peak at 1.2 V is attributed to the electrolyte decomposition
• Surface reactions are inhibited in PC electrolyte, SEI layer “seals” the surface of Sn
E (V) vs. Li/Li+0.0 0.2 0.4 0.6 0.8 1.0 1.2 1.4 1.6
i ( m A )
-6
-4
-2
0
2
4
6 1st cycle
2nd3rd4th
5th
E (V) vs. Li/Li+0.5 1.0 1.5 2.0 2.5 3.0
i ( μ A )
-300
-250
-200-150
-100
-50
0
50
1st cycle2nd3rd
E(V) vs. Li/Li+
0.0 0.2 0.4 0.6 0.8 1.0 1.2 1.4 1.6
i ( m A )
-4
-2
0
2
41st cycle2nd3rd
4th
6th
E (V) vs. Li/Li+0.5 1.0 1.5 2.0 2.5 3.0
i ( μ
A )
-60
-50
-40
-30
-20
-10
0
10
1st cycle2nd3rd
4
Sn-foil in 1M LiPF6, EC:DEC (1:2) Sn-foil in 1M LiPF6, PC
St d f I t f i l Ph
8/8/2019 es_33_kostecki LBNL
http://slidepdf.com/reader/full/es33kostecki-lbnl 17/20
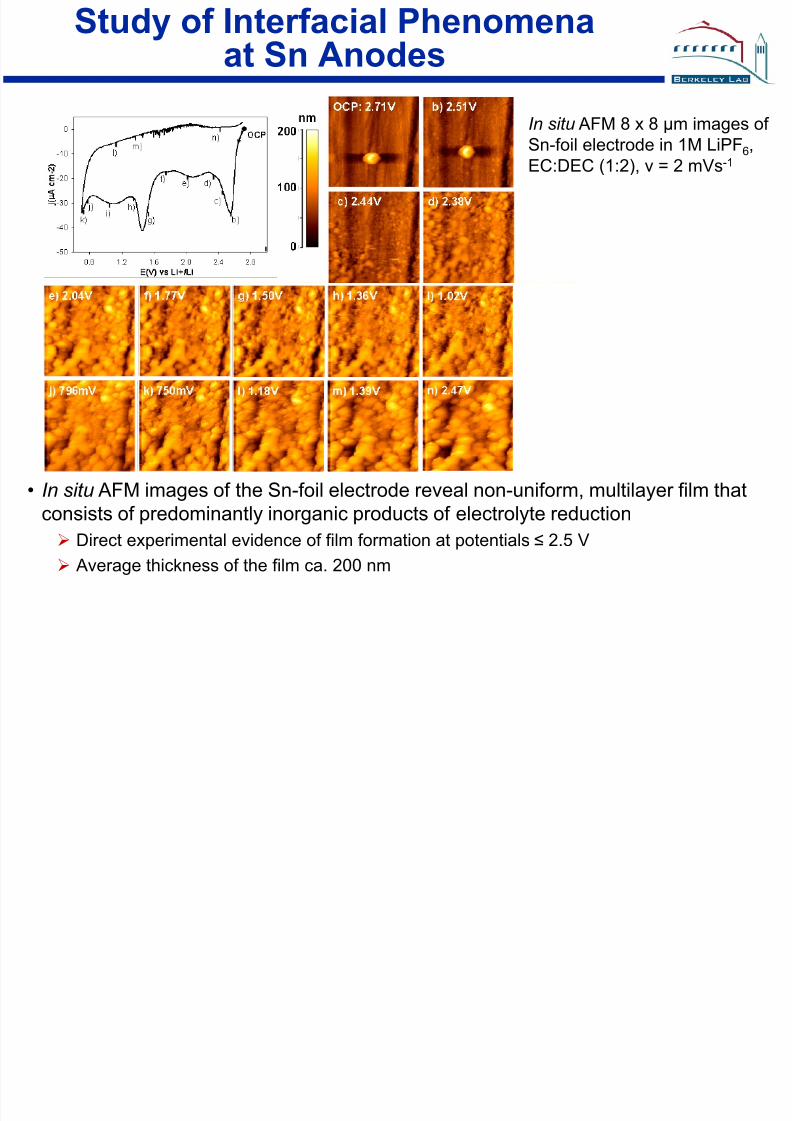
Study of Interfacial Phenomenaat Sn Anodes
• In situ AFM images of the Sn-foil electrode reveal non-uniform, multilayer film that
consists of predominantly inorganic products of electrolyte reduction Direct experimental evidence of film formation at potentials ≤ 2.5 V
Average thickness of the film ca. 200 nm
In situ AFM 8 x 8 μm images of Sn-foil electrode in 1M LiPF6,EC:DEC (1:2), v = 2 mVs-1
St di f I t f i l Ph
8/8/2019 es_33_kostecki LBNL
http://slidepdf.com/reader/full/es33kostecki-lbnl 18/20
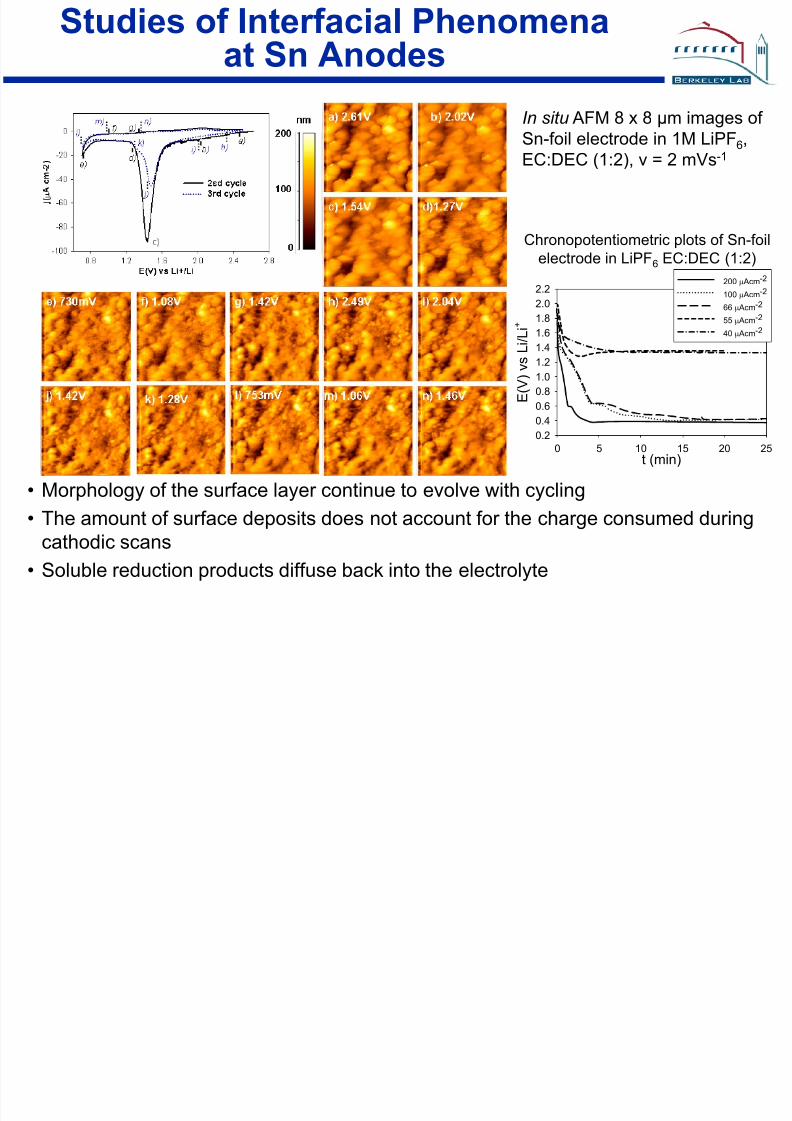
Studies of Interfacial Phenomenaat Sn Anodes
• Morphology of the surface layer continue to evolve with cycling
• The amount of surface deposits does not account for the charge consumed duringcathodic scans
• Soluble reduction products diffuse back into the electrolyte
In situ AFM 8 x 8 μm images of Sn-foil electrode in 1M LiPF6,EC:DEC (1:2), v = 2 mVs-1
t (min)0 5 10 15 20 25
E ( V ) v s L i / L i +
0.2
0.4
0.6
0.8
1.0
1.2
1.4
1.6
1.8
2.0
2.2200 μAcm-2
100 μAcm-2
66 μAcm-2
55 μAcm-2
40 μAcm-2
Chronopotentiometric plots of Sn-foilelectrode in LiPF6 EC:DEC (1:2)

8/8/2019 es_33_kostecki LBNL
http://slidepdf.com/reader/full/es33kostecki-lbnl 19/20
Summary II
Preliminary assessment of interfacial processes on Sn electrode wascompleted
In situ studies revealed that the nature and kinetics of surface reactions
are strongly dependent on the electrode and electrolyte Effective SEI layer never forms at the surface of Sn in EC-based electrolytes
Soluble products of electrolyte reduction diffuse back into the electrolyte
Surface reactions on Sn in PC-based electrolytes are inhibited. Stable SEI
layer forms after a few formation cycles
Contrary to crystalline tin, amorphous Sn tends to produce a stable SEI layer
Unwanted cathodic surface processes can be suppressed by the presence of
thin surface coatings of Cu or Ag
It is critical for the long-term electrochemical performance of intermetallic anodes to suppress unwanted surface reactions.
Coordinated electrode and electrolyte design must be carried out toachieve interfacial stability of Sn anodes in Li-ion battery applications.
8/8/2019 es_33_kostecki LBNL
http://slidepdf.com/reader/full/es33kostecki-lbnl 20/20
Future Work
• Continue studies of mass and charge transfer mechanisms at theelectrode-electrolyte interface
Develop multi-task spectro-electrochemical cell of the Devanathan-Stachurskitype to study in situ and model kinetics of Li intercalation and diffusion through
electrode materials (V. Srinivasan)• Apply in situ and ex situ instrumental methods to detect and
characterize surface processes in Li-ion intermetallic anodes
Comprehensive fundamental in situ spectroscopic ellipsometry in conjunction
with AFM and FTIR/Raman surface analysis studies of the SEI layer formationon Sn and Si electrodes will be carried out
Cooperate with the BATT Interfacial Studies Group to investigate the effect of material structure, morphology, topology on formation of the SEI layer
Investigate correlations between physico-chemical properties of the SEI layer and long-term electrochemical performance of Li-ion electrodes
• Diagnostic evaluation of detrimental phenomena in high-voltage
(>4.3V) cathodes Apply in situ and ex situ Raman and FTIR spectroscopy to detect andcharacterize surface and bulk processes in LiMePO4 cathodes


