
ATLC Advisory Group MeetingFebruary 20, 2014Analysis by Deborah SalonPresentation by Susan HandyInstitute of Transportation StudiesUniversity of California, Davis
ESTIMATING TOTAL MILES WALKED AND
BIKED BY CENSUS TRACT IN
CALIFORNIA

Vehicle activity is an output of travel models, but detailed estimates of bicycle and pedestrian activity are often not available.
Good estimates of the total amount of cyclist and pedestrian activity on our roads are useful for: Informing demand-based investments in bicycle and pedestrian infrastructure
Identifying dangerous locations for potential safety investments
MOTIVATION
Estimate the total miles walked by pedestrians and total miles biked by cyclists living in each census tract in California
Important Note: The estimates presented here are not of miles walked and biked within the geographic area of each tract, but we expect them to be highly correlated with these values.
RESEARCH OBJECTIVE

1. Assign census tracts to neighborhood types based on built environment characteristics
2. Assign each survey respondent to their age-gender-home neighborhood category
3. Calculate average miles biked and miles walked for each age-gender-home neighborhood category
4. Use these averages with census data to expand travel survey data to population totals
METHOD

Cluster analysis of 10 variables yielded 4 neighborhood types: Population Density Road Density Local Job Access Regional Job Access Restaurants Within 10
Minute Walk Pct. Walk/Bike Commuters Pct. Single Family
Detached Pct. Old Housing Pct. New Housing Median House Value
NEIGHBORHOOD TYPE CLASSIFICATION

SAN FRANCISCO BAY AREA

LOS ANGELES AREA

Categories based on:Gender (2)Age Group (5 groups)Home Neighborhood Type (4 Types)
Yields 40 Categories
SURVEY RESPONDENT CATEGORIES

Gender Age Group NH Type0.0
0.2
0.4
0.6
0.8
1.0
1.2
1.4
5-9
10-1
7
18-
59
60-7
4
75+
Centr
al C
ity
Urb
an
Suburb
Rura
l
AVERAGE MILES WALKED BY SURVEY RESPONDENT CATEGORY
M F

Gender Age Group NH Type0.00
0.05
0.10
0.15
0.20
0.25
5-9
10-3
4
35-5
9
60-6
9
70+
Centr
al C
ity
Urb
an
Suburb
Rura
l
AVERAGE MILES BIKED BY SURVEY RESPONDENT CATEGORY
M
F

Simple Expansion Formula:
where i is the gender-age group categoryand t is the neighborhood type category
SURVEY-TO-POPULATION ESTIMATION METHOD

INFRASTRUCTURE ANALYSIS:TRACT-LEVEL WALKING ESTIMATES
Weekday Miles Walked Per Non-HighwayRoad Mile
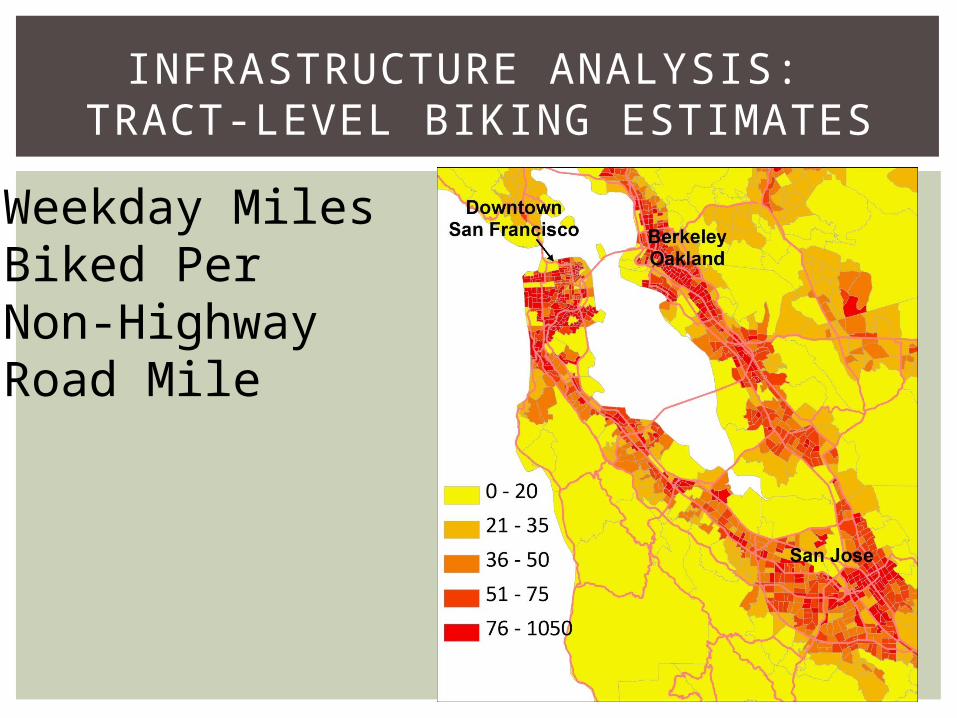
INFRASTRUCTURE ANALYSIS: TRACT-LEVEL BIKING ESTIMATES
Weekday Miles Biked Per Non-HighwayRoad Mile

SAFETY ANALYSIS:ACCIDENTS PER DISTANCE WALKED
Annual SeverePedestrian Accidents Per1000 Weekday Miles Walked

SAFETY ANALYSIS: ACCIDENTS PER DISTANCE WALKED

Method can provide estimates of cyclist and pedestrian activity based on travel survey and census data, without a full travel model
Estimates of miles of activity per road mile are highly correlated with tract population density
CHTS data produce somewhat lower estimates of bike/walk activity than NHTS data (results not shown)
Compare these results with those from a full travel model, if available
Report available next weekCensus tract estimates to be postedContact: [email protected]
CONCLUSIONS


