
ORIGINAL ARTICLE
Estimation of reservoir temperature using silica and cationicsolutes geothermometers: a case study in the Tengchonggeothermal area
Xiaobo Zhang • Qinghai Guo • Jiexiang Li •
Mingliang Liu • Yanxin Wang • Yijun Yang
Received: 11 January 2014 / Revised: 22 February 2014 / Accepted: 28 February 2014 / Published online: 17 February 2015
� Science Press, Institute of Geochemistry, CAS and Springer-Verlag Berlin Heidelberg 2015
Abstract Reservoir temperature estimation is vitally
important for assessing the exploitation potential of a
geothermal field. In this study, the concentrations of major
chemical constituents in geothermal water sampled from
boiling and hot springs in the Tengchong hydrothermal
area were measured, and quartz and cationic solutes
geothermometers were used to calculate subsurface tem-
peratures. Log (Q/K) diagrams and Na–K–Mg triangular
diagrams were applied to evaluating the equilibrium status
of geothermal water samples with regard to reservoir
minerals, and results were used to select suitable geother-
mometers. The results show that samples RH01, RH03,
RH04, RH05, and LL16 were in or very close to full
equilibrium with the selected minerals, and therefore a Na–
K geothermometer is appropriate. A K/Mg geothermome-
ter, however, is applicable to LP08 and PZH18 whose
chemical compositions adjusted to the shallow reservoir
temperatures during their re-equilibrium processes. In
contrast, cationic solute geothermometers are unsuitable
for SQ20 and RH07, which are categorized as immature
water in the Na–K–Mg diagram; a quartz geothermometer
was adopted to evaluate the corresponding subsurface
temperatures of these samples. According to the reservoir
temperature estimation made in this study, there is at least
one high-temperature reservoir below Rehai with a possi-
ble temperature range of 210–270 �C.
Keywords Chemical equilibrium � Geothermometer �Geothermal spring � Reservoir temperature � Tengchong
1 Introduction
Hot springs are typical surface indicators of subsurface
geothermal activity. During the exploration and subsequent
evaluation of geothermal resources, one of the most im-
portant procedures is to estimate reservoir temperature
based on the chemical composition of geothermal waters
(Fournier and Rowe 1966; Asta et al. 2012; Fournier and
Truesdell 1973; Pang and Reed 1998). As an essential
parameter, reservoir temperature can be used to categorize
a geothermal system and to assess its exploitation potential
(Mutlu and Gulec 1998; Pang 2001). Geothermometry is an
economical and effective way to measure this parameter
(Pasvanoglu 2011). Among all kinds of geothermometers,
silica and cationic solute geothermometers are the most
widely used, but have been proven to be useful only in
specific situations (Ellis and Wilson 1960; Ahmad et al.
2002; Anzil et al. 2012; Mimi et al. 1998; Pirlo 2004). For
example, a lack of full equilibrium of geothermal water
with all minerals in reservoir hostrocks—which may be
caused by low reservoir temperature or different types of
cooling, including adiabatic cooling, conductive cooling
and mixing with cold waters—may render cation geother-
mometry unreliable (Dulanya et al. 2010; Mohammadi
et al. 2010). Thus, for a given geothermal water sample, a
wide range of subsurface temperatures can be obtained
with the use of different geothermometers. It is necessary
to evaluate geothermal fluid–hostrock equilibrium before
selecting an appropriate geothermometer for reservoir
temperature estimation (Zheng et al. 2002; Gokgoz and
Tarcan 2006; Majumdar et al. 2009).
The Tengchong volcanic geothermal area in western
Yunnan of China is characterized by numerous hot springs
and very high terrestrial heat flow values, and has a huge
potential for geothermal resource exploitation (Shangguan
X. Zhang � Q. Guo (&) � J. Li � M. Liu � Y. Wang � Y. Yang
School of Environmental Studies & State Key Laboratory of
Biogeology and Environmental Geology, China University of
Geosciences, Wuhan 430074, Hubei, People’s Republic of China
e-mail: [email protected]
123
Chin. J. Geochem. (2015) 34(2):233–240
DOI 10.1007/s11631-015-0037-7

et al. 2005; Du et al. 2005). A wide variety in the pH,
temperature, and chemical composition of the hot springs
in the Tengchong geothermal area makes it a prime loca-
tion to comprehensively investigate the applicability of
various solute geothermometers. The primary objective of
this paper is to evaluate the feasibility of estimating the
reservoir temperatures of several representative hy-
drothermal systems located in Tengchong (e.g. Rehai,
Xiaotang, Shiqiang, etc.) using silica and cationic solute
geothermometers. Based on this evaluation, principles for
the selection of suitable geothermometers are proposed as
well. The calculation results of subsurface temperatures are
also useful for assessing the geothermal resource in
Tengchong.
2 Geological setting
Tengchong County, with a total area of 5,848 km2, lies in
the southwest of Yunnan province (Fig. 1). The elevation
in the county ranges from 3,780 to 930 m. Tectonically,
Tengchong is located in the collision belt between the
Eurasian and Indian plates, where volcanism was frequent
in the Late Cenozoic. Volcanic rocks, including Pliocene
alkaline basalt and dolerite, Early Pleistocene calc-alkaline
andesite and dacite, early Middle Pleistocene alkaline
basalt, and late-Middle and Late Pleistocene calc-alkaline
andesitic basalt are widely distributed in Teng-
chong (Shangguan 2000).
With an area of about 10 km2, the Rehai geothermal
field is located in the southern part of the Tengchong
volcanic geothermal area. Rehai is the most important
hydrothermal area in Tengchong in light of its high reser-
voir temperatures and strong geothermal manifestation in-
cluding boiling springs, hot springs, geysers, hydrothermal
explosions, and steaming ground (Zhang et al. 2008; Guo
and Wang 2012; Shangguan et al. 2005). With increasing
depth the following sequence of units is found at Rehai:
Holocene alluvium, middle Pleistocene basalt, lower
Pleistocene andesite, Miocene brecciated rocks, Cretaceous
granite, and Proterozoic gneiss and migmatite. The cap-
rocks of the Rehai hydrothermal system consist of inten-
sively altered gravelstone and sandstone, while the reser-
voir itself is composed of the Yanshanian granite and
Proterozoic metamorphic rocks. According to the carbon
isotope fractional values of CO2 and CH4 from magma
degassing, the present temperature of the deep magmatic
heat source should be above 514 �C. The discharge of
geothermal waters from Rehai is controlled by three groups
of faults at different depths. A multi-layer reservoir struc-
ture has been identified below Rehai (Shangguan et al.
2005).
Fig. 1 Simplified map of the Tengchong geothermal area and sampling locations
234 Chin. J. Geochem. (2015) 34(2):233–240
123

3 Sampling and analysis
Nine geothermal water samples were collected in Teng-
chong in July 2012; sampling locations are shown in Fig. 1.
The major characteristics and hydrochemical types of the
nine samples are presented in Table 1 and Fig. 2. All the
water samples were collected from the hot springs
emerging across the Tengchong geothermal area and added
to 500 mL polyethylene bottles which had been rinsed with
distilled water three times before sampling.
For cation analysis, reagent-grade HNO3 with a con-
centration up to 14 M was added to each sample to bring
the pH below 1. Unstable hydrochemical parameters, in-
cluding temperature, pH, and electrical conductivity (EC),
were measured with hand-held meters that had been
calibrated beforehand. Alkalinity was measured using ti-
tration within 24 h after sampling. The HCO3-, CO3
2-,
and CO2 concentrations of all samples were calculated
from the measured values of alkalinity and pH by
PHREEQC. The SO42-, Cl-, and F- concentrations were
analyzed by IC; Ca2?, Mg2?, Na?, and K? by ICP-OES;
and the other metal elements by ICP-MS. The concentra-
tions of major chemical components in the samples are
listed in Table 2. The SiO2 concentrations of the Teng-
chong samples were not determined in this study, and the
measurements made by other authors were used (Shang-
guan et al. 2005).
4 Results and discussion
4.1 Geothermometry
Many dissolved constituents in geothermal water and their
concentration ratios can be used as geothermometers to
estimate the temperature of a reservoir. The most widely
used geothermometric methods are silica and cationic so-
lute geothermometers. The former is based on temperature-
dependent variation in the solubility of silica (Pang et al.
1990), whereas the latter uses the fact that the equilibrium
for exchange reactions of some cations is controlled by
reservoir temperature. The expressions for quartz, Na–K,
and K–Mg geothermometers are presented in Table 3 and
were used to calculate the reservoir temperatures corre-
sponding to the nine geothermal water samples collected in
this study (Tong and Zhang 1989). The results are shown in
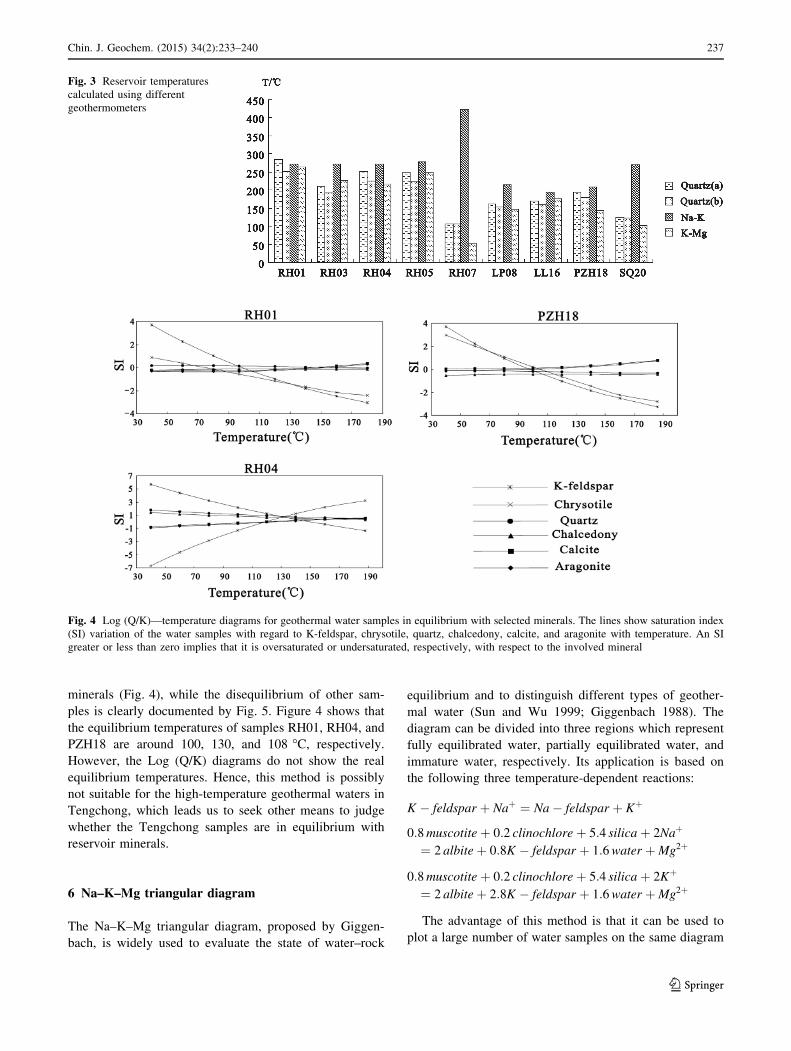
Table 4 and also in Fig. 3.
It is not surprising that different results were obtained
through the use of the four geothermometers. As mentioned
earlier, whether or not a geothermometer is appropriate for
reservoir temperature calculation depends on a series of
factors. For the application of cationic solute geother-
mometers, the most important precondition is that the
geothermal water should be in equilibrium with the rele-
vant hydrothermal minerals (Mutlu 1998; Reed and Spy-
cher 1984). Thus, an evaluation must be conducted to judge
Table 1 Characteristics of water samples from Tengchong
No. Location Date Sample type Temperature(�C) PH Hydrochemical type EC (ls/cm)
RH01 Dagunguo 2012.07.16 Hot spring 96.6 8.34 Na–HCO3–Cl 4,210
RH03 Huaitaijing-L 2012.07.16 Hot spring 88.0 8.35 Na–HCO3–Cl 3,350
RH04 Huaitaijing-R 2012.07.16 Hot spring 88.0 7.61 Na–HCO3–Cl 2,464
RH05 Gumingquan 2012.07.16 Hot spring 96.0 8.87 Na–HCO3–Cl 3,560
RH07 Bapai 2012.07.17 Hot spring 20.1 7.65 Na–Ca–HCO3 163.6
LP08 Langpu Dagunguo 2012.07.17 Hot spring 70.0 8.16 Na–HCO3–Cl 3,020
LL16 Banglazhang 2012.07.20 Hot spring 66.0 8.77 Na–HCO3 1,021
PZH18 Xiaotang 2012.07.20 Hot spring 96.0 8.00 Na–HCO3 1,078
SQ20 Shiqiang 2012.07.21 Hot spring 62.0 6.93 Na–Ca–HCO3 2,456
Fig. 2 Piper diagram of geothermal water samples
Chin. J. Geochem. (2015) 34(2):233–240 235
123

if a geothermometer is suitable for estimating reservoir
temperature.
5 Evaluation of water–rock chemical equilibrium
5.1 Log (Q/K) diagrams
Reed and Spycher (1984) proposed a method to assess the
state of chemical equilibrium between geothermal water
and minerals in reservoir hostrocks. The principle is that
the dissolved states of most minerals in water can be re-
garded as a function of temperature. If a geothermal water
sample is close to saturation with regard to a group of
minerals at a specific temperature, it is believed that this
water sample was in equilibrium with hostrock minerals
and this temperature is the most probable temperature of
the reservoir. A geothermal water that has never been in
full equilibrium with hostrock minerals or has experienced
a cooling process that was not followed by a complete re-
equilibrium cannot be saturated with all minerals at any
specific temperature (Zheng and Liu 1996).
To evaluate the status of a geothermal water sample
with regard to hostrock minerals in the reservoir, we in-
troduce the concept of saturation index (SI):
SI = logQ
K¼ log Q� log K
where Q and K represent the ion activity product in solu-
tion and the solubility constant of a mineral, respectively.
Based on the measured hydrochemical composition, the
variation of a geothermal water sample’s SIs with respect
to K-feldspar, chrysotile, quartz, chalcedony, calcite and
aragonite can be delineated in a Log (Q/K) versus tem-
perature diagram. Due to the reasons mentioned above, a
water sample may not fully equilibrate with all hostrock
minerals at a given temperature. However, if the SI
trendlines for most minerals intersect near the horizontal
axis, the sample can be regarded to be in full equilibrium
with these minerals within the corresponding temperature
range. Among the samples used in this study, RH01, RH04,
and PZH18 are nearly in equilibrium with all the evaluated
Table 2 Concentrations of
major chemical constituents in
water samples from Tengchong
(mg/L)
No. Alkalinity SiO2 SO42- Cl- F- NO3
- Ca Mg Na K Li
RH01 987.1 700 35.2 725.0 18.2 92.5 0.97 0.02 689.0 122.8 0.00
RH03 770.7 304 20.1 558.6 13.8 19.6 1.54 0.06 538.3 96.8 0.00
RH04 515.2 491 38.3 454.6 8.1 15.4 1.61 0.05 400.4 71.1 0.00
RH05 826.5 483 18.6 651.0 16.1 5.6 1.38 0.03 573.2 107.1 0.00
RH07 75.0 55 8.0 45.0 0.0 14.1 10.33 8.21 9.1 4.9 0.01
LP08 1217.9 150 28.2 336.9 11.7 5.1 3.84 0.98 573.8 55.9 2.89
LL16 505.2 172 38.9 54.5 19.3 0.0 1.36 0.01 203.5 15.2 3.03
PZH18 445.2 244 30.0 83.4 11.7 5.3 1.67 0.13 209.9 19.0 1.44
SQ20 1623.1 79 1.8 82.8 3.3 2.6 70.45 28.08 395.5 68.9 2.03
Table 3 Expressions for different geothermometers
Geothermometer Expression
Quartz(a) hSiO2
�C ¼ 1309
5:19�logSiO2
� 273:15 (1)
Quartz(b) hSiO2
�C ¼ 1522
5:75�logSiO2
� 273:15 (2)
Na/K hNa=K�C ¼ 1217
log(Na/K)þ1:483� 273:15 (3)
K2/Mg hK2=Mg�C ¼ 4410
14�log K2=Mg
� �� 273:15 (4)
Table 4 Reservoir
temperatures calculated using
different geothermometers
No. Location Temperature/�C Estimated
temperature (�C)Quartz(a) Quartz(b) Na–K K–Mg
RH01 Dagunguo 285.1 250.8 272.1 264.4 250 * 270
RH03 Huaitaijing-L 210.4 192.7 273 227.4 210 * 270
RH04 Huaitaijing-R 250.7 224.4 271.6 217.4 220 * 270
RH05 Gumingquan 249.2 223.3 277.2 248.9 250 * 277
RH07 Bapai 106.3 106.4 422.8 52.9 80 * 100
LP08 Langpu Dagunguo 161.2 152.7 214.8 147.1 150 * 210
LL16 Banglazhang 170.2 160.2 193.3 176.9 160 * 190
PZH18 Xiaotang 193.9 179.5 208.6 144 180 * 200
SQ20 Shiqiang 124.9 122.3 269.7 101.5 100 * 120
236 Chin. J. Geochem. (2015) 34(2):233–240
123
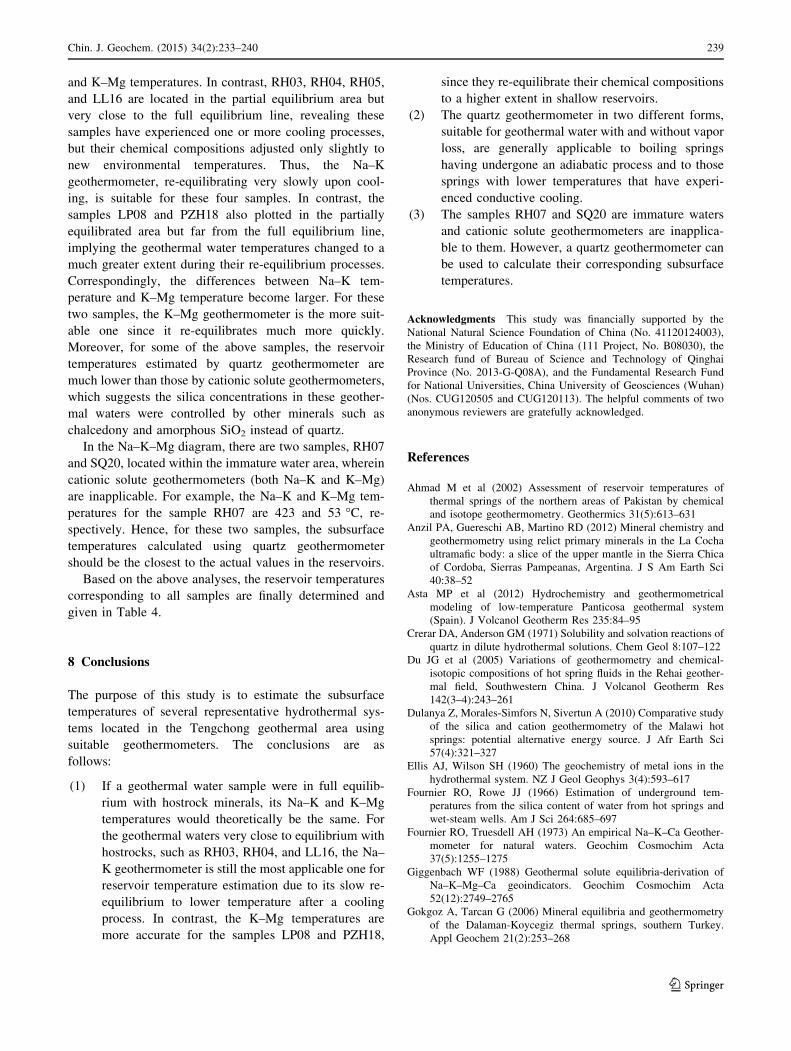
minerals (Fig. 4), while the disequilibrium of other sam-
ples is clearly documented by Fig. 5. Figure 4 shows that
the equilibrium temperatures of samples RH01, RH04, and
PZH18 are around 100, 130, and 108 �C, respectively.
However, the Log (Q/K) diagrams do not show the real
equilibrium temperatures. Hence, this method is possibly
not suitable for the high-temperature geothermal waters in
Tengchong, which leads us to seek other means to judge
whether the Tengchong samples are in equilibrium with
reservoir minerals.
6 Na–K–Mg triangular diagram
The Na–K–Mg triangular diagram, proposed by Giggen-
bach, is widely used to evaluate the state of water–rock
equilibrium and to distinguish different types of geother-
mal water (Sun and Wu 1999; Giggenbach 1988). The
diagram can be divided into three regions which represent
fully equilibrated water, partially equilibrated water, and
immature water, respectively. Its application is based on
the following three temperature-dependent reactions:
K � feldspar þ Naþ ¼ Na� feldspar þ Kþ
0:8 muscotiteþ 0:2 clinochloreþ 5:4 silicaþ 2Naþ
¼ 2 albiteþ 0:8K � feldspar þ 1:6 water þMg2þ
0:8 muscotiteþ 0:2 clinochloreþ 5:4 silicaþ 2Kþ
¼ 2 albiteþ 2:8K � feldspar þ 1:6 water þMg2þ
The advantage of this method is that it can be used to
plot a large number of water samples on the same diagram
Fig. 3 Reservoir temperatures
calculated using different
geothermometers
Fig. 4 Log (Q/K)—temperature diagrams for geothermal water samples in equilibrium with selected minerals. The lines show saturation index
(SI) variation of the water samples with regard to K-feldspar, chrysotile, quartz, chalcedony, calcite, and aragonite with temperature. An SI
greater or less than zero implies that it is oversaturated or undersaturated, respectively, with respect to the involved mineral
Chin. J. Geochem. (2015) 34(2):233–240 237
123

and to distinguish immature waters from fully equilibrated
waters and from those having experienced cooling and re-
equilibrium.
As shown in Fig. 6, the samples RH01 and RH05 from
Rehai are very close to the full equilibrium line, whereas the
rest are located in the partial equilibrium area and the non-
equilibrium area. The samples that are not in full equilibrium
may have undergone different forms of cooling or never been
in full equilibrium with hostrocks as discussed above. Thus,
cationic solute geothermometers cannot be used to estimate
their corresponding reservoir temperatures.
7 Selection of geothermometers for reservoir
temperature estimation
The quartz geothermometer can be expressed in two dif-
ferent forms (Crerar and Anderson 1971; Tong and Zhang
1989). One of them is suitable for geothermal waters that
have no vapor loss during upflow to the surface; the other is
applicable to the reverse situation. Put another way, distinct
quartz geothermometers are designed for geothermal waters
undergoing conductive cooling and adiabatic cooling. In this
study, quartz geothermometer (b) was adopted to calculate
the reservoir temperatures of samples RH01, RH05, and
LP08 collected from boiling springs, while the other samples
were subjected to quartz geothermometer (a).
RH01 is almost in full equilibrium with hostrock min-
erals in the reservoir, as indicated by its very close Na–K
Fig. 5 Log (Q/K)—temperature diagrams for geothermal water samples in disequilibrium with selected minerals. The legend is the same as in
Fig. 4
Fig. 6 Triangular Na–K–Mg diagram for geothermal water samples
from Tengchong
238 Chin. J. Geochem. (2015) 34(2):233–240
123
and K–Mg temperatures. In contrast, RH03, RH04, RH05,
and LL16 are located in the partial equilibrium area but
very close to the full equilibrium line, revealing these
samples have experienced one or more cooling processes,
but their chemical compositions adjusted only slightly to
new environmental temperatures. Thus, the Na–K
geothermometer, re-equilibrating very slowly upon cool-
ing, is suitable for these four samples. In contrast, the
samples LP08 and PZH18 also plotted in the partially
equilibrated area but far from the full equilibrium line,
implying the geothermal water temperatures changed to a
much greater extent during their re-equilibrium processes.
Correspondingly, the differences between Na–K tem-
perature and K–Mg temperature become larger. For these
two samples, the K–Mg geothermometer is the more suit-
able one since it re-equilibrates much more quickly.
Moreover, for some of the above samples, the reservoir
temperatures estimated by quartz geothermometer are
much lower than those by cationic solute geothermometers,
which suggests the silica concentrations in these geother-
mal waters were controlled by other minerals such as
chalcedony and amorphous SiO2 instead of quartz.
In the Na–K–Mg diagram, there are two samples, RH07
and SQ20, located within the immature water area, wherein
cationic solute geothermometers (both Na–K and K–Mg)
are inapplicable. For example, the Na–K and K–Mg tem-
peratures for the sample RH07 are 423 and 53 �C, re-
spectively. Hence, for these two samples, the subsurface
temperatures calculated using quartz geothermometer
should be the closest to the actual values in the reservoirs.
Based on the above analyses, the reservoir temperatures
corresponding to all samples are finally determined and
given in Table 4.
8 Conclusions
The purpose of this study is to estimate the subsurface
temperatures of several representative hydrothermal sys-
tems located in the Tengchong geothermal area using
suitable geothermometers. The conclusions are as
follows:
(1) If a geothermal water sample were in full equilib-
rium with hostrock minerals, its Na–K and K–Mg
temperatures would theoretically be the same. For
the geothermal waters very close to equilibrium with
hostrocks, such as RH03, RH04, and LL16, the Na–
K geothermometer is still the most applicable one for
reservoir temperature estimation due to its slow re-
equilibrium to lower temperature after a cooling
process. In contrast, the K–Mg temperatures are
more accurate for the samples LP08 and PZH18,
since they re-equilibrate their chemical compositions
to a higher extent in shallow reservoirs.
(2) The quartz geothermometer in two different forms,
suitable for geothermal water with and without vapor
loss, are generally applicable to boiling springs
having undergone an adiabatic process and to those
springs with lower temperatures that have experi-
enced conductive cooling.
(3) The samples RH07 and SQ20 are immature waters
and cationic solute geothermometers are inapplica-
ble to them. However, a quartz geothermometer can
be used to calculate their corresponding subsurface
temperatures.
Acknowledgments This study was financially supported by the
National Natural Science Foundation of China (No. 41120124003),
the Ministry of Education of China (111 Project, No. B08030), the
Research fund of Bureau of Science and Technology of Qinghai
Province (No. 2013-G-Q08A), and the Fundamental Research Fund
for National Universities, China University of Geosciences (Wuhan)
(Nos. CUG120505 and CUG120113). The helpful comments of two
anonymous reviewers are gratefully acknowledged.
References
Ahmad M et al (2002) Assessment of reservoir temperatures of
thermal springs of the northern areas of Pakistan by chemical
and isotope geothermometry. Geothermics 31(5):613–631
Anzil PA, Guereschi AB, Martino RD (2012) Mineral chemistry and
geothermometry using relict primary minerals in the La Cocha
ultramafic body: a slice of the upper mantle in the Sierra Chica
of Cordoba, Sierras Pampeanas, Argentina. J S Am Earth Sci
40:38–52
Asta MP et al (2012) Hydrochemistry and geothermometrical
modeling of low-temperature Panticosa geothermal system
(Spain). J Volcanol Geotherm Res 235:84–95
Crerar DA, Anderson GM (1971) Solubility and solvation reactions of
quartz in dilute hydrothermal solutions. Chem Geol 8:107–122
Du JG et al (2005) Variations of geothermometry and chemical-
isotopic compositions of hot spring fluids in the Rehai geother-
mal field, Southwestern China. J Volcanol Geotherm Res
142(3–4):243–261
Dulanya Z, Morales-Simfors N, Sivertun A (2010) Comparative study
of the silica and cation geothermometry of the Malawi hot
springs: potential alternative energy source. J Afr Earth Sci
57(4):321–327
Ellis AJ, Wilson SH (1960) The geochemistry of metal ions in the
hydrothermal system. NZ J Geol Geophys 3(4):593–617
Fournier RO, Rowe JJ (1966) Estimation of underground tem-
peratures from the silica content of water from hot springs and
wet-steam wells. Am J Sci 264:685–697
Fournier RO, Truesdell AH (1973) An empirical Na–K–Ca Geother-
mometer for natural waters. Geochim Cosmochim Acta
37(5):1255–1275
Giggenbach WF (1988) Geothermal solute equilibria-derivation of
Na–K–Mg–Ca geoindicators. Geochim Cosmochim Acta
52(12):2749–2765
Gokgoz A, Tarcan G (2006) Mineral equilibria and geothermometry
of the Dalaman-Koycegiz thermal springs, southern Turkey.
Appl Geochem 21(2):253–268
Chin. J. Geochem. (2015) 34(2):233–240 239
123
Guo QH, Wang YX (2012) Geochemistry of hot springs in the
Tengchong hydrothermal areas, Southwestern China. J Volcanol
Geotherm Res 215:61–73
Majumdar N, Mukherjee AL, Majumdar RK (2009) Mixing hy-
drology and chemical equilibria in Bakreswar geothermal area,
Eastern India. J Volcanol Geotherm Res 183(3–4):201–212
Mimi AL et al (1998) Application of chemical geothermometrys to
thermal springs. Geothermics 27(2):211–233
Mohammadi Z, Bagheri R, Jahanshahi R (2010) Hydrogeochemistry
and geothermometry of Changal thermal springs, Zagros region,
Iran. Geothermics 39(3):242–249
Mutlu H (1998) Chemical geothermometry and fluid-mineral equi-
libria for the Omer-Gecek thermal waters, Afyon area, Turkey.
J Volcanol Geotherm Res 80(3–4):303–321
Mutlu H, Gulec N (1998) Hydrogeochemical outline of thermal
waters and geothermometry applications in Anatolia (Turkey).
J Volcanol Geotherm Res 85(1–4):495–515
Pang ZG (2001) Isotope and chemical geothermometry and its
applications. Sci China Ser E-Technol Sci 44S:16–20
Pang ZH, Reed M (1998) Theoretical chemical thermometry on
geothermal waters: problems and methods. Geochim Cos-
mochim Acta 62(6):1083–1091
Pang ZH, Wang JY, Fan ZC (1990) Calculation of reservior
temperature using a SiO2 mixing model, Zhangzhou geothermal
field, SE China. Chin Sci Bull 35(16):1360–1363
Pasvanoglu S (2011) Hydrogeochemical and isotopic investigation of
the Bursa-Oylat thermal waters, Turkey. Environ Earth Sci
64(4):1157–1167
Pirlo MC (2004) Hydrogeochemistry and geothermometry of thermal
groundwaters from the Birdsville Track Ridge, Great Artesian
Basin, South Australia. Geothermics 33(6):743–774
Reed M, Spycher N (1984) Calculation of Ph and mineral equilibria in
hydrothermal waters with application to geothermometry and
studies of boiling and dilution. Geochim Cosmochim Acta
48(7):1479–1492
Shangguan ZG (2000) Structure of geothermal reservoirs and the
temperature of mantle-derived magma hot source in the Rehai
area, Tengchong. Acta Petrol Sin 16(1):83–90
Shangguan ZG, Zhao CP, Li HZ, Gao QW, Sun ML (2005) Evolution
of hydrothermal explosions at Rehai geothermal field, Teng-
chong volcanic region, China. Geothermics 34(4):518–526
Sun ZX, Wu HM (1999) Calculation of the fluid-rock equilibrium
state and geothermal reservior temperatures in the geothermal
system. Acta Geosci Sin 20:595–598
Tong W, Zhang M (1989) Geothermics in Tengchong. Science press,
Beijing. (in Chinese with English abstract)
Zheng XL, Liu HJ (1996) Study of the water-rock equilibrium state in
the application of geothermometer. J Xi’an Coll Geol
18(1):74–79
Zhang GP et al (2008) Geochemistry of the Rehai and Ruidian
geothermal waters, Yunnan Province, China. Geothermics
37:73–83
Zheng XL, Armannsson H, Li YL, Qiu HX (2002) Chemical
equilibria of thermal waters for the application of geothermome-
ters from the Guanzhong basin, China. J Volcanol Geotherm Res
113(1–2):119–127
240 Chin. J. Geochem. (2015) 34(2):233–240
123


