
Evaluating Impacts of Market Intervention
• In this lecture, we analyze the welfare effects of government policies to “intervene” the competitive markets (disturbances from market equilibrium).
• The tools we have learned are now very useful. • Welfare effects: measured by consumer surplus and
producer surplus (you should be familiar with them now).
• Elasticity: Measuring response to price changes.

Welfare in Competitive Equilibrium
Between 0 and Q0 producers receive
a net gain from selling each product--
producer surplus.
ConsumerSurplus
Quantity
Price
S
D
Q0
5
9
Between 0 and Q0
consumers receive a net gain from buying
the product-- consumer surplus
ProducerSurplus
3
QD QS

Welfare in Competitive Equilibrium
• Without intervention, at the competitive market equilibrium, the total welfare is given by CS+PS.
• Producers receive PQ but area below S curve represents the resource cost, not gain.

Government Intervention
• The government may disturb the market outcomes because:
- For achieving some objectives, it has to impose taxes.
- It may consider the market price not consistent with some social objectives (equity, distribution, please political parties)
• Whatever the goals, we need to know the welfare cost/loss of policies.

Welfare Effects of a Price Ceiling
The loss to producers is the sum of
rectangle A and triangle C.
B
A C
Consumers that can buy the good gain A
Quantity
Price
S
D
P0
Q0
Pmax
Q1 Q2
Consumers that cannot buy, lose B
Triangles B and C are losses to society – dead weight loss

Welfare Effects of a Price Ceiling
• Price is regulated to be lower than equilibrium level.
• Someone gain: Consumers who can still purchase the goods.
• Someone lose: Consumers who can’t purchase the goods due to smaller supply. Producers have to sell at lower price. Some producers quit due to lower price (< their costs).
• On the whole, gain < loss → net loss.
Welfare Costs of Intervention• Net loss = B + C = +ΔCS – ΔCS – ΔPS• The welfare loss is called deadweight loss. This
is an efficiency loss. • The fundamental reason of the existence of this l
oss is: Competitive market is the most efficient state. Disturbance from it (due to intervention) can only reduce the welfare.
• Government wants to achieve some goals (political favouritism, equity, etc). The cost is efficiency loss.
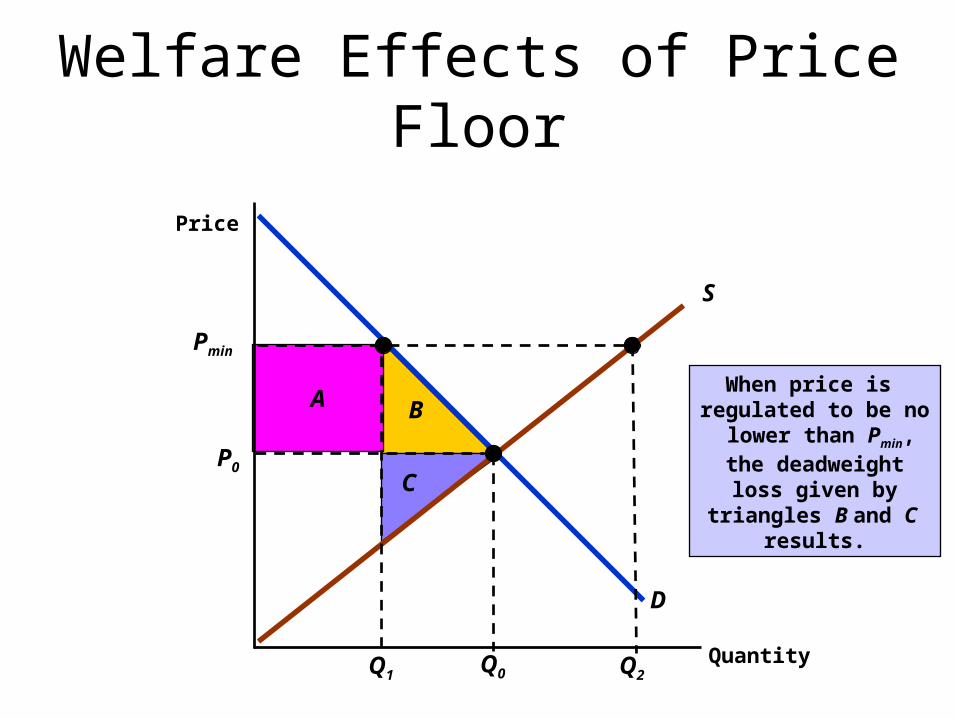
Welfare Effects of Price Floor
BA
C
Quantity
Price
S
D
P0
Q0
Pmin
Q1 Q2
When price is regulated to be no lower than Pmin, the
deadweight loss given by triangles B and C
results.

Minimum Wage
B
The deadweight lossis given by
triangles B and C.
C
A
L1 L2
Unemployment
wmin
Firms are not allowed topay less than wmin. This
results in unemployment.
S
D
w0
L0L
w
A is gain to workers who find jobs at higher wage

Tax on Goods• $t per unit of quantity is imposed on a good (paid by co
nsumers or producers).• The tax generates a difference between the price paid by
consumers and the price received by producers.• Consumers are concerned only with the price inclusive
of tax (price paid by consumers). Buyers’ price Pb on the D curve
• Producers are concerned only with the price exclusive of tax (price received by sellers). Sellers’ price Ps on S curve.
• Equilibrium conditions: Pb-Ps = t in addition to Qd = Qs.

Tax on Goods• Suppose suppliers
are required to pay t per unit of the good sold.
• Without tax, they require P1 to supply Q1.
• With tax, they require P2, because they receive, excluding tax, only P1.
Quantity
Price
Q1
P1
P2
S’
S
t
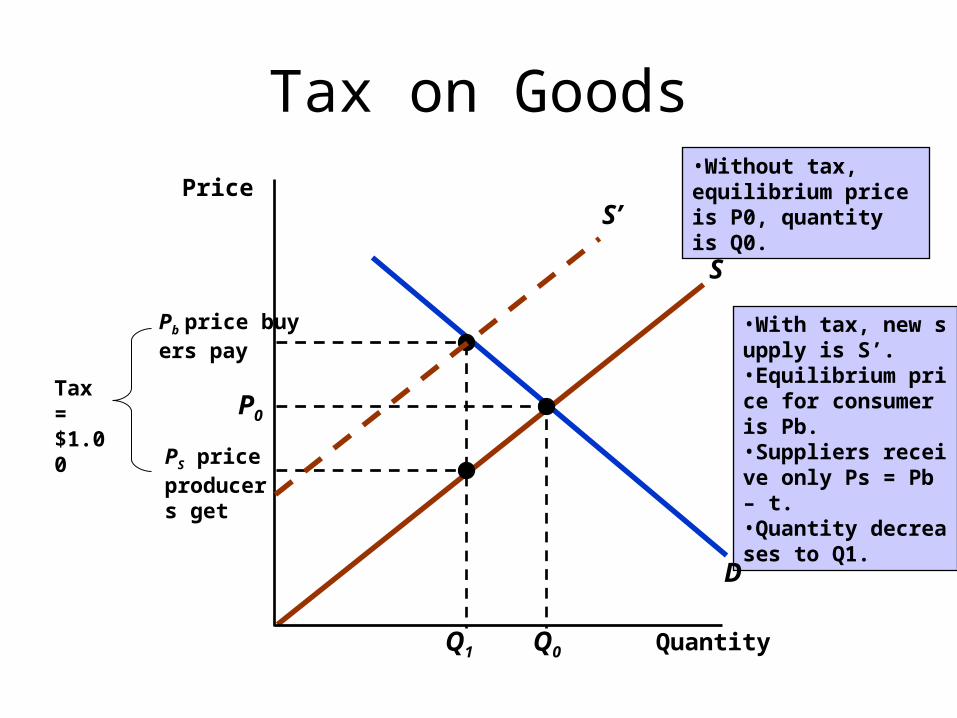
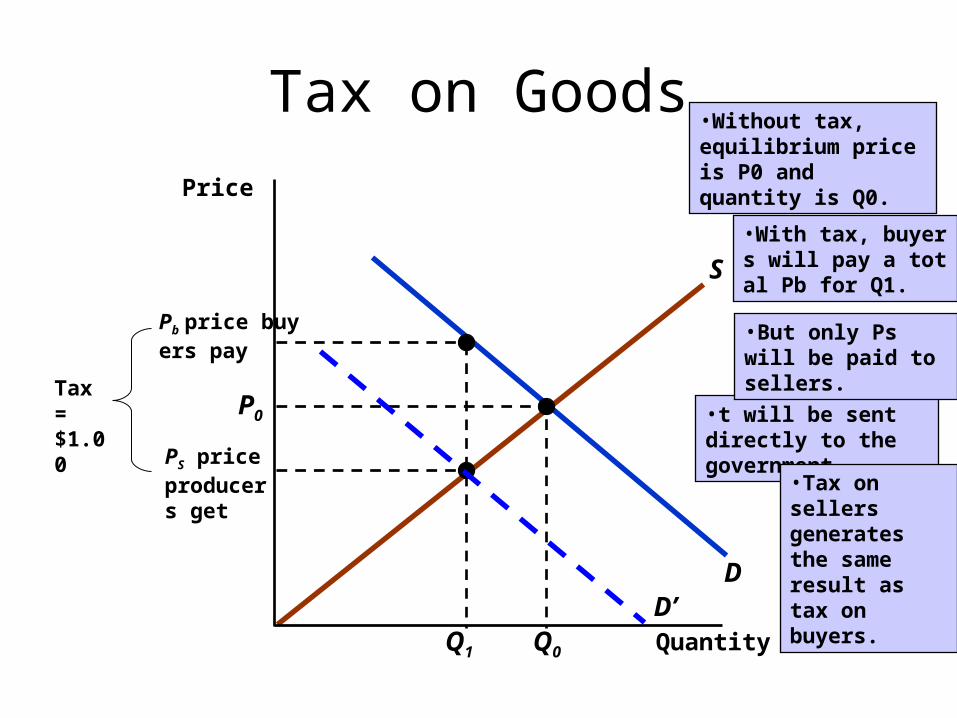
Tax on Goods
•With tax, new supply is S’. •Equilibrium price for consumer is Pb.•Suppliers receive only Ps = Pb – t.•Quantity decreases to Q1.
D
S
Quantity
Price
P0
Q0Q1
PS price producers get
Pb price buyers pay
Tax = $1.00
•Without tax, equilibrium price is P0, quantity is Q0.S’
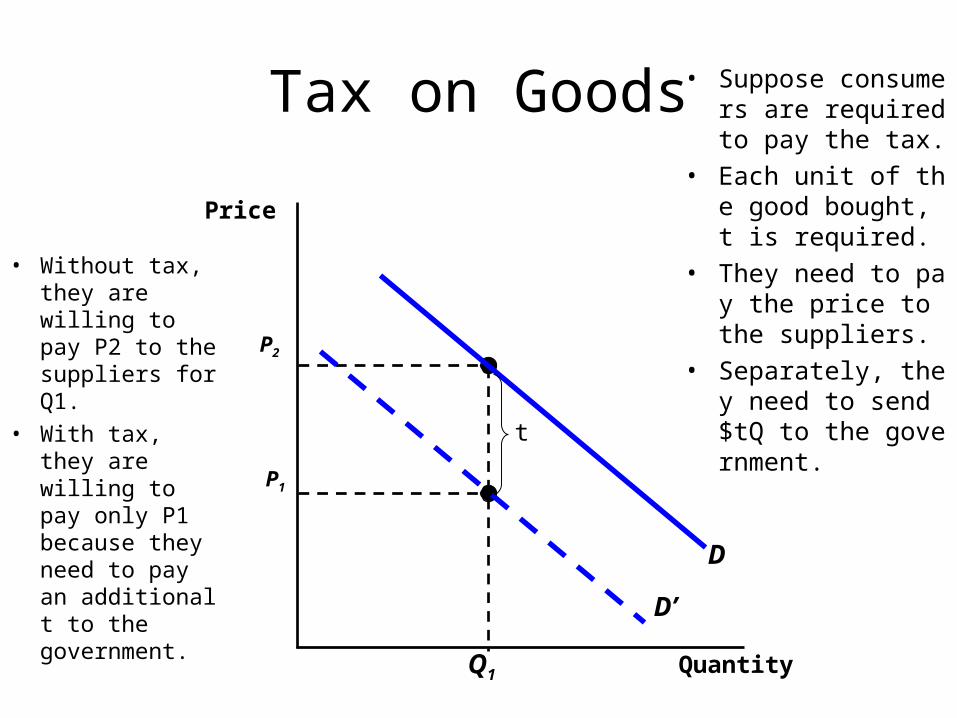
Tax on Goods • Suppose consumers are required to pay the tax.
• Each unit of the good bought, t is required.
• They need to pay the price to the suppliers.
• Separately, they need to send $tQ to the government.
Quantity
Price
Q1
P1
P2
D’
D
• Without tax, they are willing to pay P2 to the suppliers for Q1.
• With tax, they are willing to pay only P1 because they need to pay an additional t to the government.
t
Tax on Goods
•With tax, buyers will pay a total Pb for Q1.
D
S
Quantity
Price
P0
Q0Q1
PS price producers get
Pb price buyers pay
Tax = $1.00 •t will be sent directly
to the government.
•But only Ps will be paid to sellers.
•Tax on sellers generates the same result as tax on buyers.
•Without tax, equilibrium price is P0 and quantity is Q0.
D’
Tax on Goods
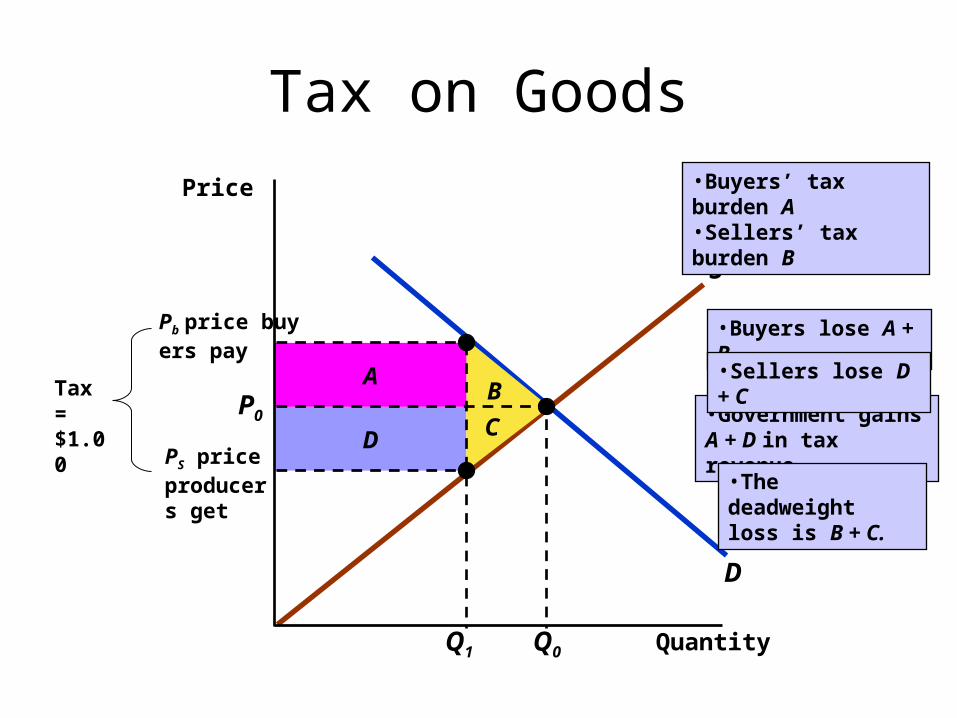
•Buyers lose A + B
D
S
B
D
A
C
Quantity
Price
P0
Q0Q1
PS price producers get
Pb price buyers pay
Tax = $1.00 •Government gains A
+ D in tax revenue.
•Sellers lose D + C
•The deadweightloss is B + C.
•Buyers’ tax burden A•Sellers’ tax burden B
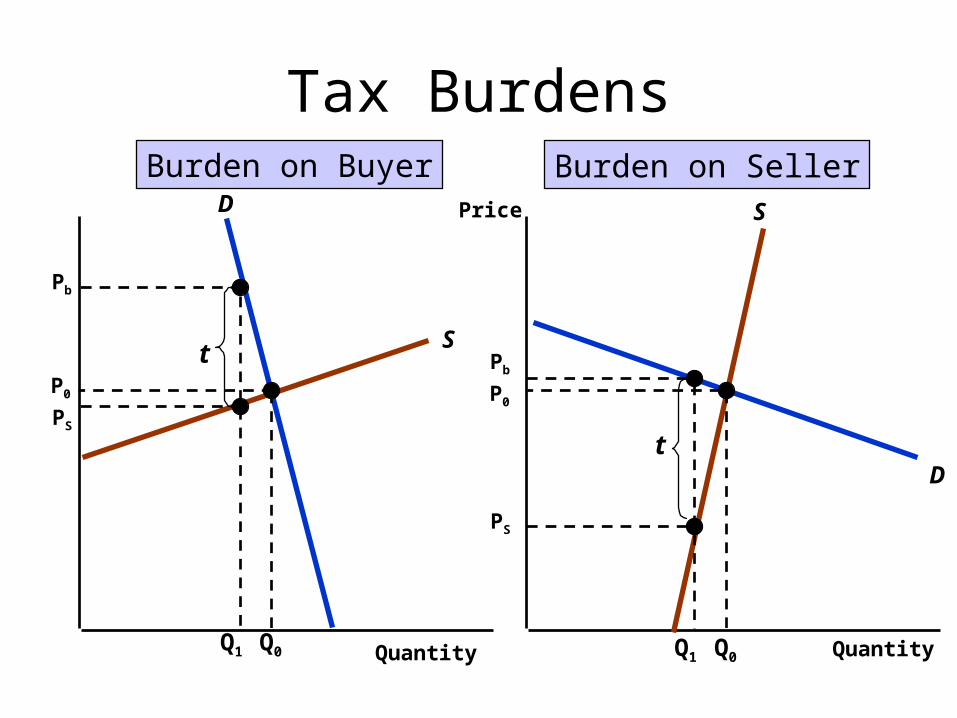
Tax Burdens
Quantity Quantity
Price
S
D S
D
Q0
P0 P0
Q0Q1
Pb
PS
t
Q1
Pb
PS
t
Burden on Buyer Burden on Seller
Tax Burdens
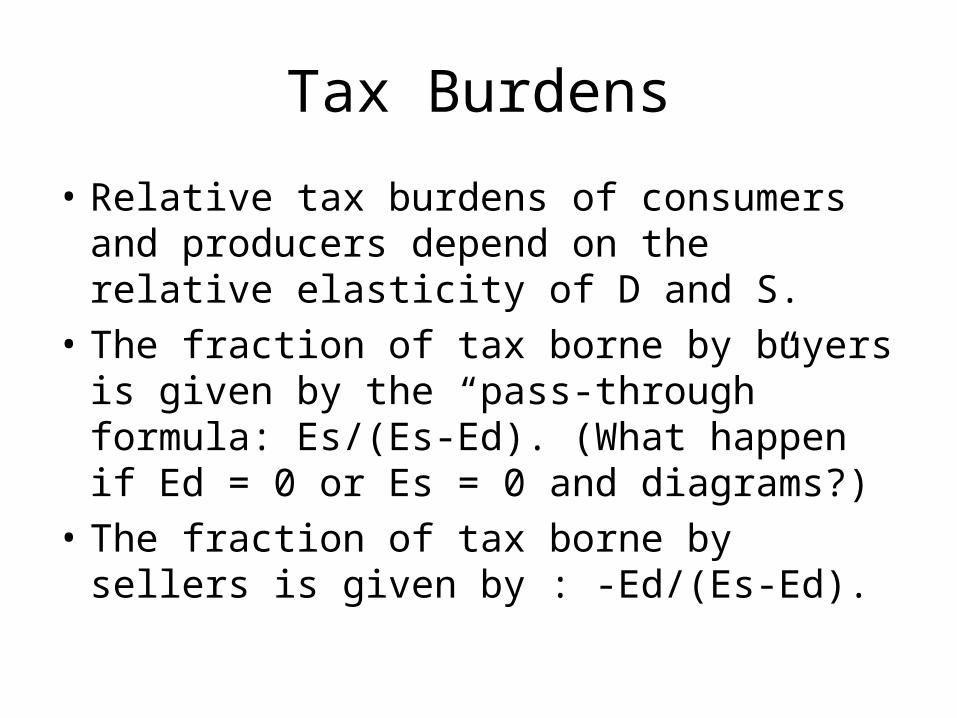
• Relative tax burdens of consumers and producers depend on the relative elasticity of D and S.
• The fraction of tax borne by buyers is given by the “pass-through” formula: Es/(Es-Ed). (What happen if Ed = 0 or Es = 0 and diagrams?)
• The fraction of tax borne by sellers is given by : -Ed/(Es-Ed).
Subsidy• $s per unit of quantity is given to the consumers
(or producers). • Consumers are willing to pay $s more to the
sellers than before due to subsidy for the same Q. (or producers are willing to receive $s less than before from the consumers to supply the same Q)
• The benefit goes mostly to consumers if Ed/Es is small.
• The benefit goes mostly to sellers if Ed/Es is large.

Subsidy
D
S
Quantity
Price
P0
Q0 Q1
PS
Pb
Like a tax, the benefitof a subsidy is split
between buyers and sellers, depending
upon the elasticities ofsupply and demand.
Producer receive Ps while consumers pay Pb. In new equilibrium, we ha
ve Ps-Pb=s.
Subsidy
Price Supports
• Instead of regulating the price level to an above-equilibrium level, government may achieve this target by purchasing the goods at the free market. E.g. agricultural products.
• It promotes production. (Greater q effect than price floor.)
Price Supports
B
DA
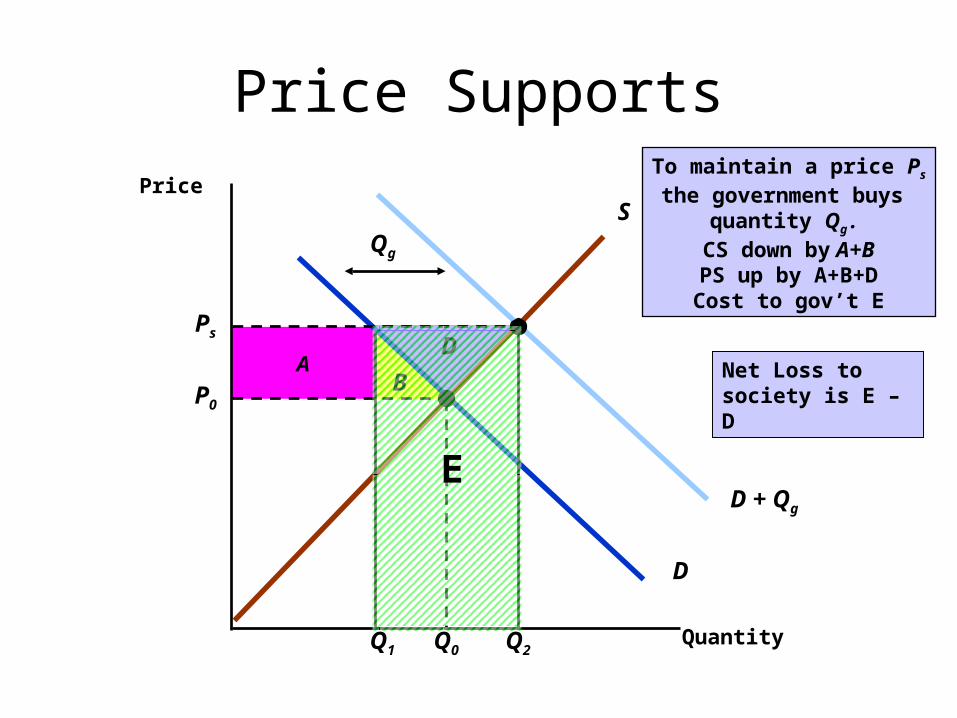
To maintain a price Ps
the government buys quantity Qg .
CS down by A+BPS up by A+B+DCost to gov’t E
D + Qg
Qg
Quantity
PriceS
D
P0
Q0
Ps
Q2Q1
E
Net Loss to society is E – D

Import Quotas vs Tariffs
• Lobbied by exporters, many government imposes trade restriction, limiting imported goods.
• Two methods to restrict imports: quotas (quantity restriction), tariff (tax on imported goods)
• Even though WTO (GAAT) don’t endorse quotas, bilateral agreements on quotas are implemented outside WTO.
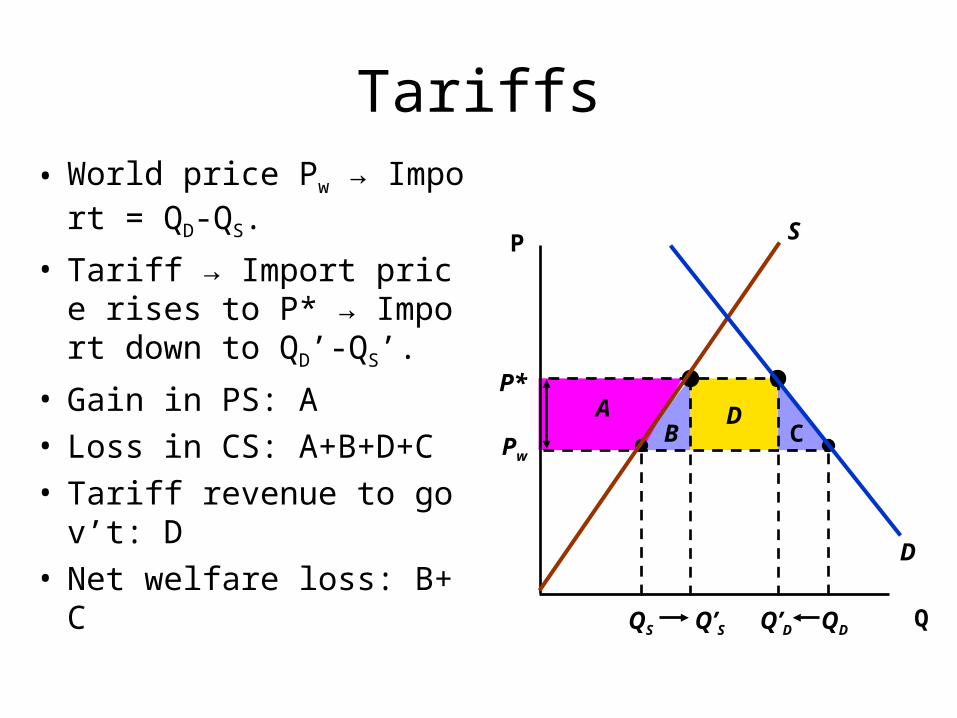
Tariffs• World price Pw → Import
= QD-QS.
• Tariff → Import price rises to P* → Import down to QD’-QS’.
• Gain in PS: A• Loss in CS: A+B+D+C• Tariff revenue to gov’t: D• Net welfare loss: B+C
DCB
QS QDQ’S Q’D
AP*
Pw
Q
P
D
S
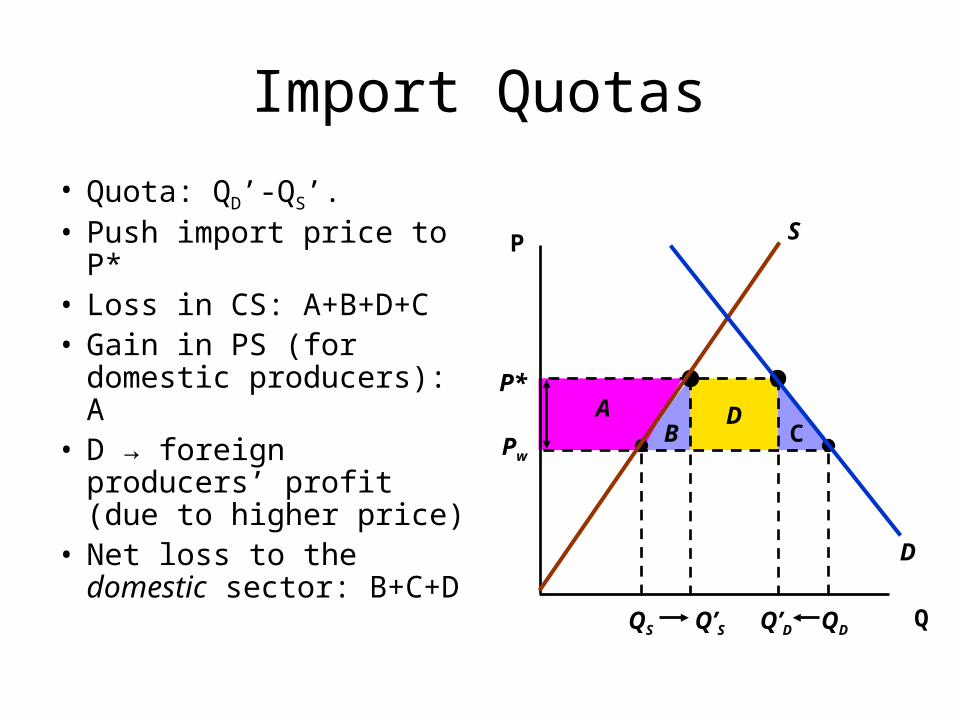
Import Quotas
• Quota: QD’-QS’. • Push import price to P*• Loss in CS: A+B+D+C• Gain in PS (for domestic
producers): A• D → foreign producers’
profit (due to higher price)
• Net loss to the domestic sector: B+C+D
DCB
QS QDQ’S Q’D
AP*
Pw
Q
P
D
S


