Download - Evaluation of a Holographic 3D Display

UPTEC F10064
Examensarbete 30 hpDecember 2010
Evaluation of a Holographic 3D Display
Jim Björk

Teknisk- naturvetenskaplig fakultet UTH-enheten Besöksadress: Ångströmlaboratoriet Lägerhyddsvägen 1 Hus 4, Plan 0 Postadress: Box 536 751 21 Uppsala Telefon: 018 – 471 30 03 Telefax: 018 – 471 30 00 Hemsida: http://www.teknat.uu.se/student
Abstract
Evaluation of a Holographic 3D Display
Jim Björk
An autostereoscopic display based on a Holographic Optical Element(HOE) presentsnew opportunities for faithful 3D displaying but also presents potential new problems,such as: accuracy of 3D objects, interactivity and user perception. In this evaluation,which is the first of its kind for this type of display, I have explored and testedmethods and tools for the evaluation of these potential problems. I have found thatthe visual quality is comparable to more common display types but with a significantvisual delay due to the parallel rendering of graphics and the projectors significantinput lag. From this I have concluded that the display system is not yet ready for itsintended purpose, cranio-maxillofacial surgery planning. We need projectors with lessinput lag and preferably better optics. The software needs to be optimized for multimonitor rendering as well.
ISSN: 1401-5757, UPTEC F10064Examinator: Tomas NybergÄmnesgranskare: Stefan SeipelHandledare: Robin Strand

POPULÄRVETENSKAPLIG SAMMANFATTNING En autostereoskopisk display baserad på ett Optisk Holografisk Element (HOE) ger oss nya
möjligheter för att kunna visualisera tredimensionellt (3D) material men för också med sig nya
potentiella problem som: att kunna visa 3D objekt med precision, interaktivitet och
användaruppfattning. Det här den första undersökningen av sitt slag och här utforskar jag
metoder och verktyg för att kunna redogöra dessa nya potentiella problem. Jag har funnit att den
visuella kvaliteten är jämförbar med mer vanliga typer av displayer men med en stor visuell
fördröjning. Denna fördröjning kan härledas till parallellrenderingen av grafiken och till
projektorernas input lag. Från detta har jag bedömt att displaysystemet inte är redo för sitt syfte,
pre-operativ planering för kraniomaxillofacial kirurgi. För att kunna förbättra interaktiviteten så
behövs nya projektorer med lägre input lag och mjukvaran behöver optimeras för ett
multimonitorsystem.
Uppsala University, Evaluation of a Holographic 3D Display 2 Jim Björk 2010
Contents
Populärvetenskaplig sammanfattning ...................................................................................................................... 1
1. Introduction ..................................................................................................................................................................... 3
1.1. Background ............................................................................................................................................................. 3
1.2. Related work ........................................................................................................................................................... 4
1.3. Configuration of display system ..................................................................................................................... 4
2. 2D Hardware Measurements ................................................................................................................................... 6
3. 3D Measurements ......................................................................................................................................................... 7
Perspective .................................................................................................................................................................. 7
Introduction & background ...................................................................................................................................... 7
Method ............................................................................................................................................................................... 8
Result .................................................................................................................................................................................. 8
Discussion ........................................................................................................................................................................ 8
Headtracking .............................................................................................................................................................. 8
4. Interactive performance .......................................................................................................................................... 10
Introduction & Background ................................................................................................................................... 10
Method ............................................................................................................................................................................ 11
Result ............................................................................................................................................................................... 11
Discussion ..................................................................................................................................................................... 11
5. user studies ................................................................................................................................................................... 13
Introduction & Background ................................................................................................................................... 13
Method ............................................................................................................................................................................ 13
Result ............................................................................................................................................................................... 14
Discussion ..................................................................................................................................................................... 14
6. Conclusions and future recommendations ...................................................................................................... 19
7. References and material used in this thesis .................................................................................................... 20
Acknowledgements ........................................................................................................................................................ 21

Uppsala University, Evaluation of a Holographic 3D Display 3 Jim Björk 2010
1. INTRODUCTION
1.1. BACKGROUND Autostereoscopic displays offer the means of visualizing 3D images without the use of special
glasses. Current commercially available autostereoscopic displays that are based on lenticular
sheets or parallax barriers have numerous limitations; in particular the user cannot move its
hand around in the “3D space” as it’s displayed on a 2D surface. In addition, these displays have
limited viewing angles, low light intensity and limited resolution. Other attempts to create
volumetric displays that give the user 3D perception by integrating images in either time or
space have similar limitations. An attempt to mitigate these various disadvantages has been
realized in a new type of display system developed by Jonny Gustafsson for the Whole Hand
Haptic with True 3D Displays project (1).
The display system at the Centre for Image Analysis’s Visualization Lab, is only the second
generation of an autostereoscopic display based on a holographic optical element (HOE) that
acts as a projection screen for eight digital projectors. The hologram is made such that each
image projected onto the HOE can be viewed within a narrow angle, representing one view of
the 3D object. With multiple properly spaced projectors each eye receives a separate view. If
adjacent pairs of these views are rendered with the centers of projection separated by an
average interpupillary distance, the user perceives a 3D model suspended in space above the
holographic plate, with no obstacle between the viewer and the image allowing him/her to reach
into the 3D model. As the user moves, he/she will see the virtual object from new vantage points,
increasing the impression of three-dimensionality. The 3D model can be manipulated in real
time using all capabilities of a modern computer graphics system. The resolution and light
intensity is the same as that achieved by a modern video projector. This display enables co-
located haptics allowing the user to reach in and actually feel, move and transform the displayed
objects. But with co-located haptics, the haptic device serves as a visual reference point
requiring more accurate stereo rendering. Our driving application, cranio-maxillofacial surgery,
put great demands on the display system in terms of accuracy and interactivity as well.
The purpose of this thesis project is to determine three aspects of the display. First, 2D and 3D
images need to be displayed faithfully, i.e., sizes shape, angles and lengths need to be perceived
correctly. Second, haptics requires quick dynamic response from the display. Third, artifacts
from other adjacent projectors (i.e., crosstalk) need to be kept to a minimum. Measurements of
crosstalk have been handled by the supplier of the HOE and the one in use in this project has less
than 0.9% crosstalk between view slits (explained in section 1.3).
My master thesis project is the first comprehensive evaluation of this new HOE-based
autostereoscopic display. The goal is to provide information on how to evaluate the visual
faithfulness and how to improve the performance in future generations of the display. With
hardware measurements I determine the displays faithfulness to present 2D and 3D objects. I
have also measured the visual delay in order to determine the extent of the lag in the system and
I provide suggestions for how to improve the system performance. Finally, a user study
evaluates individual subjects’ impressions of the ease of use of this display as compared to a
monoscopic display and 3D perception.

Uppsala University, Evaluation of a Holographic 3D Display 4 Jim Björk 2010
1.2. RELATED WORK My work spans new hardware measurement techniques for this type of display and proposing
methods to determine visual delay in a display system, as well as evaluating the visual
faithfulness by utilizing test subjects that are given a visual assessment task. Researchers have
developed various techniques for measuring properties of autostereoscopic displays e.g. (2), (3)
, (4) and (5). Most studies are limited to using a high refresh rate monitor coupled with shutter
eye glasses or parallax barrier displays, which by far is the most common autostereoscopic
display (6). The tests proposed in these papers work well for determining the properties of the
common types of autostereoscopic displays such as determining the optimal viewing distance,
viewing freedom, 3D crosstalk, luminance profile, etc. The proposed techniques are not
applicable to our display due to the completely different configuration (explained in 1.3 below).
In particular, other authors have not investigated the system delay, which is particularly
important problem when the display is coupled with haptics.
I have put effort into defining the system delay for this display. The two main aspects are the
display rendering time and the Input lag of the projectors. Input lag is not that well known
across review sites, electronic stores, web shops or anywhere else where projectors are
discussed since the most common uses are movie watching or presentations with PowerPoint
slides and similar applications. Visual delay and input lag are discussed in, mostly, internet
forums, e.g., (7), (8), and (9). In these enthusiast websites and forums a lot of effort has been put
in finding out the input lag of several projectors and desktop displays. Since very few
manufacturers of projectors or other types of displays specify the input lag, it is up to the user to
find it. The methods that are used in these forums and websites are fully applicable to our
system for finding out the input lag of our projectors.
1.3. CONFIGURATION OF DISPLAY SYSTEM The display setup is similar to the one used at the KTH Royal Institute of Technology (10) where
a HOE in reflection mode lies on a table with projectors mounted on an overhead beam can be
seen in Figure 1.
In the center of Figure 1 is the HOE with images projected on its surface. To the right of the HOE
is the phantom haptic device that is used with the display system. The eight BENQ GP 1
projectors form stereoscopic pairs when reflected off the surface of the HOE, i.e. seven different
stereo perspectives can be used when viewing the display. There are three computers, two of the
computers control four of the projectors each and communicate via Ethernet network; The third
computer is part of the headtracking system that controls the four cameras in Figure 1 (more on
headtracking in Section 3).
A sketch of the autostereoscopic principle for this display can be seen in Figure 2. In Figure 3 the
HOE is shown. In Figure 5 a, b, c are photos of a computer generated model from several angles
shown, note how the perspective varies with the viewing angle. You can also see two views at
the same time in b; this is due to the placement of the camera, it is positioned in a blend of two
viewing slits.
It is essential that the projectors are positioned such that the adjoining views are not separated
by empty space nor that the user can see two adjoining views with one eye. Figure 4 shows a
transition from left to right, from one stereoscopic pair to another with the projectors too far
apart. Figure 5 shows the effect when transitioning from one view to another with a camera.

Uppsala University, Evaluation of a Holographic 3D Display 5 Jim Björk 2010
FIGURE 1: DISPLAY EQUIPMENT.
FIGURE 2: AUTOSTEREOSCOPIC PRINCIPLE
FIGURE 3: A CLOSE UP ON THE HOLOGRAM OR HOE
Projectors
Viewing Slits
HOE

Uppsala University, Evaluation of a Holographic 3D Display 6 Jim Björk 2010
FIGURE 4: ILLUSTRATION OF MOVING FROM ONE VIEW TO ANOTHER WITH A LARGE WIDTH BETWEEN
PROJECTORS. (1) BOTH EYES IN DIFFERENT SLITS WITH STEREO VISION, (2) LEFT EYE IN BETWEEN
VIEWS, SEES NOTHING, RIGHT EYE IN SLIT, SEES THE SAME IMAGE AS IN (1), (3) RIGHT EYE BETWEEN
SLITS, SEES NOTHING, LEFT EYE IN MIDDLE SLIT, SEES THE IMAGE THE RIGHT EYE SAW IN (1) & (2),
(4) BOTH EYES IN DIFFERENT SLITS WITH STEREOVISION IN A NEW PERSPECTIVE
FIGURE 5: COMPUTER GENERATED MODEL, PHOTOS TAKEN FROM DIFFERENT ANGLES (A, B, C). THE
PHOTOS ARE FROM THE LEFT (A), TRANSITIONING (B) TO THE RIGHT (C).
2. 2D HARDWARE MEASUREMENTS We observed that there is a black band in between views, meaning that the viewing slits are not
adjoining. To quantify the width between views we mounted a camera, a Canon EOS400D, on a
tripod, and slid the camera horizontally in the position where a user would be sitting while
continuously photographing the HOE. By photographing the HOE while displaying a distinct
pattern we observed an empty space or black bands between views. This is shown in Figure 6. A
dark halo appears close to the borders on the far side.
These discontinuities ruin the 3D illusion by interrupting the transition between views. When
moving around to look at an object the black bands are visible on the objects in the display.
Figure 4 is an illustration of how it can look when transitioning to a new position. We want this
transition to be minimal to not lose the 3D perception. If both eyes see the same image it is the
same as looking at two images with no stereo disparity. If one eye sees an image and the other
nothing, the second or third case in Figure 4, the eye that is outside the slits would see nothing
or a very faded object in the display and the eye in the slit would see a 2D image. The viewing
area, or available workspace, is also affected by the black bands; a dark halo appears close to the
border and can be seen in Figure 7.
To improve the size of the viewing area, or workspace, and to mitigate the black bands distorting
the 3D perception a discussion with Gustafsson (11) on improvements for the display lead to
that the projector rig was raised higher up and the projectors spaced further apart. This is only a
temporary solution; we want to make a new hologram with thinner slits closer together. Other
possible improvements for increasing the size of the workspace would of course be to procure a
larger HOE. A larger HOE would also improve immersion since objects can be manipulated in a

Uppsala University, Evaluation of a Holographic 3D Display 7 Jim Björk 2010
much larger space and possibly “moved closer” to the observer or user. Figure 7 shows sample
photos of the limited display area of the display configuration before adjusting the projector rig
to reduce the black bands.
FIGURE 6: THE BLACK BAND BETWEEN VIEWING SLITS
FIGURE 7: THE LIMITED VIEWING AREA OF THE DISPLAY IN A DARKENED ROOM AND A LIT ROOM
3. 3D MEASUREMENTS In order to determine the faithfulness of 3D perception I have explored what I feel is the two
most important aspects of this display system, the perspective and headtracking. I have split this
section into two parts, both with their findings and results.
PERSPECTIVE
INTRODUCTION & BACKGROUND The most important factor for perceiving 3-dimensionality in this display is that the perspective
for each eye is correct in the corresponding viewing slit. Not only does the head change position
but the orientation of the users eyes too, see (12), (13) and (14) for a discussion on this topic. It
is of outmost importance that the perspective is correct to not ruin the 3D experience. This
perspective is calculated by specifying a height and a distance from the display where a person
sits. The perspective projection is affected by the calibration of the projectors and of the
keystone correction mentioned in Section 1.3. If there are discrepancies between the calculated,
projected length and size of an object and the perceived length and size the perspective model
need to be revised.

Uppsala University, Evaluation of a Holographic 3D Display 8 Jim Björk 2010
As the projectors all have different angles of inclination as can be seen in Figure 1, a custom keystone
correction software has been developed for this project. The desired projection area can be seen in Figure
8. When correcting the projection a lot of the image resolution is lost since the total projection area is still
the same size but with a smaller desired projection area. This means that a lot of the original resolution is
wasted as it is projected as dark, with only a portion actually showing something. This keystone correction
is unique for each of the projectors and we have to make sure that it will not affect the image quality.
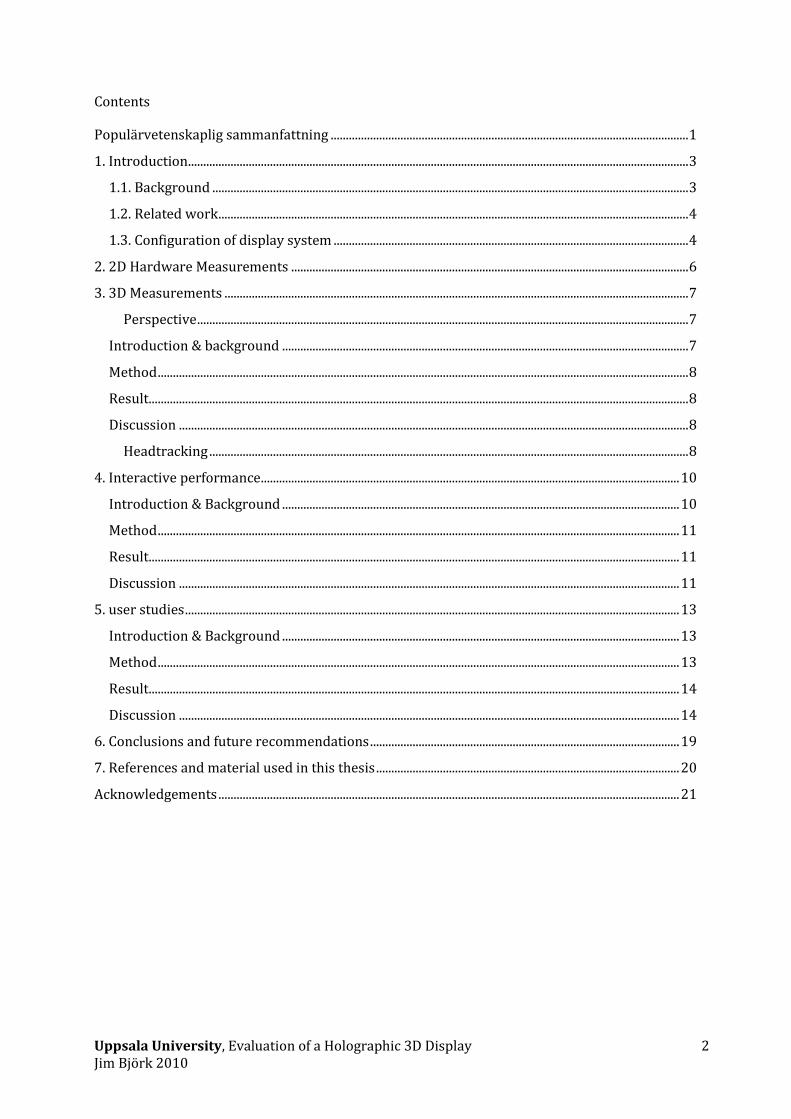
METHOD My proposed method is to measure the projection of a virtual object of length L from several
viewing angles or vantage points. I use a simple line segment with a known length projected on a
diffusion screen. When the line is seen from different vantage points the projection has a known
length if the angle of inclination and the relative position of the observer are known. With this in
mind you can test several angles and positions and use a ruler for measuring the length of the
projection. The results can be compared to the theoretical answer.
The gathered test data is measured in increments of 5 degrees from 20 to 70 degrees vertically
(rightmost image in Figure 9) and -45 to 45 degrees horizontally (leftmost image in Figure 9).
RESULT The accuracy of the projection length is within the margin of error you can measure with an
ordinary ruler. It is 0.5 mm and does not vary significantly for the different vantage points. This
is beyond what could accurately be measured with a ruler and is a calculated mean from the
measurements.
DISCUSSION The maximum error is 0.5 mm, it means that the small differences that may occur is less than 1
mm which is ok for a viewing distance of 0.5 m, the correct distance for the user to be sitting
when looking at the HOE. 0.5 mm is less than the size of one pixel in the tested height from the
projector with the least keystoning which is one of the center projectors. As the discrepancy
does not vary significantly when moving to another vantage point I would say that the keystone
correction is as good as it gets and the only source of variation would be from the calibration of
the keystone correction.
A more sophisticated approach to measure the length of the projected object from different
perspectives would be to photograph the projection and calculate the length in an image
analysis application. The other much more crude but still effective way is to use the ruler. The
approach with using a camera can be automated and can be more effective if the measurements
have to be done several times.
HEADTRACKING
Without any head tracking the view slits have a fix perspective, one fix perspective per viewing
slit. To change the perspective more dynamically and to enable a smoother transition between
views we need to know the position of the users, or operators, eyes. For a discussion on the
importance of the head-tracking and eye-tracking, see (12) and (14). Our current solution is
headtracking. By placing an active marker on the persons head or face we can track the viewer
and change the perspective dynamically.

Uppsala University, Evaluation of a Holographic 3D Display 9 Jim Björk 2010
We have been using the Worldviz PPTracker (15) with a marker mounted on a pair of glasses.
This equipment needs to be calibrated to the display coordinate space. We acquired a physical
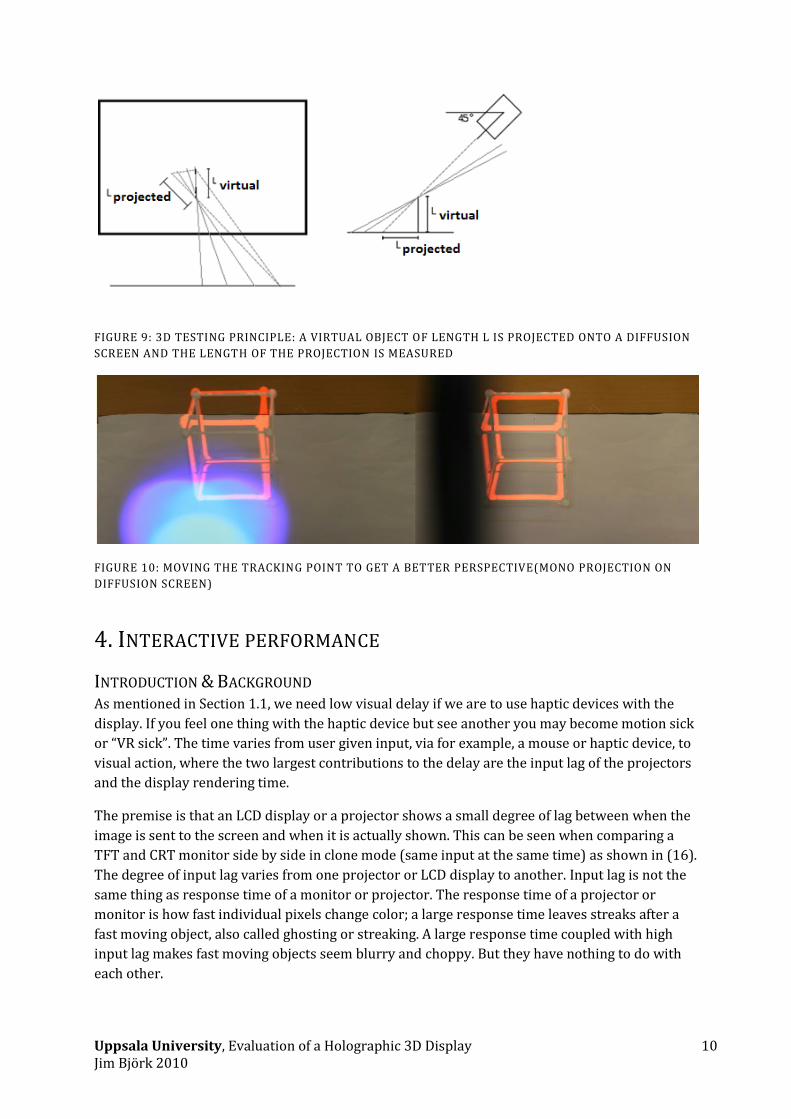
wireframe cube with which we will compare a projection of a digital model of the same cube.
The cube measures 8x8x8 cm, measured to an accuracy of 0.02 cm.
The physical cube is put in the same position on the table as the virtual cube will be projected. In
Figure 10 the offset is changed by physically moving the tracker and keeping the camera fixed
until the cubes coincide. A user can put on a pair of glasses with the tracker mounted on them
and sit still while calibrating the offset in software until the cubes coincide.
It turns out to be a fast method to test whether the perspective is correct. By adding a function
with which an operator can change the offset on the fly we have a fast method where the user
can calibrate the perspective by him or herself.
The problem with this type of headtracking is that we only get the position of the head. One of
the problems with not knowing the orientation of the head is that the perspective may seem
incorrect if the head is tilted or turned. As mentioned in (13) when the operator or user tilts or
turns his head the eyes move around interfering with the 3D perception. This may have to be
taken into consideration when investigating other types of headtracking.
If you take this into account while looking at the projection, i.e. moving with your eyes in the
same view plane at all times, the result is very impressive. The virtual cube seems to collide with
the real cube.
FIGURE 8: KEYSTONE CORRECTION. THE LEFTMOST IMAGE IS AN UNCORRECTED PROJECTION WITH
THE DESIRED AREA OF PROJECTION IN THE INNER REGION. THE RIGHTMOST IMAGE IS THE RESULTING
CORRECTED PROJECTION
Uppsala University, Evaluation of a Holographic 3D Display 10 Jim Björk 2010
FIGURE 9: 3D TESTING PRINCIPLE: A VIRTUAL OBJECT OF LENGTH L IS PROJECTED ONTO A DIFFUSION
SCREEN AND THE LENGTH OF THE PROJECTION IS MEASURED
FIGURE 10: MOVING THE TRACKING POINT TO GET A BETTER PERSPECTIVE(MONO PROJECTION ON
DIFFUSION SCREEN)
4. INTERACTIVE PERFORMANCE
INTRODUCTION & BACKGROUND As mentioned in Section 1.1, we need low visual delay if we are to use haptic devices with the
display. If you feel one thing with the haptic device but see another you may become motion sick
or “VR sick”. The time varies from user given input, via for example, a mouse or haptic device, to
visual action, where the two largest contributions to the delay are the input lag of the projectors
and the display rendering time.
The premise is that an LCD display or a projector shows a small degree of lag between when the
image is sent to the screen and when it is actually shown. This can be seen when comparing a
TFT and CRT monitor side by side in clone mode (same input at the same time) as shown in (16).
The degree of input lag varies from one projector or LCD display to another. Input lag is not the
same thing as response time of a monitor or projector. The response time of a projector or
monitor is how fast individual pixels change color; a large response time leaves streaks after a
fast moving object, also called ghosting or streaking. A large response time coupled with high
input lag makes fast moving objects seem blurry and choppy. But they have nothing to do with
each other.

Uppsala University, Evaluation of a Holographic 3D Display 11 Jim Björk 2010
The display rendering time is what I’ve chosen to call the time it takes to process the input, from
a mouse click or haptic input, to the time the projectors read from the graphic buffers. I will not
go too deep into the inner workings of I/O but I will give a brief summary. When the mouse or
haptic device signals the operating system that input is ready, the operating system has to signal
the running program. The program picks up the input, handles it and then has to render the
scene accordingly and fill the graphic buffers from which the projectors will read the image to be
projected.
METHOD The way to record the input lag accurately is by using a clock or stopwatch application running
in clone mode on both the display being tested and CRT as proposed by (8). A high shutter speed
on a digital camera allows you to capture images of the running application on both displays at
the same time that show the relative delay, or input lag. I have used the same camera as before,
the Canon EOS 400D. In this project I’ve used a stopwatch application from (8) which is a clock
with millisecond resolution. As a comparison screen I used a generic CRT monitor which has the
least amount of lag since it does not do any video processing.
When the input lag of the projectors is known, you can find the display rendering time by
measuring the time between an input action and output on the screen and then adjust for the
input lag. This is done by using a marker that shows when you give input to the screen and then
measure the time it takes to produce a response on a screen. During this test I have used, as a
marker, an ordinary HP PS/2 mouse with a bit of colored tape under one of the buttons and the
haptic device. By filming the mouse, or haptic device, getting clicked with the screen in the
background you can estimate the time it takes to produce a response on the screens. See Figure
13 for a concept of the process. Here we have used an ordinary consumer digital camera which
has high speed filming as a feature. The camera is the Casio Exillim FS10 and it can film at 210
fps with reasonable resolution. The high-speed video shows whether or not the button is pushed
down, as it can be hard to visually confirm if the button is pressed at 210 fps. The response
mechanism on the receiving side is a simple OpenGL application running in on the screen. The
program changes the color of the screen when the button is clicked. The same has been done in
H3D, supplied by (17), and is the software that is used with the screen, when measuring the
times for the haptic device. The visual delay, or response time, of the system will show on the
high-speed video.
RESULT For comparison we tested the input lag of an ordinary TFT monitor. In Figure 11 we see that the
clock is 16 ms late on the TFT monitor. Since the image data is sent at the same time to both
monitors this means that the TFT monitor lags behind the CRT by 16 ms in this particular frame.
On the projected surface to the left in Figure 12, it can be seen that the BENQ GP 1 projector lags
behind 70 ms since the CRT screen is 70 ms ahead in time. This input lag varies, Figure 12 (right)
is a photo of the monitor and projector with the projector showing only 40 ms delay, the most
common delay of the projector.
Table 1 contains the results from the visual delay tests of the different monitors. The measured
visual delay is 100±5 milliseconds for the display system. This means that from the moment I
give input to the system it takes a full 100 ms until a response is visible on the display.
DISCUSSION

Uppsala University, Evaluation of a Holographic 3D Display 12 Jim Björk 2010
It can be problematic to define the input lag and visual delay for this application. To describe the
input lag, the most common delay combined with the knowledge of the worst case delay may be
the most important aspect when considering visual interaction. Some other suggestions include:
most common delay, mean delay, worst case delay and the difference between worst case delay
and best case. The entire visual delay seems to be stable at about 100 milliseconds. H3D utilizes
OpenGL so there is no difference between OpenGL and H3D application that is used when
determining the system delay, or system response time.
I also compared the input lag of several different projectors and displays. The measured input
lags of the different displays are shown in Table 1. There are large variations due to the different
nature of the displays. The BENQ projectors show the worst performance.
We can conclude that the current total system input delay is around 100ms. For the most
common delay of the projectors, i.e., 40 ms the display rendering time is ~60 ms. We can clearly
see that there is room for software optimization. This can be explained by the poor parallel
rendering implementation.
FIGURE 11: INPUT LAG EXAMPLE: CRT (LEFT) AND TFT (RIGHT) RUNNING THE STOPWATCH
APPLICATION
FIGURE 12: A SAMPLE PICTURE OF THE STOPWATCH APPLICATION SHOWING 70 MS DELAY, THE
WORST CASE FOR THE BENQ GP 1 PROJECTOR(LEFT) AND THE MOST COMMON DELAY 40 MS(RIGHT)

Uppsala University, Evaluation of a Holographic 3D Display 13 Jim Björk 2010
FIGURE 13: MOUSEBUTTON WITH MARKER (A) BEING CLICKED (B) AND THEN REACTION IS SHOWN ON
SCREEN(C). BOTTOM RIGHT IS A REAL WORLD EXAMPLE FROM ONE OF THE HIGH SPEED VIDEO TESTS
TABLE 1: COMPARSION OF DIFFERENT MONITORS
5. USER STUDIES
INTRODUCTION & BACKGROUND The user evaluations aim to explore any systematic errors we make in estimating 3D objects
when we use the display, i.e., if we over or underestimate the depth in a consistent way. To be
able to quantify this we allow a user to scale two symmetric and regularly shaped objects to
make them uniform in shape and size. We chose a wireframe rectangular parallelepiped and a
tessellated ellipsoid and the goal is to resize them into a perfect cube and a perfect sphere. The
rectangular parallelepiped gives visual cues such as parallel lines and 90 degree corners. It is
presented in an off-axis projection and estimating the dimensions of the object is helped by the
gestalt law of continuity. The ellipsoid utilizes the gestalt law of symmetry to make it spherical
from all angles.
METHOD The testing population consisted of twelve test users and a four person control group consisting
of the employees at the department doing research on the display as well as myself. All test
subjects have done a stereoscopic test to see their ability to perceive depth in stereo imaging.
Here the test subjects have been given a task to determine whether or not an object is in front or
behind of a reference plane, in five trials each, see Figure 15 for the concept. The test subjects
Input lag(worst case) (Comparing with a CRT monitor)
Lcd 16 ms
Infocus Projector 31 ms
BENQ projectors 70 ms
Infocus depthQ Projector 31 ms

Uppsala University, Evaluation of a Holographic 3D Display 14 Jim Björk 2010
have also done a simple red-green color-deficiency test; it is of interest since the current display
is monochrome red-black only.
In this test we have used four modes of testing, with and without stereo as well as with and
without headtracking. Most of us are used to work with 2D monitors at a daily basis so for the
non-stereo tests we use a standard LCD monitor and a mono projection on a diffusion screen
when using headtracking. For the stereo-enabled tests the HOE display is used.
The test conditions are:
1. LCD monitor, fixed perspective, without headtracking
2. Mono projection on diffusion screen, with headtracking
3. Autostereoscopic display, with headtracking
4. Autostereoscopic display, without headtracking
The test subject are presented with an object, the rectangular parallelepiped or the ellipsoid,
warped in scale so it may look squished or elongated in the x, y and z coordinates, see Figure 14.
The goal then is to adjust the object, i.e., make the object into a perfect sphere or a perfect cube.
The scale of the finished objects is measured and then compared. All subjects are presented
with six cubes and six spheres.
RESULT In Table 2, showing the stereopsis results, we see the score when determining whether or not
the object is in front or behind the reference plane. The mean score for the test group is 65%
correct with a third of the group scoring less than 50%. None of the participants failed the red-
green color-deficiency test.
Figure 16 shows a box plot of the X scale value divided by the Y and Z scales respectively. The
abbreviations stand for: LCD uses no stereo imaging and no headtracking, this test contains no
depth at all. Mono+track is a mono projection with headtracking; this means that we can get
depth from motion. AS is autostereoscopic with no headtracking giving depth with stereovision
only and AS+track is autostereoscopic with headtracking giving depth in both motion and
stereovision.
We look at the X/Y and X/Z values to get a dimensionless measurement of the over and under
estimation of sizes. The Y-axis in the plots is the X/Y and X/Z scales with the boxes containing
the first and second quartile, i.e., the median is found between the boxes. An overestimation is a
large value in the plot. It is a large value since if you overestimate the depth (Z), the object
becomes a bit shallow, or flat, and thus the Z-value is smaller than the expected value, making
the X/Z-value larger. The same goes for the underestimation of values. A perfect estimate would
be 1.0 for both the X/Y and X/Z values and is shown as a baseline in the plots.
DISCUSSION Looking at the results for X/Y we see a trend that points to the fact that we perceive 2D quite
well. For the Cube-object you just have to make it square in one of the projection planes and it is
similarly easy to do the same for the Sphere-object, which becomes a circle (or ellipse) in a
projection plane. The X/Y-values are by far the more consistent values, and this is in fact not that
surprising. The more interesting results are in, the X/Z-values. Here we see a clear pattern, when
using the headtracking the test subjects start to overestimate the depth and when the

Uppsala University, Evaluation of a Holographic 3D Display 15 Jim Björk 2010
autostereoscopic display is used the overestimation lessens. The overestimation decreases
further when the tracking is removed, restricting the movement of the user.
By looking at the X/Z graph we can safely assume that the depth is hard to determine accurately.
This is true for human beings; we have a hard time to judge distances accurately. It can also be
noted that for an object with a quite simple geometry the results do not vary too much, as
mentioned before the Cube provides several geometric features which are easy to assess in 3D.
The Sphere on the other hand does not give as many visual cues as the Cube and we note more
variation in the data.
By comparing the results of tests 1 (LCD) and 3 (AS), we see similar results in X/Y for both the
sphere and the cube. Note though that the X/Z value for the LCD is more or less guesswork since
the cube displayed on a 2D surface is basically two squares connected by the corners and the
sphere is only a circle in the projection. This gives very few clues on the depth, if any.
We can also see that the head tracking helps in determining the depth when using the stereo
display.
As this is an autostereoscopic display it allows assessing the 3D depth without using any sort of
glasses or headgear i.e. we gain advantages over a 2D display by utilizing the autostereoscopic
display when looking at 3D objects. To be able to get a 3D feel for objects in a 2D screen you have
to be able to change the viewpoint or rotate the object. This is depth derived from motion. In the
autostereoscopic display, a 3D object has depth derived from stereovision. With this type of
display you are able to move around; looking at the object from different angles and still see
depth. If you want to look at 3D objects without needing to rotate objects or changing viewpoints
in software our display is the solution. With it you can move around as you would in real life to
look at something.
The visual performance is comparable to any commercially available autostereoscopic monitor.
But with the added bonus of having a large look-around area, enabling co-located haptics and
still being able to change perspective makes our display superior. The downsides include that it
is presently only available in monochrome red color and that the visual delay of the display is
quite tangible as mentioned in Section4.
This technology can be extended to making a full color hologram which could enhance the
experience, but at the present it is unavailable. In the current setup you can move your hand
around in the “3D space” but the hand or haptic device will cast real world shadows on the HOE.
With a transmission display this problem disappears. Further research would perhaps enable
the use of a full color transmission hologram i.e. the projectors mounted on the other side of the
HOE. This would completely remove the problem with real world shadows occluding the
projection.
An interesting finding is that all subjects seem to be able to correctly determine the hardest
challenge in the stereopsis pre-test. See Table 2 column three. The score for this particular part
is 92% and has the least stereoscopic disparity. This is a result worth investigating. A new type
of stereopsis pre-test should be evaluated to compare the performance. I would recommend
developing a new series visual assessment tasks for the coming generation of tests for this
display. The tests could be similar to the ones in (12). I believe that the tests that Prof. Ware is

Uppsala University, Evaluation of a Holographic 3D Display 16 Jim Björk 2010
using are very applicable to our display system. They may have to be adapted or revised to suit
the needs of our display system.
FIGURE 14: RECTANGULAR PARALLELPIPED AND ELLIPSOID
FIGURE 15: STEREOPSIS PRE-TEST. THE YELLOW OBJECT IS EITHER IN FRONT OF OR BEHIND OF THE
GRAY-BLUE REFERENCE PLANE WITH DIFFERENT DISPARITIES

Uppsala University, Evaluation of a Holographic 3D Display 17 Jim Björk 2010
Ground truth f b b b f
Offset -0,21 0,25 0,1 0,25 -0,25 %right/person
Difficulty 2 1 3 1 1
f b b b f 1,00
b f b b f 0,60
b f b f b 0,20
b f b f b 0,20
b b b b f 0,60
f f b f b 0,40
f b b b f 1,00
f f b b f 0,80
share with score <50%
f b b b f 1,00 0,33
b b b f f 0,60
f f f f f 0,40 Mean
f b b b f 1,00 0,65
0,58 0,50 0,92 0,58 0,75 TABLE 2: RESULTS FROM STEREOSCOPIC ABILITY TEST
0
1
2
3
4
5
6
LCD Mono+track AS AS+track
X/Y Cube

Uppsala University, Evaluation of a Holographic 3D Display 18 Jim Björk 2010
FIGURE 16: TESTRESULTS , BOXES CONTAINING THE FIRST AND SECOND QUARTILE, NOTE: LCD USES
NO DEPTH, SEE DISCUSSION
0
1
2
3
4
5
6
LCD Mono+track AS AS+track
X/Z Cube
0
1
2
3
4
5
6
LCD Mono+track AS AS+track
X/Y Sphere
0
1
2
3
4
5
6
LCD Mono+track AS AS+track
X/Z Sphere

Uppsala University, Evaluation of a Holographic 3D Display 19 Jim Björk 2010
6. CONCLUSIONS AND FUTURE RECOMMENDATIONS The projector rig and software keystone correction has to be calibrated for the display
configuration. Even though the keystone correction work, an optical keystone correction would
be preferable as no loss in resolution would occur. The perspectives in each viewing slit are
correct and as accurate as the calibration makes it. There is no variation in image quality as you
look at the hologram from different vantage points. The tracking helps in making a smooth
transition between views. A new type of headtracking would be preferable though, where the
orientation and position of each eye of the user is taken into account which could render a more
accurate perspective. The interactivity is potentially the most severe problem. The two most
important factors for improving the interactivity are getting faster projectors and optimizing the
rendering for a multi monitor configuration. The current 100 ms visual delay is not feasible for
interactive use with haptics, what you feel with the haptic device is not what you see in the
display. As mentioned before this may cause headaches or motion sickness which one of the test
subjects actually experienced. We’ve also compared our display setup with the one used by
Gustafsson at KTH and with the results and experiences from both projects we have summed the
requirements on the display for future generations. The requirements for the new projectors
are:
Low input lag We want no image processing in the projectors. The desired image is produced in the computer
and should be directly represented on the display. The video processing should at least be
optimized for interactivity instead of streaming video. The current 40 millisecond delay is too
long; an input lag of less than 15 milliseconds is desired. A digital in port that matches the out
port of the computer would be preferable. Increasing the refresh rate of 60 Hz to 120Hz may be
an improvement though this is more of a luxury than a requirement.
Narrow RGB spectra The HOE is matched with the narrowest peak in the light spectra of the projectors light source.
That means LED or LED-Laser hybrid lighting are the only suitable solutions. These light sources
have narrow peaks in their light spectra compared to ordinary light bulbs that are more
common in projectors. Unfortunately there is some variation among projectors which could
result in some artifacts.
Better optics Increased throw length would allow the projectors to be mounted further from the projector but
still focus on the HOE. Optical keystone correction is needed since the projection frustum will be
slanted because of the tilting of the projectors. We have noticed that as the projectors get warm
the optics start to warp and the focus shifts during this process. This could be mitigated by a
better designed housing for the optics.
Small form factor Since the projectors are mounted on a beam that is suspended from the roof the projectors
should be small enough to be mounted side by side on the beam. They should also be light
enough so that a hardhat is not needed when using the display setup, risking it dropping on your
head.
Future wish list for improved immersion

Uppsala University, Evaluation of a Holographic 3D Display 20 Jim Björk 2010
With a larger hologram you can reach in further into the display and also pick up virtual objects
and “move them closer” to your face. The workspace would also be increased.
A transmission hologram would alleviate the problem of real world shadows from e.g. haptic
devices in use with the display.
A new headtracking system that also gives the orientation of the eyes.
A full color hologram that would improve the experience by being able to present anything you
can produce with a computer in full color.
7. REFERENCES AND MATERIAL USED IN THIS THESIS 1. Carlbom, Ingrid. Centre for Image Analysis, Swedish University of Agricultural Sciences &
Uppsala University. Whole Hand Haptics with True 3D Displays. [Online] 12 11, 2009.
http://www.cb.uu.se/research/whh/.
2. Estimation of image quality in autostereostereoscopic display. Saveljev, Vladimir V., Son,
Jung-Young and Cha, Kyung-Hoon. 2005, SPIE, Vol. 5908.
3. 20.4:Objective Evaluation of Multi-View Autostereoscopic 3D Displays. Salmimaa, Marja and
Järvenpää, Toni. Media Laboratory, Nokia Research Center, Tampere, Finland : SID, 2008. SID
08 DIGEST.
4. Optical Characterization and Measurements of Autostereoscopic 3D displays. Marja Salmimaa,
Toni Järvenpää. 2008, Proc. of SPIE, Vol. 7001.
5. Analysis of the viewing zone of multi-view autostereoscopic displays. Dodgson, Neil A. 2002,
SPIE, Vol. 4660.
6. Halle, Michael. Autostereoscopic displays and computer graphics. Computer Graphics, ACM
SIGGRAPH,31(2). May 1997, pp. 58-62.
7. AVS Forum. AVS Forum. www.avsforum.com. [Online] http://www.avsforum.com.
8. Flatpanelshd. Flatpanelshd. www.flatpanelshd.com. [Online] [Cited: 07 10, 2010.]
www.flatpanelshd.com.
9. Tftcentral. Tftcentral. www.tftcentral.co.uk. [Online] [Cited: 07 10, 2010.]
www.tftcentral.co.uk/features.htm.
10. Gustafsson, et al. Large-format 3D Interaction Table. Stereoscopic Displays and Virtual
Reality Systems XII, Volume 5664, SPIE. 2005, pp. 589-595.
11. Gustafsson, Jonny. Personal communication the the developer and inventor of the HOE
based display. Uppsala, Stockholm : s.n., 2010.
12. Fish tank virtual reality. Ware, Colin, Arthur, Kevin and Booth, Kellogg S. Amsterdam, The
Netherlands : s.n., 1993. Proceedings of the INTERACT '93 and CHI '93 conference on Human
factors in computing systems.

Uppsala University, Evaluation of a Holographic 3D Display 21 Jim Björk 2010
13. High resolution virtual reality. Deering, Michael. 2, 1992, SIGGRAPH Comput. Graph., Vol. 26,
pp. 195-202.
14. Interactive viewpoint control and three-dimensional operations. McKenna, M. 1992. 1992
Symposium on Interactive 3D Graphics, Special Issue of Computer Graphics. pp. 53-56.
15. Worldviz. Worldviz. Worldviz:PPTX Details. [Online] [Cited: 11 29, 2010.]
http://www.worldviz.com/products/ppt/pptx.html.
16. Fuchur. Fuchur. fuchur.dyndns.org. [Online] [Cited: 07 10, 2010.]
http://fuchur.dyndns.org/nik/leaveasitis/TFTvsCRT.wmv.
17. Sensegraphics. H3D.org - Open Source Haptics. [Online] http://www.h3dapi.org/.
18. Gustafsson, Jonny and Lindfors, C. Development of a 3D interaction table. Stereoscopic
Displays and Virtual Reality Systems XI, Volume 5291, SPIE. 2004, pp. 509-516.
ACKNOWLEDGEMENTS This Master Thesis was carried out from June 2010 until December 2010 at the request of the
Centre for Image Analysis, Uppsala University in Uppsala, Sweden. Working place for the thesis
has been at the centre office in Uppsala. The work has been formulated by Prof. Ingrid Carlblom
at Uppsala University, Prof. Stefan Seipel at Uppsala University and Ass. Prof. Robin Strand at
Uppsala University. Examiner of the thesis is Dr. Tomas Nyberg, examiner Teknisk Fysik.
A special gratitude is dedicated to my co workers Martin Ericsson, Pontus Olsson and Fredrik
Nysjö.
Uppsala December 2010
Jim Björk


