PennWell International
Exhibiting ROI Webcast e-Workbook
Copyright 2013. Competitive Edge & PennWell. All rights reserved.
No portion of this workbook may be reproduced without permission of Competitive Edge.
For questions or permission call 800-700-6174 or 704-814-7355.
1
Exhibiting ROI
How to Measure and Report
Exhibiting Results and
Return on Investment
Custom
Present
Webinar Discussion Points
1. Exhibiting ROI – can it be measured? 2. Budgeting for exhibiting success 3. Where the tradeshow dollar goes
4. Setting exhibiting goals that lead ROI 5. Determining your ROI target
6. Tradeshow performance metrics 7. Reporting tradeshow performance and
results to management
PennWell International
Exhibiting ROI Webcast e-Workbook
Copyright 2013. Competitive Edge & PennWell. All rights reserved.
No portion of this workbook may be reproduced without permission of Competitive Edge.
For questions or permission call 800-700-6174 or 704-814-7355.
2
Want to Make it BIG in Show Business?
The “Tradeshow Turnaround Artist” Can Help! "In today's changing and competitive marketing arena, exhibitions are one of your most effective media… IF done properly. However, few exhibitors truly understand how to make exhibitions payoff," says Jefferson Davis, America's
premier exhibiting expert and author of Results-Focused Exhibiting.
Described as "a burst of focused and positive, can do energy", Davis's innovative, practical and process based approach to exhibiting has helped his clients produce over 500 million dollars in exhibition sales since 1991. Over 90,000 exhibitors have attended his exhibiting success
seminars and workshops. Hundreds of companies have hired Davis as a consultant and trainer and have experienced immediate, dramatic and measurable improvement in their exhibiting results in just one
show cycle.
Is your company ready for a tradeshow turnaround?
Visit www.tradeshowturnaround.com and take our Complimentary Exhibiting Needs Assessment to find out.
Or call Jefferson Davis at 800-700-6174 to learn more about:
Exhibiting by Objectives Consulting Services High-Impact Pre-show Marketing System Development Consulting Custom Exhibit Staff Training Workshops and Coaching Solution Focused Sales Training and Development Programs Closed Loop Lead Management System Development Consulting Exhibiting Cost Control and Return on Investment Measurement Consulting
2211 Houston Branch Road Charlotte, NC 28270
Phone: 800-700-6174 Fax: 704-814-7366
www.tradeshowturnaround.com
PennWell International
Exhibiting ROI Webcast e-Workbook
Copyright 2013. Competitive Edge & PennWell. All rights reserved.
No portion of this workbook may be reproduced without permission of Competitive Edge.
For questions or permission call 800-700-6174 or 704-814-7355.
3
Prerequisites for Measuring ROI
• Develop a “______________” versus a “_______________” perspective.
• View the exhibiting program as a marketing and sales “_____________” - not an
“_________________”.
• Get out of the “______________________”.
• Invest more time on Critical Exhibiting Success Factors that drive revenue and ROI.
Budgeting for Exhibiting Success
• Use zero based budgeting to justify ALL expenditures.
• Start with the tradeshow budgeting rule of thumb.
– Floor space cost x _____________
• Budget more for:
– driving qualified booth traffic.
– delivering a quality visitor experience.
• Consider an “______________________________” per exhibit visitor or Profile Match
within the total show audience
PennWell International
Exhibiting ROI Webcast e-Workbook
Copyright 2013. Competitive Edge & PennWell. All rights reserved.
No portion of this workbook may be reproduced without permission of Competitive Edge.
For questions or permission call 800-700-6174 or 704-814-7355.
4
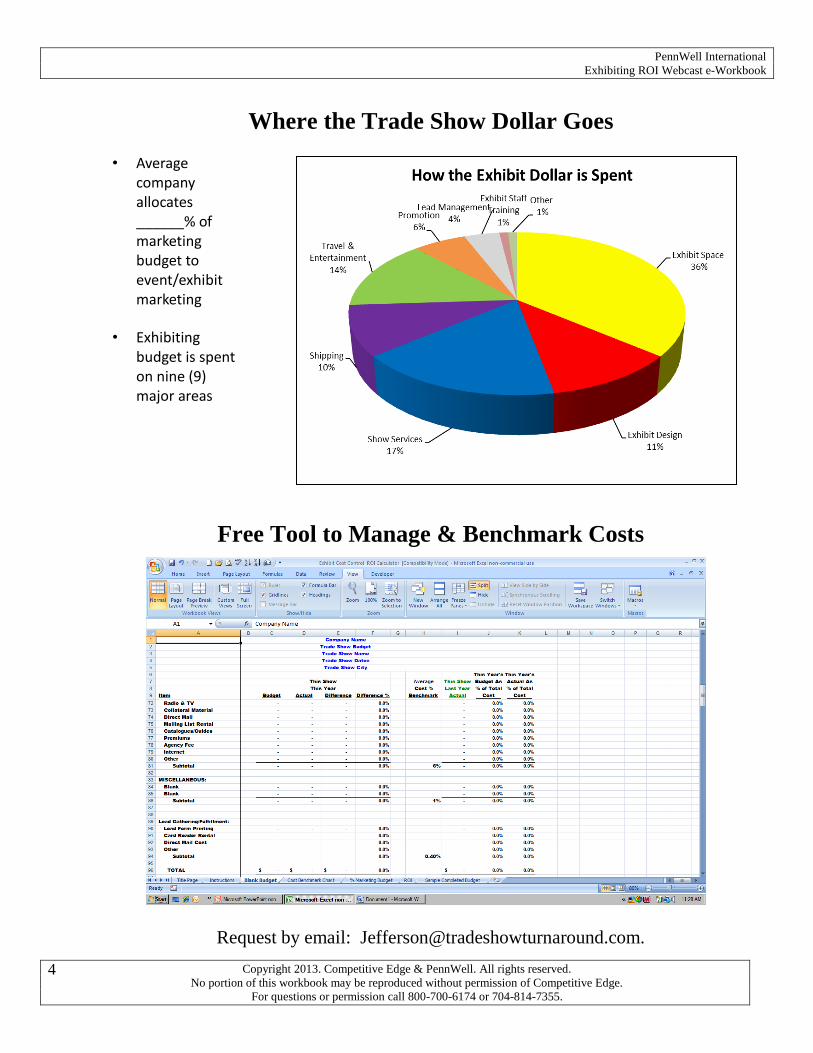
Where the Trade Show Dollar Goes
Free Tool to Manage & Benchmark Costs
Request by email: [email protected].
• Average company allocates ______% of marketing budget to event/exhibit marketing
• Exhibiting budget is spent on nine (9) major areas
PennWell International
Exhibiting ROI Webcast e-Workbook
Copyright 2013. Competitive Edge & PennWell. All rights reserved.
No portion of this workbook may be reproduced without permission of Competitive Edge.
For questions or permission call 800-700-6174 or 704-814-7355.
5
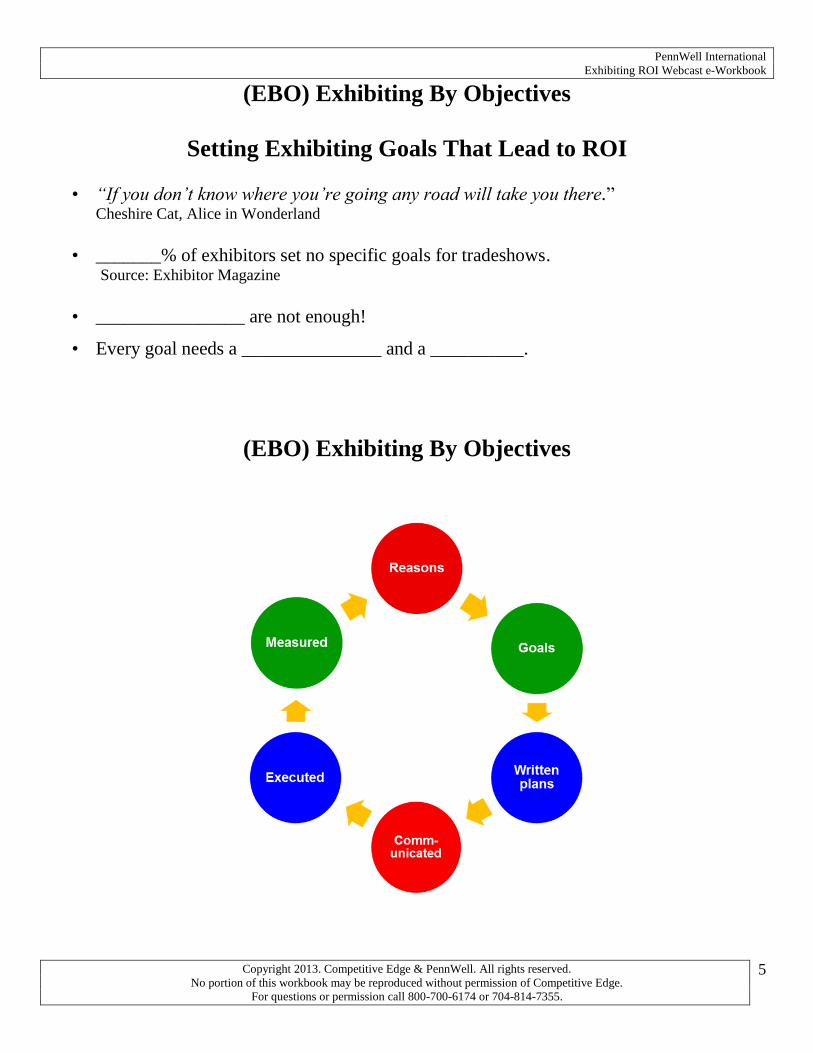
(EBO) Exhibiting By Objectives
Setting Exhibiting Goals That Lead to ROI
• “If you don’t know where you’re going any road will take you there.” Cheshire Cat, Alice in Wonderland
• _______% of exhibitors set no specific goals for tradeshows. Source: Exhibitor Magazine
• ________________ are not enough!
• Every goal needs a _______________ and a __________.
(EBO) Exhibiting By Objectives
PennWell International
Exhibiting ROI Webcast e-Workbook
Copyright 2013. Competitive Edge & PennWell. All rights reserved.
No portion of this workbook may be reproduced without permission of Competitive Edge.
For questions or permission call 800-700-6174 or 704-814-7355.
6
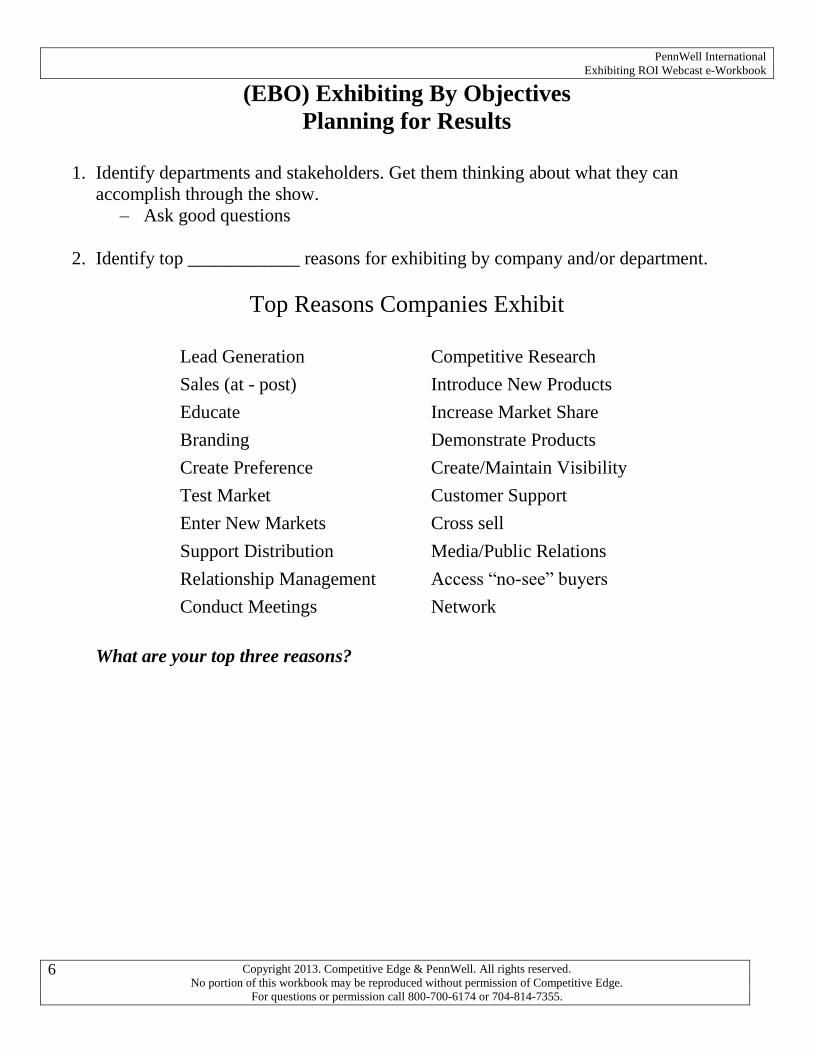
(EBO) Exhibiting By Objectives
Planning for Results
1. Identify departments and stakeholders. Get them thinking about what they can
accomplish through the show.
– Ask good questions
2. Identify top ____________ reasons for exhibiting by company and/or department.
Top Reasons Companies Exhibit
Lead Generation Competitive Research
Sales (at - post) Introduce New Products
Educate Increase Market Share
Branding Demonstrate Products
Create Preference Create/Maintain Visibility
Test Market Customer Support
Enter New Markets Cross sell
Support Distribution Media/Public Relations
Relationship Management Access “no-see” buyers
Conduct Meetings Network
What are your top three reasons?
PennWell International
Exhibiting ROI Webcast e-Workbook
Copyright 2013. Competitive Edge & PennWell. All rights reserved.
No portion of this workbook may be reproduced without permission of Competitive Edge.
For questions or permission call 800-700-6174 or 704-814-7355.
7
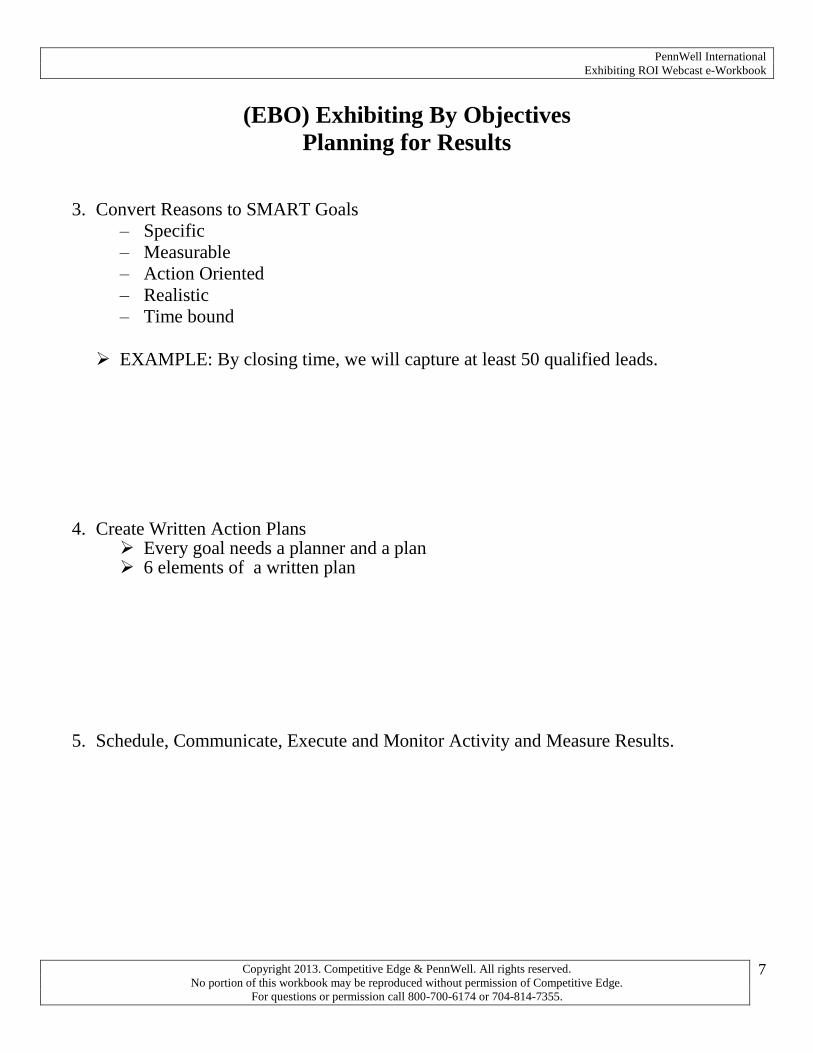
(EBO) Exhibiting By Objectives
Planning for Results
3. Convert Reasons to SMART Goals
– Specific
– Measurable
– Action Oriented
– Realistic
– Time bound
EXAMPLE: By closing time, we will capture at least 50 qualified leads.
4. Create Written Action Plans
Every goal needs a planner and a plan 6 elements of a written plan
5. Schedule, Communicate, Execute and Monitor Activity and Measure Results.
PennWell International
Exhibiting ROI Webcast e-Workbook
Copyright 2013. Competitive Edge & PennWell. All rights reserved.
No portion of this workbook may be reproduced without permission of Competitive Edge.
For questions or permission call 800-700-6174 or 704-814-7355.
8
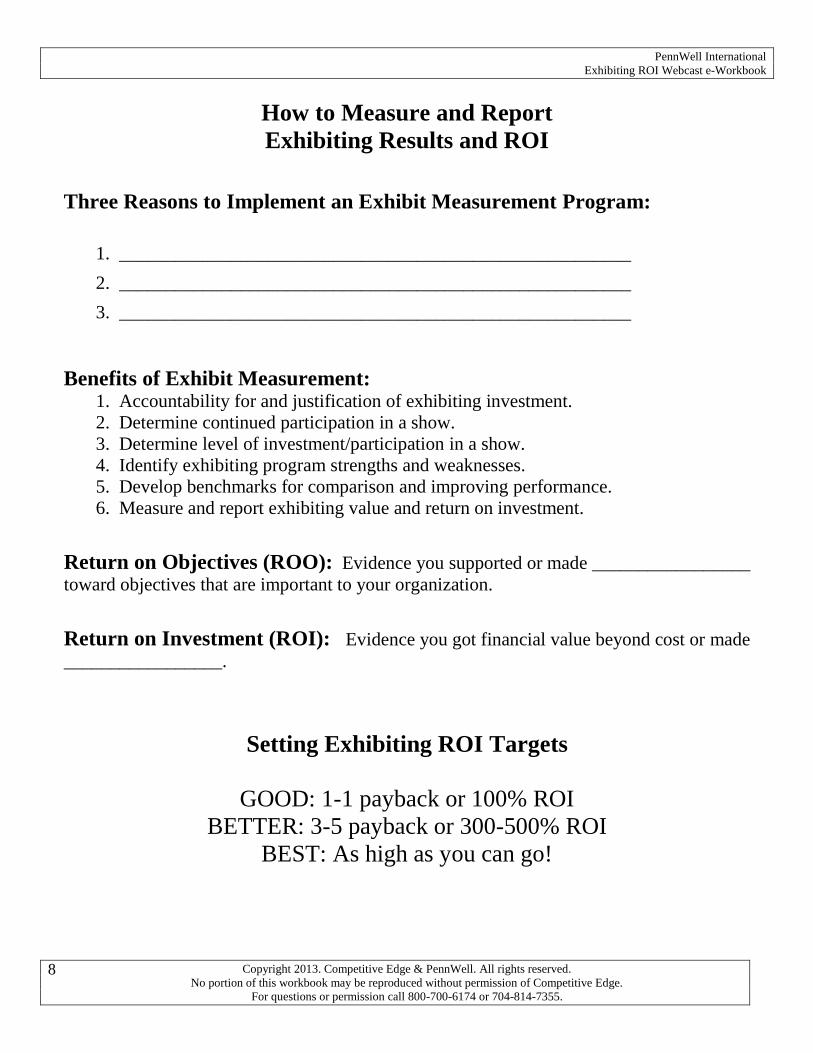
How to Measure and Report
Exhibiting Results and ROI
Three Reasons to Implement an Exhibit Measurement Program:
1. _______________________________________________________
2. _______________________________________________________
3. _______________________________________________________
Benefits of Exhibit Measurement: 1. Accountability for and justification of exhibiting investment.
2. Determine continued participation in a show.
3. Determine level of investment/participation in a show.
4. Identify exhibiting program strengths and weaknesses.
5. Develop benchmarks for comparison and improving performance.
6. Measure and report exhibiting value and return on investment.
Return on Objectives (ROO): Evidence you supported or made _________________
toward objectives that are important to your organization.
Return on Investment (ROI): Evidence you got financial value beyond cost or made
_________________.
Setting Exhibiting ROI Targets
GOOD: 1-1 payback or 100% ROI
BETTER: 3-5 payback or 300-500% ROI
BEST: As high as you can go!
PennWell International
Exhibiting ROI Webcast e-Workbook
Copyright 2013. Competitive Edge & PennWell. All rights reserved.
No portion of this workbook may be reproduced without permission of Competitive Edge.
For questions or permission call 800-700-6174 or 704-814-7355.
9
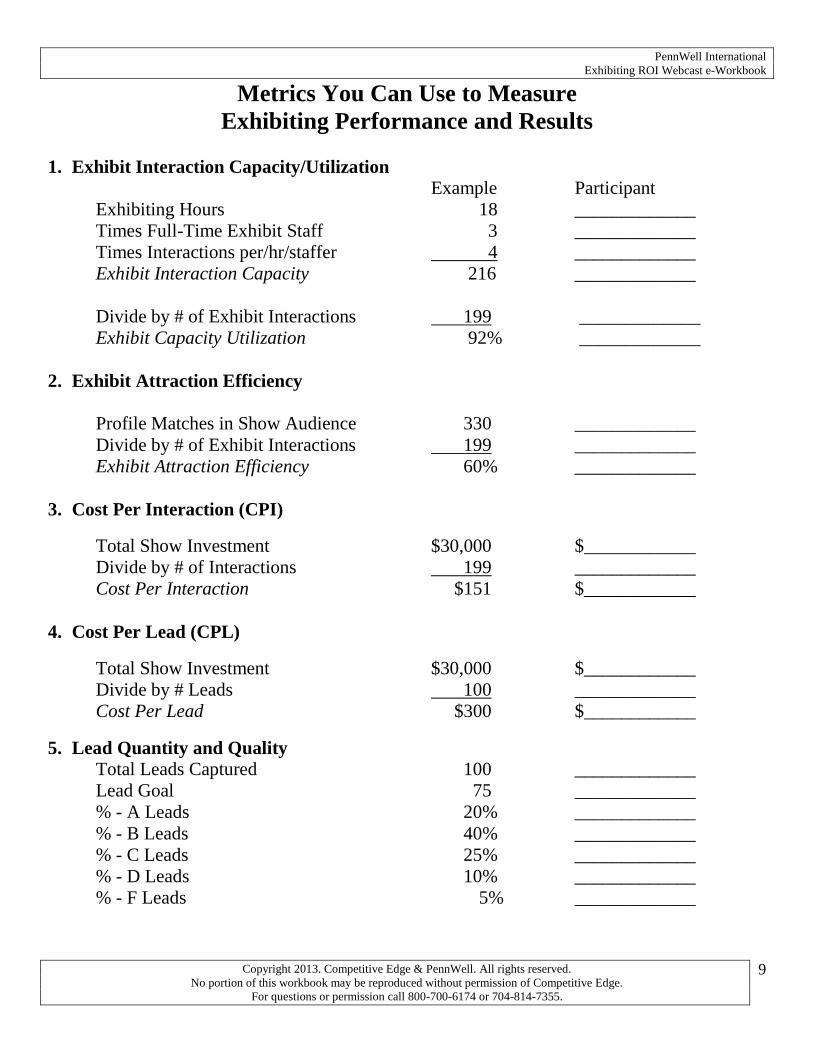
Metrics You Can Use to Measure
Exhibiting Performance and Results
1. Exhibit Interaction Capacity/Utilization
Example Participant
Exhibiting Hours 18 _____________
Times Full-Time Exhibit Staff 3 _____________
Times Interactions per/hr/staffer 4 _____________
Exhibit Interaction Capacity 216 _____________
Divide by # of Exhibit Interactions 199 _____________
Exhibit Capacity Utilization 92% _____________
2. Exhibit Attraction Efficiency
Profile Matches in Show Audience 330 _____________
Divide by # of Exhibit Interactions 199 _____________
Exhibit Attraction Efficiency 60% _____________
3. Cost Per Interaction (CPI)
Total Show Investment $30,000 $____________
Divide by # of Interactions 199 _____________
Cost Per Interaction $151 $____________
4. Cost Per Lead (CPL)
Total Show Investment $30,000 $____________
Divide by # Leads 100 _____________
Cost Per Lead $300 $____________
5. Lead Quantity and Quality
Total Leads Captured 100 _____________
Lead Goal 75 _____________
% - A Leads 20% _____________
% - B Leads 40% _____________
% - C Leads 25% _____________
% - D Leads 10% _____________
% - F Leads 5% _____________
PennWell International
Exhibiting ROI Webcast e-Workbook
Copyright 2013. Competitive Edge & PennWell. All rights reserved.
No portion of this workbook may be reproduced without permission of Competitive Edge.
For questions or permission call 800-700-6174 or 704-814-7355.
10
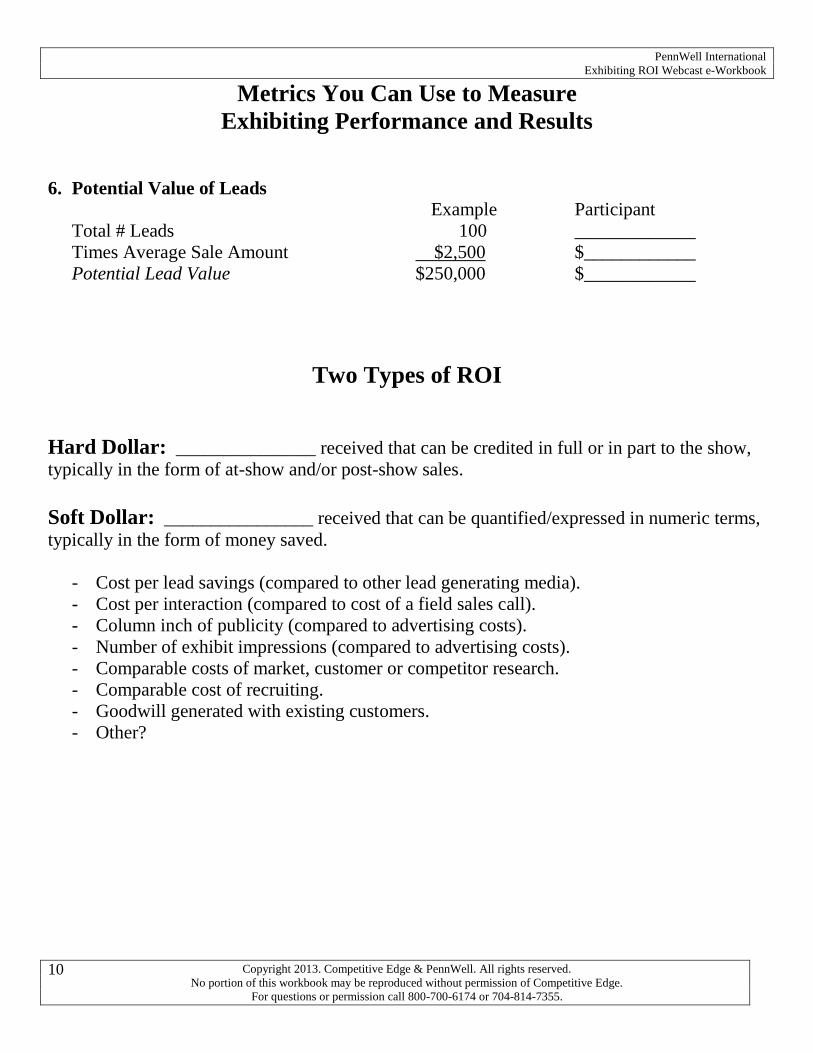
Metrics You Can Use to Measure
Exhibiting Performance and Results
6. Potential Value of Leads
Example Participant
Total # Leads 100 _____________
Times Average Sale Amount $2,500 $____________
Potential Lead Value $250,000 $____________
Two Types of ROI
Hard Dollar: _______________ received that can be credited in full or in part to the show,
typically in the form of at-show and/or post-show sales.
Soft Dollar: ________________ received that can be quantified/expressed in numeric terms,
typically in the form of money saved.
- Cost per lead savings (compared to other lead generating media).
- Cost per interaction (compared to cost of a field sales call).
- Column inch of publicity (compared to advertising costs).
- Number of exhibit impressions (compared to advertising costs).
- Comparable costs of market, customer or competitor research.
- Comparable cost of recruiting.
- Goodwill generated with existing customers.
- Other?

PennWell International
Exhibiting ROI Webcast e-Workbook
Copyright 2013. Competitive Edge & PennWell. All rights reserved.
No portion of this workbook may be reproduced without permission of Competitive Edge.
For questions or permission call 800-700-6174 or 704-814-7355.
11
Two Types of ROI
Return on Investment HARD Dollar Formula Example
Example Participant
Revenue Traced Back to Show $100,000 $___________
Less Cost of Sales (20% Gross Margin) - 20,000 $___________
Gross Exhibit Profit (Loss) $ 80,000 $___________
Less Exhibiting Investment - 30,000 $___________
Net Exhibit Profit (Loss) $ 50,000 $___________
Net Exhibit Profit (Loss) $ 50,000 $___________
Divided by Exhibiting Investment $ 30,000 $___________
Multiplied by 100 x 100 x 100
Return on Investment 167% ROI ___________%
Cost Per Interaction Soft Dollar ROI Contribution
Total Show Investment $ 30,000 $____________
Divide by # of Interactions 199 _____________
Cost Per Interaction $151 $____________
Comparative (Field Sales Call) $596 $596
Less Cost Per Interaction -$151 $____________
CPI Savings $445 $____________
Times # of Interactions x199 _____________
Soft Dollar ROI Contribution $88,555/295%SD/ROI $____________
PennWell International
Exhibiting ROI Webcast e-Workbook
Copyright 2013. Competitive Edge & PennWell. All rights reserved.
No portion of this workbook may be reproduced without permission of Competitive Edge.
For questions or permission call 800-700-6174 or 704-814-7355.
12
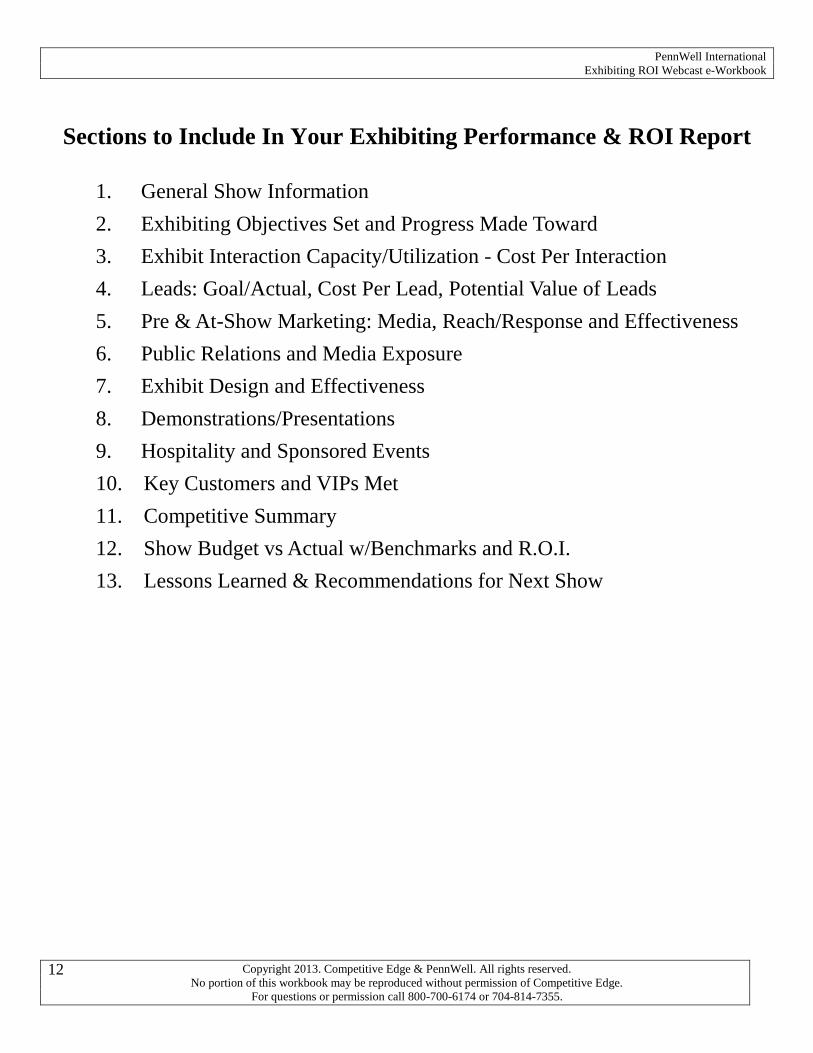
Sections to Include In Your Exhibiting Performance & ROI Report
1. General Show Information
2. Exhibiting Objectives Set and Progress Made Toward
3. Exhibit Interaction Capacity/Utilization - Cost Per Interaction
4. Leads: Goal/Actual, Cost Per Lead, Potential Value of Leads
5. Pre & At-Show Marketing: Media, Reach/Response and Effectiveness
6. Public Relations and Media Exposure
7. Exhibit Design and Effectiveness
8. Demonstrations/Presentations
9. Hospitality and Sponsored Events
10. Key Customers and VIPs Met
11. Competitive Summary
12. Show Budget vs Actual w/Benchmarks and R.O.I.
13. Lessons Learned & Recommendations for Next Show


