NSSENational Survey of
Student Engagement
Experiences That Matter: Enhancing Student Learning and SuccessAnnual Report 2007
National Survey of Student Engagement | Annual Report 2007 �� National Survey of Student Engagement | Annual Report 2007 National Survey of Student Engagement | Annual Report 2007 �� National Survey of Student Engagement | Annual Report 2007
Douglas Bennett, Chair President, Earlham College
Molly Broad President Emerita and Professor, School of Government, The University of North Carolina at Chapel Hill
Rebecca Chopp President, Colgate University
Peter Ewell Vice President, National Center for Higher Education Management Systems
Muriel Howard President, Buffalo State College
Pat Hutchings Vice President, The Carnegie Foundation for the Advancement of Teaching
Stanley Ikenberry Regent Professor and President Emeritus, University of Illinois Urbana-Champaign
John Immerwahr Associate Vice President for Academic Affairs, Villanova University
Charlie Nelms Chancellor, North Carolina Central University
Patrick Terenzini Distinguished Professor and Senior Scientist, Center for the Study of Higher Education, The Pennsylvania State University
Judith Torney-Purta Professor of Human Development, University of Maryland
William Tyson President, Morrison and Tyson Communications
Ex-officio:
John Kennedy Director, Center for Survey Research, Indiana University Bloomington
Kay McClenney Director, Community College Survey of Student Engagement
National Advisory Board
“NSSEisaninstitution’smosttrustworthylens forseeingdeeplyintothequalityofstudents’ experiences.Itsresultstranslatedirectlyinto plansforactionandstrategiesofreform andtransformation.”
— Lee S. Shulman, President, The Carnegie Foundation for the Advancement of Teaching
National Survey of Student Engagement | Annual Report 2007 �� National Survey of Student Engagement | Annual Report 2007 National Survey of Student Engagement | Annual Report 2007 �� National Survey of Student Engagement | Annual Report 2007
The National Survey of Student Engagement (NSSE) documents dimensions of quality in undergraduate education and provides information and assistance to colleges, universities, and other organizations to improve student learning. Its primary activity is annually surveying college students to assess the extent to which they engage in educational practices associated with high levels of learning and development.
Foreword
Director’s Message
Quick Facts
Selected Results
Enriching High-Impact Experiences
FSSE and BCSSE
Factors That Support Student Success
Another Look at Gender
Using NSSE Data
NSSE Institute for Effective Educational Practice
Looking Ahead
Supporting Materials
Benchmarks of Effective Educational Practice
Participating Colleges and Universities
Staff
Table of Contents
3
7
11
13
14
22
23
27
29
35
37
38
39
51
58
Foreword
Since 1998, we have also learned a great deal more about how students learn in college. NSSE, as originally conceived, rests on systematic studies of student learning and development linked empirically to student experiences and behaviors compiled over forty years. In designing a new vision of quality, we wanted to be sure that the practices we called attention to as “engagement” really mattered for student learning. That philosophy has guided NSSE ever since. But as we learn more from cognitive science, the resulting insights confirm the efficacy of the kinds of things NSSE measures. More importantly, they help illuminate why these practices and experiences are so powerful and exactly how they work. At the same time, they underscore the varied paths that individual students pursue when making meaning of the same subject matter. Finally, they call attention to the need to better understand what our colleagues in the U.K. call “deep learning” or “learning for understanding”—the ability to recall and synthesize knowledge from a wide range of disparate sources and apply it to a complex problem.
Looking back on this period also reminds us of how much NSSE has grown. The core survey has been joined by other tools that considerably enhance an institution’s ability to use results for improvement. Used in combination, NSSE and the Faculty Survey of Student Engagement (FSSE) provide a powerful way to engage faculty in serious thinking about curriculum and pedagogy. Similarly, the new Beginning College Survey of Student Engagement (BCSSE) allows colleges and universities to undertake sophisticated longitudinal studies that can reveal detailed patterns of development for different kinds of students. Just as important, NSSE data have grounded a significant and growing literature on college student growth and development that both advances the field’s “basic science” and can readily support improvement. The NSSE Institute, meanwhile, conducts the kind of in-depth inquiries required to understand the all-important qualitative and cultural dimensions of fostering student success. Indeed, NSSE as an enterprise consistently exhibits the quality of “positive restlessness”—the relentless organizational habit of constantly trying to do more things better—that Student Success in College highlighted as an attribute of high-performing colleges (Kuh, Kinzie, Schuh, Whitt & Associates, 2005).
� National Survey of Student Engagement | Annual Report 2007
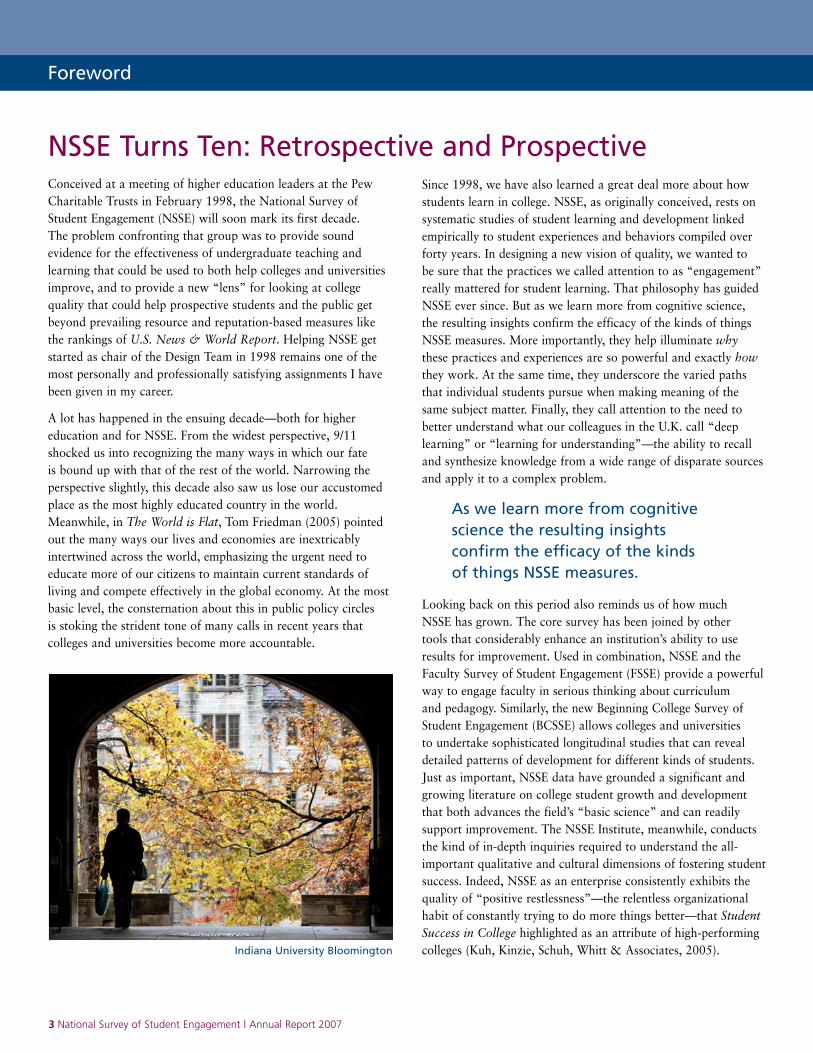
NSSE Turns Ten: Retrospective and ProspectiveConceived at a meeting of higher education leaders at the Pew Charitable Trusts in February 1998, the National Survey of Student Engagement (NSSE) will soon mark its first decade. The problem confronting that group was to provide sound evidence for the effectiveness of undergraduate teaching and learning that could be used to both help colleges and universities improve, and to provide a new “lens” for looking at college quality that could help prospective students and the public get beyond prevailing resource and reputation-based measures like the rankings of U.S. News & World Report. Helping NSSE get started as chair of the Design Team in 1998 remains one of the most personally and professionally satisfying assignments I have been given in my career.
A lot has happened in the ensuing decade—both for higher education and for NSSE. From the widest perspective, 9/11 shocked us into recognizing the many ways in which our fate is bound up with that of the rest of the world. Narrowing the perspective slightly, this decade also saw us lose our accustomed place as the most highly educated country in the world. Meanwhile, in The World is Flat, Tom Friedman (2005) pointed out the many ways our lives and economies are inextricably intertwined across the world, emphasizing the urgent need to educate more of our citizens to maintain current standards of living and compete effectively in the global economy. At the most basic level, the consternation about this in public policy circles is stoking the strident tone of many calls in recent years that colleges and universities become more accountable.
As we learn more from cognitive science the resulting insights confirm the efficacy of the kinds of things NSSE measures.
Indiana University Bloomington
Third-Party Sampling and Administration. Another important element of NSSE’s public credibility is the fact that colleges and universities do not administer the survey themselves. This was another pillar of the Design Team’s work because one of NSSE’s original objectives was to produce public benchmarks of institutional quality based on an acceptable response rates, consistent administration, and proof against manipulation by institutions. Indeed, one of the most important strengths of Indiana University’s original bid to Pew to administer the NSSE pilot was the involvement of its Center for Survey Research. The Center has continued to deliver excellent service, and each year has pushed the state of the art in Web-based surveys. But the job is getting harder. Survey response rates are falling in all fields, especially among young people. Overcoming this challenge will be one of NSSE’s biggest jobs in the years to come.
“Institutional Research in a Box.” Providing institutional users a “turnkey” service that would give them an important institutional research capability at low cost and with little institutional overhead was another original requirement set by our Design Team. Although third-party survey administration was chosen primarily to boost NSSE’s validity and credibility, it had the additional salutary effect of making it easy for any college or university to run a sound student survey. NSSE institutional reports are the best of their class with respect to coverage and ease of use. And they are supplemented by a range of additional tools and templates for presenting findings and incorporating them into processes like accreditation. Finally, NSSE staff generate tailored analyses or create customized peer groups on demand. Extensive as they currently are, all these services could be enhanced. One area in which institutions need more help, for instance, is how to conduct long-term longitudinal studies linking NSSE, BCSSE and FSSE results, student record information, and available data on student learning outcomes.
•
•
National Survey of Student Engagement | Annual Report 2007 �
Anniversaries are a time to take stock. In the light of a decade of change and with considerable increases in capability, what are NSSE’s most important assets and how should they change to meet the future? In answer to the first question, I believe that four key features of NSSE are fundamental to its success and must be continuously renewed in the decade ahead. All of them, I’m happy to report, were prominent in the deliberations of the NSSE Design Team from the beginning.
Research Base. Above all, NSSE is credible because it rests on an extensive body of research. The original rule of thumb used by the Design Team in 1998 was that the experience represented by each item on the survey be empirically linked to gains in student learning. And since the survey’s inception, NSSE staff has taken every available opportunity to validate it by linking NSSE results with direct measures of student learning and development. Maintaining and updating this research base is critical. As new modes of instruction emerge, we need to know what “engagement” looks like for each of them. And we need to continue to search for conditional effects that tell us what works for different kinds of students under different circumstances.
•
Four key features of NSSE are fundamental to its success and must be continuously renewed in the decade ahead.
St. Cloud State University
A Vital User Community. Finally, the Design Team recognized from the beginning that whatever impact NSSE ultimately could have would be a function of how and toward what ends institutions used the survey findings. Beginning with the two pilots conducted in 1999, institutional users have been an important part of NSSE’s intellectual capital. They have unceasingly made suggestions for improvement, attended lively user group gatherings at higher education meetings across the country, and exhibited an uncommon willingness to take part in experiments. Indeed, some of the most important components of the enterprise today—FSSE, for example—arose directly from trying out new ideas at participating campuses. As institutions continue to experiment with ways to use and improve NSSE in the coming years, harnessing this growing body of collective wisdom will become more important than ever. This may entail greater use of Web forums and virtual interchange as well as campus visits and face-to-face meetings.
These assets will be of considerable value as NSSE enters its second decade of championing change in higher education. Probably the biggest immediate challenge is how to walk the current accountability tightrope responsively and responsibly. This topic was the centerpiece of Doug Bennett’s Foreword to last year’s Annual Report, and the situation is even more complicated today. Since then, NSSE has had the dubious distinction of being named as an accountability measure in the report of the Secretary of Education’s Commission on
• the Future of Higher Education and is emerging a prominent candidate measure in the Voluntary System of Accountability (VSA) being promoted jointly by the National Association of State Universities and Land-Grant Colleges (NASULGC) and the American Association of State Colleges and Universities (AASCU) When Russ Edgerton of the Pew Charitable Trusts funded the development of NSSE a decade ago, his hopes were that the instrument would become a new arbiter of quality for higher education in America. Clearly this is happening and we should be grateful for this growing prominence.
But with prominence comes responsibility. On the one hand, I firmly believe that all institutions participating in NSSE should make their NSSE benchmark data public—a position that I have held since the establishment of NSSE. A major reason why we are in our accountability pickle today is the perception that colleges and universities are not forthcoming about performance. We need to be proactive in reversing this perception and, if problems are revealed, we need to be aggressive in letting people know that we are aware of them and are taking steps to change the situation. On the other hand, we need to be aware of the limits of our data and not use them in inappropriate ways. Mindless scorecards and conclusions based on miniscule differences in performance will not help anybody.
A second challenge we face as NSSE enters a new decade is to more fully harness its potential to dig deeper into the college experience. In their Foreword to the first Annual Report in
“NSSEisbecomingincreasinglyhelpfulin improvingstudentsuccessandbuildingpublic confidenceinthecommitmentofcollegesand universitiestoimproveteachingandlearning.”
— Paul E. Lingenfelter, President, State Higher Education Executive Officers
Foreword (continued)
The biggest immediate challenge is how to walk the current accountability tightrope responsively and responsibly.
� National Survey of Student Engagement | Annual Report 2007
California State University, Chico
2000, Russ Edgerton and Lee Shulman rightly cautioned us about making too much of NSSE results in that first year because we needed to understand more about the underlying stability of NSSE scores and what the instrument was actually measuring. While this will always be good advice, eight years of active administration and a simultaneous program of associated validation research has pretty well wrung out the bugs. Accordingly, we can move with greater confidence in using NSSE to guide institutional improvement and in basic research.
One promising direction here, already begun, is to continue to pursue conditional effects and important differences in experience among college student populations. Inside the central tendency measures presented in most reports is remarkable variation across students with respect to their experiences. Addressing the important question of why so many similar students can have such vastly different “educations” at the same institution is critical if we want to improve intentionally and systematically. Understanding and investigating variances as well as central tendencies may also help identify truly high-performing institutions—those that score well on a given item or benchmark but also exhibit a tight enough distribution of scores that we can be sure that most students are affected. These and many other analytical directions await the NSSE community as it begins the next ten years.
I would like to close by paying tribute to George Kuh, who will step down as NSSE’s leader in January 2008. From the earliest days of the enterprise, NSSE and George have been synonymous. His uncanny ability to anticipate new developments in higher education and to recruit the absolute best talent to staff NSSE and its many offspring are capacities we have learned to count on. As the “public face” of NSSE, he has been ubiquitous, enthusiastic, and wise. Thank you, George.
Peter T. Ewell Vice President National Center for Higher Education Management Systems (NCHEMS)
“Everyonewantsatoolthatreallyworks. NSSEresultsprovidefacultyandstaffwith informationtheycanreadilyusetostrengthen thelearningenvironment.”
— David E. Shulenburger, Vice President for Academic Affairs, National Association of State Universities and Land-Grant Colleges
I firmly believe that all institutions participating in NSSE should make their NSSE benchmark data public...
National Survey of Student Engagement | Annual Report 2007 �
Eastern Connecticut State University
� National Survey of Student Engagement | Annual Report 2007
More than anything else, being an educated person means being able to see connections that allow one to make sense of the world and act within it in creative ways. Every one of the qualities I have described here—listening, reading, talking, writing, puzzle solving, and truth seeking, seeing through other people’s eyes, leading, working in a community — is finally about connecting (Cronon, 1998).
Over the last decade I’ve visited scores of campuses to meet with faculty, administrators, student affairs staff, trustees, and – on fewer occasions than I would like – students. Across all of these groups, the most asked question is, “What is the one thing we should do to increase student engagement and success on our campus?”
In the first few years of NSSE I avoided answering this question for two reasons. First, we hadn’t yet learned enough from NSSE to be confident about whether certain educational programs and activities were more important to student success than others. Just about every behavior and institutional condition represented on the NSSE survey is positively linked to desired outcomes of college, so calling attention to one set of activities seemed counterproductive. A second reason for hedging on an answer was that decades of research showed that student development is a cumulative process shaped by many events and experiences, inside and outside the classroom. Recent research on the relationships between student characteristics, engagement, and outcomes adds an additional layer of complexity to our understanding; some students appear to benefit more than others from the same educational programs or practices, all things considered. Peter Ewell mentioned these conditional effects in the Foreword and we devoted a fair amount of attention to some related findings in last year’s NSSE Annual Report.
If We Could Do One Thing... At the same time, there is growing evidence that – when done well – a handful of selected programs and activities appear to engage participants at levels that boost their performance across a variety of educational activities and desired outcomes such as persistence. The Association of American Colleges and Universities listed ten of the more promising “high impact” practices in its 2007 report, College Learning for a New Global Century. They include first-year seminars, common intellectual experiences, learning communities, service learning, undergraduate research, study abroad and other experiences with diversity, internships, and capstone courses and projects.
Why Some Education Practices Are Unusually Effective
Effective educational practices are marked by six conditions.
First, they typically demand that students devote considerable amounts of time and effort to purposeful tasks; most require daily decisions that deepen students’ investment in the activity as well as their commitment to their academic program and the college. For example, consider a writing-intensive first-year seminar with 25 or fewer students that is team-taught by a faculty member (who also is the advisor for the students in the seminar) and an upper-division peer mentor or instructor. The composition of the instructional team coupled with the size of the course ensures that every student will get to know at least one faculty member well in the first year of college in addition to the other students in the class. Advising is no longer a once-a-semester meeting with a person a student hardly knows, but an on-going set of conversations about issues the student is facing in real time. Because it is writing-intensive, students must also put forth more effort, but they also benefit more, especially when they get frequent feedback from both the faculty member and the peer mentor.
Second, the nature of these high impact activities puts students in circumstances that essentially demand they interact with faculty and peers about substantive matters, typically over extended periods of time. A human-scale first-year seminar makes anonymity impossible, fosters face-to-face interaction, and fuels feedback. Student-faculty research and collaborative problem-based assignments in the context of a course set the
Director’s Message
What is the one thing we should do to increase student engagement and success on our campus?
University of Michigan
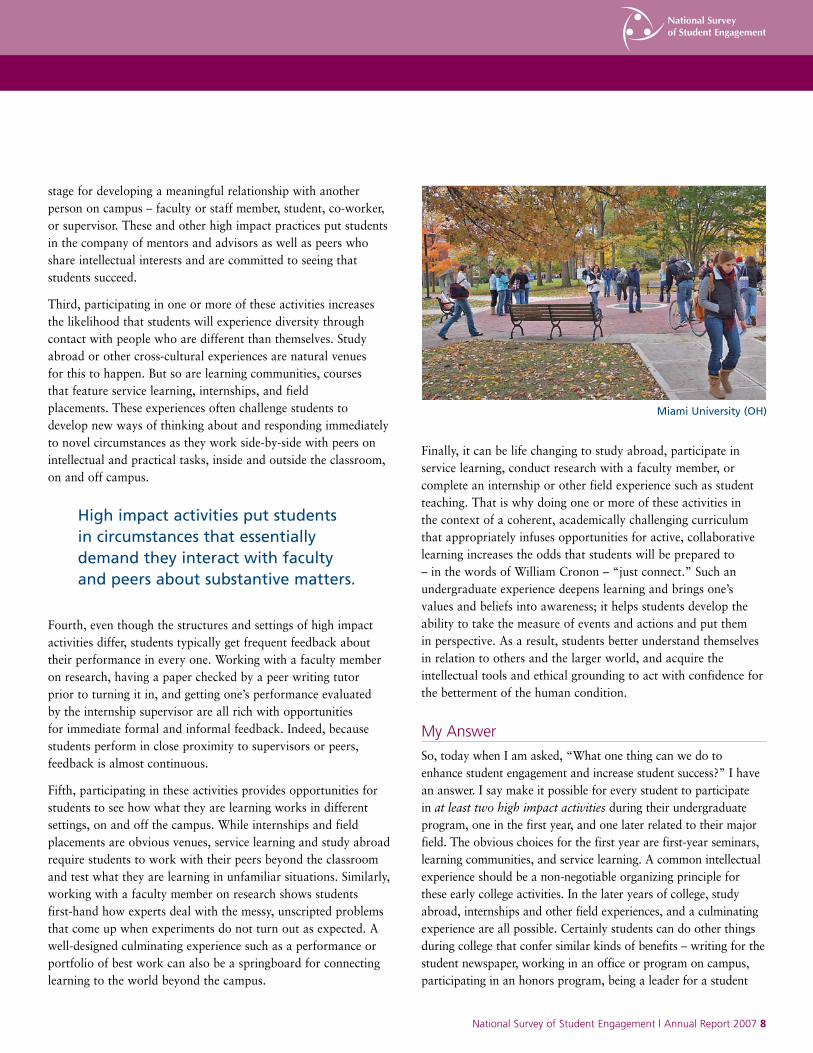
stage for developing a meaningful relationship with another person on campus – faculty or staff member, student, co-worker, or supervisor. These and other high impact practices put students in the company of mentors and advisors as well as peers who share intellectual interests and are committed to seeing that students succeed.
Third, participating in one or more of these activities increases the likelihood that students will experience diversity through contact with people who are different than themselves. Study abroad or other cross-cultural experiences are natural venues for this to happen. But so are learning communities, courses that feature service learning, internships, and field placements. These experiences often challenge students to develop new ways of thinking about and responding immediately to novel circumstances as they work side-by-side with peers on intellectual and practical tasks, inside and outside the classroom, on and off campus.
Fourth, even though the structures and settings of high impact activities differ, students typically get frequent feedback about their performance in every one. Working with a faculty member on research, having a paper checked by a peer writing tutor prior to turning it in, and getting one’s performance evaluated by the internship supervisor are all rich with opportunities for immediate formal and informal feedback. Indeed, because students perform in close proximity to supervisors or peers, feedback is almost continuous.
Fifth, participating in these activities provides opportunities for students to see how what they are learning works in different settings, on and off the campus. While internships and field placements are obvious venues, service learning and study abroad require students to work with their peers beyond the classroom and test what they are learning in unfamiliar situations. Similarly, working with a faculty member on research shows students first-hand how experts deal with the messy, unscripted problems that come up when experiments do not turn out as expected. A well-designed culminating experience such as a performance or portfolio of best work can also be a springboard for connecting learning to the world beyond the campus.
Finally, it can be life changing to study abroad, participate in service learning, conduct research with a faculty member, or complete an internship or other field experience such as student teaching. That is why doing one or more of these activities in the context of a coherent, academically challenging curriculum that appropriately infuses opportunities for active, collaborative learning increases the odds that students will be prepared to – in the words of William Cronon – “just connect.” Such an undergraduate experience deepens learning and brings one’s values and beliefs into awareness; it helps students develop the ability to take the measure of events and actions and put them in perspective. As a result, students better understand themselves in relation to others and the larger world, and acquire the intellectual tools and ethical grounding to act with confidence for the betterment of the human condition.
My Answer
So, today when I am asked, “What one thing can we do to enhance student engagement and increase student success?” I have an answer. I say make it possible for every student to participate in at least two high impact activities during their undergraduate program, one in the first year, and one later related to their major field. The obvious choices for the first year are first-year seminars, learning communities, and service learning. A common intellectual experience should be a non-negotiable organizing principle for these early college activities. In the later years of college, study abroad, internships and other field experiences, and a culminating experience are all possible. Certainly students can do other things during college that confer similar kinds of benefits – writing for the student newspaper, working in an office or program on campus, participating in an honors program, being a leader for a student
National Survey of Student Engagement | Annual Report 2007 �
High impact activities put students in circumstances that essentially demand they interact with faculty and peers about substantive matters.
Miami University (OH)
National Survey of Student Engagement | Annual Report 2007 �0� National Survey of Student Engagement | Annual Report 2007 National Survey of Student Engagement | Annual Report 2007 �0� National Survey of Student Engagement | Annual Report 2007
organization or campus committee, and playing intercollegiate athletics to name a few. But these opportunities – with the exception of working on campus – often are limited to small numbers of students, especially on large campuses.
If faculty and staff made these and other effective educational practices more frequently available throughout the institution, perhaps colleges and universities could do a better job in helping students compensate for shortcomings in academic preparation and create a culture that fosters student success. But left to their own devices, many students and faculty members may not do these things. Educationally effective institutions recognize this and create incentives to induce purposeful behavior toward these ends. Depending on the circumstances, some institutions, for example, assign all students to a learning community, require two or more writing-intensive courses in all majors, and expect students to do some form of culminating senior experience, such as a field placement, internship, or capstone project or paper. We provided examples of what these look like in different institutional settings in Student Success in College: Creating Conditions That Matter.
While high impact practices are appealing for the reasons just outlined, to engage students at high levels, these practices must be done well as I emphasized earlier. In addition, institutions must scale them up so that enough opportunities are available across all of them so that every student has a real chance to participate.
Although these and other high impact practices are promising, more information is needed about their structural features, and whether certain types of students are more likely to take advantage of them and how they benefit from the experience. To gain greater clarity on the relationship between these practices and educational gains, in 2007 we added experimental questions to the NSSE online survey to learn more about learning communities, student-faculty research, students who do independent research, study abroad, and various forms of culminating senior experiences. The results show, for example, that:
• Students who do a capstone seminar that required a final product or performance gain more in desired areas compared with their peers who did not.
• Time on task continues to matter, in that students who devote more time to an inquiry activity benefit more; students who meet with their advisors at least twice a year are more satisfied with their college experience.
• Faculty guidance and feedback enrich learning, at least in terms of student self-reported gains.
Later in this Annual Report we expand on these and other instructive findings about the nature and impact of educationally effective activities.
There is, of course, much more to learn about how engagement in various activities by different populations of students in different educational settings affects student learning and success. As with between- and within-institution differences on measures such as NSSE, the variance between groups of students, such as men and women or African Americans and Latinos, is almost certainly going to be less than within the groups. That is, while it may appear that on average students in one group seem to benefit more from certain practices or experiences, it is also the case that among students in the group that appears to have the advantage, some students benefit less than the average student in lower-performing groups. Researchers ignore this fact with their penchant for focusing on what are often small, albeit statistically significant differences between groups.
It behooves us all to focus more on within-group differences in order to determine if we can identify the circumstances that help explain why such differences exist and attempt to tease out the elements of programs and practices that are particularly
Director’s Message (continued)
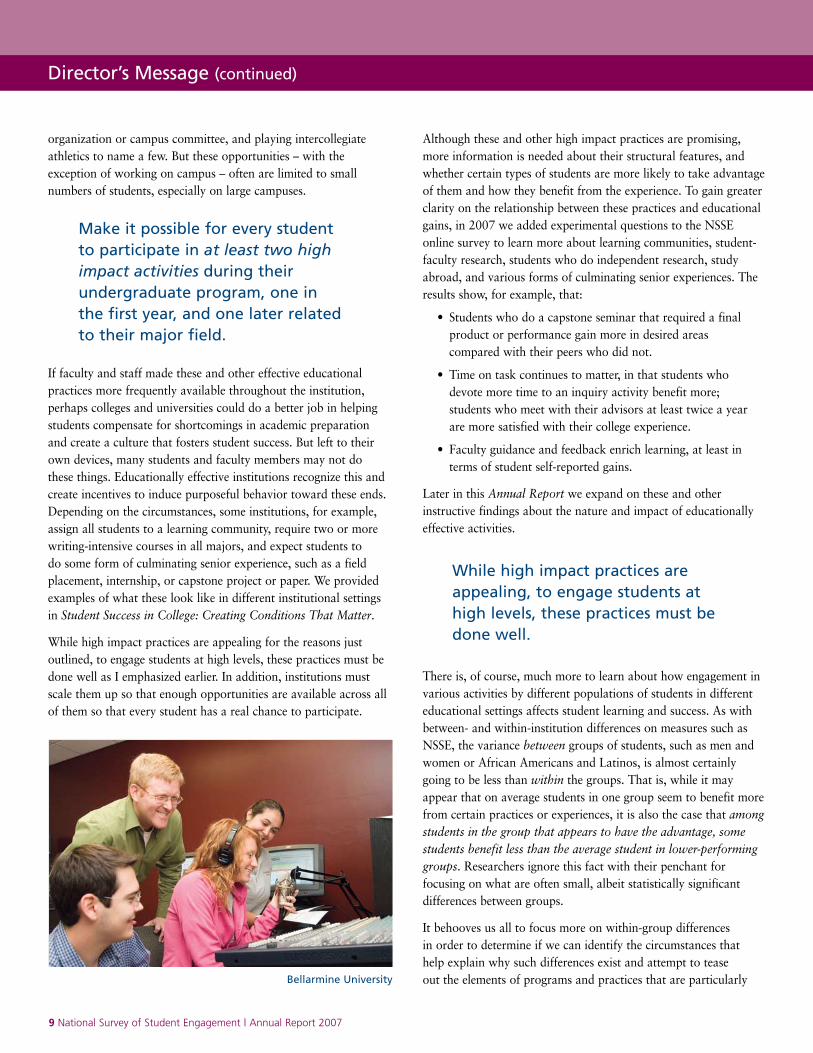
While high impact practices are appealing, to engage students at high levels, these practices must be done well.
Make it possible for every student to participate in at least two high impact activities during their undergraduate program, one in the first year, and one later related to their major field.
Bellarmine University
National Survey of Student Engagement | Annual Report 2007 �0� National Survey of Student Engagement | Annual Report 2007 National Survey of Student Engagement | Annual Report 2007 �0� National Survey of Student Engagement | Annual Report 2007
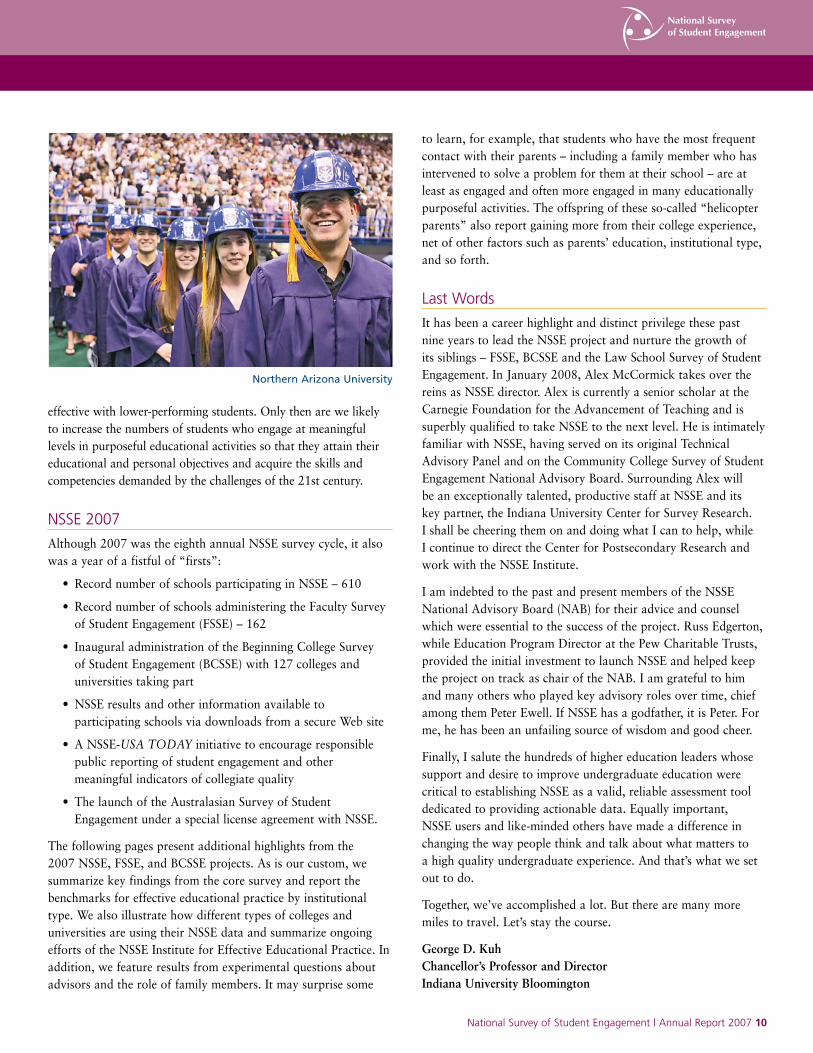
to learn, for example, that students who have the most frequent contact with their parents – including a family member who has intervened to solve a problem for them at their school – are at least as engaged and often more engaged in many educationally purposeful activities. The offspring of these so-called “helicopter parents” also report gaining more from their college experience, net of other factors such as parents’ education, institutional type, and so forth.
Last Words
It has been a career highlight and distinct privilege these past nine years to lead the NSSE project and nurture the growth of its siblings – FSSE, BCSSE and the Law School Survey of Student Engagement. In January 2008, Alex McCormick takes over the reins as NSSE director. Alex is currently a senior scholar at the Carnegie Foundation for the Advancement of Teaching and is superbly qualified to take NSSE to the next level. He is intimately familiar with NSSE, having served on its original Technical Advisory Panel and on the Community College Survey of Student Engagement National Advisory Board. Surrounding Alex will be an exceptionally talented, productive staff at NSSE and its key partner, the Indiana University Center for Survey Research. I shall be cheering them on and doing what I can to help, while I continue to direct the Center for Postsecondary Research and work with the NSSE Institute.
I am indebted to the past and present members of the NSSE National Advisory Board (NAB) for their advice and counsel which were essential to the success of the project. Russ Edgerton, while Education Program Director at the Pew Charitable Trusts, provided the initial investment to launch NSSE and helped keep the project on track as chair of the NAB. I am grateful to him and many others who played key advisory roles over time, chief among them Peter Ewell. If NSSE has a godfather, it is Peter. For me, he has been an unfailing source of wisdom and good cheer.
Finally, I salute the hundreds of higher education leaders whose support and desire to improve undergraduate education were critical to establishing NSSE as a valid, reliable assessment tool dedicated to providing actionable data. Equally important, NSSE users and like-minded others have made a difference in changing the way people think and talk about what matters to a high quality undergraduate experience. And that’s what we set out to do.
Together, we’ve accomplished a lot. But there are many more miles to travel. Let’s stay the course.
George D. Kuh Chancellor’s Professor and Director Indiana University Bloomington
effective with lower-performing students. Only then are we likely to increase the numbers of students who engage at meaningful levels in purposeful educational activities so that they attain their educational and personal objectives and acquire the skills and competencies demanded by the challenges of the 21st century.
NSSE 2007
Although 2007 was the eighth annual NSSE survey cycle, it also was a year of a fistful of “firsts”:
• Record number of schools participating in NSSE – 610
• Record number of schools administering the Faculty Survey of Student Engagement (FSSE) – 162
• Inaugural administration of the Beginning College Survey of Student Engagement (BCSSE) with 127 colleges and universities taking part
• NSSE results and other information available to participating schools via downloads from a secure Web site
• A NSSE-USA TODAY initiative to encourage responsible public reporting of student engagement and other meaningful indicators of collegiate quality
• The launch of the Australasian Survey of Student Engagement under a special license agreement with NSSE.
The following pages present additional highlights from the 2007 NSSE, FSSE, and BCSSE projects. As is our custom, we summarize key findings from the core survey and report the benchmarks for effective educational practice by institutional type. We also illustrate how different types of colleges and universities are using their NSSE data and summarize ongoing efforts of the NSSE Institute for Effective Educational Practice. In addition, we feature results from experimental questions about advisors and the role of family members. It may surprise some
Northern Arizona University
�� National Survey of Student Engagement | Annual Report 2007
Survey
The annual NSSE survey is supported by institutional participation fees. The survey is available in paper and Web versions and takes about 15 minutes to complete.
Objectives
Provide data to colleges and universities to use to improve undergraduate education, inform state accountability and accreditation efforts, and facilitate national and sector benchmarking efforts, among others.
Partners
Established in 2000 with a grant from The Pew Charitable Trusts. Support for research and development projects from Lumina Foundation for Education, the Center of Inquiry in the Liberal Arts at Wabash College, Teagle Foundation, and the National Postsecondary Education Cooperative.
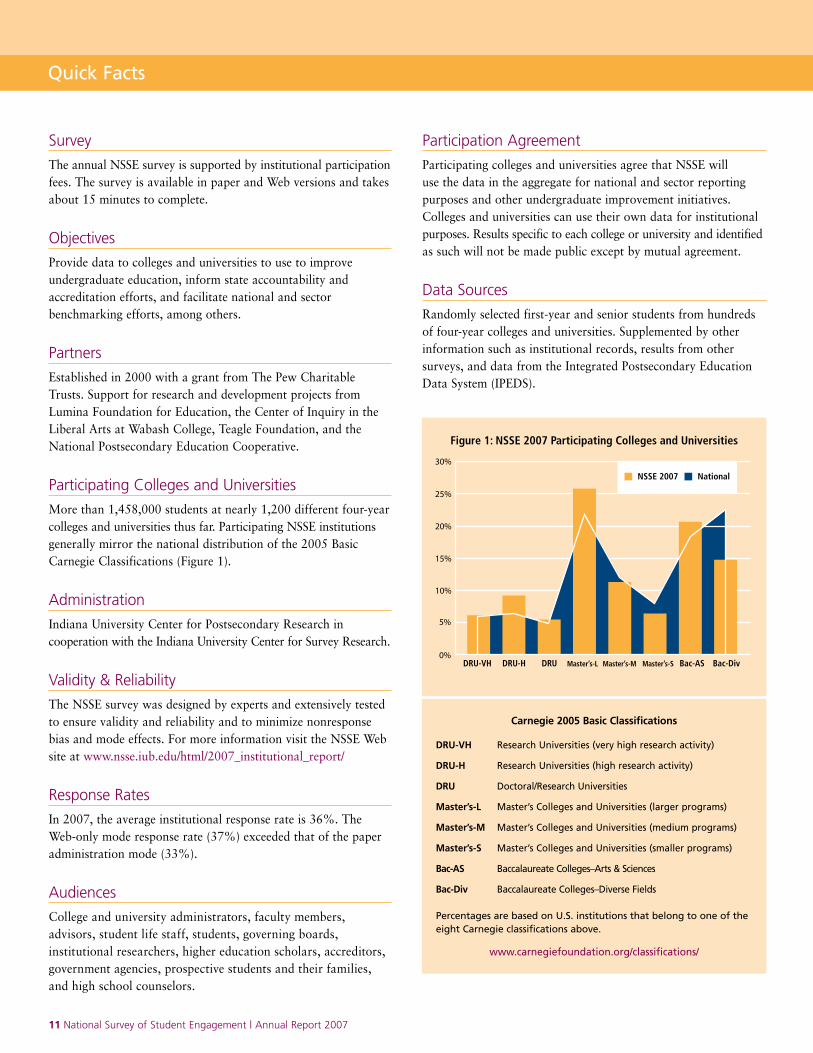
Participating Colleges and Universities
More than 1,458,000 students at nearly 1,200 different four-year colleges and universities thus far. Participating NSSE institutions generally mirror the national distribution of the 2005 Basic Carnegie Classifications (Figure 1).
Administration
Indiana University Center for Postsecondary Research in cooperation with the Indiana University Center for Survey Research.
Validity & Reliability
The NSSE survey was designed by experts and extensively tested to ensure validity and reliability and to minimize nonresponse bias and mode effects. For more information visit the NSSE Web site at www.nsse.iub.edu/html/2007_institutional_report/
Response Rates
In 2007, the average institutional response rate is 36%. The Web-only mode response rate (37%) exceeded that of the paper administration mode (33%).
Audiences
College and university administrators, faculty members, advisors, student life staff, students, governing boards, institutional researchers, higher education scholars, accreditors, government agencies, prospective students and their families, and high school counselors.
Participation Agreement
Participating colleges and universities agree that NSSE will use the data in the aggregate for national and sector reporting purposes and other undergraduate improvement initiatives. Colleges and universities can use their own data for institutional purposes. Results specific to each college or university and identified as such will not be made public except by mutual agreement.
Data Sources
Randomly selected first-year and senior students from hundreds of four-year colleges and universities. Supplemented by other information such as institutional records, results from other surveys, and data from the Integrated Postsecondary Education Data System (IPEDS).
Figure 1: NSSE 2007 Participating Colleges and Universities
0%
5%
10%
15%
20%
25%
30%
NSSE 2007 National
DRU-VH DRU-H DRU Master’s-L Master’s-M Master’s-S Bac-AS Bac-Div
Carnegie �00� Basic Classifications
www.carnegiefoundation.org/classifications/
Quick Facts
Percentages are based on U.S. institutions that belong to one of the eight Carnegie classifications above.
DRU-VH Research Universities (very high research activity)
DRU-H Research Universities (high research activity)
DRU Doctoral/Research Universities
Master’s-L Master’s Colleges and Universities (larger programs)
Master’s-M Master’s Colleges and Universities (medium programs)
Master’s-S Master’s Colleges and Universities (smaller programs)
Bac-AS Baccalaureate Colleges–Arts & Sciences
Bac-Div Baccalaureate Colleges–Diverse Fields
Benchmarks of Effective Educational Practice■ Level of Academic Challenge
■ Active and Collaborative Learning
■ Student-Faculty Interaction
■ Enriching Educational Experiences
■ Supportive Campus Environment
www.nsse.iub.edu/pdf/nsse_benchmarks.pdf
Consortia & State or University Systems
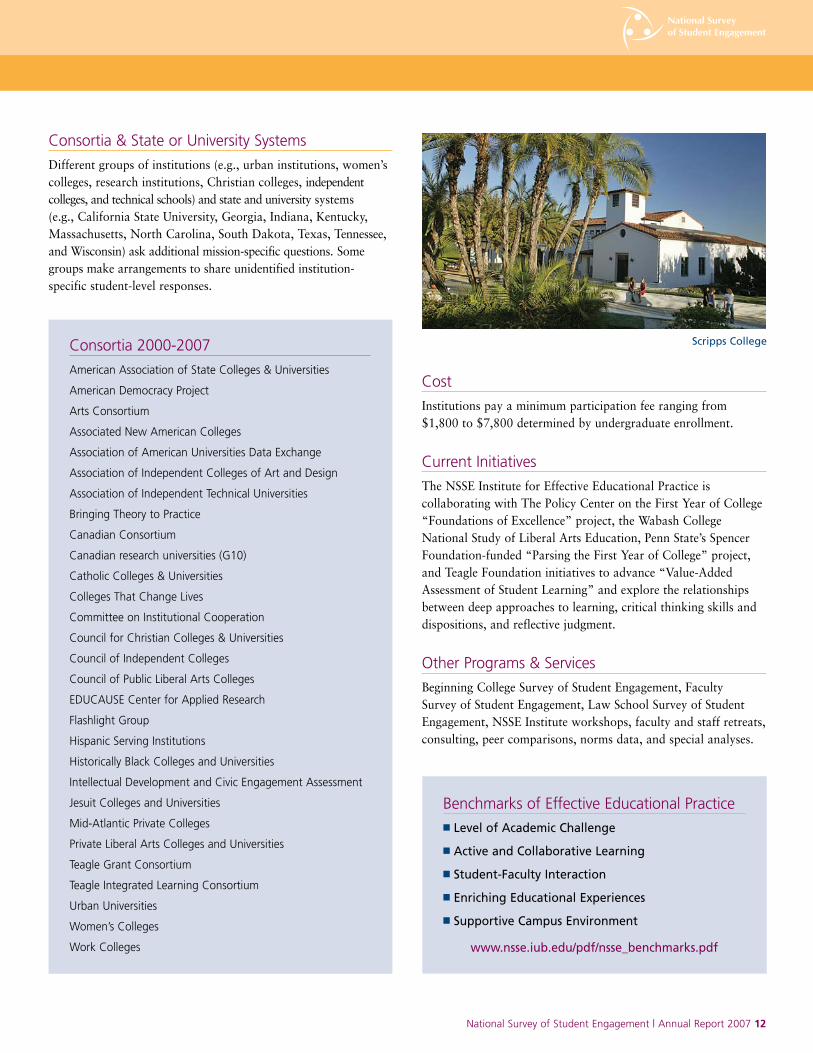
Different groups of institutions (e.g., urban institutions, women’s colleges, research institutions, Christian colleges, independent colleges, and technical schools) and state and university systems (e.g., California State University, Georgia, Indiana, Kentucky, Massachusetts, North Carolina, South Dakota, Texas, Tennessee, and Wisconsin) ask additional mission-specific questions. Some groups make arrangements to share unidentified institution- specific student-level responses.
National Survey of Student Engagement | Annual Report 2007 ��
Consortia 2000-2007
American Association of State Colleges & Universities
American Democracy Project
Arts Consortium
Associated New American Colleges
Association of American Universities Data Exchange
Association of Independent Colleges of Art and Design
Association of Independent Technical Universities
Bringing Theory to Practice
Canadian Consortium
Canadian research universities (G10)
Catholic Colleges & Universities
Colleges That Change Lives
Committee on Institutional Cooperation
Council for Christian Colleges & Universities
Council of Independent Colleges
Council of Public Liberal Arts Colleges
EDUCAUSE Center for Applied Research
Flashlight Group
Hispanic Serving Institutions
Historically Black Colleges and Universities
Intellectual Development and Civic Engagement Assessment
Jesuit Colleges and Universities
Mid-Atlantic Private Colleges
Private Liberal Arts Colleges and Universities
Teagle Grant Consortium
Teagle Integrated Learning Consortium
Urban Universities
Women’s Colleges
Work Colleges
Cost
Institutions pay a minimum participation fee ranging from $1,800 to $7,800 determined by undergraduate enrollment.
Current Initiatives
The NSSE Institute for Effective Educational Practice is collaborating with The Policy Center on the First Year of College “Foundations of Excellence” project, the Wabash College National Study of Liberal Arts Education, Penn State’s Spencer Foundation-funded “Parsing the First Year of College” project, and Teagle Foundation initiatives to advance “Value-Added Assessment of Student Learning” and explore the relationships between deep approaches to learning, critical thinking skills and dispositions, and reflective judgment.
Other Programs & Services
Beginning College Survey of Student Engagement, Faculty Survey of Student Engagement, Law School Survey of Student Engagement, NSSE Institute workshops, faculty and staff retreats, consulting, peer comparisons, norms data, and special analyses.
Scripps College
�� National Survey of Student Engagement | Annual Report 2007
As noted earlier, nearly 300,000 students attending 587 U.S. four-year colleges and universities completed NSSE in spring 2007. The selected results reported in this section feature three themes based on information from the core survey and several sets of experimental questions appended to the Web version of the survey this year. The first theme, Enriching High-Impact Experiences, examines four of the activities George Kuh briefly described in his Director’s Message: learning communities, research with faculty, study abroad, and culminating senior experiences. Table 3 (p.17) summarizes the strong positive effects associated with such activities in terms of self-reported gains in learning and development and engaging in deep approaches to learning, and Table 4 (p.18) presents the demographic characteristics of students who participated in these activities. In contrast to surface-level learning, deep-level processing emphasizes both acquiring information and understanding the underlying meaning of the information. Deep approaches to learning are important because students who use these approaches tend to earn higher grades, and retain, integrate and transfer information at higher rates.
The second theme, Factors That Support Student Success, looks at interactions students have with their academic advisor and with their family members and close friends. We also provide insights into engaged learning based on information from NSSE’s companion instruments, the Faculty Survey of Student Engagement (FSSE) and the Beginning College Survey of Student Engagement (BCSSE).
Finally, in Another Look at Gender, we briefly explore gender differences in high school experiences and college expectations, and summarize findings from a study comparing men and women in science, technology, engineering, and mathematics.
Promising/Disappointing Findings
Promising Findings • Students starting college expected to spend 50% more time preparing for class (18 hours) than relaxing and socializing (12 hours).
• The majority of students (75% of first-years, 67% of seniors) rated their academic advising as good or excellent.
• Students who took part in one or more “high-impact” practice such as a learning community, research with faculty, study abroad, and culminating senior experience reported greater levels of deep learning and greater gains in learning and personal development.
• Students who worked with a faculty member on a research project benefited more in terms of desired learning outcomes when the faculty member clearly explained expectations and provided feedback during and after the project.
• Almost two-thirds of seniors (63%) reported frequently trying to better understand someone else’s views by imagining how an issue looks from another person’s perspective.
• More than half (52%) of all seniors did a practicum, field experience, or clinical assignment, and an additional 23% intended to do so before they graduate.
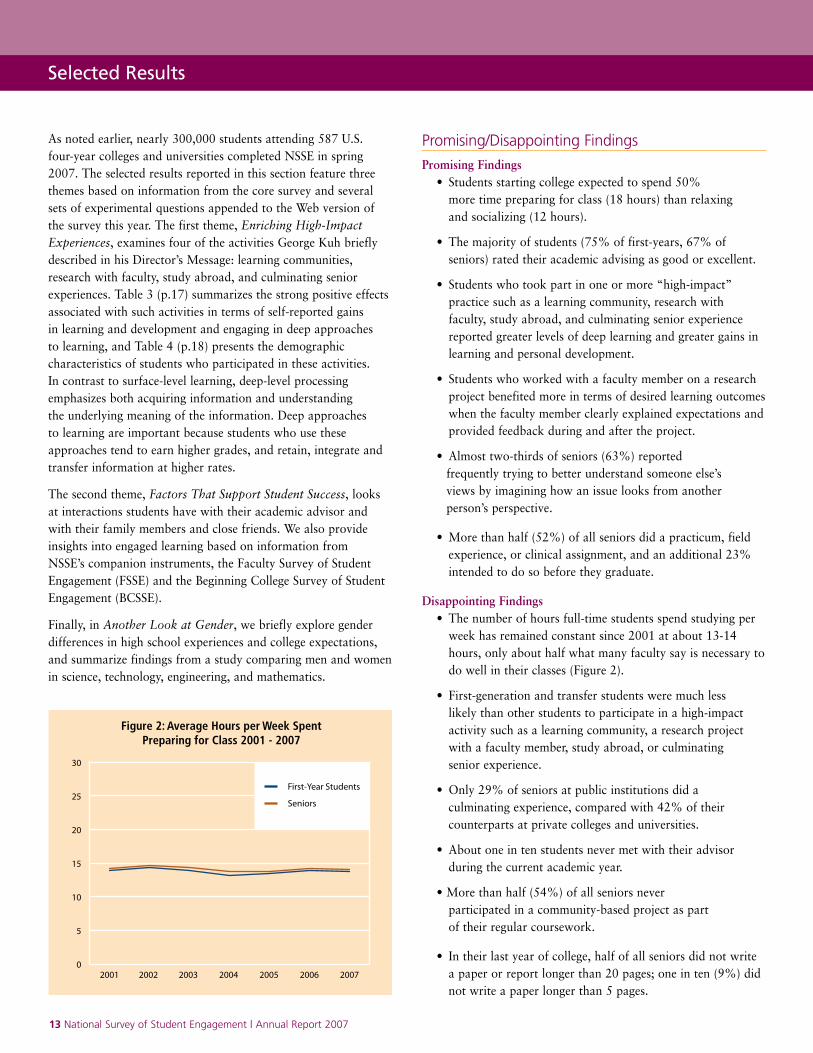
Disappointing Findings • The number of hours full-time students spend studying per week has remained constant since 2001 at about 13-14 hours, only about half what many faculty say is necessary to do well in their classes (Figure 2).
• First-generation and transfer students were much less likely than other students to participate in a high-impact activity such as a learning community, a research project with a faculty member, study abroad, or culminating senior experience.
• Only 29% of seniors at public institutions did a culminating experience, compared with 42% of their counterparts at private colleges and universities.
• About one in ten students never met with their advisor during the current academic year.
• More than half (54%) of all seniors never participated in a community-based project as part of their regular coursework.
• In their last year of college, half of all seniors did not write a paper or report longer than 20 pages; one in ten (9%) did not write a paper longer than 5 pages.
Selected Results
Figure 2: Average Hours per Week SpentPreparing for Class 2001 - 2007
30
25
20
15
10
5
02001 2002 2003 2004 2005 2006 2007
First-Year Students
Seniors
National Survey of Student Engagement | Annual Report 2007 ��
Self-Reported Gains Attributed to Selected Learning Community Features • When the LC included discussion groups and class assignments that frequently integrated material from LC classes, students reported gaining more across the three outcome domains, more frequently used deep approaches to learning, and reported an enriched social life.
• Requiring out-of-class activities as part of LC requirements for first-year students was related to substantial gains in self- understanding, deep learning, and an enriched social life.
• Assigning an undergraduate peer advisor to the LC instructional team was linked to greater gains in vocational skill development and an enriched social life.
• All things being equal, requiring first-year LC participants to live together on campus had a positive effect on the quality of social life and student-faculty interaction, but no discernable effects on engagement measures and the other selected outcomes.
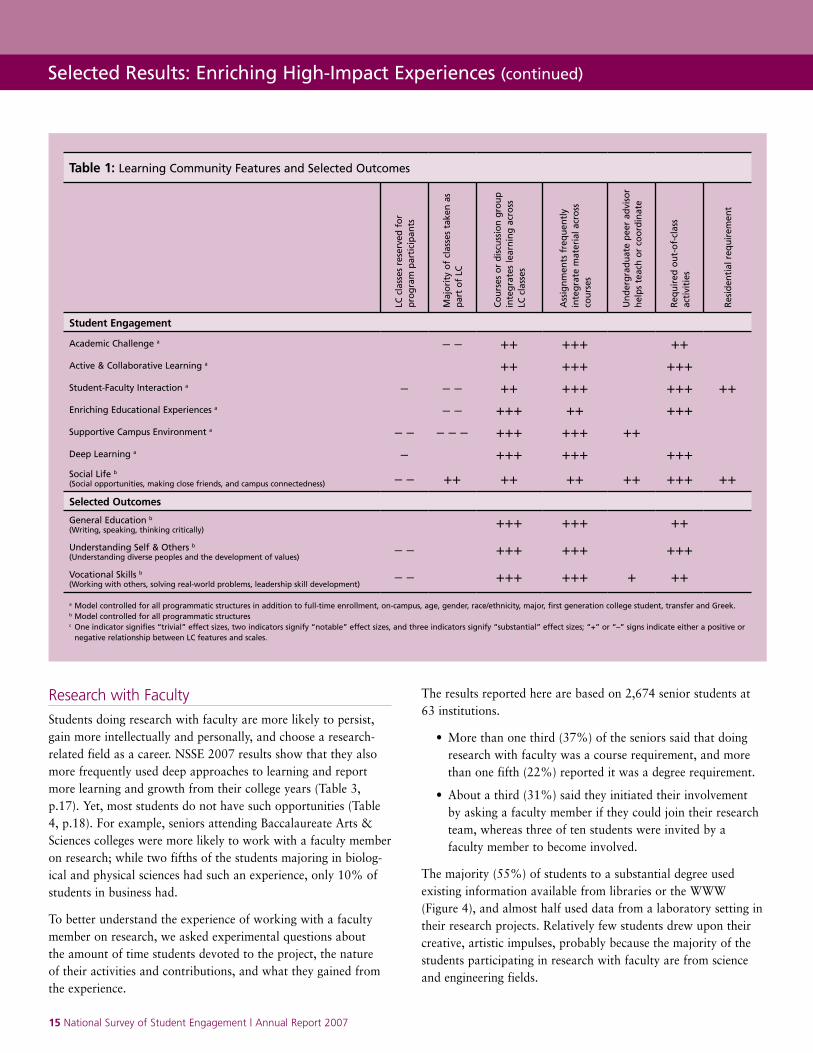
These results, summarized in Table 1, p.15, suggest that LC faculty and staff should design structures and other program features that will maximize the chances that the LC experience will have the desired effects. For example, reserving classes only for students in the LC may not always the desired effects.
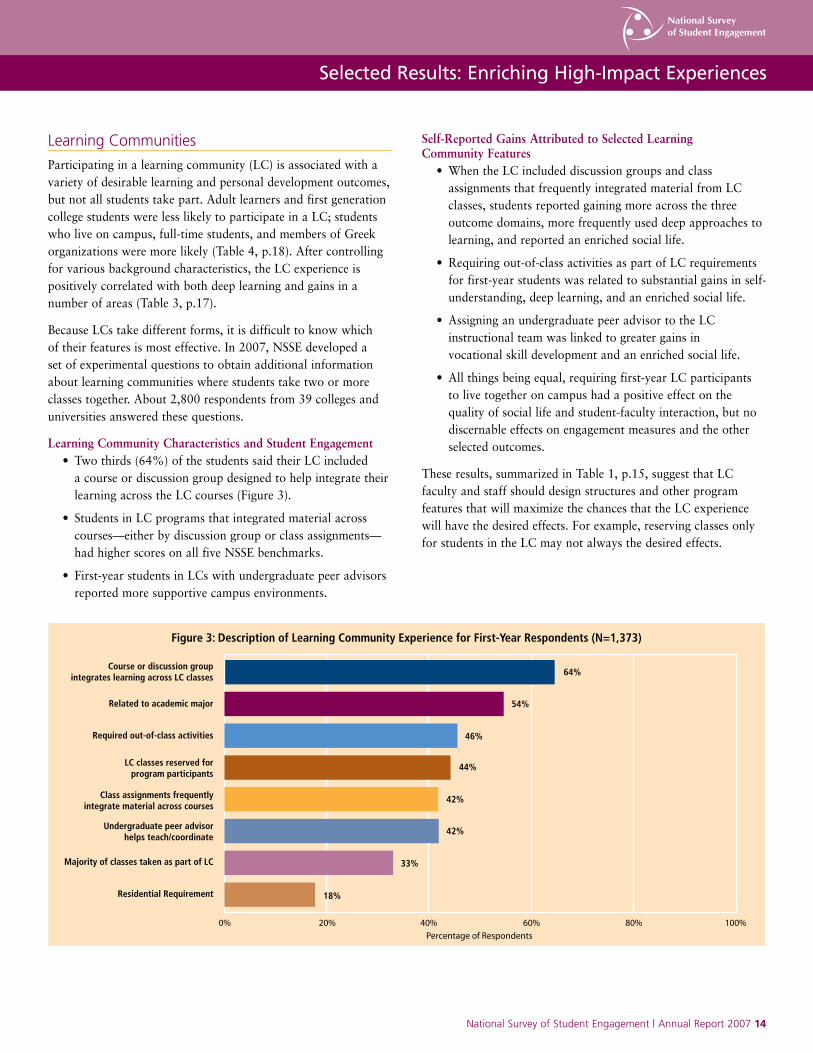
Learning Communities
Participating in a learning community (LC) is associated with a variety of desirable learning and personal development outcomes, but not all students take part. Adult learners and first generation college students were less likely to participate in a LC; students who live on campus, full-time students, and members of Greek organizations were more likely (Table 4, p.18). After controlling for various background characteristics, the LC experience is positively correlated with both deep learning and gains in a number of areas (Table 3, p.17).
Because LCs take different forms, it is difficult to know which of their features is most effective. In 2007, NSSE developed a set of experimental questions to obtain additional information about learning communities where students take two or more classes together. About 2,800 respondents from 39 colleges and universities answered these questions.
Learning Community Characteristics and Student Engagement • Two thirds (64%) of the students said their LC included a course or discussion group designed to help integrate their learning across the LC courses (Figure 3).
• Students in LC programs that integrated material across courses—either by discussion group or class assignments— had higher scores on all five NSSE benchmarks.
• First-year students in LCs with undergraduate peer advisors reported more supportive campus environments.
0% 20% 40% 60% 80% 100%
Figure 3: Description of Learning Community Experience for First-Year Respondents (N=1,373)
Course or discussion groupintegrates learning across LC classes 64%
Class assignments frequentlyintegrate material across courses
42%
Majority of classes taken as part of LC 33%
Undergraduate peer advisorhelps teach/coordinate
42%
Residential Requirement 18%
Related to academic major 54%
Required out-of-class activities 46%
LC classes reserved forprogram participants
44%
Percentage of Respondents
Selected Results: Enriching High-Impact Experiences
National Survey of Student Engagement | Annual Report 2007 ���� National Survey of Student Engagement | Annual Report 2007 National Survey of Student Engagement | Annual Report 2007 ���� National Survey of Student Engagement | Annual Report 2007
Research with Faculty
Students doing research with faculty are more likely to persist, gain more intellectually and personally, and choose a research-related field as a career. NSSE 2007 results show that they also more frequently used deep approaches to learning and report more learning and growth from their college years (Table 3, p.17). Yet, most students do not have such opportunities (Table 4, p.18). For example, seniors attending Baccalaureate Arts & Sciences colleges were more likely to work with a faculty member on research; while two fifths of the students majoring in biolog-ical and physical sciences had such an experience, only 10% of students in business had.
To better understand the experience of working with a faculty member on research, we asked experimental questions about the amount of time students devoted to the project, the nature of their activities and contributions, and what they gained from the experience.
Selected Results: Enriching High-Impact Experiences (continued)
Table �: Learning Community Features and Selected Outcomes
LC c
lass
es r
eser
ved
fo
r p
rog
ram
par
tici
pan
ts
Maj
ori
ty o
f cl
asse
s ta
ken
as
par
t o
f LC
Co
urs
es o
r d
iscu
ssio
n g
rou
p
inte
gra
tes
lear
nin
g a
cro
ss
LC c
lass
es
Ass
ign
men
ts f
req
uen
tly
inte
gra
te m
ater
ial a
cro
ss
cou
rses
Un
der
gra
du
ate
pee
r ad
viso
r h
elp
s te
ach
or
coo
rdin
ate
Req
uir
ed o
ut-
of-
clas
s ac
tivi
ties
Res
iden
tial
req
uir
emen
t
Student Engagement
Academic Challenge a – – ++ +++ ++Active & Collaborative Learning a ++ +++ +++Student-Faculty Interaction a – – – ++ +++ +++ ++Enriching Educational Experiences a – – +++ ++ +++Supportive Campus Environment a – – – – – +++ +++ ++Deep Learning a – +++ +++ +++Social Life b
(Social opportunities, making close friends, and campus connectedness) – – ++ ++ ++ ++ +++ ++
Selected Outcomes
General Education b
(Writing, speaking, thinking critically)+++ +++ ++
Understanding Self & Others b
(Understanding diverse peoples and the development of values)– – +++ +++ +++
Vocational Skills b
(Working with others, solving real-world problems, leadership skill development)– – +++ +++ + ++
The results reported here are based on 2,674 senior students at 63 institutions.
• More than one third (37%) of the seniors said that doing research with faculty was a course requirement, and more than one fifth (22%) reported it was a degree requirement.
• About a third (31%) said they initiated their involvement by asking a faculty member if they could join their research team, whereas three of ten students were invited by a faculty member to become involved.
The majority (55%) of students to a substantial degree used existing information available from libraries or the WWW (Figure 4), and almost half used data from a laboratory setting in their research projects. Relatively few students drew upon their creative, artistic impulses, probably because the majority of the students participating in research with faculty are from science and engineering fields.
a Model controlled for all programmatic structures in addition to full-time enrollment, on-campus, age, gender, race/ethnicity, major, first generation college student, transfer and Greek. b Model controlled for all programmatic structures c One indicator signifies “trivial” effect sizes, two indicators signify “notable” effect sizes, and three indicators signify “substantial” effect sizes; “+” or “–” signs indicate either a positive or negative relationship between LC features and scales.

National Survey of Student Engagement | Annual Report 2007 ���� National Survey of Student Engagement | Annual Report 2007 National Survey of Student Engagement | Annual Report 2007 ���� National Survey of Student Engagement | Annual Report 2007
Table �: Relationships between Student Contributions to the Research Project and Deep Learning Measures*
Higher Order Thinking Integrative Learning Reflective LearningOverall Deep
Learning Scale
Designing study 0.17 0.22 0.14 0.22
Reviewing related literature 0.17 0.27 0.16 0.25
Collecting data 0.12 0.11 0.08 0.13
Analyzing data 0.19 0.18 0.12 0.21
Interpreting the findings 0.21 0.20 0.14 0.23
Writing up the findings 0.16 0.21 0.12 0.20
Presenting the findings beyond the research team
0.14 0.14 0.10 0.16
Submitting a paper or product 0.14 0.18 0.10 0.18
Figure 4: Substantial Data Sources Usedin Student-Faculty Research
0% 25% 50% 75% 100%
Percent ‘Very much’ or ‘Quite a bit’
Existing info fromlibraries, WWW, etc.
55%
Results from a lab orother controlled setting
48%
Creative, imaginative,artistic impulse
21%
Results from fieldwork,interviews, surveys
43%
Figure 5: Seniors Reporting Substantial Contributions toDifferent Aspects of the Research Project
Collecting data
Analyzing data
Interpreting findings
Writing up findings
Formally presenting findings
Submitting for publication
0% 25% 50% 75% 100%
Designing study
Reviewing literature
55%
44%
63%
76%
73%
68%
62%
49%
Percent ‘Very much’ or ‘Quite a bit’
We also asked students about the nature of their contributions to the research project and what they gained from the experi-ence (Figure 5). The most common activities were collecting data, analyzing, and interpreting findings. Submitting a paper or presenting the findings to people other than the research team were not nearly as common.
An advantage of doing research with a faculty member is that students spend a fair amount of time in the company of faculty and learn firsthand how they think and deal with the inevitable challenges that crop up in the process. Perhaps as a result, students who received feedback during or after the project were more likely to report that their relationships with faculty were more friendly or supportive.
Students were asked to report when and for how long they conducted their research projects:
• Nine of ten seniors worked on the research project during a regular academic term, 13% worked during a January or May term, and 30% worked during summer.
• About a fifth of students spent more than 10 months on the project, a quarter devoted between 5-10 months, and 29% spent less than two months working on the research.
Not surprisingly, results show that the more time students spent on the project, the better they came to understand the research process and the more they gained overall.
Finally, we examined the relationships between different aspects of what students did when working with a faculty member on research and three types of deep learning activities (Table 2). Reviewing the literature and interpreting findings were the most strongly related to deep learning; data collection had the weakest relationship.
* Bivariate correlations (all significant at p<.01).
National Survey of Student Engagement | Annual Report 2007 ���� National Survey of Student Engagement | Annual Report 2007 National Survey of Student Engagement | Annual Report 2007 ���� National Survey of Student Engagement | Annual Report 2007
Study Abroad
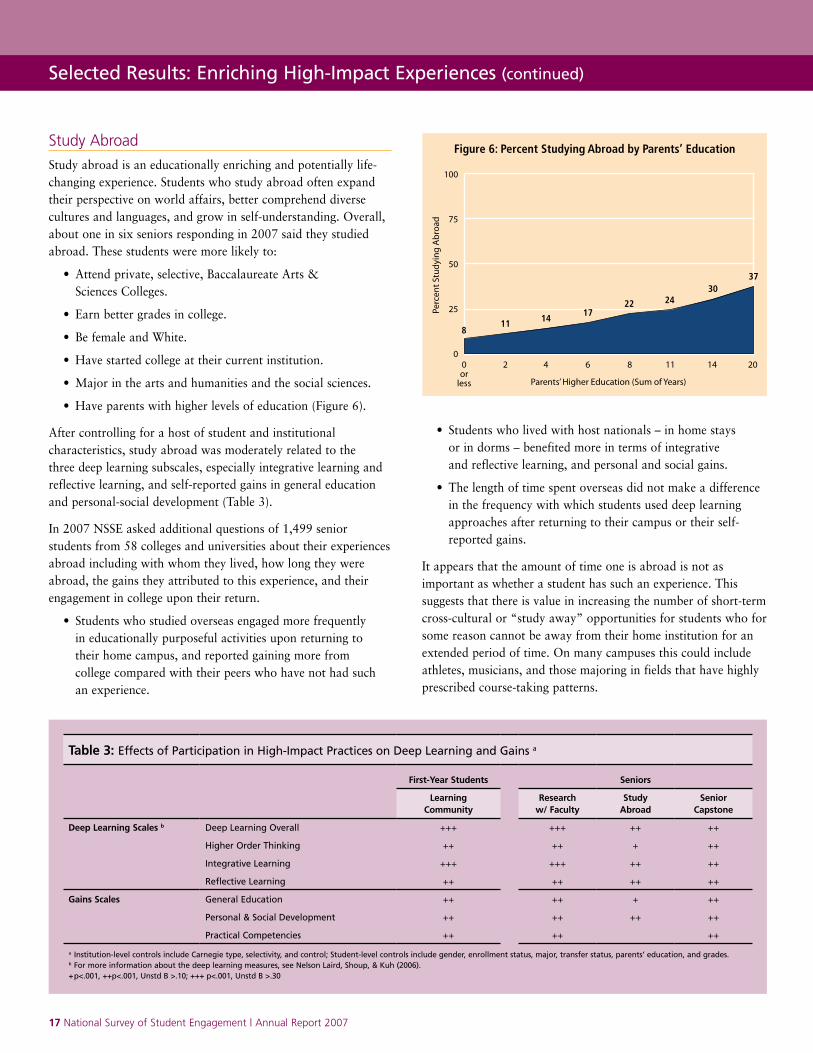
Study abroad is an educationally enriching and potentially life-changing experience. Students who study abroad often expand their perspective on world affairs, better comprehend diverse cultures and languages, and grow in self-understanding. Overall, about one in six seniors responding in 2007 said they studied abroad. These students were more likely to:
• Attend private, selective, Baccalaureate Arts & Sciences Colleges.
• Earn better grades in college.
• Be female and White.
• Have started college at their current institution.
• Major in the arts and humanities and the social sciences.
• Have parents with higher levels of education (Figure 6).
After controlling for a host of student and institutional characteristics, study abroad was moderately related to the three deep learning subscales, especially integrative learning and reflective learning, and self-reported gains in general education and personal-social development (Table 3).
In 2007 NSSE asked additional questions of 1,499 senior students from 58 colleges and universities about their experiences abroad including with whom they lived, how long they were abroad, the gains they attributed to this experience, and their engagement in college upon their return.
• Students who studied overseas engaged more frequently in educationally purposeful activities upon returning to their home campus, and reported gaining more from college compared with their peers who have not had such an experience.
• Students who lived with host nationals – in home stays or in dorms – benefited more in terms of integrative and reflective learning, and personal and social gains.
• The length of time spent overseas did not make a difference in the frequency with which students used deep learning approaches after returning to their campus or their self- reported gains.
It appears that the amount of time one is abroad is not as important as whether a student has such an experience. This suggests that there is value in increasing the number of short-term cross-cultural or “study away” opportunities for students who for some reason cannot be away from their home institution for an extended period of time. On many campuses this could include athletes, musicians, and those majoring in fields that have highly prescribed course-taking patterns.
Selected Results: Enriching High-Impact Experiences (continued)
Figure 6: Percent Studying Abroad by Parents’ Education
0or
less
2 4 6 8 11 14 20
Parents’ Higher Education (Sum of Years)
Perc
ent S
tud
yin
g A
bro
ad
100
75
50
25
0
811 14
1722 24
3037
Table �: Effects of Participation in High-Impact Practices on Deep Learning and Gains a
First-Year Students Seniors
LearningCommunity
Researchw/ Faculty
StudyAbroad
SeniorCapstone
Deep Learning Scales b Deep Learning Overall +++ +++ ++ ++
Higher Order Thinking ++ ++ + ++
Integrative Learning +++ +++ ++ ++
Reflective Learning ++ ++ ++ ++
Gains Scales General Education ++ ++ + ++
Personal & Social Development ++ ++ ++ ++
Practical Competencies ++ ++ ++
a Institution-level controls include Carnegie type, selectivity, and control; Student-level controls include gender, enrollment status, major, transfer status, parents’ education, and grades. b For more information about the deep learning measures, see Nelson Laird, Shoup, & Kuh (2006). + p<.001, ++p<.001, Unstd B >.10; +++ p<.001, Unstd B >.30
National Survey of Student Engagement | Annual Report 2007 ���� National Survey of Student Engagement | Annual Report 2007 National Survey of Student Engagement | Annual Report 2007 ���� National Survey of Student Engagement | Annual Report 2007
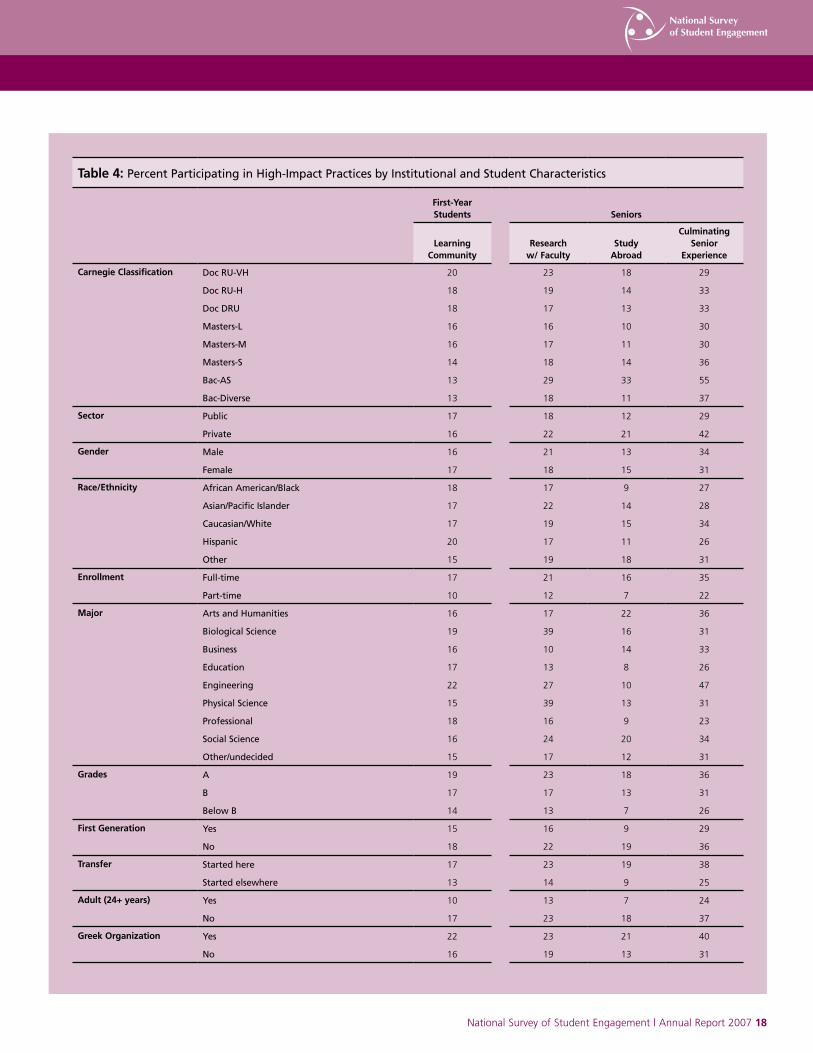
Table �: Percent Participating in High-Impact Practices by Institutional and Student Characteristics
First-YearStudents Seniors
LearningCommunity
Researchw/ Faculty
StudyAbroad
Culminating Senior
Experience
Carnegie Classification Doc RU-VH 20 23 18 29
Doc RU-H 18 19 14 33
Doc DRU 18 17 13 33
Masters-L 16 16 10 30
Masters-M 16 17 11 30
Masters-S 14 18 14 36
Bac-AS 13 29 33 55
Bac-Diverse 13 18 11 37
Sector Public 17 18 12 29
Private 16 22 21 42
Gender Male 16 21 13 34
Female 17 18 15 31
Race/Ethnicity African American/Black 18 17 9 27
Asian/Pacific Islander 17 22 14 28
Caucasian/White 17 19 15 34
Hispanic 20 17 11 26
Other 15 19 18 31
Enrollment Full-time 17 21 16 35
Part-time 10 12 7 22
Major Arts and Humanities 16 17 22 36
Biological Science 19 39 16 31
Business 16 10 14 33
Education 17 13 8 26
Engineering 22 27 10 47
Physical Science 15 39 13 31
Professional 18 16 9 23
Social Science 16 24 20 34
Other/undecided 15 17 12 31
Grades A 19 23 18 36
B 17 17 13 31
Below B 14 13 7 26
First Generation Yes 15 16 9 29
No 18 22 19 36
Transfer Started here 17 23 19 38
Started elsewhere 13 14 9 25
Adult (��+ years) Yes 10 13 7 24
No 17 23 18 37
Greek Organization Yes 22 23 21 40
No 16 19 13 31
National Survey of Student Engagement | Annual Report 2007 �0�� National Survey of Student Engagement | Annual Report 2007 National Survey of Student Engagement | Annual Report 2007 �0�� National Survey of Student Engagement | Annual Report 2007
Selected Results: Enriching High-Impact Experiences (continued)
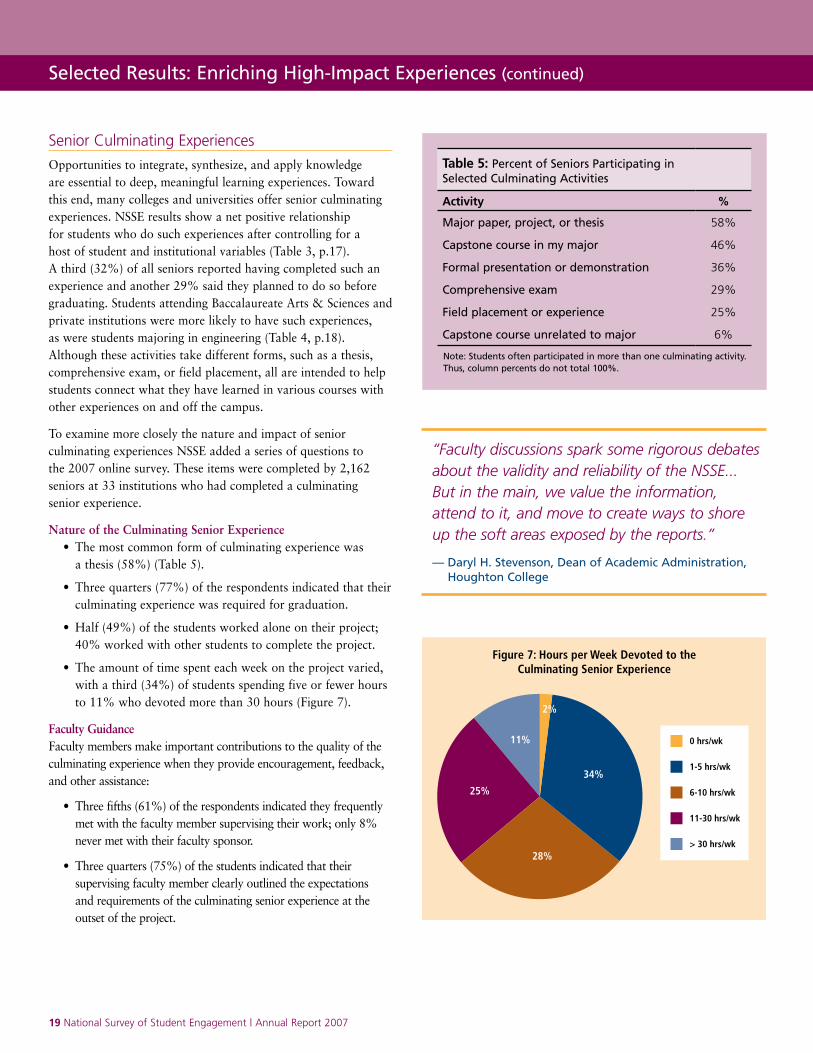
Senior Culminating Experiences
Opportunities to integrate, synthesize, and apply knowledge are essential to deep, meaningful learning experiences. Toward this end, many colleges and universities offer senior culminating experiences. NSSE results show a net positive relationship for students who do such experiences after controlling for a host of student and institutional variables (Table 3, p.17). A third (32%) of all seniors reported having completed such an experience and another 29% said they planned to do so before graduating. Students attending Baccalaureate Arts & Sciences and private institutions were more likely to have such experiences, as were students majoring in engineering (Table 4, p.18). Although these activities take different forms, such as a thesis, comprehensive exam, or field placement, all are intended to help students connect what they have learned in various courses with other experiences on and off the campus.
To examine more closely the nature and impact of senior culminating experiences NSSE added a series of questions to the 2007 online survey. These items were completed by 2,162 seniors at 33 institutions who had completed a culminating senior experience.
Nature of the Culminating Senior Experience • The most common form of culminating experience was a thesis (58%) (Table 5).
• Three quarters (77%) of the respondents indicated that their culminating experience was required for graduation.
• Half (49%) of the students worked alone on their project; 40% worked with other students to complete the project.
• The amount of time spent each week on the project varied, with a third (34%) of students spending five or fewer hours to 11% who devoted more than 30 hours (Figure 7).
Faculty Guidance Faculty members make important contributions to the quality of the culminating experience when they provide encouragement, feedback, and other assistance:
• Three fifths (61%) of the respondents indicated they frequently met with the faculty member supervising their work; only 8% never met with their faculty sponsor.
• Three quarters (75%) of the students indicated that their supervising faculty member clearly outlined the expectations and requirements of the culminating senior experience at the outset of the project.
Table �: Percent of Seniors Participating in Selected Culminating Activities
Activity %
Major paper, project, or thesis 58%
Capstone course in my major 46%
Formal presentation or demonstration 36%
Comprehensive exam 29%
Field placement or experience 25%
Capstone course unrelated to major 6%
Figure 7: Hours per Week Devoted to theCulminating Senior Experience
0 hrs/wk
6-10 hrs/wk
11-30 hrs/wk
> 30 hrs/wk
1-5 hrs/wk
2%
34%
28%
25%
11%
Note: Students often participated in more than one culminating activity. Thus, column percents do not total 100%.
“Facultydiscussionssparksomerigorousdebates aboutthevalidityandreliabilityoftheNSSE... Butinthemain,wevaluetheinformation, attendtoit,andmovetocreatewaystoshore upthesoftareasexposedbythereports.”
— Daryl H. Stevenson, Dean of Academic Administration, Houghton College
National Survey of Student Engagement | Annual Report 2007 �0�� National Survey of Student Engagement | Annual Report 2007 National Survey of Student Engagement | Annual Report 2007 �0�� National Survey of Student Engagement | Annual Report 2007
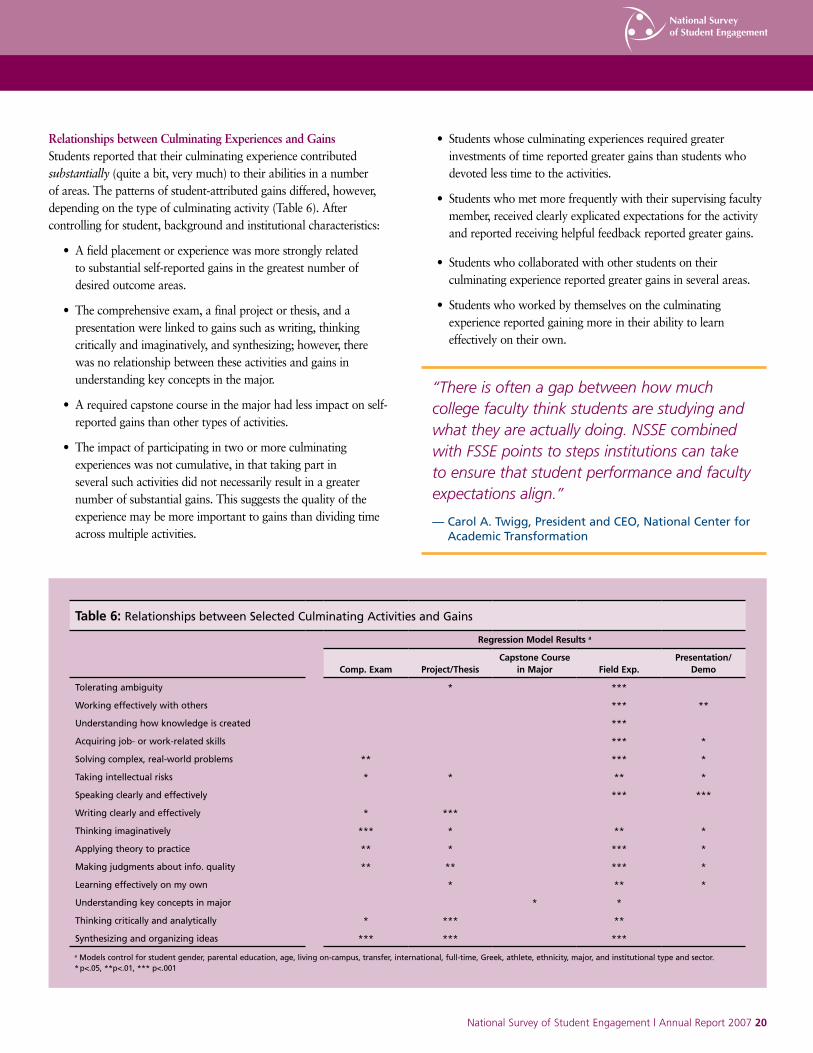
Relationships between Culminating Experiences and Gains Students reported that their culminating experience contributed substantially (quite a bit, very much) to their abilities in a number of areas. The patterns of student-attributed gains differed, however, depending on the type of culminating activity (Table 6). After controlling for student, background and institutional characteristics:
• A field placement or experience was more strongly related to substantial self-reported gains in the greatest number of desired outcome areas.
• The comprehensive exam, a final project or thesis, and a presentation were linked to gains such as writing, thinking critically and imaginatively, and synthesizing; however, there was no relationship between these activities and gains in understanding key concepts in the major.
• A required capstone course in the major had less impact on self- reported gains than other types of activities.
• The impact of participating in two or more culminating experiences was not cumulative, in that taking part in several such activities did not necessarily result in a greater number of substantial gains. This suggests the quality of the experience may be more important to gains than dividing time across multiple activities.
• Students whose culminating experiences required greater investments of time reported greater gains than students who devoted less time to the activities.
• Students who met more frequently with their supervising faculty member, received clearly explicated expectations for the activity and reported receiving helpful feedback reported greater gains.
• Students who collaborated with other students on their culminating experience reported greater gains in several areas.
• Students who worked by themselves on the culminating experience reported gaining more in their ability to learn effectively on their own.
Table �: Relationships between Selected Culminating Activities and Gains
Regression Model Results a
Comp. Exam Project/ThesisCapstone Course
in Major Field Exp.Presentation/
Demo
Tolerating ambiguity * ***
Working effectively with others *** **
Understanding how knowledge is created ***
Acquiring job- or work-related skills *** *
Solving complex, real-world problems ** *** *
Taking intellectual risks * * ** *
Speaking clearly and effectively *** ***
Writing clearly and effectively * ***
Thinking imaginatively *** * ** *
Applying theory to practice ** * *** *
Making judgments about info. quality ** ** *** *
Learning effectively on my own * ** *
Understanding key concepts in major * *
Thinking critically and analytically * *** **
Synthesizing and organizing ideas *** *** ***
a Models control for student gender, parental education, age, living on-campus, transfer, international, full-time, Greek, athlete, ethnicity, major, and institutional type and sector. * p<.05, **p<.01, *** p<.001
“Thereisoftenagapbetweenhowmuch collegefacultythinkstudentsarestudyingand whattheyareactuallydoing.NSSEcombined withFSSEpointstostepsinstitutionscantake toensurethatstudentperformanceandfaculty expectationsalign.”
— Carol A. Twigg, President and CEO, National Center for Academic Transformation
National Survey of Student Engagement | Annual Report 2007 ���� National Survey of Student Engagement | Annual Report 2007 National Survey of Student Engagement | Annual Report 2007 ���� National Survey of Student Engagement | Annual Report 2007
The Importance Faculty Place on High-Impact Experiences
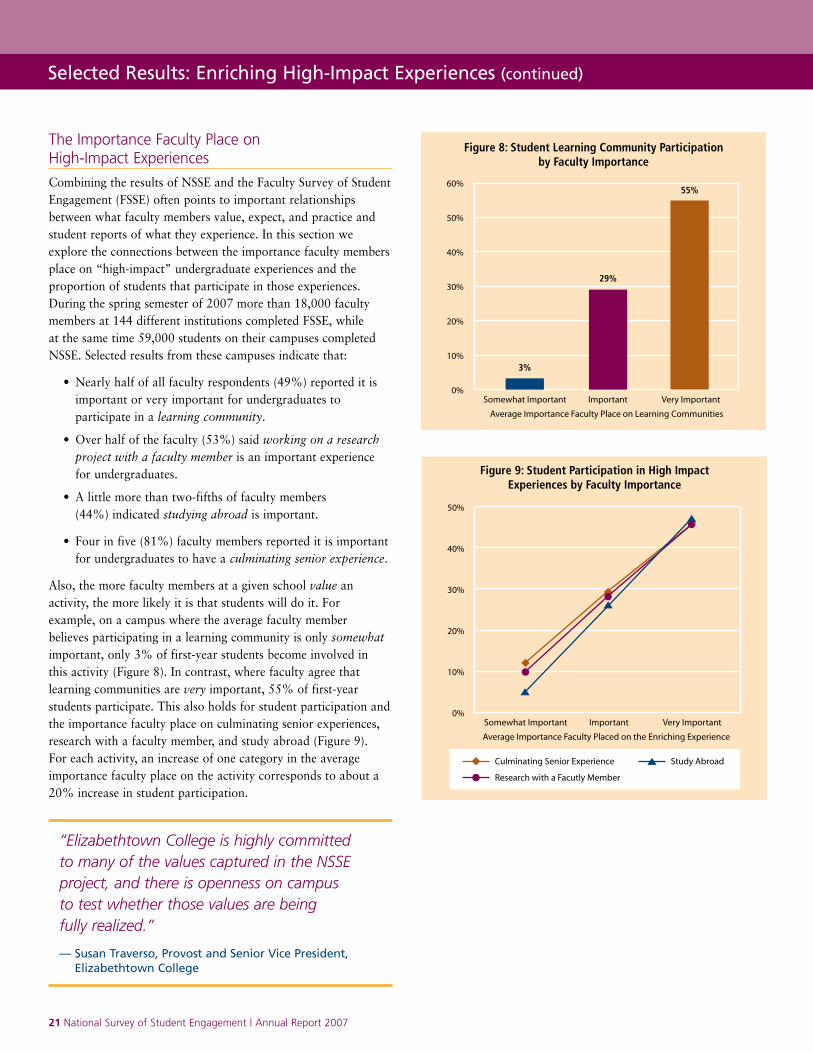
Combining the results of NSSE and the Faculty Survey of Student Engagement (FSSE) often points to important relationships between what faculty members value, expect, and practice and student reports of what they experience. In this section we explore the connections between the importance faculty members place on “high-impact” undergraduate experiences and the proportion of students that participate in those experiences. During the spring semester of 2007 more than 18,000 faculty members at 144 different institutions completed FSSE, while at the same time 59,000 students on their campuses completed NSSE. Selected results from these campuses indicate that:
• Nearly half of all faculty respondents (49%) reported it is important or very important for undergraduates to participate in a learning community.
• Over half of the faculty (53%) said working on a research project with a faculty member is an important experience for undergraduates.
• A little more than two-fifths of faculty members (44%) indicated studying abroad is important.
• Four in five (81%) faculty members reported it is important for undergraduates to have a culminating senior experience.
Also, the more faculty members at a given school value an activity, the more likely it is that students will do it. For example, on a campus where the average faculty member believes participating in a learning community is only somewhat important, only 3% of first-year students become involved in this activity (Figure 8). In contrast, where faculty agree that learning communities are very important, 55% of first-year students participate. This also holds for student participation and the importance faculty place on culminating senior experiences, research with a faculty member, and study abroad (Figure 9). For each activity, an increase of one category in the average importance faculty place on the activity corresponds to about a 20% increase in student participation.
Selected Results: Enriching High-Impact Experiences (continued)
Figure 8: Student Learning Community Participationby Faculty Importance
50%
60%
40%
30%
20%
0%
10%
Average Importance Faculty Place on Learning Communities
29%
Important
3%
Somewhat Important
55%
Very Important
Figure 9: Student Participation in High ImpactExperiences by Faculty Importance
50%
40%
30%
20%
0%
10%
Average Importance Faculty Placed on the Enriching Experience
ImportantSomewhat Important Very Important
Culminating Senior Experience
Research with a Facutly Member
Study Abroad
“ElizabethtownCollegeishighlycommitted tomanyofthevaluescapturedintheNSSE project,andthereisopennessoncampus totestwhetherthosevaluesarebeing fullyrealized.”
— Susan Traverso, Provost and Senior Vice President, Elizabethtown College
National Survey of Student Engagement | Annual Report 2007 ���� National Survey of Student Engagement | Annual Report 2007 National Survey of Student Engagement | Annual Report 2007 ���� National Survey of Student Engagement | Annual Report 2007
Faculty Survey of Student Engagement
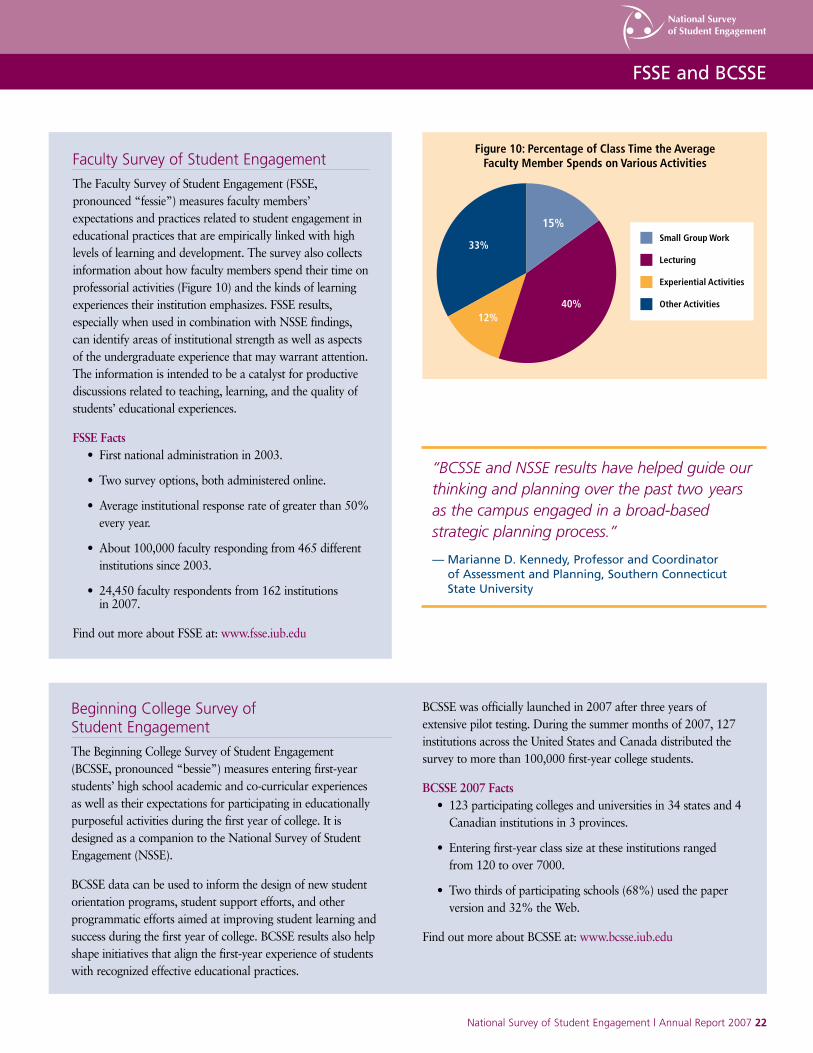
The Faculty Survey of Student Engagement (FSSE, pronounced “fessie”) measures faculty members’ expectations and practices related to student engagement in educational practices that are empirically linked with high levels of learning and development. The survey also collects information about how faculty members spend their time on professorial activities (Figure 10) and the kinds of learning experiences their institution emphasizes. FSSE results, especially when used in combination with NSSE findings, can identify areas of institutional strength as well as aspects of the undergraduate experience that may warrant attention. The information is intended to be a catalyst for productive discussions related to teaching, learning, and the quality of students’ educational experiences.
FSSE Facts • First national administration in 2003.
• Two survey options, both administered online.
• Average institutional response rate of greater than 50% every year.
• About 100,000 faculty responding from 465 different institutions since 2003.
• 24,450 faculty respondents from 162 institutions in 2007.
Find out more about FSSE at: www.fsse.iub.edu
33%
15%
12%40%
Small Group Work
Experiential Activities
Other Activities
Lecturing
Figure 10: Percentage of Class Time the AverageFaculty Member Spends on Various Activities
Beginning College Survey of Student Engagement
The Beginning College Survey of Student Engagement (BCSSE, pronounced “bessie”) measures entering first-year students’ high school academic and co-curricular experiences as well as their expectations for participating in educationally purposeful activities during the first year of college. It is designed as a companion to the National Survey of Student Engagement (NSSE).
BCSSE data can be used to inform the design of new student orientation programs, student support efforts, and other programmatic efforts aimed at improving student learning and success during the first year of college. BCSSE results also help shape initiatives that align the first-year experience of students with recognized effective educational practices.
“BCSSEandNSSEresultshavehelpedguideour thinkingandplanningoverthepasttwoyears asthecampusengagedinabroad-based strategicplanningprocess.”
— Marianne D. Kennedy, Professor and Coordinator of Assessment and Planning, Southern Connecticut State University
BCSSE was officially launched in 2007 after three years of extensive pilot testing. During the summer months of 2007, 127 institutions across the United States and Canada distributed the survey to more than 100,000 first-year college students.
BCSSE 2007 Facts • 123 participating colleges and universities in 34 states and 4 Canadian institutions in 3 provinces.
• Entering first-year class size at these institutions ranged from 120 to over 7000.
• Two thirds of participating schools (68%) used the paper version and 32% the Web.
Find out more about BCSSE at: www.bcsse.iub.edu
FSSE and BCSSE
National Survey of Student Engagement | Annual Report 2007 ���� National Survey of Student Engagement | Annual Report 2007 National Survey of Student Engagement | Annual Report 2007 ���� National Survey of Student Engagement | Annual Report 2007
Academic Advising
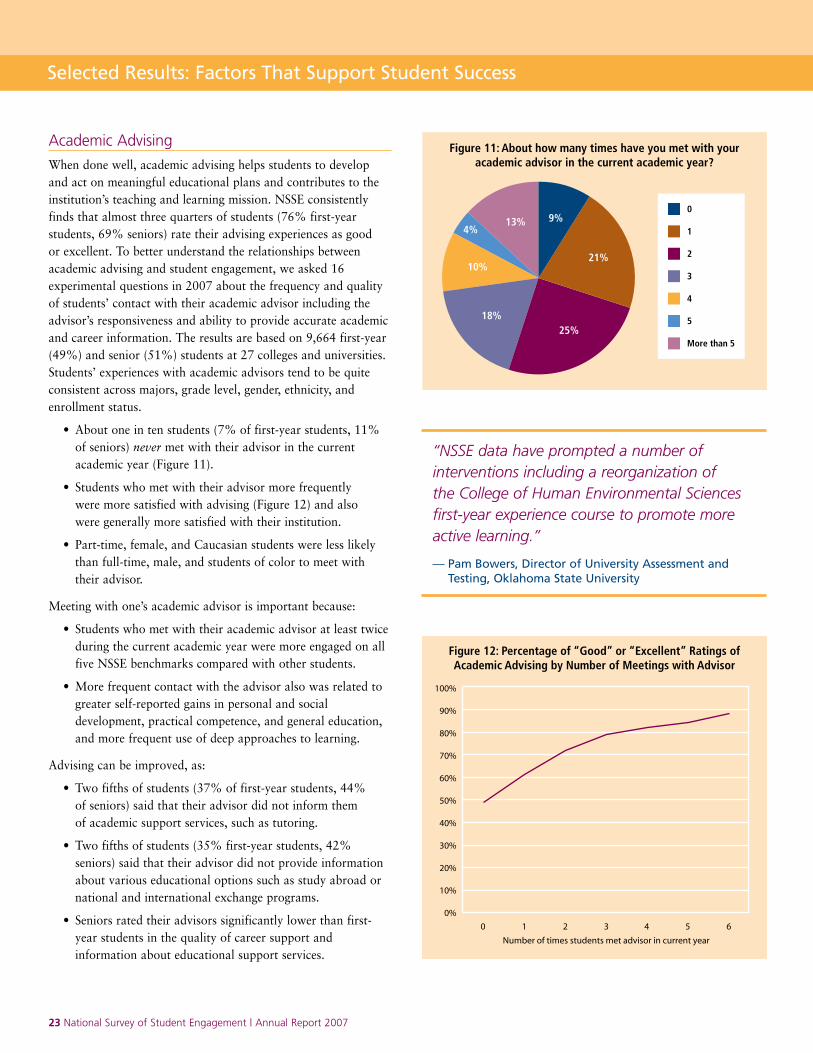
When done well, academic advising helps students to develop and act on meaningful educational plans and contributes to the institution’s teaching and learning mission. NSSE consistently finds that almost three quarters of students (76% first-year students, 69% seniors) rate their advising experiences as good or excellent. To better understand the relationships between academic advising and student engagement, we asked 16 experimental questions in 2007 about the frequency and quality of students’ contact with their academic advisor including the advisor’s responsiveness and ability to provide accurate academic and career information. The results are based on 9,664 first-year (49%) and senior (51%) students at 27 colleges and universities. Students’ experiences with academic advisors tend to be quite consistent across majors, grade level, gender, ethnicity, and enrollment status.
• About one in ten students (7% of first-year students, 11% of seniors) never met with their advisor in the current academic year (Figure 11).
• Students who met with their advisor more frequently were more satisfied with advising (Figure 12) and also were generally more satisfied with their institution.
• Part-time, female, and Caucasian students were less likely than full-time, male, and students of color to meet with their advisor.
Meeting with one’s academic advisor is important because:
• Students who met with their academic advisor at least twice during the current academic year were more engaged on all five NSSE benchmarks compared with other students.
• More frequent contact with the advisor also was related to greater self-reported gains in personal and social development, practical competence, and general education, and more frequent use of deep approaches to learning.
Advising can be improved, as:
• Two fifths of students (37% of first-year students, 44% of seniors) said that their advisor did not inform them of academic support services, such as tutoring.
• Two fifths of students (35% first-year students, 42% seniors) said that their advisor did not provide information about various educational options such as study abroad or national and international exchange programs.
• Seniors rated their advisors significantly lower than first- year students in the quality of career support and information about educational support services.
Figure 11: About how many times have you met with youracademic advisor in the current academic year?
0
2
3
4
5
More than 5
1
21%
9%13%
10%
4%
18%25%
Figure 12: Percentage of “Good” or “Excellent” Ratings ofAcademic Advising by Number of Meetings with Advisor
100%
90%
80%
70%
60%
50%
40%
10%
0%
20%
30%
10 2 3
Number of times students met advisor in current year
4 5 6
Selected Results: Factors That Support Student Success
“NSSEdatahavepromptedanumberof interventionsincludingareorganizationof theCollegeofHumanEnvironmentalSciences first-yearexperiencecoursetopromotemore activelearning.”
— Pam Bowers, Director of University Assessment and Testing, Oklahoma State University
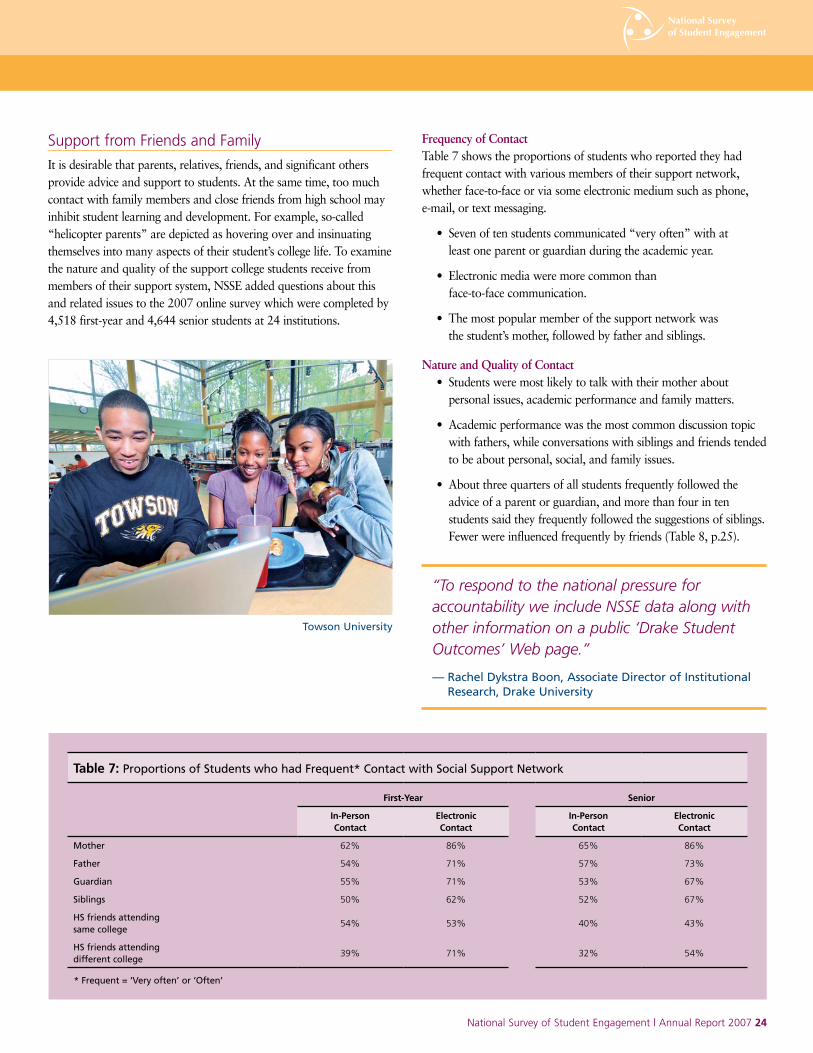
National Survey of Student Engagement | Annual Report 2007 ���� National Survey of Student Engagement | Annual Report 2007 National Survey of Student Engagement | Annual Report 2007 ���� National Survey of Student Engagement | Annual Report 2007
Support from Friends and Family
It is desirable that parents, relatives, friends, and significant others provide advice and support to students. At the same time, too much contact with family members and close friends from high school may inhibit student learning and development. For example, so-called “helicopter parents” are depicted as hovering over and insinuating themselves into many aspects of their student’s college life. To examine the nature and quality of the support college students receive from members of their support system, NSSE added questions about this and related issues to the 2007 online survey which were completed by 4,518 first-year and 4,644 senior students at 24 institutions.
Frequency of Contact Table 7 shows the proportions of students who reported they had frequent contact with various members of their support network, whether face-to-face or via some electronic medium such as phone, e-mail, or text messaging.
• Seven of ten students communicated “very often” with at least one parent or guardian during the academic year.
• Electronic media were more common than face-to-face communication.
• The most popular member of the support network was the student’s mother, followed by father and siblings.
Nature and Quality of Contact • Students were most likely to talk with their mother about personal issues, academic performance and family matters.
• Academic performance was the most common discussion topic with fathers, while conversations with siblings and friends tended to be about personal, social, and family issues.
• About three quarters of all students frequently followed the advice of a parent or guardian, and more than four in ten students said they frequently followed the suggestions of siblings. Fewer were influenced frequently by friends (Table 8, p.25).
Table �: Proportions of Students who had Frequent* Contact with Social Support Network
First-Year Senior
In-PersonContact
ElectronicContact
In-PersonContact
ElectronicContact
Mother 62% 86% 65% 86%
Father 54% 71% 57% 73%
Guardian 55% 71% 53% 67%
Siblings 50% 62% 52% 67%
HS friends attending same college
54% 53% 40% 43%
HS friends attending different college
39% 71% 32% 54%
* Frequent = ‘Very often’ or ‘Often’
Towson University
“Torespondtothenationalpressurefor accountabilityweincludeNSSEdataalongwith otherinformationonapublic‘DrakeStudent Outcomes’Webpage.”
— Rachel Dykstra Boon, Associate Director of Institutional Research, Drake University
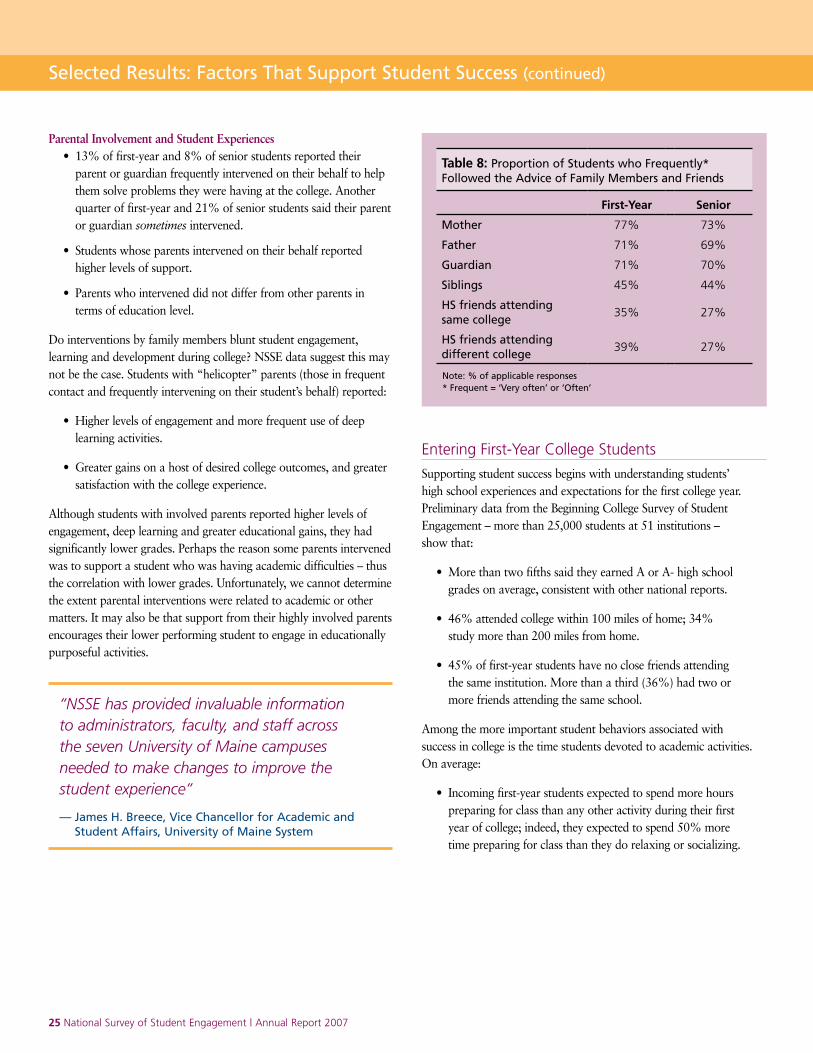
National Survey of Student Engagement | Annual Report 2007 ���� National Survey of Student Engagement | Annual Report 2007 National Survey of Student Engagement | Annual Report 2007 ���� National Survey of Student Engagement | Annual Report 2007
Entering First-Year College Students
Supporting student success begins with understanding students’ high school experiences and expectations for the first college year. Preliminary data from the Beginning College Survey of Student Engagement – more than 25,000 students at 51 institutions – show that:
• More than two fifths said they earned A or A- high school grades on average, consistent with other national reports.
• 46% attended college within 100 miles of home; 34% study more than 200 miles from home.
• 45% of first-year students have no close friends attending the same institution. More than a third (36%) had two or more friends attending the same school.
Among the more important student behaviors associated with success in college is the time students devoted to academic activities. On average:
• Incoming first-year students expected to spend more hours preparing for class than any other activity during their first year of college; indeed, they expected to spend 50% more time preparing for class than they do relaxing or socializing.
Selected Results: Factors That Support Student Success (continued)
Parental Involvement and Student Experiences • 13% of first-year and 8% of senior students reported their parent or guardian frequently intervened on their behalf to help them solve problems they were having at the college. Another quarter of first-year and 21% of senior students said their parent or guardian sometimes intervened.
• Students whose parents intervened on their behalf reported higher levels of support.
• Parents who intervened did not differ from other parents in terms of education level.
Do interventions by family members blunt student engagement, learning and development during college? NSSE data suggest this may not be the case. Students with “helicopter” parents (those in frequent contact and frequently intervening on their student’s behalf) reported:
• Higher levels of engagement and more frequent use of deep learning activities.
• Greater gains on a host of desired college outcomes, and greater satisfaction with the college experience.
Although students with involved parents reported higher levels of engagement, deep learning and greater educational gains, they had significantly lower grades. Perhaps the reason some parents intervened was to support a student who was having academic difficulties – thus the correlation with lower grades. Unfortunately, we cannot determine the extent parental interventions were related to academic or other matters. It may also be that support from their highly involved parents encourages their lower performing student to engage in educationally purposeful activities.
Table �: Proportion of Students who Frequently* Followed the Advice of Family Members and Friends
First-Year Senior
Mother 77% 73%
Father 71% 69%
Guardian 71% 70%
Siblings 45% 44%
HS friends attending same college
35% 27%
HS friends attending different college
39% 27%
Note: % of applicable responses * Frequent = ‘Very often’ or ‘Often’
“NSSEhasprovidedinvaluableinformation toadministrators,faculty,andstaffacross thesevenUniversityofMainecampuses neededtomakechangestoimprovethe studentexperience”
— James H. Breece, Vice Chancellor for Academic and Student Affairs, University of Maine System
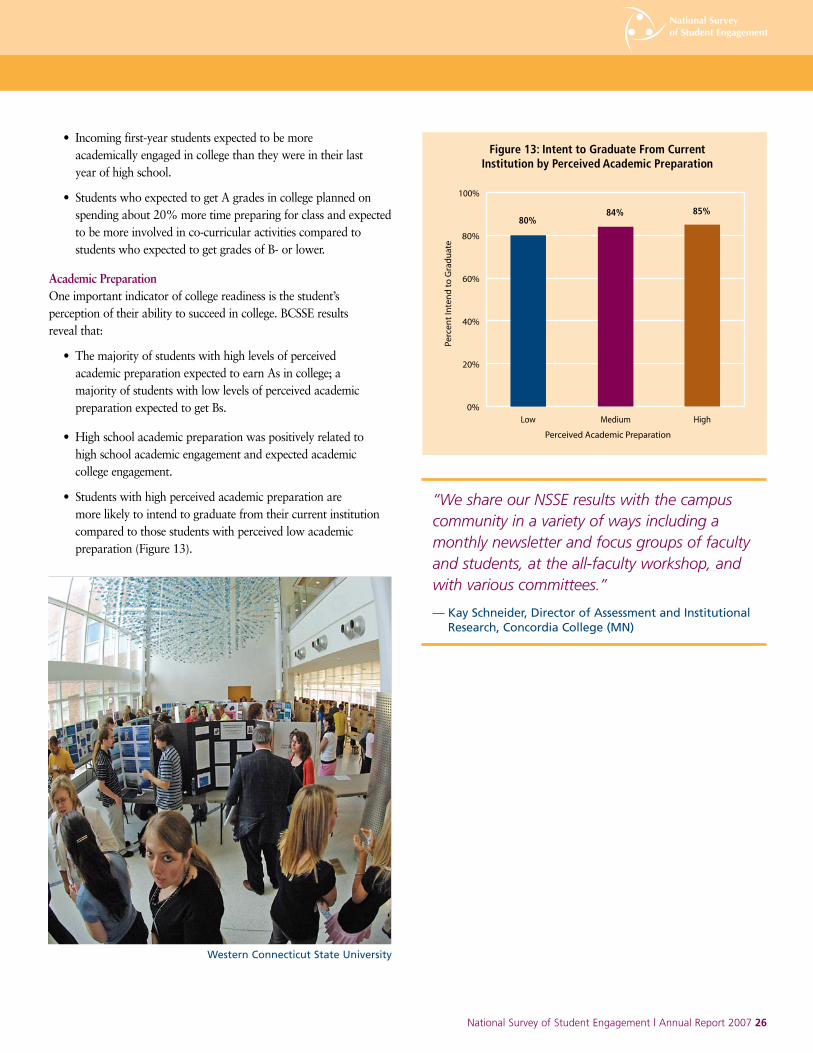
National Survey of Student Engagement | Annual Report 2007 ���� National Survey of Student Engagement | Annual Report 2007 National Survey of Student Engagement | Annual Report 2007 ���� National Survey of Student Engagement | Annual Report 2007
Figure 13: Intent to Graduate From CurrentInstitution by Perceived Academic Preparation
100%
80%
60%
40%
0%
20%
MediumLow High
Perceived Academic Preparation
80%84% 85%
Perc
ent
Inte
nd
to
Gra
du
ate
• Incoming first-year students expected to be more academically engaged in college than they were in their last year of high school.
• Students who expected to get A grades in college planned on spending about 20% more time preparing for class and expected to be more involved in co-curricular activities compared to students who expected to get grades of B- or lower.
Academic Preparation One important indicator of college readiness is the student’s perception of their ability to succeed in college. BCSSE results reveal that:
• The majority of students with high levels of perceived academic preparation expected to earn As in college; a majority of students with low levels of perceived academic preparation expected to get Bs.
• High school academic preparation was positively related to high school academic engagement and expected academic college engagement.
• Students with high perceived academic preparation are more likely to intend to graduate from their current institution compared to those students with perceived low academic preparation (Figure 13).
“WeshareourNSSEresultswiththecampus communityinavarietyofwaysincludinga monthlynewsletterandfocusgroupsoffaculty andstudents,attheall-facultyworkshop,and withvariouscommittees.”
— Kay Schneider, Director of Assessment and Institutional Research, Concordia College (MN)
Western Connecticut State University
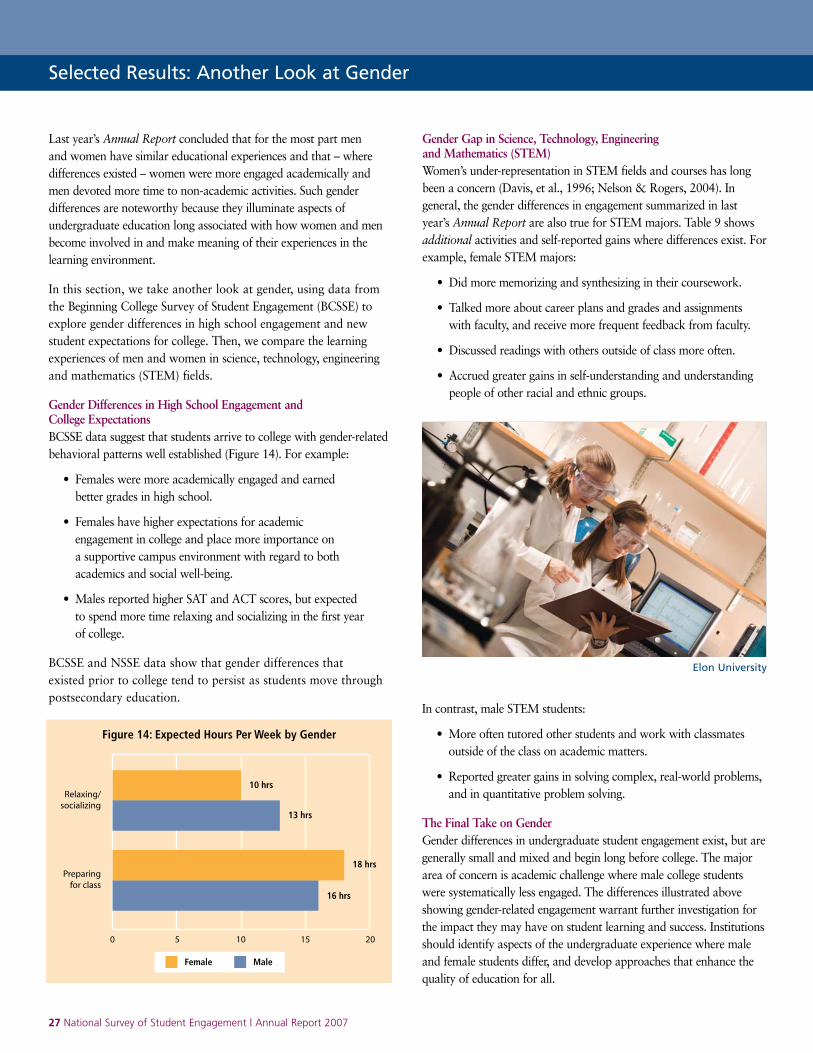
National Survey of Student Engagement | Annual Report 2007 ���� National Survey of Student Engagement | Annual Report 2007 National Survey of Student Engagement | Annual Report 2007 ���� National Survey of Student Engagement | Annual Report 2007
Last year’s Annual Report concluded that for the most part men and women have similar educational experiences and that – where differences existed – women were more engaged academically and men devoted more time to non-academic activities. Such gender differences are noteworthy because they illuminate aspects of undergraduate education long associated with how women and men become involved in and make meaning of their experiences in the learning environment.
In this section, we take another look at gender, using data from the Beginning College Survey of Student Engagement (BCSSE) to explore gender differences in high school engagement and new student expectations for college. Then, we compare the learning experiences of men and women in science, technology, engineering and mathematics (STEM) fields.
Gender Differences in High School Engagement and College Expectations BCSSE data suggest that students arrive to college with gender-related behavioral patterns well established (Figure 14). For example:
• Females were more academically engaged and earned better grades in high school.
• Females have higher expectations for academic engagement in college and place more importance on a supportive campus environment with regard to both academics and social well-being.
• Males reported higher SAT and ACT scores, but expected to spend more time relaxing and socializing in the first year of college.
BCSSE and NSSE data show that gender differences that existed prior to college tend to persist as students move through postsecondary education.
Gender Gap in Science, Technology, Engineering and Mathematics (STEM) Women’s under-representation in STEM fields and courses has long been a concern (Davis, et al., 1996; Nelson & Rogers, 2004). In general, the gender differences in engagement summarized in last year’s Annual Report are also true for STEM majors. Table 9 shows additional activities and self-reported gains where differences exist. For example, female STEM majors:
• Did more memorizing and synthesizing in their coursework.
• Talked more about career plans and grades and assignments with faculty, and receive more frequent feedback from faculty.
• Discussed readings with others outside of class more often.
• Accrued greater gains in self-understanding and understanding people of other racial and ethnic groups.
Selected Results: Another Look at Gender
50 10 15 20
Figure 14: Expected Hours Per Week by Gender
Relaxing/socializing
Preparingfor class
10 hrs
13 hrs
18 hrs
16 hrs
Female Male
Elon University
In contrast, male STEM students:
• More often tutored other students and work with classmates outside of the class on academic matters.
• Reported greater gains in solving complex, real-world problems, and in quantitative problem solving.
The Final Take on Gender Gender differences in undergraduate student engagement exist, but are generally small and mixed and begin long before college. The major area of concern is academic challenge where male college students were systematically less engaged. The differences illustrated above showing gender-related engagement warrant further investigation for the impact they may have on student learning and success. Institutions should identify aspects of the undergraduate experience where male and female students differ, and develop approaches that enhance the quality of education for all.
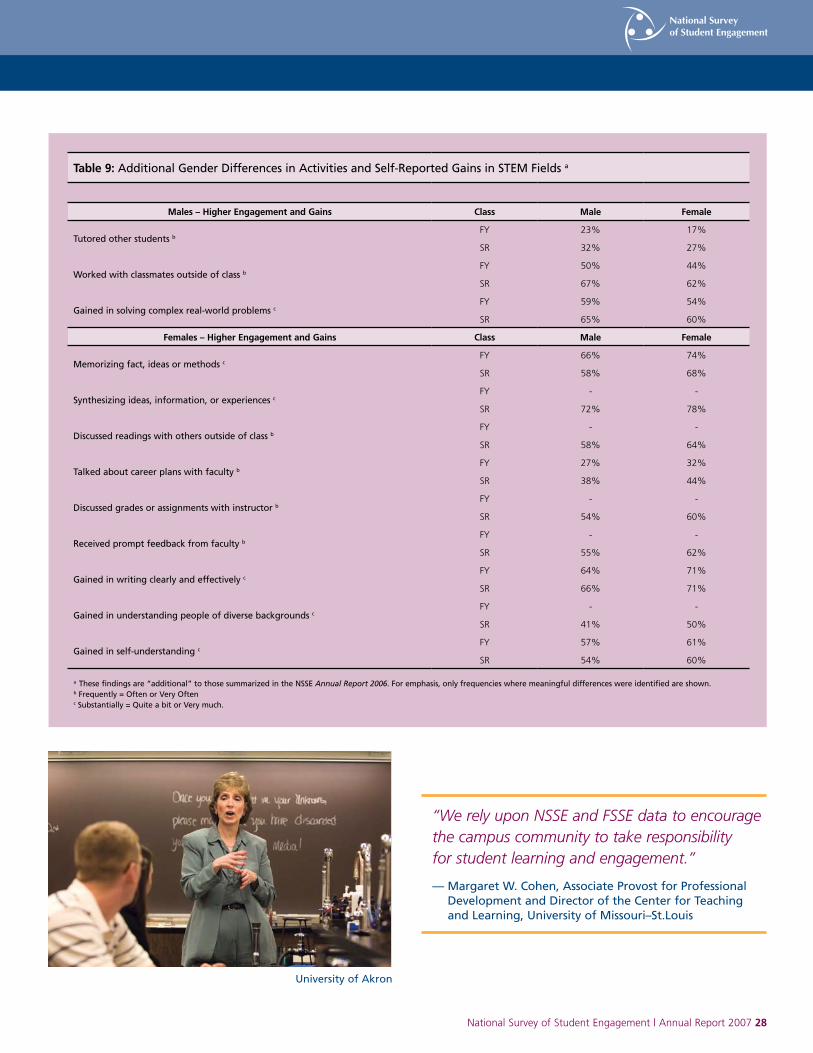
National Survey of Student Engagement | Annual Report 2007 ���� National Survey of Student Engagement | Annual Report 2007 National Survey of Student Engagement | Annual Report 2007 ���� National Survey of Student Engagement | Annual Report 2007
Table �: Additional Gender Differences in Activities and Self-Reported Gains in STEM Fields a
Males – Higher Engagement and Gains Class Male Female
Tutored other students bFY 23% 17%
SR 32% 27%
Worked with classmates outside of class bFY 50% 44%
SR 67% 62%
Gained in solving complex real-world problems cFY 59% 54%
SR 65% 60%
Females – Higher Engagement and Gains Class Male Female
Memorizing fact, ideas or methods cFY 66% 74%
SR 58% 68%
Synthesizing ideas, information, or experiences cFY - -
SR 72% 78%
Discussed readings with others outside of class bFY - -
SR 58% 64%
Talked about career plans with faculty bFY 27% 32%
SR 38% 44%
Discussed grades or assignments with instructor bFY - -
SR 54% 60%
Received prompt feedback from faculty bFY - -
SR 55% 62%
Gained in writing clearly and effectively cFY 64% 71%
SR 66% 71%
Gained in understanding people of diverse backgrounds cFY - -
SR 41% 50%
Gained in self-understanding cFY 57% 61%
SR 54% 60%
a These findings are “additional” to those summarized in the NSSE Annual Report 2006. For emphasis, only frequencies where meaningful differences were identified are shown.b Frequently = Often or Very Often c Substantially = Quite a bit or Very much.
“WerelyuponNSSEandFSSEdatatoencourage thecampuscommunitytotakeresponsibility forstudentlearningandengagement.”
— Margaret W. Cohen, Associate Provost for Professional Development and Director of the Center for Teaching and Learning, University of Missouri–St.Louis
University of Akron
National Survey of Student Engagement | Annual Report 2007 �0�� National Survey of Student Engagement | Annual Report 2007 National Survey of Student Engagement | Annual Report 2007 �0�� National Survey of Student Engagement | Annual Report 2007
NSSE provides information that faculty, staff and others can use almost immediately to improve the quality of the undergraduate experience. Institutions such as Drake University and Florida International University (see examples below) triangulate students’ NSSE results with additional information such as other national survey and institutional records to better understand who is at risk and the effects of various programs and practices. This section offers a sampling of different applications and interventions based on engagement results.
General Education
Drake University
Along with other sources of information, Drake University is using its NSSE results to assess its general education curriculum, specifically to examine areas such as service learning, multicultural understanding, and critical thinking skills. NSSE data are also expected to inform the review of capstone courses and other senior culminating experiences as the process moves forward. Drake participated in the inaugural administration of the Beginning College Survey of Student Engagement (BCSSE) and anticipates that BCSSE results combined with NSSE findings will provide instructive insight into the review of undergraduate advising. Finally, responding to the national interest in institutional accountability and transparency, Drake is participating in the NSSE-USA TODAY initiative and reporting NSSE data along with other information on its public “Drake Student Outcomes” Web page: www.drake.edu/academics/Academics.php.
Grand Valley State University
Seniors at Grand Valley State University reported lower gains on NSSE than their comparison groups in working effectively with others, solving complex real-world problems, and developing a personal code of ethics. These data were incorporated into the institution’s “Claiming a Liberal Education” (CLE) campus change initiative, which is designed to align faculty and student
expectations with the goals of a liberal arts education. To estimate the impact of the CLE project, students in an advertising and public relations course collected additional information from students and faculty using their own locally developed surveys that elaborated on NSSE items. In addition, references to student engagement often emerge in discussions about culture change at the university, with faculty making such comments as, “I now require my students to make presentations because the NSSE seniors said they needed more help in speaking clearly and effectively.” Student affairs staff used NSSE results to advance the collaboration between academic and student life and took the lead in establishing learning communities.
University of Georgia
The University of Georgia (UGA) Vice President for Instruction engaged in a series of NSSE Campus Conversations to discuss NSSE results with deans, departmental faculty, members of the Teaching Academy, the University Curriculum Committee, TA Mentors, the Student Government Association, academic advisors, and other groups on campus. In 2004, the Provost organized a Task Force that was charged “to explore questions related to whether the University has a rigorous intellectual climate, how students learn and should learn…and whether the University’s general education requirements remain innovative and engaging for undergraduate students…” (Report of the Task Force on General Education and Student Learning, University of Georgia, August, 2005, Executive Summary). Although the Task Force members read and discussed many documents during their year of study, they noted in their Final Report that “perhaps the most influential document we examined was the 2003 report of the National Survey of Student Engagement (NSSE)” (Task Force Report, p. 2). Based on NSSE data and the Report of the Task Force on General Education and Student Learning, a number of initiatives have been introduced including an Office of Service Learning, expanded residential learning communities, additional resources allocated to writing programs, and a revised general education curriculum submitted to the University System Board of Regents.
Intellectual Rigor and Active Learning
Peace College
At Peace College, NSSE data are shared with all faculty members annually. The Curricular Issues Committee reviewed the student engagement results along with other information and suggested changes, which led to the College revising its liberal education requirements with the goal of increasing academic rigor. The 2007 NSSE data confirm that the students responded
Using NSSE Data
“Forseveralyearswedebatedtheneedfor substantivereformofourfirst-yearcurriculum. NSSEresultsprovidedevidencetopersuadethe facultytochange,andhelpedinformthenew curriculumthatwearenowimplementing.”
— Richard F. Vaz, Dean for Interdisciplinary and Global Studies, Worcester Polytechnic Institute
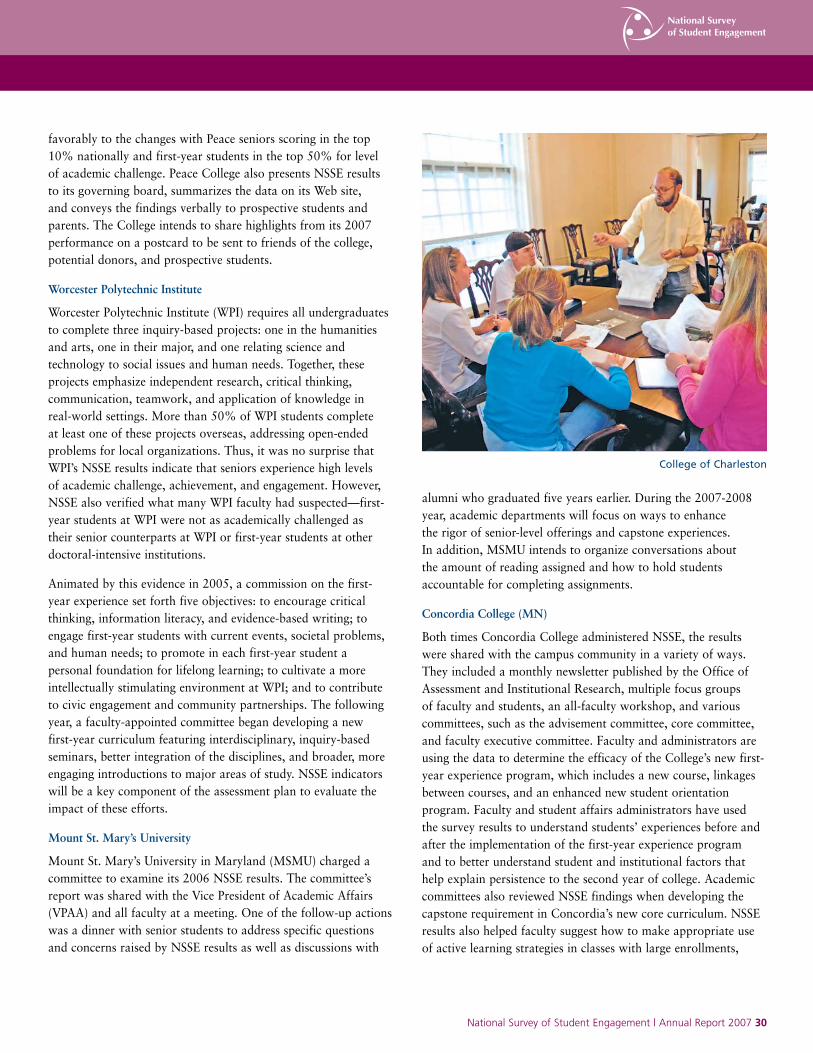
National Survey of Student Engagement | Annual Report 2007 �0�� National Survey of Student Engagement | Annual Report 2007 National Survey of Student Engagement | Annual Report 2007 �0�� National Survey of Student Engagement | Annual Report 2007
favorably to the changes with Peace seniors scoring in the top 10% nationally and first-year students in the top 50% for level of academic challenge. Peace College also presents NSSE results to its governing board, summarizes the data on its Web site, and conveys the findings verbally to prospective students and parents. The College intends to share highlights from its 2007 performance on a postcard to be sent to friends of the college, potential donors, and prospective students.
Worcester Polytechnic Institute
Worcester Polytechnic Institute (WPI) requires all undergraduates to complete three inquiry-based projects: one in the humanities and arts, one in their major, and one relating science and technology to social issues and human needs. Together, these projects emphasize independent research, critical thinking, communication, teamwork, and application of knowledge in real-world settings. More than 50% of WPI students complete at least one of these projects overseas, addressing open-ended problems for local organizations. Thus, it was no surprise that WPI’s NSSE results indicate that seniors experience high levels of academic challenge, achievement, and engagement. However, NSSE also verified what many WPI faculty had suspected—first-year students at WPI were not as academically challenged as their senior counterparts at WPI or first-year students at other doctoral-intensive institutions.
Animated by this evidence in 2005, a commission on the first-year experience set forth five objectives: to encourage critical thinking, information literacy, and evidence-based writing; to engage first-year students with current events, societal problems, and human needs; to promote in each first-year student a personal foundation for lifelong learning; to cultivate a more intellectually stimulating environment at WPI; and to contribute to civic engagement and community partnerships. The following year, a faculty-appointed committee began developing a new first-year curriculum featuring interdisciplinary, inquiry-based seminars, better integration of the disciplines, and broader, more engaging introductions to major areas of study. NSSE indicators will be a key component of the assessment plan to evaluate the impact of these efforts.
Mount St. Mary’s University
Mount St. Mary’s University in Maryland (MSMU) charged a committee to examine its 2006 NSSE results. The committee’s report was shared with the Vice President of Academic Affairs (VPAA) and all faculty at a meeting. One of the follow-up actions was a dinner with senior students to address specific questions and concerns raised by NSSE results as well as discussions with
alumni who graduated five years earlier. During the 2007-2008 year, academic departments will focus on ways to enhance the rigor of senior-level offerings and capstone experiences. In addition, MSMU intends to organize conversations about the amount of reading assigned and how to hold students accountable for completing assignments.
Concordia College (MN)
Both times Concordia College administered NSSE, the results were shared with the campus community in a variety of ways. They included a monthly newsletter published by the Office of Assessment and Institutional Research, multiple focus groups of faculty and students, an all-faculty workshop, and various committees, such as the advisement committee, core committee, and faculty executive committee. Faculty and administrators are using the data to determine the efficacy of the College’s new first-year experience program, which includes a new course, linkages between courses, and an enhanced new student orientation program. Faculty and student affairs administrators have used the survey results to understand students’ experiences before and after the implementation of the first-year experience program and to better understand student and institutional factors that help explain persistence to the second year of college. Academic committees also reviewed NSSE findings when developing the capstone requirement in Concordia’s new core curriculum. NSSE results also helped faculty suggest how to make appropriate use of active learning strategies in classes with large enrollments,
College of Charleston
National Survey of Student Engagement | Annual Report 2007 ���� National Survey of Student Engagement | Annual Report 2007 National Survey of Student Engagement | Annual Report 2007 ���� National Survey of Student Engagement | Annual Report 2007
integrate research into capstone courses and study abroad, develop honors tracks for students in more majors, and expand opportunities for small groups of students to work with faculty.
Hope College
Although Hope compares favorably with the NSSE national cohort on most measures, for several years the College has lagged behind other comparison groups, including the Carnegie Liberal Arts group and the Colleges that Change Lives consortium group. Hope College is focusing on two issues, one of which is academic engagement.
From 2003-2007, the College tracked Hope students on several NSSE items, one of which was the number of hours students study each week. After concluding improvement was needed, the College developed several strategies to address this, including: 1) devoting two faculty meetings to address student engagement (one an extended meeting, over dinner, with very high attendance), 2) a year-long commitment from the Academic Affairs Board to study this issue, with a request that every academic department provide a list of strategies to increase engagement, 3) student focus groups designed to add more depth to the survey data, and 4) a workshop for department chairs to share best practices for increasing student engagement. The results from the 2007 NSSE data indicated a marked increase in self-reported number of hours studying, whereby Hope students now report studying more than both comparison groups.
Student Engagement Data Combined with Additional Information
Austin Peay State University
Austin Peay State University (APSU) presented its NSSE findings to the University’s deans, chairs, and directors, connecting student engagement information with data from the Cooperative Institutional Research Program and Your First College Year survey. After analyzing the responses of students majoring in education, the results were incorporated in the self-study prepared for the National Council for Accreditation of Teacher Education review. In addition, NSSE results have been considered in freshman seminar and orientation workshops and other first-year student initiatives. Student affairs program directors in health services and counseling use NSSE data to guide outreach programming. The University also has included its NSSE results in proposals prepared for external funding, such as Title III grants for expanding institutional capacity to serve low-income students.
University of Nebraska – Lincoln
The University of Nebraska - Lincoln (UNL) administered NSSE in 2002, 2004, and 2007. The 2002 NSSE results contributed to two campus-wide reports about the experiences of faculty, staff, and students at UNL. The first report, Intellectual Engagement and Achievement at UNL (www.unl.edu/svcaa/documents/blue_sky_report.pdf) assessed how the experiences of faculty, staff, and students related to the goals identified in the 2000 benchmark report, A 2020 Vision: The Future of Research and Graduate Education at UNL (www.unl.edu/svcaa/documents/2020report.pdf). The second report, Everyone a Teacher, Everyone a Learner, addressed the effectiveness of first-year undergraduate orientation and transition programs (www.unl.edu/svcaa/documents/everyone_a_learner.pdf). Both documents integrated NSSE results with other evidence, such as findings from UNL’s Quality Performance Indicators and the Gallup Climate Survey. Specifically, NSSE results helped formulate questions that were used to lead student focus groups, as well as help in analyzing the feedback from faculty who teach first-year courses to formulate the conclusions and recommendations found in the two reports.
The 2004 NSSE findings informed the initiative to review and reform general education at UNL, verifying that learning outcomes and the structure of the existing general education program needed to be revisited. In addition, by increasing the NSSE sample size, UNL was able to provide each college with a detailed report of NSSE responses from their students. Some of the colleges shared the results with other constituent groups (students, alumni, faculty members) and all the colleges used the 2004 NSSE administration as benchmark data. UNL is also participating in the “Parsing the First-Year of College ” national study that will analyze NSSE 2007 results in concert with other
Using NSSE Data (continued)
“We’veusedourNSSEresultstosupportmajor expansionofthelearningcommunities,faculty developmentinitiatives,andcreationofahost ofonlinestudentsupporttoolsincluding tutoringinmath,statistics,andcomposition madeaccessiblethroughanewWebnetwork whichwasourBEAMSproject.”
— Rosa L. Jones, Vice President for Student Affairs and Undergraduate Education, Florida International University
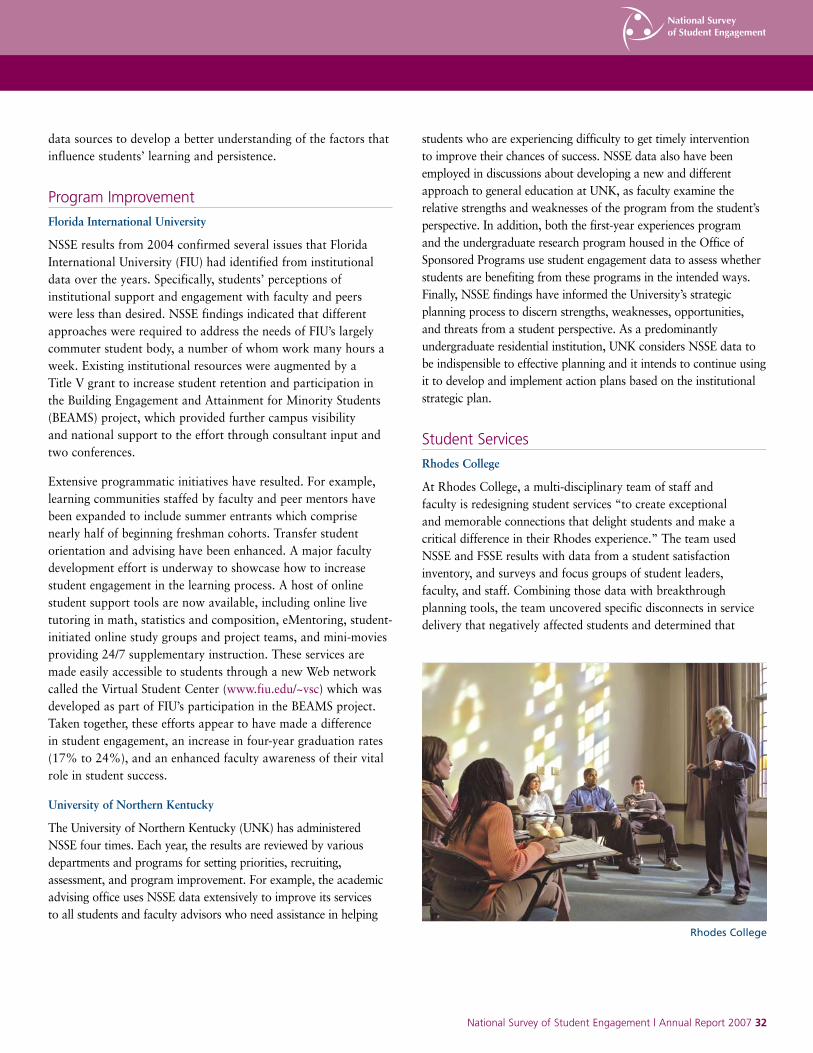
National Survey of Student Engagement | Annual Report 2007 ���� National Survey of Student Engagement | Annual Report 2007 National Survey of Student Engagement | Annual Report 2007 ���� National Survey of Student Engagement | Annual Report 2007
data sources to develop a better understanding of the factors that influence students’ learning and persistence.
Program Improvement
Florida International University
NSSE results from 2004 confirmed several issues that Florida International University (FIU) had identified from institutional data over the years. Specifically, students’ perceptions of institutional support and engagement with faculty and peers were less than desired. NSSE findings indicated that different approaches were required to address the needs of FIU’s largely commuter student body, a number of whom work many hours a week. Existing institutional resources were augmented by a Title V grant to increase student retention and participation in the Building Engagement and Attainment for Minority Students (BEAMS) project, which provided further campus visibility and national support to the effort through consultant input and two conferences.
Extensive programmatic initiatives have resulted. For example, learning communities staffed by faculty and peer mentors have been expanded to include summer entrants which comprise nearly half of beginning freshman cohorts. Transfer student orientation and advising have been enhanced. A major faculty development effort is underway to showcase how to increase student engagement in the learning process. A host of online student support tools are now available, including online live tutoring in math, statistics and composition, eMentoring, student-initiated online study groups and project teams, and mini-movies providing 24/7 supplementary instruction. These services are made easily accessible to students through a new Web network called the Virtual Student Center (www.fiu.edu/~vsc) which was developed as part of FIU’s participation in the BEAMS project. Taken together, these efforts appear to have made a difference in student engagement, an increase in four-year graduation rates (17% to 24%), and an enhanced faculty awareness of their vital role in student success.
University of Northern Kentucky
The University of Northern Kentucky (UNK) has administered NSSE four times. Each year, the results are reviewed by various departments and programs for setting priorities, recruiting, assessment, and program improvement. For example, the academic advising office uses NSSE data extensively to improve its services to all students and faculty advisors who need assistance in helping
students who are experiencing difficulty to get timely intervention to improve their chances of success. NSSE data also have been employed in discussions about developing a new and different approach to general education at UNK, as faculty examine the relative strengths and weaknesses of the program from the student’s perspective. In addition, both the first-year experiences program and the undergraduate research program housed in the Office of Sponsored Programs use student engagement data to assess whether students are benefiting from these programs in the intended ways. Finally, NSSE findings have informed the University’s strategic planning process to discern strengths, weaknesses, opportunities, and threats from a student perspective. As a predominantly undergraduate residential institution, UNK considers NSSE data to be indispensible to effective planning and it intends to continue using it to develop and implement action plans based on the institutional strategic plan.
Student Services
Rhodes College
At Rhodes College, a multi-disciplinary team of staff and faculty is redesigning student services “to create exceptional and memorable connections that delight students and make a critical difference in their Rhodes experience.” The team used NSSE and FSSE results with data from a student satisfaction inventory, and surveys and focus groups of student leaders, faculty, and staff. Combining those data with breakthrough planning tools, the team uncovered specific disconnects in service delivery that negatively affected students and determined that
Rhodes College
National Survey of Student Engagement | Annual Report 2007 ���� National Survey of Student Engagement | Annual Report 2007 National Survey of Student Engagement | Annual Report 2007 ���� National Survey of Student Engagement | Annual Report 2007
the level of support for students provided by the institution was inconsistent with its high level of academic challenge. To make its services more student-centered, Rhodes introduced the College’s first-ever summer orientation and a new events management process and system. Student services staff and faculty members are working with architects to renovate the former library building to be the new Burrow Student Services Center, which will house several interconnected service hubs intended to support student success, including admissions and financial aids, student development and academic services, career services, and student organization support.
Using NSSE in Accreditation
Institutions can document their educational effectiveness and provide indirect evidence of student learning using their NSSE results. To demonstrate what institutional practices contribute to undergraduate education, about one third of NSSE users have incorporated student engagement results into their accreditation self-studies. Institutions have also used NSSE to benchmark effective practice, to demonstrate improvements resulting from assessment, and to guide future institutional improvement initiatives.
Accrediting agencies are the primary external group with which schools share NSSE results. The Accreditation Toolkits, available at www.nsse.iub.edu/institute/?view=tools/accred, are specific to the six regional accreditation bodies and provide suggestions for incorporating student engagement results into accreditation reviews with an emphasis on mapping NSSE results to regional accreditation standards. The toolkits were updated in 2007 to reflect changes in regional standards and include new examples of how institutions in each region have used NSSE in their accreditation efforts. Finally, we have revised sample timelines to help institutions decide when and how often to collect student engagement data for integration into their accreditation process.
The following examples provide a flavor for how institutions are using student engagement data in the accreditation process.
College of Charleston
Prepared in March 2007 for the Southern Association of Colleges and Schools (SACS), the College of Charleston’s (C of C) Quality Enhancement Plan (QEP), Going Further Faster: College of Charleston’s First Year Experience, focuses on improving the first-year experience to support overall enhancement and redesign of the institution’s general education program. Central to C of C’s mission is its strong liberal arts and sciences tradition. Faculty participated in a series of discussions to define what this means at
this point in time. Their conclusions affirmed a deep commitment to liberal arts education goals:
1. A student-centered focus that highly values student-faculty interaction.
2. Student learning contains a core of common outcomes based on common requirements.
3. Professional education is enhanced by the common core that students acquire.
A major initiative of the redesign was to develop a new common core for the general education program. The initial phase of this process included analyses of results to identify where first-year students had scored above and below average on the NSSE benchmarks of effective educational practice. These analyses were then integrated with other internal and national assessment tools.
In addition to a new common core, The First-year Experience plan of the QEP includes the creation of Learning Communities and First-Year Seminars. Students can choose between the two curricular options enhanced by orientation, advising, residence life, and programs provided by other student support groups. C of C believes that Learning Communities will foster interdisciplinary study, student interaction with faculty and each other, service learning and assignments to develop writing and reading skills, thereby providing numerous opportunities for students to integrate their social and academic experiences. NSSE results will be used as an indirect assessment tool to track improvements in many of these areas as well as student awareness of library and academic support services.
Using NSSE Data (continued)
Kennesaw State University
Kennesaw State’s (KSU) Quality Enhancement Plan (QEP) for 2007-2012, “Global Learning for Engaged Citizenship” is a “five-year plan …to raise global learning to the top tier of KSU’s educational priorities and outcomes.” The plan relies heavily on longitudinal
“Studentengagementispartofourstrategic planandwoventhroughourQuality EnhancementPlanforthereaffirmationof ouraccreditationthroughSACS,‘Engaging StudentsinaCultureofScholarship.’”
— John T. Masterson, Executive Vice President and Provost, Texas Lutheran University
National Survey of Student Engagement | Annual Report 2007 ���� National Survey of Student Engagement | Annual Report 2007 National Survey of Student Engagement | Annual Report 2007 ���� National Survey of Student Engagement | Annual Report 2007
assessment of NSSE data as well as “nuggets” from 2005 NSSE results to provide baseline evidence of KSU’s impact on student learning outcomes. KSU’s QEP contains ten goals with related action plans and strategies for assessing progress. For example, analyses of NSSE scores from 2004, 2005, and 2006, indicated that KSU students did not study abroad, experience diversity, or study foreign language at the desired levels to attain KSU’s global learning goals. Goals 1-9 of the plan concentrate on strengthening leadership, financial, and infrastructure commitments “to the promotion and interaction of visibility and awareness of the importance of global learning,” and to enhancing student success programs. The action plan for Goal 10, “Campus-wide Engagement in Global Learning Will Increase Greatly,” focuses on assessing the summative impact of Goals 1-9 and includes biennial participation in NSSE through 2012. Survey responses of KSU seniors will be used for trend analysis and to show gains in targeted areas.
St. John’s University (NY)
Over the past ten years, St. John’s University has focused on creating a culture of assessment in academic areas as well as in operations and student services. As part of its self-study for reaccreditation from the Middle States Commission and to support the four goals of its current strategic plan, St. John’s has formalized using a variety of instruments including NSSE and FSSE to assess the effectiveness of its educational environment. Specifically, data for the five NSSE benchmarks are used over time to study the quality of the student learning experience under Goal I, “Develop our Academic and Institutional Culture to be Student-Centered and Committed to Lifelong Learning.” NSSE data on student involvement in community service, and student responses to survey questions related to personal values and ethics are used to assess how well St. John’s is fulfilling its Vincentian mission. In addition, data collected from the NSSE survey on student- and course-related use of technology provide evidence that St. John’s supports and fosters student proficiency in computer-related skills.
The University of Texas at Arlington
The University of Texas at Arlington (UTA) used its NSSE and FSSE results to identify the key issues to be addressed in developing its QEP for SACS. For example, a gap between faculty and students in their perception of active learning (the focus of the QEP) was revealed. This analysis, along with other institutional assessments, led to the conclusion that systematic, university-wide intervention in the classroom would enhance students’ ability to make better use of current active learning efforts put forth by faculty. UTA also uses NSSE to examine the impact of the 12 pilot projects in its QEP on the development of higher order thinking skills among students. Annual NSSE testing will include an oversample of the students
in these pilot project classes in order to (1) help assess the impact of active learning pedagogies, and (2) compare the results against students who were in classes that did not employ extensive active learning techniques.
Marywood University (PA)
The theme for Marywood University’s 2004-05 self-study for the Middle States Commission on Higher Education (MSCHE) was “becoming a university.” After the MSCHE accreditation visit in 1996, Marywood’s president called for expanded assessment activity headed up by the Institutional Research and Planning Office. An Outcomes Assessment Group (OAG) made up of deans, faculty members, and administrators used NSSE data as one of several assessment tools to provide evidence that Marywood supported an effective learning environment and to examine how attaining university status affected academic standards. When major restructuring was finalized in 2003, the new self-study was well-timed to assess the effectiveness of these initiatives and institutional changes. The goals of the 2004-05 self-study were to: “(1) integrate the self-study with institutional planning and assessment activities, (2) evaluate the progress Marywood has made in becoming a university, and (3) identify vital issues, resources, and expectations for the future to provide input for the next stage of strategic planning.” (Marywood Self-Study Report, p.1).
NSSE Results Used for Specific MSCHE StandardsNSSE results were particularly useful as evidence to support several standards in Marywood’s self-study report. For example:
Standard 1- Mission, Goals and Objectives A major component of Marywood’s mission is to provide a “welcoming community” for students. Student satisfaction with institutional support of co-curricular activities, orientation events to acclimate new students, special departmental programs, and active involvement of the community is reflected in Marywood’s 2004 NSSE results. In the same year, Marywood also participated in a NSSE consortium of Catholic colleges. A “Mission Perception Inventory” (MPI) of 17 additional items to assess students’ awareness of institutional mission was added to the standard NSSE survey. The 2004MissionPerceptionInventoryReport used transcripts and NSSE scores as evidence of student awareness of the value of outside of classroom experiences, service learning, and volunteering. The success of Marywood’s focus on community is reflected as well in Marywood’s retention and completion rates.
National Advisory Board
�� National Survey of Student Engagement | Annual Report 2007
The NSSE Institute for Effective Educational Practice assists institutions and other organizations in using student engagement data to improve student learning and institutional effectiveness. Since its inception in 2003, NSSE Institute associates have completed a major national study of high-performing colleges and universities, made dozens of presentations at national and regional meetings, worked with several campuses to enhance student success, and held seven NSSE Users Workshops.
Assistance to Institutions, State Systems, and Organizations
Working with institutions, state systems, and organizations helps advance the productive use of student engagement data and related information and allows NSSE staff to gain first-hand accounts of how campuses and systems use NSSE results. In the past year, NSSE Institute associates have:
• Designed several half-day workshops and day-long retreats with administrators of several universities in the US and Canada to review their NSSE and FSSE data and identify institutional policies and practices that promote and inhibit student persistence and academic success.
• Reviewed student engagement data with small groups of faculty, administrators, and staff at colleges and universities to identify areas where the institutions could focus to improve student engagement.
• Presented a workshop at a system-level conference for faculty members interested in using NSSE data in their scholarship of teaching projects.
• Conducted a workshop on effective educational practice, assessment, and using NSSE and FSSE data for institutional teams at two state system conferences on student engagement.
• Worked with teams from dozens of colleges and universities that participated in regional workshops (Texas, Illinois, Florida, Oklahoma, Connecticut, Kansas, and Nevada) on using NSSE and FSSE results for accreditation and institutional improvement initiatives.
User Workshops
The Spring NSSE Users Workshop co-hosted by Wichita State University, Friends University, and Newman University, was held on April 19-20, 2007, on the Wichita State campus. The event drew 78 institutional representatives from 32 colleges and universities and included faculty, staff, and administrators with commitments and responsibilities for enhancing the quality of the undergraduate learning experience. The sessions focused on topics such as using NSSE data for new and experienced users,
multiple-year analyses of NSSE data, student response rate and nonresponse error, the characteristics and level of engagement of students at urban universities, and ways to compare NSSE and FSSE data. Workshop participants also took advantage of opportunities for individual consultations with NSSE staff.
The fall workshop was held at the University of Nevada, Reno, on Tues. and Wed., October 16-17, 2007. Presentations from the workshop are available on the NSSE Institute Web site, www.nsse.iub.edu/institute/index.cfm?view=services/workshops/index.
NSSE Institute for Effective Educational Practice
Using NSSE Data to Achieve Positive Outcomes in Student AffairsStudent affairs professionals are using NSSE data to:
1) Learn more about students’ views of the learning environment by year in school, commuter or residential status, and racial and ethnic background.
2) Identify shortfalls in student engagement to address through strategic planning initiatives.
3) Inform efforts to support first-year students’ transition to college through summer advising and orientation.
How can student affairs staff benefit from NSSE data? Consider the following examples:
Bellarmine University student affairs staff used NSSE data to learn about students’ experiences with its internship programs. First-year students indicated they wanted to do internships, but seniors reported having not completed one. Knowing about students’ interests helped the campus realize there were gaps in communicating about these opportunities. More campus advertising and overall focus on the internship program have increased participation.
At Western Oregon University, many residential students left campus each weekend, creating the ubiquitous “suitcase” effect. Because NSSE was administered to all students (residential and off-campus), administrators were able to examine item-level results to identify ways to encourage residential and commuter students to stay on campus by augmenting popular programming and eliminating outdated initiatives.
Northern Arizona University residence life staff wanted to compare and contrast the experiences of residents in a living-learning center versus more traditional housing. The institution requested an oversample to include students living in learning communities to monitor success of the interventions.
DEEP Practice Briefs
Presidents, senior academic affairs and student affairs administrators, faculty members, and governing boards often have little time to read volumes of materials, even when they offer practical advice. For this reason, we have prepared more than a dozen briefs: four-page documents that summarize key findings from the strong-performing colleges in the Documenting Effective Educational Practice (DEEP) Project for specific campus audiences. DEEP Practice Briefs can be downloaded from the NSSE Web site: www.nsse.iub.edu/institute/index.cfm?view=deep/briefs.
Sharing NSSE Results in Admissions and with Prospective Students
The NSSE Pocket Guide to Choosing a College was created to help prospective college students and their families ask important questions during the college search and decision-making process. This year we introduced a new one-page report, “What Students Are Saying About Their...Experience.” This report displays institutions’ NSSE 2007 results in an accessible, attractive format that aligns with questions posed in the Pocket Guide. The Pocket Guide and the report may be of particular interest to admissions professionals. College admission offices may request up to 300 free Pocket Guides per year.
In addition to being a helpful tool in college admissions, this initiative is designed to promote and facilitate public reporting of NSSE results. More details and a PDF version of the guide are available on the NSSE Web site, www. nsse.iub.edu/html/pocket_guide_intro.cfm.
New NSSE User Tool: Contextualizing Your NSSE Data
A new resource is available for institutional researchers and administrative staff to facilitate use of their NSSE data. A Guide to Contextualizing Your NSSE Data: Cognitive Interviews and Focus Groups outlines how to use adapted qualitative survey design and development techniques such as cognitive research testing and focus groups to provide a more contextualized understanding of survey responses. This step-by-step guide to conducting cognitive interviews and focus groups can help institutions develop a deeper understanding of their NSSE data. The guide is available on the NSSE Web site: www.nsse.iub.edu/pdf/Cognitive_interviews_facilitation_guide.pdf.
Updated Accreditation Toolkits
One of the most common institutional uses of NSSE data is for accreditation. NSSE data can be used in all components of the accreditation process: self-studies, during visits by peer
evaluators, and in response to accrediting body requests for improvement or additional evidence of student learning. The NSSE Accreditation Toolkits suggest ways to map specific items from the NSSE instrument to regional accreditation board standards. The toolkits were updated in 2007 to reflect changes in the standards for several regional accrediting organizations and to include recent examples of how institutions have used their NSSE data for accreditation. NSSE Institute staff are also creating accreditation toolkits that map NSSE survey items to specialized, professional accreditation standards, including the National Council for Accreditation of Teacher Education (NCATE), the Association to Advance Collegiate Schools of Business (AACSB), and the Accreditation Board for Engineering and Technology (ABET).
Research Initiatives
Two research initiatives funded by the Teagle Foundation are designed to advance assessment in undergraduate education. The first project will provide insights into faculty-driven assessment approaches that promote rigorous, systematic assessment of the quality of undergraduate education in the liberal arts, and document the use of existing assessment models and tools in liberal arts colleges to develop a culture of evidence on campus. The second project, Assessing Deep Approaches to Learning, is a Teagle Improved Assessment Methods Grant aimed at establishing the relationships between deep approaches to learning, critical thinking skills and dispositions, and reflective judgment. The NSSE survey, which contains a measure of deep approaches to learning, is being administered along with the California Critical Thinking Skills Test, the California Critical Thinking Disposition Inventory, and the Reasoning about Current Issues Test at Indiana University Bloomington and two other campuses. The project will help validate a component of the NSSE instrument by connecting deep learning processes to valued educational outcomes.
Getting Faculty Better Acquainted with NSSE Data
WorkingwithNSSEData:AFacilitator’sGuide is an instructional manual designed to help institutional leaders share NSSE data with campus stakeholders. Sharing of results at retreats, professional development workshops, and task force meetings can help faculty and staff better understand, interpret and act on NSSE data. Copies of the Facilitator’s Guide are available on the NSSE Web site, www.nsse.iub.edu/pdf/Facilitators%20Guide%202006.pdf.
National Survey of Student Engagement | Annual Report 2007 ��
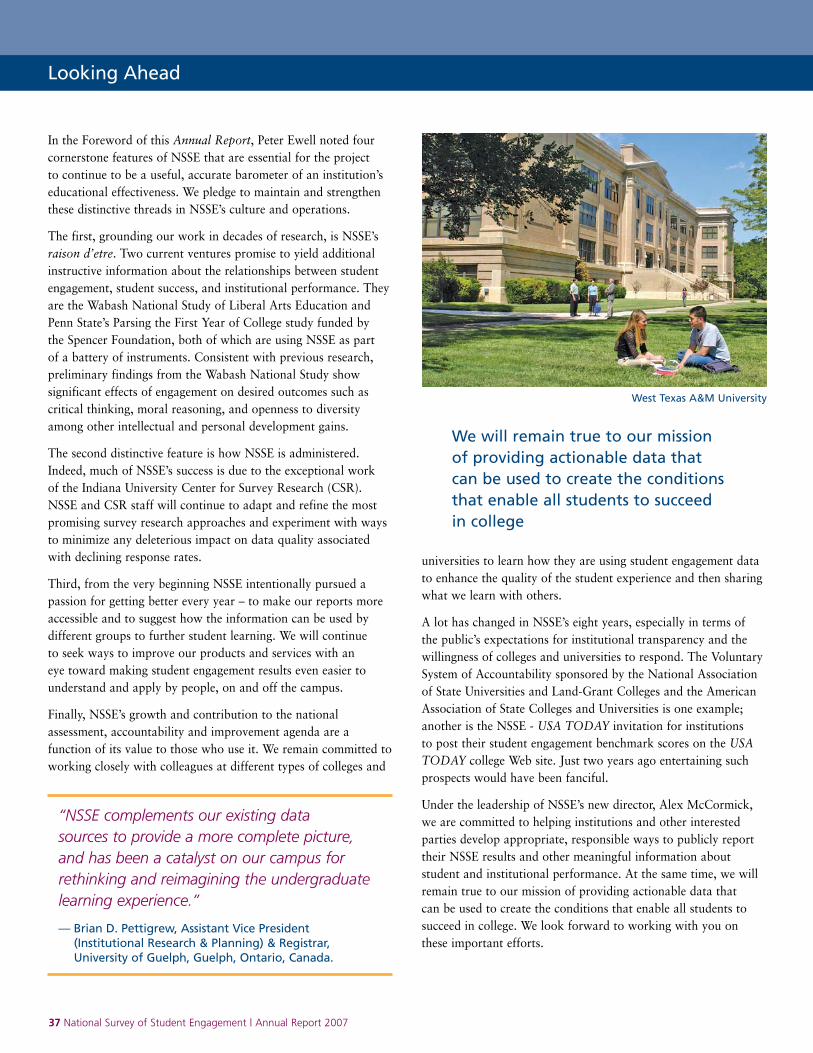
National Survey of Student Engagement | Annual Report 2007 ���� National Survey of Student Engagement | Annual Report 2007 National Survey of Student Engagement | Annual Report 2007 ���� National Survey of Student Engagement | Annual Report 2007
In the Foreword of this Annual Report, Peter Ewell noted four cornerstone features of NSSE that are essential for the project to continue to be a useful, accurate barometer of an institution’s educational effectiveness. We pledge to maintain and strengthen these distinctive threads in NSSE’s culture and operations.
The first, grounding our work in decades of research, is NSSE’s raison d’etre. Two current ventures promise to yield additional instructive information about the relationships between student engagement, student success, and institutional performance. They are the Wabash National Study of Liberal Arts Education and Penn State’s Parsing the First Year of College study funded by the Spencer Foundation, both of which are using NSSE as part of a battery of instruments. Consistent with previous research, preliminary findings from the Wabash National Study show significant effects of engagement on desired outcomes such as critical thinking, moral reasoning, and openness to diversity among other intellectual and personal development gains.
The second distinctive feature is how NSSE is administered. Indeed, much of NSSE’s success is due to the exceptional work of the Indiana University Center for Survey Research (CSR). NSSE and CSR staff will continue to adapt and refine the most promising survey research approaches and experiment with ways to minimize any deleterious impact on data quality associated with declining response rates.
Third, from the very beginning NSSE intentionally pursued a passion for getting better every year – to make our reports more accessible and to suggest how the information can be used by different groups to further student learning. We will continue to seek ways to improve our products and services with an eye toward making student engagement results even easier to understand and apply by people, on and off the campus.
Finally, NSSE’s growth and contribution to the national assessment, accountability and improvement agenda are a function of its value to those who use it. We remain committed to working closely with colleagues at different types of colleges and
universities to learn how they are using student engagement data to enhance the quality of the student experience and then sharing what we learn with others.
A lot has changed in NSSE’s eight years, especially in terms of the public’s expectations for institutional transparency and the willingness of colleges and universities to respond. The Voluntary System of Accountability sponsored by the National Association of State Universities and Land-Grant Colleges and the American Association of State Colleges and Universities is one example; another is the NSSE - USA TODAY invitation for institutions to post their student engagement benchmark scores on the USA TODAY college Web site. Just two years ago entertaining such prospects would have been fanciful.
Under the leadership of NSSE’s new director, Alex McCormick, we are committed to helping institutions and other interested parties develop appropriate, responsible ways to publicly report their NSSE results and other meaningful information about student and institutional performance. At the same time, we will remain true to our mission of providing actionable data that can be used to create the conditions that enable all students to succeed in college. We look forward to working with you on these important efforts.
Looking Ahead
We will remain true to our mission of providing actionable data that can be used to create the conditions that enable all students to succeed in college
West Texas A&M University
“NSSEcomplementsourexistingdata sourcestoprovideamorecompletepicture, andhasbeenacatalystonourcampusfor rethinkingandreimaginingtheundergraduate learningexperience.”
— Brian D. Pettigrew, Assistant Vice President (Institutional Research & Planning) & Registrar, University of Guelph, Guelph, Ontario, Canada.
National Survey of Student Engagement | Annual Report 2007 ���� National Survey of Student Engagement | Annual Report 2007 National Survey of Student Engagement | Annual Report 2007 ���� National Survey of Student Engagement | Annual Report 2007
References Davis, C., Ginorio, A. B., Hollenshead C. S., Lazarus, B. B., Rayman, P. M., & Associates. (1996). The equity equation: Fostering the advancement of women in the sciences, mathematics, and engineering. San Francisco: Jossey-Bass.
Friedman, T. L. (2005). The world is flat: A brief history of the twenty-first century. New York: Farrar, Straus and Giroux.
Kuh, Kinzie, Schuh, Whitt & Associates (2005). Student success in college: Creating conditions that matter. San Francisco: Jossey-Bass.
Nelson, D. J. & Rogers, D.C. (2004). An Analysis of Diversity in Science and Education Faculties at Research Universities. Available: http://www.now.org/issues/diverse/diversity_report.pdf
Nelson Laird, T. F., Shoup, R., & Kuh, G. D. (2006). Measuring deep approaches to learning using the National Survey of Student Engagement. Paper presented at the Annual Forum of the Association for Institutional Research, May, 2006, Chicago, IL.
Roberts, T. (1991). Gender and influence of evaluations on self-assessments in achievement settings. Psychological Bulletin, 109, 297-308.
Roberts, T., & Nolen-Hoeksema, S. (1989). Sex differences in reaction to evaluative feedback. Sex Roles, 21, 725-747.
Sax L. J. (1994). Mathematical self-concept: How college reinforces the gender gap. Research in Higher Education, 35(2), 141–166
Related Resources: Chickering, A.W. (2006). Every student can learn if … About Campus, 11(2), 9-15.
Kinzie, J., & Kuh, G.D. (2004). Going DEEP: Learning from campuses that share responsibility for student success. About Campus, 9(5), 2-8.
Kuh, G.D. (2004). Forging a new direction: How UTEP created its own brand of excellence. About Campus, 9(5), 9-15.
Kuh, G.D. (2005). 7 steps for taking student learning seriously. Trusteeship, 13(3), 20-24.
Kuh, G.D., Kinzie, J., Buckley, J., Bridges, B.K., & Hayek, J.C. (2007). Piecing together the student success puzzle: Research, propositions, and recommendations. ASHE Higher Education Report, 32(5). San Francisco: Jossey-Bass.
Kuh, G.D., Kinzie, J., Cruce, T., Shoup, R., & Gonyea, R.M. (2006, July). Connecting the dots: Multifaceted analyses of the relationships between student engagement results from the NSSE and the institutional policies and conditions that foster student success. Final report to Lumina Foundation for Education. Bloomington, IN: Indiana University Center for Postsecondary Research.
Kuh, G.D., Kinzie, J., Schuh, J.H., & Whitt, E. J. (2005). Assessing conditions to enhance educational effectiveness: The Inventory for Student Engagement and Success. San Francisco: Jossey-Bass.
Kuh, G.D., Kinzie, J., Schuh, J.H., & Whitt, E.J. (2005). Never let it rest: Lessons about student success from high-performing colleges and universities. Change, 37(4), 44-51.
Whitt, E.J. (2006). Are all of your educators educating? About Campus, 10(6), 2-9.
For a list of research articles, conference presentations, and other works, see www.nsse.iub.edu/html/researchers.cfm.
Supporting Materials
Friends University
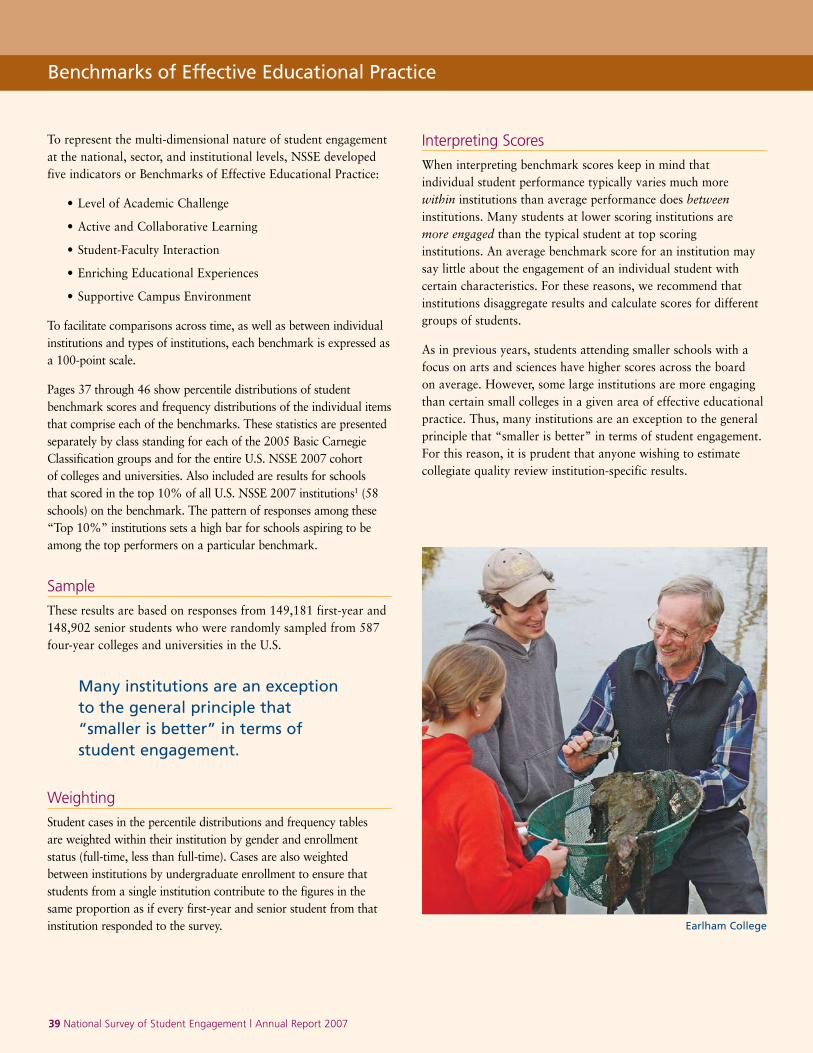
Percentile First-Year Students
Benchmark Scores First-Year Students
Benchmarks of Effective Educational Practice (continued)
Percentile Seniors
Benchmark Scores Seniors
100
90
80
70
60
50
40
30
20
10
0
Benc
hmar
k Sc
ores
DRU-VH
95th Percentile
75th Percentile
25th Percentile
5th Percentile
50th Percentile(Median)
59
Guide to Benchmark Figures
First-Year Students
Seniors
Key
�� National Survey of Student Engagement | Annual Report 2006
�� National Survey of Student Engagement | Annual Report 2007
To represent the multi-dimensional nature of student engagement at the national, sector, and institutional levels, NSSE developed five indicators or Benchmarks of Effective Educational Practice:
• Level of Academic Challenge
• Active and Collaborative Learning
• Student-Faculty Interaction
• Enriching Educational Experiences
• Supportive Campus Environment
To facilitate comparisons across time, as well as between individual institutions and types of institutions, each benchmark is expressed as a 100-point scale.
Pages 37 through 46 show percentile distributions of student benchmark scores and frequency distributions of the individual items that comprise each of the benchmarks. These statistics are presented separately by class standing for each of the 2005 Basic Carnegie Classification groups and for the entire U.S. NSSE 2007 cohort of colleges and universities. Also included are results for schools that scored in the top 10% of all U.S. NSSE 2007 institutions1 (58 schools) on the benchmark. The pattern of responses among these “Top 10%” institutions sets a high bar for schools aspiring to be among the top performers on a particular benchmark.
Sample
These results are based on responses from 149,181 first-year and 148,902 senior students who were randomly sampled from 587 four-year colleges and universities in the U.S.
Weighting
Student cases in the percentile distributions and frequency tables are weighted within their institution by gender and enrollment status (full-time, less than full-time). Cases are also weighted between institutions by undergraduate enrollment to ensure that students from a single institution contribute to the figures in the same proportion as if every first-year and senior student from that institution responded to the survey.
Interpreting Scores
When interpreting benchmark scores keep in mind that individual student performance typically varies much more within institutions than average performance does between institutions. Many students at lower scoring institutions are more engaged than the typical student at top scoring institutions. An average benchmark score for an institution may say little about the engagement of an individual student with certain characteristics. For these reasons, we recommend that institutions disaggregate results and calculate scores for different groups of students.
As in previous years, students attending smaller schools with a focus on arts and sciences have higher scores across the board on average. However, some large institutions are more engaging than certain small colleges in a given area of effective educational practice. Thus, many institutions are an exception to the general principle that “smaller is better” in terms of student engagement. For this reason, it is prudent that anyone wishing to estimate collegiate quality review institution-specific results.
Many institutions are an exception to the general principle that “smaller is better” in terms of student engagement.
Benchmarks of Effective Educational Practice
Earlham College
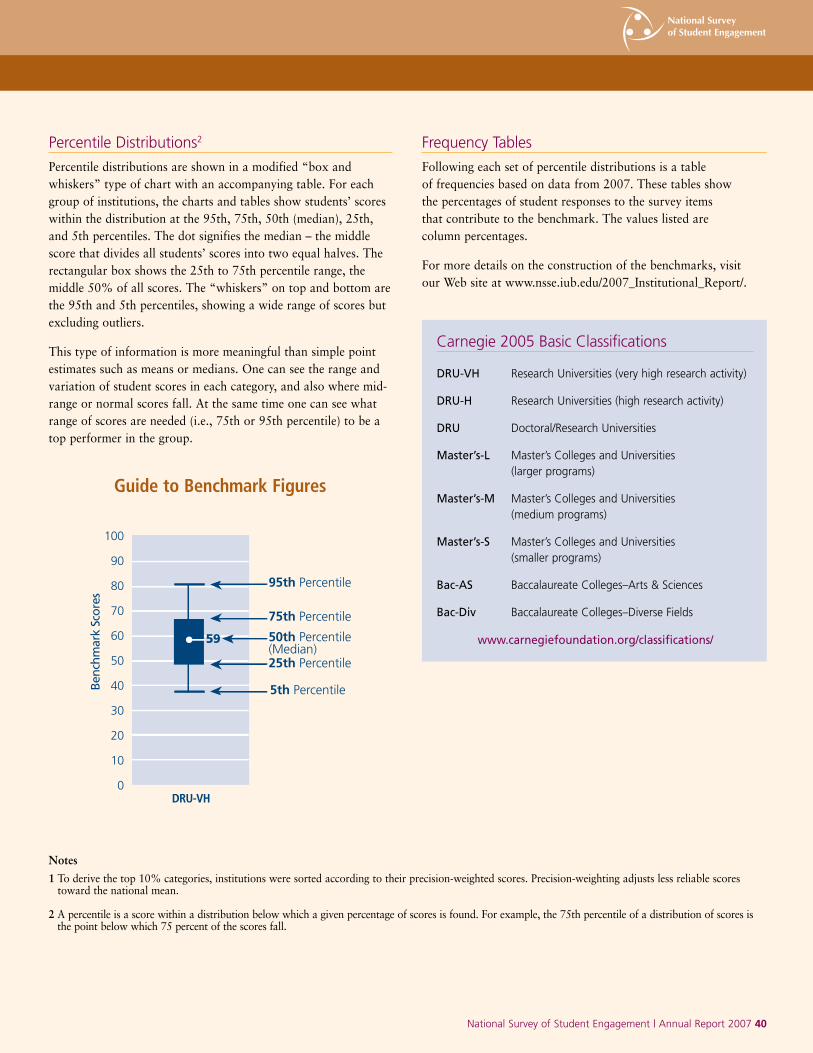
Percentile Distributions2
Percentile distributions are shown in a modified “box and whiskers” type of chart with an accompanying table. For each group of institutions, the charts and tables show students’ scores within the distribution at the 95th, 75th, 50th (median), 25th, and 5th percentiles. The dot signifies the median – the middle score that divides all students’ scores into two equal halves. The rectangular box shows the 25th to 75th percentile range, the middle 50% of all scores. The “whiskers” on top and bottom are the 95th and 5th percentiles, showing a wide range of scores but excluding outliers.
This type of information is more meaningful than simple point estimates such as means or medians. One can see the range and variation of student scores in each category, and also where mid-range or normal scores fall. At the same time one can see what range of scores are needed (i.e., 75th or 95th percentile) to be a top performer in the group.
100
90
80
70
60
50
40
30
20
10
0
Benc
hmar
k Sc
ores
DRU-VH
95th Percentile
75th Percentile
25th Percentile
5th Percentile
50th Percentile(Median)
59
Guide to Benchmark Figures
National Survey of Student Engagement | Annual Report 2007 �0
Carnegie 2005 Basic Classifications
www.carnegiefoundation.org/classifications/
Notes
1 To derive the top 10% categories, institutions were sorted according to their precision-weighted scores. Precision-weighting adjusts less reliable scores toward the national mean.
2 A percentile is a score within a distribution below which a given percentage of scores is found. For example, the 75th percentile of a distribution of scores is the point below which 75 percent of the scores fall.
Frequency Tables
Following each set of percentile distributions is a table of frequencies based on data from 2007. These tables show the percentages of student responses to the survey items that contribute to the benchmark. The values listed are column percentages.
For more details on the construction of the benchmarks, visit our Web site at www.nsse.iub.edu/2007_Institutional_Report/.
DRU-VH Research Universities (very high research activity)
DRU-H Research Universities (high research activity)
DRU Doctoral/Research Universities
Master’s-L Master’s Colleges and Universities (larger programs)
Master’s-M Master’s Colleges and Universities (medium programs)
Master’s-S Master’s Colleges and Universities (smaller programs)
Bac-AS Baccalaureate Colleges–Arts & Sciences
Bac-Div Baccalaureate Colleges–Diverse Fields

Percentile First-Year Students
Benchmark Scores First-Year Students
Benchmarks of Effective Educational Practice (continued)
Percentile Seniors
Benchmark Scores Seniors
100
90
80
70
60
50
40
30
20
10
0
Benc
hmar
k Sc
ores
DRU-VH
95th Percentile
75th Percentile
25th Percentile
5th Percentile
50th Percentile(Median)
59
Guide to Benchmark Figures
First-Year Students
Seniors
Key
�� National Survey of Student Engagement | Annual Report 2006
Level of Academic Challenge
DRU-VH DRU-H DRU Master’s-L Master’s-M Master’s-S Bac-AS Bac-DIV Top 10% NSSE 2007
95th % 78 78 79 79 78 80 81 79 84 78
75th % 64 65 67 66 66 67 70 66 73 65
Median 55 55 56 56 56 57 60 56 64 56
25th % 45 46 46 46 47 48 51 46 54 46
5th % 32 32 32 32 32 34 37 32 40 32
Percentiles Seniors
DRU-VH DRU-H DRU Master’s-L Master’s-M Master’s-S Bac-AS Bac-DIV Top 10% NSSE 2007
51 52 51 5253 5658
51 51 51
DRU-VH DRU-H DRU Master’s-L Master’s-M Master’s-S Bac-AS Bac-DIV Top 10% NSSE 2007
55 56 56 5760
56 56 56
64
55
Benchmark Scores Seniors
100
90
80
70
60
50
40
30
20
10
0
Benc
hmar
k Sc
ores
DRU-VH
95th Percentile
75th Percentile
25th Percentile
5th Percentile
50th Percentile(Median)
59
Guide to Benchmark Figures
First-Year Students
Seniors
Key
Challenging intellectual and creative work is central to student learning and collegiate quality. Colleges and univer-sities promote high levels of student achievement by setting high expectations for student performance.
DRU-VH DRU-H DRU Master’s-L Master’s-M Master’s-S Bac-AS Bac-DIV Top 10% NSSE 2007
95th % 73 73 74 73 74 74 77 73 78 74
75th % 60 60 62 60 60 62 65 61 67 61
Median 51 51 52 51 51 53 56 51 58 52
25th % 43 43 43 42 42 44 47 42 49 43
5th % 31 30 30 29 29 30 34 29 37 30
Percentiles First-Year Students
DRU-VH DRU-H DRU Master’s-L Master’s-M Master’s-S Bac-AS Bac-DIV Top 10% NSSE 2007
51 52 51 5253 5658
51 51 51
DRU-VH DRU-H DRU Master’s-L Master’s-M Master’s-S Bac-AS Bac-DIV Top 10% NSSE 2007
55 56 56 5760
56 56 56
64
55
Benchmark Scores First-Year Students
�� National Survey of Student Engagement | Annual Report 2007
Benchmarks of Effective Educational Practice (continued)
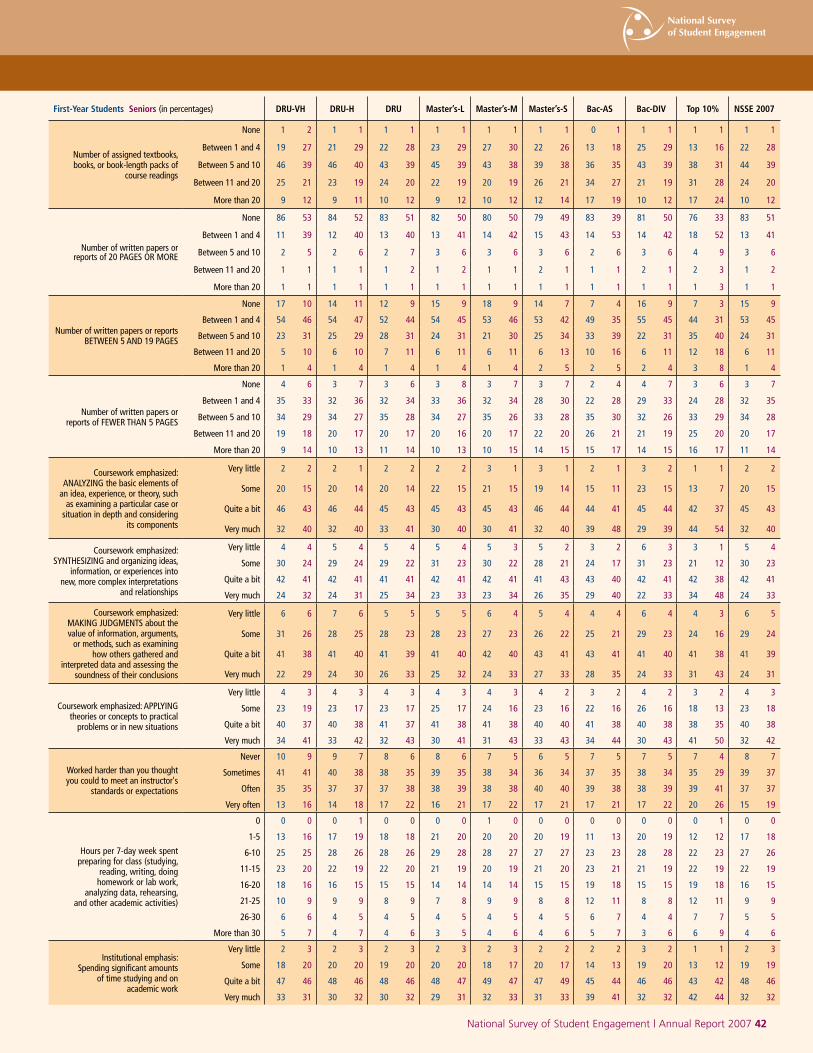
First-Year Students Seniors (in percentages) DRU-VH DRU-H DRU Master’s-L Master’s-M Master’s-S Bac-AS Bac-DIV Top 10% NSSE 2007
Number of assigned textbooks, books, or book-length packs of
course readings
None 1 2 1 1 1 1 1 1 1 1 1 1 0 1 1 1 1 1 1 1
Between 1 and 4 19 27 21 29 22 28 23 29 27 30 22 26 13 18 25 29 13 16 22 28
Between 5 and 10 46 39 46 40 43 39 45 39 43 38 39 38 36 35 43 39 38 31 44 39
Between 11 and 20 25 21 23 19 24 20 22 19 20 19 26 21 34 27 21 19 31 28 24 20
More than 20 9 12 9 11 10 12 9 12 10 12 12 14 17 19 10 12 17 24 10 12
Number of written papers or reports of 20 PAGES OR MORE
None 86 53 84 52 83 51 82 50 80 50 79 49 83 39 81 50 76 33 83 51
Between 1 and 4 11 39 12 40 13 40 13 41 14 42 15 43 14 53 14 42 18 52 13 41
Between 5 and 10 2 5 2 6 2 7 3 6 3 6 3 6 2 6 3 6 4 9 3 6
Between 11 and 20 1 1 1 1 1 2 1 2 1 1 2 1 1 1 2 1 2 3 1 2
More than 20 1 1 1 1 1 1 1 1 1 1 1 1 1 1 1 1 1 3 1 1
Number of written papers or reports BETWEEN 5 AND 19 PAGES
None 17 10 14 11 12 9 15 9 18 9 14 7 7 4 16 9 7 3 15 9
Between 1 and 4 54 46 54 47 52 44 54 45 53 46 53 42 49 35 55 45 44 31 53 45
Between 5 and 10 23 31 25 29 28 31 24 31 21 30 25 34 33 39 22 31 35 40 24 31
Between 11 and 20 5 10 6 10 7 11 6 11 6 11 6 13 10 16 6 11 12 18 6 11
More than 20 1 4 1 4 1 4 1 4 1 4 2 5 2 5 2 4 3 8 1 4
Number of written papers or reports of FEWER THAN 5 PAGES
None 4 6 3 7 3 6 3 8 3 7 3 7 2 4 4 7 3 6 3 7
Between 1 and 4 35 33 32 36 32 34 33 36 32 34 28 30 22 28 29 33 24 28 32 35
Between 5 and 10 34 29 34 27 35 28 34 27 35 26 33 28 35 30 32 26 33 29 34 28
Between 11 and 20 19 18 20 17 20 17 20 16 20 17 22 20 26 21 21 19 25 20 20 17
More than 20 9 14 10 13 11 14 10 13 10 15 14 15 15 17 14 15 16 17 11 14
Coursework emphasized: ANALYZING the basic elements of
an idea, experience, or theory, such as examining a particular case or
situation in depth and considering its components
Very little 2 2 2 1 2 2 2 2 3 1 3 1 2 1 3 2 1 1 2 2
Some 20 15 20 14 20 14 22 15 21 15 19 14 15 11 23 15 13 7 20 15
Quite a bit 46 43 46 44 45 43 45 43 45 43 46 44 44 41 45 44 42 37 45 43
Very much 32 40 32 40 33 41 30 40 30 41 32 40 39 48 29 39 44 54 32 40
Coursework emphasized: SYNTHESIZING and organizing ideas,
information, or experiences into new, more complex interpretations
and relationships
Very little 4 4 5 4 5 4 5 4 5 3 5 2 3 2 6 3 3 1 5 4
Some 30 24 29 24 29 22 31 23 30 22 28 21 24 17 31 23 21 12 30 23
Quite a bit 42 41 42 41 41 41 42 41 42 41 41 43 43 40 42 41 42 38 42 41
Very much 24 32 24 31 25 34 23 33 23 34 26 35 29 40 22 33 34 48 24 33
Coursework emphasized: MAKING JUDGMENTS about the value of information, arguments,
or methods, such as examining how others gathered and
interpreted data and assessing the soundness of their conclusions
Very little 6 6 7 6 5 5 5 5 6 4 5 4 4 4 6 4 4 3 6 5
Some 31 26 28 25 28 23 28 23 27 23 26 22 25 21 29 23 24 16 29 24
Quite a bit 41 38 41 40 41 39 41 40 42 40 43 41 43 41 41 40 41 38 41 39
Very much 22 29 24 30 26 33 25 32 24 33 27 33 28 35 24 33 31 43 24 31
Coursework emphasized: APPLYING theories or concepts to practical
problems or in new situations
Very little 4 3 4 3 4 3 4 3 4 3 4 2 3 2 4 2 3 2 4 3
Some 23 19 23 17 23 17 25 17 24 16 23 16 22 16 26 16 18 13 23 18
Quite a bit 40 37 40 38 41 37 41 38 41 38 40 40 41 38 40 38 38 35 40 38
Very much 34 41 33 42 32 43 30 41 31 43 33 43 34 44 30 43 41 50 32 42
Worked harder than you thought you could to meet an instructor's
standards or expectations
Never 10 9 9 7 8 6 8 6 7 5 6 5 7 5 7 5 7 4 8 7
Sometimes 41 41 40 38 38 35 39 35 38 34 36 34 37 35 38 34 35 29 39 37
Often 35 35 37 37 37 38 38 39 38 38 40 40 39 38 38 39 39 41 37 37
Very often 13 16 14 18 17 22 16 21 17 22 17 21 17 21 17 22 20 26 15 19
Hours per 7-day week spent preparing for class (studying,
reading, writing, doing homework or lab work,
analyzing data, rehearsing, and other academic activities)
0 0 0 0 1 0 0 0 0 1 0 0 0 0 0 0 0 0 1 0 0
1-5 13 16 17 19 18 18 21 20 20 20 20 19 11 13 20 19 12 12 17 18
6-10 25 25 28 26 28 26 29 28 28 27 27 27 23 23 28 28 22 23 27 26
11-15 23 20 22 19 22 20 21 19 20 19 21 20 23 21 21 19 22 19 22 19
16-20 18 16 16 15 15 15 14 14 14 14 15 15 19 18 15 15 19 18 16 15
21-25 10 9 9 9 8 9 7 8 9 9 8 8 12 11 8 8 12 11 9 9
26-30 6 6 4 5 4 5 4 5 4 5 4 5 6 7 4 4 7 7 5 5
More than 30 5 7 4 7 4 6 3 5 4 6 4 6 5 7 3 6 6 9 4 6
Institutional emphasis: Spending significant amounts
of time studying and on academic work
Very little 2 3 2 3 2 3 2 3 2 3 2 2 2 2 3 2 1 1 2 3
Some 18 20 20 20 19 20 20 20 18 17 20 17 14 13 19 20 13 12 19 19
Quite a bit 47 46 48 46 48 46 48 47 49 47 47 49 45 44 46 46 43 42 48 46
Very much 33 31 30 32 30 32 29 31 32 33 31 33 39 41 32 32 42 44 32 32
National Survey of Student Engagement | Annual Report 2007 ��
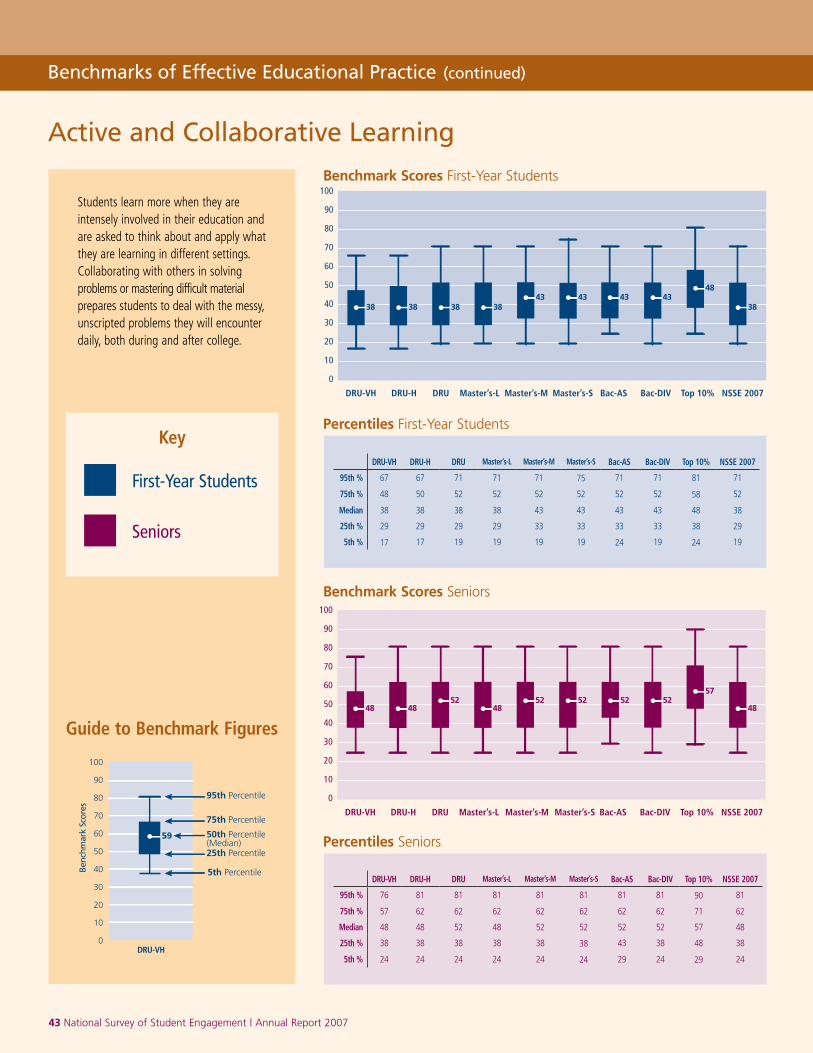
Percentile First-Year Students
Benchmark Scores First-Year Students
Benchmarks of Effective Educational Practice (continued)
Percentile Seniors
Benchmark Scores Seniors
100
90
80
70
60
50
40
30
20
10
0
Benc
hmar
k Sc
ores
DRU-VH
95th Percentile
75th Percentile
25th Percentile
5th Percentile
50th Percentile(Median)
59
Guide to Benchmark Figures
First-Year Students
Seniors
Key
�� National Survey of Student Engagement | Annual Report 2006
Active and Collaborative Learning
100
90
80
70
60
50
40
30
20
10
0
Benc
hmar
k Sc
ores
DRU-VH
95th Percentile
75th Percentile
25th Percentile
5th Percentile
50th Percentile(Median)
59
Guide to Benchmark Figures
First-Year Students
Seniors
Key
DRU-VH DRU-H DRU Master’s-L Master’s-M Master’s-S Bac-AS Bac-DIV Top 10% NSSE 2007
95th % 76 81 81 81 81 81 81 81 90 81
75th % 57 62 62 62 62 62 62 62 71 62
Median 48 48 52 48 52 52 52 52 57 48
25th % 38 38 38 38 38 38 43 38 48 38
5th % 24 24 24 24 24 24 29 24 29 24
Percentiles Seniors
DRU-VH DRU-H DRU Master’s-L Master’s-M Master’s-S Bac-AS Bac-DIV Top 10% NSSE 2007
38 3843
3843 43 43
48
38 38
DRU-VH DRU-H DRU Master’s-L Master’s-M Master’s-S Bac-AS Bac-DIV Top 10% NSSE 2007
4852 52 52 52
4852
48
57
48
Benchmark Scores Seniors
DRU-VH DRU-H DRU Master’s-L Master’s-M Master’s-S Bac-AS Bac-DIV Top 10% NSSE 2007
95th % 67 67 71 71 71 75 71 71 81 71
75th % 48 50 52 52 52 52 52 52 58 52
Median 38 38 38 38 43 43 43 43 48 38
25th % 29 29 29 29 33 33 33 33 38 29
5th % 17 17 19 19 19 19 24 19 24 19
Percentiles First-Year Students
DRU-VH DRU-H DRU Master’s-L Master’s-M Master’s-S Bac-AS Bac-DIV Top 10% NSSE 2007
38 3843
3843 43 43
48
38 38
DRU-VH DRU-H DRU Master’s-L Master’s-M Master’s-S Bac-AS Bac-DIV Top 10% NSSE 2007
4852 52 52 52
4852
48
57
48
Benchmark Scores First-Year Students
Students learn more when they are intensely involved in their education and are asked to think about and apply what they are learning in different settings. Collaborating with others in solving problems or mastering difficult material prepares students to deal with the messy, unscripted problems they will encounter daily, both during and after college.
�� National Survey of Student Engagement | Annual Report 2007
Benchmarks of Effective Educational Practice (continued)
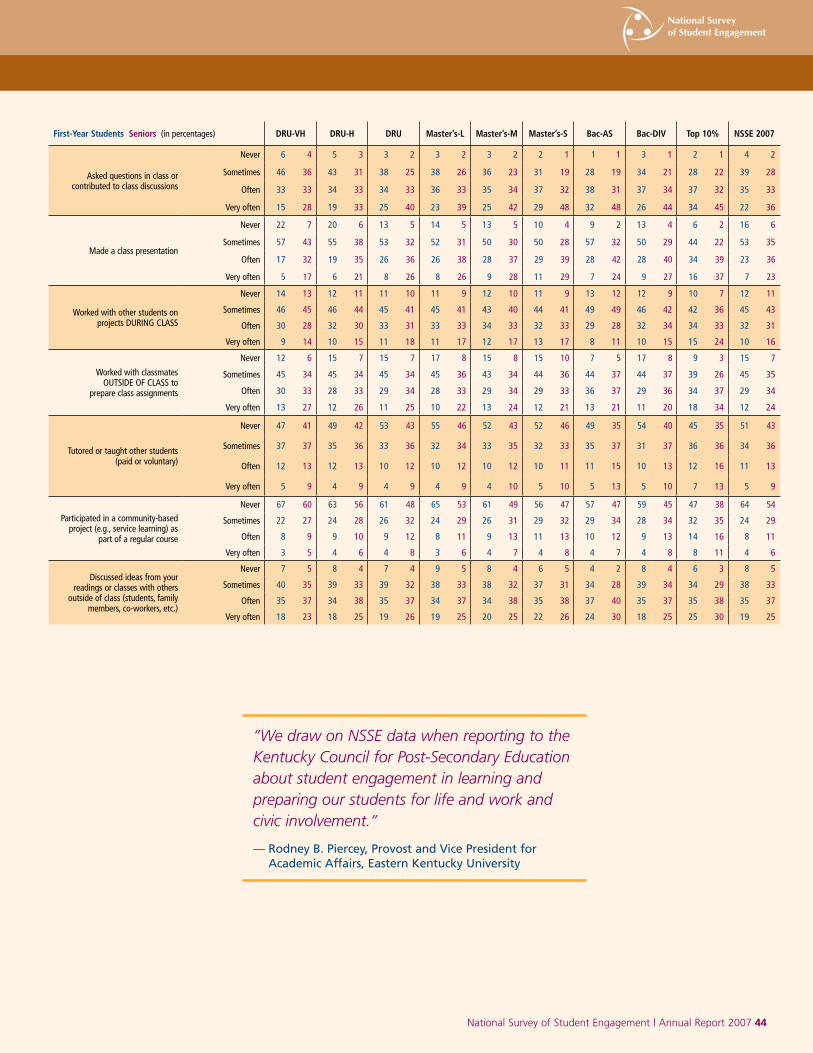
First-Year Students Seniors (in percentages) DRU-VH DRU-H DRU Master’s-L Master’s-M Master’s-S Bac-AS Bac-DIV Top 10% NSSE 2007
Asked questions in class or contributed to class discussions
Never 6 4 5 3 3 2 3 2 3 2 2 1 1 1 3 1 2 1 4 2
Sometimes 46 36 43 31 38 25 38 26 36 23 31 19 28 19 34 21 28 22 39 28
Often 33 33 34 33 34 33 36 33 35 34 37 32 38 31 37 34 37 32 35 33
Very often 15 28 19 33 25 40 23 39 25 42 29 48 32 48 26 44 34 45 22 36
Made a class presentation
Never 22 7 20 6 13 5 14 5 13 5 10 4 9 2 13 4 6 2 16 6
Sometimes 57 43 55 38 53 32 52 31 50 30 50 28 57 32 50 29 44 22 53 35
Often 17 32 19 35 26 36 26 38 28 37 29 39 28 42 28 40 34 39 23 36
Very often 5 17 6 21 8 26 8 26 9 28 11 29 7 24 9 27 16 37 7 23
Worked with other students on projects DURING CLASS
Never 14 13 12 11 11 10 11 9 12 10 11 9 13 12 12 9 10 7 12 11
Sometimes 46 45 46 44 45 41 45 41 43 40 44 41 49 49 46 42 42 36 45 43
Often 30 28 32 30 33 31 33 33 34 33 32 33 29 28 32 34 34 33 32 31
Very often 9 14 10 15 11 18 11 17 12 17 13 17 8 11 10 15 15 24 10 16
Worked with classmates OUTSIDE OF CLASS to
prepare class assignments
Never 12 6 15 7 15 7 17 8 15 8 15 10 7 5 17 8 9 3 15 7
Sometimes 45 34 45 34 45 34 45 36 43 34 44 36 44 37 44 37 39 26 45 35
Often 30 33 28 33 29 34 28 33 29 34 29 33 36 37 29 36 34 37 29 34
Very often 13 27 12 26 11 25 10 22 13 24 12 21 13 21 11 20 18 34 12 24
Tutored or taught other students (paid or voluntary)
Never 47 41 49 42 53 43 55 46 52 43 52 46 49 35 54 40 45 35 51 43
Sometimes 37 37 35 36 33 36 32 34 33 35 32 33 35 37 31 37 36 36 34 36
Often 12 13 12 13 10 12 10 12 10 12 10 11 11 15 10 13 12 16 11 13
Very often 5 9 4 9 4 9 4 9 4 10 5 10 5 13 5 10 7 13 5 9
Participated in a community-based project (e.g., service learning) as
part of a regular course
Never 67 60 63 56 61 48 65 53 61 49 56 47 57 47 59 45 47 38 64 54
Sometimes 22 27 24 28 26 32 24 29 26 31 29 32 29 34 28 34 32 35 24 29
Often 8 9 9 10 9 12 8 11 9 13 11 13 10 12 9 13 14 16 8 11
Very often 3 5 4 6 4 8 3 6 4 7 4 8 4 7 4 8 8 11 4 6
Discussed ideas from your readings or classes with others
outside of class (students, family members, co-workers, etc.)
Never 7 5 8 4 7 4 9 5 8 4 6 5 4 2 8 4 6 3 8 5
Sometimes 40 35 39 33 39 32 38 33 38 32 37 31 34 28 39 34 34 29 38 33
Often 35 37 34 38 35 37 34 37 34 38 35 38 37 40 35 37 35 38 35 37
Very often 18 23 18 25 19 26 19 25 20 25 22 26 24 30 18 25 25 30 19 25
National Survey of Student Engagement | Annual Report 2007 ��
“WedrawonNSSEdatawhenreportingtotheKentuckyCouncilforPost-SecondaryEducation aboutstudentengagementinlearningand preparingourstudentsforlifeandworkand civicinvolvement.”
— Rodney B. Piercey, Provost and Vice President for Academic Affairs, Eastern Kentucky University
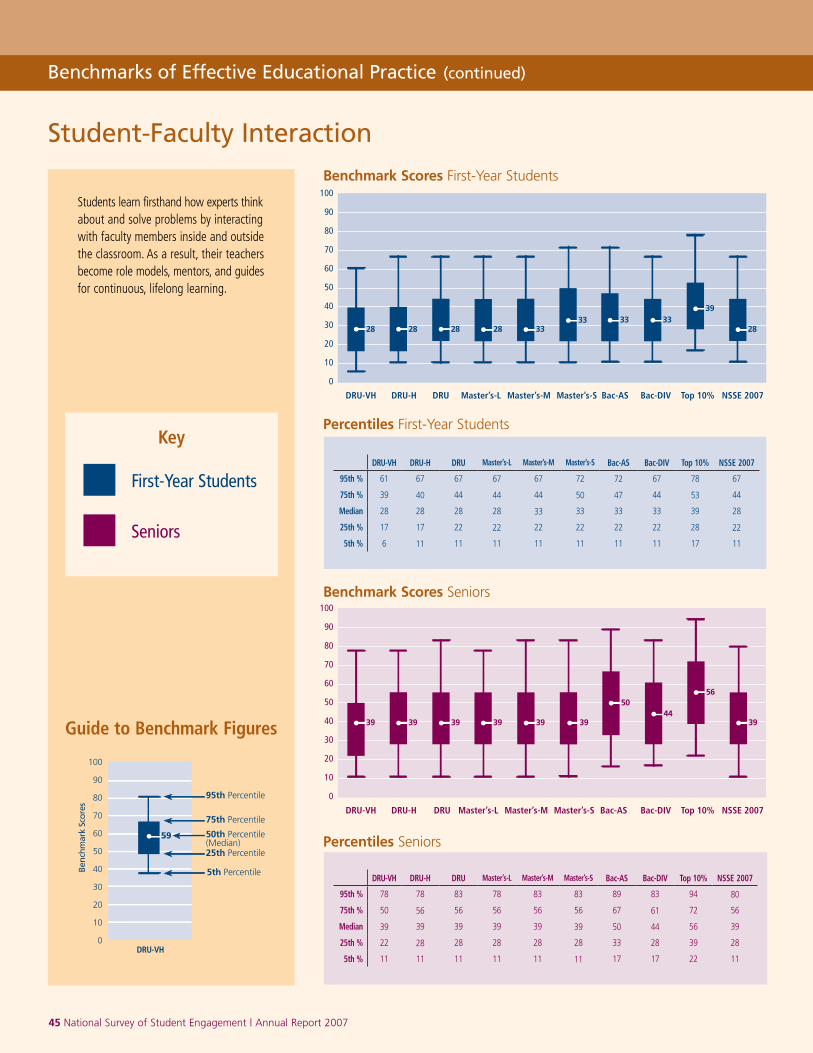
Percentile First-Year Students
Benchmark Scores First-Year Students
Benchmarks of Effective Educational Practice (continued)
Percentile Seniors
Benchmark Scores Seniors
100
90
80
70
60
50
40
30
20
10
0
Benc
hmar
k Sc
ores
DRU-VH
95th Percentile
75th Percentile
25th Percentile
5th Percentile
50th Percentile(Median)
59
Guide to Benchmark Figures
First-Year Students
Seniors
Key
�� National Survey of Student Engagement | Annual Report 2006
Student-Faculty Interaction
DRU-VH DRU-H DRU Master’s-L Master’s-M Master’s-S Bac-AS Bac-DIV Top 10% NSSE 2007
28 28 28 33 2833 33 33
39
28
DRU-VH DRU-H DRU Master’s-L Master’s-M Master’s-S Bac-AS Bac-DIV Top 10% NSSE 2007
39 39 39 39 3944
39 39
5056
Benchmark Scores Seniors
DRU-VH DRU-H DRU Master’s-L Master’s-M Master’s-S Bac-AS Bac-DIV Top 10% NSSE 2007
95th % 78 78 83 78 83 83 89 83 94 80
75th % 50 56 56 56 56 56 67 61 72 56
Median 39 39 39 39 39 39 50 44 56 39
25th % 22 28 28 28 28 28 33 28 39 28
5th % 11 11 11 11 11 11 17 17 22 11
Percentiles Seniors
100
90
80
70
60
50
40
30
20
10
0
Benc
hmar
k Sc
ores
DRU-VH
95th Percentile
75th Percentile
25th Percentile
5th Percentile
50th Percentile(Median)
59
Guide to Benchmark Figures
First-Year Students
Seniors
Key
Students learn firsthand how experts think about and solve problems by interacting with faculty members inside and outside the classroom. As a result, their teachers become role models, mentors, and guides for continuous, lifelong learning.
DRU-VH DRU-H DRU Master’s-L Master’s-M Master’s-S Bac-AS Bac-DIV Top 10% NSSE 2007
95th % 61 67 67 67 67 72 72 67 78 67
75th % 39 40 44 44 44 50 47 44 53 44
Median 28 28 28 28 33 33 33 33 39 28
25th % 17 17 22 22 22 22 22 22 28 22
5th % 6 11 11 11 11 11 11 11 17 11
Percentiles First-Year Students
DRU-VH DRU-H DRU Master’s-L Master’s-M Master’s-S Bac-AS Bac-DIV Top 10% NSSE 2007
28 28 28 33 2833 33 33
39
28
DRU-VH DRU-H DRU Master’s-L Master’s-M Master’s-S Bac-AS Bac-DIV Top 10% NSSE 2007
39 39 39 39 3944
39 39
5056
Benchmark Scores First-Year Students
�� National Survey of Student Engagement | Annual Report 2007
Benchmarks of Effective Educational Practice (continued)
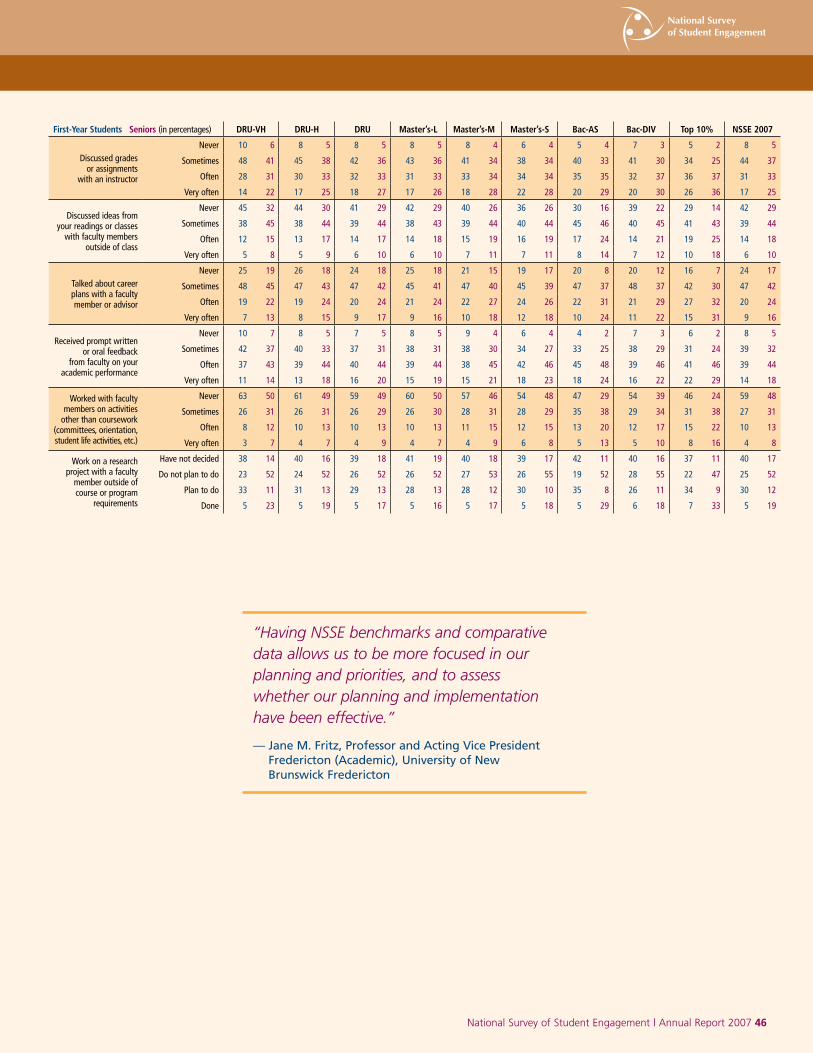
First-Year Students Seniors (in percentages) DRU-VH DRU-H DRU Master’s-L Master’s-M Master’s-S Bac-AS Bac-DIV Top 10% NSSE 2007
Discussed grades or assignments
with an instructor
Never 10 6 8 5 8 5 8 5 8 4 6 4 5 4 7 3 5 2 8 5
Sometimes 48 41 45 38 42 36 43 36 41 34 38 34 40 33 41 30 34 25 44 37
Often 28 31 30 33 32 33 31 33 33 34 34 34 35 35 32 37 36 37 31 33
Very often 14 22 17 25 18 27 17 26 18 28 22 28 20 29 20 30 26 36 17 25
Discussed ideas from your readings or classes
with faculty members outside of class
Never 45 32 44 30 41 29 42 29 40 26 36 26 30 16 39 22 29 14 42 29
Sometimes 38 45 38 44 39 44 38 43 39 44 40 44 45 46 40 45 41 43 39 44
Often 12 15 13 17 14 17 14 18 15 19 16 19 17 24 14 21 19 25 14 18
Very often 5 8 5 9 6 10 6 10 7 11 7 11 8 14 7 12 10 18 6 10
Talked about career plans with a faculty member or advisor
Never 25 19 26 18 24 18 25 18 21 15 19 17 20 8 20 12 16 7 24 17
Sometimes 48 45 47 43 47 42 45 41 47 40 45 39 47 37 48 37 42 30 47 42
Often 19 22 19 24 20 24 21 24 22 27 24 26 22 31 21 29 27 32 20 24
Very often 7 13 8 15 9 17 9 16 10 18 12 18 10 24 11 22 15 31 9 16
Received prompt written or oral feedback
from faculty on your academic performance
Never 10 7 8 5 7 5 8 5 9 4 6 4 4 2 7 3 6 2 8 5
Sometimes 42 37 40 33 37 31 38 31 38 30 34 27 33 25 38 29 31 24 39 32
Often 37 43 39 44 40 44 39 44 38 45 42 46 45 48 39 46 41 46 39 44
Very often 11 14 13 18 16 20 15 19 15 21 18 23 18 24 16 22 22 29 14 18
Worked with faculty members on activities
other than coursework (committees, orientation, student life activities, etc.)
Never 63 50 61 49 59 49 60 50 57 46 54 48 47 29 54 39 46 24 59 48
Sometimes 26 31 26 31 26 29 26 30 28 31 28 29 35 38 29 34 31 38 27 31
Often 8 12 10 13 10 13 10 13 11 15 12 15 13 20 12 17 15 22 10 13
Very often 3 7 4 7 4 9 4 7 4 9 6 8 5 13 5 10 8 16 4 8
Work on a research project with a faculty
member outside of course or program
requirements
Have not decided 38 14 40 16 39 18 41 19 40 18 39 17 42 11 40 16 37 11 40 17
Do not plan to do 23 52 24 52 26 52 26 52 27 53 26 55 19 52 28 55 22 47 25 52
Plan to do 33 11 31 13 29 13 28 13 28 12 30 10 35 8 26 11 34 9 30 12
Done 5 23 5 19 5 17 5 16 5 17 5 18 5 29 6 18 7 33 5 19
National Survey of Student Engagement | Annual Report 2007 ��
“HavingNSSEbenchmarksandcomparative dataallowsustobemorefocusedinour planningandpriorities,andtoassess whetherourplanningandimplementation havebeeneffective.”
— Jane M. Fritz, Professor and Acting Vice President Fredericton (Academic), University of New Brunswick Fredericton
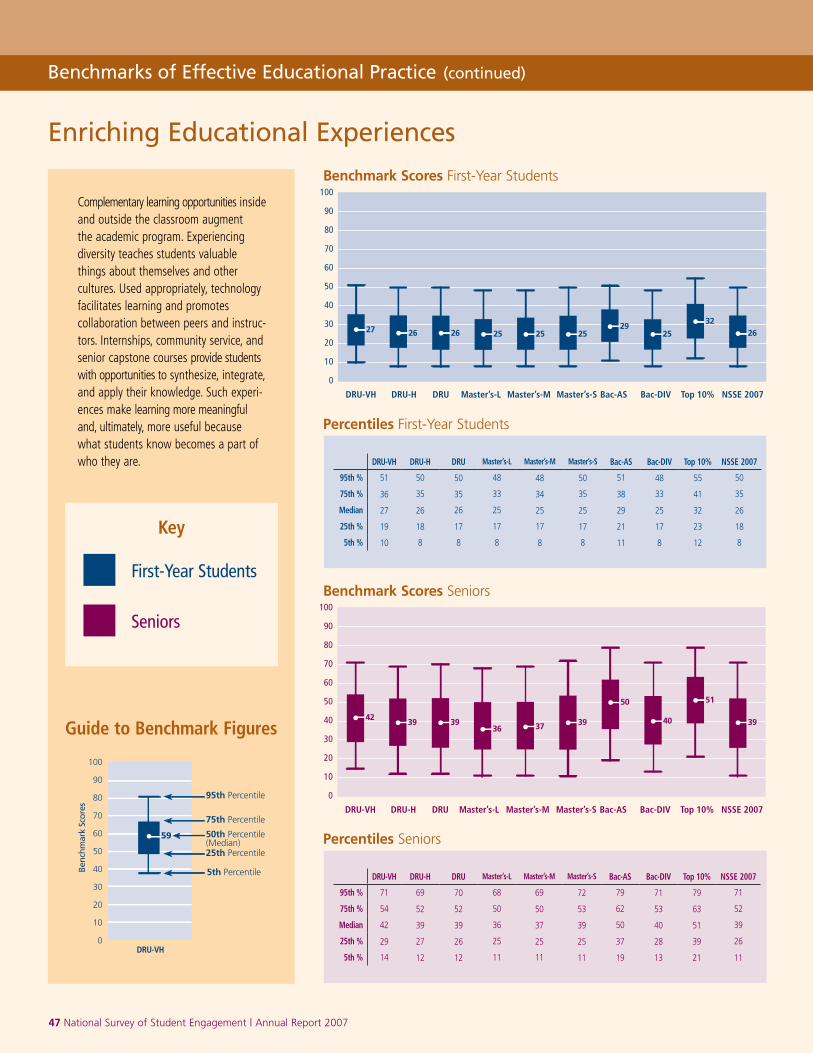
Percentile First-Year Students
Benchmark Scores First-Year Students
Benchmarks of Effective Educational Practice (continued)
Percentile Seniors
Benchmark Scores Seniors
100
90
80
70
60
50
40
30
20
10
0
Benc
hmar
k Sc
ores
DRU-VH
95th Percentile
75th Percentile
25th Percentile
5th Percentile
50th Percentile(Median)
59
Guide to Benchmark Figures
First-Year Students
Seniors
Key
�� National Survey of Student Engagement | Annual Report 2006
Enriching Educational Experiences
DRU-VH DRU-H DRU Master’s-L Master’s-M Master’s-S Bac-AS Bac-DIV Top 10% NSSE 2007
95th % 71 69 70 68 69 72 79 71 79 71
75th % 54 52 52 50 50 53 62 53 63 52
Median 42 39 39 36 37 39 50 40 51 39
25th % 29 27 26 25 25 25 37 28 39 26
5th % 14 12 12 11 11 11 19 13 21 11
Percentiles Seniors
DRU-VH DRU-H DRU Master’s-L Master’s-M Master’s-S Bac-AS Bac-DIV Top 10% NSSE 2007
27 26 26 25 262529
25
32
25
DRU-VH DRU-H DRU Master’s-L Master’s-M Master’s-S Bac-AS Bac-DIV Top 10% NSSE 2007
4239 39 37 3940
3639
50 51
Benchmark Scores Seniors
100
90
80
70
60
50
40
30
20
10
0
Benc
hmar
k Sc
ores
DRU-VH
95th Percentile
75th Percentile
25th Percentile
5th Percentile
50th Percentile(Median)
59
Guide to Benchmark Figures
First-Year Students
Seniors
Key
Complementary learning opportunities inside and outside the classroom augment the academic program. Experiencing diversity teaches students valuable things about themselves and other cultures. Used appropriately, technology facilitates learning and promotes collaboration between peers and instruc-tors. Internships, community service, and senior capstone courses provide students with opportunities to synthesize, integrate, and apply their knowledge. Such experi-ences make learning more meaningful and, ultimately, more useful because what students know becomes a part of who they are. DRU-VH DRU-H DRU Master’s-L Master’s-M Master’s-S Bac-AS Bac-DIV Top 10% NSSE 2007
95th % 51 50 50 48 48 50 51 48 55 50
75th % 36 35 35 33 34 35 38 33 41 35
Median 27 26 26 25 25 25 29 25 32 26
25th % 19 18 17 17 17 17 21 17 23 18
5th % 10 8 8 8 8 8 11 8 12 8
Percentiles First-Year Students
DRU-VH DRU-H DRU Master’s-L Master’s-M Master’s-S Bac-AS Bac-DIV Top 10% NSSE 2007
27 26 26 25 262529
25
32
25
DRU-VH DRU-H DRU Master’s-L Master’s-M Master’s-S Bac-AS Bac-DIV Top 10% NSSE 2007
4239 39 37 3940
3639
50 51
Benchmark Scores First-Year Students
�� National Survey of Student Engagement | Annual Report 2007
Benchmarks of Effective Educational Practice (continued)
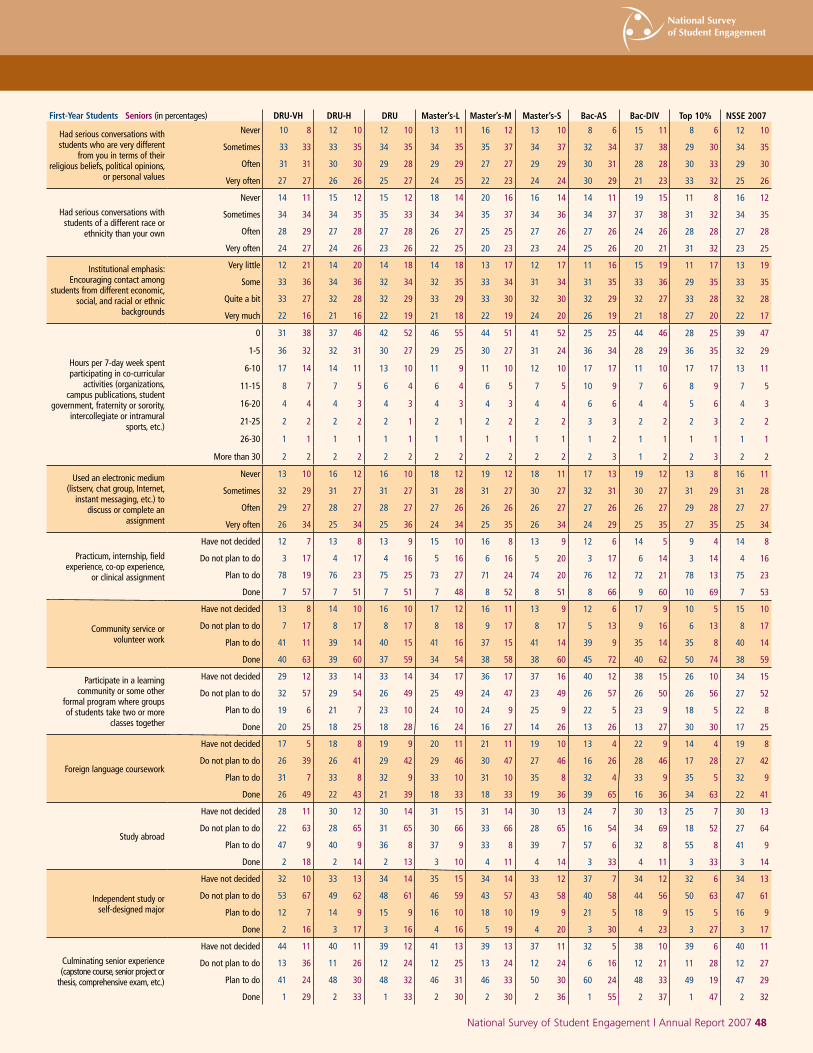
First-Year Students Seniors (in percentages) DRU-VH DRU-H DRU Master’s-L Master’s-M Master’s-S Bac-AS Bac-DIV Top 10% NSSE 2007
Had serious conversations with students who are very different
from you in terms of their religious beliefs, political opinions,
or personal values
Never 10 8 12 10 12 10 13 11 16 12 13 10 8 6 15 11 8 6 12 10
Sometimes 33 33 33 35 34 35 34 35 35 37 34 37 32 34 37 38 29 30 34 35
Often 31 31 30 30 29 28 29 29 27 27 29 29 30 31 28 28 30 33 29 30
Very often 27 27 26 26 25 27 24 25 22 23 24 24 30 29 21 23 33 32 25 26
Had serious conversations with students of a different race or
ethnicity than your own
Never 14 11 15 12 15 12 18 14 20 16 16 14 14 11 19 15 11 8 16 12
Sometimes 34 34 34 35 35 33 34 34 35 37 34 36 34 37 37 38 31 32 34 35
Often 28 29 27 28 27 28 26 27 25 25 27 26 27 26 24 26 28 28 27 28
Very often 24 27 24 26 23 26 22 25 20 23 23 24 25 26 20 21 31 32 23 25
Institutional emphasis: Encouraging contact among
students from different economic, social, and racial or ethnic
backgrounds
Very little 12 21 14 20 14 18 14 18 13 17 12 17 11 16 15 19 11 17 13 19
Some 33 36 34 36 32 34 32 35 33 34 31 34 31 35 33 36 29 35 33 35
Quite a bit 33 27 32 28 32 29 33 29 33 30 32 30 32 29 32 27 33 28 32 28
Very much 22 16 21 16 22 19 21 18 22 19 24 20 26 19 21 18 27 20 22 17
Hours per 7-day week spent participating in co-curricular
activities (organizations, campus publications, student
government, fraternity or sorority, intercollegiate or intramural
sports, etc.)
0 31 38 37 46 42 52 46 55 44 51 41 52 25 25 44 46 28 25 39 47
1-5 36 32 32 31 30 27 29 25 30 27 31 24 36 34 28 29 36 35 32 29
6-10 17 14 14 11 13 10 11 9 11 10 12 10 17 17 11 10 17 17 13 11
11-15 8 7 7 5 6 4 6 4 6 5 7 5 10 9 7 6 8 9 7 5
16-20 4 4 4 3 4 3 4 3 4 3 4 4 6 6 4 4 5 6 4 3
21-25 2 2 2 2 2 1 2 1 2 2 2 2 3 3 2 2 2 3 2 2
26-30 1 1 1 1 1 1 1 1 1 1 1 1 1 2 1 1 1 1 1 1
More than 30 2 2 2 2 2 2 2 2 2 2 2 2 2 3 1 2 2 3 2 2
Used an electronic medium (listserv, chat group, Internet,
instant messaging, etc.) to discuss or complete an
assignment
Never 13 10 16 12 16 10 18 12 19 12 18 11 17 13 19 12 13 8 16 11
Sometimes 32 29 31 27 31 27 31 28 31 27 30 27 32 31 30 27 31 29 31 28
Often 29 27 28 27 28 27 27 26 26 26 26 27 27 26 26 27 29 28 27 27
Very often 26 34 25 34 25 36 24 34 25 35 26 34 24 29 25 35 27 35 25 34
Practicum, internship, field experience, co-op experience,
or clinical assignment
Have not decided 12 7 13 8 13 9 15 10 16 8 13 9 12 6 14 5 9 4 14 8
Do not plan to do 3 17 4 17 4 16 5 16 6 16 5 20 3 17 6 14 3 14 4 16
Plan to do 78 19 76 23 75 25 73 27 71 24 74 20 76 12 72 21 78 13 75 23
Done 7 57 7 51 7 51 7 48 8 52 8 51 8 66 9 60 10 69 7 53
Community service or volunteer work
Have not decided 13 8 14 10 16 10 17 12 16 11 13 9 12 6 17 9 10 5 15 10
Do not plan to do 7 17 8 17 8 17 8 18 9 17 8 17 5 13 9 16 6 13 8 17
Plan to do 41 11 39 14 40 15 41 16 37 15 41 14 39 9 35 14 35 8 40 14
Done 40 63 39 60 37 59 34 54 38 58 38 60 45 72 40 62 50 74 38 59
Participate in a learning community or some other
formal program where groups of students take two or more
classes together
Have not decided 29 12 33 14 33 14 34 17 36 17 37 16 40 12 38 15 26 10 34 15
Do not plan to do 32 57 29 54 26 49 25 49 24 47 23 49 26 57 26 50 26 56 27 52
Plan to do 19 6 21 7 23 10 24 10 24 9 25 9 22 5 23 9 18 5 22 8
Done 20 25 18 25 18 28 16 24 16 27 14 26 13 26 13 27 30 30 17 25
Foreign language coursework
Have not decided 17 5 18 8 19 9 20 11 21 11 19 10 13 4 22 9 14 4 19 8
Do not plan to do 26 39 26 41 29 42 29 46 30 47 27 46 16 26 28 46 17 28 27 42
Plan to do 31 7 33 8 32 9 33 10 31 10 35 8 32 4 33 9 35 5 32 9
Done 26 49 22 43 21 39 18 33 18 33 19 36 39 65 16 36 34 63 22 41
Study abroad
Have not decided 28 11 30 12 30 14 31 15 31 14 30 13 24 7 30 13 25 7 30 13
Do not plan to do 22 63 28 65 31 65 30 66 33 66 28 65 16 54 34 69 18 52 27 64
Plan to do 47 9 40 9 36 8 37 9 33 8 39 7 57 6 32 8 55 8 41 9
Done 2 18 2 14 2 13 3 10 4 11 4 14 3 33 4 11 3 33 3 14
Independent study or self-designed major
Have not decided 32 10 33 13 34 14 35 15 34 14 33 12 37 7 34 12 32 6 34 13
Do not plan to do 53 67 49 62 48 61 46 59 43 57 43 58 40 58 44 56 50 63 47 61
Plan to do 12 7 14 9 15 9 16 10 18 10 19 9 21 5 18 9 15 5 16 9
Done 2 16 3 17 3 16 4 16 5 19 4 20 3 30 4 23 3 27 3 17
Culminating senior experience (capstone course, senior project or
thesis, comprehensive exam, etc.)
Have not decided 44 11 40 11 39 12 41 13 39 13 37 11 32 5 38 10 39 6 40 11
Do not plan to do 13 36 11 26 12 24 12 25 13 24 12 24 6 16 12 21 11 28 12 27
Plan to do 41 24 48 30 48 32 46 31 46 33 50 30 60 24 48 33 49 19 47 29
Done 1 29 2 33 1 33 2 30 2 30 2 36 1 55 2 37 1 47 2 32
National Survey of Student Engagement | Annual Report 2007 ��
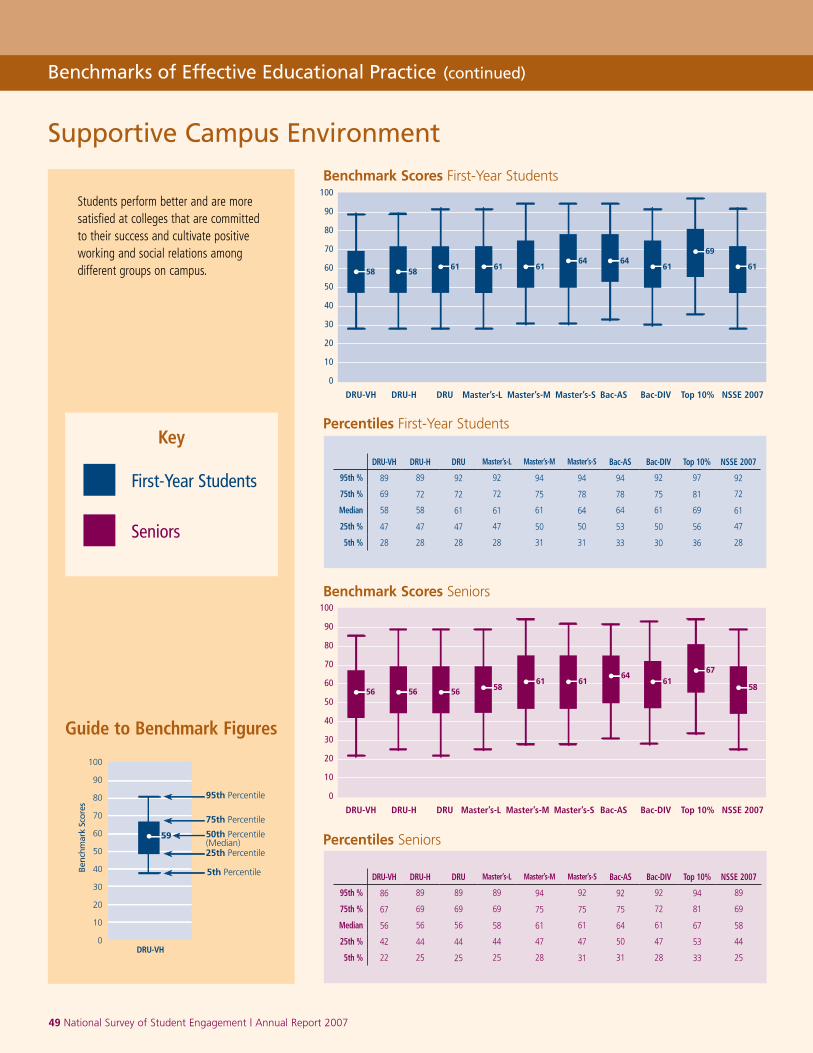
Percentile First-Year Students
Benchmark Scores First-Year Students
Benchmarks of Effective Educational Practice (continued)
Percentile Seniors
Benchmark Scores Seniors
100
90
80
70
60
50
40
30
20
10
0
Benc
hmar
k Sc
ores
DRU-VH
95th Percentile
75th Percentile
25th Percentile
5th Percentile
50th Percentile(Median)
59
Guide to Benchmark Figures
First-Year Students
Seniors
Key
�� National Survey of Student Engagement | Annual Report 2006
Supportive Campus Environment
DRU-VH DRU-H DRU Master’s-L Master’s-M Master’s-S Bac-AS Bac-DIV Top 10% NSSE 2007
58 5861
69
DRU-VH DRU-H DRU Master’s-L Master’s-M Master’s-S Bac-AS Bac-DIV Top 10% NSSE 2007
56 56 58 585661 61 61
6467
61 6161 6164 64
Benchmark Scores Seniors
DRU-VH DRU-H DRU Master’s-L Master’s-M Master’s-S Bac-AS Bac-DIV Top 10% NSSE 2007
58 5861
69
DRU-VH DRU-H DRU Master’s-L Master’s-M Master’s-S Bac-AS Bac-DIV Top 10% NSSE 2007
56 56 58 585661 61 61
6467
61 6161 6164 64
Benchmark Scores First-Year Students
DRU-VH DRU-H DRU Master’s-L Master’s-M Master’s-S Bac-AS Bac-DIV Top 10% NSSE 2007
95th % 89 89 92 92 94 94 94 92 97 92
75th % 69 72 72 72 75 78 78 75 81 72
Median 58 58 61 61 61 64 64 61 69 61
25th % 47 47 47 47 50 50 53 50 56 47
5th % 28 28 28 28 31 31 33 30 36 28
Percentiles First-Year Students
DRU-VH DRU-H DRU Master’s-L Master’s-M Master’s-S Bac-AS Bac-DIV Top 10% NSSE 2007
95th % 86 89 89 89 94 92 92 92 94 89
75th % 67 69 69 69 75 75 75 72 81 69
Median 56 56 56 58 61 61 64 61 67 58
25th % 42 44 44 44 47 47 50 47 53 44
5th % 22 25 25 25 28 31 31 28 33 25
Percentiles Seniors
100
90
80
70
60
50
40
30
20
10
0
Benc
hmar
k Sc
ores
DRU-VH
95th Percentile
75th Percentile
25th Percentile
5th Percentile
50th Percentile(Median)
59
Guide to Benchmark Figures
First-Year Students
Seniors
Key
Students perform better and are more satisfied at colleges that are committed to their success and cultivate positive working and social relations among different groups on campus.
�� National Survey of Student Engagement | Annual Report 2007
Benchmarks of Effective Educational Practice (continued)
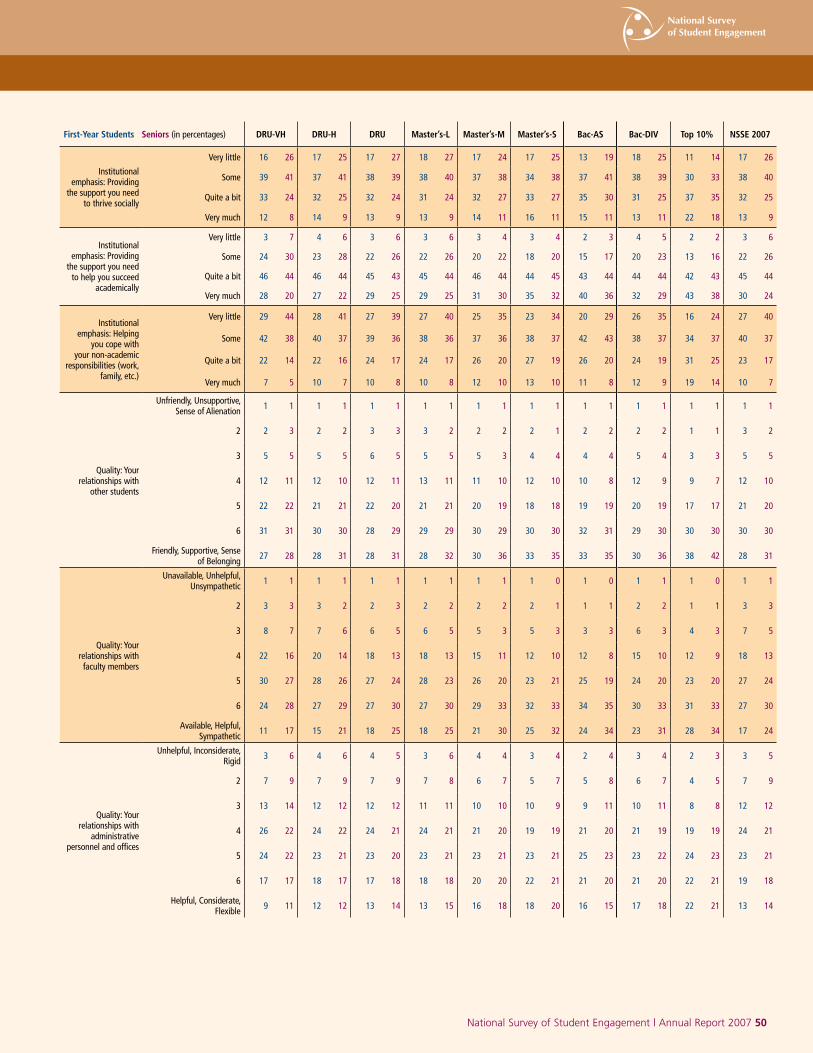
First-Year Students Seniors (in percentages) DRU-VH DRU-H DRU Master’s-L Master’s-M Master’s-S Bac-AS Bac-DIV Top 10% NSSE 2007
Institutional emphasis: Providing
the support you need to thrive socially
Very little 16 26 17 25 17 27 18 27 17 24 17 25 13 19 18 25 11 14 17 26
Some 39 41 37 41 38 39 38 40 37 38 34 38 37 41 38 39 30 33 38 40
Quite a bit 33 24 32 25 32 24 31 24 32 27 33 27 35 30 31 25 37 35 32 25
Very much 12 8 14 9 13 9 13 9 14 11 16 11 15 11 13 11 22 18 13 9
Institutional emphasis: Providing
the support you need to help you succeed
academically
Very little 3 7 4 6 3 6 3 6 3 4 3 4 2 3 4 5 2 2 3 6
Some 24 30 23 28 22 26 22 26 20 22 18 20 15 17 20 23 13 16 22 26
Quite a bit 46 44 46 44 45 43 45 44 46 44 44 45 43 44 44 44 42 43 45 44
Very much 28 20 27 22 29 25 29 25 31 30 35 32 40 36 32 29 43 38 30 24
Institutional emphasis: Helping
you cope with your non-academic
responsibilities (work, family, etc.)
Very little 29 44 28 41 27 39 27 40 25 35 23 34 20 29 26 35 16 24 27 40
Some 42 38 40 37 39 36 38 36 37 36 38 37 42 43 38 37 34 37 40 37
Quite a bit 22 14 22 16 24 17 24 17 26 20 27 19 26 20 24 19 31 25 23 17
Very much 7 5 10 7 10 8 10 8 12 10 13 10 11 8 12 9 19 14 10 7
Quality: Your relationships with
other students
Unfriendly, Unsupportive, Sense of Alienation 1 1 1 1 1 1 1 1 1 1 1 1 1 1 1 1 1 1 1 1
2 2 3 2 2 3 3 3 2 2 2 2 1 2 2 2 2 1 1 3 2
3 5 5 5 5 6 5 5 5 5 3 4 4 4 4 5 4 3 3 5 5
4 12 11 12 10 12 11 13 11 11 10 12 10 10 8 12 9 9 7 12 10
5 22 22 21 21 22 20 21 21 20 19 18 18 19 19 20 19 17 17 21 20
6 31 31 30 30 28 29 29 29 30 29 30 30 32 31 29 30 30 30 30 30
Friendly, Supportive, Sense of Belonging 27 28 28 31 28 31 28 32 30 36 33 35 33 35 30 36 38 42 28 31
Quality: Your relationships with faculty members
Unavailable, Unhelpful, Unsympathetic 1 1 1 1 1 1 1 1 1 1 1 0 1 0 1 1 1 0 1 1
2 3 3 3 2 2 3 2 2 2 2 2 1 1 1 2 2 1 1 3 3
3 8 7 7 6 6 5 6 5 5 3 5 3 3 3 6 3 4 3 7 5
4 22 16 20 14 18 13 18 13 15 11 12 10 12 8 15 10 12 9 18 13
5 30 27 28 26 27 24 28 23 26 20 23 21 25 19 24 20 23 20 27 24
6 24 28 27 29 27 30 27 30 29 33 32 33 34 35 30 33 31 33 27 30
Available, Helpful, Sympathetic 11 17 15 21 18 25 18 25 21 30 25 32 24 34 23 31 28 34 17 24
Quality: Your relationships with
administrative personnel and offices
Unhelpful, Inconsiderate, Rigid 3 6 4 6 4 5 3 6 4 4 3 4 2 4 3 4 2 3 3 5
2 7 9 7 9 7 9 7 8 6 7 5 7 5 8 6 7 4 5 7 9
3 13 14 12 12 12 12 11 11 10 10 10 9 9 11 10 11 8 8 12 12
4 26 22 24 22 24 21 24 21 21 20 19 19 21 20 21 19 19 19 24 21
5 24 22 23 21 23 20 23 21 23 21 23 21 25 23 23 22 24 23 23 21
6 17 17 18 17 17 18 18 18 20 20 22 21 21 20 21 20 22 21 19 18
Helpful, Considerate, Flexible 9 11 12 12 13 14 13 15 16 18 18 20 16 15 17 18 22 21 13 14
National Survey of Student Engagement | Annual Report 2007 �0
National Advisory Board
�� National Survey of Student Engagement | Annual Report 2007
AlabamaAuburn University1
Auburn University at Montgomery
Birmingham-Southern College1
Faulkner University1
Huntingdon College
Jacksonville State University
Judson College
Miles College
Oakwood College
Samford University
Southeastern Bible College
Spring Hill College
Stillman College
Troy University
Troy University-Montgomery Campus
University of Alabama at Birmingham1
University of Alabama in Huntsville
University of Alabama, The1
University of North Alabama
University of South Alabama
AlaskaAlaska Pacific University1
University of Alaska Anchorage1
University of Alaska Fairbanks
University of Alaska Southeast
ArizonaArizona State University at the Polytechnic Campus1
Arizona State University at the Tempe Campus1
Arizona State University at the West Campus1
Embry Riddle Aeronautical University-Prescott
Northern Arizona University1
University of Arizona, The
University of Advancing Technology
ArkansasArkansas State University1
Arkansas Tech University1
Ecclesia College
Henderson State University1
Hendrix College
John Brown University1
Lyon College
Ouachita Baptist University
Philander Smith College2
Southern Arkansas University
University of Arkansas
University of Arkansas-Fort Smith1
University of Arkansas at Little Rock1
University of Arkansas at Monticello
University of Arkansas at Pine Bluff2
University of Central Arkansas
University of the Ozarks
CaliforniaAlliant International University
California Baptist University1
California College of the Arts
California Lutheran University
California Polytechnic State University- San Luis Obispo
California State Polytechnic University-Pomona
California State University San Marcos
California State University, Fresno1 2
California State University, Northridge2
California State University, Sacramento1
California State University-Bakersfield
California State University-Chico1
California State University-Dominguez Hills1 2
California State University-Fullerton
California State University-Long Beach1
California State University-Los Angeles2
California State University-Monterey Bay2
California State University-San Bernardino1 2
California State University-Stanislaus1 2
Chapman University
Concordia University1
Fresno Pacific University
Harvey Mudd College1
Holy Names University
Hope International University
Humboldt State University
La Sierra University
Laguna College of Art and Design
Loyola Marymount University
Master’s College and Seminary, The
Menlo College
National University1
Notre Dame de Namur University1
Occidental College2
Pepperdine University1
Pitzer College
Point Loma Nazarene University
Saint Mary’s College of California1
San Diego Christian College
San Diego State University
San Francisco State University1
San Jose State University1
Santa Clara University1
Scripps College1
Sierra College
Simpson University
Sonoma State University1
University of California-Berkeley
University of California-Davis
University of California-Merced
University of California-Santa Cruz
University of Judaism
University of La Verne
University of Redlands
University of San Diego
University of San Francisco
University of the Pacific
Westmont College1
Whittier College1
Woodbury University2
ColoradoAdams State College1 2
Colorado College1
Colorado School of Mines
Colorado State University1
Colorado State University-Pueblo2
Fort Lewis College1
Metropolitan State College of Denver1
Naropa University
Regis University
United States Air Force Academy
University of Colorado at Boulder
University of Colorado at Colorado Springs1
University of Colorado at Denver & Health Sciences Center1
University of Denver1
ConnecticutCentral Connecticut State University
Connecticut College1
Eastern Connecticut State University
Fairfield University
Post University1
Quinnipiac University1
Sacred Heart University
Saint Joseph College
Southern Connecticut State University
University of Bridgeport
University of Connecticut1
University of Connecticut-Avery Point1
University of Connecticut-Stamford1
University of Connecticut-Tri-Campus1
University of Hartford
University of New Haven
Western Connecticut State University
DelawareDelaware State University2
Goldey-Beacom College
University of Delaware
Wesley College
District of ColumbiaAmerican University
Catholic University of America
Corcoran College of Art and Design
Gallaudet University
George Washington University
Georgetown University
Howard University
Southeastern University
Trinity (Washington) University1
University of the District of Columbia1 2
FloridaBarry University2
Beacon College
Bethune Cookman College2
Eckerd College
Edward Waters College2
Embry Riddle Aeronautical University-Daytona Beach
Embry Riddle Aeronautical University-Worldwide
Flagler College1
Florida A&M University
Florida Atlantic University1
Florida Gulf Coast University1
Florida Institute of Technology
Florida International University2
Florida Memorial University
Florida Southern College1
Florida State University
Jacksonville University1
Lynn University1
New College of Florida1
Participating Colleges and Universities: 2000-2007
Northwood University-Florida Campus
Nova Southeastern University
Palm Beach Atlantic University-West Palm Beach
Ringling School of Art and Design
Rollins College1
Saint John Vianney College Seminary1
Saint Leo University
Saint Thomas University2
Stetson University
University of Central Florida1
University of Florida
University of Miami
University of North Florida
University of South Florida
University of South Florida St. Petersburg
University of Tampa, The1
University of West Florida, The
Warner Southern College1
GeorgiaAgnes Scott College1
Albany State University2
Armstrong Atlantic State University
Augusta State University
Berry College1
Brenau University
Clark Atlanta University1 2
Clayton State University1
Columbus State University1
Covenant College
Dalton State College
Emory University
Fort Valley State University2
Georgia College and State University1
Georgia Institute of Technology
Georgia Southern University1
Georgia Southwestern State University1
Georgia State University1
Kennesaw State University1
LaGrange College1
Macon State College
Medical College of Georgia
Mercer University1
Morehouse College2
North Georgia College & State University1
Oglethorpe University1
Oxford College of Emory University1
Savannah College of Art and Design1
Savannah State University1 2
Shorter College1
Southern Catholic College
Southern Polytechnic State University
Spelman College2
Thomas University
University of Georgia1
University of West Georgia
Valdosta State University
Wesleyan College1
HawaiiBrigham Young University-Hawaii
Chaminade University of Honolulu1
University of Hawaii at Hilo1
University of Hawaii at Manoa1
University of Hawaii-West Oahu
IdahoAlbertson College of Idaho
Boise State University1
Brigham Young University-Idaho1
Idaho State University1
University of Idaho
IllinoisAugustana College1
Aurora University1
Blackburn College1
Bradley University
Chicago State University2
Columbia College Chicago1
Concordia University
DePaul University1
Dominican University1
East-West University
Elmhurst College1
Eureka College
Greenville College
Harrington College of Design
Illinois College1
Illinois Institute of Technology
Illinois State University1
Illinois Wesleyan University1
Judson College
Knox College1
Lake Forest College
Lewis University
Lincoln Christian College and Seminary
Loyola University Chicago
McKendree College
Millikin University
Monmouth College1
North Central College1
Northeastern Illinois University
Northern Illinois University
Northwestern University
Olivet Nazarene University
Robert Morris College1
Rockford College
Roosevelt University1
Saint Xavier University1
School of the Art Institute of Chicago
Southern Illinois University Edwardsville1
Trinity Christian College1
University of Illinois at Chicago
University of Illinois at Springfield
University of Illinois at Urbana-Champaign
University of St Francis1
Western Illinois University1
Wheaton College1
IndianaAnderson University
Ball State University
Butler University1
Calumet College of Saint Joseph1
DePauw University1
Earlham College1
Franklin College
Grace College and Theological Seminary
Hanover College
Huntington University1
Indiana State University
Indiana University Bloomington1
Indiana University-East1
Indiana University Kokomo
Indiana University-Northwest
Indiana University-Purdue University-Fort Wayne
Indiana University-Purdue University-Indianapolis1
Indiana University-South Bend1
Indiana University-Southeast
Indiana Wesleyan University
Manchester College1
Purdue University
Purdue University-Calumet Campus
Purdue University-North Central Campus
Rose-Hulman Institute of Technology
Saint Mary’s College
Taylor University-Upland
Tri-State University
University of Evansville
University of Indianapolis1
University of Southern Indiana1
Valparaiso University
Wabash College
IowaBuena Vista University1
Central College1
Clarke College1
Cornell College
Dordt College
Drake University1
Graceland University-Lamoni1
Grand View College1
Grinnell College
Iowa State University1
Loras College
Luther College1
Maharishi University of Management
Morningside College1
Mount Mercy College
Northwestern College
Saint Ambrose University1
Simpson College1
University of Dubuque
University of Iowa
University of Northern Iowa1
Waldorf College
Wartburg College1
KansasBaker University
Benedictine College
Bethany College
Emporia State University1
Fort Hays State University1
Friends University
Haskell Indian Nations University2
Kansas State University
McPherson College
MidAmerica Nazarene University
Newman University1
National Survey of Student Engagement | Annual Report 2007 ��
National Survey of Student Engagement | Annual Report 2007 ���� National Survey of Student Engagement | Annual Report 2007 National Survey of Student Engagement | Annual Report 2007 ���� National Survey of Student Engagement | Annual Report 2007
Pittsburg State University
Southwestern College1
University of Kansas
University of Saint Mary
Washburn University1
Wichita State University1
KentuckyAlice Lloyd College
Asbury College
Bellarmine University1
Berea College
Brescia University
Campbellsville University1
Centre College
Eastern Kentucky University1
Georgetown College
Kentucky State University1 2
Lindsey Wilson College
Morehead State University1
Murray State University1
Northern Kentucky University
Sullivan University1
Thomas More College
Transylvania University1
Union College
University of Kentucky
University of Louisville
Western Kentucky University1
LouisianaCentenary College of Louisiana
Dillard University2
Louisiana State University and A&M College1
Louisiana State University-Shreveport
Louisiana Tech University
Loyola University New Orleans1
McNeese State University
Northwestern State University of Louisiana
Our Lady of the Lake College
Southeastern Louisiana University1
Southern University and A&M College2
Tulane University of Louisiana
University of Louisiana at Lafayette
University of Louisiana at Monroe
Xavier University of Louisiana2
MaineCollege of the Atlantic
Husson College1
Saint Joseph’s College (Maine)
Thomas College1
Unity College1
University of Maine
University of Maine at Augusta
University of Maine at Farmington1
University of Maine at Fort Kent
University of Maine at Machias
University of Maine at Presque Isle1
University of New England
University of Southern Maine1
MarylandBowie State University2
College of Notre Dame of Maryland1
Coppin State University2
Frostburg State University
Goucher College
Hood College
Loyola College in Maryland1
McDaniel College1
Morgan State University1 2
Mount St. Mary’s University1
Salisbury University
Sojourner-Douglass College2
St. Mary’s College of Maryland
Towson University1
United States Naval Academy1
University of Maryland-Baltimore County1
University of Maryland-College Park
University of Maryland-Eastern Shore1 2
Villa Julie College1
Washington College
MassachusettsAssumption College
Babson College
Bay Path College
Boston Architectural College
Boston University
Bridgewater State College
Clark University
College of the Holy Cross
Dean College
Emerson College
Emmanuel College
Endicott College1
Fitchburg State College1
Framingham State College1
Franklin W. Olin College of Engineering
Gordon College
Hampshire College1
Lesley University
Massachusetts College of Liberal Arts1
Merrimack College
Mount Ida College
Nichols College1
Northeastern University
Pine Manor College1
Regis College
Simmons College
Simons Rock College of Bard
Springfield College1
Stonehill College
Suffolk University1
University of Massachusetts-Amherst1
University of Massachusetts-Boston
University of Massachusetts-Dartmouth
University of Massachusetts-Lowell1
Wentworth Institute of Technology1
Western New England College
Wheaton College1
Wheelock College
Williams College
Worcester Polytechnic Institute1
MichiganAdrian College
Albion College
Alma College1
Calvin College
Central Michigan University1
Cleary University1
Concordia University
Davenport University
Eastern Michigan University1
Ferris State University
Grand Valley State University1
Great Lakes Christian College
Hope College
Kalamazoo College
Kettering University
Kuyper College
Lawrence Technological University
Madonna University
Michigan State University
Michigan Technological University
Northern Michigan University
Northwood University-Michigan Campus
Oakland University
Spring Arbor University
University of Detroit Mercy1
University of Michigan-Ann Arbor1
University of Michigan-Dearborn1
University of Michigan-Flint1
Wayne State University1
Western Michigan University1
MinnesotaAugsburg College1
Bemidji State University
Bethany Lutheran College
Bethel University1
Capella University
College of Saint Benedict, The
College of Saint Scholastica, The
College of of Saint Catherine, The1
Concordia College at Moorhead
Concordia University-Saint Paul1
Gustavus Adolphus College1
Hamline University
MacAlester College
Martin Luther College
Metropolitan State University
Minnesota State University-Mankato1
Minnesota State University-Moorhead
Saint Mary’s University of Minnesota
Southwest Minnesota State University
St. Cloud State University
St. Olaf College
University of Minnesota-Crookston
University of Minnesota-Duluth
University of Minnesota-Morris
University of St. Thomas1
MississippiAlcorn State University2
Delta State University1
Jackson State University1 2
Millsaps College
Mississippi State University
Mississippi State University-Meridian Campus
Participating Colleges and Universities: 2000-2007 (continued)
National Survey of Student Engagement | Annual Report 2007 ���� National Survey of Student Engagement | Annual Report 2007 National Survey of Student Engagement | Annual Report 2007 ���� National Survey of Student Engagement | Annual Report 2007
Mississippi Valley State University2
Tougaloo College2
University of Mississippi
University of Southern Mississippi
William Carey University
MissouriAvila University
Barnes-Jewish College of Nursing and Allied Health
Central Methodist University1
College of the Ozarks
Columbia College1
Drury University1
Fontbonne University
Harris-Stowe State University2
Kansas City Art Institute
Maryville University of Saint Louis1
Missouri Baptist University
Missouri Southern State University1
Missouri State University1
Missouri Valley College1
Missouri Western State University
Northwest Missouri State University1
Rockhurst University1
Saint Louis University
Southeast Missouri State University
Truman State University1
University of Central Missouri1
University of Missouri-Columbia
University of Missouri-Kansas City1
University of Missouri-Rolla
University of Missouri-St. Louis1
Webster University Worldwide
Westminster College
William Jewell College
William Woods University1
MontanaCarroll College
Montana State University-Billings1
Montana State University-Bozeman
Salish Kootenai College2
University of Montana, The University of Great Falls
NebraskaChadron State College1
College of Saint Mary
Concordia University Nebraska
Creighton University1
Doane College
Hastings College
Nebraska Methodist College1
Nebraska Wesleyan University1
University of Nebraska at Kearney1
University of Nebraska at Lincoln1
University of Nebraska at Omaha1
Wayne State College1
NevadaNevada State College at Henderson
University of Nevada-Las Vegas
University of Nevada-Reno1
New HampshireColby-Sawyer College1
Daniel Webster College
Franklin Pierce College
Keene State College1
New England College1
Plymouth State University1
Rivier College
Saint Anselm College
New JerseyBloomfield College
Centenary College1
College of New Jersey, The
College of Saint Elizabeth
Drew University1
Fairleigh Dickinson University-Metropolitan Campus
Georgian Court University1
Kean University
Monmouth University1
Montclair State University1
New Jersey City University2
New Jersey Institute of Technology
Ramapo College of New Jersey
Richard Stockton College of New Jersey, The1
Rider University
Rowan University
Rutgers University-New Brunswick/Piscataway
Saint Peters College2
Seton Hall University1
Stevens Institute of Technology1
William Paterson University of New Jersey1
New MexicoEastern New Mexico University1 2
Institute of American Indian and Alaska Native Culture2
New Mexico Institute of Mining and Technology
New Mexico State University
University of New Mexico2
Western New Mexico University1 2
New YorkAdelphi University1
Alfred University1
Barnard College
Binghamton University
Canisius College
Cazenovia College1
Clarkson University
Colgate University
College of New Rochelle, The
College of Saint Rose, The
Concordia College
CUNY Bernard M Baruch College1
CUNY Brooklyn College1
CUNY City College
CUNY College of Staten Island
CUNY Hunter College1
CUNY John Jay College Criminal Justice
CUNY Lehman College2
CUNY Medgar Evers College1 2
CUNY New York City College of Technology2
CUNY Queens College
CUNY York College
Daemen College1
Elmira College1
Farmingdale State University of New York
Fordham University
Hamilton College
Hartwick College1
Hobart and William Smith Colleges
Hofstra University
Houghton College1
Iona College
Ithaca College
Keuka College
Laboratory Institute of Merchandising
Le Moyne College
Long Island University-Brooklyn Campus1
Manhattanville College1
Marist College
Marymount College of Fordham University
Marymount Manhattan College
Medaille College1
Mercy College2
Molloy College
Mount Saint Mary College1
Nazareth College of Rochester1
New School, The
Niagara University
Pace University1
Paul Smiths College1
Polytechnic University1
Roberts Wesleyan College
Rochester Institute of Technology
Russell Sage College
Sage College of Albany
Saint Bonaventure University
Saint Joseph’s College1
Saint Joseph’s College-Suffolk Campus1
Sarah Lawrence College
School of Visual Arts
Siena College1
Skidmore College
State University of New York at Geneseo, The
St. Francis College
St. John’s University-New York1
St. Lawrence University
Stony Brook University1
SUNY at Buffalo
SUNY College at Brockport1
SUNY College at Old Westbury
SUNY College at Oneonta
SUNY College at Oswego1
SUNY College at Plattsburgh
SUNY College at Purchase1
SUNY College of Environmental Science and Forestry
SUNY Fredonia
SUNY Potsdam
SUNY-Buffalo State College1
Syracuse University
Touro College
Union College
United States Merchant Marine Academy1
United States Military Academy
Vassar College
Wagner College1
National Survey of Student Engagement | Annual Report 2007 ���� National Survey of Student Engagement | Annual Report 2007 National Survey of Student Engagement | Annual Report 2007 ���� National Survey of Student Engagement | Annual Report 2007
Webb Institute
Wells College1
North CarolinaAppalachian State University
Barton College1
Belmont Abbey College
Bennett College for Women2
Campbell University Inc.
Catawba College
East Carolina University
Elizabeth City State University1 2
Elon University
Fayetteville State University1 2
Gardner-Webb University1
Greensboro College1
Guilford College1
High Point University
Johnson C Smith University2
Lees-McRae College1
Lenoir-Rhyne College
Livingstone College2
Mars Hill College
Meredith College1
Methodist University
North Carolina A&T State University1 2
North Carolina Central University2
North Carolina State University
Peace College
Pfeiffer University
Queens University of Charlotte
Salem College1
St. Andrews Presbyterian College
University of North Carolina at Asheville
University of North Carolina at Chapel Hill
University of North Carolina at Charlotte
University of North Carolina at Greensboro
University of North Carolina at Pembroke
University of North Carolina Wilmington1
Warren Wilson College1
Western Carolina University1
Wingate University
Winston-Salem State University1 2
North DakotaDickinson State University1
Mayville State University1
Minot State University1
North Dakota State University1
University of Mary
University of North Dakota1
Valley City State University1
OhioAntioch College1
Baldwin-Wallace College1
Bowling Green State University1
Capital University
Case Western Reserve University
Cedarville University1
Central State University2
Cleveland State University
College of Mount St. Joseph
College of Wooster, The
Columbus College of Art and Design1
Defiance College1
Denison University1
Franciscan University of Steubenville1
Heidelberg College1
Hiram College1
John Carroll University1
Kent State University1
Kenyon College
Lourdes College1
Malone College
Marietta College
Miami University-Oxford1
Mount Union College1
Notre Dame College1
Ohio Christian University
Ohio Northern University1
Ohio State University at Newark, The
Ohio State University, The
Ohio State University-Mansfield Campus
Ohio University
Ohio University-Zanesville Campus
Ohio Wesleyan University
Otterbein College
Tiffin University
University of Akron, The1
University of Cincinnati1
University of Dayton
University of Findlay, The
University of Toledo-Main Campus
Urbana University1
Ursuline College1
Walsh University
Wilmington College
Wittenberg University
Wright State University
Xavier University1
Youngstown State University
OklahomaEast Central University
Northwestern Oklahoma State University
Oklahoma City University1
Oklahoma State University
Oral Roberts University
Rogers State University
Southeastern Oklahoma State University
Southern Nazarene University
University of Central Oklahoma
University of Oklahoma Norman Campus
University of Science and Arts of Oklahoma
University of Tulsa1
OregonConcordia University
Eastern Oregon University1
George Fox University1
Lewis & Clark College
Linfield College
Northwest Christian College1
Oregon State University1
Pacific University1
Portland State University1
Southern Oregon University
University of Oregon
University of Portland
Warner Pacific College
Western Oregon University
Willamette University
PennsylvaniaAlbright College
Allegheny College1
Alvernia College
Arcadia University
Bloomsburg University of Pennsylvania
Bryn Mawr College
Bucknell University
Cabrini College
California University of Pennsylvania1
Carnegie Mellon University
Cedar Crest College
Chatham College1
Chestnut Hill College
Cheyney University of Pennsylvania2
College Misericordia
Delaware Valley College1
Dickinson College
Drexel University1
Duquesne University
Eastern University1
Edinboro University of Pennsylvania
Elizabethtown College
Franklin and Marshall College
Gettysburg College
Grove City College1
Gwynedd Mercy College
Holy Family University
Indiana University of Pennsylvania
Juniata College1
Keystone College
La Roche College
La Salle University
Lafayette College
Lebanon Valley College
Lincoln University of Pennsylvania1 2
Lock Haven University of Pennsylvania
Mansfield University of Pennsylvania
Marywood University
Mercyhurst College
Messiah College
Millersville University of Pennsylvania
Moore College of Art and Design
Moravian College and Moravian Theological Seminary
Mount Aloysius College
Muhlenberg College
Neumann College1
Pennsylvania College of Technology
Pennsylvania State University
Pennsylvania State University-Abington1
Pennsylvania State University-Altoona
Pennsylvania State University-Berks1
Pennsylvania State University-Erie, The Behrend College
Philadelphia University1
Point Park University
Participating Colleges and Universities: 2000-2007 (continued)
National Survey of Student Engagement | Annual Report 2007 ���� National Survey of Student Engagement | Annual Report 2007 National Survey of Student Engagement | Annual Report 2007 ���� National Survey of Student Engagement | Annual Report 2007
Robert Morris University
Rosemont College
Saint Francis University
Saint Joseph’s University
Saint Vincent College1
Seton Hill University
Shippensburg University of Pennsylvania
Slippery Rock University of Pennsylvania1
Susquehanna University1
Swarthmore College
Temple University
Thiel College1
University of Pittsburgh
University of Pittsburgh-Bradford
University of Pittsburgh-Greensburg1
University of Pittsburgh-Johnstown1
University of Scranton
University of the Arts, The
University of the Sciences in Philadelphia
Ursinus College1
Villanova University
Washington & Jefferson College
Waynesburg College
Widener University
Wilkes University
Wilson College
York College Pennsylvania
Puerto RicoInter American University of Puerto Rico- Ponce Campus2
Inter American University of Puerto Rico- San German2
Pontifical Catholic University of Puerto Rico-Ponce2
Universidad Del Este2
Universidad Politecnica de Puerto Rico2
University of Puerto Rico-Humacao1 2
University of Puerto Rico-Mayaguez2
University of Puerto Rico-Ponce1 2
University of Puerto Rico-Rio Piedras Campus1
University of Puerto Rico-Utuado2
Rhode IslandBryant University1
Providence College
Rhode Island College
Rhode Island School of Design
Roger Williams University1
Salve Regina University
University of Rhode Island
South CarolinaAnderson University
Benedict College2
Bob Jones University
Citadel, The Military College of South Carolina, The
Claflin University2
Clemson University
Coker College1
College of Charleston
Columbia College1
Columbia International University
Converse College1
Francis Marion University
Furman University
Lander University
Limestone College
Morris College2
Presbyterian College1
Southern Wesleyan University
University of South Carolina Aiken1
University of South Carolina Columbia
University of South Carolina Upstate1
University of South Carolina-Beaufort1
Voorhees College1 2
Winthrop University1
Wofford College
South DakotaAugustana College
Black Hills State University1
Dakota State University1
Dakota Wesleyan University
Mount Marty College
Northern State University1
Oglala Lakota College2
South Dakota School of Mines and Technology1
South Dakota State University1
University of South Dakota1
TennesseeAustin Peay State University
Baptist Memorial College of Health Sciences1
Belmont University1
Bryan College1
Christian Brothers University
East Tennessee State University
Fisk University
Johnson Bible College
Lane College2
Le Moyne-Owen College2
Lee University
Lincoln Memorial University
Lipscomb University1
Martin Methodist College
Maryville College
Middle Tennessee State University
Milligan College1
Rhodes College1
Sewanee: The University of the South1
Southern Adventist University1
Tennessee State University2
Tennessee Technological University
Trevecca Nazarene University
Tusculum College1
Union University
University of Memphis
University of Tennessee at Chattanooga, The1
University of Tennessee Martin, The
University of Tennessee, The1
TexasAbilene Christian University1
Angelo State University
Austin College1
Baylor University
Concordia University at Austin
Hardin-Simmons University
Howard Payne University
Huston-Tillotson University2
Jarvis Christian College2
Lamar University
LeTourneau University
McMurry University1
Northwood University-TX Campus
Our Lady of the Lake University-San Antonio2
Paul Quinn College
Prairie View A&M University1 2
Rice University
Sam Houston State University1
Southwestern Assemblies of God University
Southwestern University1
St. Edward’s University
St. Mary’s University1 2
Stephen F. Austin State University1
Tarleton State University1
Texas A&M International University1 2
Texas A&M University
Texas A&M University-Commerce1
Texas A&M University-Corpus Christi2
Texas A&M University-Galveston1
Texas A&M University-Kingsville1 2
Texas A&M University-Texarkana
Texas Christian University1
Texas Lutheran University1
Texas State University-San Marcos1
Texas Tech University
Texas Woman’s University1
University of Dallas
University of Houston
University of Houston-Downtown1 2
University of North Texas
University of St. Thomas2
University of Texas at Arlington, The1
University of Texas at Austin, The1
University of Texas at Brownsville, The
University of Texas at Dallas, The1
University of Texas at El Paso, The2
University of Texas at San Antonio, The1 2
University of Texas at Tyler, The1
University of Texas of the Permian Basin, The2
University of Texas-Pan American, The1 2
University of the Incarnate Word1 2
West Texas A&M University1
Wiley College1 2
UtahBrigham Young University1
Southern Utah University
University of Utah
Utah State University1
Weber State University
Western Governors University
Westminster College1
VermontBennington College
Champlain College
Johnson State College
Lyndon State College
Marlboro College
Middlebury College
Norwich University1
National Survey of Student Engagement | Annual Report 2007 ���� National Survey of Student Engagement | Annual Report 2007 National Survey of Student Engagement | Annual Report 2007 ���� National Survey of Student Engagement | Annual Report 2007
Saint Michaels College
Sterling College
University of Vermont1
Woodbury College
Virgin IslandsUniversity of the Virgin Islands2
VirginiaArt Institute of Washington, The
Bridgewater College
Christopher Newport University
College of William and Mary
Eastern Mennonite University
Emory and Henry College
Ferrum College
George Mason University1
Hampden-Sydney College1
Hollins University
James Madison University
Liberty University
Longwood University1
Lynchburg College
Mary Baldwin College
Marymount University1
Norfolk State University1 2
Old Dominion University
Radford University1
Randolph College
Randolph-Macon College
Roanoke College1
Shenandoah University1
Southern Virginia University1
Sweet Briar College
University of Mary Washington
University of Richmond1
University of Virginia
University of Virginia’s College at Wise, The
Virginia Commonwealth University1
Virginia Intermont College
Virginia Military Institute
Virginia Polytechnic Institute and State University
Virginia Union University2
Virginia Wesleyan College
Washington and Lee University1
WashingtonCentral Washington University
Eastern Washington University
Evergreen State College, The1
Gonzaga University
Heritage University1 2
Pacific Lutheran University
Seattle Pacific University1
Seattle University
University of Puget Sound
University of Washington, Bothell
University of Washington Tacoma
University of Washington-Seattle
Washington State University1
Western Washington University
Whitman College
Whitworth College1
West VirginiaBethany College1
Concord University
Davis & Elkins College
Fairmont State University
Marshall University
Mountain State University1
Shepherd University
University of Charleston1
West Liberty State College
West Liberty State University
West Virginia University1
West Virginia University Institute of Technology
West Virginia Wesleyan College1
Wheeling Jesuit University1
WisconsinAlverno College1
Beloit College
Cardinal Stritch University
Carroll College1
Carthage College
Concordia University-Wisconsin
Edgewood College1
Lakeland College
Lawrence University
Marantha Baptist Bible College
Marian College of Fond du Lac1
Marquette University
Milwaukee Institute of Art Design1
Milwaukee School of Engineering
Mount Mary College1
Northland College
Ripon College
University of Wisconsin-Eau Claire1
University of Wisconsin-Green Bay1
University of Wisconsin-La Crosse1
University of Wisconsin-Madison
University of Wisconsin-Milwaukee1
University of Wisconsin-Oshkosh1
University of Wisconsin-Parkside1
University of Wisconsin-Platteville1
University of Wisconsin-River Falls1
University of Wisconsin-Stevens Point1
University of Wisconsin-Stout1
University of Wisconsin-Superior
University of Wisconsin-Whitewater1
Viterbo University
Wisconsin Lutheran College1
WyomingUniversity of Wyoming1
Canada
AlbertaUniversity of Alberta
University of Calgary1
University of Lethbridge
British ColumbiaRoyal Roads University
Trinity Western University
University of British Columbia
University of Northern British Columbia
University of Victoria
ManitobaThe University of Manitoba
New BrunswickMount Allison University
St. Thomas University
University of New Brunswick - Fredericton Campus
University of New Brunswick - Saint John Campus
Nova ScotiaAcadia University
Dalhousie University
Ontario
Brescia University College
Brock University
Carleton University1
Huron University College
King’s University College at the University of Western Ontario
Lakehead University
Laurentian University/Université Laurentienne
McMaster’s University
Nipissing University
Ontario College of Art and Design
Queen’s University
Ryerson University
Trent University
University of Guelph
University of Ontario Institute of Technology
University of Ottawa/Université d’Ottawa
University of Toronto
University of Waterloo
University of Western Ontario
University of Windsor
Wilfrid Laurier University
York University
QuebecConcordia University
McGill University
Université Laval
Prince Edward IslandUniversity of Prince Edward Island1
SaskatchewanUniversity of Regina
University of Saskatchewan
LebanonLebanese American University1
United Arab EmiratesThe Petroleum Institute
1 Participated in the Faculty Survey of Student Engagement (FSSE)
2 Participating in the Building Engagement and Attainment of Minority Students project (BEAMS)
Participating Colleges and Universities: 2000-2007 (continued)
National Survey of Student Engagement | Annual Report 2007 ���� National Survey of Student Engagement | Annual Report 2007 National Survey of Student Engagement | Annual Report 2007 ���� National Survey of Student Engagement | Annual Report 2007
NationalSurveyofStudentEngagement
Director . . . . . . . . . . . . . . . . . . . George Kuh
Associate Director,
Research & Data Analysis . . . . . . . . . . Robert Gonyea
Associate Director,
NSSE Institute & BEAMS . . . . . . . . . . Jillian Kinzie
Assistant Director, Survey Operations . . . . Todd Chamberlain
Finance Manager . . . . . . . . . . . . . . . Kim Fatten
Finance Assistant . . . . . . . . . . . . . . . Lyndsey Gibson
BCSSE Project Manager
& Research Analyst . . . . . . . . . . . . . James S. Cole
CSEQ Project Manager
& Research Analyst . . . . . . . . . . . . . Julie Williams
CSEQ/Local NSSE
Project Associates . . . . . . . . . . . . . . Michelle Salinas Holmes Kathleen Zaback
FSSE Project Manager . . . . . . . . . . . . Thomas F. Nelson Laird
FSSE Project Associates . . . . . . . . . . . Amy Garver Amanda Suniti Niskodé
LSSSE Project Manager . . . . . . . . . . . Lindsay Watkins
NSSE Client Services Coordinator . . . . . . Chad Ahren
NSSE Client Services
Project Associates . . . . . . . . . . . . . . Julianna Banks Elizabeth Beeler Dan Bureau Chad Christensen Kevin Guidry Tony Ribera Mahauganee Shaw Lisa Wallace
NSSE Institute Project Manager . . . . . . . Kathy Anderson
NSSE Institute Project Associate . . . . . . Jennifer Buckley
Research Analysts . . . . . . . . . . . . . . Pu-Shih Daniel Chen Ali Korkmaz Shimon Sarraf Rick Shoup
Web Developer . . . . . . . . . . . . . . . . Jonathan Tweedy
Office Coordinator. . . . . . . . . . . . . . Erin Whisler
Office Secretary . . . . . . . . . . . . . . . Barbara Stewart
Project Support Staff . . . . . . . . . . . . . Stephen Berry Sarah Feagles
IndianaUniversityCenterforSurveyResearch
Director . . . . . . . . . . . . . . . . . . . John Kennedy
Associate Director . . . . . . . . . . . . . . Nancy Bannister
Assistant Director, Finance . . . . . . . . . . Maryanne McDonnell
Assistant Director, Technology. . . . . . . . Kevin Tharp
Project Managers. . . . . . . . . . . . . . . Julie Baker Heather Brummell
Field Manager, Mail . . . . . . . . . . . . . Jaime Roberts
Field Manager, Telephone . . . . . . . . . . Lilian Yahng
Research Assistants. . . . . . . . . . . . . . Kristin McCormick Frankie Ferrell Amanda Wrigley Ray Zdonek
Senior Supervisor. . . . . . . . . . . . . . . Sojourner Manns
Programmer/Analyst . . . . . . . . . . . . . Jason Francis
Computing Assistants . . . . . . . . . . . Push Wijegunawardena
Kennesaw State University
NSSE Staff
w w w. n s s e . i u b . e d u
Center for Postsecondary Research School of Education Indiana University Bloomington 1900 E. Tenth Street Eigenmann Hall, Suite 419 Bloomington, IN 47406-7512
Phone: 812-856-5824 Fax: 812-856-5150 E-mail: [email protected] Web: www.nsse.iub.edu


