XXXIV SIMPOSIO BRASILEIRO DE TELECOMUNICACOES - SBrT2016, AUGUST 30 TO SEPTEMBER 02, SANTAREM, PA
Experiments of Speech Enhancement Based on
Deep Neural Networks in Far Field ScenariosJacques H. Bessa Araujo, Walter da Cruz Freitas Jr, Andre Lima Ferrer de Almeida and Diego Dutra Viot
Abstract— Efficient speech enhancement techniques are
essential to improve quality and intelligibility of speech
signals and reliability in voice recognition applications. One
way to reduce word error rate is through powerful noise
reduction algorithms. This paper is intended to provide speech
enhancement experiments based on deep neural networks
(DNN) in far field scenarios under noisy environments. In the
present work, it is investigated the use of DNNs as a front-end
for automatic speech recognition (ASR). Objective metrics are
used to investigate its effectiveness and results are compared
against several popular speech enhancement algorithms. It is
shown that DNN provides better results under all noisy and
SNR conditions.
Keywords— Speech enhancement, deep neural networks
(DNNs), spectral mapping.
I. INTRODUCTION
Far-field automatic speech recognition (ASR) remains a
challenging research field, once it is difficult to obtain the
same accuracy degree of close-talking conditions. It is hoped
that an efficient ASR is capable to interact with humans even
in situations that have hard identification or intelligibility, like
command control in factories or situations that a TV behave
as interference signal.
More powerful methods are necessary to further reduce
the word error rate and improve the robustness of speech
recognition systems across various adverse conditions. In this
context, signal processing techniques are effective allies to
improve results from an ASR system. Some techniques has
been employed to provide speech enhancement under noisy
and reverberant environments, such as spectral subtraction [1],
Wiener filter [2] and sensor array [3].
The non-linear spectral subtraction presented in [1] is a
modification of the standard spectral subtraction algorithm
method proposed in [4] by making the over-subtraction factor
frequency dependent and the subtraction process nonlinear. In
[2], it was proposed an approach for the speech enhancement
method based on prior signal-to-noise ratio (SNR). Sensor
array is another strategy to extract speech from corrupted
signals. In this technique, signals from a given desired di-
rection are reinforced, while signals from all other directions
are attenuated through a microphone-array beamforming [3].
Jacques H. Bessa Araujo, Walter da Cruz Freitas Jr, Andre LimaFerrer de Almeida and Diego Dutra Viot, Department of Teleinfor-matics Engineering, Federal University of Ceara, Fortaleza-CE, Brazil.E-mails: [email protected], [email protected], [email protected],[email protected].
Other research direction that has been largely used for
speech enhancement is artificial neural networks (ANN) [5]
[6] [7]. It consists a hierarchical representation of data whereas
each layer can be seen as a high-level abstraction of previous
one. Deep neural network (DNN) is a term derived from ANN
and represents a conventional multilayer perceptron (MLP)
with many (often more than two) hidden layers, whose weights
are fully connected and often initialized either an unsupervised
or a supervised pre-training technique [8].
In [5], it was presented a framework of speech enhancement
based on deep neural networks in which the log-power spectral
features were used to train a DNN. The DNN-based speech
enhancement system was improved in [6], in which three tech-
niques were added to improve robustness in mismatched cases,
sharp the formant peaks of the recovered speech, suppress the
residual noise and improve clean speech prediction.
In this paper, experiments to estimate clean speech from
noisy signals through a spectral non-linear regression using
supervised and unsupervised learning are presented. Three
different types of noises (fan, living room and tv news) and
three distances (1m, 2m and 3m) are used for training and
tests.
The rest of this paper is organized as follows. In Section II,
a brief system overview and the basic algorithm for training
are described. The following section show in details the set of
parameters and strategies used in the experiments are shown
in details. The experimental results are presented in Section
IV. Finally, our findings are summarized in Section V.
II. SYSTEM DESCRIPTION
The system, illustrated in Fig. 1, is composed by the
following processes: feature extraction, DNN training, DNN
decoding and waveform reconstruction.
The first stage consists to extract features of training ut-
terances. Each speech signal is divided into a set of short-
time overlapped frames. The Hanning windowing function is
employed to reduce spectral leakage effect. Short-time discrete
Fourier transform (STFT) and log-power spectra are computed
to obtain speech features used as input to DNN.
The process is finished in the waveform reconstruction
block, in which inverse Fourier transform is performed and
frames in time-domain are rearranged through an overlap-add
method. Thus, estimations of clean signals in time domain are
obtained. In next subsections, it is presented each one of these
blocks in detail.
90

XXXIV SIMPOSIO BRASILEIRO DE TELECOMUNICACOES - SBrT2016, AUGUST 30 TO SEPTEMBER 02, SANTAREM, PA
Feature
Extraction
Clean/Noisy
Samples
DNN
Training
Noisy
Samples
Feature
Extraction
DNN
Decoding
Waveform
Reconstruction
Final Weight Matrices, biasesEnhancement Stage
Training Stage
Phase Information
Exp(.) IDFT Overlap-Add
Waveform Reconstruction
Phase Information
Framing with
OverlappingWindowing
Magnitude Log(.)
Feature Extraction
DFT
Phase
Fig. 1. Block diagram of the DNN-based speech enhancement [5].
A. Feature Extraction
Feature extraction process is necessary to get a represen-
tation with low dimension and less redundant information of
speech signals. Each utterance is downsampled to 8 kHz and
divided into a series of overlapped frames. The frame length
is chosen short enough so that noise is considered quasi-
stationary and large to guarantee that spectral features remains
measurable. Discrete Fourier transform (DFT) is applied to
each frame and log-power magnitude spectrum is used as input
to neural network. The original phase information is used in
reconstruction stage. At low SNRs, clean and noisy phases
are quite different [6]. Many efforts have been devoted to
investigate a way to deal with this task of precisely estimating
clean phase information from an utterance corrupted by noise
[9].
B. Deep Neural Network
1) Pre-training with restricted Boltzmann machine: Pre-
training is employed to provide a reduction of mean square
error (MSE) and avoid local minima. Some techniques, like
restricted Boltzmann machines (RBM) and denoising autoen-
coder, have been successfully used. RBM is defined as an
unsupervised algorithm that uses a dataset to make initial
adjustments to weights and biases instead of initial random
values in traditional neural networks. Due to size of layers,
contrastive divergence algorithm [10] is used to estimate a
given data in visible and hidden layers through an specified
number of iterations. One-step contrastive divergence approx-
imation for the gradient with regard to the visible-hidden
weights is [11]:
∇WijJNLL(W, a,b;v) = −[〈vihj〉data − 〈vihj〉∞],
≈ −[〈vihj〉data − 〈vihj〉1],(1)
where W is the weight matrix, a is the visible layer bias
vector, b is the hidden layer bias vector, 〈.〉∞ and 〈vihj〉1denote the exception computed with samples generated by
running the Gibbs sampler infinite and one step, respectively,
vi denote the ith visible neuron and hj is the jth hidden neuron.
According to [12], before any training, most hidden prob-
abilities should be around 0.5 with some as low as 0.4 or
as high as 0.6. Otherwise, all hidden neurons have already
determined what features they are looking for before seeing
any of the data. It is usually helpful to initialize the weights
and biases to small random values chosen from a zero-mean
Gaussian with a standard deviation of about 0.01. Using larger
random values can speed the initial learning, but it may lead to
a slightly worse final model [13]. A set of tips like how to set
the values of numerical meta-parameters such as the learning
rate, the momentum, the weight-cost, the initial values of the
weights, the number of hidden units and the size of each mini-
batch can also be found in [13].
2) Fine-Tunning: The conventional multilayer perceptron
(MLP) based on MSE criterion is used to perform this stage.
The minibatch training is used to estimate the gradient with
multiple epochs to improve learning convergence. Minibatch
training allows to parallelize the computations within the
minibatch and thus can converge faster than stochastic gradient
descent (SGD) [11]. The MSE is defined as:
JMSE(W,b;om,ym) =1
M
M∑
m=1
1
2(vL − ym)T (vL − ym),
(2)
where om is the mth observation vector, vL is the output
vector, ym is the corresponding desired output vector and L
is the number of layers.
The sigmoid function is used as activation function for
hidden units, while a linear layer is used to obtain the output
vector.
C. Waveform Reconstruction
Finally, in the last stage, three processes are used to recon-
struct signals: exponential operation, inverse discrete Fourier
transform (IDFT) and overlap-add. Exponential operation con-
verts back to linear scale, IDFT converts frequency-domain
frames back to time domain representation and overlap-add is
a procedure to synthesize the set of overlapped frames in time
domain.
III. EXPERIMENTS
The CMU Communicator corpus [14] was partially used
to conduct the experiments. Three additive noise conditions
were examined: fan, living room and tv news. Clean audio files
were corrupted with these noise types. Table I shows the SNR
91

XXXIV SIMPOSIO BRASILEIRO DE TELECOMUNICACOES - SBrT2016, AUGUST 30 TO SEPTEMBER 02, SANTAREM, PA
TABLE I
SNR LEVELS FOR EACH TYPE NOISE IN DISTANCES FROM 1M TO 3M
1 m 2 m 3 m
Fan 12 dB 10 dB 8 dB
Living room 8 dB 6 dB 4 dB
TV News 4 dB 2 dB 0 dB
levels for each noise type and distances to the source. Multi-
condition training set contains about 19 hours of simulated
speech data. Validation and test set consist of approximately 4
and 2 hours, respectively. The frame length was set to 32 ms
with a frame shift of 50%. The segment overlap from 50% to
85.5% can significantly improve the quality of noisy speech
[15]. The DFT size was 256. An expansion of 11 frames
was used as input to DNN. A total of 3 hidden layers were
used with 2048 neurons each one. The weight matrices were
initialized with random values and standard deviation of 0.01.
Learning rate of pre-training was set as 0.0005. The mini-
batch size was 128. The initial and final momentum was 0.5
and 0.9, respectively. Four different learning rates of training
was empirically found and their respectively values are 0.0512,
0.0256, 0.0128 and 0.0004.
To compare algorithm performance, we plot results for two
other popular speech enhancement methods, namely spectral
subtraction [1] and Wiener filter [2].
Three metrics are used to performance evaluation. The
first one is short-time objective intelligibility (STOI) score
[16]. STOI algorithm compares temporal envelopes of clean
and degraded speech in short time segments by means of
a correlation coefficient. The output is a scalar value which
have a monotonic relation with the average intelligibility and
range from 0 to 1. The second measure is log-spectral distance
(LSD) [17], an Euclidean distance between log spectra to
evaluate the fundamental distortion criteria. The perceptual
evaluation of speech quality (PESQ) [18] is the third objective
measure and the most complex to compute. The algorithm
estimates the objective mean opinion score between original
and degraded speech signal. This metric has a high correlation
with subjective score.
IV. RESULTS AND DISCUSSION
The Fig. 2(a) presents a comparative of log-spectral distance
for fan noise between the three algorithms. DNN has the best
results reaching an average value of 0.77. It also has the best
result under living room noise, as we can see in Fig. 2(b). The
performance difference was more significant in this scenario
for spectral subtraction and Wiener filter because this noise
consists of impulsive sounds. The distortion degree caused
by tv news noise is, as we expect, higher than other noises.
The disparity between algorithms is more expressive when we
compare the enhanced versions of corrupted utterances with
tv noise, as we can see in Fig. 2(c).
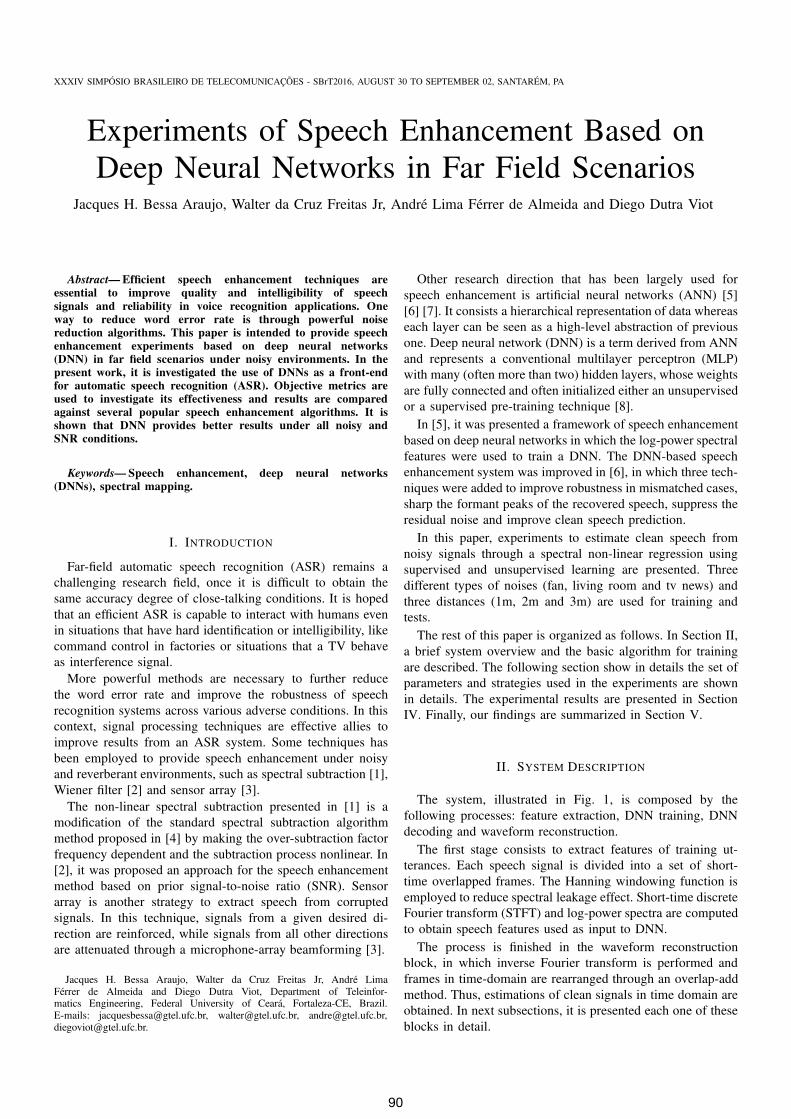
In Fig. 3(a), it is shown intelligibility level measured by
STOI under fan noise. Results confirm DNN efficiency. How-
ever, when compared to the other algorithms, it is possible to
Distance (m)
1 2 30
0.5
1
1.5
2
2.5
3
3.5Spectral Subtraction
Wiener
DNN
(a)
Distance (m)
1 2 30
0.5
1
1.5
2
2.5
3
3.5Spectral Subtraction
Wiener
DNN
(b)
Distance (m)
1 2 30
0.5
1
1.5
2
2.5
3
3.5Spectral Subtraction
Wiener
DNN
(c)
Fig. 2. LSD for scenarios with (a) fan, (b) living room and (c) tv news noise.
observe that the discrepancy is lower than previous analyzed
cases. Although distortion degree is high, this factor do not
contribute significantly to difference between intelligibility
levels. A similar result can be observed in Fig. 3(b). In Fig.
3(c), the difference between average STOI is more evident.
TV News noise disturbs more significantly intelligibility of
spectral subtraction and Wiener filter algorithms results, while
DNN keeps almost the same result of fan and living room
noise.
PESQ results in fan noise scenario are shown in Fig. 4(a).
Although the average difference between the algorithms is
small, the DNN has also the best performance. This small
difference is resulted by high SNR used for fan noise. This
disparity is higher for PESQ result in the other scenarios,
shown in Fig. 4(b) and Fig. 4(c).
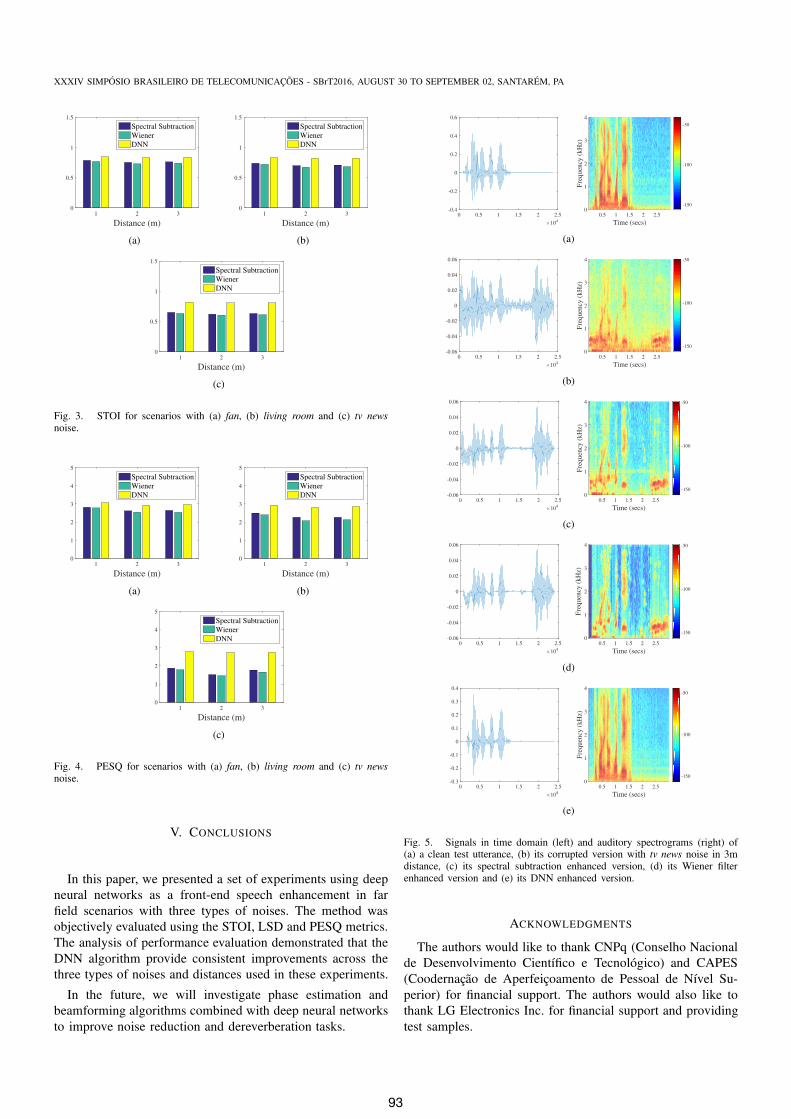
Fig. 5 shows auditory spectrograms comparison between
a clean test utterance, its version corrupted by TV news
noise and their corresponding enhanced versions processed by
spectral subtraction, Wiener filter and DNN algorithms. The
speech utterance is separated into frequency bands and the
frequency channel intensity is represented over time.
From a set of experiments, we conclude that the main
challenge of spectral subtraction and Wiener filter was extract
the signal of interest from the corrupted utterance with tv news
noise, whereas it is more difficult to distinguish the signal of
interest in this scenario. The Figs. 5(d) and 5(c) show the en-
hanced versions of spectral subtraction and Wiener filter. When
we compare these results with the clean version illustrated in
Fig. 5(a), we observe some residual noise. This interference
may directly disturb results from automatic speech recognition
systems. It is possible to infer through spectrogram analysis a
significant noise reduction in three algorithms. However, the
DNN algorithm was the only to efficiently suppress the tv
news noise without causing a significant distortion, as we can
observe in Fig. 2. The suppression of tv news noise by DNN
algorithm can be visualized in Fig 5(e).
92
XXXIV SIMPOSIO BRASILEIRO DE TELECOMUNICACOES - SBrT2016, AUGUST 30 TO SEPTEMBER 02, SANTAREM, PA
Distance (m)
1 2 30
0.5
1
1.5
Spectral Subtraction
Wiener
DNN
(a)
Distance (m)
1 2 30
0.5
1
1.5
Spectral Subtraction
Wiener
DNN
(b)
Distance (m)
1 2 30
0.5
1
1.5
Spectral Subtraction
Wiener
DNN
(c)
Fig. 3. STOI for scenarios with (a) fan, (b) living room and (c) tv news
noise.
Distance (m)
1 2 30
1
2
3
4
5
Spectral Subtraction
Wiener
DNN
(a)
Distance (m)
1 2 30
1
2
3
4
5
Spectral Subtraction
Wiener
DNN
(b)
Distance (m)
1 2 30
1
2
3
4
5
Spectral Subtraction
Wiener
DNN
(c)
Fig. 4. PESQ for scenarios with (a) fan, (b) living room and (c) tv news
noise.
V. CONCLUSIONS
In this paper, we presented a set of experiments using deep
neural networks as a front-end speech enhancement in far
field scenarios with three types of noises. The method was
objectively evaluated using the STOI, LSD and PESQ metrics.
The analysis of performance evaluation demonstrated that the
DNN algorithm provide consistent improvements across the
three types of noises and distances used in these experiments.
In the future, we will investigate phase estimation and
beamforming algorithms combined with deep neural networks
to improve noise reduction and dereverberation tasks.
×104
0 0.5 1 1.5 2 2.5-0.4
-0.2
0
0.2
0.4
0.6
Time (secs)
0.5 1 1.5 2 2.5
Fre
quen
cy (
kH
z)
0
1
2
3
4
-150
-100
-50
(a)
×104
0 0.5 1 1.5 2 2.5-0.06
-0.04
-0.02
0
0.02
0.04
0.06
Time (secs)
0.5 1 1.5 2 2.5
Fre
quen
cy (
kH
z)
0
1
2
3
4
-150
-100
-50
(b)
×104
0 0.5 1 1.5 2 2.5-0.06
-0.04
-0.02
0
0.02
0.04
0.06
Time (secs)
0.5 1 1.5 2 2.5
Fre
qu
ency
(kH
z)
0
1
2
3
4
-150
-100
-50
(c)
×104
0 0.5 1 1.5 2 2.5-0.06
-0.04
-0.02
0
0.02
0.04
0.06
Time (secs)
0.5 1 1.5 2 2.5
Fre
qu
ency
(k
Hz)
0
1
2
3
4
-150
-100
-50
(d)
×104
0 0.5 1 1.5 2 2.5-0.3
-0.2
-0.1
0
0.1
0.2
0.3
0.4
Time (secs)
0.5 1 1.5 2 2.5
Fre
qu
ency
(k
Hz)
0
1
2
3
4
-150
-100
-50
(e)
Fig. 5. Signals in time domain (left) and auditory spectrograms (right) of(a) a clean test utterance, (b) its corrupted version with tv news noise in 3mdistance, (c) its spectral subtraction enhanced version, (d) its Wiener filterenhanced version and (e) its DNN enhanced version.
ACKNOWLEDGMENTS
The authors would like to thank CNPq (Conselho Nacional
de Desenvolvimento Cientıfico e Tecnologico) and CAPES
(Coodernacao de Aperfeicoamento de Pessoal de Nıvel Su-
perior) for financial support. The authors would also like to
thank LG Electronics Inc. for financial support and providing
test samples.
93
XXXIV SIMPOSIO BRASILEIRO DE TELECOMUNICACOES - SBrT2016, AUGUST 30 TO SEPTEMBER 02, SANTAREM, PA
REFERENCES
[1] P. Lockwood and J. Boudy, “Experiments with a nonlinear spectralsubtractor (nss), hidden markov models and the projection, for robustspeech recognition in cars,” Speech Communication, vol. 11, no. 2-3,pp. 215–228, 1992.
[2] P. Scalart et al., “Speech enhancement based on a priori signal to noiseestimation,” in Acoustics, Speech, and Signal Processing, 1996. ICASSP-
96. Conference Proceedings., 1996 IEEE International Conference on,vol. 2. IEEE, 1996, pp. 629–632.
[3] J. Benesty, J. Chen, Y. Huang, and J. Dmochowski, “On microphone-array beamforming from a mimo acoustic signal processing perspective,”Audio, Speech, and Language Processing, IEEE Transactions on, vol. 15,no. 3, pp. 1053–1065, 2007.
[4] S. F. Boll, “Suppression of acoustic noise in speech using spectral sub-traction,” Acoustics, Speech and Signal Processing, IEEE Transactions
on, vol. 27, no. 2, pp. 113–120, 1979.[5] Y. Xu, J. Du, L.-R. Dai, and C.-H. Lee, “An experimental study on
speech enhancement based on deep neural networks,” Signal Processing
Letters, IEEE, vol. 21, no. 1, pp. 65–68, 2014.[6] Y. Xu, J. Du, L.-R. Dai, and C. Lee, “A regression approach to speech
enhancement based on deep neural networks,” Audio, Speech, and
Language Processing, IEEE/ACM Transactions on, vol. 23, no. 1, pp.7–19, 2015.
[7] K. Han, Y. Wang, D. Wang, W. S. Woods, I. Merks, and T. Zhang,“Learning spectral mapping for speech dereverberation and denoising,”Audio, Speech, and Language Processing, IEEE/ACM Transactions on,vol. 23, no. 6, pp. 982–992, 2015.
[8] L. Deng and D. Yu, “Deep learning for signal and information process-ing,” Microsoft Research Monograph, 2013.
[9] S. Vanambathina and T. K. Kumar, “Speech enhancement using bayesianestimation given a priori knowledge of clean speech phase,” Speech
Communication, vol. 77, pp. 8–27, 2016.[10] G. E. Hinton, “Training products of experts by minimizing contrastive
divergence,” Neural computation, vol. 14, no. 8, pp. 1771–1800, 2002.[11] D. Yu and L. Deng, Automatic Speech Recognition. Springer, 2012.[12] J. Yosinski and H. Lipson, “Visually debugging restricted boltzmann
machine training with a 3d example,” in Representation LearningWorkshop, 29th International Conference on Machine Learning, 2012.
[13] G. Hinton, “A practical guide to training restricted boltzmann machines,”Momentum, vol. 9, no. 1, p. 926, 2010.
[14] C. Bennett and A. I. Rudnicky, “The carnegie mellon communicatorcorpus,” 2002.
[15] T. Gerkmann, M. Krawczyk, and R. Rehr, “Phase estimation in speechenhancement unimportant, important, or impossible?” in Electrical &Electronics Engineers in Israel (IEEEI), 2012 IEEE 27th Convention
of. IEEE, 2012, pp. 1–5.[16] C. H. Taal, R. C. Hendriks, R. Heusdens, and J. Jensen, “An algorithm
for intelligibility prediction of time–frequency weighted noisy speech,”Audio, Speech, and Language Processing, IEEE Transactions on, vol. 19,no. 7, pp. 2125–2136, 2011.
[17] J. Benesty, J. Chen, Y. Huang, and I. Cohen, “Spectral enhancementmethods,” in Noise Reduction in Speech Processing. Springer, 2009,pp. 1–30.
[18] A. W. Rix, J. G. Beerends, M. P. Hollier, and A. P. Hekstra, “Perceptualevaluation of speech quality (pesq)-a new method for speech qualityassessment of telephone networks and codecs,” in Acoustics, Speech,
and Signal Processing, 2001. Proceedings.(ICASSP’01). 2001 IEEE
International Conference on, vol. 2. IEEE, 2001, pp. 749–752.
94


