FACTORS INFLUENCING THE ADOPTION OF ENTERPRISE APPLICATION ARCHITECTURE FOR SUPPLY CHAIN MANAGEMENT IN SMALL AND MEDIUM
ENTERPRISES WITHIN CAPRICORN DISTRICT MUNICIPALITY
by
KINGSTON XERXES THEOPHILUS LAMOLA
Submitted in fulfilment of the requirements for the degree of
MASTER OF COMMERCE
in
BUSINESS MANAGEMENT
in the
FACULTY OF MANAGEMENT AND LAW (School of Economics and Management)
at the
UNIVERSITY OF LIMPOPO
SUPERVISOR: PROF GPJ PELSER CO-SUPERVISOR: PROF OO FATOKI
2021

i
DEDICATION
I dedicate this work to my beloved daughters, Queen Vanquesher Lamola and Queen
Quayên Lamola for their precious support, guidance and continuous encouragement
throughout the three years of completion of this study project.
ii
DECLARATION
I declare that the dissertation hereby submitted to the University of Limpopo, for the
degree of MASTER OF COMMERCE in BUSINESS MANAGEMENT has not
previously been submitted by me for a degree at this or any other university; that it is
my work in design and in execution, and that all material contained herein has been
duly acknowledged.
Mr. K.X.T. Lamola 27th April 2021
Title: Ititials & Surname Date

iii
ACKNOWLEDEMENTS
First and foremost, I would like to give all glory to God Almighty, the One who
was, is and is to come, for His guidance, protection and strength that He
invested for the completion of this study (Revelations 4:8).
How can I forget both Prof GPJ Pelser and Prof OO Fatoki, for their extensive
knowledge and wisdom they shared to enable me to accomplishing this
research project? Their enormous expertise on data analysis was an incredible
adventure in my study.
I want to acknowledge awesome and remarkable motivation from my
daughters, Queen Vanquisher Lamola & Queen Quayên Lamola, for their
amusement and thrill when I told them that “Daddy” is a student at the University
of Limpopo. They responded thus: “Wena o kgona go ngwala? (Do you know
how to write?) O ba phale kudukudu…“ (You excel and surpass their them all
with greatest heights…).
Last but not least, I acknowledge my family, for their support and prayers, plus
motivation throughout the execution of this project: you’re the best….
iv
ABSTRACT Increasing consumer demand, customer expectations, and change in technology compel industrial corporations, governments and small medium enterprises (SMEs) to adopt Enterprise Application Architecture (EAA). EAA is a system where the applications and software are connected to each other in such a way that new components can easily be integrated with existing components. This study focused on how internal and external factors impact the adoption of EAA for Supply Chain Management (SCM) in SMEs, located in the Capricorn District Municipality. Data is analysed through a statistical package for the social sciences (SPSS version 25). A quantitative methodology with self-administered questionnaire was used to collect data from SMEs (SMEs owners and managers). In total, 480 questionnaires were distributed and 310 useable were returned. Cronbach’s Alpha was used to measure reliability. Data validity is obtained through the use of Kolmogorov-Sminorv-Test to ensuring that the questionnaire was based on assumptions from accepted theories as set out in the literature review. From the research findings, it was concluded that the adoption of EAA for SCM in SMEs depends on internal factors, external factors and perceived attitudes towards the adoption of EAA. The managerial implications of the study is based on actual results such as; (a) Internal factors on owners’ characteristics were described as assessment of interior dynamics affecting the enterprise, of which the management have a full control over them, such as employees, business culture, norms and ethics, processes and overall functional activities, (b) The Theory of Reasoned Action (TRA) revealed that behavioural measures on Enterprise Resources that depends on speculations about the intensions towards the adoption of EAA for SCM, (c) Compatibility in Diffusion Theory of Innovation ascertains that Technology Acceptance Models need to be linked with relevant Information System Components to have a functional EAA for SCM, (d) The Theory of Planned Behaviour (TPB) encourages apparent behaviour on control for supplementary forecaster on intentions of employees towards the adoption of EAA for SCM in SMEs, (e) The TPB encourages apparent behaviour on control for supplementary forecaster on intentions of employees towards the adoption of EAA for SCM in SMEs, (f) Consultations with government parastatals or legal representatives of the enterprise would save the SMEs against any unforeseen challenges such as product liabilities, legal costs on lawsuit, tax evasion or avoidance penalties so forth, (g) The Diffusion Theory of Innovation (DTI) proposes that the Perceived Attitudes towards the Adoption of EAA have is affected by behaviour challenges from employees’ personal conduct that affect SCM activities within the SMEs, and (h) The DTI on the intention towards the adoption of EAA for SCM provides the competence in limiting some negative thoughts about the integrative phases or steps limiting the adoption of EAA for SCM. Keywords: Enterprise Application Architecture; Supply Chain Management; Internal and External Factors Affecting Adoption; and Technology Acceptance Models
v
EXECUTIVE SUMMARY Assurance in the adoption of EAA for SCM in SMEs
In recent years several programs have emerged to deal with the challenges in
coordinating SCM activities within SMEs based on internal and external factor
affecting the adoption of EAA. The present study provides additional evidence with
respect to some existing software solutions and websites that are developed in South
Africa, that provide the following; learn how to turn an idea into a business, assessing
the funding readiness, starting a crowdfunding campaign, accessing FREE accounting
software service, have no time to read? By listening to audio books, keeping track of
your online reputation, making it easier for SMEs to be found online, taking more useful
notes, talk to your customers, monitoring and tracking freelancers and salespeople,
keeping in the loop with business news and insuring their mobile phones and laptops
(Javan, 2019).
However, what happens when the internal factors, external factors and perceived
attitudes towards the adoption of EAA hit the actual adoption of EAA? The suggestion
with the adoption of EAA is that SMEs will have to be equipped with factors that affect
perceived attitudes towards the adoption of EAA that includes; alternative User-Base
solutions, technological aversion and resistance to change. Fortunately, most SMEs
currently participating in the adoption of EAA already have electronic for a possible
adoption of EAA.
EAA Benefits
While establishing a new enterprise application of any kind bears risk, connecting
SMEs with internal and external stakeholders to address a common EAA problem
offers several advantages; a)flexible access for low-income SMEs is broadened with
minimal involvement with the actual enterprise design, development and
configuration,(b)all SMEs are provided with new markets niches during the
introduction phase in product cycle, (c) the concentration of SMEs during weekend
services ensures a reliable enterprise base for participation, (d) SMEs' markets are
effective in the adoption of EAA that encourages and build the disseminating of EAA
education. The program would require minimal start-up cash flow and the mutual
partnership between SMEs and service provider(s).
vi
Proven Success
Similar programs have thrived within the cloud computing publicity, ERP SaaS is
receiving more focus from ERP vendors such as ERP market leader SAP
announcing SAP by Design, their new ERP SaaS solution (Lechesa, Seymour &
Schuler, 2012). The adoption of EAA is driven by amongst other things; (a) perceived
risk that include; financial risk, social risk and psychological risk (Fatoki, 2014,
Csikszentmihalyi & Larson, 2014, Landgraf, 2016). The ultimate success for the
adoption of EAA depends on initial interest of SME owners and level of algorithms to
be implemented.
Immediate Plan of Action
Given the limited financial resources required to adopt EAA for SCM in SMEs to
commence with the algorithms the following should be considered; (a) contact at least
ten SMEs operating in Blouberg (Bochum) Municipality, Molemole (Dendron)
Municipality, Polokwane Municipality and Lepelle-Nkumbi (Lebowakgomo)
Municipality to measure interest. (b) Contact the Office of Authorities on innovation
initiatives for clarity on how EAA could be adopted through a relationship with the
business structures. (c) Target 2-3 potential host SMEs in two lower-income areas. (d)
Discuss potential costs structures and feasibility concerns with the adoption of EAA.
(e) Evalaute potential funding sources, such as; Vuk'uzenzele, Lulalend, banks and
financial institutions for lower interest rate and possible payback period.

vii
TABLE OF CONTENTS DEDICATION ........................................................................................................................ i DECLARATION .................................................................................................................... ii ACKNOWLEDGEMENTS .................................................................................................... iii ABSTRACT….. .................................................................................................................... iv TABLE OF CONTENTS ....................................................................................................... v APPENDIXES .................................................................................................................... xiii Appendix A: List of Abbreviations and Acronyms ........................................................ xiii Appendix B: List of Tables .............................................................................................. xiv Appendix C: List of Figures ........................................................................................... xvii CHAPTER 1: DEFINING THE RESEARCH .......................................................................... 1 1.1 Introduction ................................................................................................................... 1 1.2 Background to and Rationale for the Study ................................................................ 3 1.3 Problem Statement ....................................................................................................... 6 1.4 Aim of the Study ............................................................................................................ 7 1.5 Objectives of the Study ................................................................................................ 7 1.6 Research Hypotheses ................................................................................................... 8 1.7 Literature Review .......................................................................................................... 8 1.7.1 Theoretical Review on EAA ....................................................................................... 8 1.7.1.1 Theory of Reasoned Action (TRA) ............................................................................. 9 1.7.1.2 Technology Acceptance Model (TAM) ..................................................................... 10 1.7.1.3 Theory of Planned Behaviour (TPB) ........................................................................ 10 1.8 Definitions of Terms ................................................................................................... 11 1.8.1 Internal Factors ........................................................................................................ 11 1.8.1.1 Owners’ Characteristics .......................................................................................... 11 1.8.1.2 Enterprise Resources (ERs) .................................................................................... 11 1.8.1.3 Information System Components (ISCs) ................................................................. 11 1.8.1.4 Employees’ Competencies (ECs) ............................................................................ 12 1.8.2 External Factors ....................................................................................................... 12 1.8.2.1 Complex Legal-Constraints ..................................................................................... 12 1.8.2.2 Regulatory Constraints ............................................................................................ 12 1.8.2.3 External Financing .................................................................................................. 12 1.8.2.4 Low Technological Capacity .................................................................................... 13 1.8.2.5 Relative Advantage ................................................................................................. 13 1.8.2.6 Compatibility of Computer Systems ......................................................................... 13 1.8.2.7 System Customisability ........................................................................................... 13 1.8.2.8 Information Security ................................................................................................ 13 1.8.3 Perceived Attitudes towards the Adoption of EAA ................................................ 13 1.8.3.1 Alternative User-Base Solutions .............................................................................. 14 1.8.3.2 Technological Aversion ........................................................................................... 14 1.8.3.3 Resistance to Change ............................................................................................. 14 1.8.4 Actual Adoption of EAA ........................................................................................... 14 1.8.4.1 Job Performance ..................................................................................................... 14 1.8.4.2 Critical Support-Base .............................................................................................. 15 1.8.4.3 Supply Chain Management (SCM) Activities ........................................................... 15 1.8.4.4 Ease of Activities ..................................................................................................... 15 1.9 Research Methodology ............................................................................................... 15 1.10 Significance of the Study ......................................................................................... 18 1.11 Format of the Study .................................................................................................. 19 1.12 Conclusion ................................................................................................................ 20 CHAPTER 2: LITERATURE REVIEW ................................................................................ 21 2.1 Introduction ................................................................................................................. 21
viii
2.2.1 Technologically Acceptance Model (TAM) ............................................................. 22 2.2.2 Theory of Reasoned Action (TRA) .......................................................................... 22 2.2.3 Theory of Planned Behaviour (TPB) ....................................................................... 23 2.2.4 Diffusion Theory of innovation................................................................................ 24 2.3. Defining EAA for Supply Chains ............................................................................... 25 2.3.1 Introduction ................................................................................................................ 25 2.3.2 Suppliers and business partners ................................................................................ 26 2.3.3 Processes and Enterprise Systems ............................................................................ 27 2.3.4 Customers and Distributors ........................................................................................ 28 2.3.5 Supply Chain Management System (SCMS) .............................................................. 28 2.3.6 Customer Relationship Management Systems (CRMSs) ........................................... 30 2.3.7 Knowledge Management Systems (KMS) .................................................................. 30 2.3.8 Sales and Marketing .................................................................................................. 31 2.3.9 Manufacturing and Production .................................................................................... 32 2.3.10 Finance and Accounting ........................................................................................... 32 2.4 Small And Medium Enterprises (SMES) .................................................................... 33 2.4.1 Defining Small and Medium Enterprises ................................................................ 33 2.4.2 Contribution of SMEs to the South African Economy ........................................... 35 2.4.2.1 Gross Domestic Product (GDP) Contribution........................................................... 35 2.4.2.2 Contribution towards Employment ........................................................................... 36 2.4.2.3 Contribution to Wealth Formation ............................................................................ 37 2.4.2.4 Poverty Alleviation ................................................................................................... 38 2.4.2.5 Innovation Conception ............................................................................................. 38 2.5.3 EAA Challenges Faced by SMEs............................................................................. 39 2.5.3.1 Lack of Financial Sustainability for the Actual Adoption of EAA ............................... 39 2.5.3.2 Lack of Formal Education for the Actual Adoption of EAA ....................................... 40 2.5.3.3 Lack of Technical Skills from Employees for the Actual Adoption of EAA ................ 41 2.6 Emperical Literature ................................................................................................... 42 2.6.1 Internal Factors affecting the adoption of EAA for SCM ....................................... 42 2.6.1.1 Owners’ Characteristics .......................................................................................... 42 2.6.1.1.1 Passion for Enterprise Success ............................................................................ 42 2.6.1.1.2 Creative Thinking and Mind-Set in Risk Taking .................................................... 43 2.6.1.1.3 Discipline for Action Orientation............................................................................ 43 2.6.1.1.4 Innovation Abilities ............................................................................................... 44 2.6.1.1.5 Vision Orientation ................................................................................................. 44 2.6.1.1.6 Owner’s Resilience ............................................................................................... 45 2.6.2 Enterprise Resources (ERs) .................................................................................... 45 2.6.2.1 Financial Resources ................................................................................................ 46 2.6.2.2 Competent Human Resources ................................................................................ 47 2.6.2.3 Mainframe and Personal Computers ....................................................................... 47 2.6.2.4 Application Software Systems (ASS) ....................................................................... 48 2.6.2.5 Hardware Systems (HSs) ........................................................................................ 49 2.6.2.6 Expert Personnel ..................................................................................................... 49 2.6.3 Information System Components (ISCs) ................................................................ 50 2.6.3.1 Transaction Support System (TSS) ......................................................................... 50 2.6.3.2 Management Information System (MIS) .................................................................. 51 2.6.3.3 Information System Components Governance (ISCG) ............................................ 51 2.6.3.4 Decision Support System (DSS).............................................................................. 52 2.6.3.5 Executive Support System (ESS) ............................................................................ 53 2.6.3.6 Knowledge Management Systems (KMS) ............................................................... 54 2.6.3.7 Internet and Network Connectivity ........................................................................... 55 2.6.4 Employees’ Competencies (ECs) ............................................................................ 55 2.6.4.1 Enterprise Integration and Administration (EIA) ....................................................... 57 2.6.4.2 Information Resources Managemnt (IRM) ............................................................... 57
ix
2.6.4.3 Enterprise Resource Planning (ERP) ...................................................................... 58 2.6.4.4 Spreadsheets utilisation and merging documents ................................................... 59 2.6.4.5 Communication capabilities ..................................................................................... 60 2.6.4.6 Interpersonal skills .................................................................................................. 61 2.6.4.7 Using the internet (Microsoft Windows) ................................................................... 62 2.6.4.8 Enterprise integration and administration ................................................................ 63 2.6.4.9 Standardisation and web-interface .......................................................................... 64 2.6.4.10 Assets Management .............................................................................................. 65 2.7 External Factors Impacting the Actual Adoption EAA for SCM ............................... 66 2.7.1 Complex Legal and Regulatory Constraints ............................................................... 66 2.7.2 Lack of External Financing ......................................................................................... 67 2.7.3 Low Technological Capacity ....................................................................................... 68 2.7.4 Relative Advantage .................................................................................................... 68 2.7.5 Compatibility of Computer Systems ............................................................................ 69 2.7.6 Customisability of EAA to the Enterprise and External Users ..................................... 70 2.7.7 Information Security ................................................................................................... 70 2.8 Perceived Attitude towards the Actual Adoption of EAA ......................................... 71 2.8.1 Alternative User-Base Solutions ................................................................................. 71 2.8.2 Technological Aversion .............................................................................................. 72 2.8.3 Vulnerability and stochasticity .................................................................................... 72 2.8.4 Resistance to Change ................................................................................................ 73 2.9 Actual Adoption of EAA .............................................................................................. 74 2.9.1 EAA Improves Job Performance of SCM.................................................................... 74 2.9.2 EAA Provide Critical Support-Base for SCM .............................................................. 74 2.9.3 EAA Enhances SCM Activities ................................................................................... 75 2.9.4 EAA Improves Activities for SCM ............................................................................... 76 2.9.5 Supply Chain World: Supply Chain Optimisation ........................................................ 76 2.9.6 Technological intransigence or inflexibility .................................................................. 77 2.10 The Conceptual Research Model ............................................................................. 77 2.11 Conclusion ................................................................................................................ 79 CHAPTER 3: RESEARCH METHODOLOGY..................................................................... 80 3.1 Introduction ................................................................................................................. 80 3.2 Research Design ......................................................................................................... 81 3.3 The Research Process ................................................................................................ 82 3.4 Research Philosophy .................................................................................................. 84 3.4.1 Positivism Paradigm ................................................................................................... 84 3.4.2 Interpretivism Paradigm/Constructivist Paradigm ....................................................... 85 3.4.3 Epidome of Pragmatism ............................................................................................. 86 3.4.4 Critical Realism .......................................................................................................... 86 3.4.5 Postmodernism .......................................................................................................... 86 3.5 Study Area ................................................................................................................... 87 3.6 Population of the Study .............................................................................................. 88 3.7 Methods/Instruments/Techniques Used to Collect the Data .................................... 88 3.8 Sample and Sampling Methods ................................................................................. 89 3.8.1. Sampling Methods .................................................................................................... 89 3.8.2.1 Probability Sampling ................................................................................................ 89 3.8.2.2 Non-Probability Sampling ........................................................................................ 90 3.9 Sample Method Used, Sample Selection and Sample Size ........................................... 91 3.10 The Research Instrument Construction .................................................................. 92 3.10.1 The Research Instrument ......................................................................................... 92 3.10.2 Questionnaire Construction ...................................................................................... 92 3.11 Pilot Study ................................................................................................................. 95 3.12 Data Analysis and Presentation ............................................................................... 97 3.13 Reliability, Validity and Objectivity .......................................................................... 97
x
3.13.1 Reliability of the Study .............................................................................................. 97 3.13.2 Validity of the Study ................................................................................................. 97 3.13.3 Objectivity ................................................................................................................ 98 3.14 Ethical Considerations ............................................................................................. 99 3.15 Conclusion .............................................................................................................. 101 CHAPTER 4: DISCUSSION, PRESENTATION AND INTERPRETATION OF THE
FINDINGS .................................................................................................. 102 4.1 Introduction ............................................................................................................... 102 4.2 Section A: Reliability and Validity Analysis and Testing for Normality ................. 103 4.2.1 Research sample results .......................................................................................... 103 4.2.2 Data Reliability ......................................................................................................... 103 4.2.3 Validity ..................................................................................................................... 104 4.3 Testing the Suitability of the Sampled Data for Inferential Analyses .................... 104 4.3.1 Introduction ............................................................................................................ 104 4.3.2 Descriptive Statistics on Internal Factors for SCM in SMEs ............................... 105 4.3.2.1 Descriptive Statistics on Normality Test for Owners’ Characteristics ..................... 105 4.3.2.2 Descriptive Statistics on Normality Test for Enterprise Resources ......................... 107 4.3.2.3 Descriptive Statistics on Normality Test for Information System Components ....... 109 4.3.2.4 Descriptive Statistics on Normality Test for Employees’ Competencies ................. 111 4.3.3 Descriptive Statistics on External Factors for SCM in SMEs .............................. 113 4.3.4 Descriptive Statistics on Perceived Attitudes on the Actual Adoption of EAA for
SCM in SMEs ............................................................................................................ 115 4.3.5 Descriptive Statistics on Actual Adoption of EAA for SCM in SMEs .................. 118 SECTION B: RESULTS OF HYPOTHESES TESTING .................................................... 121 4.4. Introduction .............................................................................................................. 121 4.5 Descriptive Statistics on Variables .......................................................................... 122 4.5.1 Owners’ Characteristics and Perceived Attitudes towards the Adoption of EAA for SCM
in SMEs ..................................................................................................................... 122 4.5.1.1 Pearson Correlations on Owners’ Characteristics and Perceived Attitudes towards
Adoption of EAA for SCM ........................................................................................... 122 4.5.1.2 ANOVA on Owners’ Characteristics and Perceived Attitudes towards the Actual
Adoption of EAA for SCM in SMEs ............................................................................. 123 4.5.1.3 Pearson’s Coefficients on Owners’ Characteristics and Perceived Attitudes towards the Actual Adoption of EAA for SCM in SMEs................................................ 124 4.5.1.4 Linear Regression on Owner’ Characteristics and Perceived Attitudes towards the Actual Adoption of EAA for SCM in SMEs .............................................................. 124 The linear regression where ........................................................................................... 124 This confirms that the ..................................................................................................... 125 4.5.2 Enterprise Resources and Perceived Attitudes towards the Actual Adoption of
EAA for SCM in SMEs .............................................................................................. 125 4.5.2.1 Pearson Correlation on Enterprise Resources and Perceived Attitudes towards the
Actual Adoption of EAA for SCM in SMEs .................................................................. 125 4.5.2.2 ANOVA on Enterprise Resources and Perceived Attitudes towards the Actual
Adoption of EAA for SCM ........................................................................................... 126 4.5.2.3 Pearson Coefficients on Enterprise Resources and Perceived Attitudes towards the
Actual Adoption of EAA .............................................................................................. 127 4.5.2.4 Linear Regression on Enterprise Resources and Perceived Attitudes towards the
Adoption of EAA ......................................................................................................... 127 4.5.3 Information System Components and Perceived Attitudes towards the Adoption
of EAA for SCM in SMEs .......................................................................................... 128 4.5.3.1 Pearson Correlation on Information System Components and Perceived Attitudes
towards the Adoption of EAA...................................................................................... 128 4.5.3.2 ANOVA on Information System Components and Perceived Attitudes towards the
Adoption of EAA for SCM ........................................................................................... 129
xi
4.5.3.3 Pearson Coefficients on Information System Components and Perceived Attitudes towards the Adoption of EAA for SCM ........................................................................ 130
4.5.3.4 Linear Regression on Information System Components and Perceived Attitudes towards the Adoption of EAA for SCM ........................................................................ 130
4.5.4 Employees’ Competencies Perceived Attitudes towards the Adoption of EAA for SCM in SMEs ............................................................................................................ 131
4.5.4.1 Pearson Correlations on Employees’ Competencies and Perceived Attitudes towards the Adoption of EAA for SCM in SMEs ....................................................................... 131
4.5.4.2 ANOVA on Employees’ Competencies .................................................................. 132 4.5.4.3 Pearson Coefficients on Employees’ Competencies and Perceived Attitudes towards
the Adoption of EAA for SCM ..................................................................................... 133 4.5.4.4 Linear Regression Model on Employees’ Competencies and Perceived Attitudes
towards the Adoption of EAA for SCM ........................................................................ 133 4.6 External Factors and Perceived Attitudes towards the Adoption of EAA for SCM in
SMEs ......................................................................................................................... 134 4.6.1 Pearson Correlation on External Factors .................................................................. 134 4.6.2 ANOVA on External Factors and Perceived Attitudes towards the Adoption of EAA for
SCM ........................................................................................................................... 135 4.6.3 Pearson Coefficients on External Factors and Actual Adoption of EAA .................... 136 4.6.4 Liner Regression Model on External Factors and Perceived Attitudes towards the
Adoption of EAA for SCM ........................................................................................... 136 4.7 Perceived Attitudes towards the Adoption of EAA ................................................. 137 4.7.1 Pearson Correlations on Perceived Attitudes and Actual Adoption of EAA ............... 137 4.7.2 ANOVA on Perceived Attitudes towards the Adoption of EAA and Actual Adoption of
EAA ............................................................................................................................ 138 4.7.3 Pearson Coefficients on Perceived Attitudes and Actual Adoption of EAA ............... 139 4.8 Descriptive Statistics for All Variables and Actual Adoption of EAA for SCM in
SMEs ......................................................................................................................... 140 4.8.1 Internal Factors and Actual Adoption of EAA for SCM in SMEs ......................... 140 4.8.1.1 Owners’ Characteristics and Actual Adoption of EAA ..................................... 140 4.8.1.1.1 Pearson Correlations on Owners’ Characteristics and Actual Adoption of EAA.................... 140 4.8.1.1.2 ANOVA on Owners’ Characteristics and Actual Adoption of EAA ........................................... 141 4.8.1.1.3 Pearson Coefficient on Owners’ Characteristics and Actual Adoption of AA ......................... 142 4.8.1.1.4 Linear Regression on Owners’ Characteristics and Actual Adoption of EAA ......................... 142 4.8.1.2 Enterprise Resources and Actual Adoption of EAA ......................................... 143 4.8.1.2.1. Pearson Correlations on Enterprise Resources and Actual Adoption of EAA ...................... 143 4.8.1.2.2 ANOVA on Enterprise Resources and Actual Adoption of EAA ............................................... 144 4.8.1.2.3 Coefficients on Enterprise Resources and Actual Adoption of EAA ........................................ 144 4.8.1.2.4 Linear regression on Enterprise Resources and Actual Adoption of EAA .............................. 145 4.8.1.3 Information System Components and Actual Adoption of EAA .......................................... 146 4.8.1.3.1 Pearson Correlations on Information System Components and Actual Adoption of EAA .... 146 4.8.1.3.2 ANOVA on Information System Components and Actual Adoption of EAA ........................... 147 4.8.1.3.3 Pearson Coefficients on Information System Components and Actual Adoption of EAA .... 147 4.8.1.3.4 Linear Regression on Information System Components and Actual Adoption of EAA ......... 148 4.4.1.4 Employees’ Competencies and Actual Adoption of EAA ................................. 149 4.8.1.4.1 Pearson Correlations on Employees’ Competencies and Actual Adoption of EAA .............. 149 4.8.1.4.2 ANOVA on Employees’ Competencies and Actual Adoption of EAA ...................................... 149 4.8.1.4.3 Pearson Correlation on Employees’ Competencies and Actual Adoption of EAA ................ 150 4.8.1.4.4 Linear Regression on Employees’ Competencies and Actual Adoption of EAA.................... 151 The linear regression where ........................................................................................... 151 4.8.2 External Factors and Actual Adoption of EAA ..................................................... 152 4.8.2.1 Pearson Correlations on External Factors and Actual Adoption of EAA................. 152 4.8.2.2 ANOVA on External Factors and Actual Adoption of EAA ..................................... 152 4.8.2.3 Pearson Coefficients on External Factors and Actual Adoption of EAA ................. 153 4.8.2.4 Linear Regression on External Factors and Actual Adoption of EAA ..................... 153
xii
4.9 Multiple Regression Analysis ................................................................................... 154 4.9.1 Descriptive Statistics on Actual Adoption of EAA and Unstandardized Predictive Value
................................................................................................................................... 155 4.9.2 Pearson Correlations on Actual Adoption of EAA and PRE_1 .................................. 155 4.9.3 ANOVA between Actual Adoption of EAA and PRE_1 ............................................. 156 4.9.4 Coefficients between Actual Adoption of EAA and PRE_1 ....................................... 156 4.9.5 Multiple Linear Regression Model ............................................................................ 157 4.9.6 Regression Analysis ................................................................................................. 158 CHAPTER 5: SUMMARY FINDINGS, CONCLUSIONS AND RECOMMENDATIONS ..... 161 5.1 Introduction ............................................................................................................... 161 5.2 Summary Findings on Internal Factors ................................................................... 162 5.2.1 Summary of Findings for Internal Factors: Owners’ Characteristics.......................... 162 5.2.2 Summary of Findings for Internal Factors: Enterprise Resources ............................. 163 5.2.3 Summary of Findings for Internal Factors: Information System Components ........... 163 5.2.4 Summary of Findings for Internal Factors: Employees’ Competencies ..................... 164 5.3 Summary of Findings on External Factors .............................................................. 164 5.4 Summary of Findings on Perceived Attitudes towards the Adoption of EAA ...... 164 5.5 Summary of Findings on Actual Adoption of EAA ................................................. 165 5.6 Summary of Conclusions on Internal Factors ........................................................ 166 5.6.1 Summary of Conclusions for Internal Factors: Owners’ Characteristics .................... 166 5.6.2 Summary of Conclusions for Internal Factors: Enterprise Resources ....................... 166 5.6.3 Summary of Conclusions for Internal Factors: Information System Components ...... 167 5.6.4 Summary of Conclusions for Internal Factors: Employees’ Competencies ............... 167 5.7 Summary of Conclusions on External Factors ....................................................... 168 5.8 Summary of Conclusions on Perceived Attitudes towards the Adoption of EAA 168 5.9 Summary of Conclusions on Actual Adoption of EAA ........................................... 169 5.10 Recommendations .................................................................................................. 169 5.10.1 Recommendations on Internal Factors .............................................................. 169 5.10.1.1Summary of Recommendations for Internal Factors: Owners’ Characteristics...... 169 5.10.1.2 Recommendations for Internal Factors: Information System Components .......... 170 5.10.1.3 Recommendations for Internal Factors: Enterprise Resources ............................ 170 5.10.1.4 Recommendations for Internal Factors: Employees’ Competencies .................... 171 5.10.2 Recommendations on External Factors ............................................................. 171 5.10.3 Recommendations on Perceived Attitudes towards the Adoption of EAA ...... 171 5.10.4 Recommendations on Actual Adoption of EAA ................................................. 172 5.10.4.1 Technical Complexity .......................................................................................... 173 5.10.4.2 Technological Failure .......................................................................................... 173 5.10.4.3 Technological Intransigence ................................................................................ 174 5.11 Conclusion on Recommendations Made ............................................................... 174 Annexure A: CPASA for Master’s and Doctoral Students ........................................... 175 Annexure B: Letter of Consent ...................................................................................... 176 Annexure C: Questionnaire ............................................................................................ 177 Annexure D: Turfloop Research Ethics Committee-Ethics Clearance Certificate ...... 181 Annexure E: Proof of Registration ................................................................................. 224 Annexure F: Editor’s Letter ............................................................................................ 225 Annexure G: Turnitin and Plagiarism Report ............................................................... 226 REFERENCES ................................................................................................................. 174
xiii
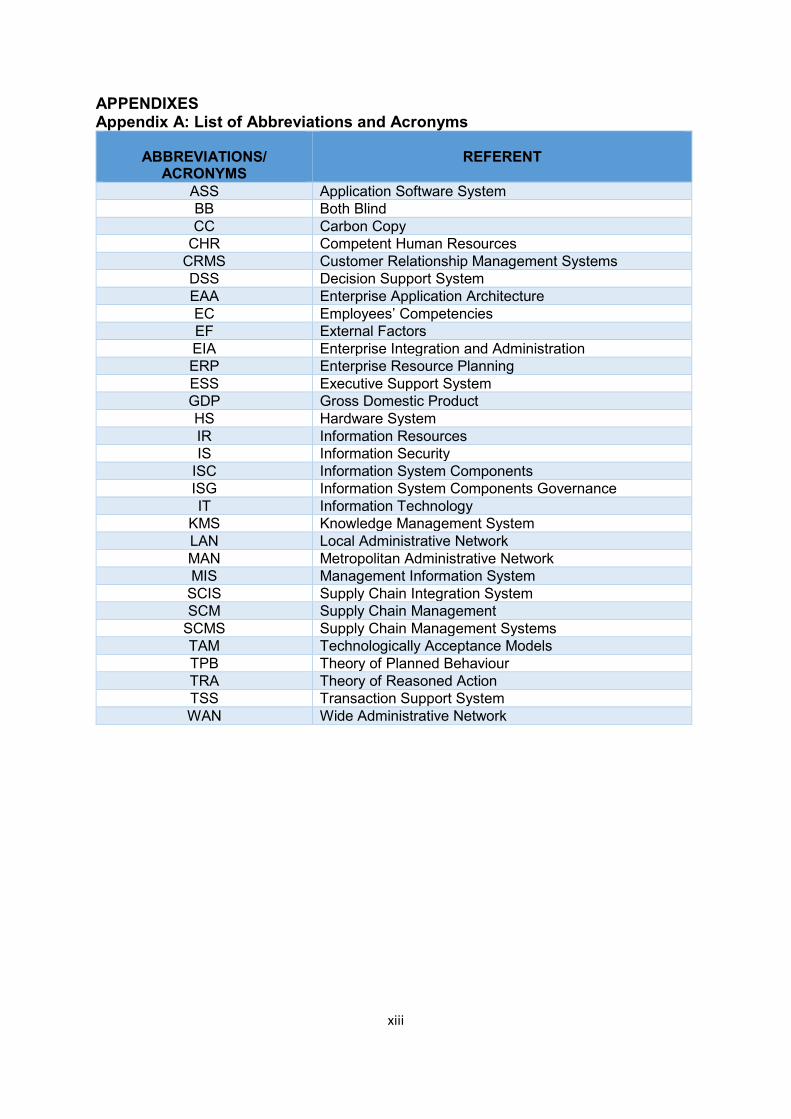
APPENDIXES Appendix A: List of Abbreviations and Acronyms
ABBREVIATIONS/
ACRONYMS
REFERENT
ASS Application Software System BB Both Blind CC Carbon Copy
CHR Competent Human Resources CRMS Customer Relationship Management Systems DSS Decision Support System EAA Enterprise Application Architecture EC Employees’ Competencies EF External Factors EIA Enterprise Integration and Administration ERP Enterprise Resource Planning ESS Executive Support System GDP Gross Domestic Product HS Hardware System IR Information Resources IS Information Security
ISC Information System Components ISG Information System Components Governance IT Information Technology
KMS Knowledge Management System LAN Local Administrative Network MAN Metropolitan Administrative Network MIS Management Information System
SCIS Supply Chain Integration System SCM Supply Chain Management
SCMS Supply Chain Management Systems TAM Technologically Acceptance Models TPB Theory of Planned Behaviour TRA Theory of Reasoned Action TSS Transaction Support System WAN Wide Administrative Network
xiv
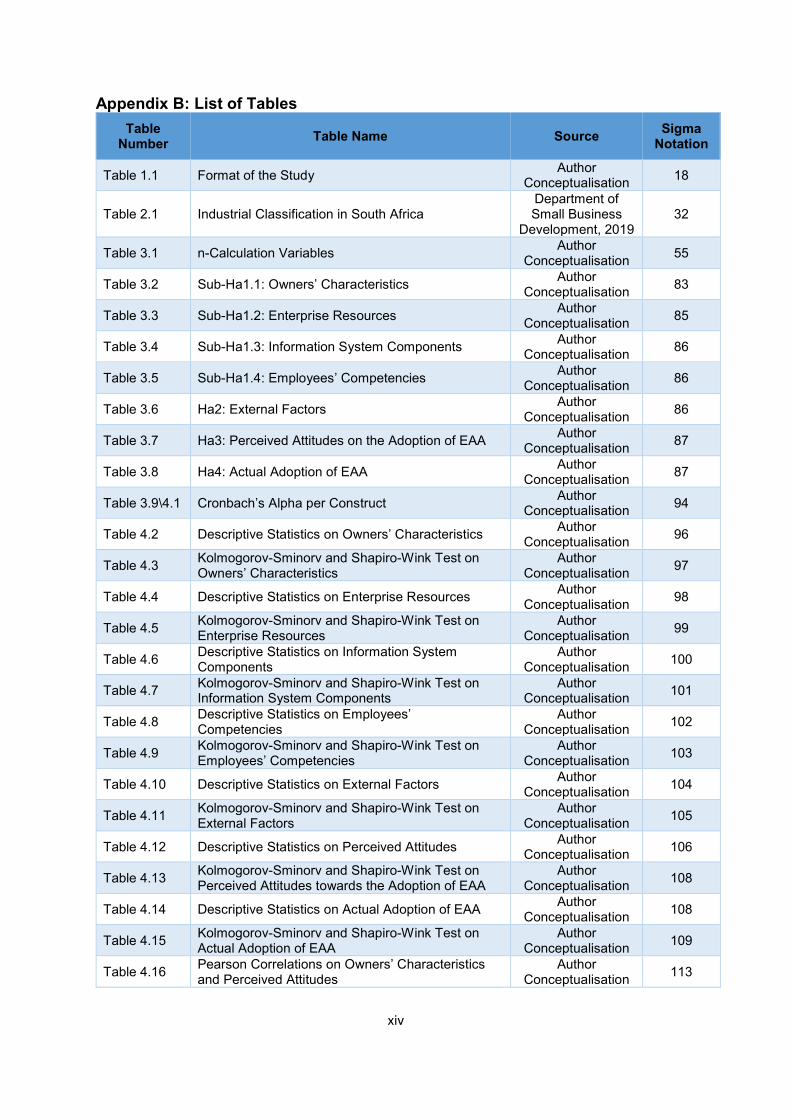
Appendix B: List of Tables Table
Number
Table Name
Source Sigma Notation
Table 1.1 Format of the Study Author Conceptualisation 18
Table 2.1 Industrial Classification in South Africa Department of Small Business
Development, 2019 32
Table 3.1 n-Calculation Variables Author Conceptualisation 55
Table 3.2 Sub-Ha1.1: Owners’ Characteristics Author Conceptualisation 83
Table 3.3 Sub-Ha1.2: Enterprise Resources Author Conceptualisation 85
Table 3.4 Sub-Ha1.3: Information System Components Author Conceptualisation 86
Table 3.5 Sub-Ha1.4: Employees’ Competencies Author Conceptualisation 86
Table 3.6 Ha2: External Factors Author Conceptualisation 86
Table 3.7 Ha3: Perceived Attitudes on the Adoption of EAA Author Conceptualisation 87
Table 3.8 Ha4: Actual Adoption of EAA Author Conceptualisation 87
Table 3.9\4.1 Cronbach’s Alpha per Construct Author Conceptualisation 94
Table 4.2 Descriptive Statistics on Owners’ Characteristics Author Conceptualisation 96
Table 4.3 Kolmogorov-Sminorv and Shapiro-Wink Test on Owners’ Characteristics
Author Conceptualisation 97
Table 4.4 Descriptive Statistics on Enterprise Resources Author Conceptualisation 98
Table 4.5 Kolmogorov-Sminorv and Shapiro-Wink Test on Enterprise Resources
Author Conceptualisation 99
Table 4.6 Descriptive Statistics on Information System Components
Author Conceptualisation 100
Table 4.7 Kolmogorov-Sminorv and Shapiro-Wink Test on Information System Components
Author Conceptualisation 101
Table 4.8 Descriptive Statistics on Employees’ Competencies
Author Conceptualisation 102
Table 4.9 Kolmogorov-Sminorv and Shapiro-Wink Test on Employees’ Competencies
Author Conceptualisation 103
Table 4.10 Descriptive Statistics on External Factors Author Conceptualisation 104
Table 4.11 Kolmogorov-Sminorv and Shapiro-Wink Test on External Factors
Author Conceptualisation 105
Table 4.12 Descriptive Statistics on Perceived Attitudes Author Conceptualisation 106
Table 4.13 Kolmogorov-Sminorv and Shapiro-Wink Test on Perceived Attitudes towards the Adoption of EAA
Author Conceptualisation 108
Table 4.14 Descriptive Statistics on Actual Adoption of EAA Author Conceptualisation 108
Table 4.15 Kolmogorov-Sminorv and Shapiro-Wink Test on Actual Adoption of EAA
Author Conceptualisation 109
Table 4.16 Pearson Correlations on Owners’ Characteristics and Perceived Attitudes
Author Conceptualisation 113
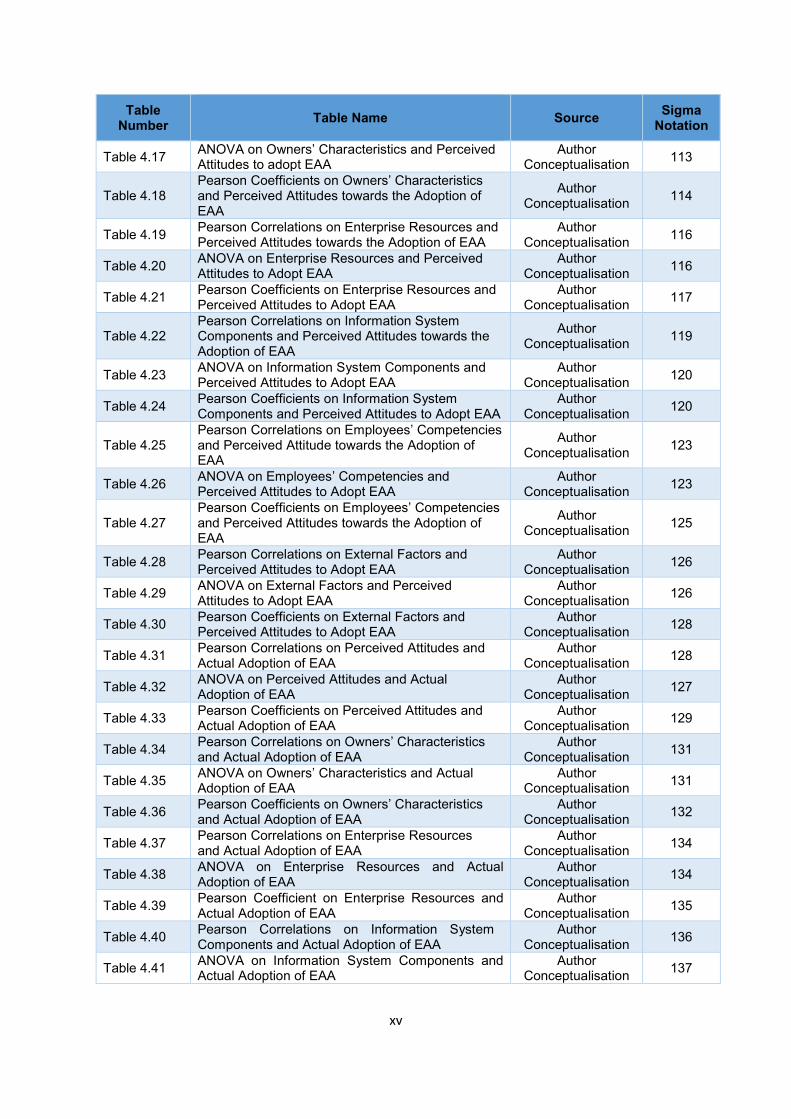
xv
Table Number
Table Name
Source Sigma
Notation
Table 4.17 ANOVA on Owners’ Characteristics and Perceived Attitudes to adopt EAA
Author Conceptualisation 113
Table 4.18 Pearson Coefficients on Owners’ Characteristics and Perceived Attitudes towards the Adoption of EAA
Author Conceptualisation 114
Table 4.19 Pearson Correlations on Enterprise Resources and Perceived Attitudes towards the Adoption of EAA
Author Conceptualisation 116
Table 4.20 ANOVA on Enterprise Resources and Perceived Attitudes to Adopt EAA
Author Conceptualisation 116
Table 4.21 Pearson Coefficients on Enterprise Resources and Perceived Attitudes to Adopt EAA
Author Conceptualisation 117
Table 4.22 Pearson Correlations on Information System Components and Perceived Attitudes towards the Adoption of EAA
Author Conceptualisation 119
Table 4.23 ANOVA on Information System Components and Perceived Attitudes to Adopt EAA
Author Conceptualisation 120
Table 4.24 Pearson Coefficients on Information System Components and Perceived Attitudes to Adopt EAA
Author Conceptualisation 120
Table 4.25 Pearson Correlations on Employees’ Competencies and Perceived Attitude towards the Adoption of EAA
Author Conceptualisation 123
Table 4.26 ANOVA on Employees’ Competencies and Perceived Attitudes to Adopt EAA
Author Conceptualisation 123
Table 4.27 Pearson Coefficients on Employees’ Competencies and Perceived Attitudes towards the Adoption of EAA
Author Conceptualisation 125
Table 4.28 Pearson Correlations on External Factors and Perceived Attitudes to Adopt EAA
Author Conceptualisation 126
Table 4.29 ANOVA on External Factors and Perceived Attitudes to Adopt EAA
Author Conceptualisation 126
Table 4.30 Pearson Coefficients on External Factors and Perceived Attitudes to Adopt EAA
Author Conceptualisation 128
Table 4.31 Pearson Correlations on Perceived Attitudes and Actual Adoption of EAA
Author Conceptualisation 128
Table 4.32 ANOVA on Perceived Attitudes and Actual Adoption of EAA
Author Conceptualisation 127
Table 4.33 Pearson Coefficients on Perceived Attitudes and Actual Adoption of EAA
Author Conceptualisation 129
Table 4.34 Pearson Correlations on Owners’ Characteristics and Actual Adoption of EAA
Author Conceptualisation 131
Table 4.35 ANOVA on Owners’ Characteristics and Actual Adoption of EAA
Author Conceptualisation 131
Table 4.36 Pearson Coefficients on Owners’ Characteristics and Actual Adoption of EAA
Author Conceptualisation 132
Table 4.37 Pearson Correlations on Enterprise Resources and Actual Adoption of EAA
Author Conceptualisation 134
Table 4.38 ANOVA on Enterprise Resources and Actual Adoption of EAA
Author Conceptualisation 134
Table 4.39 Pearson Coefficient on Enterprise Resources and Actual Adoption of EAA
Author Conceptualisation 135
Table 4.40 Pearson Correlations on Information System Components and Actual Adoption of EAA
Author Conceptualisation 136
Table 4.41 ANOVA on Information System Components and Actual Adoption of EAA
Author Conceptualisation 137
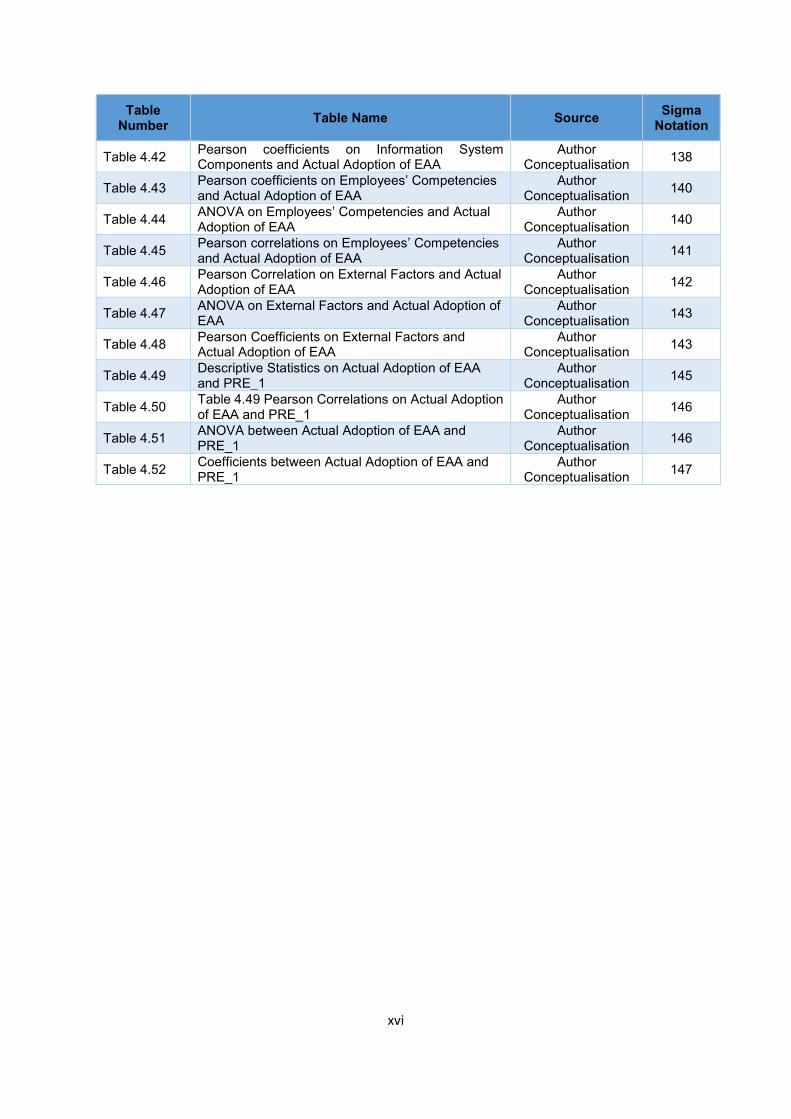
xvi
Table Number
Table Name
Source Sigma
Notation
Table 4.42 Pearson coefficients on Information System Components and Actual Adoption of EAA
Author Conceptualisation 138
Table 4.43 Pearson coefficients on Employees’ Competencies and Actual Adoption of EAA
Author Conceptualisation 140
Table 4.44 ANOVA on Employees’ Competencies and Actual Adoption of EAA
Author Conceptualisation 140
Table 4.45 Pearson correlations on Employees’ Competencies and Actual Adoption of EAA
Author Conceptualisation 141
Table 4.46 Pearson Correlation on External Factors and Actual Adoption of EAA
Author Conceptualisation 142
Table 4.47 ANOVA on External Factors and Actual Adoption of EAA
Author Conceptualisation 143
Table 4.48 Pearson Coefficients on External Factors and Actual Adoption of EAA
Author Conceptualisation 143
Table 4.49 Descriptive Statistics on Actual Adoption of EAA and PRE_1
Author Conceptualisation 145
Table 4.50 Table 4.49 Pearson Correlations on Actual Adoption of EAA and PRE_1
Author Conceptualisation 146
Table 4.51 ANOVA between Actual Adoption of EAA and PRE_1
Author Conceptualisation 146
Table 4.52 Coefficients between Actual Adoption of EAA and PRE_1
Author Conceptualisation 147
xvii
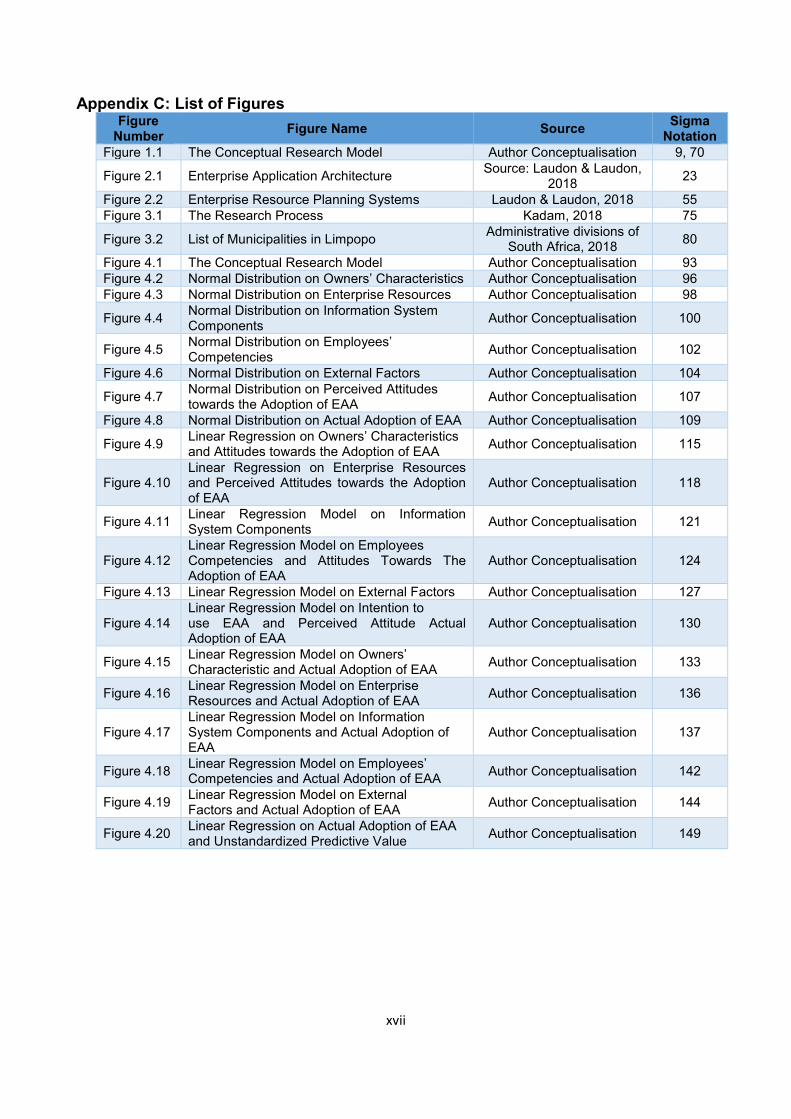
Appendix C: List of Figures Figure
Number Figure Name Source Sigma Notation
Figure 1.1 The Conceptual Research Model Author Conceptualisation 9, 70
Figure 2.1 Enterprise Application Architecture Source: Laudon & Laudon, 2018 23
Figure 2.2 Enterprise Resource Planning Systems Laudon & Laudon, 2018 55 Figure 3.1 The Research Process Kadam, 2018 75
Figure 3.2 List of Municipalities in Limpopo Administrative divisions of South Africa, 2018 80
Figure 4.1 The Conceptual Research Model Author Conceptualisation 93 Figure 4.2 Normal Distribution on Owners’ Characteristics Author Conceptualisation 96 Figure 4.3 Normal Distribution on Enterprise Resources Author Conceptualisation 98
Figure 4.4 Normal Distribution on Information System Components Author Conceptualisation 100
Figure 4.5 Normal Distribution on Employees’ Competencies Author Conceptualisation 102
Figure 4.6 Normal Distribution on External Factors Author Conceptualisation 104
Figure 4.7 Normal Distribution on Perceived Attitudes towards the Adoption of EAA Author Conceptualisation 107
Figure 4.8 Normal Distribution on Actual Adoption of EAA Author Conceptualisation 109
Figure 4.9 Linear Regression on Owners’ Characteristics and Attitudes towards the Adoption of EAA Author Conceptualisation 115
Figure 4.10 Linear Regression on Enterprise Resources and Perceived Attitudes towards the Adoption of EAA
Author Conceptualisation 118
Figure 4.11 Linear Regression Model on Information System Components Author Conceptualisation 121
Figure 4.12 Linear Regression Model on Employees Competencies and Attitudes Towards The Adoption of EAA
Author Conceptualisation 124
Figure 4.13 Linear Regression Model on External Factors Author Conceptualisation 127
Figure 4.14 Linear Regression Model on Intention to use EAA and Perceived Attitude Actual Adoption of EAA
Author Conceptualisation 130
Figure 4.15 Linear Regression Model on Owners’ Characteristic and Actual Adoption of EAA Author Conceptualisation 133
Figure 4.16 Linear Regression Model on Enterprise Resources and Actual Adoption of EAA Author Conceptualisation 136
Figure 4.17 Linear Regression Model on Information System Components and Actual Adoption of EAA
Author Conceptualisation 137
Figure 4.18 Linear Regression Model on Employees’ Competencies and Actual Adoption of EAA Author Conceptualisation 142
Figure 4.19 Linear Regression Model on External Factors and Actual Adoption of EAA Author Conceptualisation 144
Figure 4.20 Linear Regression on Actual Adoption of EAA and Unstandardized Predictive Value Author Conceptualisation 149

1
CHAPTER 1: DEFINING THE RESEARCH
1.1 Introduction The Supply Chain Management (SCM) is increasingly recognised as a worldwide
enterprise functional activity that involves dynamic algorithms for managing internal
and external enterprise activities (Stet, 2014; Pashaei & Olhager, 2015; and Fish,
2019). Algorithms are protocols to be followed in the execution of SCM activities, which
includes computer programming that are aligned with internal and external users and
different enterprise activities (Riezebos, 2017; Suhadak & Mawardi, 2017; and Walport
& Rothwell, 2019). In Small and Medium Enterprises (SMEs), the purpose of SCM is
to satisfy customers’ needs through Information Technology (IT) alignment, integration
and collaborated through Technologically Acceptance Models (TAM) (Benade &
Pretorius, 2012; Hackman & Knowlden, 2014; and Hoque, 2016).
SMEs are entities operating both in the formal and informal sectors of the economy
serving as economic instrument for development by providing entrepreneurial spirit
with flexibility and adaptability coupled with their potential to face environmental
challenges in contributing to employment and tax incentives (Department of Small
Business Development, 2019). SCM includes logistics combined with core
competencies, cost reductions that involves dynamic algorithms for managing issues
on internal factors, n such as, organisational structure and associated relationships,
Supply Chain coordination; inter-and-intra enterprise communication; sourcing;
manufacturing orientation, inventory and cost management; internal and external
factors such as outsourcing, and with the intention of satisfying consumers’ needs
(Sangam, 2010; Benade & Pretorius, 2012).
EAA is a description of the structure for the applications and software used across the
enterprise in which the systems are broken down into sub-systems and connected to
each other based on their ultimate relationships and functionalities (Sangam, 2010;
Benade & Pretorius, 2012; and Flower, 2018). EAA has become a reliable and
dependable integrated system embraced by many businesses universally (Gulati &
Baldwin, 2018). One advantage of adopting EAA is that it enables SMEs to take
advantage of available and sophisticated technological standards on applications

2
software systems to be used in SCM (Burson, 2015; Schofield, 2018; and Tagged,
2019). The adoption of EAA can be used to develop interventions in SMEs for
supporting software used by internal and external users (Hackman & Knowlden, 2014;
and Nimsa, 2016). A list of a few of these software includes Basic Accounting Systems,
Cloud Accounting, On-Line Accounting Package for Ease in EAA (Shelly & Vermaat,
2011; Sharma, 2015b; Badenhorst-Weiss, Strydom, Strydom, Heckroodt, Howell,
Cook, & Phume, 2016; Vogt, 2017; and Badenhorst-Weiss, van Biljon & Ambe, 2018).
3
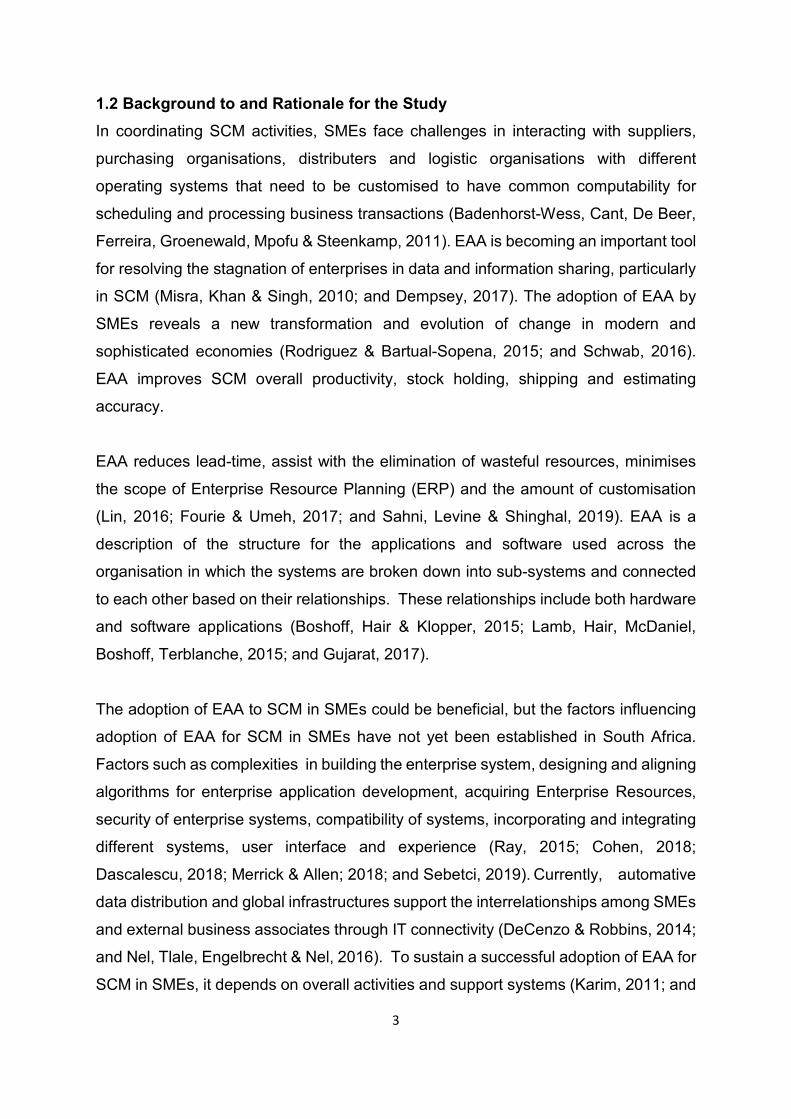
1.2 Background to and Rationale for the Study In coordinating SCM activities, SMEs face challenges in interacting with suppliers,
purchasing organisations, distributers and logistic organisations with different
operating systems that need to be customised to have common computability for
scheduling and processing business transactions (Badenhorst-Wess, Cant, De Beer,
Ferreira, Groenewald, Mpofu & Steenkamp, 2011). EAA is becoming an important tool
for resolving the stagnation of enterprises in data and information sharing, particularly
in SCM (Misra, Khan & Singh, 2010; and Dempsey, 2017). The adoption of EAA by
SMEs reveals a new transformation and evolution of change in modern and
sophisticated economies (Rodriguez & Bartual-Sopena, 2015; and Schwab, 2016).
EAA improves SCM overall productivity, stock holding, shipping and estimating
accuracy.
EAA reduces lead-time, assist with the elimination of wasteful resources, minimises
the scope of Enterprise Resource Planning (ERP) and the amount of customisation
(Lin, 2016; Fourie & Umeh, 2017; and Sahni, Levine & Shinghal, 2019). EAA is a
description of the structure for the applications and software used across the
organisation in which the systems are broken down into sub-systems and connected
to each other based on their relationships. These relationships include both hardware
and software applications (Boshoff, Hair & Klopper, 2015; Lamb, Hair, McDaniel,
Boshoff, Terblanche, 2015; and Gujarat, 2017).
The adoption of EAA to SCM in SMEs could be beneficial, but the factors influencing
adoption of EAA for SCM in SMEs have not yet been established in South Africa.
Factors such as complexities in building the enterprise system, designing and aligning
algorithms for enterprise application development, acquiring Enterprise Resources,
security of enterprise systems, compatibility of systems, incorporating and integrating
different systems, user interface and experience (Ray, 2015; Cohen, 2018;
Dascalescu, 2018; Merrick & Allen; 2018; and Sebetci, 2019). Currently, automative
data distribution and global infrastructures support the interrelationships among SMEs
and external business associates through IT connectivity (DeCenzo & Robbins, 2014;
and Nel, Tlale, Engelbrecht & Nel, 2016). To sustain a successful adoption of EAA for
SCM in SMEs, it depends on overall activities and support systems (Karim, 2011; and
4
Grigoriu, 2014). EAA is a description of the structure for the applications and software
used across the organisation in which the systems are broken down into sub-systems
and connected to each other based on their relationships, that includes both hardware
and software applications (Boshoff, Hair & Klopper, 2015; Lamb, Hair, McDaniel,
Boshoff, Terblanche, 2015; and Gujarat, 2017). SMEs should have thorough
knowledge and understanding on the integration of software and hardware for the
adoption of EAA for SCM in SMEs. A software system is used hand-in-hand with
hardware system to produce meaningful outcome for business processes that could
be used for EAA adoption (Wayner, 2018; Schofield, 2018; and Wayner, 2019).
Applications software include components such as, database programs, word
processors, Web browsers and spreadsheets (Beal, 2018a; Zandbergen, 2018a; and
Gregersen, 2018). Information System Components are regarded as electronic
communications protocols and infrastructure that are inclusive of hardware and
software components (Hoque, 2016; and Jacobson, 2018). SMEs adopt EAA for IT
developments to operate at an optimal economies-of-scale to assist achieve a
successful SCM (Pradhan, 2013). Sustainable EAA adoption include the management
of enterprise information infrastructure with specific algorithms to make it responsive,
adaptable and receptive to consumer needs and demands (Trinh-Phuong, Molla, &
Peszynski, 2012; Hagmann, 2013; and Boykin, 2017).
EAA links demand forecasting for their product and services with management system
and process to avoid surplus or deficit (Sharma, 2015b; and Fourie & Umeh, 2017).
EAA serves as a fundamental instrument to ease SCM activities in SMEs with
appropriate algorithms that are used to provide information regularity and reliability
(Walport & Rothwell, 2013; and Ray, 2017). EAA plays a fundamental part as an
instrument to ease SCM activities in SMEs for enterprises to reap positive results
through insourcing, processing and outsourcing for products and service offerings with
ease (Smith, 2013). SCM assists in the execution for information sharing from
distribution channels that includes; manufacturers, wholesalers, retailers and
customers, in the order-processing and distribution for durable materials, semi-durable
materials and none-durable materials at an economically-viable prices (Leong, Tan &
Wisner, 2012; and Vdovin, 2017). EAA depends on Information System Components
5
that need to be well understood, particularly on their features, functionality and
processing output (Fahy & Jobber, 2012; De Oliveira & Peres, 2015; and Nazir & Zhu,
2018). SMEs and their business associates in the SCM should understand fully how
the relationships among the components of SCM in their daily businesses transactions
are incorporated (Fahy & Jobber, 2012; and Juneja, 2019). Convenient software
systems are regarded as ready-made applications for personalised computer systems
that require compatibility of systems (Jacobson, 2018; Igrany, 2018; and Beal, 2018).
The Application Software System (ASS) minimise operational issues, system errors
and cost associated with installation (Schnädelbach, 2010; and Flower, 2018). Internal
and external factors force SMEs to be more responsive to changes and unpredictable
business environments (Sharma, 2015a). Successful SMEs are based on the
understanding of the internal and external factors influencing the adoption of EAA
for SCM (Alziari, 2017; and Martin, 2019).
Lack of external financing in SMEs is linked with the general market environment and
aspects of equity financing and security guarantees on micro-finance (Trinh-Phuong,
Molla & Peszynski, 2012; and Ramlee & Berma, 2013). The adoption of EAA for SCM
requires capital requirements for SMEs which is a challenge due to formal
requirements on loan securities for technological capacity (Suhadak& Mawardi, 2017;
and Maverick, 2018). Moreover, lack of skills development and training, poor
Employees’ Competencies and lack of formal educational requirements makes the
adoption of EEA for SCM in SMEs challenging and demanding (Kruger, 2016; and
Travis, 2017).
In some instances, external factors complicates the adoption of EAA for SCM such as;
customer and supplier perceptions and attitudes, lack of Enterprise Resources (ER)
and poor Information Systems Components (ISC) (Porteous, 2014; and Gregersen,
2018). EAA can overcome internal and external challenges and can be used to
analyse the adoption of EAA. Adoption of EAA improves decision making by enterprise
owners, managers and employees (Sahab, Rose & Osman, Ray, 2015; and Dillon &
Morris, 2018b). This study set out with the rationale for the study to determine whether
the adoption of EAA within SMEs could bring a successive change in supply chain
6
management, whilst other variables such as; internal factors, external factors and
perceived attitudes towards the adoption of EAA are tested.
1.3 Problem Statement The adoption of EAA in SMEs is not always a successful operation due to internal and
external constraints such as challenges for participatory design; integrated
performance and mechanisms; measurement systems; and technological ignorance
(Giovannoni & Maraghini, 2013; Grigoriu, 2014; Faircloth, 2014; and Arbesman, 2015).
As SMEs establish new product development and service offerings, they face
challenges in SCM based on the size and consequential low economic power (Ketteni,
Mamuneas & Stengos, 2011; Khalifa, 2016; and Schwab, 2016). SMEs also encounter
difficulties and complications within business cycle on recession and depression
parallel with the adoption of EAA for creating competitive benefit in SCM (Callaghan,
2013; Khalifa, 2016; and McPeak, 2018).
Any insufficiencies in the internal and external factors will make the adoption of EAA
more of a difficult encounter (Sherman, 2018; Hawks, 2019; and Jessee, 2019).
External forces like corporate governance accountability and competition lead to tight
linkages with SMEs partners (Trinh-Phuong et al., 2012; and Weber, Geneste &
Connell, 2015). The problem is compounded by internal factors such as owner’s and
worker’s characteristics, Enterprise Resources (ER), Information System Components
(ISC) and employee competencies that tend to influence the adoption for EAA for SCM
in SMEs (Suhadak& Mawardi, 2017; and Sherman, 2018). However, there has been
little discussion about the adoption of EAA for SCM in SMEs and the factors influencing
adoption.
Previous work has only focused on; enterprise performance, gaps in the organisational
structure and reporting channels whereas the underlying causes of the gap between
the adoption of EAA and SCM are lacking (Mathaisel, 2013; Iyamu & Mphahlele, 2014;
and Hazen, Kung, Cegielski & Jones-Farmer, 2014). The researcher examines the
internal and external factors, and provides guidelines for the adoption of EAA in South
Africa (Ghobakhloo, Sabouri & Hong, 2011; Gujarat, 2017; Suhadak & Mawardi, 2017;
Riezebos, 2017; and Sherman, 2018). The problem is that, factors influencing the
7
adoption of EAA for SCM by SMEs remain unexplored from the South African
perspective. The research gap, therefore, is identified as lack of knowledge on the
internal and external factors influencing the adoption of EAA for SCM in SMEs.
1.4 Aim of the Study The aim of this study is to investigate influence of both internal factors (such as
Owners’ Characteristics, Enterprise Resources, Information System Components,
Employees’ Competencies) and external factors (such as complex legal and
regulatory constraints; external financing; low technological capacity; and relative
advantage) on the adoption of EAA for SCM in the SMEs.
1.5 Objectives of the Study The research objectives are distinct driving force in all aspects of the methodology,
which include instrument design, data collection, analysis and ultimately the
recommendations for future studies (Grigoriu, 2014; Lyons, 2017; and Muhamad,
2018). Consequently, the objectives of the study are as follows;
To determine whether internal factors (Owners’ Characteristics, Enterprise
Resources, Information System Components and Employees’ Competencies)
influence the perceived attitudes (Alternative User-Base Solutions, low
Technological Aversion, vulnerability and stochasticity and resistance to change)
influence Perceived Attitudes towards the Actual Adoption of EAA (alternative
user-based solutions, low Technological Aversion and resistance to change) for
SCM in SMEs;
To determine whether external factors (viz., complex legal and regulatory
constraints, external financing, low technological capacity, relative advantage,
systems compatibility and stochasticity and resistance to change) influence
Perceived Attitudes towards the Actual Adoption of EAA for SCM in SMEs; and
To determine whether Perceived Attitudes influence the Actual Adoption of EAA
for SCM in SMEs; and
To determine whether internal factors influence the Actual Adoption of EAA for
SCM in SMEs.
To determine whether external factors influence the Actual Adoption of EAA for
SCM in SMEs.
8
1.6 Research Hypotheses A research hypotheses is defined as detailed, precise and thorough proposition or
analytical statement about the future outcomes of a scientific research study based on
a particular group of a population. Based on research objectives, hypotheses are
presented thus:
H01: There is no relationship between internal factors and Perceived Attitudes
towards the Actual Adoption of EAA for SCM in SMEs;
Ha1: There is a positive relationship between internal factors and Perceived
Attitudes towards the Actual Adoption of EAA for SCM in SMEs;
H02: There is no relationship between external factors and Perceived Attitudes
towards the Actual Adoption of EAA for SCM in SMEs;
Ha2: There is a positive relationship between external factors and Perceived
Attitudes towards the Actual Adoption of EAA for SCM in SMEs;
H03: There is no relationship between Perceived Attitudes and the Actual
Adoption of EAA for SCM in SMEs;
Ha3: There is a positive relationship between Perceived Attitudes and the
Actual Adoption of EAA for SCM in SMEs;
H04: There is no relationship between internal factors and the Actual Adoption
of EAA for SCM in SMEs; and
H04: There is a positive relationship between internal factors and the Actual
Adoption of EAA for SCM in SMEs; and
H05: There is no relationship between external factors and the Actual Adoption
of EAA for SCM in SMEs.
H05: There is a positive relationship between external factors and the Actual
Adoption of EAA for SCM in SMEs.
1.7 Literature Review The literature on internal and external factors influencing the Actual Adoption of EAA
for SCM is reviewed.
1.7.1 Theoretical Review on EAA
Through literature review, the researcher generated more interest to investigate the
decision to adopt an EAA by using an adapted TAM for analysing both internal and
9
external factors that influence SMEs operations in SCM as discussed in 1.7.1.1. below.
In recent times, there is slight Actual Adoption of EAA for SCM in SMEs (Shilman,
2017). The conceptual research model known as the TAM is discussed below as it
serves as general guideline for the study; detailing it an action research (Zentis, 2020).
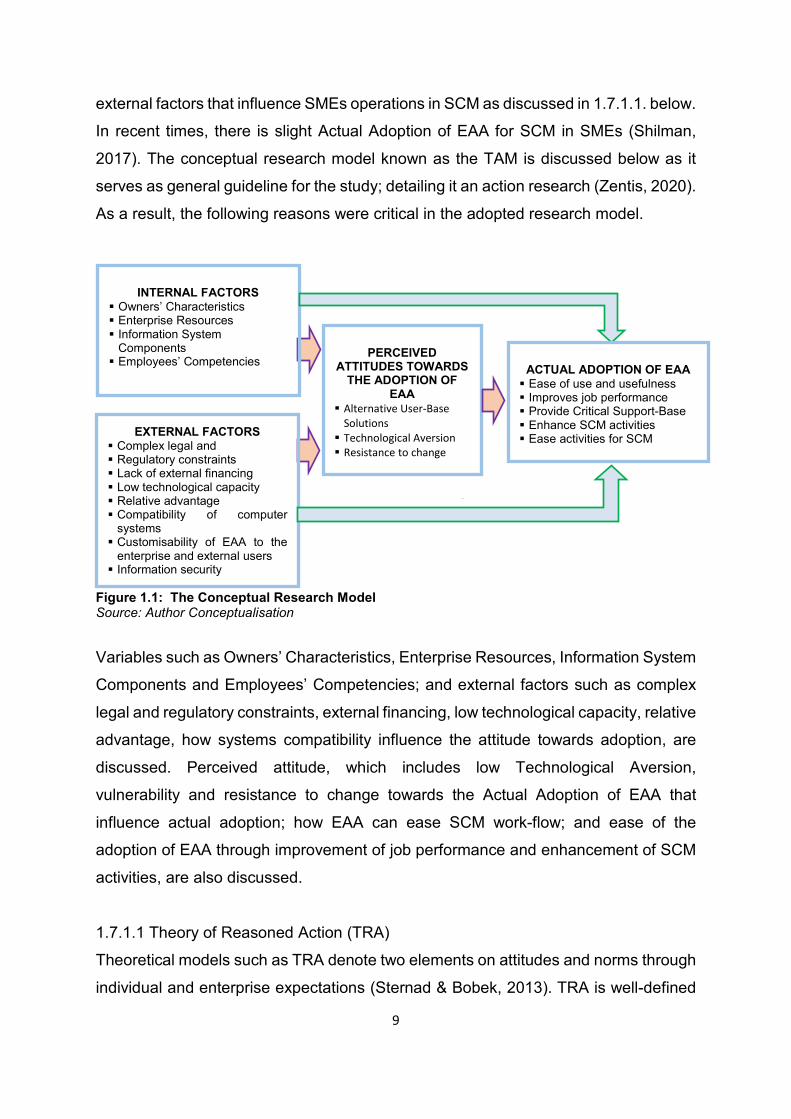
As a result, the following reasons were critical in the adopted research model.
Figure 1.1: The Conceptual Research Model Source: Author Conceptualisation
Variables such as Owners’ Characteristics, Enterprise Resources, Information System
Components and Employees’ Competencies; and external factors such as complex
legal and regulatory constraints, external financing, low technological capacity, relative
advantage, how systems compatibility influence the attitude towards adoption, are
discussed. Perceived attitude, which includes low Technological Aversion,
vulnerability and resistance to change towards the Actual Adoption of EAA that
influence actual adoption; how EAA can ease SCM work-flow; and ease of the
adoption of EAA through improvement of job performance and enhancement of SCM
activities, are also discussed.
1.7.1.1 Theory of Reasoned Action (TRA)
Theoretical models such as TRA denote two elements on attitudes and norms through
individual and enterprise expectations (Sternad & Bobek, 2013). TRA is well-defined
PERCEIVED
ATTITUDES TOWARDS THE ADOPTION OF
EAA Alternative User-Base
Solutions Technological Aversion Resistance to change
INTERNAL FACTORS
Owners’ Characteristics Enterprise Resources Information System
Components Employees’ Competencies
ACTUAL ADOPTION OF EAA Ease of use and usefulness Improves job performance Provide Critical Support-Base Enhance SCM activities Ease activities for SCM
EXTERNAL FACTORS Complex legal and Regulatory constraints Lack of external financing Low technological capacity Relative advantage Compatibility of computer
systems Customisability of EAA to the
enterprise and external users Information security
10
as the predictive validity of the Theory of Reasoned Action has been that are examined
in the adoption of technologically accepted model such as EAA for SCM (Hackman &
Knowlden, 2014). EAA focuses on final output for rational-decision making centred on
reasonable and sustainable variables included in that, and Employees' Competencies
encountering technological implications (Anderson & Perrin, 2017; and Dillon & Morris,
1996a). Ajzen's Theory of Reasoned Action in the Social Psychology describes TRA
as relationships among beliefs, attitudes, norms, intentions and behaviour, based on
competency level of labour versus Information System Components such as hardware
and software (Ajzen, 1991; Hackman & Knowlden, 2014; and Dillon & Morris, 2018b).
The TAM is based on TRA and TAM is the main theoretical model used in this
research.
1.7.1.2 Technology Acceptance Model (TAM)
TAM is Information System Components theory used for modelling how end-users
makes the conclusions on accepting or using technology (Davis, Bagozzi & Warshaw,
1989). The challenge in SMEs is to identify an EAA system that would serve as a
solution in SCM activities. TAM is the basic theory on which this study is grounded as
it is generally used to analyse factors influencing the adoption based on the two
constructs, namely, ease of use and usefulness (Sternad & Bobek, 2013; and
Escobar-Rodriguez & Bartual-Sopena, 2015). TAM was developed by Davis, Bagozzi
and Warshaw as a basic theory to analyse individual and enterprise acceptance of
new technologies in 1989 (Godoe & Johansen, 2018).
1.7.1.3 Theory of Planned Behaviour (TPB)
TPB employs three user determinants, namely, effort expectancy, social influence and
facilitation conditions, to engage in EAA adoption (Hazen et al., 2014). TPB makes
assumptions about employee engagement based on certain behavioural patterns,
merits and times (Escobar-Rodríguez & Bartual-Sopena, 2015). The Actual Adoption
of EAA is based on the TPB using of the managerial roles (Hellriegel, Slocum,
Jackson, Staude, Amos, Klopper, Oosthuizen, Perks & Zindiye, 2012; and Erasmus,
Ferreira & Groenewald, 2013). In this research, the effort expectancy and facilitation
conditions are used in the conceptual research model. But the social behavioural
11
aspect is included as the study concentrates on the Owners’ Characteristic (Coulson‐
Thomas, 2012).
1.8 Definitions of Terms Conceptual definitions are described from the research objective for the measurement
of the variables, questions were developed containing sets of questions based on the
theory.
1.8.1 Internal Factors Internal factors are described as internal aspects within the enterprise, which includes
employees, organisational culture, processes and finances, which measure strength
and weakness against external forces (Voges & Pulakanam, 2011; and Jessee, 2019).
1.8.1.1 Owners’ Characteristics
Throughout this dissertation, the term Owners’ Characteristics is used to refer to
entrepreneurial drive that are distinctive traits acquired at birth, which includes
passion; independent thinking; optimism; self-confidence, resource and problem
solving; tenacity and ability to overcome hardship; and action oriented with vision and
focus (Gao & Hafsi, 2015; and Duermyer, 2017).
1.8.1.2 Enterprise Resources (ERs)
Generally, ERs are defined as factors of production, which include human capital
formation or employees capital; machinery; equipment; and intellectual competencies
that provide SMEs with the means to perform SCM activities (Hersey & Blanchard,
2017).
1.8.1.3 Information System Components (ISCs)
In this research study, ISCs are therefore defined in terms of combinations or
collections of different components used for gathering, safe guarding and processing
data into providing information knowledge; and digital products for interacting with both
internal and external stakeholders (Zwass, 2017; and Jacobson, 2018).
12
1.8.1.4 Employees’ Competencies (ECs)
The term ECs is regarded as a set of analytical skills, negotiating skills and capability
skills for the use of elementary desktop and computing skills needed for the adoption
of EAA in SCM (Knox & Haupt, 2015; and Tolstoshev, 20117).
1.8.2 External Factors In general terms, external factors refers to threats and opportunities emerging from
both market and macro business environments, with a variety of factors such as
competition; customer taste and preferences; and market fluctuations; finance and
credit regulatory systems; impacts from severe weather; changes in infrastructure,
changing trends; and technological changes (Skoko, Ceric & Hawks, 2019; and Ray,
2019).
1.8.2.1 Complex Legal-Constraints
Throughout this dissertation, the term legal complexity is used to refer to methods to
measure and monitor the legal aspects of an entity, governed by legal theories and
statutory regulators such as Competition Commission of South Africa, Consumer
Board of South Africa and many more, so as to reflect on particular law’s complexities
to adhere to standard (Ruhl & Katz, 2015).
1.8.2.2 Regulatory Constraints
While a variety of definitions of the term ‘regulatory constraints’ have been suggested,
this study uses the term as forces that every enterprise should compete for in order to
execute its strategy, based on period, assets, liquid assets, resources, quality,
regulatory compliance, interests of stakeholders, organisational culture and rick
tolerance (Spacey, 2019).
1.8.2.3 External Financing
External financing refers the form of bonds, loans and debt financing or to acquire
funds business angels and venture capitalists as a way of raising capital rather than
retained earnings (Harvey, 2012; and Althuser, 2018).
13
1.8.2.4 Low Technological Capacity
There is no clear definition of Low Technological Capacity, nevertheless, in this study,
it refers to an enterprise with low or no funds to cover investment in technological
infrastructure and intensity that could be used to adopt EAA (Spacey, 2015; and Del
Carpio & Miralles, 2018).
1.8.2.5 Relative Advantage
Relative Advantage is defined as the point-of-return wherein customers take priority
of the benefits of a product or service based on its enhanced features and benefits
rather than other substitutional product such as the use of computer systems instead
of old-school devices such as type writers (Tagged, 2019).
1.8.2.6 Compatibility of Computer Systems
Compatibility of Computer Systems is referred to as the ability of electronic devices
and systems to perform functions in proximity of electromechanical devices with zero-
defects (Tong, 2019; Sebetci, 2019).
1.8.2.7 System Customisability
In this study, System Customisability is regarded as a process framing the operational
activities that includes different system operation for different users in respect of
network users; safeguarding data, sorting data for different aspects and automating
networks (Barker, 2018).
1.8.2.8 Information Security
Information Security is defined as the theory and practice that provide authorised users
the privilege and the right to use computer software and severs on classified
information (Delony, 2019).
1.8.3 Perceived Attitudes towards the Adoption of EAA Perceived Attitude towards the Adoption of EAA in this study is defined as the level of
psychological state of willingness, grounded in experience, which indicates a directive
or dynamic influence on the person’s reaction to all objects and situations to enhance
14
SCM activities and ultimately the business performance (Davis, 1989; Del Carpio &
Miralles, 2018; and Fenech, 2018).
1.8.3.1 Alternative User-Base Solutions
Throughout this study, the term Alternative User-Base Solutions refers to a process
whereby Information Technology could be used for searching enterprise solutions
through; fieldnames on the system that reveal all tracked documents available in the
computer or internet (Thomas, 2011).
1.8.3.2 Technological Aversion
Technological Aversion refers to reluctance in technological usage that includes the
use of on-line information on both personal and enterprise data sharing through
electronic mechanisms (Law Insider, 2019).
1.8.3.3 Resistance to Change
Resistance to Change in this study is regarded as advanced digital revolution such as
EAA with digital transformation's role that provoke denial and fear on new
technological innovation aimed at the provision of better results (Merritt, 2019).
1.8.4 Actual Adoption of EAA Actual Adoption of EAA denotes the ability to use technology related to the migration
from old system to a newly-target system associated with the behavioural intention
influenced by attitudes within the enterprise, all of which have the chances and
opportunity to yield efficient results (Davis, 1989; and Harry et al., 2017). The Actual
Adoption is the dependent variable as an accurate measurement that is obtained by
measuring perceived attitudes.
1.8.4.1 Job Performance
Job performance is defined as task and contextual performances that involve the
expected value from employees over a certain period of time linked with productivity
(Hordos, 2018).
15
1.8.4.2 Critical Support-Base
Critical Support-Base remains a poorly defined term and in this study it is regarded as
a software system that detects system errors and prevents any defects and
dysfunctionality of both software and hardware systems (Poba-Nzaou, Raymond &
Fabi, 2014).
1.8.4.3 Supply Chain Management (SCM) Activities
SCM activities are defined as a combination of methods utilised to integrate internal
and external stakeholders so that commodities are manufactured, outsources just-in-
time in appropriate qualities and to the specific locations, with the sole purpose of
minimising system-wide costs while sustaining service-level requirements (Kaminsky,
Simchi-Levi & Simchi-Levi, 2009; and DeCenzo & Robbins, 2014).
1.8.4.4 Ease of Activities
The concept ‘Ease of Activities’ has come to be used to refer to the degree to which
a person identifies critical success factors for ERP implementation sources, which
include top management commitment; project management; changes in enterprise
culture; data accuracy; user training and education; user involvement; multi-site
applications; software vendor support; perceived usefulness; and perceived
usefulness (Hwang & Min, 2015).
1.9 Research Methodology The study was conducted within the area of the Capricorn District Municipality (CDM)
in the Limpopo Province of South Africa. CDM includes Blouberg (Bochum)
Municipality, Molemole (Dendron) Municipality, Polokwane Municipality and Lepelle-
Nkumbi (Lebowakgomo) Municipality (Administrative Divisions of South Africa, 2018).
1.9.1 Research Design
The research design in this study outlines the implementation plan on how the
researcher executed the project, whereby a summary on data collection,
measurement instruments and data analysis are outlined (Cooper & Schindler, 2012).
The quantitative research design is adopted to provide a measure of results and to
test the research hypotheses (Anderson, Sweeney, Williams, Camm & Martin, 2013;
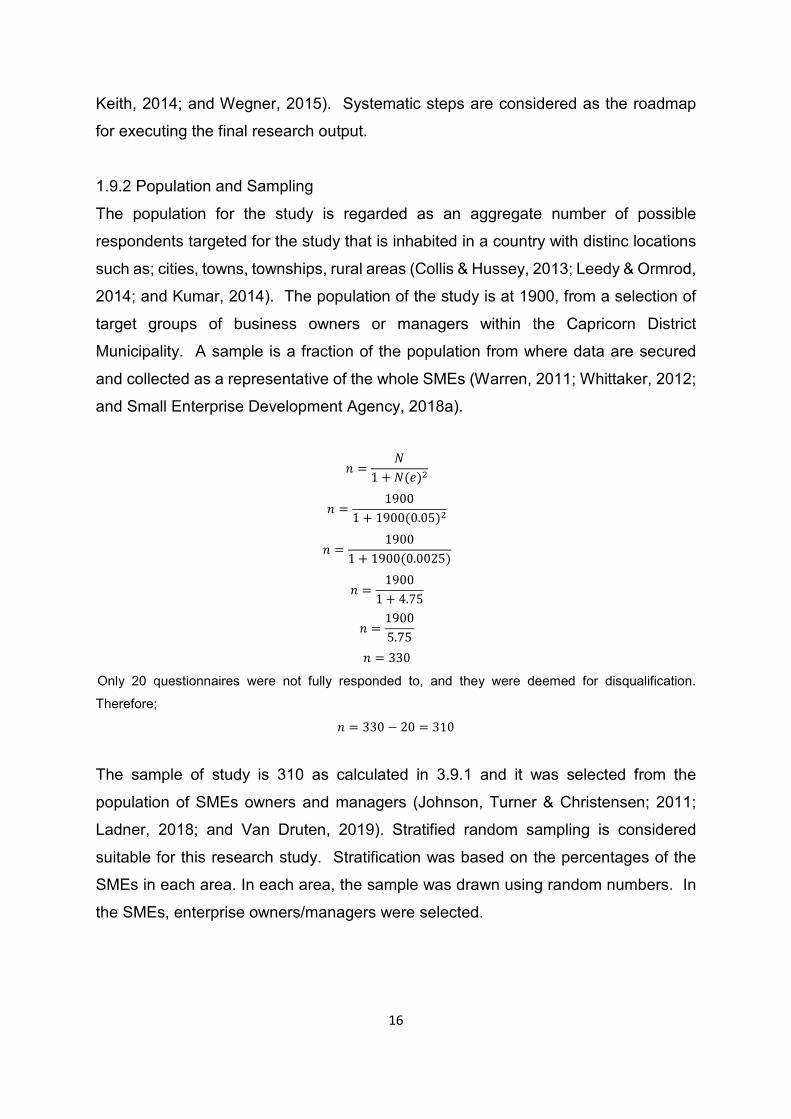
16
Keith, 2014; and Wegner, 2015). Systematic steps are considered as the roadmap
for executing the final research output.
1.9.2 Population and Sampling
The population for the study is regarded as an aggregate number of possible
respondents targeted for the study that is inhabited in a country with distinc locations
such as; cities, towns, townships, rural areas (Collis & Hussey, 2013; Leedy & Ormrod,
2014; and Kumar, 2014). The population of the study is at 1900, from a selection of
target groups of business owners or managers within the Capricorn District
Municipality. A sample is a fraction of the population from where data are secured
and collected as a representative of the whole SMEs (Warren, 2011; Whittaker, 2012;
and Small Enterprise Development Agency, 2018a).
𝑛𝑛 =𝑁𝑁
1 + 𝑁𝑁(𝑒𝑒)2
𝑛𝑛 =1900
1 + 1900(0.05)2
𝑛𝑛 =1900
1 + 1900(0.0025)
𝑛𝑛 =1900
1 + 4.75
𝑛𝑛 =19005.75
𝑛𝑛 = 330
Only 20 questionnaires were not fully responded to, and they were deemed for disqualification.
Therefore;
𝑛𝑛 = 330 − 20 = 310
The sample of study is 310 as calculated in 3.9.1 and it was selected from the
population of SMEs owners and managers (Johnson, Turner & Christensen; 2011;
Ladner, 2018; and Van Druten, 2019). Stratified random sampling is considered
suitable for this research study. Stratification was based on the percentages of the
SMEs in each area. In each area, the sample was drawn using random numbers. In
the SMEs, enterprise owners/managers were selected.
17
1.9.3 Data collection
The researcher conducted data collection using structured self-administered
questionnaires in a cross-sectional survey.
1.9.4 Data Analysis
Descriptive and inferential statistical methods were used to analyse the data (de Vos,
Strydom, Fouche & Delport, 2011; and Collis & Hussey, 2013). The SPSS (version
25) tool was used for producing results on Kolmogorov-Sminorv test for normality,
Pearson Correlations, Analysis of Variance (ANOVA) and Pearson Coefficient for
testing the hypotheses and Simple Linear Regression for relationships (Omai, 2014;
Samuel & Neil, 2016; and Van Druten, 2019).
1.9.5 Reliability and Validity 1.9.5.1 Reliability
Reliability refers to the equivalence in testing reliable outcomes in research projects
(Pallant, 2013; and Birley & Moreland, 2014). The Cronbach’s Alpha was used to
measure reliability at the value of at least 0.7 to indicate the internal consistency of
measures (Tavakol & Dennick, 2014).
1.9.5.2 Validity
Validity is whether the research measures are appropriate to estimate the truthfulness
of the results without any manipulation of data (Rubin & Babbie, 2013; and
Csikszentmihalyi & Larson, 2014). The validity of the research is segmented into two
groups, namely, internal validity, which reflects how the research methodology delivers
authenticity of the results and external validity, which reflects the extent to which a
research measures reality (Dudovskiy, 2016). In addition, content validity, construct
validity and face validity were ensured.
Content validity was ensured as all the variables of the research study were obtained
from the literature review (Lobiondo-Wood & Haber, 2013). Construct validity was
ensured by selecting and testing the relationship between the measurement items and
the constructs used (Bagozzi & Yi, 2012). Face validity was ensured by the inclusion
of variables as discussed by the scientific community (Bryman, Hirschsohn, Du Toit &
18
Wagner, 2014; and Shuttleworth, 2015). Internal validity was considered for its
accurate procedures and experiment ability to draw out correct assumptions or
inferences about the results (Sarniak, 2015).
1.10 Significance of the Study EAA is increasingly recognised as a success factor in corporate entities and it could
bring constructive modifications for SCM in SMEs. This study provides a greater
understanding of EAA of the factors influencing the actual adoption of EEA in SCM.
The findings could be useful by internal stakeholders (such as enterprise owners,
managers and employees) to utilise the benefits of EAA in simplifying the use of
various applications. This simplification will allow for using problem-solving methods
on Supply Chain; improving Supply Chain performance through better facilities
utilisation; having less inventories; and providing quick and accurate information for
sourcing and pricing. External stakeholders (such as customers, suppliers,
government, creditors, investors and shareholders) will benefit from the internal
improvements that EAA provides and the improvement in enterprise networking. The
government can consider introducing EAA for SMEs in their training and development
programmes.
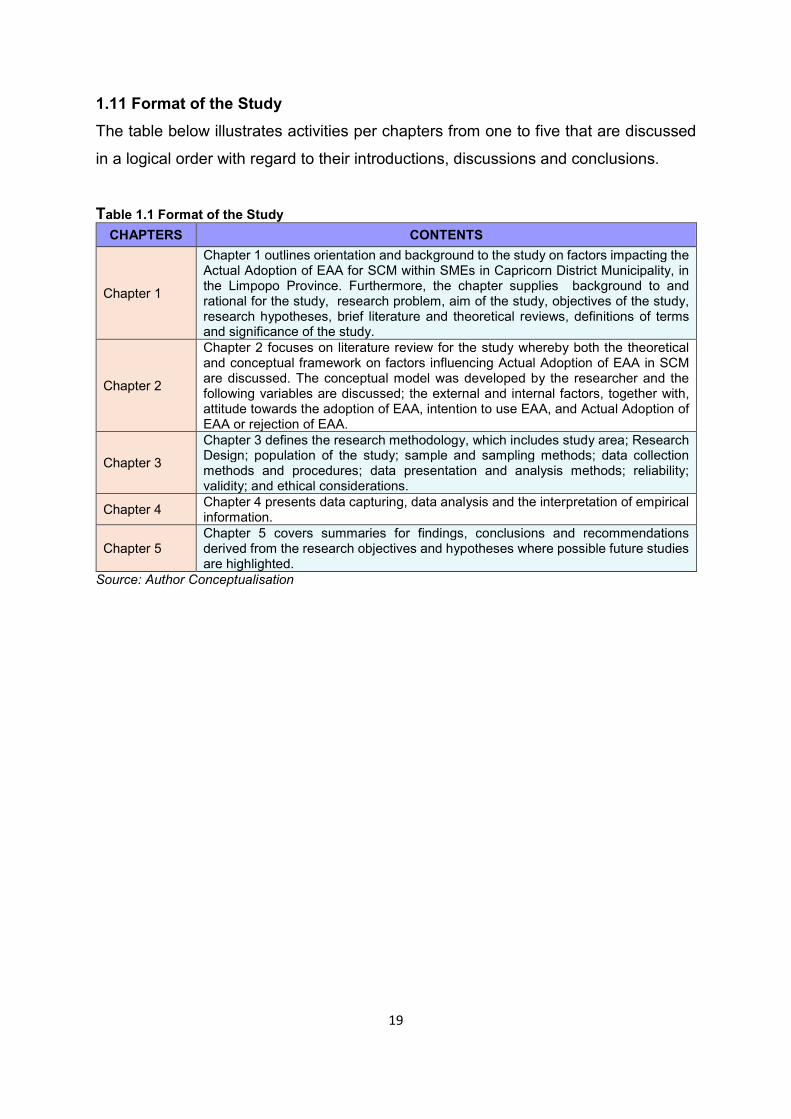
19
1.11 Format of the Study The table below illustrates activities per chapters from one to five that are discussed
in a logical order with regard to their introductions, discussions and conclusions.
Table 1.1 Format of the Study CHAPTERS CONTENTS
Chapter 1
Chapter 1 outlines orientation and background to the study on factors impacting the Actual Adoption of EAA for SCM within SMEs in Capricorn District Municipality, in the Limpopo Province. Furthermore, the chapter supplies background to and rational for the study, research problem, aim of the study, objectives of the study, research hypotheses, brief literature and theoretical reviews, definitions of terms and significance of the study.
Chapter 2
Chapter 2 focuses on literature review for the study whereby both the theoretical and conceptual framework on factors influencing Actual Adoption of EAA in SCM are discussed. The conceptual model was developed by the researcher and the following variables are discussed; the external and internal factors, together with, attitude towards the adoption of EAA, intention to use EAA, and Actual Adoption of EAA or rejection of EAA.
Chapter 3
Chapter 3 defines the research methodology, which includes study area; Research Design; population of the study; sample and sampling methods; data collection methods and procedures; data presentation and analysis methods; reliability; validity; and ethical considerations.
Chapter 4 Chapter 4 presents data capturing, data analysis and the interpretation of empirical information.
Chapter 5 Chapter 5 covers summaries for findings, conclusions and recommendations derived from the research objectives and hypotheses where possible future studies are highlighted.
Source: Author Conceptualisation
20
1.12 Conclusion This introductory chapter provided the background to the study. The aim and
objectives of the study, significance of the study and the preliminary research
methodology were discussed. Furthermore, it described background to the problem,
research problem, problem statement, sub-problems, limitation to the research,
purpose of the study, research objectives, research hypotheses, literature review,
definition of terms, research methodology, significant of the study and format of the
study. In the next chapter, the theoretical framework covering three theories, namely,
Diffusion Theory of Innovation, Technology Acceptance Model and Theory of
Reasoned Action, are discussed.
21
CHAPTER 2: LITERATURE REVIEW
2.1 Introduction The concept of SCM was introduced by Keith Oliver in 1982 at Booz Allen Hamilton,
through the public domain, in an interview for Financial Times (Badenhorst-Weiss et
al., 2018b). Contemporary developments in the field of SCM have led to a renewed
interest in EAA. This chapter demonstrates and displays the literature review by
covering important aspects such as theoretical framework and conceptual framework
of EAA. The conceptual research model includes external factors; internal factors;
perceived attitude towards the Actual Adoption of EAA; and the Actual Adoption of
EAA for SCM in SMEs. SCMs have significant influence on enterprise operations and,
with the inclusion of EAA, SMEs will contribute to improved performance of the South
African economy, particularly the Gross Domestic Product (GDP).
22
2.2 Theoretical Literature Review
2.2.1 Technologically Acceptance Model (TAM) In this study, during the review of TAM, some of the constructs such as perceived ease
of use and perceived usefulness were not used in this study. The aim was to shorten
the conceptual research model and to explore other variables such as internal and
external factors affecting the adoption of EAA. Using the TAM for analysing the
adoption of EAA for SCM in SMEs can improve the low actual adoption (Shilman,
2017). TAM is a theory that is used to analyse the adoption of new technologies by
organisations (Escobar-Rodriguez & Bartual-Sopena, 2015). TAM was developed by
Davis, Bagozzi and Warshaw in 1989 (Godoe & Johansen, 2018).
TAM focuses on rational decision-making for technological implications that would
bring a significant change in SCM (Anderson & Perrin, 2017; and Dillon & Morris,
1996a). For SMEs to be more efficient and effective in SCM, they need to take
calculated risk by investing in TAM that will bring positive benefits for the entire
enterprise. The intended actual adoption of new technology is influenced by the ease-
of-use and usefulness of EAA for SCM (Schnädelbach, 2010; Travis, 2017; and Leong
et al., 2012). An implication of this is the possibility that TAM would be efficient in SMEs
that are willing to invest more financial resource that allows a roof for learning,
implementation and execusion of EAA.
2.2.2 Theory of Reasoned Action (TRA) Ajzen's Theory of Reasoned Action in Social Psychology describes the relationships
between beliefs, attitudes, norms, intentions and behaviour based on competency
level of labour, versus Enterprise Resources such as hardware and software systems
(Hackman & Knowlden, 2014; and Dillon & Morris, 2018b). TRA is a good illustration
of EAA actual adoption as it reveals the decisions required in the choice of the
business as a prerequisite for the actual adoption (Mutopo, 2016; Zayra, 2016; and
Thomas & Tagler, 2019). TRA validates the adoption of EAA by prioritizing the
behavioural patterns of employees and their general knowledge on IT (Hackman &
Knowlden, 2014; Sternad & Bobek, 2013; and Escobar-Rodríguez & Bartual-Sopena,
2015). TRA suggests that employees’ behavioural patterns could be monitored and
directed towards the Actual Adoption of EAA for SCM. TRA states that behavioural
23
measures are speculations on the intentions of acceptance or rejection technology
(Camadan, Reisoglu, Ursavas & Mcilroy, 2018; LaMorte, 2018; and Hagger, 2019).
TRA was synthesised using the same method that was detailed for the adoption of
EAA, using the following constructs namely; ease of use of activities and their general
knowledge components of IT.
2.2.3 Theory of Planned Behaviour (TPB) TPB it is ment to produce useful information for effective communication approaches
that involves attitudes, behavioural intention, subjective norms, social norms,
perceived power and perceived behavioural control for the adoption of EAA for SCM
in SMEs (Alzen, 1991). Moreover, it is defined as means to produce useful information
for effective communication approaches that involves insourcing, processing and
outsourcing activities in SCM (Silverman & Lim, 2016). TPB explains three user
determinants, namely, effort expectancy, social influence and facilitation conditions to
engage in EAA adoption (Hazen et al., 2014). It emphasises conceptual Actual
Adoption of EAA based on thorough application of managerial roles, such as planning,
organising, leading and controlling (Hellriegel, Slocum, Jackson, Staude, Amos,
Klopper, Oosthuizen, Perks & Zindiye, 2012).
Thomas and Tagler (2019) show how, in the past, research using TPB was mainly
concerned with changing attitudes and subjective norms of employees rather than
actual adoption (Dippel et al., 2017). The extended TPB model includes interpersonal
and situational variables that may have an influence on the attitude towards intention
to use for SCM in SMEs (Hackman & Knowlden, 2014; and Pesquisa, 2018). The
theory includes behavioural achievement that relies on motivation and ability, which
are differentiated with three beliefs, namely, behavioural, normative and control for
internal and external systems used in SCM. This shows a need to understand the
motivational aspects of the Owners’ Characteristics (O’Kelly, 2016; Halabisky, 2017;
and Forsdike et al., 2018). TPB was synthesised using the same method that was
detailed for the adoption of EAA, where; attitudes, behavioural intention, subjective
norms, social norms, perceived power and perceived behaviour were scrutunised.
24
2.2.4 Diffusion Theory of innovation A basic theory also underlying this research is the Diffusion Theory of Innovation (DTI).
The DTI was originally developed by E.M. Rogers in 1962 for communication in social
systems by describing how new ideas spread in an organization (Dearing, 2009,
Mulder, 2012; Chatterjee, 2017; Rehman, Majumdar & Krishna 2017; and LaMorte,
2018). The theory’s origin is in communication model maintaining how new inventions
in technological standards evolves as time moves in a positive direction in-line with
socio-demographic factors that maintain drive and diffuses through a specific
population or social system (Rehman et al., 2017).
DTI can use as a conceptual model explaining the diffusion of technological innovative
systems (Green, 2014; and MacVaugh, 2019). As a results, two essential elements
are involved in the DTI; (a) the innovation part that needs to modify an appropriate
change or upgrade in SCM that is spreading towards SME development (b) and
vectors of communication diffusion that need to be at hand for agile information
dessermination (Ingram 2017). Five constructs were adopted in the Diffusion Theory
of Innovation, namely, relative advantage, compatibility, complexity, triability and
observability, all of which encourage the adoption of new processes and ideas. These
construct were used to develop questions on the Perceived Attitudes towards Adoption
of EAA for the questionnaire.
Relative advantages materialise when customers prefer on-line purchases on its
enhanced features and benefits rather than engaging in door-to-door purchases
(Tagged, 2019). Potential adopters, therefore, evaluate an innovation on its relative
advantage (i.e., the perceived efficiencies gained by the innovation relative to current
tools or procedures), its compatibility with the pre-existing system, complexity or
difficulty to learn, its triability or testability, its potential for reinvention (using the tool
for initially unintended purposes), and its observed effects (Vejlgaard, 2018; and Baker
et al., 2019). To date various theories have been reviewed and introduced to measure
DTI in light of EAA as a key factor for SMEs adoption.
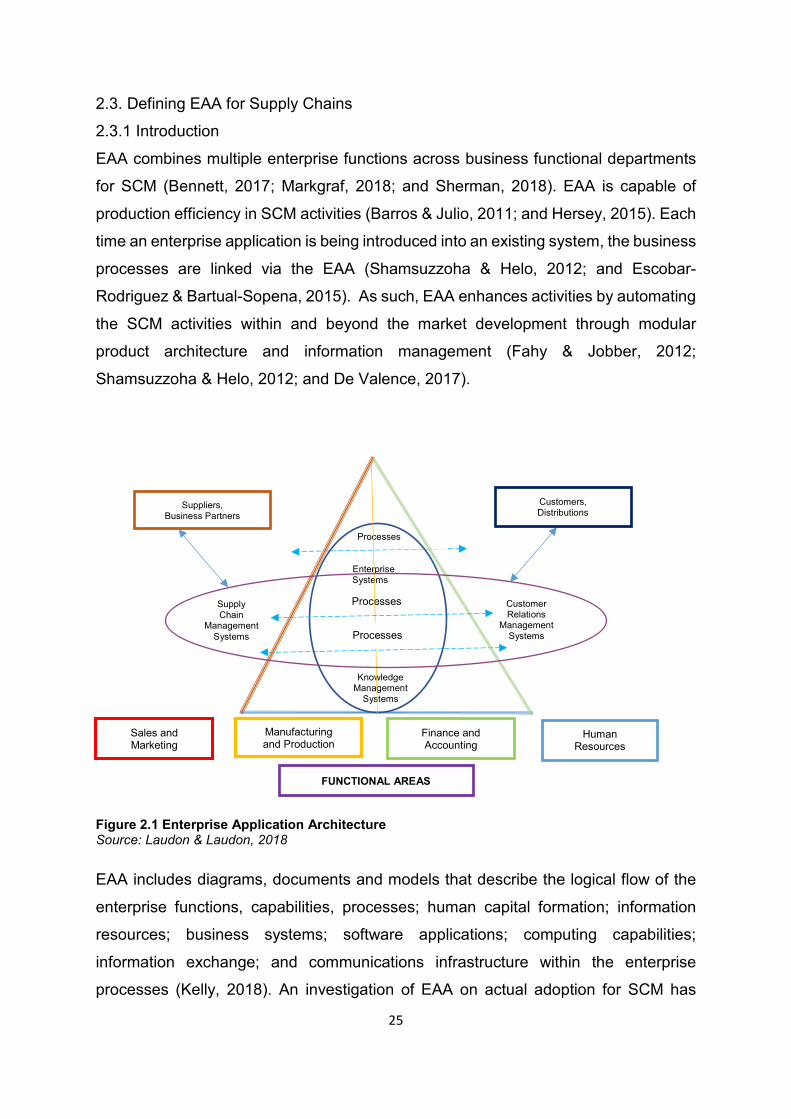
25
2.3. Defining EAA for Supply Chains
2.3.1 Introduction
EAA combines multiple enterprise functions across business functional departments
for SCM (Bennett, 2017; Markgraf, 2018; and Sherman, 2018). EAA is capable of
production efficiency in SCM activities (Barros & Julio, 2011; and Hersey, 2015). Each
time an enterprise application is being introduced into an existing system, the business
processes are linked via the EAA (Shamsuzzoha & Helo, 2012; and Escobar-
Rodriguez & Bartual-Sopena, 2015). As such, EAA enhances activities by automating
the SCM activities within and beyond the market development through modular
product architecture and information management (Fahy & Jobber, 2012;
Shamsuzzoha & Helo, 2012; and De Valence, 2017).
Figure 2.1 Enterprise Application Architecture Source: Laudon & Laudon, 2018
EAA includes diagrams, documents and models that describe the logical flow of the
enterprise functions, capabilities, processes; human capital formation; information
resources; business systems; software applications; computing capabilities;
information exchange; and communications infrastructure within the enterprise
processes (Kelly, 2018). An investigation of EAA on actual adoption for SCM has
Processes
Processes
Enterprise Systems
Knowledge Management
Systems
Supply Chain
Management Systems
Customer Relations
Management Systems
Suppliers, Business Partners
Customers, Distributions
Manufacturing and Production
Sales and Marketing
Finance and Accounting
Human Resources
FUNCTIONAL AREAS
Processes
26
shown that all functional departments need to be incorporated in the system with the
enterprise (Kuhn, Galloway & Collins-Williams, 2016; and Asetpartners, 2018). It is
overbearing for SMEs to structure EAA that will impact on enterprise structure for
SCM. 2.3.2 Suppliers and business partners
The enterprise interactions with suppliers includes working hand-in-hand with other
contractors for the provision of innovative solutions in a sustainable and ethical
environment by exploiting, operating and take advantage of available resources and
adopting EAA in SCM (Vogt, 2017; MTN Group, 2019; and Vodafone, 2019). Digital
trends are impacting the suppliers’ expectations with complex and constant changes,
which requires them to collaborate in the SCM environment (Shelat, 2016; and Van
der Meulen, 2018). Enterprises are operating in a digital-age with hierarchies and
different elements of administrative protocols and algorithms for SCM with quality
assurance, timely delivery and adherence to responsible business practice (Chadwick,
2018; and Ingram, 2018).
A number of functions for interfaces with supplier should include contract
management; customer service systems; data gathering regarding customer
requirements and trends in the market; customer history tracking; order entry;
decision-support for campaigns; and market segmentation (Guimarães, 2012;
Badenhorst-Weiss et al., 2016a; and Naughter, 2017). EAA relies on logistical
arrangements between the suppliers and the SMEs for collaboration, administration
protocols and contract management with service systems (Ballard & Barker; 2016;
Naughter, 2017; Mulder, 2019; and Coster, 2019).
By aligning innovation with agility and implementing statutory framework that defines
all roles, responsibilities and relationships involved in the program management and
IT processes, could give SMEs a competitive advantage in SCM (Asetpartners, 2018).
The strategic component for suppliers includes decisions is the number, size and
location of warehouses and the selection of SCM partners (Ingram, 2018). For a
successful business partners’ relationship, it would be necessary to develop partners
in a business functions by creating a project that contributes to business value and
27
encourage flexibility in EAA (Hickey, 2015). SMEs should make room for accelerated
processes and faster development linked to the Actual Adoption of EAA for SCM.
2.3.3 Processes and Enterprise Systems
Processing and enterprise systems link are common challenges characterised by
processes and algorithms in the Actual Adoption of EAA. Enterprise system features
enable SMEs to experience cost-reducing strategies such as reduction in manual
record keeping, agile customers and suppliers tracking system, increased efficiency
and effectiveness (McDonald; 2018). Improved customer service depends on
resourced operations that are designed to enhance customer retention and build brand
equity through the Actual Adoption of EAA (Sambartolo, 2015; Hamid, 2016; and Dillon
& Morris, 2018b). Enterprise system features enable SMEs to experience cost-
reducing strategies such as reduction in manual record keeping; agile customers and
suppliers tracking system; and increased efficiency and effectiveness (Ogrinja, 2013;
and Nordmeyer, 2019).
The EAA includes three steps to digital SCM, namely, confirming the organisation’s
digital vision and Supply Chain’s role; alignment of SCM operating model to the digital
vision; and prioritising digital technology investments (Coté, 2016; and Van der
Meulen, 2018). SCM strategy includes a demand-driven operating model that
integrates customers, processes and technology, for a better EAA system (Oracle,
2018; and Gemalto, 2018). The market and macro-environment pressure brings
changes in standards and regulations, thus leading to change or upgrades in
processes (Guimarães & Souza, 2012; Hickey, 2015; and Writing, 2017).
Digital business services use different connectivity for bridging the gap between
strategic, operational and functional strategies occurring in SCM (Sinha et al., 2015;
and Altexsoft, 2018). Customer intimacy is determined by factors such as; experience,
fulfilment desired products, accessibility for products and possession of valued items
as requested that carry a certain impact on processing programs (Asmundson, 2017;
and Badenhorst-Weiss et al., 2018b). Customer’s value could be identified through
vital elements such as; conformance to the specific requirements, product selection,
value-added services, price and branding, relationship and experiences that would
28
impact the processing (Barros & Julio, 2011; and Badenhorst-Weiss et al., 2016a).
Although there are limitations to SMEs towards the Actual Adoption of EAA for SCM,
other factors such as adherence to technological standards could be used to keep
track of sales, customer demand and retention, building brand-equity with value-added
services in progression with processes and enterprise systems.
2.3.4 Customers and Distributors
A primary concern for customers and distribution is in the SCM activities that provide
agile services just-in-time (Rouse, 2018b; and Crain, 2018). Customer and distribution
links results from feedback mechanism in data management, distribution and network
optimisation with Knowledge Management Systems that permits SMEs to share and
communicate decisions between demand and supply interaction (Aveva, 2019). In the
traditional approach, some SMEs consider distribution as a physical routes that a
product flow from the supplier to customers, and sellers could use member of criteria
such as; complexity of technical requirements in EAA, lifespan and price of the
software and hardware, service requirements an turnover generated to determine their
distribution cost-efficiency (Vogt, 2017).
Distribution and logistics could be hindered by unforeseen circumstances such delays
in shipping that can leave a lasting impact on customers and directly affecting
Customer Relationship Management System (CRMS) (Saha, 2018). Electronic
interchange includes the exchange of business transaction between multiple business
and customers by make use of internet interfaces for transmitting data and information
from business-to-business, business-to-customer, consumer-to-consumer or
consumer-to-business (Rouse, 2018c). The relevance of customer and distribution link
in EAA could depends on technical requirements per SMEs for a aligning it with
customers on the website or internet sources for easy access for processing
transactions on-line.
2.3.5 Supply Chain Management System (SCMS)
Much of the current literature on SCMs pays particular attention to ever-increasing
competition and service delivery demands are forcing SMEs to revisit the operational
efficiencies of their Supply Chains facing barriers to competition (Sewdass, 2012;
29
Asmundson, 2017; and Ticlo, 2018). The discipline of SCMS has encouraged
considerable research interest in recent years (Susan et al., 2012). This is evident in
empirical articles that some large firms they progressively expanded their business
and upgraded their service offering over periods of 8 to 20 years as they benefited on
EAA investments (Perry & Towers, 2013). The SCMs should be maintainable and
sufficiently responsive to support the SMES informational requirements with practical
and open knowledge sharing process (Guimarães & Souza, 2012). Internal and
external factors compel SMES to be more responsive based on changing and
unpredictable business environments (Sharma, 2015a).
At present, SMEs are facing growing pressure on improving logistic performance as a
number of factors can cause delays in the SCMS (Wisner et al., 2012). EAA is
organised on the life sequence of the transformational processes that portrays the flow
of phases necessary to initiate, sustain and continuously refine SMEs based upon lean
principles and systems engineering methods with other SC partners (Flower, 2018c).
Factors found to be influencing SCMS have been explored in several studies, which
includes that a broader SCMS framework is coupled with risk analysis and
management of product architectures for SCMS design, testing and implementation
(Pashaei & Olhager, 2015).
Integrated systems involve human subjectivity, uncertain mathematical framework for
integrating imprecision and ambiguity into the models for SCMS (Kahraman, Kaya &
Çevikcan, 2011). Despite the fact that there are formal processes that need to be
aligned with EAA, SCMs depend on other functional departments and they have better
interactions with operational efficiencies being able to face barriers to competition by
applying on-hand mathematical frameworks (Vogt, 2017). The most apparent
encounter to emerge from SCM is that SCM activities such as insourcing, processing
and outsourcing should be linked with enterprise functional departments for an
equitable Actual Adoption of EAA.
30
2.3.6 Customer Relationship Management Systems (CRMSs)
CRMSs it is known as collective name for a management strategy with many individual
sub-strategies, which are implemented through diverse processes, technologies and
approaches (Badenhorst-Weiss et al., 2016a). CRMSs help SMEs to seal the SCM
transactions faster while consolidating the CRMSs (Sinha, Zande & Smith, 2015). In
principle, CRMSs help SMEs to recognise valued-customers on an automated and
tracking from customer database, firstly by partitioning their demands and
requirements (Lin, 2016; and Chamber of Commerce of Metropolitan Montreal, 2018).
CRMSs ultimately help businesses to grow by building a relationship with their
customers that, in turn, creates loyalty and customer remembrance engineered for
SCMS and long-term relationships (Cognite, 2018).
The evaluation of customer retention is waved on monetary value invested in the EAA
and software technology that provide accurate results about customer habits and
purchasing patterns (Waskito, 2018). The positive side on implementing EAA for CRM
system is that there is very less need for paper and manual work, which requires lesser
staff to manage and lesser resources to deal with (Vogt, 2017; and Juneja, 2018). There
is an important relationship between CRM and SCM that depend on factors such as
demand management, creating customer value, depended demand and capacity
management (Badenhorst-Weiss et al., 2016). There is, therefore, a definite need for
techniques for solving CRM challenges are computationally demanding and not
neglecting their purchasing patterns and SMEs capacity management.
2.3.7 Knowledge Management Systems (KMS)
The nature of KMS has been addressed in small-scale investigations in EAA and, as
such, in hiring, prioritising digital dexterity, a combination of analogue and digital skills
and traits, over pure technical know-how, of which is a careful process, is vital in SCM
(Van der Meulen, 2018; and Merritt, 2019). KMS involvement could be considered as
investment in SCM and EAA could be considered for such invention (Reyes et al.,
2015). Human capital formation in SCM provide employees with extraordinary
experience and with the Actual Adoption of EAA with low scientific knowledge
(Azoulay, Jones, Kim & Miranda, 2018). Knowledge-intensive task for SMEs is to use
comprehensive IT applications like EAA (Ardley, Moss & Taylor, 2016). Theoretical
31
basis for understanding learning as a social process and argue “learning is defined not
only as the acquisition of knowledge but also the acquisition of identity by having a
deep knowledge about the systems processes in the Actual Adoption of EAA (Chen,
2017; and Smith & Barrett, 2016). Successful SMEs have the most inspirational ideas
that needs to be natured with relevant KMS with a perfect identification of window of
an opportunity (Jenkin, 2016; and Tumenta, 2016). Knowledge-intensive task for
SMEs use comprehensive IT applications like EAA and sharing with extended teams
(Sinha et al., 2015). KMS could be linked with both quantitative and qualitative
approaches that leads to improvement in SCM in production forecasting (Chamber of
Commerce of Metropolitan Montreal, 2018).
It could be a difficult encounter for some SMEs to cope with larger business
organisations as they have EAA in place and with formal systems making working
relationships difficult as they have competitive advantage on on-going activities linked
to the KMS, such as clarifying employees’ responsibilities, job descriptions,
organograms and lines of authorities (Nieman, 2013). Despite the exploratory nature
of KMS the key success factor would be to consider the digital dexterity, distribution
of information from internal and external perspective by clarifying employees’
responsibilities, job descriptions and following all organograms.
2.3.8 Sales and Marketing
This section outlines how sales and marketing activities are changing and upgrading
EAA could compel the SMEs to design a dynamic electronic link for a changing
marketplace (Chadwick, 2018). An EAA is developed to collect information such as
sales accumulation versus costs incurred across the SMEs’ different geographical
locations and by categorising total sales comprised of cash and credit sales (Ingram,
2018). EAA assist managers to focus on the organisation's information and IT systems
by analysing the SMEs challenges on sales and market related activities (Beal,
2018a). EAA could be used within the SMEs at an operational level between sales
and marketing, manufacturing and production, finance and accounting and human
resource for sharing information (Gemalto, 2018).
32
SCM involves using a formal planning process that involves historical data on
dependent demand and independent demand (Writing, 2017; and Badenhorst-Weiss
et al., 2018b). For the correct use of EAA, SMEs could maintain their sales and
marketing records on daily, weekly, quarterly and annual basis (Cognite, 2018; and
Waskito, 2018). In-house communication across the SMEs to yield common and
mutual understanding for internal forces such as strength and weaknesses and
external forces on opportunities and threats (Callaghan, 2013; Herman & Stefanescu,
2017; and Kozicki, 2017). Moreover, more of sales and marketing activities should be
incorporated in EAA for data management, mining and processing with ease in
financial and marketing departments.
2.3.9 Manufacturing and Production
Current developments in the field of IT have led to a renewed interest in manufacturing
and production by using software applications for SCM that are ready-made package
usually targeted for dealing with certain set of tasks (Markgraf, 2018). Operational
manager’s general viewpoint toward inventory levels is adopt EAA to keep a constant
rate of productivity and to ensure that the SMEs’ Financial Resources (FRs) are not
being wastefully capitalised in excess resources (Gitman, 2015; and Rupeika-Apoga
& Danovi, 2015). EAA is a model that represents two purposes: (a) it focuses on the
employee as a sub-system, with specific algorithms executed by employee with the
use of different, tools, machinery and equipment; and (b) it focuses on technical sub-
algorithms aimed at managing, maintaining knowledge, skills and abilities for
administrative proposes (Ferreira et al., 2013; and Ray, 2017). In spite of these EAA
occurrences, it is evident that manufacturing and production should at least have
automate algorithms, intensive knowledge and technical skills, so as to capitalised in
cost savings and not disregard economic factors such as inflation, recession and
interest rates.
2.3.10 Finance and Accounting
Accounting Information System Components in modem economy has brought
simplicity in analysing the main duties and responsibilities for Accountants and
Financial professionals by adopting modern technology such as EAA (Trigo & Belfo,
2013; and Wayner, 2018). The challenge is towards the Actual Adoption of EAA for
33
SCM that would bring financial clarification on creditors and suppliers’ records in SCM
(Shilman, 2017; and Saito et al., 2017). As a result, the software application systems
needs to support data preservation from the time at which a transaction occurred
(Eberechukwu & Chukwuma, 2016; Shelat, 2016; and Shefer, 2018). A well-structured
EAA would be able to include multiple activities such as raw-material ordering and
processing, planning for material purchasing, inventory control, distribution,
accounting, marketing, finance, direct and indirect labour assessments (Kharytonov,
2012; Brunello, 2013; and Beal, 2018d). These factors influence the use of EAA to
achieve optimal performance in SCM. Convenient package-software applications are
for mass-customised products and thus by design disregard the specific requirements
of certain SMEs (Portugal, 2016; McLaughlin, 2016; and Igriany, 2018).
EAA is a fundamental-intellectual property for SMEs based on the contexts and
emphasise for description of different conceptual models developed and managed for
reasonable SMEs system that include Information System Components and
integration phases for developing optimal solutions for SCM (Filho & Aquino Júnior,
2015; and Banaeianjahromi & Smolander, 2016). Many theoretical models have been
developed with the sole purpose of fulfilling demand forecast on SMEs alliances for
better SCM in SMEs and corporations (Hazen et al., 2014; Iyamu & Mphahlele, 2014;
and Ingram, 2018). Overall, there seems to be some evidence to indicate that EAA
depends upon the conceptual framework from authors’ conceptualisation that includes
Owners’ Characteristics, ER, ISCs and EC competencies.
2.4 Small And Medium Enterprises (SMES) The SMEs are regarded as the pillar of economic development and growth in the South
African economy. Small and Medium Enterprises are the primary focus in this research
study. Based on their economic and monetary contribution to the economy, the
researcher’s optimism was triggered to include SMEs rather than micro enterprises,
private and public enterprises.
2.4.1 Defining Small and Medium Enterprises This concept on defining SMEs have recently been challenged by the adoption of EAA
studies demonstrating ways they are defined in the South African context, in
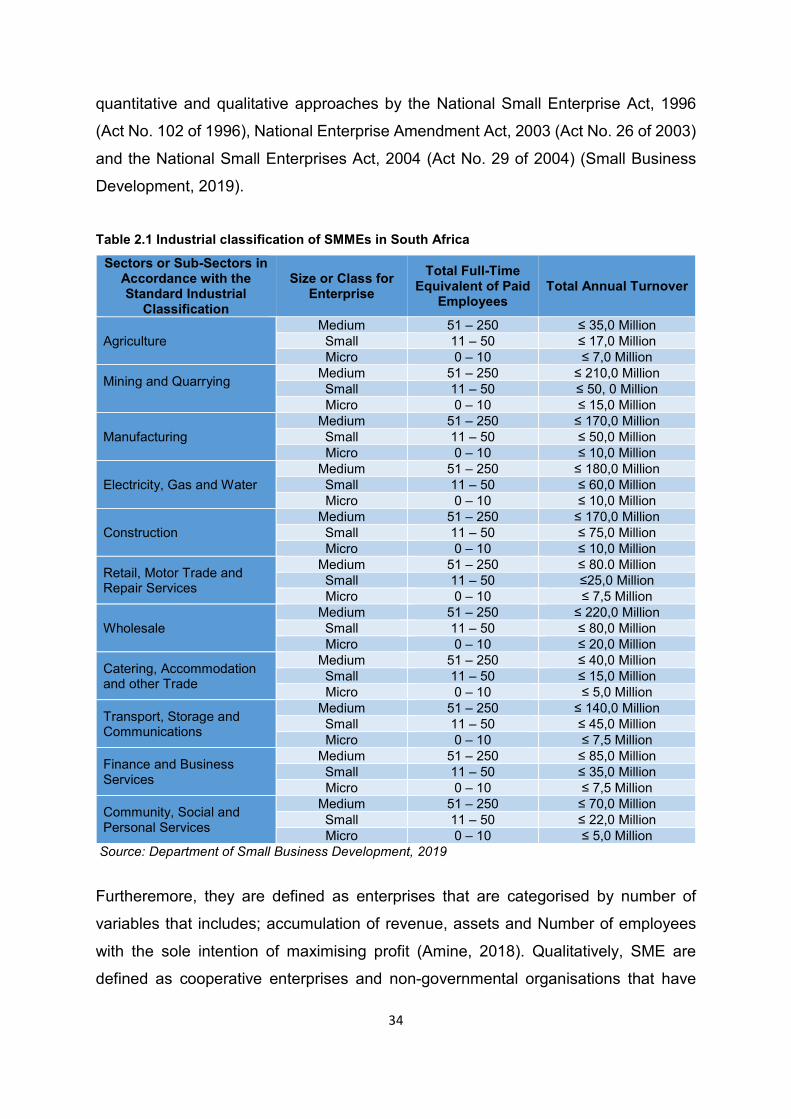
34
quantitative and qualitative approaches by the National Small Enterprise Act, 1996
(Act No. 102 of 1996), National Enterprise Amendment Act, 2003 (Act No. 26 of 2003)
and the National Small Enterprises Act, 2004 (Act No. 29 of 2004) (Small Business
Development, 2019).
Table 2.1 Industrial classification of SMMEs in South Africa
Sectors or Sub-Sectors in Accordance with the Standard Industrial
Classification
Size or Class for Enterprise
Total Full-Time Equivalent of Paid
Employees Total Annual Turnover
Agriculture Medium 51 – 250 ≤ 35,0 Million Small 11 – 50 ≤ 17,0 Million Micro 0 – 10 ≤ 7,0 Million
Mining and Quarrying
Medium 51 – 250 ≤ 210,0 Million Small 11 – 50 ≤ 50, 0 Million Micro 0 – 10 ≤ 15,0 Million
Manufacturing Medium 51 – 250 ≤ 170,0 Million Small 11 – 50 ≤ 50,0 Million Micro 0 – 10 ≤ 10,0 Million
Electricity, Gas and Water Medium 51 – 250 ≤ 180,0 Million Small 11 – 50 ≤ 60,0 Million Micro 0 – 10 ≤ 10,0 Million
Construction Medium 51 – 250 ≤ 170,0 Million Small 11 – 50 ≤ 75,0 Million Micro 0 – 10 ≤ 10,0 Million
Retail, Motor Trade and Repair Services
Medium 51 – 250 ≤ 80.0 Million Small 11 – 50 ≤25,0 Million Micro 0 – 10 ≤ 7,5 Million
Wholesale Medium 51 – 250 ≤ 220,0 Million Small 11 – 50 ≤ 80,0 Million Micro 0 – 10 ≤ 20,0 Million
Catering, Accommodation and other Trade
Medium 51 – 250 ≤ 40,0 Million Small 11 – 50 ≤ 15,0 Million Micro 0 – 10 ≤ 5,0 Million
Transport, Storage and Communications
Medium 51 – 250 ≤ 140,0 Million Small 11 – 50 ≤ 45,0 Million Micro 0 – 10 ≤ 7,5 Million
Finance and Business Services
Medium 51 – 250 ≤ 85,0 Million Small 11 – 50 ≤ 35,0 Million Micro 0 – 10 ≤ 7,5 Million
Community, Social and Personal Services
Medium 51 – 250 ≤ 70,0 Million Small 11 – 50 ≤ 22,0 Million Micro 0 – 10 ≤ 5,0 Million
Source: Department of Small Business Development, 2019
Furtheremore, they are defined as enterprises that are categorised by number of
variables that includes; accumulation of revenue, assets and Number of employees
with the sole intention of maximising profit (Amine, 2018). Qualitatively, SME are
defined as cooperative enterprises and non-governmental organisations that have

35
separate and distinct characters that are managed by one proprietor or more
individuals, which includes its extended branches or subsidiaries (Department of Small
Business Development, 2019). Quantitatively, SMEs are classified in the table below
according to total full-time equivalent of paid employees and total annual turnover in
the different industry types (Department of Small Business Development, 2019).
Furtheremore, SMEs are are defined as entities that preserve their enterprise class
and size, revenue, assets and number of employees with a primary objective for
maximising profit (Amine, 2018).
The categorisation is more advanced with grouped sectors as; agriculture, mining and
quarrying, manufacturing, electricity, gas and water, construction; retail, motor trade
and repair services; wholesales; catering, accommodation and other trade; transport,
storage and communications; finance and business services; and community, social
and personal services (Department of Small Business Development, 2019). SMEs
from all sectors of the economy play a significant role in tax contribution, which later
gets distributed through State organs and Corporate Social Responsibility.
2.4.2 Contribution of SMEs to the South African Economy SMEs contribution are significantly recognised as GDP growth, which is measured
through contribution towards employment, wealth formation, poverty alleviation and
innovation conception. The contributions by SMEs categorised in to three spheres as;
economic, industrial and firm based benefits with limited control over the market and
macro business environment (Rees & Porter, 2015; Schwab, 2016; Singh, 2018). At
least five contributions are discussed in terms of gross domestic product (GDP),
employment, wealth formation, poverty alleviation and innovation conception;
2.4.2.1 Gross Domestic Product (GDP) Contribution
In economics viewpoint GDP includes variables such as; consumption, government,
investment expenditures and net exports that happens within the boundaries of the
South African economy during a specified period of time, usually a year. GDP is
regarded as an instrument for measuring the aggregate and monetary value of final
commodities and services produced within the boundaries of a country at a given
period of time (Callen, 2020). SMEs are regarded as fundamental contributing factors

36
to GDP in the South African economy, as documented in the National Development
Plan (NDP), and is expected to contribute 60-80% of the GDP by the financial year
2030 (Kamleitner, Korunka & Kirchler, 2012; and Vuba, 2019). Copmpetition amonst
SMEs enhance completion in the industry were enterprises improve both their
production, service offerings and practicing the total quality management to avoid in
product liability leading to economic growth in GDP(Van Aardt, Bezuidenhout, 2014).
The contributions include contributions to employment and equitable distribution of
income (Marais, 2018; and Liedtke, 2019). SMEs stimulate the economy during
business cycles such as boom, peak, recession, depression and recovery (Susman,
2017).
Based on a study by Thulo (2019), SMEs’ contribution to the economy is affected by
little government support for funding, market access, regulations and growth
strategies. It contributes thirty-six percent to the GDP in South African economy (Smit,
2017). SMEs contribute by paying tax that stimulates the economy through equitable
distribution of income (Nkosi, 2019). Entrepreneurs who acquired work experience
from previous employers could stimulate the economy through applying those skills
for SCM (Saito, Sakurazawa & Nakamura 2017; and Marks, 2018). Government
initiatives in business support leads to expansions in market competition, improvement
in product and service offerings and economic opportunities assisting in meeting
demand and need of customers (Pinho & Sampaio de Sá, 2014). SME survival would
make a positive contribution to the South African economy.
2.4.2.2 Contribution towards Employment
Employment could be referred to as an agreement between the employer and
employees where the employees are expected to render their services in a safe work
place covered under Labour Law Act, which includes health and safety, remuneration
packages and other fringe benefits, whilst the employer set the rules and regulation
that are accepted by the law to administrate the employees. The South African
economy suffers low employment rate due to under-skilled population despite
available job vacancies (Vuba, 2019). SMEs contribute towards employment at 15.4%
to the South African economy (Small Enterprise Development Agency, 2019). The
Actual Adoption of EAA could lead to scarce skills recruitment to manage systems
37
configurations in SCM (Ronny, 2017). SMEs plays a significant role in the economic
stimulation through employment (Weber, Geneste & Connell, 2015). In a study by
Ansara (2019), approximately 98% of registered SMMEs contribute less than 28%
towards employment with the government aspirations to increase it to 90% in 2030
(Ansara et al., 2019). Employment in SMEs is motivated by other socio-demographic
factors like age, educational background, and the type of the sector (Blackburn, Hart
& Wainwright, 2013). The livelihood of SMEs are based on financial breakthrough as
an indication toward business growth, which is evident in some entrepreneurs’ lifestyle
expenditures (Weber, Geneste& Connell, 2015; and Kuhn, et al., 2016). In practice, a
positive relationship between the employer and employee is regarded as a point of
mutual interest and impact on efficiency and effectiveness that yields productivity.
2.4.2.3 Contribution to Wealth Formation
Wealth could be regarded as a financial breakthrough for the enterprise as evident in
bank and financial statements and, to some extent, in investments and enterprise
expansion. A growing turnover contributes towards the increased profitability of
enterprises that stimulates wealth for the economy (Blackburn et al., 2013). Weber at
al., (2015) maintain that enterprise growth is determined by the level of growth in sales,
market share, assets accumulation, profitability and number of employees. In some
instances, entrepreneurs find themselves in a sacrifice position wherein they use their
personal savings for the business (Sjögrén, Puumalainen & Syrjä, 2011). The degree
of an enterprise’s success is determined by the level of services offered to both internal
and external stakeholders (Ardley, Moss & Taylor, 2016).
Effective communication methods could advance enterprise growth through
technological advancements (Kuhn et al., 2016). Sun (2011) establishes a creativity,
innovation and entrepreneurship model (CIM) that comprises project, process,
problem, principle, practice, performance and presentations that could assist SMEs to
accumulate wealth. Wealth creation in SMEs is determined by the level of enterprise
knowledge, managerial and leadership styles applied to develop long-term
relationships with employees.
38
2.4.2.4 Poverty Alleviation
Poverty alleviation could be regarded as an act of practising economic principle
through full employment. SMEs play a significant role in providing employment (Ardley,
et al., 2016). Tax compliance from SMEs perspective leads to better distribution of
income within the economy (Ardley et al., 2016). A financial growth in SMEs lead to
poverty alleviation within the economy wherein people are employed and able to cater
for their physiological needs for daily survival (Kuhn et al., 2016). Poverty could be
eradicated through SMEs’ contribution towards employment. On the other hand,
government initiatives through enterprise development could lead to economic boom
that leads to better life for all through employment. EAA adoption will require an IT
personnel with credentials that meet the job specification, which is regarded as part of
employment relief for members of the society.
2.4.2.5 Innovation Conception
Innovation is defined as modification to processes by adopting technological systems
that bring a productive output with ease (Sarri, Bakouros & Petridou, 2010; and Sun,
2011). In a study by Blackburn et al.(2013), it was found that it is critical for SMEs to
develop a for a successful adoption of EAA in SCM: SMEs as prospectors play an
important role as major job suppliers, innovators and sources of growth in free market-
economies with long-term aspirations on modernisation of systems (Weber et al.,
2011). An objective is to develop a favourable innovative environment based on setting
up innovation-hub and centre for SMEs; and involving governments’ enterprise
developments that could produce maximum results for SMEs (Pinho & Sampaio de
Sá, 2014).
As defined in Table 2.1 for industrial classification of SMMEs in South Africa, SMEs
stand a chance for differentiating themselves in terms of innovative orientation for
opportunities and success factor (Weber et al., 2015). Innovation encourages new
approaches toward the adoption of EAA. Entrepreneurial interest stimulates
innovation on EAA adoption that requires strategic orientations in regardless of
Technological Aversion discussed in 2.6.2 (Sjögrén et al., 2011). In some instances,
innovation categories include comparing typologies in EAA that could bring future
39
growth in SCM (Catley & Hamilton, 1998). Innovation conception in SMEs depends on
open platforms that encourage calculated risk-taking linked with monetary value.
2.5.3 EAA Challenges Faced by SMEs
2.5.3.1 Lack of Financial Sustainability for the Actual Adoption of EAA
The ever increasing problem faced by the SMEs is based on slow growth due to lack
of capital for purchasing the required hardware and software for a possible Actual
Adoption of EAA (Little, 2010; Mustafa et al., 2016; Sherman, 2018; Ticlo, 2018; and
Liedtke, 2019). Nevertheless, not every SME has all ISC in their possession to adopt
EAA. The other challenge is in relation to employees’ skills, training and development
that might be lacking to assist them in exploring the benefits of adopting EAA in SCM
(Susman, 2017). SMEs encounter challenges when acquiring finance due to paper
work, security on personal property and proper financial records that might be seen as
difficult work to engage into (Kraemer-Eis, Botsari, Gvetadze, Lang & Torfs, 2018; and
Vuba, 2019).
In this regard, financial matters could be resolved to address the issues surrounding;
enterprise interactions with supplier, processes and enterprise systems. The ability to
process and interpret large volumes of complex SMEs’ information is also a problem
(Vaiman et al., 2012). The applications for loans by SMEs involve a number of complex
processes such as; production-flow, information sharing, financial transfers, credit
worthiness, flexible payment methods, financial risk, leverage and price elasticity of
demand (Saha, 2018; and Sahni, 2019). Financial approval for Actual Adoption of EAA
for SCM documentation on SMEs depend on substantive documentation (Fitzgerald,
Brown, Herbert, King & McAulay, 2017).
Work experience is regarded as an important for accessing financial capital (Holzherr,
2013; and Azoulay et al., 2018). Risk is one of the results following entrepreneurs’
reluctance to invest in financial markets and institutions (Genever, 2017). In some
instances, the major factors that impact South African SMEs from socio-economic
issues; include interest and exchange rates, inflation, unemployment, crime, HIV/Aids,
change in technological advancements and statutory regulations (Ketteni, Mamuneas
& Stengos, 2011; Rehman et al., 2017 Singh, 2018; Chappelow, 2019). Last but not
40
least the Covid-19 pendemic have impacted the population dynamics in global arena
as a major threat to the livelihood for both enterprise’ internal and external
stakeholders through the loss of lives and businesses that impacted the world
business market negatively (Tourish, 2020). In deduction, most SMEs have the
challenge of financial constraints that obstruct them from the Actual Adoption of EAA
for SCM.
2.5.3.2 Lack of Formal Education for the Actual Adoption of EAA
Lack of education could be regarded as illiterate rate SMEs face challenges, such as,
lack of formal education in the use of computer equipment for facilitating SCM activities
such as insourcing, processing and outsourcing (Smit, 2017; and Herman &
Stefanescu, 2017). Furthermore, the security system for using EAA, require basic
education for understanding (Ruiz & Kovács, 2016). By educating employees in
software and hardware systems, standardisation and Web-Interface, enterprise
integration and administration, information resources and cloud computing skills could
stimulate their learning capacity and skills expertise (Mantzana, Themistocleous &
Morabito, 2010; Ferreira et al., 2013; and Bowersox, Closs, Cooper & Bowersox,
2013).
SMEs without formal education need to be associate themselves with environmental
expertise with higher corporate participation in voluntary programs (Said, 2011). As a
matter of fact talent management applications deal with; workforce planning; workforce
acquisition that covers recruitment, selection and induction, performance
management, career development, succession planning, learning management and
compensation management (Little, 2010). Talent development focusses on learning,
career development, leadership development, performance feedback, and
recognition. EAA provides opportunities for challenging work assignments with a
strong learning curve, and a career path to every employee. Flexible talent
management could provide employees with learning abilities through on-line
opportunities that requires less computer skills to learn ISC (Naim & Lenka, 2017).
More knowledge could be acquired through the advancement of educational
programmes and skills development that could intensify better understanding for the
Actual Adoption of EAA for SCM.
41
2.5.3.3 Lack of Technical Skills from Employees for the Actual Adoption of EAA
Lack of technical skills could be regarded as human gap in 4th Industrial Revolution
with little or no skills in using electronic mechanisms to cope with the demand in the
market. The technological aspect for adopting EAA requires technical skills for
incorporating mainframe or otherwise personal computers with relevant application
software system could ease the adoption of EAA (Yeo, Gold & Marquardt, 2015;
Bradic-Martinovic & Dorel, 2016; and Moran, 2016). Financial expertise for SMEs have
all the powers to determine the technical skills for employees that are encrypted in
their abilities that are regarded as a key factor for a successful adoption of EAA for
SCM (Bagorogoza & de Waal, 2010; and Naim & Lenka, 2017).
Human capital development fosters employee’s talent by developing blue collar
employees for building technical talent; managers for building operational talent; and
executives for building tactical talent for SCM (Lawrence, 2017; and Mlangeni, 2017).
SMEs need to network with business mentors to seek advice and to outsource
technical assistance in the Actual Adoption of EAA for SCM (Karim, 2011; and Seth,
2017a). In a study by Little (2010), it is postulated that there is a need to align learning
and development activities for SMEs to complement strategic business with strategic
needs and values, which includes a shift from measuring internal resources for
measuring outputs, the diversification of learning delivery options that comprises
greater use of e-learning, electronic performance support systems, streamlining
management processes and systems which is aimed at improving service levels,
efficiency and responsiveness in SCM. For SMEs to become competitive, they need
to employ labour with competitive skills matching the job description and qualification
criteria (Coulson‐Thomas, 2012).
SMEs faces complex processes that brings more challenges in dealing with technical
skills in the Actual Adoption of EAA for SCM (Zailani et al., 2015; and Sebetci, 2019).
Technical abilities assist SMEs in sharing experience (Smith & Barrett, 2016). EAA is
a fundamental part of the enterprise that requires technical expert skills (Dias, 2016;
Vatsa, 2010; and Arisar, 2016). In some instances, lack of grow and advancements in
technological innovation could be caused by lack of education and computer skills. In
the next content, the internal factors affecting the adoption of EAA are discussed.
42
2.6 Emperical Literature 2.6.1 Internal Factors affecting the adoption of EAA for SCM In this section, internal factors are discussed and how they influence the Actual
Adoption of EAA for SCM in SMEs (Flower, 2018b; and Crain, 2018). Internal factors
are aspects from within the organisation that affect the organisation, which include
employees, organisational culture, processes and finances (Voges & Pulakanam,
2011; and Jessee, 2019). In this research, internal factors are; Owners’
Characteristics, Enterprise Resources, Information System Components and
Employees’ Competencies. The internal environment significantly influence ERP that
is linked to SCM (Asmundson, 2017; and Igriany, 2018). To lead in turbulent times
managers respond to internal complexity (Roland et al., 2015).
Profitability, productivity and efficiency are dependent on good management of the
internal processes of the business (Kaya & Azaltun, 2012; and Sherman, 2018). The
benefits of information sharing and integration are attained due to incompatible
systems, platforms and high maintenance costs coupled with a lack of understanding
of the true purpose, value and power of integrated Information System Components
(Ardley et al., 2016). The implication of this is that internal factors might make the
Actual Adoption of EAA.
2.6.1.1 Owners’ Characteristics Owners’ Characteristics include sub-variables such as passion for SMEs success,
creative thinking and creative mind-set in risk taking, discipline, innovation, vision
orientation and owner’s resilience. The characteristics are discussed below.
2.6.1.1.1 Passion for Enterprise Success
Passion is regarded an internal desire that act a driving force for entrepreneurs to
excel in day-to-day enterprise operations. As a result, motivation for enterprise
success is a necessary measure for innovation and transformation (Metcalf, 2015).
Entrepreneurs with passion survive tough times and circumstances from internal and
external environmental challenges and forces with low economic benefits, if they are
passion (Stok, 2018). The desire to promote innovation is manifested through the
exploration and risk taking that promote learning skills through collaborative activities

43
(Zaugg & Warr, 2018). An entrepreneur’s passion demonstrates the success or failure
for the enterprise if correct knowledge and energy they are not directed towards, more
especially in this era of the 4th Industrial Revolution with the adoption of EAA in SCM.
2.6.1.1.2 Creative Thinking and Mind-Set in Risk Taking
Promoting creativity and innovation is encouraged by collaboration and allowing
mistakes (Thompson, 2018b; and Zaugg & Warr, 2018). It is associated with perceived
gains and losses if no action is carried out (Gao & Hafsi, 2015). Traditional success
criteria like product efficiency, in the 1960s and 1970s and quality management in the
1980s and 1990s have been replaced by creativity, innovation and knowledge based
economic factors (Sarri, Bakouros & Petridou, 2010; and DesMarais, 2014).
Entrepreneurs possess risk-taking mentality, balanced with the instinct of not taking
risk that could destroy reputation (Trinh-Phuong et al., 2012; Jenkin, 2016; and Liu,
2015).
Risk taking identifies three core-competencies, namely, self-confidence, resistance to
change and determination for achievement (Sun, 2011; and Broughton, 2018). SMEs
owners are often mentioned as a high-risk group. Risk taking leads to better return-
on-investment (Svärd, 2013; and Ahmad & Mehmood, 2015). Creative thinking
stimulates IT approaches with eased possibilities for the adoption of EAA.
2.6.1.1.3 Discipline for Action Orientation
Discipline for action orientation opposes the anti-reaction against long-term solutions
adopted for improved business interest (Sarri et al., 2010). Entrepreneurs’ focus
eliminates the level of deviation from their actual calling that is treated as a success
factor, which is defined by the level of stubbornness on their action orientation with
stubbornness (Seth, 2017b; and Gao & Hafsi, 2015). Mediation and negotiations with
both internal and external stakeholders, projects an entrepreneur as reliable (Ghosh,
2018b). Thought-oriented strategies based on ignoring irrational beliefs and
assumptions, mental imagery of successful future performance and positive self-talk
have merits for the entire SME (Ghosh, 2015a; Kharytonov, 2012; and Ardley et al.,
2016). Big challenges require a rational mind-set with positive ambitions that leads to
a remarkable success (Post, 2017; Ghosh, 2018b; and Hendricks, 2018). These
44
studies outlined that entrepreneurs should play a major role in action orientation in
functional areas that include sales and marketing; manufacturing and production;
finance and accounting; and Human Resources Management (HRM).
2.6.1.1.4 Innovation Abilities
Innovations could be regarded as process of applying new versions in IT that enhance
SMEs performance based on creative thinking and capabilities with entrepreneurial
motivation of business owners and employees (Sun, 2011; DesMarais, 2014; and
Broughton, 2018). Integrating knowledge on production with creativity, leads to
understand the implications of creative activities in the production process (Giovannoni
& Maraghini, 2013; and Hon & Lui, 2016). Self-leadership supported by a positive
creativity climate can make synergistic use of creativity and innovation for generating
sustainable competitive advantage (Ghosh, 2015a; and Jenkin, 2016).
Family embracement play a significant role in facing both enterprise and IT challenges
(Genever, 2017; and Butterfield, 2017). Entrepreneurs’ intense focus on faith in their
idea may be misconstrued as stubbornness, but it is this willingness to work hard and
defy the odds that make them successful (Seth, 2017b; and Tumenta, 2016). These
studies outlined the need for encouragement and emotional support towards the
entrepreneur in their innovation efforts.
2.6.1.1.5 Vision Orientation
Vision orientation is the ability to put in practice dream through enterprise project
planning. Entrepreneurs are determined hard-working and forward looking in pursuit
of their goals (DesMarais, 2014; Liu, 2015; and Broughton, 2018). Much of the current
literature on vision orientated entrepreneurs pays particular attention to greater
productivity (Johnson, 2017; Stok, 2018; and Broughton, 2018). Visionary techniques
in entrepreneurial orientation can be used to facilitate and enhance aspects such as
idea generation, team building, idea evaluation, data collection and implementation,
decision making and analyses (Sarri et al., 2010). Undesirable negative relationships
amongst trading partners and lack of cohesion among group members can shrink the
vision of the SMEs, and poor decision-making and involvement can reduce attitudes
of resistance to change (Hon & Lui, 2016). Entrepreneurs formulate overall vision,
45
mission, strategic planning, strategic organising and staffing, strategic control and
crisis management for efficient SCM (Zandbergen, 2018b). A well-structured and
formulated long-term perspectives that are well aligned with required resources may
lead to the accomplishment of future goals (Khalifa, 2016; and Hillstrom, 2018). Direct
focus on enterprise routine activities in line with IT could help in the adoption of EAA
for SCM.
2.6.1.1.6 Owner’s Resilience
Owner’s resilience is regarded as internal driving force that is evident in their self-
assurance, elasticity and flexibility for coping with both internal and external forces
challenging their routine-business activities. Owner’s resilience is linked to behavioural
rather than an attitude or a trait that ensures adaptation to adversity (Eckler & Bolls,
2011; and Roland et al., 2015). Measuring individual differences regarding resilience
to work interruptions for relating with other key constructs of employee effectiveness
(Kuntz et al., 2017; and Mills, Shahani-Denning & Sweetapple, 2017).
Excellence and integrity are linked with factors for rewarding employees for
outstanding efficiency and effectiveness (Quible, 2013). The effects of owner’s-
manager values on a small firm’s survival is dependent upon growth orientation
(Sjögrén et al., 2011). An entrepreneur who operates a SMEs from the grass-roots
with little capital, practices relative merits of different routes to high performance
standards irrespective of the intensity of challenges by adapting to circumstances for
greater rewards (Coulson‐Thomas, 2012). The owner’s resilience speaks resemble
their level of dedication by taking drastic measures in the adoption of EAA.
2.6.2 Enterprise Resources (ERs) SCM does not operate in isolation from other functional departments, such as,
operations, purchasing, sales and distribution. ERs include Financial Resources
(human resources), mainframe or personal computers, Application Software System
Hardware systems and expert personnel (Karim, 2011; Toor, 2016; McPeak, 2018;
and Chen, Hailey, Wang, & Yu, 2018). Identifying and integrating common resources
across the SMEs leads to reasonable competitive advantages within and across
business units (Fotheringham & Saunders, 2014; and Toor, 2016).

46
Integration of ERs such as; finance, physical, human and network connectivity is
success factor, as other sources could be used through the SMEs and other trading
partners (Mills et al., 2013; Jenner, 2016; and Maverick, 2018). Gross-functional
activities leads to sustainable economic success for SMEs, depending on
marginalisation of economic and financial costs (Mills et al., 2013; Fotheringham &
Saunders, 2014; and Jenner, 2016). The failure to acquire sufficient capital via savings
or financial institutions borrowing would lead to difficulties in purchasing ERs.
2.6.2.1 Financial Resources
IT systems includes three basic elements; business processes; applications; and
infrastructure (Trinh-Phuong et al., 2012; Ingram; 2018; Segal; 2018; and Hamlett;
2018). Therefore, the Financial Resources includes the following sources of financing;
Business partners for a legal partnership that is formed via partnership agreement
and contract (Lorette, 2018);
Start-up investors for contributing Financial Resources towards SMEs in the form
of shareholding (Kehring, 2018);
Entrepreneur’s personal savings or credit that encourage entrepreneurs to
automate their bill payments to avoid interest charges via credit card (Newlands,
2018);
Crowd funding being available from guaranteed profits in retained earnings,
proceeds from shares, accounting and economic profits that are accumulated from
different investment options (Althuser, 2018);
Business grants that are available during the start-up includes; equity finance, tax
reliefs, soft loans, growth charter scheme, growth accelerator and connection
vouchers; and
Commercial lending include long term liabilities such as; long-term fixed interest,
commercial mortgage, interest-only payment loan, refinance loan, hard money loan,
bridge loan and blanket loan (Becker, 2016).
Financial institutions requires security as a leverage for any cent borrowed, of which it
includes the controls measures that covers payback-period, insurance, flotation costs
such as; underwritten costs and administrative costs.
47
2.6.2.2 Competent Human Resources
In this study, Competent Human Resources is defined as the ability to cope with the
challenging enterprise activities that require educational and technical aspects.
Competency in SCM starts with by developing employees competencies (Vetráková,
Smerek & Seková, 2017). The adoption of EAA could ease the control on database
for employees by tracking performance, measuring job openings and streamline
compensation (Hazen et al., 2014; Ross, 2018; and Wayner, 2018). CHR is based on
the basis of modern methods of measuring human development, such as performance
standards, based on performance appraisal (Abbott, Kung, Cegielski & Jones-Farmer,
2013). Human resource function focuses on the way in which SCM or division is
evolving towards lean-manufacturing and performance work systems examining the
impacts on employee interests and considering alternatives to the lean model (Jiang
& Liu, 2015; and Israelstam, 2015).
Skilled and proficient employees are every employer’s aspiration, as they minimise
costs on training and development for the adoption of EAA. SMEs formulate proper
performance standards based on performance goals through documentation of all
employees’ personal record and by promoting a healthy contractual relationship that
is based on trust and cooperation (Dyer et al., 2015). By considering the personal traits
and realities of employee complaints, suggestions from personnel and realising talent
among existing employees both promote and develop confidence and trust (Leonard,
2018). Also by taking into account the enterprise cultures and work environment the
adoption of EAA is a global trend for business success (Viets, 2014). A competent
employees would simplify the SMEs’ costs in terms of training and development in line
with the adoption of EAA.
2.6.2.3 Mainframe and Personal Computers
SMEs choose the computer equipment based on its internal and external needs, to
avoid over or under capitalisation for personal or mainframe computers (Ayer, 2010;
and Michael & Mike, 2014). SMEs are using IT to perform electronic transactions in
SCM activities such as the exchange of money over the Internet (Reynolds, 2018).
SMEs use the traditional mainframes based on their stability, manageability and
performance (Michael & Mike, 2014). The first personal computers were introduced in
48
1975 (Knight, 2014) and were regarded as a calculating machine (Thakur, 2018).
Personal computers are classified as follows:
Desktop computers, designed to be used at a desk and they can seldom be
moved;
Notebooks are portable computers designed to fold up like a notebook for
carrying and storage of data, information and different documents (Smallwood,
2014);
Internet notebooks known as netbooks are smaller to desktops and notebooks
designed for accessing the Internet (Park & Yun, 2017);
Tablets are portable computers that consists of a touch-sensitive screen (Klein,
2014); and
Smart phone are mobile phones that can run applications and has Internet
capability (Wempen, 2018).
Mainframe computers were produced in the early 1940s, and they are regarded as
bulky machines that required cooling-sensitive rooms (Kayo, 2018; and Jacobson,
2018). Most of SMEs used lap-tops and computer systems to manage, share and
process data into a meaningful information, as such the adoption of EAA that could
ease SMEs activities in SCM.
2.6.2.4 Application Software Systems (ASS)
ASS are regarded as intangible computer components that are designed to be
incorporated in computer hardware to perform certain tasks. ASS are used computer
or system hardware discussed in 2.4.2.3 (Ayer, 2010; and Zandbergen, 2018a). ASS
is accompanied by complementary free-antivirus that secure the operating system
against virus, spam-ware and system hacking (Eckler & Bolls, 2011; and Ellis, 2017).
ASS can be installed in a bulky driver in system windows application (Picks, 2018).
Windows 10-powered computers, use Android emulators for enterprises, Manhattan
Active Supply Chain, Oracle SCM Cloud, SmartTurn Inventory Management,
GAINSystems and Enterprise Supply Planning (Jenic, 2018). Simplifying the work and
enabling a productive work schedule, are the reasons for using ASS (Duffy, 2017).
Optimisation programs provide a lot of tools in one package (Schofield, 2018).
49
BlueStacks is an Android emulators used in Windows for teleconferencing; Play-Store
gaming experience (Rohit, 2017). Once the SMEs is in possession of mainframe and
personal computers, the adoption of EAA for SCM become an easy project to
implement.
2.6.2.5 Hardware Systems (HSs)
HSs are the physical aspect of computers, telecommunications and other devices
used to perform electronic activities on a Random Access Memory (Zandbergen,
2018a; and Rouse, 2018a). Hardware system refers to computers,
telecommunications and external storage tools linked with software systems to
produce desired results (Ellis, 2017; and Picks, 2018). The central processing unit is
the most important part of all computer hardware that store, process and release data
and information (Jacobson, 2018). The other computer hardware is the internal
component such as a hard disk drive, motherboard video card, monitor, keyboard, and
mouse that are incorporate to function as a one unit (Hyde, 2018). Tasks related to
SCM include insourcing, process and outsourcing of data (Poba-Nzaou, Raymond &
Fabi, 2014; and Ticlo, 2018). The Global Positioning System (GPS) Emulation could
be installed in all hardware for location monitoring in the Supply Chain (Rohit, 2017).
Hardware systems could help SMEs to adopt EAA to perform SCM duties such as on;
facilities, inventory, transparency, information, sourcing and pricing.
2.6.2.6 Expert Personnel
Expert personnel are regarded as IT specialists with technical expertise in the use of
EAA, particularly for the implementation, monitoring or maintenance of IT systems,
while the IT specialists focus on a specific computer network, database, or systems
administration function (Kocoglu & Kirmaci, 2012; Beal, 2018; and Heakal, 2018). The
role of expert personnel is to provide technical solutions for both internal and external
users (Coté, 2016). The EAA expert is needed for aligning all technological strategies
and execution plans with the SMEs visions and objectives to minimise total average
cost and maximise the output level through talent management (Pradhan, 2013; and
Ewerlin & Süß, 2016). In some instances, the global financial crisis has flagged the
relevance of traditional approaches to talent management as evidence suggesting that
it is the responsibility of top management to employ staff with full competencies
50
(Vaiman, Scullion & Collings, 2012). Just at the pre-phase for the adoption of EAA,
SMEs should be able to develop cost-effective measures that will Impact of internet-
based communication channels on SCM (Guimarães, 2012; Cote, 2016; Park & Yun,
2016; and Goldenberg & Dyson, 2018). For SMEs to have a proficient EAA, they have
to employ or outsource expert personnel who will be responsible for technical
assistance to the SMEs can any unforeseen circumstances that could trouble the
Actual Adoption of EAA.
2.6.3 Information System Components (ISCs) ISCs are an integrated set of components for gathering data, storing data and
transforming data in the form of usable format known as information that could be used
for taking rational-decision making (Zwass, 2018). ISCs include items such as the
Transaction Support System, MIS, DSS, ESS, data warehousing and data mining and
KMS (Sharma, 2018a). In the 1990s, firms adopted networking standards and
software tools that could integrate disparate networks and applications throughout the
firm into an enterprise-wide infrastructure (Kelly, 2014; and Mkansi & Acheampong,
2012).
Database management is a prerequisite for Actual Adoption of EAA (Ardley et al,
2016). Ownership of ISCs is crucial for enhancing SMEs’ privacy and information
confidentiality (Accenture, 2012; and Tamrin et al., 2017). SMEs could develop a
framework that involves testing different components and interactions and ultimately
owning EAA for SCM (Sjögrén et al., 2011; and Weber, Geneste & Connell, 2015).
SMEs attempt to design or develop EAA that accommodates flexible enterprise
interchange (King, Huggins, Prasanna & Yang, 2017). SMEs need to structure their
ISC in such a way that none of the internal or external users will be affected and thus
leading to SCM destructions.
2.6.3.1 Transaction Support System (TSS)
TPS is a system used to capture and process detailed information necessary to update
data on the fundamental operations of an organisation (Zandbergen, 2018a). The TSS
monitors the business operations and involves the operational and financial
management cycles (Chen et al., 2018). For example, the accountant and auditors
51
needs to know what and how these transactions are recorded and processed to
produce meaningful information. All of these events are referred to as transactions,
and they requires a transaction processing system. Keeping track of such as
collection, processing, storing, reporting, source documents, journals and registers,
ledger and files; and outline and printing is part of the TSS. The SMEs fundamental
operations are linked with transaction processing systems that capture and process
the detailed information necessary to update data and produce detailed information
(Zandbergen, 2018b). SMEs should have a system that manages both internal and
external transactions for effective adoption of EAA in SCM.
2.6.3.2 Management Information System (MIS)
MIS is a set of systems and procedures that collect and transmit data from a range of
sources that compile information and present it in a readable format (Ingram, 2018;
and Segal, 2018). MIS offerings have existed since the 1960s, when large mainframe
computer systems began automating processes at major corporations (Hamlett,
2018). Service reaction time measures how quickly Information System Components
react to errors occurring in the communication lines, main frames, and software
program (Lee & Rhim, 2014). The history of modern Management Information System
Components parallels the evolution of computer hardware and software (Boykin,
2017).
MIS could be regarded as a master program in information management that includes
both technology management and experts for its organisation and development
(Portugal, 2016). MIS has three main advantages for SCM; supporting tactical
planning and subsequently enhancing the decision-making process; for supporting
strategic planning and enhancing the decision-making process (Karim, 2011).The use
of MIS data leads to improved utilisation of internal and external information (Porteous,
2014; and Segal, 2018). Proper management of information will enhance the adoption
of EAA for SCM within and outside the SMEs.
2.6.3.3 Information System Components Governance (ISCG)
ISCG is defined as the specification of decision rights and an accountability framework
to ensure appropriate behaviour in the valuation, creation, storage, use, archiving and
52
deletion of information. It includes the processes, roles and policies, standards and
metrics that ensure the effective and efficient use of information in enabling an
organisation to achieve its goals (Smallwood, 2014; and Schulz & Dankert, 2016). IT
governance relates to decision-making authority, enterprise capabilities, structures,
processes, and relational mechanisms that result in an alignment between business
and IT (Mohamed, Kaur & Singh, 2012). SMEs that operate without correct measures
in internet security governance could be exposed to theft of information, hacking and
unauthorised users based on the complexity theory on information ISG (Grant, 2011;
and Mishra, 2015).
An appropriate ISG could assist the SMEs in securing its classified information and
confidential documents without any computer security bridge by using biometric
technology and cloud computing. ISG is used to strengthen the strategic aspects of IT
risk and compliance and to have proper information governance (Hagmann, 2013;
Smallwood, 2014; and Segal, 2018). ISG is regarded as the specification of decision
rights and an accountability framework to ensure appropriate behaviour in the
valuation, creation, storage, use, archiving and deletion of information.
It includes the processes, roles and policies, standards and metrics that ensure the
effective and efficient use of information in enabling an organisation to achieve its
goals (Smallwood, 2014). One feature of SMEs is that they are less likely to have
formalised governance and management arrangements than larger firms (Gao &
Hafsi, 2015; and Prasanna et al., 2017). The complexity of data storage, sharing,
analysis and application integration reflect several challenges for any governance
platform in SMEs (Little, 2010; and Truong & Dustdar, 2012). ISG would provide
guidance and assurance to SMEs in terms on information security and enterprise
modelling for SCM.
2.6.3.4 Decision Support System (DSS)
A DSS is a computer program application that analyses enterprise data into accurate
information represented to managers for rational decision-making (Rouse, 2018b;
Power, 2008a; and Sharma, 2018b). DSS is a system designed for making rational
decision making at the managerial level for managers and deputy managers. The
53
user-friendly software such as DSS, help managers to make sound decisions (Beal,
2018b). EAA use different components such as spatial analyses and map-based
output compared with the existing types of Information System Components (Sun,
2011; and Sewdass, 2012). DSS challenges include high cost of mechanisation,
equipment and machinery break down, poor working conditions, ineffective
procedures and forms, disorganised file systems with resultant poor control (Karim,
2011; and Ferreira et al., 2013).
Information System Components might face challenges in conceptualising the
essential components when addressing needs of different departmental or cross-
functional activities (Prasanna et al., 2017). ISC incorporate retrieval components that
seek to identify related instructions or operational functions that match user
specifications (Gretzel et al., 2012). A DSS has the capability of outlining or projecting
information graphically with the inclusion of an expert system. DSS are given to
dedicated employees based on their competencies (Rouse, 2018b). DSS are also part
of MIS for the provision of detailed reports for the activities as it also functions well as
Management-By-Objective (MBO) tools (Hamlett, 2018).
A well-structured and designed model DSS provide the ability to create, maintain and
manipulate statistical and mathematical models by using capabilities encrypted in
modelling packages (Sharma, 2018b). EAA require additional systems to support
internal arrangements for SCM (Ramlee & Berma, 2013; and Montilva, Barrios &
Besembel, 2014). DSS has the capability to provide managers and deputy managers
with the opportunity to be well-informed at all times with the ability to indulge in
informed decisions for their enterprises insight aimed at simplifying the work for both
executive and tactical strategic levels and ultimately the functional level through the
adoption of EAA.
2.6.3.5 Executive Support System (ESS)
ESS refers to a specialised information system used to support senior-level for
decision making. An ESS is not only channelled for the top management but for
general managers for making strategic decisions to improve the long-term
performance of the enterprise (Power, 2008b; and McLaughlin, 2016). Much of the
54
current literature on ESS pays particular attention on management levels, such as,
strategic, tactical and operational levels, and examines how to identify individual
performance on a specific task or subtask (Shemi, 2012; Kim, Chan & Gupta, 2016;
McLaughlin, 2016; and Zandbergen, 2018b). ESS is used for formulating, structuring
and facilitating all executive duties (Watson & Rainer Jr, 1991; and Nimsaj, 2016).
ESS could play an important role in SMEs where there is a formal organisational
structure that will be channelled with relevant application system for well-defined
duties.
2.6.3.6 Knowledge Management Systems (KMS)
KMS refers to applications designed to capture all the information within your
organisation and make it easily available to your employees, anywhere and anytime
(Smith, 2013; Asif, Braytee & Hussain, 2017; and Birkett, 2018). In other words, a KMS
is a knowledge repository software system. Most KMS provide an "information hub"
where content can be created, organised and redistributed through search tools and
other features that let users find answers quickly (Smith, 2013). KMS supports the
decision needs of senior executives (Zandbergen, 2018b). Some of the tangible
benefits of using KMS include improved distribution of knowledge; greater information
accuracy and consistency; increased employee satisfaction; less-time spent looking
for answers; getting new employees faster on-board; and retention of knowledge when
employees leave (Smith, 2013).
KMS use different software modules served by a central user interface, with staff
training and orientation through the provision or sharing of electronic documents
(Birkett, 2018). KMS is use techniques, technologies and tools for SCM support
(Andrade, Ares, García, Rodríguez, Silva & Suárez, 2003). The evidence presented
in this section suggests that KMS could be used by SMEs to capture all customer and
supplier information through an "information hub" where content can be created,
organised and redistributed through search tools and other features that provide users
with agile answers.
55
2.6.3.7 Internet and Network Connectivity
Internet and network connectivity is the collective use of network sources such as
routers, optic-fibre, routers, switches and gateways linked together with computers,
printers, machinery and equipment to produce digital information (Habraken, 2001).
In the early 1990s, industrialised firm adopted networking standards and software tools
that could integrate disparate networks and applications throughout the firm into an
enterprise-wide infrastructure (Mitchell, 2019). The SMEs infrastructure also requires
software to link disparate applications and enable data to flow freely among different
parts of the business.
Information System Components manufacturing techniques allow the development of
advanced Supply Chains (Michael & Mike, 2014; Ellis, 2017; and Tamrin et al., 2017).
The advice pertaining to the internet and making the entire SMEs more productive
could depend on the nature of internet (Kim, Chan & Gupta, 2016; and Duffy, 2017).
Appropriate internet connectivity would ease the information dissemination on both
internal and external users on daily basis being accessed anytime and anywhere
across the globe for SCM activities.
2.6.4 Employees’ Competencies (ECs) ECs are regarded as a success and mandatory factors that requires a specific
educational background and experience from diverse circumstances (Knox & Haupt,
2015; and Jabbour et al., 2015). Assessing ECs includes using a variety of
psychometric instruments, such as, self-assessments and 360-degree assessments
of the routine role and work situation of employees (Metcalf, 2015; and Rees &Porter,
2015). Formal education and training can enhance ECs (Esposito et al., 2015; Robbins
& DeCenzo, 2014; and Kubberød & Pettersen, 2018). The value provided to the ECs
is evident in SMEs’ performance and user satisfaction (Jiang & Liu, 2015; Filson, 2018;
and Camadan et al., 2018). Thorough training for ECs close the gap for illiterate and
knowledge deficit as a tool for leading to staff competencies (Esposito, Freda & Bosco,
2015; and Kihn, 2018). The development and management activities leads to
professional and productive activities that are embodied in intellectual gratification
(Filson, 2018). A large growing body of literature has investigated that internet
connectivity that includes three networks, namely:

56
Local Area Network (LAN), which is regarded as a digital network that transmits
digital signals from a sever machine via modem or router, to a computer system
into analogue form that travels up to 500 meters through an office or floor of a
building, transmitted over analogue telephone lines (Shelly & Vermaat, 2011;
and Laudon & Laudon, 2018);
Metropolitan Area Network (MAN) it is regarded as a network that is larger than
LAN and smaller than WAN, located within a central geographic location or a
city (Beal, 2018b; Fairhurst, 2001, Kuhn et al., 2016; and Rouse, 2018c); and
Wide Area Network (WAN) is regarded as a digital network that transmits digital
signals from a sever machine via modem or router, to a computer system in the
analogue form, which travels around the global community without any limits
through an office or floor of a building, transmitted over analogue telephone
lines (Laudon & Laudon, 2018; and Mitchell, 2019).
There is no doubt that ECs exempt the SMEs from additional financial stress on cost
for employees’ training and development. The following competencies are required for
a flexible adoption of EAA for SCM (Atlassian, 2018; and Bridges, 2018):
Employee communication skills;
Constructing tables and columns;
Standardisation and web-interface;
Using email and internet interfaces;
Creating and formulating word documents;
Creating and formulating Microsoft documents;
Project the ability to troubleshoot the internet disconnections; and
Creation of business networking for suppliers and customers.
Standardisation and web-interface are approved, accepted and customary
specifications that have gone through a process of voluntary consensus within Supply
Chain activities that evolve from a customised specification and consensus (Burson,
2015). Internal integration are cross-functional unification, standardisation,
simplification, compliance, and structural adaptation (Bowersox et al., 2013). Recent
trends in quality management include compliance with or conformance to standards
for meeting minimum requirements in SCM activities. Supplier integration focuses on
57
capabilities that create operational linkages with material and service-providing Supply
Chain partners. Although customers are the dominant focal point or Supply Chain
driven, overall success could also depend on strategic alignment, operational fusion,
financial linkage and supplier management. Competency in supplier integration results
from performing the capabilities effortlessly in internal work processes (Karim, 2011;
and Weber et al., 2015). A wide-ranging framework for effective implementation of
standardisation is completed through the use of the correct operational strategy
(Shalder, 2015; Ticlo, 2018; and Ticlo, 2018). If the business environment is
heterogeneous, then application architecture has a great way to either design for or
trend towards standardisation (Nickolaisen, 2018). The evidence outlined in this
section suggests that standardisation and web-interface could be of a positive
investment depending on proper equipment and computer software that are
purchased to structure the SMEs on-line transactions.
2.6.4.1 Enterprise Integration and Administration (EIA)
EIA is defined as the incorporation for the entire enterprise activities and the system
administration that produce solid outcomes for SCM. Enterprise integration and
administration is an extension of Computer Integrated Manufacturing (CIM) that
integrates financial or executive decision-support systems with manufacturing,
tracking and inventory systems, product-data management, and other Information
System Components (Gulati & Baldwin, 2018). The Supply Chain Integration systems
(SCIs) embraces major systems and interfaces such as Enterprise Resource Planning
(ERP), communication systems, execution systems, and planning systems. s systems
becomes more integrated within an organisation and provides more and more
information, the likelihood of discovering any inefficiencies within that system also
increases (Bowersox, 2013; and Beal, 2018b). This provides the confirmation EIA
work as joined component that includes both hardware and software system for a
progressive SCM.
2.6.4.2 Information Resources Managemnt (IRM) Information resources is a series of internal and external business information
resources such as data, database system, financial, economic and operational models
that are reliable and valid to produce desired results in SCM (Little, 2015; and
58
Richards, 2018). Information resources are used for the combination of internal and
external business resources that provide the background necessary to evaluate
current performance and plan future progress. Knowing the types of information
resources that are most critical to business can help companies plan for capturing,
analysing and using that information most effective (Richards, 2018). SMEs with a
progressive SCM require a strong commitment to the supportive capabilities and
resources required for technological advancements (Bowersox et al., 2013). In SCM,
this requires an increased complexity in technological standards to increase the
production efficiency and effectiveness of SMEs, and subsequently reduce their cost
implications and extended waiting periods for transacting any items (Iyamu &
Mphahlele, 2014; Sambartolo, 2015; and Mustafa et al., 2016). EAA could help SMEs
to have IRs and SCM to have its daily operational activities in order.
2.6.4.3 Enterprise Resource Planning (ERP)
ERP systems is developed from the increased need for a system that integrates core
business processes (Robinson, 2015). ERP helps SMEs to increase their total
revenue or decrease total costs (Butterfield, 2017; and Ross, 2018). ERP integrates
the business processes of an entire enterprise into a single software system that
enables information to flow seamlessly throughout the organisation (Beal, 2018c).
ERP is intended to incorporate all aspects of a company’s functional operations (i.e.,
production, planning, material purchasing, inventory control, logistics, accounting,
finance, marketing and HRM) by creating a single database that can be shared by the
entire organisation and its trading partners (Vikas, Khan & Sultanpur, 2010; and Min,
2015).
ERP improves problem-solving capability among employees and is an important
prerequisite for successful ERP development and implementation (Consumer Goods
Council of South Africa, 2019). Enterprise systems integrate the significant business
processes of an entire enterprise into a single software system that enables
information to flow seamlessly throughout the organisation (Beal, 2018c). ERP is
intended to incorporate all aspects of a company’s functional operations incorporating
production planning, material purchasing, inventory control, logistics, accounting,
finance, marketing, and human resource management by creating a single depository

59
of the database that can be shared by the entire organization and its trading partners
(Min, 2015).
Figure 2.1: Enterprise Resource Planning (ERP) Systems Laudon et al., 2007:61
ERP is being implemented in almost entirely within enterprises regardless of its
method and spread of operations (Vikas, Khan & Sultanpur, 2010). SMEs’ ought foster
and reward open communication with frequent interaction, since it would improve
ERP-related problem-solving capability among employees as an important
prerequisite for successful ERP development and implementation (Hwang & Hokey,
2015). The studies presented thus far provide evidence that traditional enterprises
collect data from various key business processes and store the data in a various
incomprehensive data source (manual storage) where they can be used by other parts
of the business without corrective measures on the accessibility of sensitive and
confidential financial data.
2.6.4.4 Spreadsheets utilisation and merging documents During the past 40 years, much more information has become available in software
that took centre stage in 1978 when Dan Bricklin and Bob Frankston produced
VisiCalc, the first electronic spreadsheet (Ayer, 2010). Excel is a great place to clean
up data and hammer it into shape before you use it in another system (Branscombe,
60
2018). The use of conjoint analysis and TAM in information system design to identify
factors which affect user satisfaction and system usage (Lee & Rhim, 2014).
Enterprise Spreadsheet Manager (ESM) keeps records for every transactional change
of when the changes made, and by stipulating the old and new value in effect (Berlind,
2007). When merging documents there will be interchange between systems as they
always export and import data with comma-separated values (CSV) files.
As an alternative for leaving corrupted CSV with an error-prone and end-users they
could import, merge and export data or information at any given time (Branscombe,
2018). The positive light when documents are merged that could simplify the work for
separating related documents from multiple areas, each document will not lose its
page design and arrangements (Kelly, 2018). The relevance of spreadsheets
utilisation and merging documents could assist the enterprises in simplify routine
activities such as; financial recordkeeping, human resources profiling, customer
ratings and tracking for SCM.
2.6.4.5 Communication capabilities
Several studies thus far have linked communication capability to new ways of
decreasing perceived opportunities in a non-threatening manner, or consequences of
different ways of communicating changes in EAA used in SCM (Kamleitner et al.,
2012; Stok, 2018; Rao, 2008). In recent years, communication creates better
relationships that highlights coordination for both the enterprise and business partners
by evaluating ideas. (Chatterjee, 2017; Zaugg & Warr, 2018). Furthermore, innovation
and entrepreneurship education will change their mind-sets and enhance their
entrepreneurial spirit, teamwork, leadership and communication skills (Sun, 2011).
There is unambiguous relationship between communication capabilities and SCM,
thus in modern information and communication technologies can be used to develop
suitable EAA for netter managerial capabilities that support external stakeholders
(Smith & Barrett, 2016). In-house communication across the entire enterprise yield
common and mutual understanding and to some extend been overleaped to external
customers as a result of SCM advocacy based on greater productivity and new
prospect or sales accumulation (Kozicki, 2017). Communication was mend for
61
facilitating SCM systems (Oracle…2018). The studies presented in thus far provide
evidence that better communication abilities from the entrepreneur conducted within
and outside the enterprise will develop a positive image for the enterprise and
automatically grow both revenue and profit.
2.6.4.6 Interpersonal skills What we know about interpersonal skills is largely based upon empirical studies on
the willingness to learn and to develop greater efficiency and effectiveness that leads
to productivity (Chatterjee & Das, 2016). Interpersonal skills are defined as an integral
part of personal traits that help to explain individual behaviour on traits such as locus
of control, Machiavellianism, self-esteem, self-monitoring, and risk-tolerance for
enterprise expansion (Robbins & DeCenzo, 2008). An important aspect for the
successful implementation of EAA is to encourage the communication level among
the professionals from all internal and external functions of the SCM (Ardalan &
Ardalan, 2009). Partners include initiators who conceive the idea but who need a
partner to operationalise it, and joiners, those who join an existing business to provide
special skills (Catley & Hamilton, 1998).
In the workplace the mix of people in relations to gender, race, ethnicity, disability,
sexual orientation, age, and demographic characteristics such as education and socio-
economic status complicates the attitudes of people and make management of
diversity important when adopting new technology (Appelbaum et al., 2015). The skills
development courses enhance employee development and growth been linked with
their level of specialisation (Zaugg & Warr, 2018). The degree to which members are
alike in terms of personal attributes, attitudes, values or demographic characteristics
increases interpersonal attraction and cohesion (Hon & Lui, 2016). Together these
studies provide important insights into entrepreneurs to strive for more knowledge
through advancement of educational credentials and initiating skills development for
themselves and later be extended to their employees that could intensify better
understanding for EAA on SCM.
62
2.6.4.7 Using the internet (Microsoft Windows) A large growing body of literature has investigated that internet connectivity, includes;
local area network (LAN) metropolitan area network (MAN) and wide administrative
network (WAN) and application software systems and any other electronic
mechanisms used to capture, store, process, manipulate and update information
(Beal, 2018b; Fairhurst, 2001, Kuhn et al., 2016; Rouse, 2018b). Three networks are
defined as; (a) LAN which is a group of computers and associated devices that share
a common communications line or wireless link to a server; (b) MAN is a network that
interconnects users with computer resources in a geographic area or region larger
than that covered by even a large local area network but smaller than the area covered
by a wide area network (Rouse, 2018b); (c) A wide area network regarded as a
geographically distributed private telecommunications network that interconnects
multiple local area networks).
In an enterprise, a WAN may consist of connections to a company's headquarters,
branch offices, colocation facilities, cloud services and other facilities (Rouse, 2018b).
Typically, a LAN encompasses computers and peripherals connected to a server
within a distinct geographic area such as an office or a commercial establishment.
Computers and other mobile devices use a LAN connection to share resources such
as a printer or network storage (Rouse, 2018b). A service oriented architecture (SOA)
arises when a firm need to interchange information to its partners in order to exemplify
the use of the proposed SOA for building services and facilities management in
general, the researcher describe an suggestive case study regarding its use, namely
the integration of wireless sensor networks (WSNs) in the overall enterprise
architecture (Malatras et al., 2008).
Any email could be linked with internal LAN-based alerts such as SMS notification
(Berlind, 2007). Software system is regarded as an application is any program, or
group of programs, that is designed for the end user. Applications software (also called
end-user programs) include such things as database programs, word processors, Web
browsers and spreadsheets (Beal, 2018a). Enterprises are able to take full advantage
of their information resources, thereby maximising benefits, capitalising on
opportunities and gaining competitive advantage with policies and governance in
63
place via the internet (Van der Walt & du Toit, 2007). An interactive approach on
benchmarking measure the relative value of competitors’ threats against best internal
operations (Mathaisel, 2004; Janssen & Cresswell, 2005). On contrary, the integrative
approach seeks to reconcile the firm’s divergent interest and with mutual benefit as an
outcome of the specific use of EAA (Bahli & Ji, 2007; Israelstam, 2015). For a complete
and comprehensive application of supply chain in IT sufficient cash has to be directed
into the overall enterprise operational-strategy (Reyes et al., 2015). The evidence
provided about using the internet (Microsoft Windows) maintain that all networks or
internet connectivity could assist the enterprise in enjoying the best possible way for
sharing information to-and-from just with a click of a button.
2.6.4.8 Enterprise integration and administration A comprehensive supply chain information system (SCIs) initiates, monitors, assists
in decision making, and reports on activities requires for completion of supply chain
operations and planning (Bowersox et al., 2013; Gulati & Baldwin, 2018). Enterprise
integration and administration (EIA) – EIA might be regarded as an extension of
computer integrated manufacturing (CIM) that integrates financial or executive
decision-support systems with manufacturing, tracking and inventory systems,
product-data management, and other information systems (Gulati & Baldwin, 2018).
Any enterprise seeking supply chain integration should also demonstrate strong
commitment to the supportive capabilities of segmentation, relevancy,
responsiveness, and flexibility.
Therefore the supply chain integration systems (SCIs) embraces major systems and
interfaces such as; enterprise resource planning (ERP), communication systems,
execution systems, and planning systems. System becomes more integrated within
an organisation and provides more and more information, the likelihood of discovering,
inefficiencies within that system also increases (Bowersox, 2013; Bailry et al., 1998;
Beal, 2018b). The more advanced the computer systems, the greater the possibilities
of reducing routine work carried out by capturing data. Likewise, integrated systems
organise and disclose the enormous amount of information about the workings of the
total system (Boxall et al., 2008). EAA support every activity involved in strategic level
for high performing ratings for the enterprise (Vetráková et al., 2017; Lawrence, 2017).
64
Overall, these studies provide important insight into the development of enterprise
integration and administration that could assist the enterprise in information
dissemination to both internal and external business world.
2.6.4.9 Standardisation and web-interface Recently, researcher have shown an increased interest in standardisation and web
design in EAA based on its essential features of quality management and
standardisation of policies, procedures, systems and processes that facilitates
coordination, which compels organisations to spend a proportion of cash on training
their employees (Ferreira et al., 2013; Burson, 2015; Akella et al., 2009). Recent
trends in quality management include a shift in emphasis with compliance or
conformance to standards for meeting minimum requirements. Capabilities support
internal integration which are cross-functional unification, standardisation,
simplification, compliance, and structural adaptation (Bowersox et al., 2013).
Supplier integration focuses on capabilities that create operational linkages with
material and service-providing supply chain partners. Although customers are the
dominant focal point or supply chain driven, overall success will also depend on
strategic alignment, operational fusion, financial linkage, and supplier management.
Competency in supplier integration results from performing the capabilities effortlessly
in internal work processes (Karim, 2011; Weber et al., 2015). Standardisation and
Web-Interface (SW-I) – SW-I Official” standards are specifications that have gone
through a process of voluntary consensus.
There is potentially a clear path for projects to evolve from a de facto specification to
one that is standardized through voluntary consensus that includes; developer
identifies problem and proposes solution to peers, peer community provides feedback
and proposes potential alternate solutions in public channels like GitHub or Google
Groups, peer community reaches mass consensus and hands specification off to a
standards body and developers implement solution while the standards body
formalizes and legalizes the standard (Burson, 2015). A wide-ranging framework for
effective implementation of standardisation is completed through the use of the correct
operational strategy (Ticlo, 2018; Ticlo, 2018; Lawrence, 2017; Shalder, 2015). The
65
following standardisation strategies could be used; part standardisation (common
parts are used across may products), process standardisation (it involves
standardising as much of the process as possible for different products, and then
customising the product as late as possible, product standardisation (a large variety
of products may be offered, but only a few kept in inventory), and procurement
standardisation (involves standardising processing equipment and approaches, even
when the product itself is not standardised) (Simchi-Levi et al., 2009).
In the service profit chain where the employee and customer interface is central, it
compel the user to understanding the worker dimension is poorly developed (Heskett
et al., 1997). If the business environment is heterogeneous, then application
architecture has a great way to either design for or trend towards standardization
(Nickolaisen, 2018). The evidence presented in this section suggest that
standardisation and web-interface could be a positive investment provided proper
equipment, computer software are purchased to structure the enterprise on-line
transactions.
2.6.4.10 Assets Management
Aassets management is defined as the use of financial instruments aimed at
maximising invested assets for managing wealth in the world economy (Wittrock &
Heiden, 2020). A comprehensive asset management strategy could marginalise
noncompliance against tax invation and avoidence with a formidable information
gathering in a quick and reliable ways as a mandatory command from statutaory
regulators through innovative structures such as the adoption of EAA in SMEs (Ford,
2019). As a matter of fact, fixed assets are acquired by SMEs accumulating profit, of
which the acquirer should determine whether the assets are financially justified
through costs and benefits (Gitman & Zutter, 2015).
Overall, assests management could be linked with software programs that vary in
many ways but quaranttee quality through; a) flexibility, by using software program
that is adaptable to any assets within the enterprise; b) energy and cost efficiency, by
maintenaning management program that is effective, so as to allow assets to operate
at better energy and cost efficiency; c) affordability, by purchasing a software program

66
that is cost effective with ultimate results (Daudi, 2019). The capital asset pricing
model (CAPM) could be used to describes the relationship between the required return
(rs), and the nondiversifiable risk of the firm as measured by the beta coefficient (b)
(Learch & Melicher, 2018). The payback period method could be used by SMEs to
determine the minimum number of years to settle the account against the initial
investment amount (Alsemgeest, du Toit, Ngwenya & Thomas, 2014). By drawing on
the concept of assets management, it is evidence that the success of SMEs depend
on proper assets valuation and other determents for entrepreneurial success.
2.7 External Factors Impacting the Actual Adoption EAA for SCM External factors are factors that affect the enterprise directly from both the competitive
market-environment and macro-environment business perspectives with regard to
threats and opportunities. External factors are discussed to determine their influence
on the intended Actual Adoption of EAA for SCM management in SMEs (Hawks,
2019). The external environment has a significant influence on decisions taken in
SMEs (Beal, 2018). SMEs justify the costs and expected benefits before proceeding
with new investments in technological advancements (Trinh-Phuong et al., 2012; and
Epe, 2015). SMEs use external Transaction Support System from external sources,
such as current prices from competitors, inflation and interest rate (Laudon et al., 2018;
and Asmundson, 2017).
2.7.1 Complex Legal and Regulatory Constraints Through business regulatory systems governments affect businesses via trading
policies, import and export quotas, in some developed economies that have legal and
regulatory requirements in place (Jooste, Strydom, Berndt & Du Plessis, 2016; and
Mzekandaba, 2018a). The quick rise of technological advancements introduced a host
of legal and ethical issues with copyright and intellectual property compliance as a
result new ethical and legal considerations that are constantly arising (Walcerz, 2019).
Legal complexity is used to refer methods to measure and monitor the legal aspect of
an entity governed by legal theorists, statutory regulators such as Competition
Commission of South Africa, Consumer Board of South Africa and many more, so as
to reflect on particular law’s complexity to adhere to trading standard and norms
(Ruhl& Katz, 2015). Regulatory constraints have been suggested. This study uses the
67
definition of the forces that every enterprise should compete for in order to execute its
strategy based on period, assets, liquid assets, resources, quality, regulatory
compliance, interests of stakeholders, organisational culture and rick tolerance
(Spacey, 2019). The business regulations by government includes; regulatory
instruments for markets, social customs, and technology (Leenes, Palmerini, Koops,
Bertolini, Salvini & Lucivero, 2017; and McKinlay, Pithouse, McGonagle & Sanders,
2018). Outsourcing strategies should be at par with regulatory goals and within a
Corporate Social Responsibility framework so as protect the image of the SMEs
(Schulz & Dankert, 2016).
Legal frameworks are developed to achieve a competitive advantage by challenging
prevailing SMEs models and exploiting gaps in legal and regulatory environments
(Rossi, 2014). The illegal copying of software could be minimised through the use of
custom-based product keys and other forms of biometric technology (Frenz, 2017; and
Quintia, 2019). The legal factors regulating SMEs on the adoption of EAA should
eased so that SMEs will have a better competitive advantage and cost-benefits
analysis that could assist the SMEs for economic tool to aid in decision-making for any
legal matter arising.
2.7.2 Lack of External Financing External financing can be in the form of bonds, loans and debt financing or to acquire
funds business angels and venture capitalists as a way of raising capital rather than
retained earnings (Harvey, 2012; and Althuser, 2018). External financing result in a
financial burden of interest rate being charged (Rossi, 2014). This has negative
implications on both the banks and customers as they bear a financial burden with
exorbitant interest payable (Gerber, 2018). Financial service companies are
competing with fluctuating market interest rates that affect the SMEs (Mulesoft, 2009).
From external view the acquisition of funds depend on creditworthiness, financial
statements, feasible business-plans and bank statements (Guimarães, 2012; and
Ritchot, 2013). Companies are increasingly unprepared to effectively integrate
advanced technological infrastructure that require additional capital (Benay, 2016).
Limited expansion on opportunities are as a consequence of slow GDP growth and a
lack of external financing for SMEs (Brooks, 2019). Personal saving could save

68
entrepreneurs from the financial burden of high interest rate from acquisitions of
mortgage bond, long-term loans, equipment lease, micro loan, accounts receivable
factoring and merchant cash advance.
2.7.3 Low Technological Capacity Low technological capability is the inability to absorb technology to transform
operations as a way of maximising production efficiency and gaining competitive
advantage within SMEs (Reichert & Zawislak, 2014; and Spacey, 2015).
Technological capacity is a sustainable enterprise capability by applying new
technologies in order to improve the innovation performance (Khalifa, 2016). SMEs
have different business requirements, diverse technological standards and IT system
for sharing data and information (Suhadak & Mawardi, 2017; and Wayner, 2019).
The absence of technological capacity leads to low network capacity which, in turn,
leads to slow processing systems for transactions for both internal and external
partners in SCM (Buckow & Rey, 2010; and Del Carpio & Miralles, 2018).
Development in technological transfer is critical to remove barriers and close gaps in
achieving increased SCM proficiency (Ann, 2019). Innovation through technological
capacity could accumulates positive results for the SMEs (Del Carpio & Miralles,
2018). New entrants to the business markets bring new capacities leading to an
automatic increase in competition (Endro et al., 2017). SMEs with good intentions will
adhere to technological capacity by investing enough cash on modern technology that
could assist them in the adoption of EAA.
2.7.4 Relative Advantage Relative advantage is regarded as the process whereby customers realises the
benefits of a product or service based on its enhanced features and benefits rather
than those of other substitutional computer software or hardware systems, such as,
the use of advanced laptops rather than old-school devices such as type writers
(Reichert & Zawislak, 2014; Maduku et al., 2015; and Tagged, 2019). Relative
advantage include; Customer Relationship Management Systems (CRMSs),
Knowledge Management Systems, Sales and Marketing Systems, manufacturing and
production systems, finance, accounting and links with HRM (Kehring, 2018; and Ann,
69
2019). Adopting EAA in SCM can lead to elative advantage by integrating different
business strategies (Gerstein, 2012). Relative advantage it is advantageous if SMEs
change the existing business models for the adoption of EAA (Rossi, 2014). DTI
postulates five characteristics of innovation that affect diffusion, namely: relative
advantage (the degree at which new IT provide more advantages to the existing tools);
compatibility (its reliability with collective practices and norms among its users);
complexity (its ease of use with processes); trialability (the opportunity to explore new
technological systems(the actual adoption); and observability (depicts the positive side
before the actual use) (Dillon & Morris, 1996a).
Sharing information across the Supply Chain compels SMEs to improve accuracy and
reduce cost of orders at strategic, tactical and operational levels (Sewdass, 2012; and
Reyes et al., 2015). The relative advantage of using IT technology is that it allows the
reach all types of systems and employees can give their inputs and suggestions
(Endro et al., 2017; and Sweeney, 2011). Relative advantage could lead to competitive
advantage in SMEs with element of superiority in SCM.
2.7.5 Compatibility of Computer Systems Compatibility of computer systems is referred to as the ability of electronic equipment
and systems to function and perform with zero-defect together with electromechanical
devices (Sebetci, Ö. 2019; Tong, K. 2019.). Compatibility of a technology entails the
specific technical skills applied by architects with the responsibility for executing proper
system operational activities with ease in SCM (Maerkedahl & Shi, 2014). With
compatibility of computer systems documents can be easily stored and shared in
different electronic mechanisms (Cedarville University, 2019). The internet is more
compatible in Ethernet and optic fibre for network connectivity with protocols to control
the waves through the transmissions of two or more systems that need a link to LAN,
MAN and WAN (Kshetri, 2019). Compatibility could be perceived as an element of
similarity with existing values, which depended on old systems that are possibly
upgraded through the application software (De Oliveira & Peres, 2015; and Alshamari,
2016). System compatibility could be determined by the level of processor types that
allows different data formats to meet all specifications from one system to the other,
as such, the adoption of EAA would be simplified.
70
2.7.6 Customisability of EAA to the Enterprise and External Users Customisability, in this study, is regarded as a process framing the operational
activities that includes different system operation for different users in respect of
network users; safeguarding data, sorting data for different aspects and automating
networks (Barker, 2018). During the business processes on the adoption of EAA, it is
key for SMEs to consider business strategies, such as, strategic market marketing
planning, competitive strategies, strategies in the product life cycle, global strategies,
relationship building strategies, brand strategies (Jooste et al., 2018).
In some e-mail settings such as Yahoo! and Google, users are allowed to customise
their web layout and background to closely match their preferences SMEs by adopting
to EAA (Krishnaraju & Mathew, 2013; and Brandeisky, 2015). In a customer based
EAA, the primary SMEs should have a clear understanding for customisability as a
failure to understand terms and conditions by the initial producer of ready-made
software could lead to legal issues such as infringement of privacy rights (Walcerz,
2019). Customisability of systems during the adoption of EAA would allow SMEs to
choose software programmes that are economically viable.
2.7.7 Information Security
Information security is defined as the theories and practices that provide authorised
user with the privilege and the right to use computer software for accessing classified
information that requires high measures in accessibility (Delony, 2019). Biometric
authentication is typically used to gain access on log-in to a system/service. This
means that the rightful user is identified and recognised, but with an intruder, his or
her data will be captured automatically and be sent to both the lawful user and the
server administrator (Naser, 2018). Biological tracing such as fingerprint and face
images, as well as biographic identification information that reflects surname; names;
date of birth and place of birth, nationality and so forth, can be used in information
security systems (Morosan, 2011; Efrati et al., 2014; Maurer, 2018; and Marshall,
Adebamowo, Ogundrian, Vekich, Strenski, Zhou, Mayhew, 2019). Biological tracing
was developed to authenticate information about client’s true-identity and the
elimination of hacking (Jaiswal, Bhadauria & Jadon, 2011). Positive relationships with
external financial institutions, such as financial donors and banks will assist in the
71
Actual Adoption of EAA in SCM (Ritchot, 2013; and Kirlidog & Kaynak, 2013).
Biometric systems will provide secured access from when combined with gait cycle
detection known as image detection, finger-print detection, voice-recognition and
password encryption (Efrati et al., 2014; Naser, 2018; and Mayhew, 2019). A
weakness of the authentication systems is that they can be manipulated (Holden,
2010; and De Groot, 2014). Hacking is undertaken for a variety of reasons, such as
the wish to damage a system or to understand how a system works (Quintia, 2019).
It is a requirement for SMEs to adopt smart EAA that take in account the security
architecture to avoid cyber hacking (Ritchot, 2013). The system can be encrypted with
user passwords for security verification by compounding it with biometric features (Asif
et al., 2017; and Brinkmann, 2019). The enterprise system is constructed to safeguard
both internal and external users with regard to their privacy on their personal data
(Filho & Aquino Júnior, 2015; and Ahmad & Mehmood, 2015). SMEs should, at least,
magnify information security is to obstruct and identify hackers on computer system
and internet, and to safeguard the SMEs data and information.
2.8 Perceived Attitude towards the Actual Adoption of EAA In this section, relationships amongst Perceived Attitudes are determined on the
Actual Adoption of EAA for SCM in SMEs are investigated. Attitude is classified as
negative and positive attributes towards the actual adoption of EAA by complying with
technological standards. Digital technology has transformed the livelihood of most
business enterprises, with some setbacks (Anderson & Perrin, 2017). Perceived ease-
of-use and perceived usefulness are key factors in the Actual Adoption of EAA
(Kirlidog & Kaynak, 2013). Four variables, namely, Alternative User-Base Solutions,
low Technological Aversion, vulnerability and resistance to change, are discussed to
the next page.
2.8.1 Alternative User-Base Solutions Sophisticated technological models and Application Software System (ASS) provide
ready-made software for performing tasks such as on money transfer, debtors and
creditors’ control and on-line purchasing (Ismail, 2018). Throughout this study, the
term Alternative User-Base Solutions refers to a process whereby IT could be used as
72
a technique of examining the enterprise solutions through fieldnames on the system
that reveal all tracked documents being available in the computer or internet (Thomas,
2011). The use of an eye-detection scanner could be used as an alternative fora
fingerprint detector and administrative login password to disguise all unauthorised
users (Dascalescu, 2018; and Strom, 2018). In some instances, the greatest
disadvantage in Alternative User-Base Solutions is that the sophistications in
technology could be manipulated by hackers, thieves and intruders putting SMEs in
risk.
2.8.2 Technological Aversion Technological aversion manifest as a result of natural instinct as maximum acceptance
to adopt EAA without determining beta-coefficient which is a relative measure of non-
diversifiable risk (Malan, 2015; and Zhang, Brennan & Lo, 2014). Employees from
South African Social Security Agency have objected the use of biometric technology
due to complications that they encountered in setting-up the software. The upgrades
in new versions will, at least, mitigate the risk of aversion (Horvitz, 2014). Security
authentications will lead to admiration of classical economics that considers capital
and intensive model that disadvantage labour intensive for full employment
(Ghobakhloo et al., 2011; and Nicolson, Huebner & Shipworth, 2018). SMEs could
measure the level of sensitivity by considering the undiversifiable risk that would be
inherent as a financial expenditure for the adoption of EAA.
2.8.3 Vulnerability and stochasticity Securing the underlying data for users makes it possible amendments to change
repository platforms in the future without losing any data (Oldewage, Engelbrecht &
Wesley, 2019). The stochasticity involves biological or physical interactions such as
iris, finger-print, face detection and voice-recognition (Székely &Burrage, 2014).
Stochastic programming include models with random settings with discrete realisation
being capable to create a strong decision-making framework in SCM (Domenica, Mitra
& Birbilis, 2007). Well, in digital computers there is positive strong indication that
stochastic behaviour can be tolerated in the adoption of EAA were systems are in
place to increase SCM performance (Vasilaki & Allwood, 2018). SMEs could deal have
appropriate approaches in SCM content to have a better inert-changing systems with
73
ease and comfort without tempering with the existing data or information (Szigligetius,
2019). For example, SEMs could be considered for data collection in relation with new
competing product as a case study on how parameters of a stochastic individual-
based model can be acknowledged from existing data and how the experimental
model can be used to solve an optimal-control problem in a stochastic background
(Parise, Lygeros & Ruess, 2015). However, a critical valuation on the importance of
EAA in SCM is lacking (Zhou & Ning, 2017). A holistic approach is utilised, integrating
Vulnerability and stochasticity to establish a safe environment for adopting EAA for
SCM in SMEs.
2.8.4 Resistance to Change Resistance to change is defined as a phase at which some employees do not see any
need for a change and the level of conflict is massive with the possibility that the level
of conflict will mobilise negative message to shift balance of power towards the
adoption of EAA (Bolognese, 2018; Juneja, 2019; and Merritt, 2019). Resistance to
change in this study is regarded as advanced digital revolution, such as EAA with
digital transformation's role in security that provides better results (Merritt, 2019). The
world is going through major technological changes. SMEs need to adapt and seek
continuous improvement, not only to compete but to survive (Gonçalves, Pereira & da
Gonçalves, 2012). Warning sign on active-resistance to change include seeing things
in a negative light, such as, finding mistakes and fault, entertaining fear and
manipulating the Actual Adoption of EAA as part of passive-resistance (Bolognese,
2018).
The application and implementation of suitable strategies could help to identify early
manifestation of resistance to change by mitigating all cause effects for the Actual
Adoption of EAA (Juneja, 2019). The core of resistance to change are the believe that
change is unnecessary as it might make things worse, losing trust in employees
leading the change, past low-success factors and the fear that the Actual Adoption of
EAA could drain the capital of the organisation (Nguyen, 2010). SMEs should be in a
good position to align change with organisational goals, determine any impacts,
provide adequate communication strategies and training with the implementation of
support structures and measure the change process linked with the adoption of EAA.
74
2.9 Actual Adoption of EAA The relationship between perceived ease of use and the Actual Adoption of EAA
focused on the following variables.
2.9.1 EAA Improves Job Performance of SCM EAA provides empirical improvements depending on broad SMEs characteristics,
employee perspectives and external business partners that reflects the benefits of
adopting EAA for SCM integration (Abdullah, et al., 2013). Long-term relationships
between employer and employees increases the level of confidence and trust for
shared values and mutual understanding on the adoption of EAA (Dyer et al., 2015;
and Esposito et al., 2015). Absolute technological capability could assist SMEs to
performance work interruptions resiliency reflected directly toward an improved
understanding of employee effectiveness and efficiency that leads to productivity in
SCM (Reichert & Zawislak, 2014; and Zide et al., 2017).
SMEs commitment on improving the perception of obtaining great results on the
adoption of EAA should be a priority (Porteous, 2014). By evaluating the functional
performance and current IT aspects on electronic documentation system could help
SMEs to improve its SCM activities (De Oliveira & Peres, 2015). The identification of
the key drivers of ERP and evaluating its impacts on SCM performances could lead to
a productive SCM (Mathaisel, 2013; and Hwang & Min, 2015). By developing an
internal competitive strategies for adopting EAA could enhance job performance in
SCM (Sewdass, 2012; and Zhang, Brennan & Lo, 2014). A value-added job enactment
in SCM rely on the correct alignment of algorithms that integrates all functional
departments within the SMEs.
2.9.2 EAA Provide Critical Support-Base for SCM The critical support base in EAA include specific administration and analysis skills that
could help in providing essential support on routine basis and crisis times (Asif et al.,
2017). Multiple communication technologies are used to adopt or facilitate EAA actual
adoption so as to have a flexible and adaptable system for the entire enterprise, by
encouraging and motivating employee participation (Kuehnhausen & Frost, 2011; King
et al., 2017; and Poirier, 2018). During the EAA actual adoption, the SMEs can use
75
mobile applications being linked with the computer software from different software
technologies and architecture (Filho & Aquino Júnior, 2015). The system prototypes
will include reverse engineering or integrating the old system with the new one and
forward integration by implementing new process from scratch (Kuehnhausen & Frost,
2011). The major challenge are regarded as obsolescence in hardware and software
that compels the SMEs to lease or hire equipment to keep up with the SCM
complexities in categorization (Svärd, 2013; and Boykin, 2017). The information and
communication technology need robust updates for viable enterprise operational-
system in SCM (Poba-Nzaou et al., 2014). The use of IT has brought a better
communication and information dissemination to both internal and external
stakeholders when there is effective communication and coordination of problems and
decrease management control (Said et al., 2013). A Critical Support-Base depends
on SMEs’ architectural design, design and key business drivers.
2.9.3 EAA Enhances SCM Activities For EAA to enhance SCM activities, there should be integration of activities involved
in the flow of materials and services focused on customer value creation
(Banaeianjahromi & Smolander, 2016; and Gulati et al., 2018). EAA could enhance
SCM based on enterprise manufacturing systems’ tools such as ERP and MRP
(Juneja, 2018). By planning demand forecasting with programmed EAA, flexibility will
be experienced as a key factor to enabling a low-cost structure in SCM (Goldenberg
& Dyson, 2018). SCM activities should be aligned with manufacturing department to
reduce operational complexities through system collaboration (Mutoko & Kapund,
2017).
An efficient SCM approach need to be linked with a proper EAA to analyse the
methodology and approach to manage the whole process (Kumar, 2000). Information
processing will lead to a better way to analyse factors affecting the adoption of EAA
on the possibility to enhance SCM activities and ultimately the business performance
(Endro, Taher, Zainul & Nayati, 2017). EAA could upgrade SCM activities through
designing strategic advantage; and creating a seamless operation by coordinating and
integrating all activities and processes (Sangam, 2010; and Penaluna, Penaluna, Usei
76
& Griffiths, 2015). A systematic arrangement of EAA processes and design could
make SCM activities more simplified for SMEs.
2.9.4 EAA Improves Activities for SCM EAA compels enterprises to have a conceptual work allocations per specialisation so
that activities are eased by using electronic systems to documenting, editing, sending
and retrieving for SCM (Fenech, 2018). Digital filing email messages can make filing
important information easier, safer and less expensive for SCM (Desmet, Maerkedahl
& Shi, 2014; and Root III, 2018). Electronical documentation provide SMEs with the
opportunity to duplicate, send and receive documents within short space of times (De
Oliveira & Peres, 2015). EAA could allow the SMEs to manage activities with a high-
performing standards (Lawrence, 2017). EAA could legitimate the workplace‐based
activities for SMEs through programming in SMEs (Chen, 2014). EAA ease end-user
satisfaction through technology compatibility within the enterprise by assessing core
Information System Components that leads to ease of SCM activities (Sebetci, 2019).
It enhances the strategic and tactical planning, firstly by proposing a competitive
intelligence framework for both internal and external users aligned per departments
for specialisation in SCM (Sewdass, 2012). It focuses on end-user satisfaction on well
specified activities through technological compatibility and allocating all SC activities
within the EAA (Karim, 2011). It makes suggestions on proposing a competitive
intelligence framework for SCM activities for enhancing enterprise productivity to
maximum level (Sebetci, 2019). The ease of SCM in SME activities depends on the
structural development for EAA through digital work processes that will operate at
ease for their routine business activities.
2.9.5 Supply Chain World: Supply Chain Optimisation EAA ease work-flow system in SMEs for SCM should be able to face challenges such
as; distribution network configuration, flexibility for access, number of participants,
geographical allocation, suppliers networks, production facilities, distribution centres,
warehouses, customers relations and distribution strategies (Nair, 2010; and Stet,
2014). Little attention has been paid to the capabilities of EAA systems and the degree
to which ECs actually utilise them for SCM (Holden, 2010). The use of transmission
77
media from different geographic locations compels SMEs to make use of computers,
telephones and wireless devices with the use of networks such as LAM, MAN and
WAN making the adoption of EAA possible (Dias, 2016; Vatsa; 2010; Arisar, 2016;
and Matin & Islam, 2012). The Data Communication Model highlights important
variables such as; sender, protocol communication, transmission media, messages
and the receiver in the Actual Adoption of EAA (Beal, 2018b). A suitable EAA structural
system would lead to productive SCM work optimisation that will lead to SME value
creation through customer retention.
2.9.6 Technological intransigence or inflexibility Information technology is dependent on comprehensive flexibility within the enterprise
and its external stakeholders on the lime-light between lack of compatibility from
different software application systems that could have difficulties in enhancing sending
and receiving of different purchases request forms (Han, Wang & Naim, 2018). To
advanced enterprises information technology flexibility has yielded positive results
aligning sustainability with competitive advantage in all transactional processing
(Ness, 2008; Vogt, 2015). Flexibility technologies could ease the use of manual
recordkeeping with the use of programmed order forms (Goldenberg & Dyson, 2018).
A well-regulated computer system could design a flexible architecture model that is
based on efficiency and effectiveness in all input-requirements in SCM (Bawa,
Buchholz, de Villiers, J. Corless, & Kaliner, 2017). For enterprises to have flexible
working environment, reasonable computer systems should be in-place with flexible
work interchange (Sanders, Zeng, Hellicar & Fagg, 2016). Flexibility could be used to
strengthen the business relationships between different suppliers, distributors,
wholesalers and retails stores (Pereira, Sellitto, & Borchardt, 2018).
2.10 The Conceptual Research Model The conceptual model illustrates the relationships between the independent variables
Actual Adoption of EAA for SCM, the researcher developed the conceptual research
model, illustrated in Figure 1. The following variables are discussed; internal factors,
external factors, perceived attitude towards the Actual Adoption of EAA and Actual
Adoption of EAA for SCM in SMEs. The concepts EAA in SCM has been rapidly
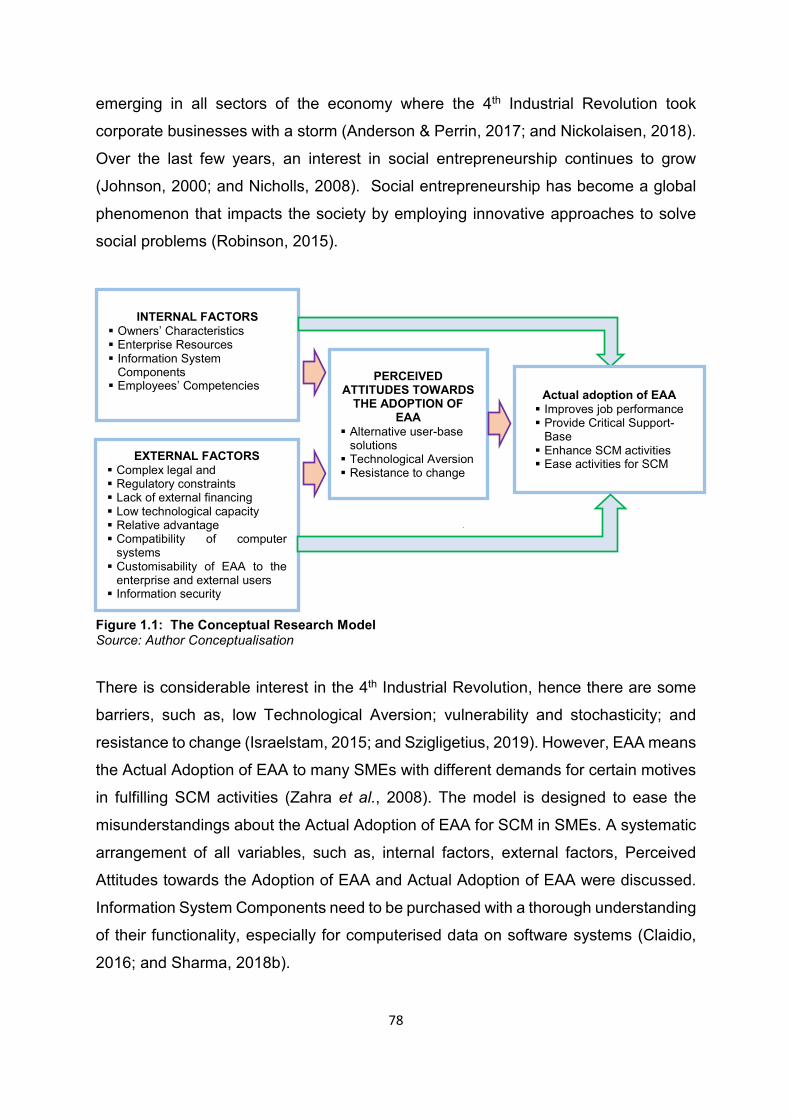
78
INTERNAL FACTORS
Owners’ Characteristics Enterprise Resources Information System
Components Employees’ Competencies
Actual adoption of EAA Improves job performance Provide Critical Support-
Base Enhance SCM activities Ease activities for SCM EXTERNAL FACTORS
Complex legal and Regulatory constraints Lack of external financing Low technological capacity Relative advantage Compatibility of computer
systems Customisability of EAA to the
enterprise and external users Information security
emerging in all sectors of the economy where the 4th Industrial Revolution took
corporate businesses with a storm (Anderson & Perrin, 2017; and Nickolaisen, 2018).
Over the last few years, an interest in social entrepreneurship continues to grow
(Johnson, 2000; and Nicholls, 2008). Social entrepreneurship has become a global
phenomenon that impacts the society by employing innovative approaches to solve
social problems (Robinson, 2015).
Figure 1.1: The Conceptual Research Model Source: Author Conceptualisation There is considerable interest in the 4th Industrial Revolution, hence there are some
barriers, such as, low Technological Aversion; vulnerability and stochasticity; and
resistance to change (Israelstam, 2015; and Szigligetius, 2019). However, EAA means
the Actual Adoption of EAA to many SMEs with different demands for certain motives
in fulfilling SCM activities (Zahra et al., 2008). The model is designed to ease the
misunderstandings about the Actual Adoption of EAA for SCM in SMEs. A systematic
arrangement of all variables, such as, internal factors, external factors, Perceived
Attitudes towards the Adoption of EAA and Actual Adoption of EAA were discussed.
Information System Components need to be purchased with a thorough understanding
of their functionality, especially for computerised data on software systems (Claidio,
2016; and Sharma, 2018b).
PERCEIVED
ATTITUDES TOWARDS THE ADOPTION OF
EAA Alternative user-base
solutions Technological Aversion Resistance to change
79
2.11 Conclusion This chapter presented what other authors have established on what EAA is and how
it could affect SCM within SMEs. The definition of SMEs, contributions of SMES to the
South African economy and challenges encountered by SMEs were discussed. The
theoretical framework covers four theories concepts, namely, TAM, DTI, TRA and
TPB. The definitions, contributions of SMES to the South African economy and
challenges faced by SMEs are also discussed. The relevance of theoretical framework
is supported by the conceptual research model. The following chapter will be focusing
on the research methodology.
80
CHAPTER 3: RESEARCH METHODOLOGY
3.1 Introduction The purpose of this chapter was to outline the Research Design, research area and
population, sampling method, sample size, data collection, data analysis, reliability,
validity and objectivity, as well as the preparation involved in conducting this research.
Research methodology was regarded as a systematic way used to solve a specific
enterprise problem. As a result, it was treated as a science of studying how research
was to be carried out (Myers, 2019). Essentially, the procedures by which researchers
go about their work of describing, explaining and predicting phenomena are called
research methodology (Bryman, 2012; and Dudovskiy, 2016).
This chapter provided a detailed discussion about the methods and procedures that
were used. Research techniques referred to various instruments or tools that were
used to collect and analyse data (Creswell & Creswell, 2017). Three methods of
research methodology, namely; qualitative, quantitative and trianquliation of
methodologies, are commonly used in research, based on the nature of the study
(Durcevic, 2020). For this study, a quantitative method was applied and classified
based on the nature of data collection sources (Creswell & Creswell, 2017).

81
3.2 Research Design Categories on research philosophical approaches ranged from positivism to the
qualitative study of phenomenon (Salkind, 2012; Creswell, 2013; McMillan &
Schumacher, 2014; Gaille, 2018; Ittana, 2018; and Cloud, 2019). A positivist Research
Design was chosen based on a cross-sectional survey that allowed the researcher to
explore the research objectives through the collection that let to ease on analysis of
primary data. Research Design was considered as the masterplan based on a
fundamental method of data collected through questionnaires, interviews, surveys,
archival research, observations, and a single combination of these methods
(Riezebos, 2017). In this study, the researcher utilised a descriptive model to obtain
the primary data (Hennessy & Patterson, 2012; and Anderson, et al., 2013).
The advantage for using the descriptive model is that it is able to describe relationships
between internal and external factors and Perceived Attitudes towards the Adoption
of EAA. The quantitative approach was adopted as the research required the testing
of relationships. Quantitative research was considered as a positivistic approach
where data were used to describe and measure all variables (Anderson, et al., 2013;
and Wegner 2015). The benefit of using quantitative research was based on the
conception that it focused on techniques that required comprehensive and complete
data that were collected. Five categories on research philosophical approaches such
as, positivism paradigm, interpretivism paradigm, epidome of pragmatism, critical
realism and postmodernism, were discussed (Salkind, 2012; Creswell, 2013; McMillan
& Schumacher, 2014; Gaille, 2018; Ittana, 2018; and Cloud, 2019).
A positivist Research Design was chosen based on its natural instincts that granted
experimental and field survey that granted the researcher an opportunity to explore
the research objectives and the collection of primary data. Descriptive research
provided a competitive advantage for designing a distinctive profile per variables,
procedures and situations (Saunders, Lewis & Thornhil, 2012). The descriptive
research was selected as one few variables that included; sample population, range,
minimum, maximum, mean, standard deviation (σ) and variance.
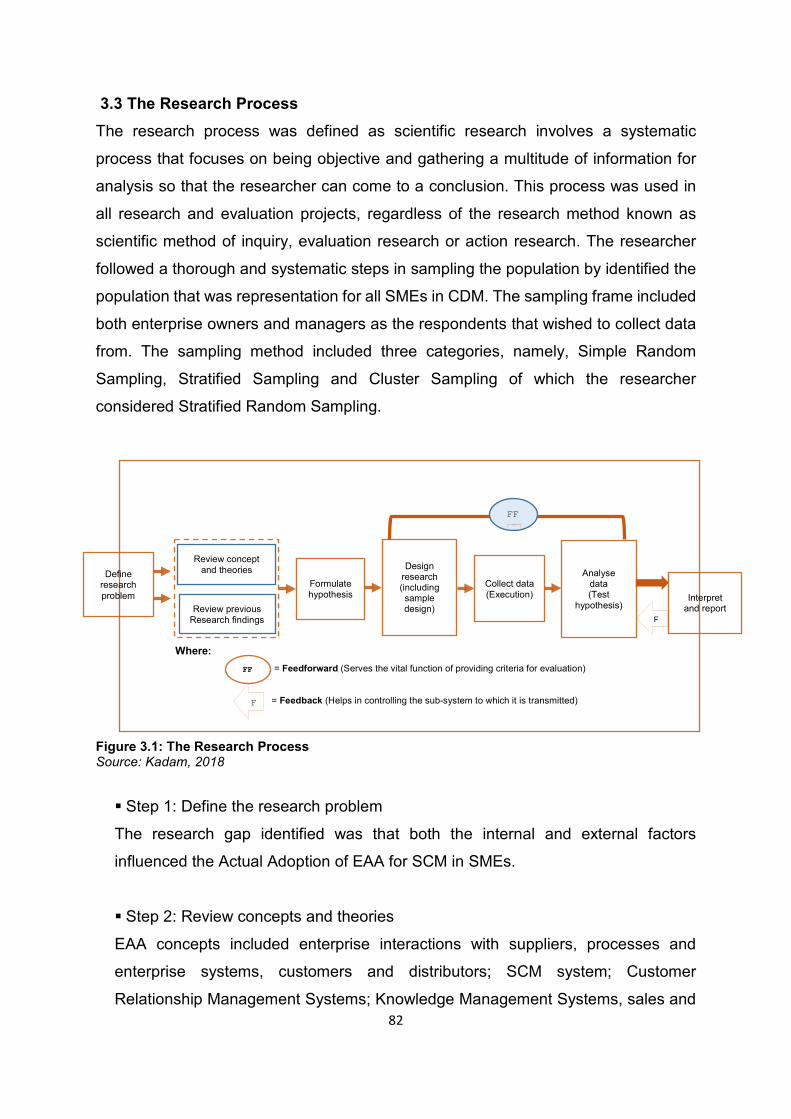
82
Define research problem
Formulate hypothesis Interpret
and report
Analyse data (Test
hypothesis)
Design research (including sample design)
Collect data (Execution)
F
FF
F
3.3 The Research Process The research process was defined as scientific research involves a systematic
process that focuses on being objective and gathering a multitude of information for
analysis so that the researcher can come to a conclusion. This process was used in
all research and evaluation projects, regardless of the research method known as
scientific method of inquiry, evaluation research or action research. The researcher
followed a thorough and systematic steps in sampling the population by identified the
population that was representation for all SMEs in CDM. The sampling frame included
both enterprise owners and managers as the respondents that wished to collect data
from. The sampling method included three categories, namely, Simple Random
Sampling, Stratified Sampling and Cluster Sampling of which the researcher
considered Stratified Random Sampling.
Where: = Feedforward (Serves the vital function of providing criteria for evaluation)
= Feedback (Helps in controlling the sub-system to which it is transmitted)
Figure 3.1: The Research Process Source: Kadam, 2018
Step 1: Define the research problem
The research gap identified was that both the internal and external factors
influenced the Actual Adoption of EAA for SCM in SMEs.
Step 2: Review concepts and theories
EAA concepts included enterprise interactions with suppliers, processes and
enterprise systems, customers and distributors; SCM system; Customer
Relationship Management Systems; Knowledge Management Systems, sales and
FF
Review concept and theories
Review previous Research findings
83
marketing; manufacturing and production; finance and accounting; and link with
Human Resources Management. Three theories were scrutinised and discussed,
namely, Diffusion Theory of Innovation (DTI) and its limitations; Theory of Reasoned
Action (TRA); and Theory of Planned Behaviour (TPB).
Step 3: Review previous research findings
Previous literature review provided insight in structuring the research problem
statement and focused on internal and external factors affecting the Actual Adoption
of EAA for SCM in SMEs.
Step 4: Formulate the hypotheses
Five hypotheses were formulated after structuring the research objectives that
included internal factors with three sub-hypotheses external factors, Perceived
Attitudes towards the Actual Adoption of EAA and Actual Adoption of EAA.
Step 5: Research Design
The Research Design was considered to be quantitative method as a descriptive
research were the population was identified, sample was identified as 310 SMEs
and where data were collected from.
Step 6: Collection of data
Data was collected in the form of questionnaire survey in SMEs located in CDM that
included7; Blouberg (Bochum) Municipality, Molemole (Dendron) Municipality,
Polokwane Municipality and Lepelle-Nkumbi (Lebowakgomo) Municipality
(Administrative Divisions of South Africa, 2018
Step 7: Analyse data
Tests were used to determine the distribution of data of the populations from which
the samples were drawn and both the Cronbach’s Alpha and Kolmogorov-Smirnov
test were used to determine the reliability and validity of data. At a latter stage, data
analysis was concluded through the use of descriptive statistics on Pearson
Correlation Coefficients, ANOVA, Pearson’s coefficients and for testing the
hypotheses (Kim, 2014; Shrivastava, 2019). Furthermore, the simple Linear
84
Regression Model was used to measure linear relationship between variables that
projected either a negative or positive slope.
Step 8: Clarify the Problem
The main problem was identified in Step 1, although the problem was complex and
unavoidable with certain limitations that they were inflexible and linked to traditional
forms of investigation.
Step 9: Interpret and report the results
The interpretation of the results was done in Chapter 4, whereas the reporting of
the results was conducted in Chapter 5 in the form of summary findings, conclusions
and recommendations.
3.4 Research Philosophy Research philosophy was regarded as a systematic prearrangement of assumptions
based on of beliefs and progression on knowledge from dynamic and dramatics of
new theory derived from human motivation for producing solutions through the
adoption of EAA for SCM within SMEs (O'Gorman & MacIntosh, 2015; and Sharrock
& Button, 2016). In the history of research philosophy, several assumptions were
made such as epistemological assumptions known as human knowledge; ontological
assumptions denoted to realisms encountered by the researcher; and axiological
assumptions signified to a magnitude where certain values influenced the research
process (Thorne, 2016; and Kadam, 2018). The research philosophies were discussed
below.
3.4.1 Positivism Paradigm
The French philosopher, August Comte, postulated positivism as a pattern was based
on the philosophical ideas referred to empiricism of positive knowledge, observation
through confirmed and substantiated data with natural phenomena that used scientific
methods and their properties and relations on positive facts, interpreted through
reasons and logical observation as empirical evidence (Boyd, 2019; and Crossman,
2019). A positivistic approach lead to the understanding of human behavioural
patterns as an approach to the adoption of EAA for SCM (Rosenberg, 2011; and
85
Rafeedalie, 2019). For a credible and meaningful data, epistemologically the
researcher focused on discovering apparent and measurable facts leading to the
adoption or rejection of EAA for SCM (Thorne, 2016; and Hughes & Sharrock, 2016).
In Sociology, there were two basic approaches to research known as: positivism,
which considers scientific quantitative methods; and interpretivism, which considers
humanistic qualitative methods (Thompson, 2015a).
In positivism research, positivists prefer quantitative methods such as social surveys,
structured questionnaires and official statistical analysis as they guaranteed good
reliability and representativeness (Jansen, 2010). Furthermore, positivists perceive
society on the notion that social facts shape individual actions, and such provides the
advantage of conducting quantitative research on large-scale surveys in order to get
an overview of society or population as a whole and to uncover social trends, such as
the relationship between EAA and SCM known as a comparative method (Anayet &
Ali, 2014). In natural phenomena, the researcher adopted an extreme positivist
position, as evident in data collection where enterprises were treated and managed as
physical substances for data collection.
3.4.2 Interpretivism Paradigm/Constructivist Paradigm
Interpretivism was used to group together diverse approaches in research that
included; social constructivism, phenomenology and hermeneutics approaches.
Interpretivist paradigm was assigned within the structure of the domain for self-
sufficiently consciousness, which was associated with the philosophical situation of
optimism (Kivunja & Kuyini, 2017). Interpretivism emphasised that humans are
different from physical singularities as they create meanings to any situation
(Dudovskiy, 2019).
Interpretivism argued that human beings and their social worlds cannot be studied in
the same way as physical phenomena, and that social sciences research needed to
be different from natural sciences research rather than trying to emulate the previous
research results (Rosenberg, 2011). The purpose of interpretivist research was to
create new, rich understandings and interpretations of social worlds and contexts
(O'Gorman & MacIntosh, 2015). Interpretivism denoted that individuals were
86
sophisticated with complex different personalities and experience that lead them to
have objective reality’ in very different ways, thus signify that scientific methods were
not appropriate (Bernabe, Van Thiel, Raaijmakers & Van Delden, 2012).
3.4.3 Epidome of Pragmatism
Epidome of pragmatism was reflected as a general view-point that strengthened mixed
methods in research such as; methodological triangulation for addressing the problem-
oriented philosophy that verified the research hypotheses (Kivunja & Kuyini, 2017; and
Saeed, 2018). Pragmatism declared that research concepts or terminologies were
relevant for the study thorough understanding and flow of information that served as
an interpretation of difficult terminologies (Sharrock & Button, 2016). It attempted to
reconcile both objectivism and subjectivism with facts and values that leads to
accurate understanding of different contextualised experiences.
3.4.4 Critical Realism
Epistemologically, critical realism was considered as a philosophy of scientific
knowledge based on the grounds of having the relations between the concepts and
categories in a subject area or domain, grounded in theoretical explanations about
phenomena, which operated the same way as positivism and interpretivism
(Lyubimov, 2015; and Kivunja & Kuyini, 2017). In the late twentieth, critical realism
was developed as an approach that occupies a middle ground between two positions,
such as on positivism and interpretivism standards (Cloud, 2019). Critical realism
functioned and depended on tangible evidence and involvement practices for
mastering the fundamental underlying structures of reality that constructed the
observed events (Kent & Tsang, 2010). In epistemological relativism, secondary and
tertiary information were used to respond to social constructions and phenomena
(Hoghes & Sharrock, 2016).
3.4.5 Postmodernism
Postmodernism highlights answered for enquiry being acknowledged as a way of
rational thinking that provided a voice to alternative side-lined views based on the role
of language and of power relations (Kent & Tsang, 2010; and Sharrock & Button,
2016). Postmodernism was historically entangled with the intellectual movement of
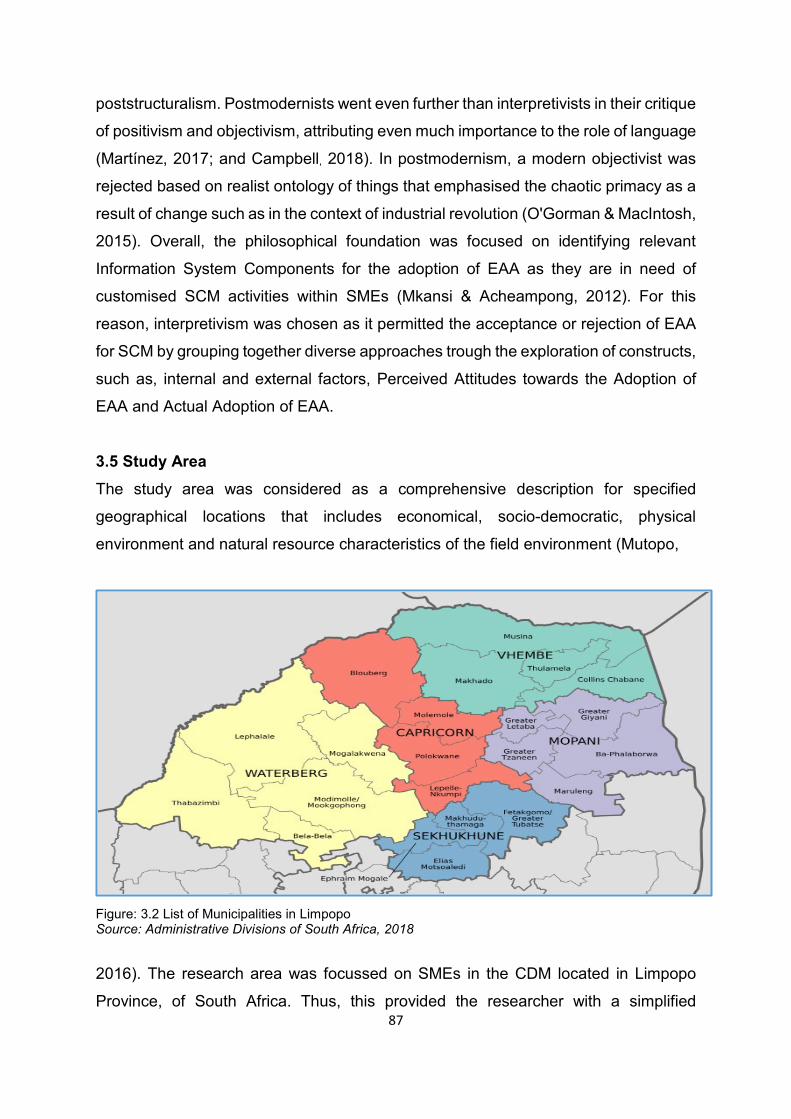
87
poststructuralism. Postmodernists went even further than interpretivists in their critique
of positivism and objectivism, attributing even much importance to the role of language
(Martínez, 2017; and Campbell, 2018). In postmodernism, a modern objectivist was
rejected based on realist ontology of things that emphasised the chaotic primacy as a
result of change such as in the context of industrial revolution (O'Gorman & MacIntosh,
2015). Overall, the philosophical foundation was focused on identifying relevant
Information System Components for the adoption of EAA as they are in need of
customised SCM activities within SMEs (Mkansi & Acheampong, 2012). For this
reason, interpretivism was chosen as it permitted the acceptance or rejection of EAA
for SCM by grouping together diverse approaches trough the exploration of constructs,
such as, internal and external factors, Perceived Attitudes towards the Adoption of
EAA and Actual Adoption of EAA.
3.5 Study Area The study area was considered as a comprehensive description for specified
geographical locations that includes economical, socio-democratic, physical
environment and natural resource characteristics of the field environment (Mutopo,
Figure: 3.2 List of Municipalities in Limpopo Source: Administrative Divisions of South Africa, 2018
2016). The research area was focussed on SMEs in the CDM located in Limpopo
Province, of South Africa. Thus, this provided the researcher with a simplified
88
availability of a sufficient number of SMEs to gather data.The above figure
demonstrates municipalities per districts and, in this regard, the focus area is CDM.
Data were collected from those designated areas.
3.6 Population of the Study The research population is considered as the diverse group of individuals to whom the
researcher intended to generalise the results for the study (David, 2019). The
population included all registered SMEs in the CDM of the Limpopo Province of South
Africa. The target population was represented by either the owner’s or management
of the enterprise. The SMEs population in Limpopo Province was 1900 as per the
record from Small Enterprise Development Agency (Small Enterprise Development
Agency, 2019b).
3.7 Methods/Instruments/Techniques Used to Collect the Data The methodological approach used in this study for collection of data reserved its
ability to perform a comprehensive analysis of the results after the completion of the
interpretation of the results (Salthouse, 2011). A thorough check was done by
eliminating and excluding certain questions in a survey that were irrelevant for the
study. Nevertheless, a pilot study was conducted and occurrences were eliminated
from the actual survey. In some cases wherein analytical methods are problematic or
had implications on developmental phenomenon based upon results of the methods,
such were changed.
A literature on theoretical and methodological watchfulness in scale was development
extensively as some limitations have been identified in the process. These include
failure to adequately define the geographical area and for incorrectly specifying the
measurement model, even underutilisation of some techniques that were helpful in
establishing construct validity (Morgado, Julia, Meireles, Neves, Amaral & Ferreira,
2017).
89
3.8 Sample and Sampling Methods 3.8.1. Sampling Methods
Sampling methods explicate the way at which the members were selected from the
population to be in the study (Khan Academy, 2013).
3.8.2.1 Probability Sampling
The researcher considered a Probability Sampling for randomisation and took steps
to ensure all members of a population have an equal chance of being selected. The
challenges in using Probability Sampling were that, there was a need for additional
information as accumulated from chapter 2 via literature review in responding to
questions and on the other hand it was complex and time-consuming (Lombardo,
2018);
In Stratified Sampling the population was divided into sub-groups known as
strata and they were randomly selected from each stratum groups. Its core
focus was to ensure that all required groups were fully presented (Gerrish &
Lathlean, 2015; and Murphy, 2018);
Systematic sampling was used for a specific system to select members such
as every third person on an alphabetic order (Jackson, 2018). It is more
advantageous approach with low risk and easily controllable (Ross, 2018). Its
drawback is that the requirement that the population is uniform may not always
be realistic (Devkota, 2018);
Cluster Random Sampling entailed that population was grouped together and
divided into clusters and regarded as samples (Ochoa, 2017);
Multi-Stage Random Sampling included the combination of one or more of the
above methods (Gove, Ducey & Valentine, 2002). In general, it is less efficient
than a suitable single-stage Random Sampling (Azad, 2018); and
Cluster Sampling reduced the process of variability and was applied with
feasible approach as it was applied to multiple areas within the CDM (Verial,
2018; and Gaille, 2018). Its benefits are that it was relatively easy to manage
fast and it is more cost-effective (Foley, 2018c).
90
3.8.2.2 Non-Probability Sampling
A non-probability sampling methods was considered as an acceptable alternative as
control studies in clinical trials for evaluation research designs that divert surveys and
for opt-in panels that were not explored in detail by survey researchers in other applied
research fields (Baker, Brick, Bates, Battaglia, Couper, Dever, Gile & Tourangeau,
2013). The Non-Probability Sampling does not depend on the use of randomisation
techniques to select members. This was typically used in studies where randomisation
is not possible. The level of biasness is more of a concern with this type of sampling.
The different types of Non-Probability Sampling are as follows:
Convenience or Accidental Sampling – The convenience sampling denotes a
platform whereby participants are selected based on their availability (Stephane,
2014);
Purposive Sampling – The purposive sampling signifies a point where
respondents are purposefully selected (Foley, 2018);
Modal Instance Sampling – The modal instance sampling was considered as an
important factor used to plan new programs such as EAA in SCM (Staphane,
2014);
Expert Sampling – In expert sampling it is regarded as a situation wherein
respondents are selected for their knowledge about a subject (Palinkas, Horwitz,
Green, Wisdom, Duan & Hoagwood, 2016);
Proportional and Non-Proportional Quota Sampling – In case for both
proportional and non-proportional quota sampling participants are sampled until
exact proportions of certain types of data were obtained, with sufficient data in
different categories collected (Sedgwick, 2013);
Diversity Sampling – In diversity sampling the respondents are selected
intentionally across possible types of responses, so as to capture all possibilities
(Allmark, 2004); and
Snowball Sampling – In this regard the snowball sampling the respondents are
sampled and asked to help identify other members to sample and the process
continued until enough samples are collected (Devkota, 2018).
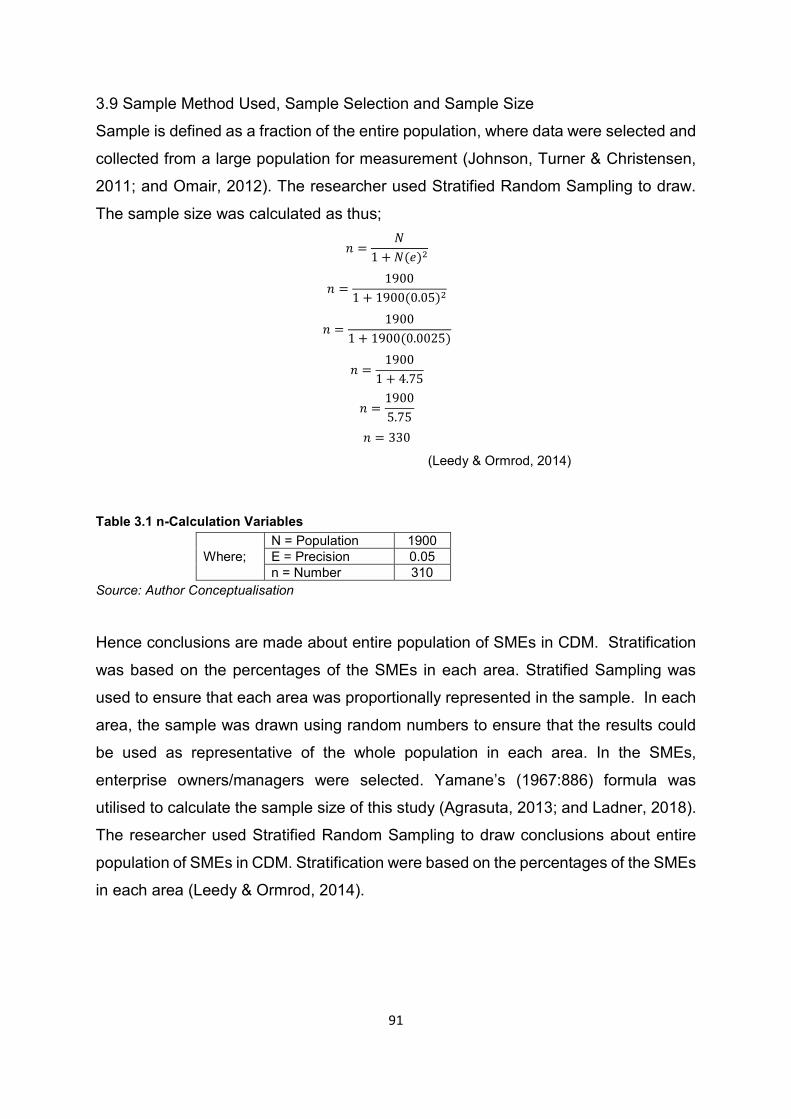
91
3.9 Sample Method Used, Sample Selection and Sample Size
Sample is defined as a fraction of the entire population, where data were selected and
collected from a large population for measurement (Johnson, Turner & Christensen,
2011; and Omair, 2012). The researcher used Stratified Random Sampling to draw.
The sample size was calculated as thus;
𝑛𝑛 =𝑁𝑁
1 + 𝑁𝑁(𝑒𝑒)2
𝑛𝑛 =1900
1 + 1900(0.05)2
𝑛𝑛 =1900
1 + 1900(0.0025)
𝑛𝑛 =1900
1 + 4.75
𝑛𝑛 =19005.75
𝑛𝑛 = 330
(Leedy & Ormrod, 2014)
Table 3.1 n-Calculation Variables
Source: Author Conceptualisation
Hence conclusions are made about entire population of SMEs in CDM. Stratification
was based on the percentages of the SMEs in each area. Stratified Sampling was
used to ensure that each area was proportionally represented in the sample. In each
area, the sample was drawn using random numbers to ensure that the results could
be used as representative of the whole population in each area. In the SMEs,
enterprise owners/managers were selected. Yamane’s (1967:886) formula was
utilised to calculate the sample size of this study (Agrasuta, 2013; and Ladner, 2018).
The researcher used Stratified Random Sampling to draw conclusions about entire
population of SMEs in CDM. Stratification were based on the percentages of the SMEs
in each area (Leedy & Ormrod, 2014).
Where; N = Population 1900 E = Precision 0.05 n = Number 310
92
3.10 The Research Instrument Construction 3.10.1 The Research Instrument
A research instrument is a tool used for measuring dependent and independent
variables. The questionnaire was tested in a pilot study and few amendments were
made (National Academy of Sciences Engineering Medicine, 2009). The following
main variables were tested; internal factors, external factors, Perceived Attitudes
towards the Adoption of EAA have been measured towards the Actual Adoption of
EAA.
3.10.2 Questionnaire Construction
The primary data were collected by using self-administered questionnaires, structured
in a Likert Scale or cross-table are formalised for the response rate with specified
ratings, wherein the respondents tick a favourable and that gave the researcher a
flexible amble opportunity to stratify the response rates (Saunders, et al., 2012; and
Chauri & Grønhaug, 2010). Likert scale was considered as a psychometric scale with
set of options for the respondednts to express their interpretations, opinions and
thoughts based on projected sitiation. Likert-scale questionnaires allow researchers to
collect large amount of data with relative ease (Nemoto & Beglar, 2014). The rating
scales was from 1 – 5, and being represented as follows; 1 = Strongly Disagree, 2 =
Disagree, 3 = Moderate, 4 = Agree and 5 = Strongly Agree.
Secondary data were considered as primary data collected by other researchers;
hence, in reality, it is regarded as historical data being analysed. A tertiary data
represented summaries or condensed versions of materials that referenced back to
both primary and/or secondary sources (Repplinger, 2015; and Elsoudy, 2016).
Afterwards, the pilot study conduct and all unnecessary errors and biased questions
were highlighted and corrected. Follow-ups were completed to increase the response
rate. The questionnaire was developed in line with the research objectives and
hypotheses. The table below exemplifies all hypotheses with reference to the concepts
as discussed in the literature review. The following constructs in line with research
objectives were discussed.
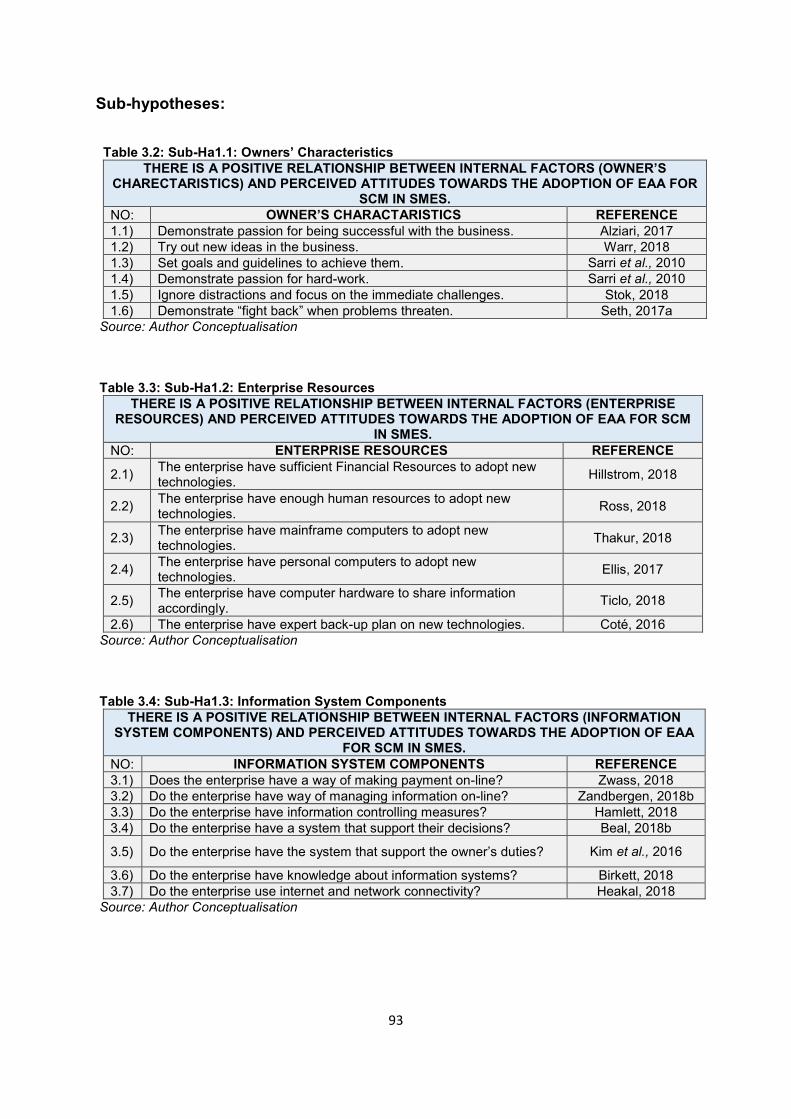
93
Sub-hypotheses: Table 3.2: Sub-Ha1.1: Owners’ Characteristics
THERE IS A POSITIVE RELATIONSHIP BETWEEN INTERNAL FACTORS (OWNER’S CHARECTARISTICS) AND PERCEIVED ATTITUDES TOWARDS THE ADOPTION OF EAA FOR
SCM IN SMES. NO: OWNER’S CHARACTARISTICS REFERENCE 1.1) Demonstrate passion for being successful with the business. Alziari, 2017 1.2) Try out new ideas in the business. Warr, 2018 1.3) Set goals and guidelines to achieve them. Sarri et al., 2010 1.4) Demonstrate passion for hard-work. Sarri et al., 2010 1.5) Ignore distractions and focus on the immediate challenges. Stok, 2018 1.6) Demonstrate “fight back” when problems threaten. Seth, 2017a
Source: Author Conceptualisation Table 3.3: Sub-Ha1.2: Enterprise Resources
THERE IS A POSITIVE RELATIONSHIP BETWEEN INTERNAL FACTORS (ENTERPRISE RESOURCES) AND PERCEIVED ATTITUDES TOWARDS THE ADOPTION OF EAA FOR SCM
IN SMES. NO: ENTERPRISE RESOURCES REFERENCE
2.1) The enterprise have sufficient Financial Resources to adopt new technologies. Hillstrom, 2018
2.2) The enterprise have enough human resources to adopt new technologies. Ross, 2018
2.3) The enterprise have mainframe computers to adopt new technologies. Thakur, 2018
2.4) The enterprise have personal computers to adopt new technologies. Ellis, 2017
2.5) The enterprise have computer hardware to share information accordingly. Ticlo, 2018
2.6) The enterprise have expert back-up plan on new technologies. Coté, 2016 Source: Author Conceptualisation Table 3.4: Sub-Ha1.3: Information System Components
THERE IS A POSITIVE RELATIONSHIP BETWEEN INTERNAL FACTORS (INFORMATION SYSTEM COMPONENTS) AND PERCEIVED ATTITUDES TOWARDS THE ADOPTION OF EAA
FOR SCM IN SMES. NO: INFORMATION SYSTEM COMPONENTS REFERENCE 3.1) Does the enterprise have a way of making payment on-line? Zwass, 2018 3.2) Do the enterprise have way of managing information on-line? Zandbergen, 2018b 3.3) Do the enterprise have information controlling measures? Hamlett, 2018 3.4) Do the enterprise have a system that support their decisions? Beal, 2018b
3.5) Do the enterprise have the system that support the owner’s duties? Kim et al., 2016
3.6) Do the enterprise have knowledge about information systems? Birkett, 2018 3.7) Do the enterprise use internet and network connectivity? Heakal, 2018
Source: Author Conceptualisation
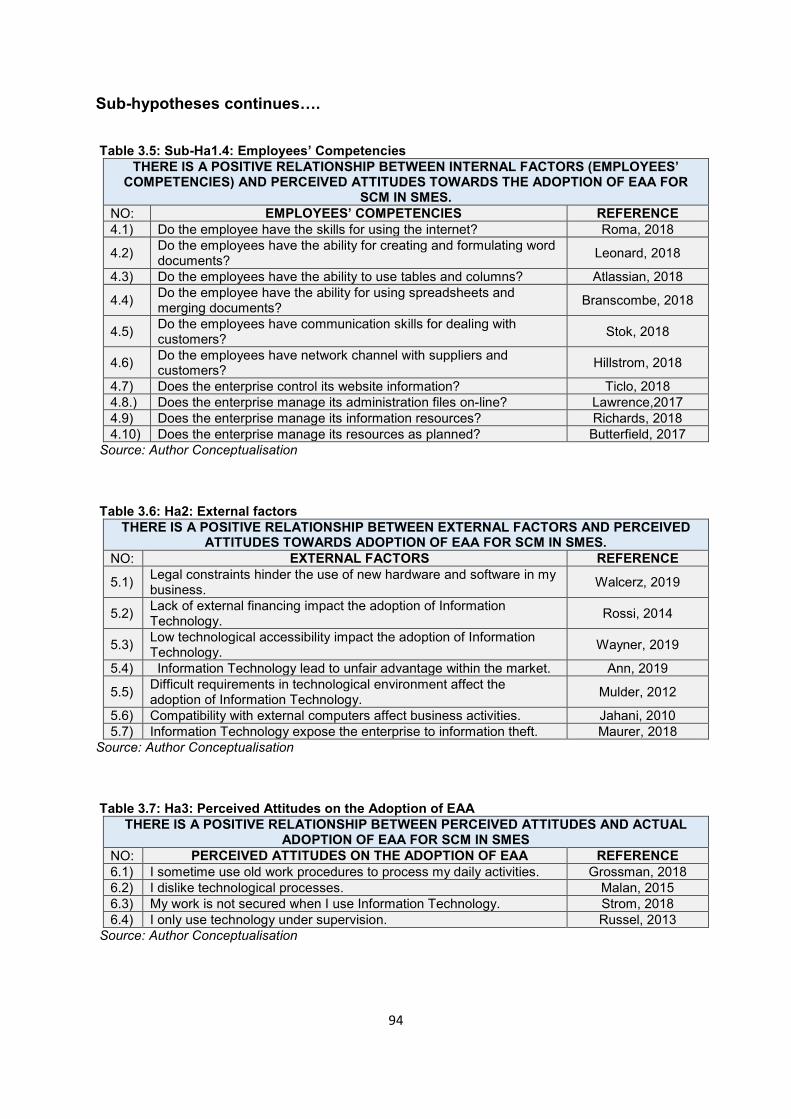
94
Sub-hypotheses continues…. Table 3.5: Sub-Ha1.4: Employees’ Competencies
THERE IS A POSITIVE RELATIONSHIP BETWEEN INTERNAL FACTORS (EMPLOYEES’ COMPETENCIES) AND PERCEIVED ATTITUDES TOWARDS THE ADOPTION OF EAA FOR
SCM IN SMES. NO: EMPLOYEES’ COMPETENCIES REFERENCE 4.1) Do the employee have the skills for using the internet? Roma, 2018
4.2) Do the employees have the ability for creating and formulating word documents? Leonard, 2018
4.3) Do the employees have the ability to use tables and columns? Atlassian, 2018
4.4) Do the employee have the ability for using spreadsheets and merging documents? Branscombe, 2018
4.5) Do the employees have communication skills for dealing with customers? Stok, 2018
4.6) Do the employees have network channel with suppliers and customers? Hillstrom, 2018
4.7) Does the enterprise control its website information? Ticlo, 2018 4.8.) Does the enterprise manage its administration files on-line? Lawrence,2017 4.9) Does the enterprise manage its information resources? Richards, 2018 4.10) Does the enterprise manage its resources as planned? Butterfield, 2017
Source: Author Conceptualisation Table 3.6: Ha2: External factors
THERE IS A POSITIVE RELATIONSHIP BETWEEN EXTERNAL FACTORS AND PERCEIVED ATTITUDES TOWARDS ADOPTION OF EAA FOR SCM IN SMES.
NO: EXTERNAL FACTORS REFERENCE
5.1) Legal constraints hinder the use of new hardware and software in my business. Walcerz, 2019
5.2) Lack of external financing impact the adoption of Information Technology. Rossi, 2014
5.3) Low technological accessibility impact the adoption of Information Technology. Wayner, 2019
5.4) Information Technology lead to unfair advantage within the market. Ann, 2019
5.5) Difficult requirements in technological environment affect the adoption of Information Technology. Mulder, 2012
5.6) Compatibility with external computers affect business activities. Jahani, 2010 5.7) Information Technology expose the enterprise to information theft. Maurer, 2018
Source: Author Conceptualisation Table 3.7: Ha3: Perceived Attitudes on the Adoption of EAA
THERE IS A POSITIVE RELATIONSHIP BETWEEN PERCEIVED ATTITUDES AND ACTUAL ADOPTION OF EAA FOR SCM IN SMES
NO: PERCEIVED ATTITUDES ON THE ADOPTION OF EAA REFERENCE 6.1) I sometime use old work procedures to process my daily activities. Grossman, 2018 6.2) I dislike technological processes. Malan, 2015 6.3) My work is not secured when I use Information Technology. Strom, 2018 6.4) I only use technology under supervision. Russel, 2013
Source: Author Conceptualisation
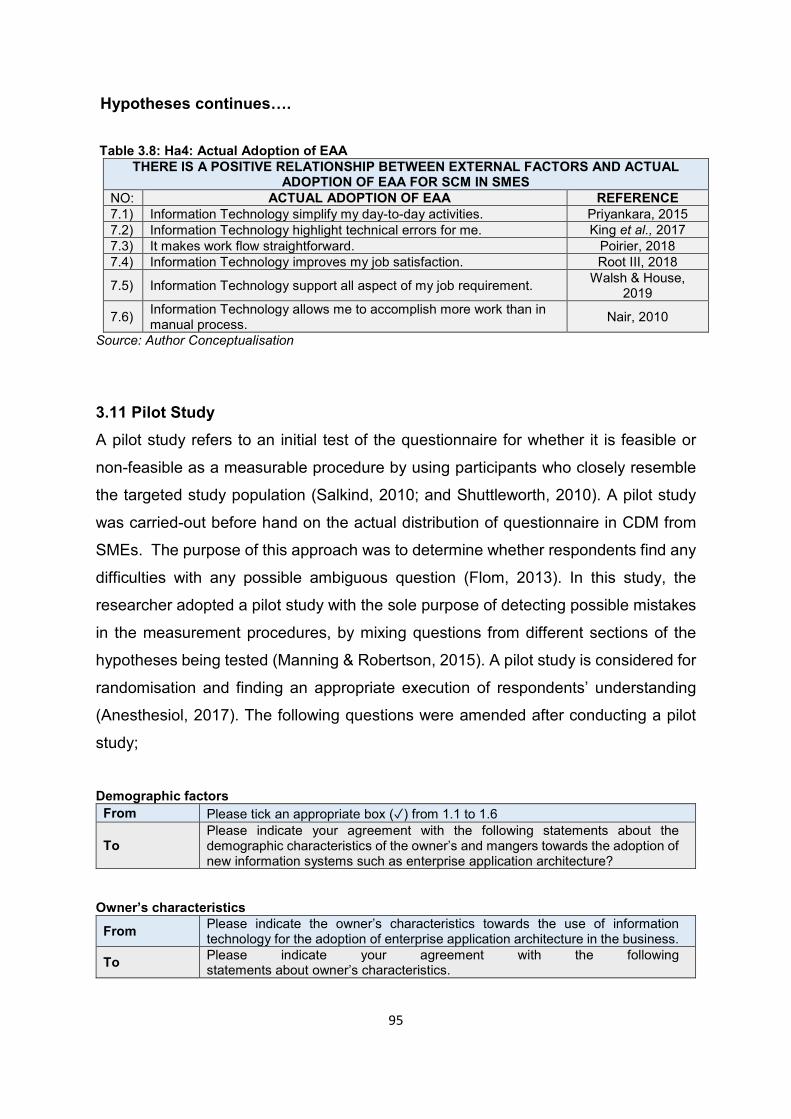
95
Hypotheses continues…. Table 3.8: Ha4: Actual Adoption of EAA
THERE IS A POSITIVE RELATIONSHIP BETWEEN EXTERNAL FACTORS AND ACTUAL ADOPTION OF EAA FOR SCM IN SMES
NO: ACTUAL ADOPTION OF EAA REFERENCE 7.1) Information Technology simplify my day-to-day activities. Priyankara, 2015 7.2) Information Technology highlight technical errors for me. King et al., 2017 7.3) It makes work flow straightforward. Poirier, 2018 7.4) Information Technology improves my job satisfaction. Root III, 2018
7.5) Information Technology support all aspect of my job requirement. Walsh & House, 2019
7.6) Information Technology allows me to accomplish more work than in manual process. Nair, 2010
Source: Author Conceptualisation
3.11 Pilot Study A pilot study refers to an initial test of the questionnaire for whether it is feasible or
non-feasible as a measurable procedure by using participants who closely resemble
the targeted study population (Salkind, 2010; and Shuttleworth, 2010). A pilot study
was carried-out before hand on the actual distribution of questionnaire in CDM from
SMEs. The purpose of this approach was to determine whether respondents find any
difficulties with any possible ambiguous question (Flom, 2013). In this study, the
researcher adopted a pilot study with the sole purpose of detecting possible mistakes
in the measurement procedures, by mixing questions from different sections of the
hypotheses being tested (Manning & Robertson, 2015). A pilot study is considered for
randomisation and finding an appropriate execution of respondents’ understanding
(Anesthesiol, 2017). The following questions were amended after conducting a pilot
study;
Demographic factors
From Please tick an appropriate box (✓) from 1.1 to 1.6
To Please indicate your agreement with the following statements about the demographic characteristics of the owner’s and mangers towards the adoption of new information systems such as enterprise application architecture?
Owner’s characteristics
From Please indicate the owner’s characteristics towards the use of information technology for the adoption of enterprise application architecture in the business.
To Please indicate your agreement with the following statements about owner’s characteristics.
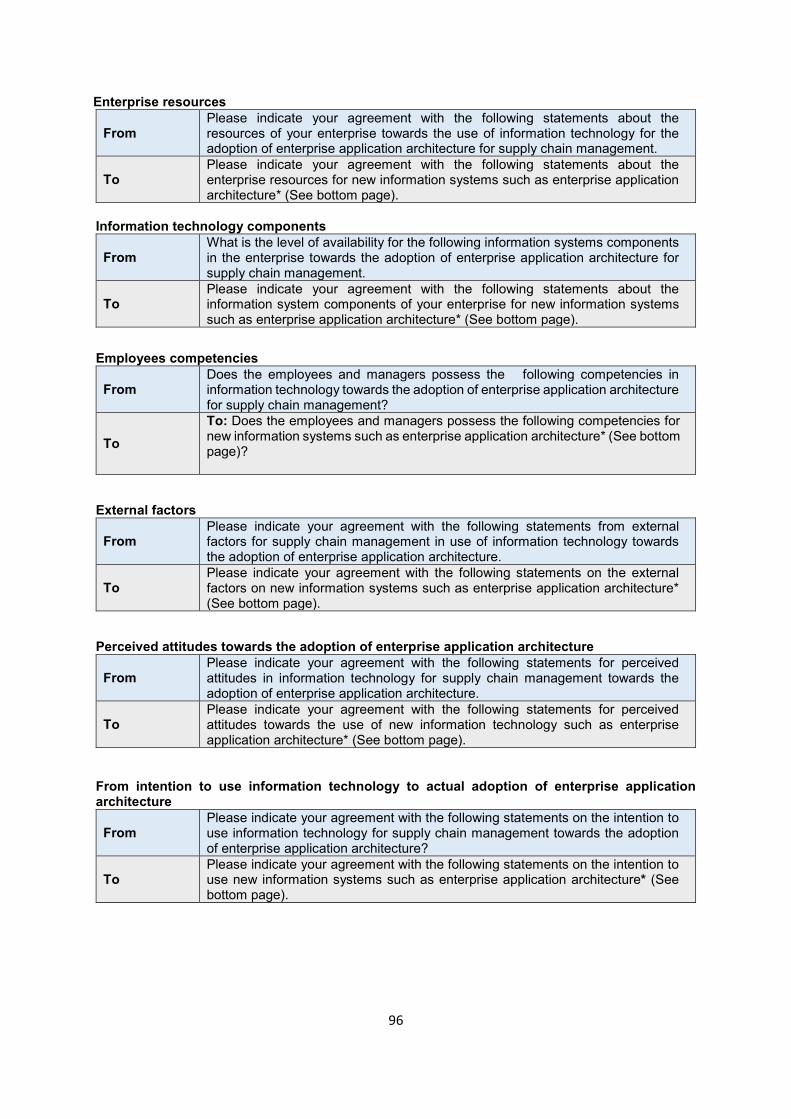
96
Enterprise resources
From Please indicate your agreement with the following statements about the resources of your enterprise towards the use of information technology for the adoption of enterprise application architecture for supply chain management.
To Please indicate your agreement with the following statements about the enterprise resources for new information systems such as enterprise application architecture* (See bottom page).
Information technology components
From What is the level of availability for the following information systems components in the enterprise towards the adoption of enterprise application architecture for supply chain management.
To Please indicate your agreement with the following statements about the information system components of your enterprise for new information systems such as enterprise application architecture* (See bottom page).
Employees competencies
From Does the employees and managers possess the following competencies in information technology towards the adoption of enterprise application architecture for supply chain management?
To To: Does the employees and managers possess the following competencies for new information systems such as enterprise application architecture* (See bottom page)?
External factors
From Please indicate your agreement with the following statements from external factors for supply chain management in use of information technology towards the adoption of enterprise application architecture.
To Please indicate your agreement with the following statements on the external factors on new information systems such as enterprise application architecture* (See bottom page).
Perceived attitudes towards the adoption of enterprise application architecture
From Please indicate your agreement with the following statements for perceived attitudes in information technology for supply chain management towards the adoption of enterprise application architecture.
To Please indicate your agreement with the following statements for perceived attitudes towards the use of new information technology such as enterprise application architecture* (See bottom page).
From intention to use information technology to actual adoption of enterprise application architecture
From Please indicate your agreement with the following statements on the intention to use information technology for supply chain management towards the adoption of enterprise application architecture?
To Please indicate your agreement with the following statements on the intention to use new information systems such as enterprise application architecture* (See bottom page).
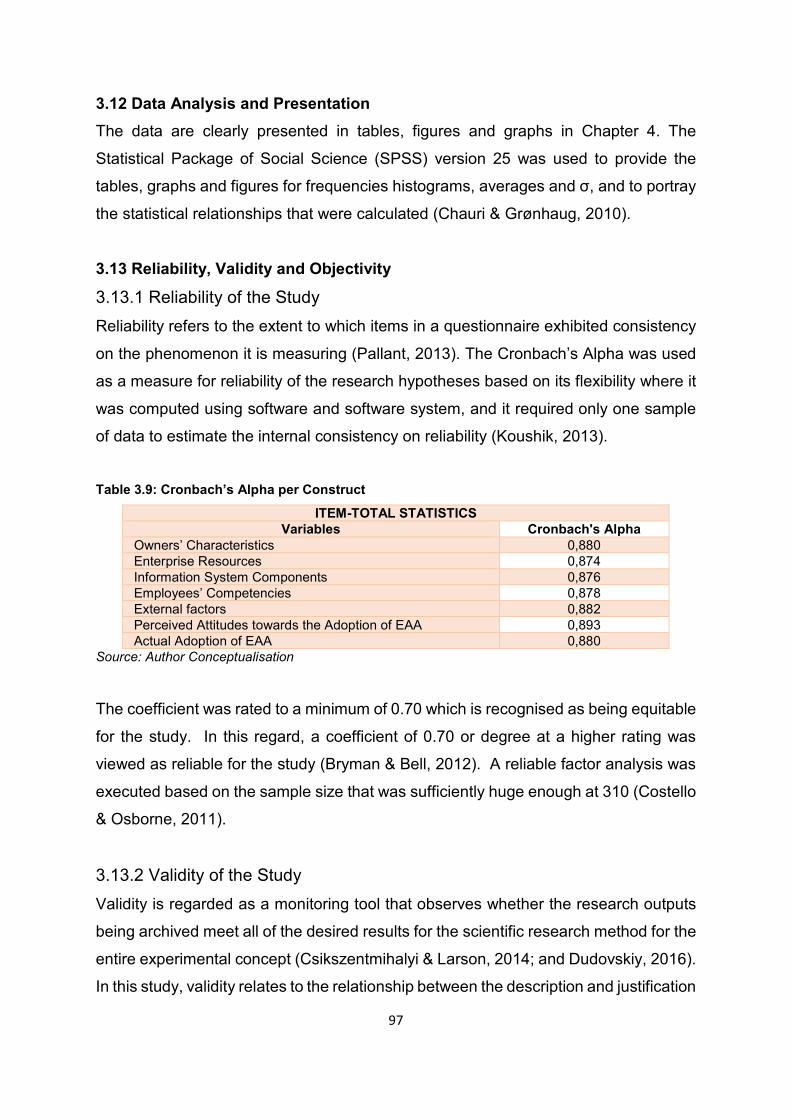
97
3.12 Data Analysis and Presentation The data are clearly presented in tables, figures and graphs in Chapter 4. The
Statistical Package of Social Science (SPSS) version 25 was used to provide the
tables, graphs and figures for frequencies histograms, averages and σ, and to portray
the statistical relationships that were calculated (Chauri & Grønhaug, 2010).
3.13 Reliability, Validity and Objectivity
3.13.1 Reliability of the Study Reliability refers to the extent to which items in a questionnaire exhibited consistency
on the phenomenon it is measuring (Pallant, 2013). The Cronbach’s Alpha was used
as a measure for reliability of the research hypotheses based on its flexibility where it
was computed using software and software system, and it required only one sample
of data to estimate the internal consistency on reliability (Koushik, 2013).
Table 3.9: Cronbach’s Alpha per Construct
ITEM-TOTAL STATISTICS Variables Cronbach's Alpha
Owners’ Characteristics 0,880 Enterprise Resources 0,874 Information System Components 0,876 Employees’ Competencies 0,878 External factors 0,882 Perceived Attitudes towards the Adoption of EAA 0,893 Actual Adoption of EAA 0,880
Source: Author Conceptualisation
The coefficient was rated to a minimum of 0.70 which is recognised as being equitable
for the study. In this regard, a coefficient of 0.70 or degree at a higher rating was
viewed as reliable for the study (Bryman & Bell, 2012). A reliable factor analysis was
executed based on the sample size that was sufficiently huge enough at 310 (Costello
& Osborne, 2011).
3.13.2 Validity of the Study Validity is regarded as a monitoring tool that observes whether the research outputs
being archived meet all of the desired results for the scientific research method for the
entire experimental concept (Csikszentmihalyi & Larson, 2014; and Dudovskiy, 2016).
In this study, validity relates to the relationship between the description and justification
98
of other sources regarded as a phenomenon that account for whether that
phenomenon is constructed as objective reality, participants or a diversity of other
possible interpretations (Shuttleworth, 2015; and Dudovskiy, 2016).
The research validity was ensured by adhering to the following steps:
The questionnaire was based on assumptions from accepted theories as set
out in the literature review;
The questionnaire was focused on the conceptual framework that was in itself
based on academically accepted theory and models;
A pilot survey was conducted to pre-test the questionnaire to get rid of mistakes
and weaknesses;
The sample size of 310 lead to increased precision in estimates of various
characteristics of the population that was calculated with a margin of error of
not more than 5% and a confidence level of 95% was used;
Research validity was divided into two groups; internal validity that referred to
how the research findings matched reality and external validity that referred to
the extent to which the research findings was replicated from other
environments (Dudovskiy, 2016);
In addition, content validity , construct validity and face validity was ensured;
Content validity was ensured as all dimensions of the research study was
obtained from the literature review (Lobiondo-Wood & Haber, 2013). Construct
validity was ensured by selecting and testing the relationship between the
measurement items and the constructs used (Bagozzi & Yi, 2012). Face validity
was ensured by the inclusion of variables as discussed by the scientific
community (Bryman, Hirschsohn, Du Toit & Wagner, 2014; and Shuttleworth,
2015); and
Internal validity was considered for its accurate procedures and experiment
ability to draw correct assumptions or inferences about the results (Sarniak,
2015).
3.13.3 Objectivity The objective of this study was to determine the factors impacting the Actual Adoption
of EAA for SCM in SMEs. The concepts and terms was used to give a clear meaning

99
for analysing and describing the research. The researcher did not participate in the
completion of the questionnaires and use the results from the analysis. All findings are
based on the results of the analysis and conclusions drawn were based on the
findings. Care was taken to make sure that the findings are reliably and fairly represent
the results. The interpretations and conclusions were drawn logically from the research
findings in chapter four.
3.14 Ethical Considerations Ethical considerations in this research study were considered as critical norms or
standards for conduct that distinguished and determined the difference between
acceptable and unacceptable behaviours, as they helped the researcher to prevent
fabrication or falsifying of data by promoting the quest of information and certainty
(Lewis et al., 2012; and Centre for Innovation in Research and Teaching, 2018).
Ethical practices were followed and as such incorrect, deceptive or undocumented
statements were avoided. The accuracy of data for analysis was not exaggerated.
The research findings and analysis are presented with trustworthiness, accurately and
questionnaires are securely kept for future reference as evidence; and full justification
is specified in case the ethical principles were not encountered (Fouka & Mantzorou,
2019). The researcher documented all data sources in the form of citations and
references. Ethical clearance was obtained from Turfloop Research Ethics Committee
(TREC) at the University of Limpopo before the start of data collection.
Informed consent provided participants with the following assurances (Coville, 2011;
Kowalczyk, 2019; and Fouka & Mantzorou, 2019):
Their participation is voluntary;
They are not feeling pressured to participate;
They can withdraw from the survey at any time;
Their personal-contact details were not needed;
Their confidentiality and privacy will be maintained;
They have the rights to refuse to partake in the survey; and
The survey offers guarantee on anonymity and confidentiality for their
participation.
100
The actual benefit is that the researcher is prepared to write journal articles from the
research findings in line with the research objectives, and most enterprises benefited
by making informed decisions whether or not adopt EAA in SCM. The researcher will
publish five journal articles from the study and they will be accessed from the website
of the university. There is risk in putting the lives of the respondents in danger, hence
the research does not use any body-related samples. Furthermore, both sensitive,
confidential and personal questions were not asked in order to maintain dignity and
privacy for all respondents.
101
3.15 Conclusion A critical assessment and examination on the existing theory allowed the author to
structure and formulate the research methodology to accomplishing the objectives for
the research. The researcher applied a quantitative research using a descriptive
survey design. Stratified Random Sampling was used with Random Sampling in the
stratified groupings to ensure that the entire population was represented in the sample
for generalisability of the results. A questionnaires with f Likert scale measures were
distributed and collected for data analysis. The population sample was regarded as
both SMEs owners and managers.
102
CHAPTER 4: DISCUSSION, PRESENTATION AND INTERPRETATION OF THE FINDINGS
4.1 Introduction This chapter presents the results of the data analysis based on dual aspects. Firstly,
the fitness of the data for analysis is discussed on reliability, validity and testing for
normality and, secondly, the relationships among the variables to investigate the
research hypotheses in the conceptual framework are discussed. The Kolmogorov-
Smirnov diagnostic test for normality was used to determine if sample scores of the
population follow the normal distribution. The Kolmogorov-Smirnov diagnostic test was
used to determine the normality of data on both the skewedness and Kurtosis in
distribution of data for variables. The Cronbach’s Alpha test was used to measure
reliability or internal consistency among the test items in the questionnaire.
Two tools were used to authenticate the results, such as, Pearson Correlation and
Pearson Coefficient. The hypotheses testing were conducted through Analysis of
Variance (ANOVA). The Linear Regression Model was used for modelling the
relationship between dependent variable and independent variables based on one or
more explanatory variables. This chapter is partitioned into two sections, namely,
Section A for testing reliability and validity analysis on normality of data; and Section
B for discussing the relationships among the variables in the conceptual framework,
presenting and interpreting the findings.
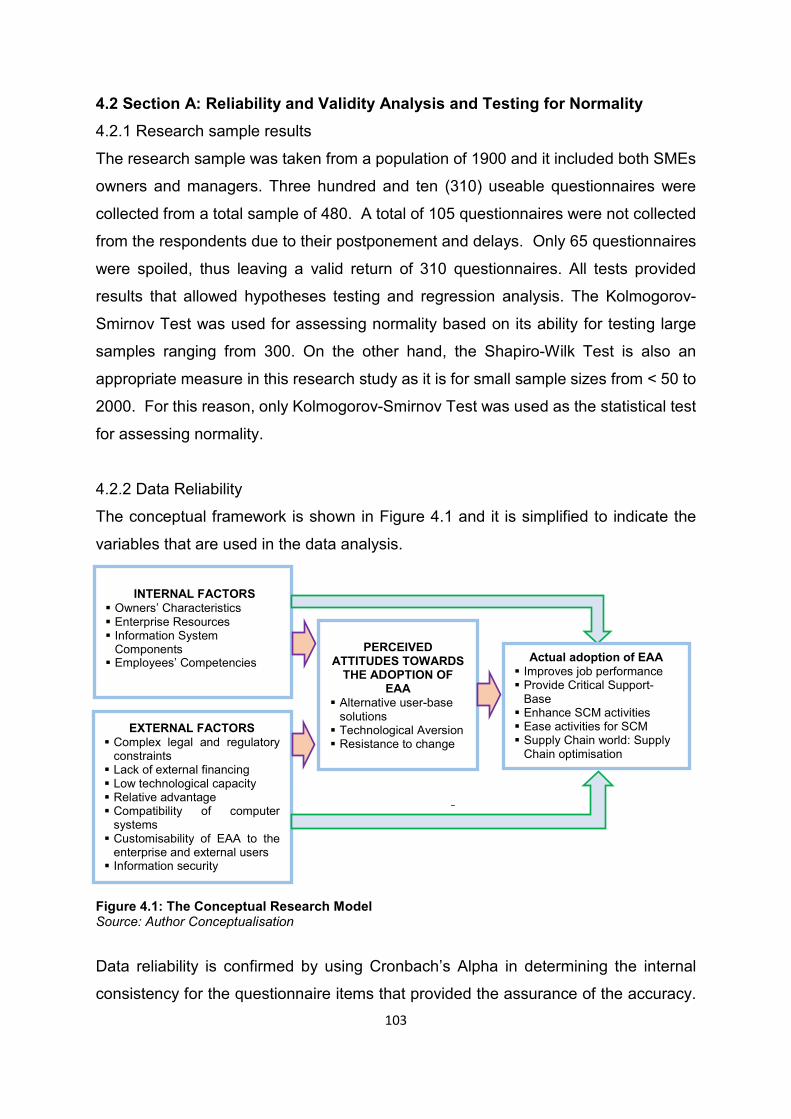
103
INTERNAL FACTORS
Owners’ Characteristics Enterprise Resources Information System
Components Employees’ Competencies Actual adoption of EAA
Improves job performance Provide Critical Support-
Base Enhance SCM activities Ease activities for SCM Supply Chain world: Supply
Chain optimisation
EXTERNAL FACTORS Complex legal and regulatory
constraints Lack of external financing Low technological capacity Relative advantage Compatibility of computer
systems Customisability of EAA to the
enterprise and external users Information security
4.2 Section A: Reliability and Validity Analysis and Testing for Normality 4.2.1 Research sample results
The research sample was taken from a population of 1900 and it included both SMEs
owners and managers. Three hundred and ten (310) useable questionnaires were
collected from a total sample of 480. A total of 105 questionnaires were not collected
from the respondents due to their postponement and delays. Only 65 questionnaires
were spoiled, thus leaving a valid return of 310 questionnaires. All tests provided
results that allowed hypotheses testing and regression analysis. The Kolmogorov-
Smirnov Test was used for assessing normality based on its ability for testing large
samples ranging from 300. On the other hand, the Shapiro-Wilk Test is also an
appropriate measure in this research study as it is for small sample sizes from < 50 to
2000. For this reason, only Kolmogorov-Smirnov Test was used as the statistical test
for assessing normality.
4.2.2 Data Reliability
The conceptual framework is shown in Figure 4.1 and it is simplified to indicate the
variables that are used in the data analysis.
Figure 4.1: The Conceptual Research Model Source: Author Conceptualisation
Data reliability is confirmed by using Cronbach’s Alpha in determining the internal
consistency for the questionnaire items that provided the assurance of the accuracy.
PERCEIVED
ATTITUDES TOWARDS THE ADOPTION OF
EAA Alternative user-base
solutions Technological Aversion Resistance to change
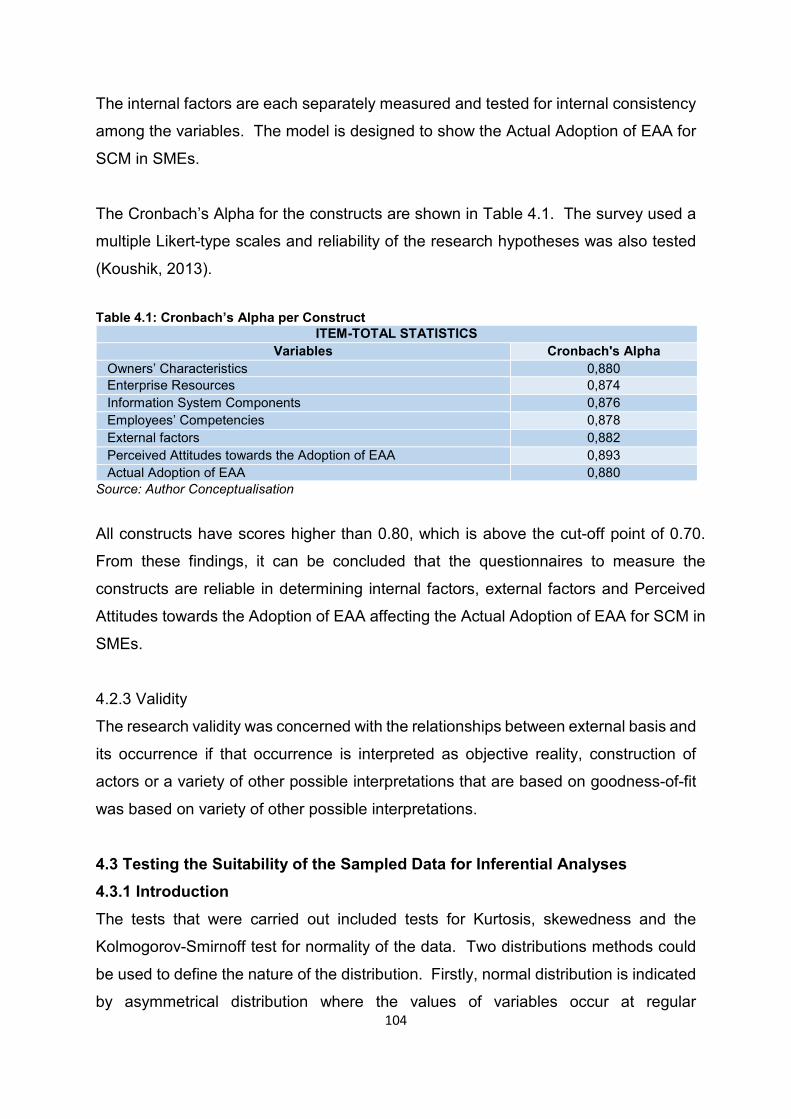
104
The internal factors are each separately measured and tested for internal consistency
among the variables. The model is designed to show the Actual Adoption of EAA for
SCM in SMEs.
The Cronbach’s Alpha for the constructs are shown in Table 4.1. The survey used a
multiple Likert-type scales and reliability of the research hypotheses was also tested
(Koushik, 2013). Table 4.1: Cronbach’s Alpha per Construct
ITEM-TOTAL STATISTICS Variables Cronbach's Alpha
Owners’ Characteristics 0,880 Enterprise Resources 0,874 Information System Components 0,876 Employees’ Competencies 0,878 External factors 0,882 Perceived Attitudes towards the Adoption of EAA 0,893 Actual Adoption of EAA 0,880
Source: Author Conceptualisation
All constructs have scores higher than 0.80, which is above the cut-off point of 0.70.
From these findings, it can be concluded that the questionnaires to measure the
constructs are reliable in determining internal factors, external factors and Perceived
Attitudes towards the Adoption of EAA affecting the Actual Adoption of EAA for SCM in
SMEs.
4.2.3 Validity
The research validity was concerned with the relationships between external basis and
its occurrence if that occurrence is interpreted as objective reality, construction of
actors or a variety of other possible interpretations that are based on goodness-of-fit
was based on variety of other possible interpretations.
4.3 Testing the Suitability of the Sampled Data for Inferential Analyses 4.3.1 Introduction The tests that were carried out included tests for Kurtosis, skewedness and the
Kolmogorov-Smirnoff test for normality of the data. Two distributions methods could
be used to define the nature of the distribution. Firstly, normal distribution is indicated
by asymmetrical distribution where the values of variables occur at regular
105
occurrences with the mean, median and mode tending to be the same and produce a
bell curve; the shape is like a bell and there is no skewness. Secondly, it could be
regarded as an asymmetrical distribution where there is irregular frequencies as the
mean, median and mode occur at different points from all variables, with skewness
either to the left or right side. The standard normal distribution has a Kurtosis of zero
and a positive Kurtosis indicates a "peaked" distribution and negative Kurtosis
indicates a "flat" distribution.
The Kurtosis figure should be near zero (0). The skewedness for a normal distribution
is 0, and any symmetric data should have a skewedness near zero. Negative values
for the skewedness indicate data that are skewed left and positive values for the
skewedness indicate data that are skewed right. In the Kolmogorov test, the test
statistic p is calculated as a percentage that states how much the sample data deviate
from a normal distribution. If p < 0.05, it can be accepted that the data does not come
from a normal distribution. These tests are now applied to the distributions of the
sampled data.
4.3.2 Descriptive Statistics on Internal Factors for SCM in SMEs 4.3.2.1 Descriptive Statistics on Normality Test for Owners’ Characteristics
Owners’ Characteristics are the entrepreneurial drive of the owner and are distinctive
traits acquired at birth or learned through educational system, which includes, passion
driven for enterprise success; creative thinking mind-set and in risk taking; discipline
for action orientation; innovation abilities for hard-working; vision oriented; and owner’s
resilience (Kuhn, Galloway & Collins-Williams, 2016; and Duermyer, 2017).
Table 4.2 on page 106 demonstrates the results for Owners’ Characteristics for the
Actual Adoption of EAA for SCM in SMEs. The sample (n) is 310, with a range value
(r) of 16.00 with the minimum (min) and maximum (max) at 14.00 and 30.00,
respectively. The standard deviation (σ) is 3.263 as projected in Figure 4.2. Table 4.2
indicates skewedness at -0.196 and Kurtosis at -0.141.
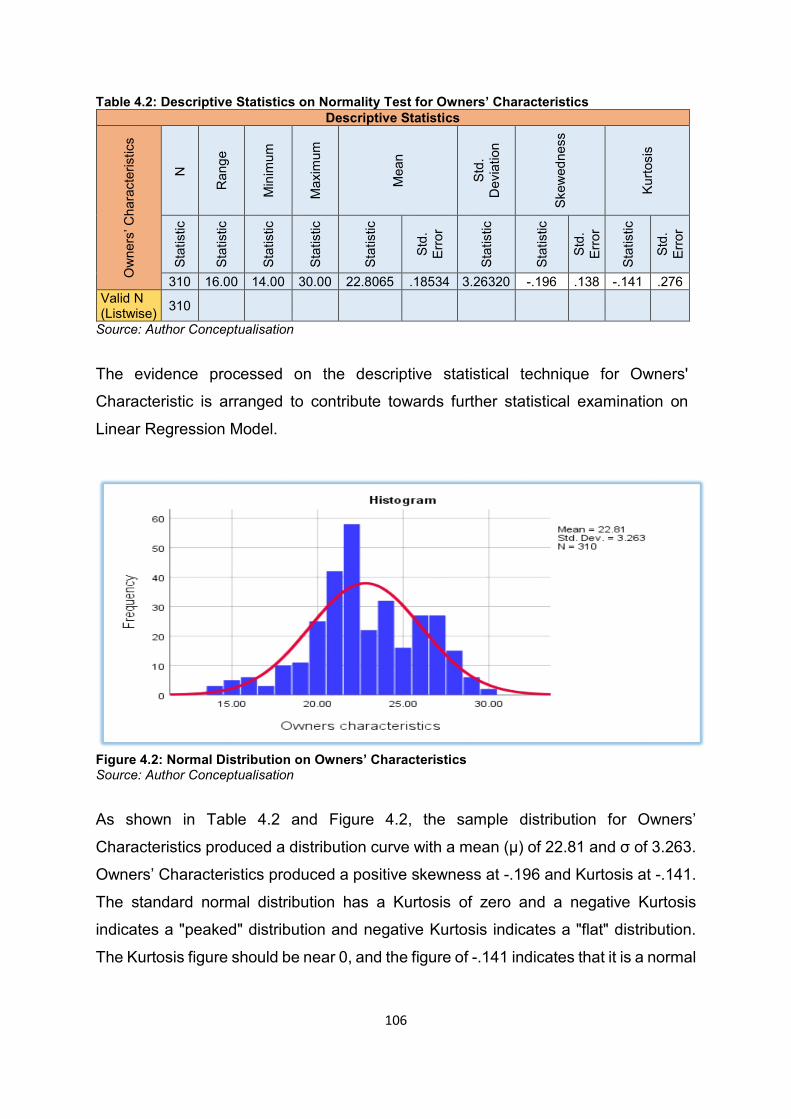
106
Table 4.2: Descriptive Statistics on Normality Test for Owners’ Characteristics Descriptive Statistics
Ow
ners
’ Cha
ract
eris
tics
N
Ran
ge
Min
imum
Max
imum
Mea
n
Std.
D
evia
tion
Skew
edne
ss
Kurto
sis
Stat
istic
Stat
istic
Stat
istic
Stat
istic
Stat
istic
Std.
Er
ror
Stat
istic
Stat
istic
Std.
Er
ror
Stat
istic
Std.
Er
ror
310 16.00 14.00 30.00 22.8065 .18534 3.26320 -.196 .138 -.141 .276 Valid N (Listwise) 310
Source: Author Conceptualisation
The evidence processed on the descriptive statistical technique for Owners'
Characteristic is arranged to contribute towards further statistical examination on
Linear Regression Model.
Figure 4.2: Normal Distribution on Owners’ Characteristics Source: Author Conceptualisation
As shown in Table 4.2 and Figure 4.2, the sample distribution for Owners’
Characteristics produced a distribution curve with a mean (μ) of 22.81 and σ of 3.263.
Owners’ Characteristics produced a positive skewness at -.196 and Kurtosis at -.141.
The standard normal distribution has a Kurtosis of zero and a negative Kurtosis
indicates a "peaked" distribution and negative Kurtosis indicates a "flat" distribution.
The Kurtosis figure should be near 0, and the figure of -.141 indicates that it is a normal
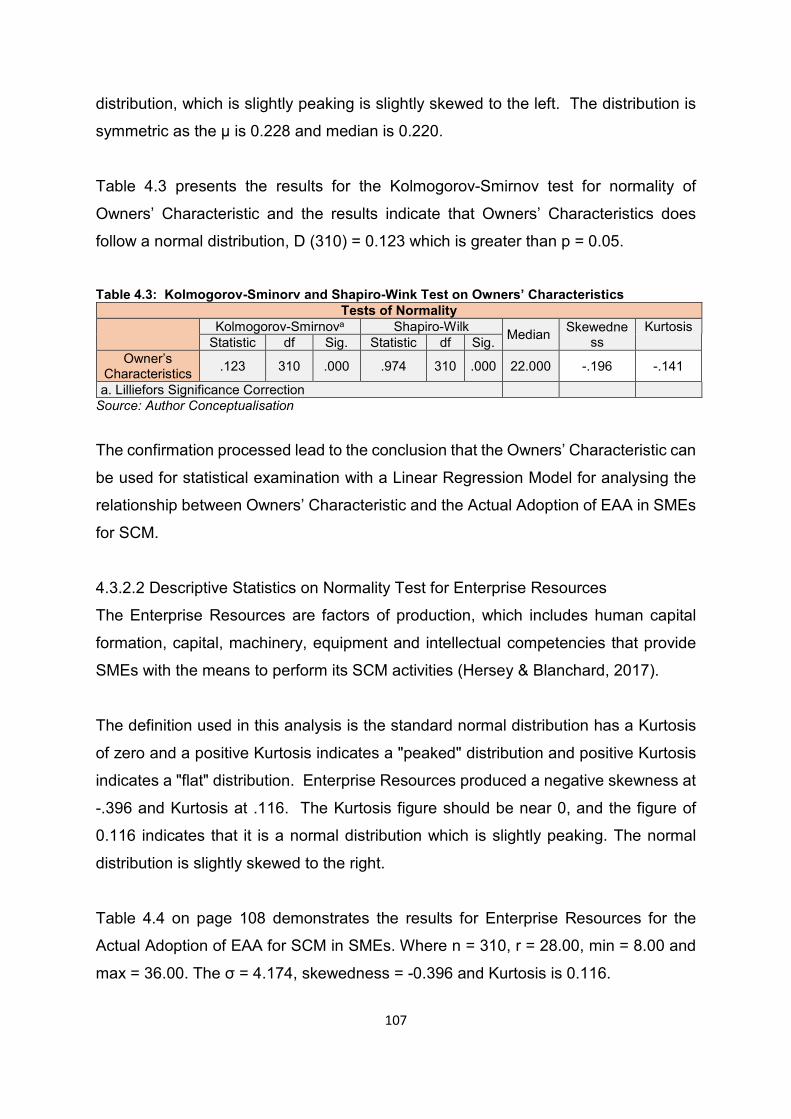
107
distribution, which is slightly peaking is slightly skewed to the left. The distribution is
symmetric as the μ is 0.228 and median is 0.220.
Table 4.3 presents the results for the Kolmogorov-Smirnov test for normality of
Owners’ Characteristic and the results indicate that Owners’ Characteristics does
follow a normal distribution, D (310) = 0.123 which is greater than p = 0.05.
Table 4.3: Kolmogorov-Sminorv and Shapiro-Wink Test on Owners’ Characteristics
Tests of Normality
Kolmogorov-Smirnova Shapiro-Wilk Median Skewedness
Kurtosis Statistic df Sig. Statistic df Sig.
Owner’s Characteristics .123 310 .000 .974 310 .000 22.000 -.196 -.141
a. Lilliefors Significance Correction Source: Author Conceptualisation
The confirmation processed lead to the conclusion that the Owners’ Characteristic can
be used for statistical examination with a Linear Regression Model for analysing the
relationship between Owners’ Characteristic and the Actual Adoption of EAA in SMEs
for SCM.
4.3.2.2 Descriptive Statistics on Normality Test for Enterprise Resources
The Enterprise Resources are factors of production, which includes human capital
formation, capital, machinery, equipment and intellectual competencies that provide
SMEs with the means to perform its SCM activities (Hersey & Blanchard, 2017).
The definition used in this analysis is the standard normal distribution has a Kurtosis
of zero and a positive Kurtosis indicates a "peaked" distribution and positive Kurtosis
indicates a "flat" distribution. Enterprise Resources produced a negative skewness at
-.396 and Kurtosis at .116. The Kurtosis figure should be near 0, and the figure of
0.116 indicates that it is a normal distribution which is slightly peaking. The normal
distribution is slightly skewed to the right.
Table 4.4 on page 108 demonstrates the results for Enterprise Resources for the
Actual Adoption of EAA for SCM in SMEs. Where n = 310, r = 28.00, min = 8.00 and
max = 36.00. The σ = 4.174, skewedness = -0.396 and Kurtosis is 0.116.
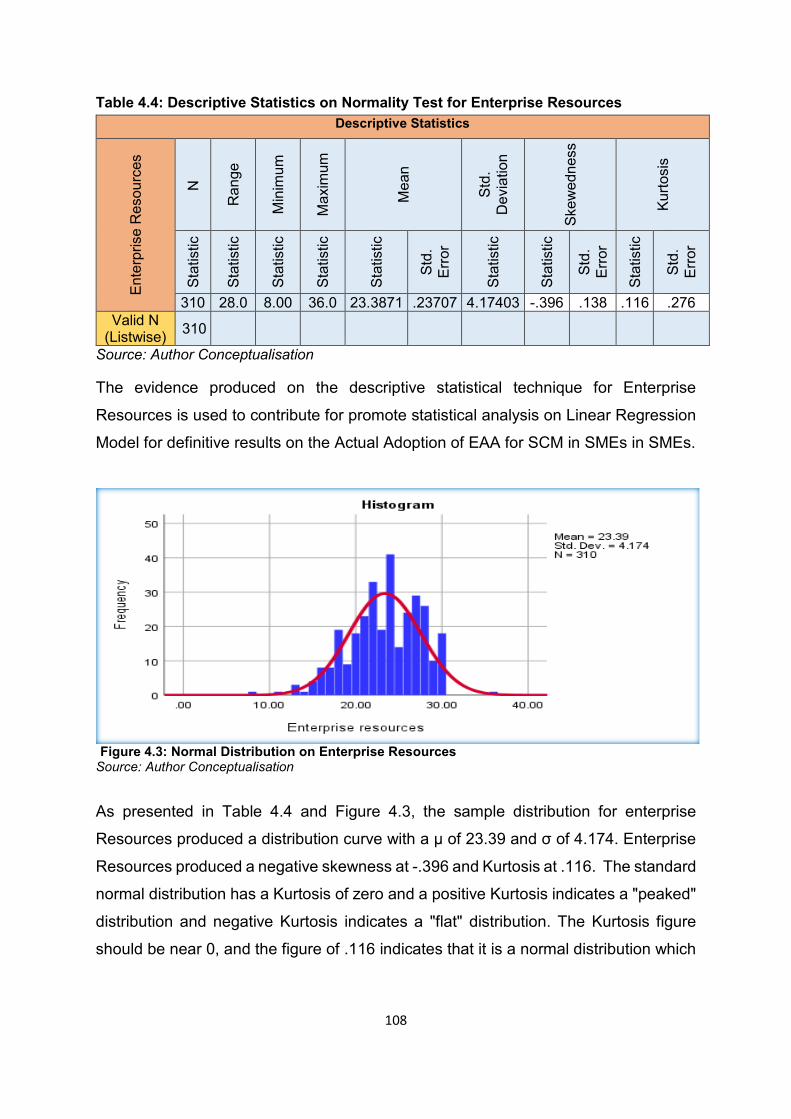
108
Table 4.4: Descriptive Statistics on Normality Test for Enterprise Resources
Source: Author Conceptualisation The evidence produced on the descriptive statistical technique for Enterprise
Resources is used to contribute for promote statistical analysis on Linear Regression
Model for definitive results on the Actual Adoption of EAA for SCM in SMEs in SMEs.
Figure 4.3: Normal Distribution on Enterprise Resources Source: Author Conceptualisation
As presented in Table 4.4 and Figure 4.3, the sample distribution for enterprise
Resources produced a distribution curve with a μ of 23.39 and σ of 4.174. Enterprise
Resources produced a negative skewness at -.396 and Kurtosis at .116. The standard
normal distribution has a Kurtosis of zero and a positive Kurtosis indicates a "peaked"
distribution and negative Kurtosis indicates a "flat" distribution. The Kurtosis figure
should be near 0, and the figure of .116 indicates that it is a normal distribution which
Descriptive Statistics En
terp
rise
Res
ourc
es
N
Ran
ge
Min
imum
Max
imum
Mea
n
Std.
D
evia
tion
Skew
edne
ss
Kurto
sis
Stat
istic
Stat
istic
Stat
istic
Stat
istic
Stat
istic
Std.
Er
ror
Stat
istic
Stat
istic
Std.
Er
ror
Stat
istic
Std.
Er
ror
310 28.0 8.00 36.0 23.3871 .23707 4.17403 -.396 .138 .116 .276 Valid N
(Listwise) 310
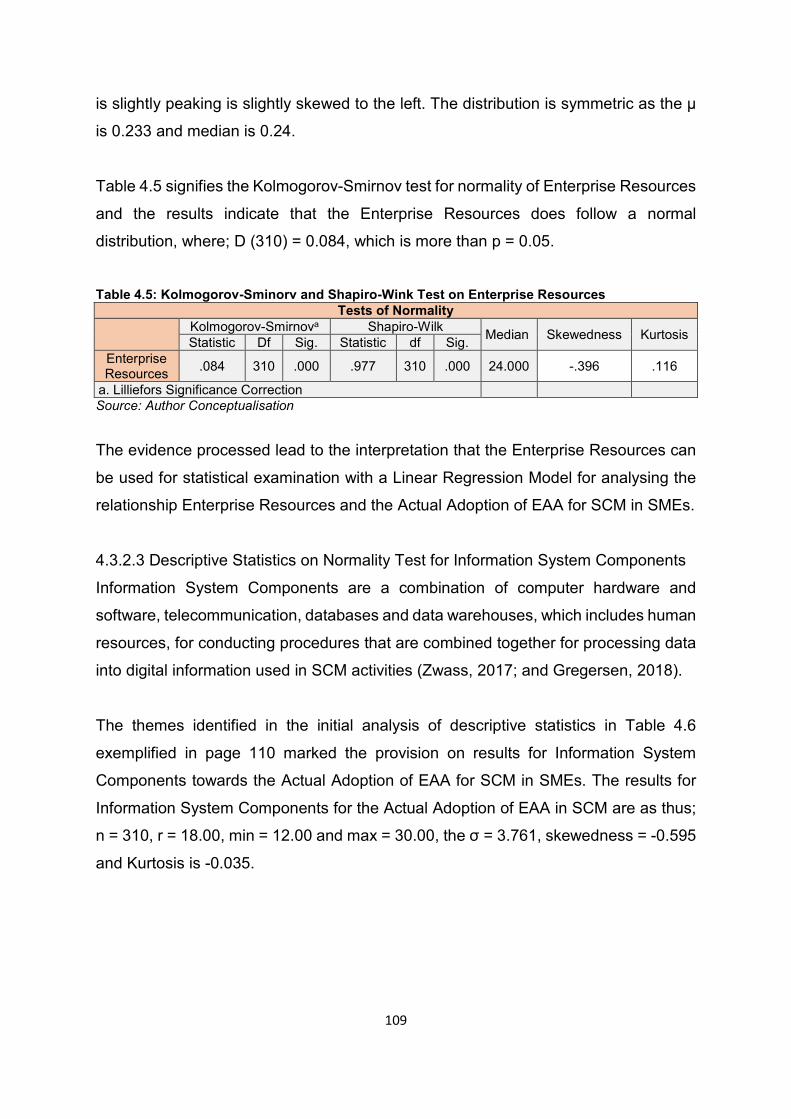
109
is slightly peaking is slightly skewed to the left. The distribution is symmetric as the μ
is 0.233 and median is 0.24.
Table 4.5 signifies the Kolmogorov-Smirnov test for normality of Enterprise Resources
and the results indicate that the Enterprise Resources does follow a normal
distribution, where; D (310) = 0.084, which is more than p = 0.05.
Table 4.5: Kolmogorov-Sminorv and Shapiro-Wink Test on Enterprise Resources
Tests of Normality
Kolmogorov-Smirnova Shapiro-Wilk Median Skewedness Kurtosis Statistic Df Sig. Statistic df Sig. Enterprise Resources .084 310 .000 .977 310 .000 24.000 -.396 .116
a. Lilliefors Significance Correction Source: Author Conceptualisation
The evidence processed lead to the interpretation that the Enterprise Resources can
be used for statistical examination with a Linear Regression Model for analysing the
relationship Enterprise Resources and the Actual Adoption of EAA for SCM in SMEs.
4.3.2.3 Descriptive Statistics on Normality Test for Information System Components
Information System Components are a combination of computer hardware and
software, telecommunication, databases and data warehouses, which includes human
resources, for conducting procedures that are combined together for processing data
into digital information used in SCM activities (Zwass, 2017; and Gregersen, 2018).
The themes identified in the initial analysis of descriptive statistics in Table 4.6
exemplified in page 110 marked the provision on results for Information System
Components towards the Actual Adoption of EAA for SCM in SMEs. The results for
Information System Components for the Actual Adoption of EAA in SCM are as thus;
n = 310, r = 18.00, min = 12.00 and max = 30.00, the σ = 3.761, skewedness = -0.595
and Kurtosis is -0.035.
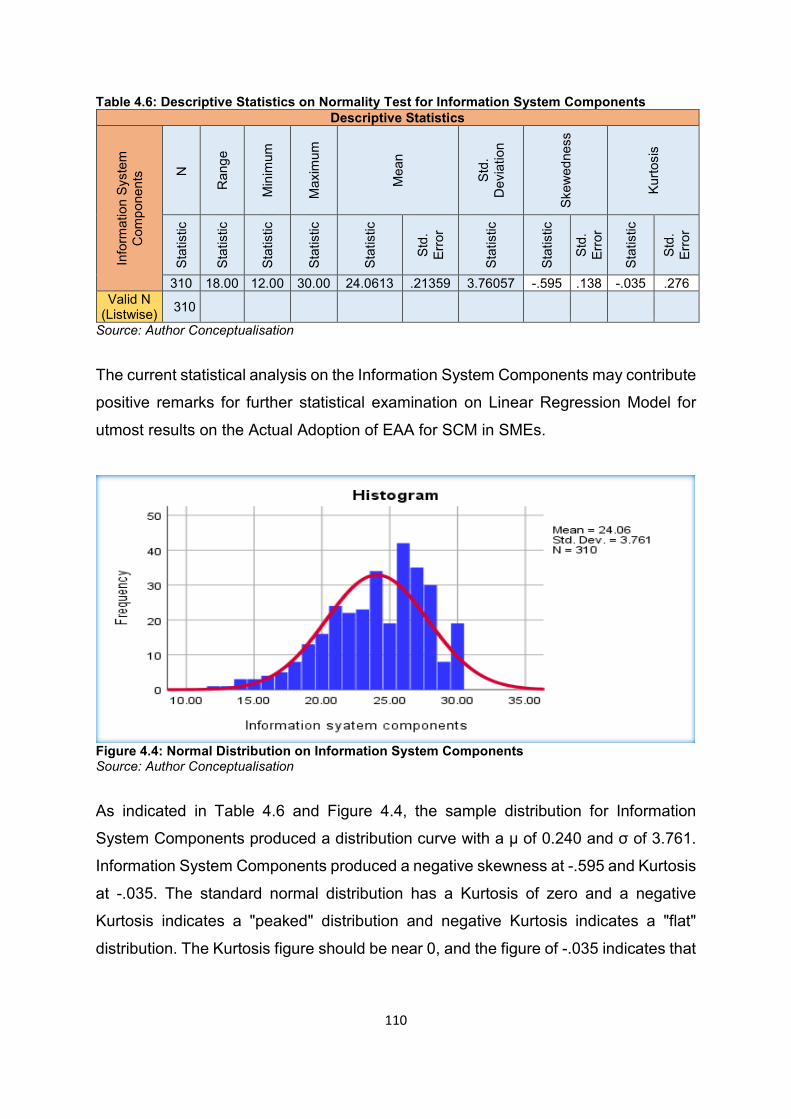
110
Table 4.6: Descriptive Statistics on Normality Test for Information System Components Descriptive Statistics
Info
rmat
ion
Syst
em
Com
pone
nts N
Ran
ge
Min
imum
Max
imum
Mea
n
Std.
D
evia
tion
Skew
edne
ss
Kurto
sis
Stat
istic
Stat
istic
Stat
istic
Stat
istic
Stat
istic
Std.
Er
ror
Stat
istic
Stat
istic
Std.
Er
ror
Stat
istic
Std.
Er
ror
310 18.00 12.00 30.00 24.0613 .21359 3.76057 -.595 .138 -.035 .276 Valid N
(Listwise) 310 Source: Author Conceptualisation
The current statistical analysis on the Information System Components may contribute
positive remarks for further statistical examination on Linear Regression Model for
utmost results on the Actual Adoption of EAA for SCM in SMEs.
Figure 4.4: Normal Distribution on Information System Components Source: Author Conceptualisation
As indicated in Table 4.6 and Figure 4.4, the sample distribution for Information
System Components produced a distribution curve with a μ of 0.240 and σ of 3.761.
Information System Components produced a negative skewness at -.595 and Kurtosis
at -.035. The standard normal distribution has a Kurtosis of zero and a negative
Kurtosis indicates a "peaked" distribution and negative Kurtosis indicates a "flat"
distribution. The Kurtosis figure should be near 0, and the figure of -.035 indicates that
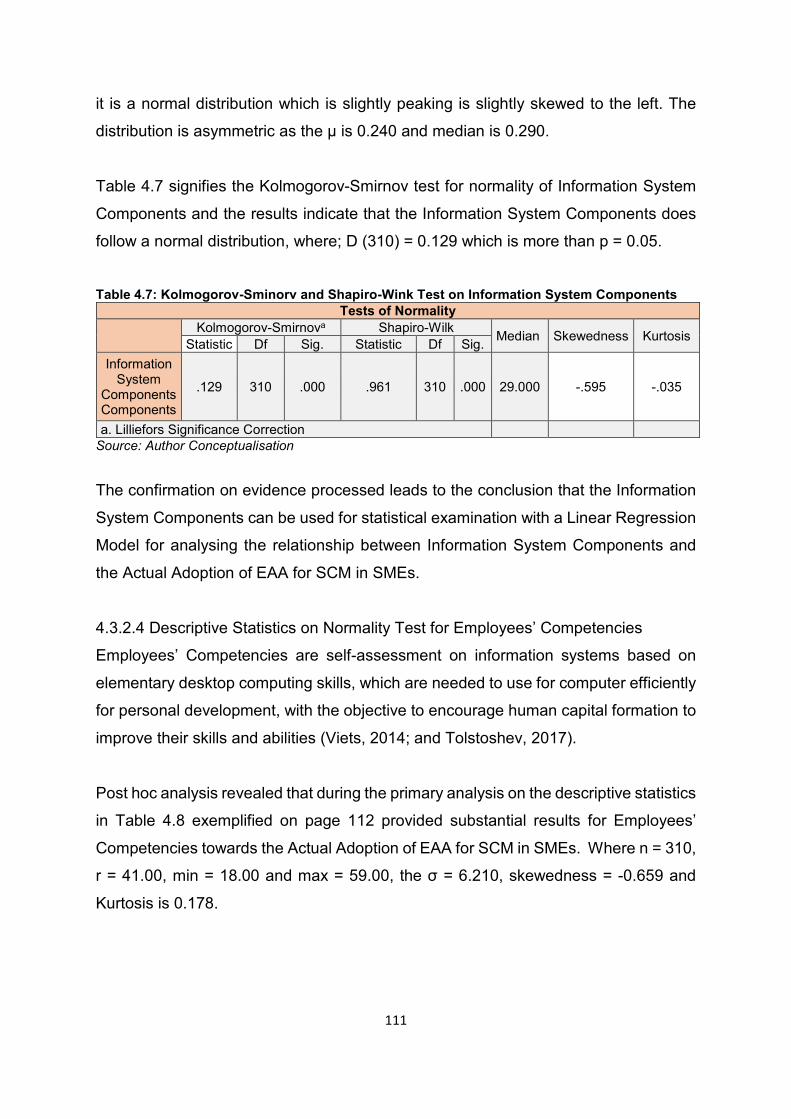
111
it is a normal distribution which is slightly peaking is slightly skewed to the left. The
distribution is asymmetric as the μ is 0.240 and median is 0.290.
Table 4.7 signifies the Kolmogorov-Smirnov test for normality of Information System
Components and the results indicate that the Information System Components does
follow a normal distribution, where; D (310) = 0.129 which is more than p = 0.05.
Table 4.7: Kolmogorov-Sminorv and Shapiro-Wink Test on Information System Components
Tests of Normality
Kolmogorov-Smirnova Shapiro-Wilk Median Skewedness Kurtosis Statistic Df Sig. Statistic Df Sig. Information
System Components Components
.129 310 .000 .961 310 .000 29.000 -.595 -.035
a. Lilliefors Significance Correction Source: Author Conceptualisation
The confirmation on evidence processed leads to the conclusion that the Information
System Components can be used for statistical examination with a Linear Regression
Model for analysing the relationship between Information System Components and
the Actual Adoption of EAA for SCM in SMEs.
4.3.2.4 Descriptive Statistics on Normality Test for Employees’ Competencies
Employees’ Competencies are self-assessment on information systems based on
elementary desktop computing skills, which are needed to use for computer efficiently
for personal development, with the objective to encourage human capital formation to
improve their skills and abilities (Viets, 2014; and Tolstoshev, 2017).
Post hoc analysis revealed that during the primary analysis on the descriptive statistics
in Table 4.8 exemplified on page 112 provided substantial results for Employees’
Competencies towards the Actual Adoption of EAA for SCM in SMEs. Where n = 310,
r = 41.00, min = 18.00 and max = 59.00, the σ = 6.210, skewedness = -0.659 and
Kurtosis is 0.178.

112
Table 4.8: Descriptive Statistics on Normality Test for Employees’ Competencies Descriptive Statistics
Empl
oyee
s’
Com
pete
ncie
s N
Ran
ge
Min
imum
Max
imum
Mea
n
Std.
D
evia
tion
Skew
edne
ss
Kurto
sis
Stat
istic
Stat
istic
Stat
istic
Stat
istic
Stat
istic
Std.
Er
ror
Stat
istic
Stat
istic
Std.
Er
ror
Stat
istic
Std.
Er
ror
310 41.00 18.00 59.00 40.9452 .35276 6.21098 -.659 .138 .178 .276 Valid N
(Listwise) 310 Source: Author Conceptualisation
The current statistical analysis on Employees’ Competencies may contribute positive
remarks for further statistical examination on Linear Regression Model for utmost
results on the Actual Adoption of EAA for SCM in SMEs.
Figure 4.5: Normal Distribution on Employees’ Competencies Source: Author Conceptualisation
As illustrated in Table 4.8 and Figure 4.5, the sample distribution for Employees’
Competencies produced a distribution curve with a μ of 40.95 and σ of 6.211.
Employees’ Competencies produced a positive skewness at -.695 and Kurtosis at
.178. The standard normal distribution has a Kurtosis of zero and a positive Kurtosis
indicates a "peaked" distribution and negative Kurtosis indicates a "peak" distribution.
The Kurtosis figure should be near 0, and the figure of .178 indicates that it is a normal
distribution which is slightly peaking is slightly skewed to the left. The distribution is
symmetric as the μ is 0.409 and median is 0.430.
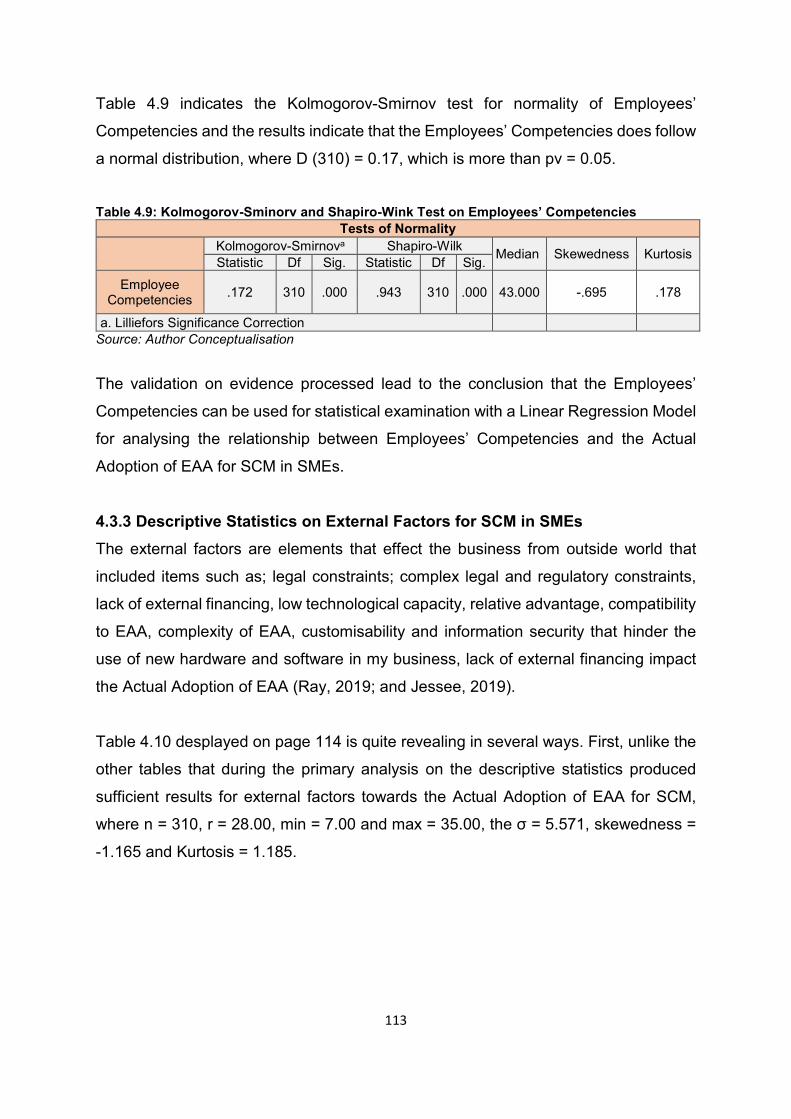
113
Table 4.9 indicates the Kolmogorov-Smirnov test for normality of Employees’
Competencies and the results indicate that the Employees’ Competencies does follow
a normal distribution, where D (310) = 0.17, which is more than pv = 0.05.
Table 4.9: Kolmogorov-Sminorv and Shapiro-Wink Test on Employees’ Competencies
Tests of Normality
Kolmogorov-Smirnova Shapiro-Wilk Median Skewedness Kurtosis Statistic Df Sig. Statistic Df Sig. Employee
Competencies .172 310 .000 .943 310 .000 43.000 -.695 .178
a. Lilliefors Significance Correction Source: Author Conceptualisation
The validation on evidence processed lead to the conclusion that the Employees’
Competencies can be used for statistical examination with a Linear Regression Model
for analysing the relationship between Employees’ Competencies and the Actual
Adoption of EAA for SCM in SMEs.
4.3.3 Descriptive Statistics on External Factors for SCM in SMEs The external factors are elements that effect the business from outside world that
included items such as; legal constraints; complex legal and regulatory constraints,
lack of external financing, low technological capacity, relative advantage, compatibility
to EAA, complexity of EAA, customisability and information security that hinder the
use of new hardware and software in my business, lack of external financing impact
the Actual Adoption of EAA (Ray, 2019; and Jessee, 2019).
Table 4.10 desplayed on page 114 is quite revealing in several ways. First, unlike the
other tables that during the primary analysis on the descriptive statistics produced
sufficient results for external factors towards the Actual Adoption of EAA for SCM,
where n = 310, r = 28.00, min = 7.00 and max = 35.00, the σ = 5.571, skewedness =
-1.165 and Kurtosis = 1.185.
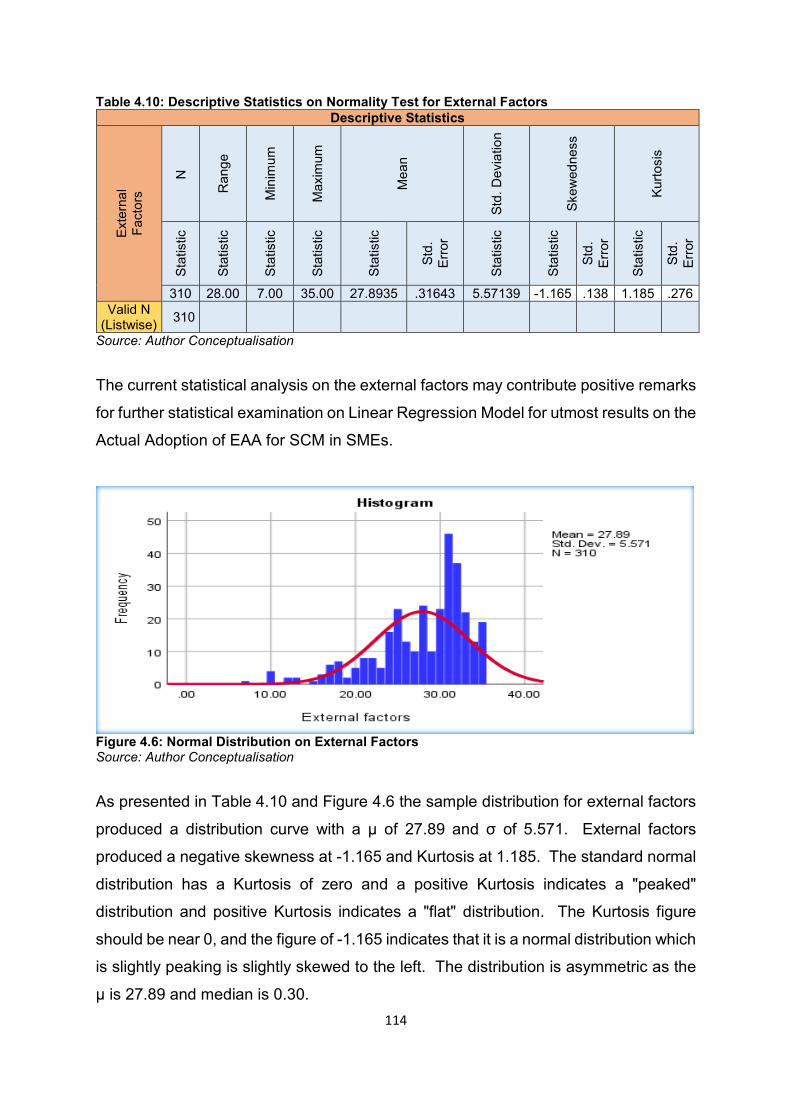
114
Table 4.10: Descriptive Statistics on Normality Test for External Factors Descriptive Statistics
Exte
rnal
Fa
ctor
s
N
Ran
ge
Min
imum
Max
imum
Mea
n
Std.
Dev
iatio
n
Skew
edne
ss
Kurto
sis
Stat
istic
Stat
istic
Stat
istic
Stat
istic
Stat
istic
Std.
Er
ror
Stat
istic
Stat
istic
Std.
Er
ror
Stat
istic
Std.
Er
ror
310 28.00 7.00 35.00 27.8935 .31643 5.57139 -1.165 .138 1.185 .276 Valid N
(Listwise) 310 Source: Author Conceptualisation
The current statistical analysis on the external factors may contribute positive remarks
for further statistical examination on Linear Regression Model for utmost results on the
Actual Adoption of EAA for SCM in SMEs.
Figure 4.6: Normal Distribution on External Factors Source: Author Conceptualisation
As presented in Table 4.10 and Figure 4.6 the sample distribution for external factors
produced a distribution curve with a μ of 27.89 and σ of 5.571. External factors
produced a negative skewness at -1.165 and Kurtosis at 1.185. The standard normal
distribution has a Kurtosis of zero and a positive Kurtosis indicates a "peaked"
distribution and positive Kurtosis indicates a "flat" distribution. The Kurtosis figure
should be near 0, and the figure of -1.165 indicates that it is a normal distribution which
is slightly peaking is slightly skewed to the left. The distribution is asymmetric as the
μ is 27.89 and median is 0.30.
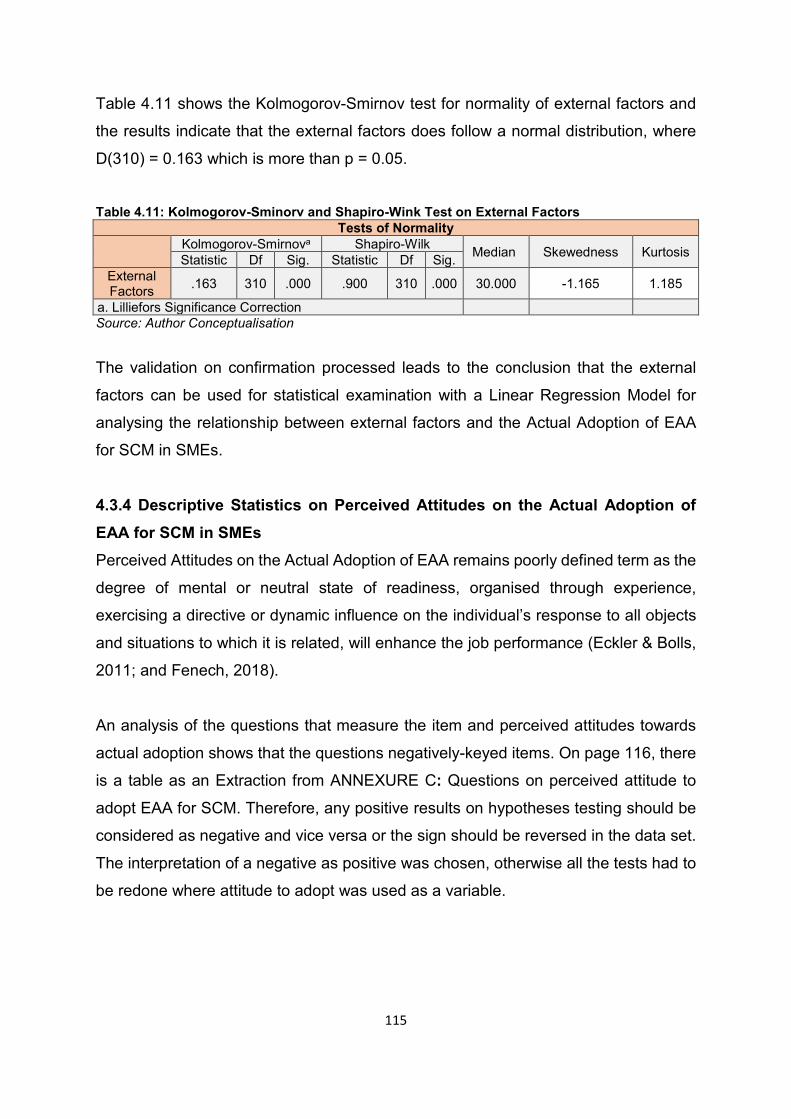
115
Table 4.11 shows the Kolmogorov-Smirnov test for normality of external factors and
the results indicate that the external factors does follow a normal distribution, where
D(310) = 0.163 which is more than p = 0.05.
Table 4.11: Kolmogorov-Sminorv and Shapiro-Wink Test on External Factors
Tests of Normality
Kolmogorov-Smirnova Shapiro-Wilk Median Skewedness Kurtosis Statistic Df Sig. Statistic Df Sig. External Factors .163 310 .000 .900 310 .000 30.000 -1.165 1.185
a. Lilliefors Significance Correction Source: Author Conceptualisation
The validation on confirmation processed leads to the conclusion that the external
factors can be used for statistical examination with a Linear Regression Model for
analysing the relationship between external factors and the Actual Adoption of EAA
for SCM in SMEs.
4.3.4 Descriptive Statistics on Perceived Attitudes on the Actual Adoption of EAA for SCM in SMEs Perceived Attitudes on the Actual Adoption of EAA remains poorly defined term as the
degree of mental or neutral state of readiness, organised through experience,
exercising a directive or dynamic influence on the individual’s response to all objects
and situations to which it is related, will enhance the job performance (Eckler & Bolls,
2011; and Fenech, 2018).
An analysis of the questions that measure the item and perceived attitudes towards
actual adoption shows that the questions negatively-keyed items. On page 116, there
is a table as an Extraction from ANNEXURE C: Questions on perceived attitude to
adopt EAA for SCM. Therefore, any positive results on hypotheses testing should be
considered as negative and vice versa or the sign should be reversed in the data set.
The interpretation of a negative as positive was chosen, otherwise all the tests had to
be redone where attitude to adopt was used as a variable.
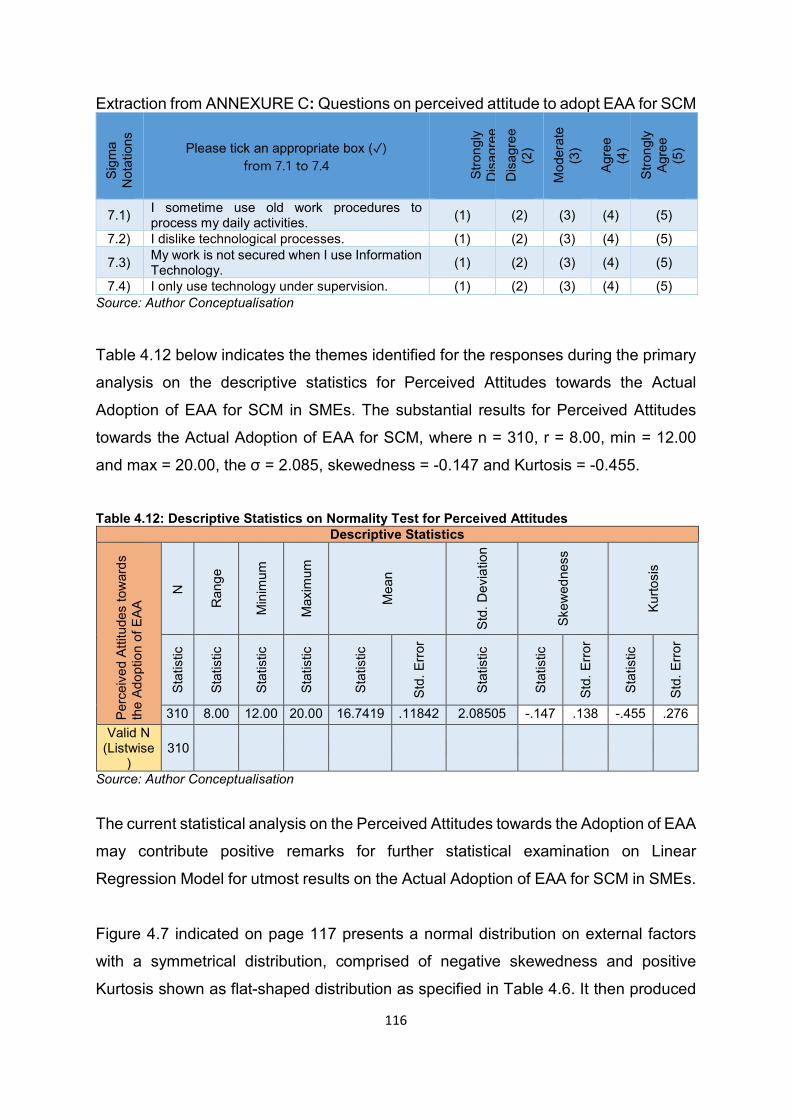
116
Extraction from ANNEXURE C: Questions on perceived attitude to adopt EAA for SCM Si
gma
Not
atio
ns
Please tick an appropriate box (✓) from 7.1 to 7.4
St
rong
ly
Dis
agre
e
Dis
agre
e (2
)
Mod
erat
e (3
)
Agre
e (4
)
Stro
ngly
Ag
ree
(5)
7.1) I sometime use old work procedures to process my daily activities. (1) (2) (3) (4) (5)
7.2) I dislike technological processes. (1) (2) (3) (4) (5)
7.3) My work is not secured when I use Information Technology. (1) (2) (3) (4) (5)
7.4) I only use technology under supervision. (1) (2) (3) (4) (5) Source: Author Conceptualisation
Table 4.12 below indicates the themes identified for the responses during the primary
analysis on the descriptive statistics for Perceived Attitudes towards the Actual
Adoption of EAA for SCM in SMEs. The substantial results for Perceived Attitudes
towards the Actual Adoption of EAA for SCM, where n = 310, r = 8.00, min = 12.00
and max = 20.00, the σ = 2.085, skewedness = -0.147 and Kurtosis = -0.455.
Table 4.12: Descriptive Statistics on Normality Test for Perceived Attitudes
Descriptive Statistics
Perc
eive
d At
titud
es to
war
ds
the
Adop
tion
of E
AA N
Ran
ge
Min
imum
Max
imum
Mea
n
Std.
Dev
iatio
n
Skew
edne
ss
Kurto
sis
Stat
istic
Stat
istic
Stat
istic
Stat
istic
Stat
istic
Std.
Erro
r
Stat
istic
Stat
istic
Std.
Erro
r
Stat
istic
Std.
Erro
r
310 8.00 12.00 20.00 16.7419 .11842 2.08505 -.147 .138 -.455 .276 Valid N
(Listwise)
310
Source: Author Conceptualisation
The current statistical analysis on the Perceived Attitudes towards the Adoption of EAA
may contribute positive remarks for further statistical examination on Linear
Regression Model for utmost results on the Actual Adoption of EAA for SCM in SMEs.
Figure 4.7 indicated on page 117 presents a normal distribution on external factors
with a symmetrical distribution, comprised of negative skewedness and positive
Kurtosis shown as flat-shaped distribution as specified in Table 4.6. It then produced
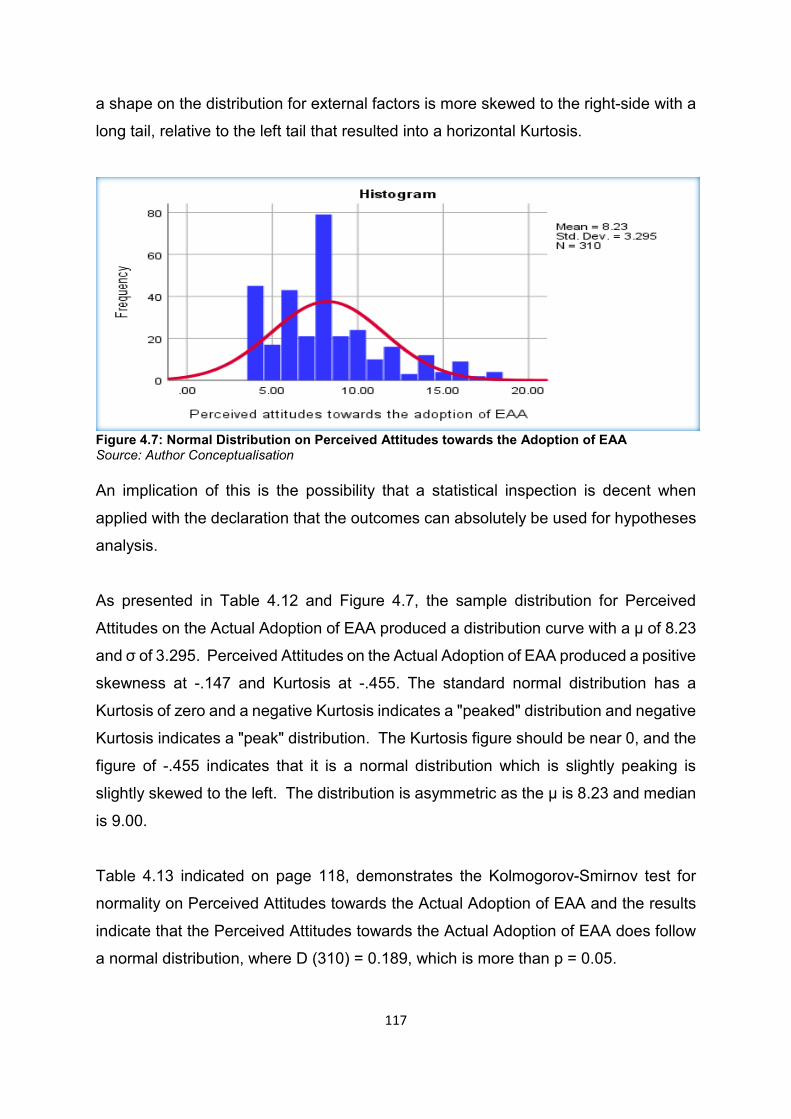
117
a shape on the distribution for external factors is more skewed to the right-side with a
long tail, relative to the left tail that resulted into a horizontal Kurtosis.
Figure 4.7: Normal Distribution on Perceived Attitudes towards the Adoption of EAA Source: Author Conceptualisation An implication of this is the possibility that a statistical inspection is decent when
applied with the declaration that the outcomes can absolutely be used for hypotheses
analysis.
As presented in Table 4.12 and Figure 4.7, the sample distribution for Perceived
Attitudes on the Actual Adoption of EAA produced a distribution curve with a μ of 8.23
and σ of 3.295. Perceived Attitudes on the Actual Adoption of EAA produced a positive
skewness at -.147 and Kurtosis at -.455. The standard normal distribution has a
Kurtosis of zero and a negative Kurtosis indicates a "peaked" distribution and negative
Kurtosis indicates a "peak" distribution. The Kurtosis figure should be near 0, and the
figure of -.455 indicates that it is a normal distribution which is slightly peaking is
slightly skewed to the left. The distribution is asymmetric as the μ is 8.23 and median
is 9.00.
Table 4.13 indicated on page 118, demonstrates the Kolmogorov-Smirnov test for
normality on Perceived Attitudes towards the Actual Adoption of EAA and the results
indicate that the Perceived Attitudes towards the Actual Adoption of EAA does follow
a normal distribution, where D (310) = 0.189, which is more than p = 0.05.
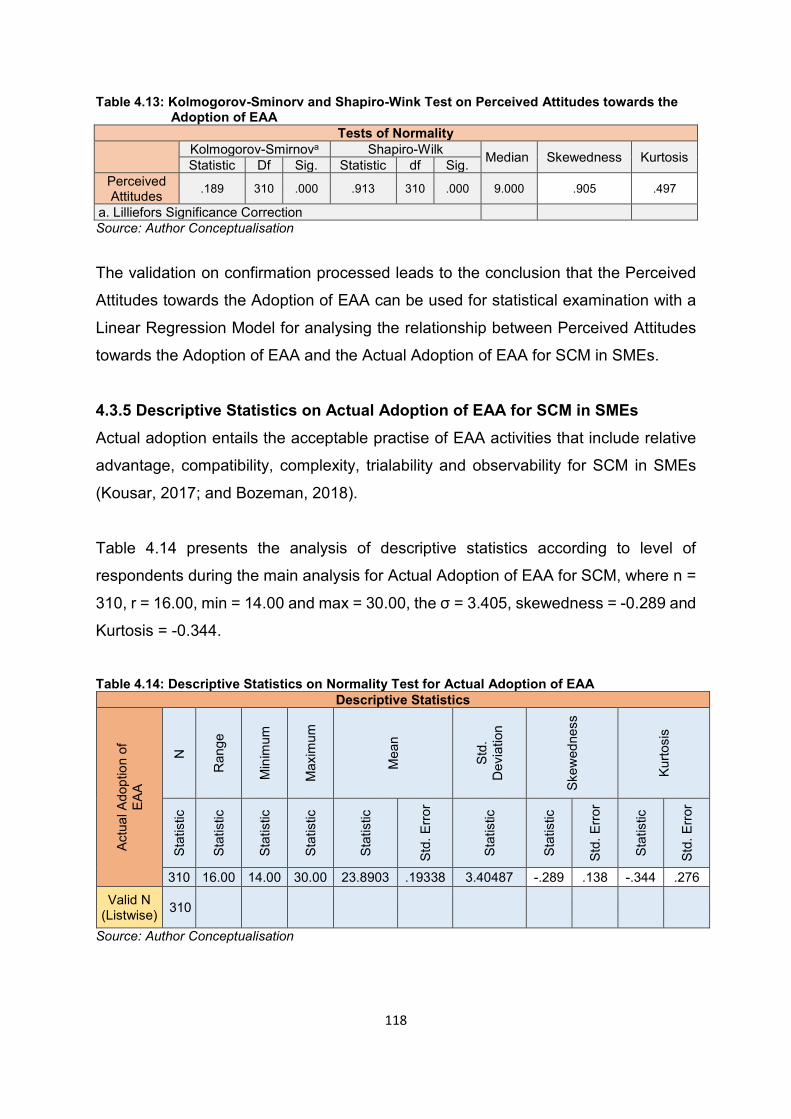
118
Table 4.13: Kolmogorov-Sminorv and Shapiro-Wink Test on Perceived Attitudes towards the Adoption of EAA
Tests of Normality
Kolmogorov-Smirnova Shapiro-Wilk Median Skewedness Kurtosis Statistic Df Sig. Statistic df Sig. Perceived Attitudes .189 310 .000 .913 310 .000 9.000 .905 .497
a. Lilliefors Significance Correction Source: Author Conceptualisation
The validation on confirmation processed leads to the conclusion that the Perceived
Attitudes towards the Adoption of EAA can be used for statistical examination with a
Linear Regression Model for analysing the relationship between Perceived Attitudes
towards the Adoption of EAA and the Actual Adoption of EAA for SCM in SMEs.
4.3.5 Descriptive Statistics on Actual Adoption of EAA for SCM in SMEs Actual adoption entails the acceptable practise of EAA activities that include relative
advantage, compatibility, complexity, trialability and observability for SCM in SMEs
(Kousar, 2017; and Bozeman, 2018).
Table 4.14 presents the analysis of descriptive statistics according to level of
respondents during the main analysis for Actual Adoption of EAA for SCM, where n =
310, r = 16.00, min = 14.00 and max = 30.00, the σ = 3.405, skewedness = -0.289 and
Kurtosis = -0.344.
Table 4.14: Descriptive Statistics on Normality Test for Actual Adoption of EAA
Descriptive Statistics
Actu
al A
dopt
ion
of
EAA
N
Ran
ge
Min
imum
Max
imum
Mea
n
Std.
D
evia
tion
Skew
edne
ss
Kurto
sis
Stat
istic
Stat
istic
Stat
istic
Stat
istic
Stat
istic
Std.
Erro
r
Stat
istic
Stat
istic
Std.
Erro
r
Stat
istic
Std.
Erro
r
310 16.00 14.00 30.00 23.8903 .19338 3.40487 -.289 .138 -.344 .276 Valid N
(Listwise) 310
Source: Author Conceptualisation
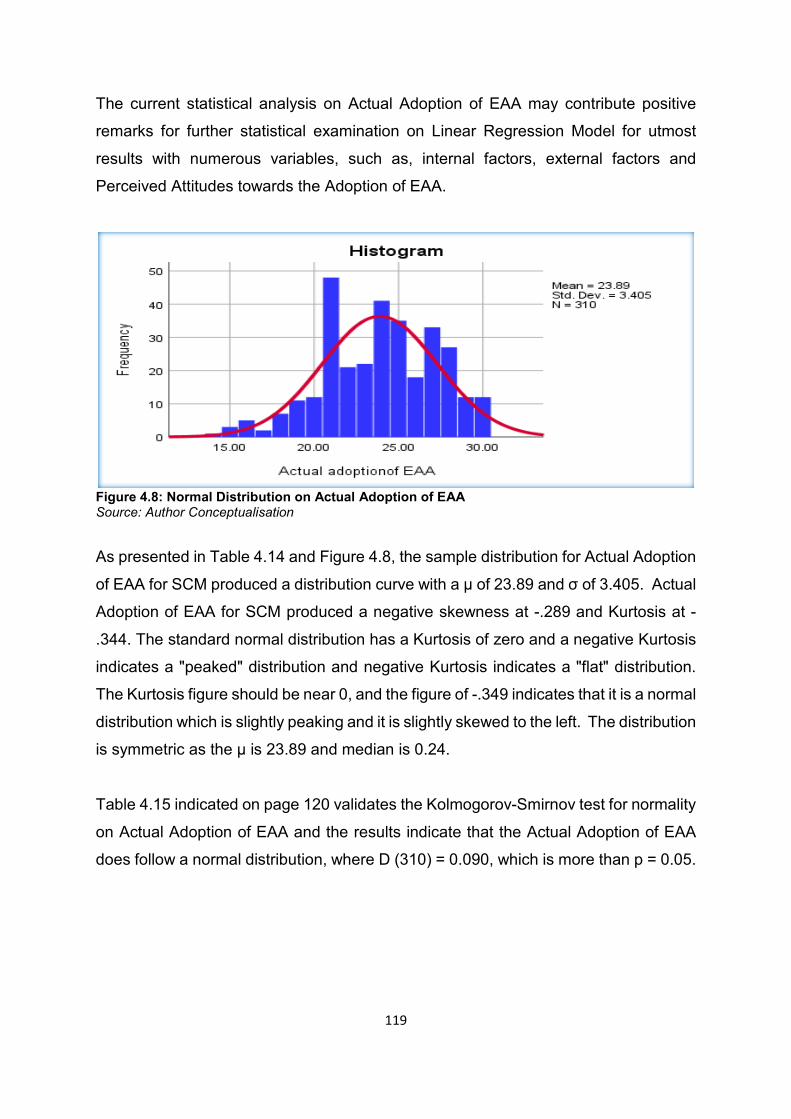
119
The current statistical analysis on Actual Adoption of EAA may contribute positive
remarks for further statistical examination on Linear Regression Model for utmost
results with numerous variables, such as, internal factors, external factors and
Perceived Attitudes towards the Adoption of EAA.
Figure 4.8: Normal Distribution on Actual Adoption of EAA Source: Author Conceptualisation
As presented in Table 4.14 and Figure 4.8, the sample distribution for Actual Adoption
of EAA for SCM produced a distribution curve with a μ of 23.89 and σ of 3.405. Actual
Adoption of EAA for SCM produced a negative skewness at -.289 and Kurtosis at -
.344. The standard normal distribution has a Kurtosis of zero and a negative Kurtosis
indicates a "peaked" distribution and negative Kurtosis indicates a "flat" distribution.
The Kurtosis figure should be near 0, and the figure of -.349 indicates that it is a normal
distribution which is slightly peaking and it is slightly skewed to the left. The distribution
is symmetric as the μ is 23.89 and median is 0.24.
Table 4.15 indicated on page 120 validates the Kolmogorov-Smirnov test for normality
on Actual Adoption of EAA and the results indicate that the Actual Adoption of EAA
does follow a normal distribution, where D (310) = 0.090, which is more than p = 0.05.
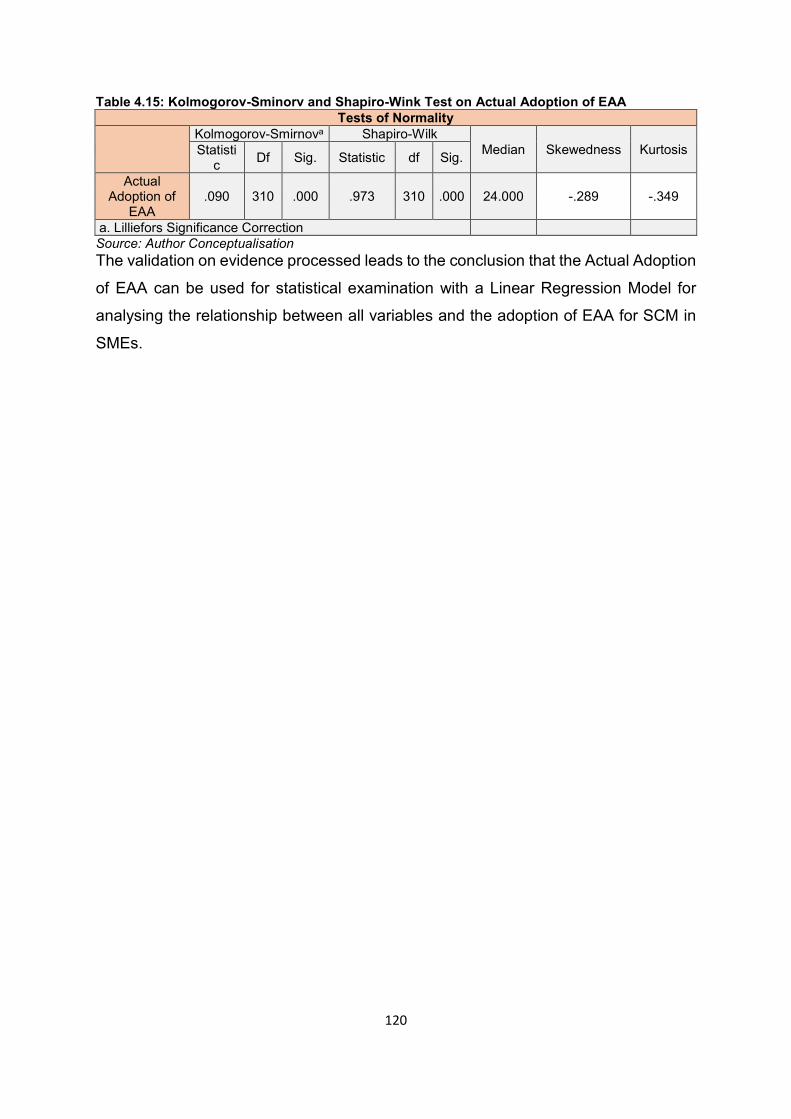
120
Table 4.15: Kolmogorov-Sminorv and Shapiro-Wink Test on Actual Adoption of EAA Tests of Normality
Kolmogorov-Smirnova Shapiro-Wilk
Median Skewedness Kurtosis Statistic Df Sig. Statistic df Sig.
Actual Adoption of
EAA .090 310 .000 .973 310 .000 24.000 -.289 -.349
a. Lilliefors Significance Correction Source: Author Conceptualisation The validation on evidence processed leads to the conclusion that the Actual Adoption
of EAA can be used for statistical examination with a Linear Regression Model for
analysing the relationship between all variables and the adoption of EAA for SCM in
SMEs.
121
SECTION B: RESULTS OF HYPOTHESES TESTING
4.4. Introduction This chapter presents the results of data analysis. This chapter is partitioned into two
sections: (a) Section A for reliability and validity analysis and testing for normality; and
(b) Section B for discussing the relationships among the variables in the conceptual
framework. In order to test the hypotheses, certain tests were done and the results
were presented in Section A. In this section, data analysis is presented. Firstly,
reliability of data was tested through the use of Cronbach’s Alpha. Secondly, the
Kolmogorov test were used to test if the distributions of the variables’ data represents
normal distributions were done. Thirdly, the mean, mode, median, the standard
deviation (σ) the minimum, maximum were calculated for each variable. None of the
items had to be removed for all Cronbach’s Alphas were in the acceptable range, that
is, above 0.80. The Kolmogorov-Smirnov diagnostic test for normality was used to
determine if the sample scores of the population follow the normal distribution. Overall, the sampled data were found to be suitable for further analysis to test the
hypotheses. Inferential statistics was used to analyse data if the relationships among
variables exist. The constructs were, namely, internal factors, external factors,
perceived attitude towards the adoption of EAA and Actual Adoption of EAA. The
internal Factors construct had four sub-variables Owners’ Characteristics, Enterprise
Resources, Information System Components and Employees’ Competencies.
The following tests were done:
The Pearson Correlation Coefficient was used to determine the strength of the
linear association between the constructs;
Analysis of Variance (ANOVA) is used for two reasons: (a) to determine
whether any differences at all axis, and (b) to ascertain the nature of the
difference;
The difference refers to the null hypotheses as the null hypotheses specifies
that there is no difference;
The Anova test is, therefore, used to either accept or not accept the null
hypotheses; and
A Linear Regression Model was then used to illustrate the relationship.
122
Last but not least, data were distributed thus: (a) symmetrical distribution occurs when
the values of variables occur at regular occurrences of which the mean, median and
mode take place on the same spot and produce a bell curve; and (b) asymmetric
distribution occurs when the values of variables take place at an irregular frequencies
where the mean, median and mode occur at different locations and the shape is like
a bell curve where both sides of the graph are symmetrical. At a later stage, the
Multinomial Logistic Regression is used between the dependent variables that are
equivalently categorical, of which five categories were used to ascertain the results for
all constructs on Pearson Correlation Coefficients, Analysis of Variance, Coefficients
and Linear Regressions.
4.5 Descriptive Statistics on Variables The alternative hypotheses stated that there is a positive relationship between internal
factors and Perceived Attitudes towards the Adoption of EAA for SCM in SMEs. This
was ascertained by testing four sub-hypotheses on Owners’ Characteristics,
Enterprise Resources, Information System Components and Employees’
Competencies.
4.5.1 Owners’ Characteristics and Perceived Attitudes towards the Adoption of EAA
for SCM in SMEs
4.5.1.1 Pearson Correlations on Owners’ Characteristics and Perceived Attitudes
towards Adoption of EAA for SCM
Table 4.16 illustrated on page 123, specifies the results on correlations between
Owners’ Characteristics and Perceived Attitudes towards the Actual Adoption of EAA.
The p-value is near zero at “˂.001” with the required value set at 0.05. In this regard,
the statistical method “ANOVA” is applied to test the hypotheses between the
dependent variable, namely, Perceived Attitudes towards the Actual Adoption of EAA
and independent variable, namely, Owners’ Characteristics discussed in Table 4.17.
Pearson Correlation Coefficient is .215, thus indicating that there is a positive
relationship between Owners’ Characteristics and Perceived Attitudes to the Actual
Adoption of EAA.
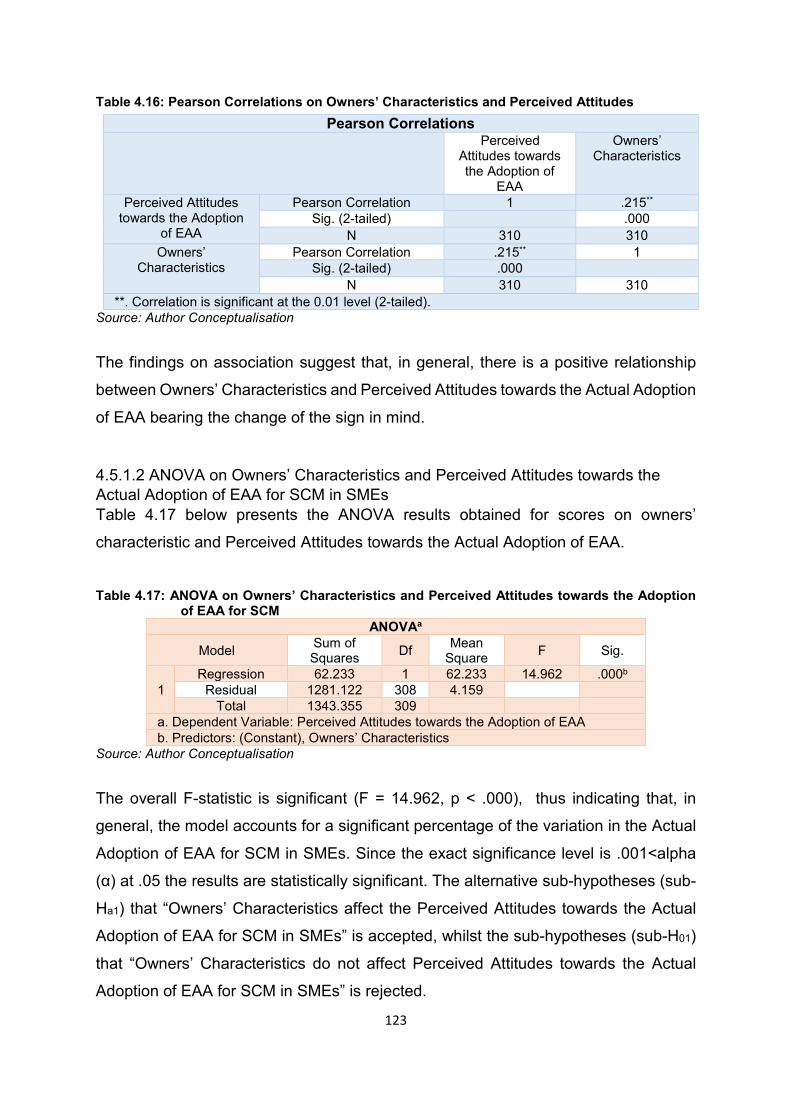
123
Table 4.16: Pearson Correlations on Owners’ Characteristics and Perceived Attitudes
Source: Author Conceptualisation
The findings on association suggest that, in general, there is a positive relationship
between Owners’ Characteristics and Perceived Attitudes towards the Actual Adoption
of EAA bearing the change of the sign in mind.
4.5.1.2 ANOVA on Owners’ Characteristics and Perceived Attitudes towards the Actual Adoption of EAA for SCM in SMEs Table 4.17 below presents the ANOVA results obtained for scores on owners’
characteristic and Perceived Attitudes towards the Actual Adoption of EAA.
Table 4.17: ANOVA on Owners’ Characteristics and Perceived Attitudes towards the Adoption
of EAA for SCM ANOVAa
Model Sum of Squares Df Mean
Square F Sig.
1 Regression 62.233 1 62.233 14.962 .000b
Residual 1281.122 308 4.159 Total 1343.355 309
a. Dependent Variable: Perceived Attitudes towards the Adoption of EAA b. Predictors: (Constant), Owners’ Characteristics
Source: Author Conceptualisation
The overall F-statistic is significant (F = 14.962, p ˂ .000), thus indicating that, in
general, the model accounts for a significant percentage of the variation in the Actual
Adoption of EAA for SCM in SMEs. Since the exact significance level is .001˂alpha
(α) at .05 the results are statistically significant. The alternative sub-hypotheses (sub-
Ha1) that “Owners’ Characteristics affect the Perceived Attitudes towards the Actual
Adoption of EAA for SCM in SMEs” is accepted, whilst the sub-hypotheses (sub-H01)
that “Owners’ Characteristics do not affect Perceived Attitudes towards the Actual
Adoption of EAA for SCM in SMEs” is rejected.
Pearson Correlations Perceived
Attitudes towards the Adoption of
EAA
Owners’ Characteristics
Perceived Attitudes towards the Adoption
of EAA
Pearson Correlation 1 .215** Sig. (2-tailed) .000
N 310 310 Owners’
Characteristics Pearson Correlation .215** 1
Sig. (2-tailed) .000 N 310 310
**. Correlation is significant at the 0.01 level (2-tailed).
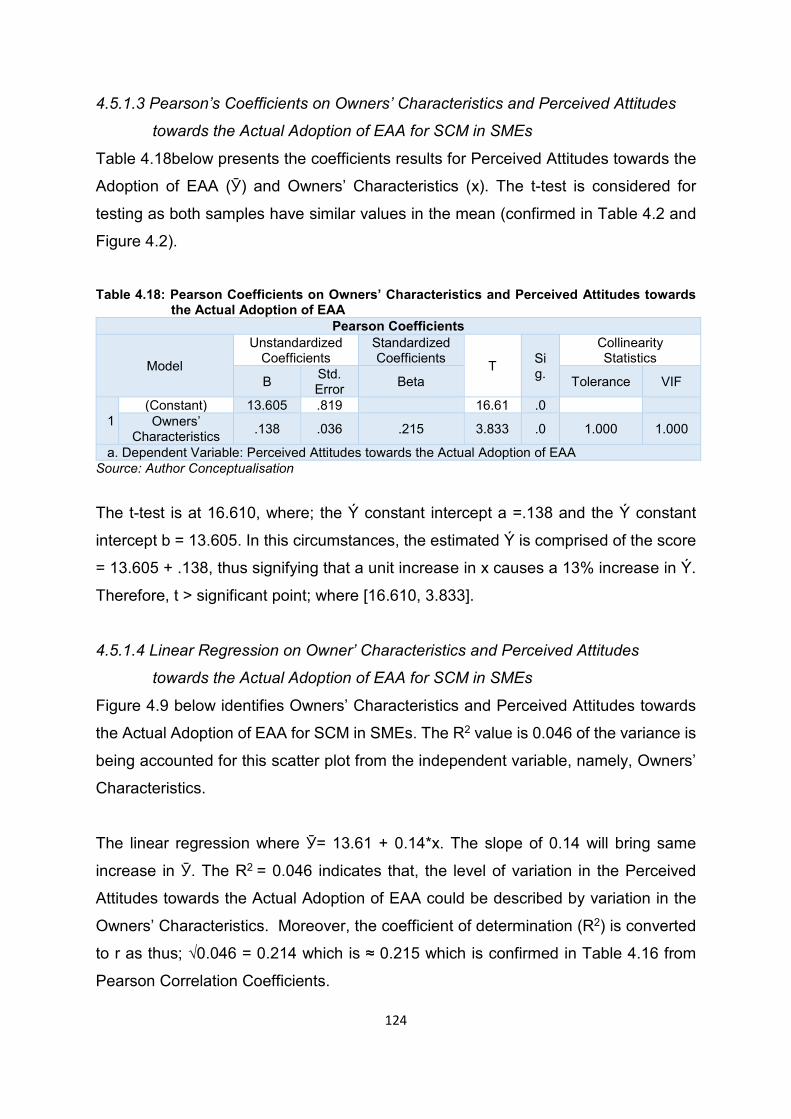
124
4.5.1.3 Pearson’s Coefficients on Owners’ Characteristics and Perceived Attitudes
towards the Actual Adoption of EAA for SCM in SMEs
Table 4.18below presents the coefficients results for Perceived Attitudes towards the
Adoption of EAA (Ӯ) and Owners’ Characteristics (x). The t-test is considered for
testing as both samples have similar values in the mean (confirmed in Table 4.2 and
Figure 4.2).
Table 4.18: Pearson Coefficients on Owners’ Characteristics and Perceived Attitudes towards
the Actual Adoption of EAA Pearson Coefficients
Model
Unstandardized Coefficients
Standardized Coefficients T Si
g.
Collinearity Statistics
B Std. Error Beta Tolerance VIF
1 (Constant) 13.605 .819 16.61 .0 Owners’
Characteristics .138 .036 .215 3.833 .0 1.000 1.000
a. Dependent Variable: Perceived Attitudes towards the Actual Adoption of EAA Source: Author Conceptualisation
The t-test is at 16.610, where; the Ý constant intercept a =.138 and the Ý constant
intercept b = 13.605. In this circumstances, the estimated Ý is comprised of the score
= 13.605 + .138, thus signifying that a unit increase in x causes a 13% increase in Ý.
Therefore, t ˃ significant point; where [16.610, 3.833].
4.5.1.4 Linear Regression on Owner’ Characteristics and Perceived Attitudes
towards the Actual Adoption of EAA for SCM in SMEs
Figure 4.9 below identifies Owners’ Characteristics and Perceived Attitudes towards
the Actual Adoption of EAA for SCM in SMEs. The R2 value is 0.046 of the variance is
being accounted for this scatter plot from the independent variable, namely, Owners’
Characteristics.
The linear regression where Ӯ= 13.61 + 0.14*x. The slope of 0.14 will bring same
increase in Ӯ. The R2 = 0.046 indicates that, the level of variation in the Perceived
Attitudes towards the Actual Adoption of EAA could be described by variation in the
Owners’ Characteristics. Moreover, the coefficient of determination (R2) is converted
to r as thus; √0.046 = 0.214 which is ≈ 0.215 which is confirmed in Table 4.16 from
Pearson Correlation Coefficients.
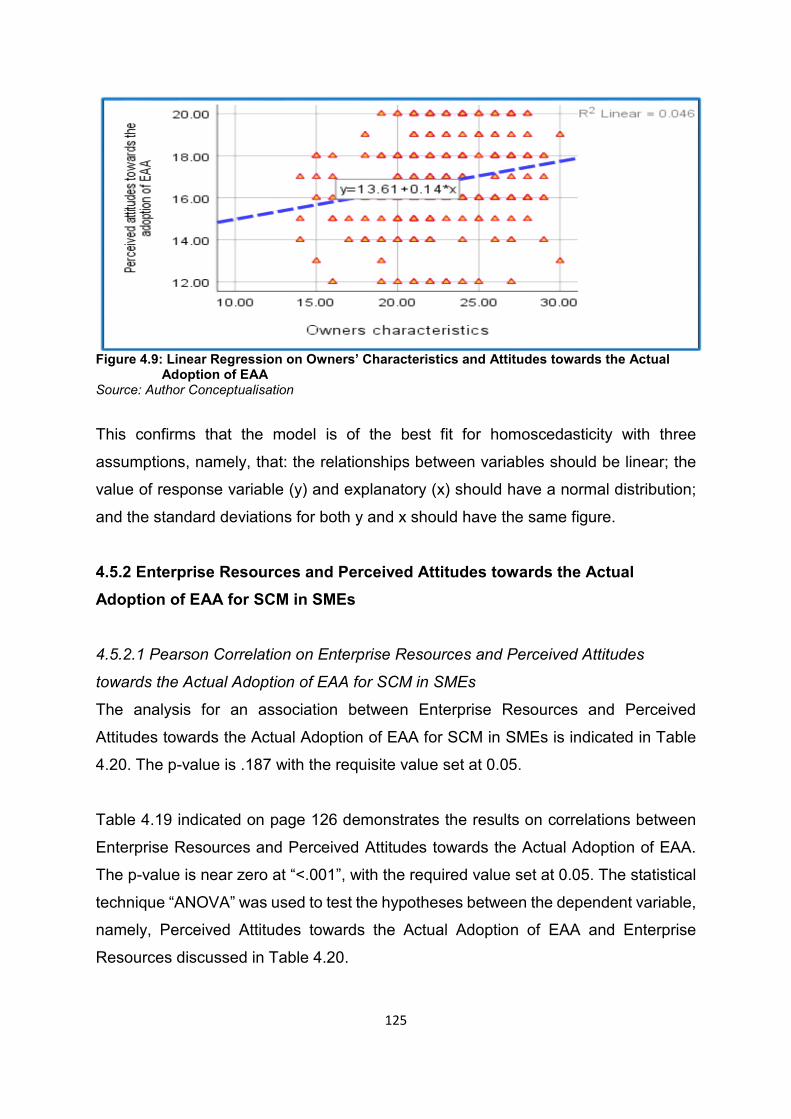
125
Figure 4.9: Linear Regression on Owners’ Characteristics and Attitudes towards the Actual
Adoption of EAA Source: Author Conceptualisation
This confirms that the model is of the best fit for homoscedasticity with three
assumptions, namely, that: the relationships between variables should be linear; the
value of response variable (y) and explanatory (x) should have a normal distribution;
and the standard deviations for both y and x should have the same figure.
4.5.2 Enterprise Resources and Perceived Attitudes towards the Actual Adoption of EAA for SCM in SMEs
4.5.2.1 Pearson Correlation on Enterprise Resources and Perceived Attitudes
towards the Actual Adoption of EAA for SCM in SMEs
The analysis for an association between Enterprise Resources and Perceived
Attitudes towards the Actual Adoption of EAA for SCM in SMEs is indicated in Table
4.20. The p-value is .187 with the requisite value set at 0.05.
Table 4.19 indicated on page 126 demonstrates the results on correlations between
Enterprise Resources and Perceived Attitudes towards the Actual Adoption of EAA.
The p-value is near zero at “˂.001”, with the required value set at 0.05. The statistical
technique “ANOVA” was used to test the hypotheses between the dependent variable,
namely, Perceived Attitudes towards the Actual Adoption of EAA and Enterprise
Resources discussed in Table 4.20.
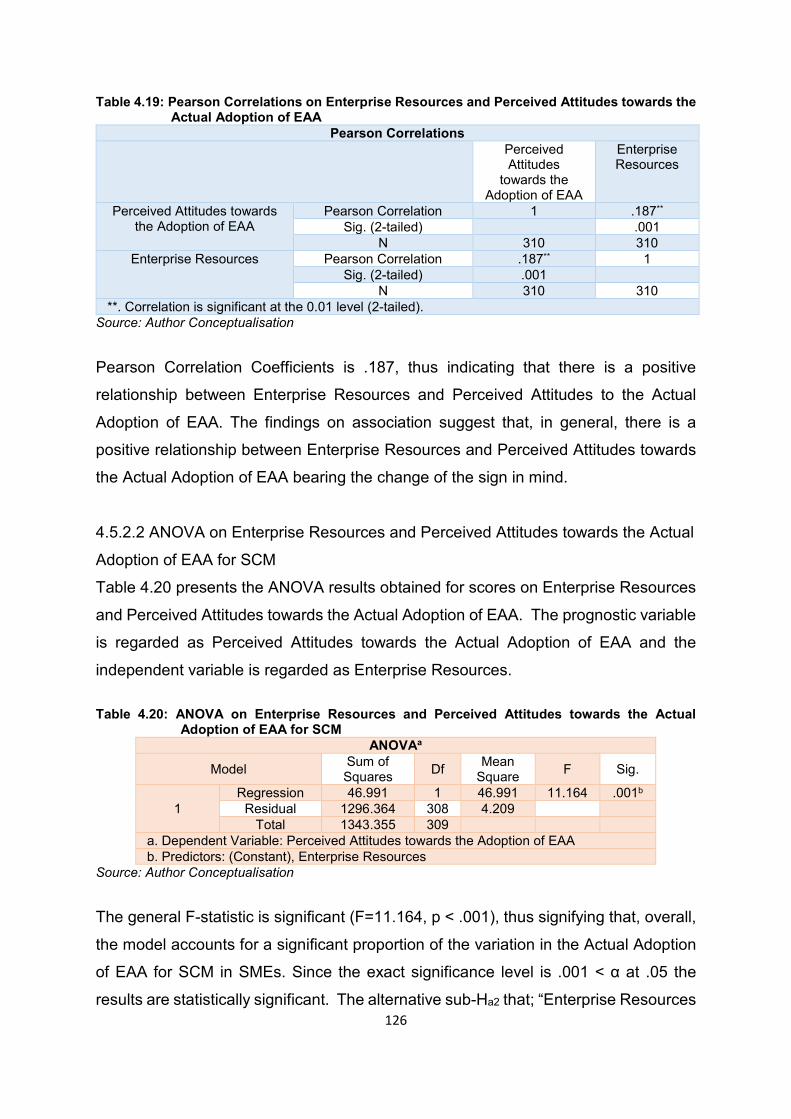
126
Table 4.19: Pearson Correlations on Enterprise Resources and Perceived Attitudes towards the Actual Adoption of EAA
Pearson Correlations Perceived
Attitudes towards the
Adoption of EAA
Enterprise Resources
Perceived Attitudes towards the Adoption of EAA
Pearson Correlation 1 .187** Sig. (2-tailed) .001
N 310 310 Enterprise Resources Pearson Correlation .187** 1
Sig. (2-tailed) .001 N 310 310
**. Correlation is significant at the 0.01 level (2-tailed). Source: Author Conceptualisation
Pearson Correlation Coefficients is .187, thus indicating that there is a positive
relationship between Enterprise Resources and Perceived Attitudes to the Actual
Adoption of EAA. The findings on association suggest that, in general, there is a
positive relationship between Enterprise Resources and Perceived Attitudes towards
the Actual Adoption of EAA bearing the change of the sign in mind.
4.5.2.2 ANOVA on Enterprise Resources and Perceived Attitudes towards the Actual
Adoption of EAA for SCM
Table 4.20 presents the ANOVA results obtained for scores on Enterprise Resources
and Perceived Attitudes towards the Actual Adoption of EAA. The prognostic variable
is regarded as Perceived Attitudes towards the Actual Adoption of EAA and the
independent variable is regarded as Enterprise Resources.
Table 4.20: ANOVA on Enterprise Resources and Perceived Attitudes towards the Actual
Adoption of EAA for SCM ANOVAa
Model Sum of Squares Df Mean
Square F Sig.
1 Regression 46.991 1 46.991 11.164 .001b
Residual 1296.364 308 4.209 Total 1343.355 309
a. Dependent Variable: Perceived Attitudes towards the Adoption of EAA b. Predictors: (Constant), Enterprise Resources
Source: Author Conceptualisation
The general F-statistic is significant (F=11.164, p ˂ .001), thus signifying that, overall,
the model accounts for a significant proportion of the variation in the Actual Adoption
of EAA for SCM in SMEs. Since the exact significance level is .001 ˂ α at .05 the
results are statistically significant. The alternative sub-Ha2 that; “Enterprise Resources

127
affect Perceived Attitudes towards the Actual Adoption of EAA for SCM in SMEs” is
accepted, whilst the sub-H02that; “Enterprise Resources do not affect Perceived
Attitudes towards the Actual Adoption of EAA for SCM in SMEs” is rejected.
4.5.2.3 Pearson Coefficients on Enterprise Resources and Perceived Attitudes
towards the Actual Adoption of EAA
Table 4.21 presents the coefficients results for Enterprise Resources and Perceived
Attitudes towards the Actual Adoption of EAA. The t-test is considered for testing as
both samples have similar values in the mean (confirmed in Table 4.3 and Figure 4.3).
Table 4.21: Pearson Coefficients on Enterprise Resources and Perceived Attitudes towards the
Adoption of EAA for SCM Pearson Coefficients
Model
Unstandardized Coefficients
Standardized Coefficients T Sig.
Collinearity Statistics
B Std. Error Beta Tolerance VIF
1
(Constant) 17.838 1.047 17.035 .00 Information
System Components
.259 .044 .317 5.871 .00 1.000 1.00
a. Dependent Variable: Perceived Attitudes towards the Adoption of EAA Source: Author Conceptualisation
In instances where the estimated Ý is comprised of Perceived Attitudes towards the
Actual Adoption of EAA and Owners’ Characteristics with the score = 17.838 + .259,
then the t-test shows that the Ý constant a=17.838 and the Ý constant b=.259 are
significantly different from zero. The independent t-test is used to determine the
confidence interval of the coefficient, in case the 95% confidence interval for the t-test
is where the t-test [17.035, 5.871].
4.5.2.4 Linear Regression on Enterprise Resources and Perceived Attitudes towards
the Adoption of EAA
Figure 4.10 indicated on page 128 provides the summary statistics for linear
regression that provides an overview for the results signifying a positive b. The y-axis
is regarded as Perceived Attitudes towards the Actual Adoption of EAA, a=y-axis
intercept, positive b and x-axis = Enterprise Resources. The R2 value is 0.035 of the
variance is being accounted for this scatter plot from the independent variable as
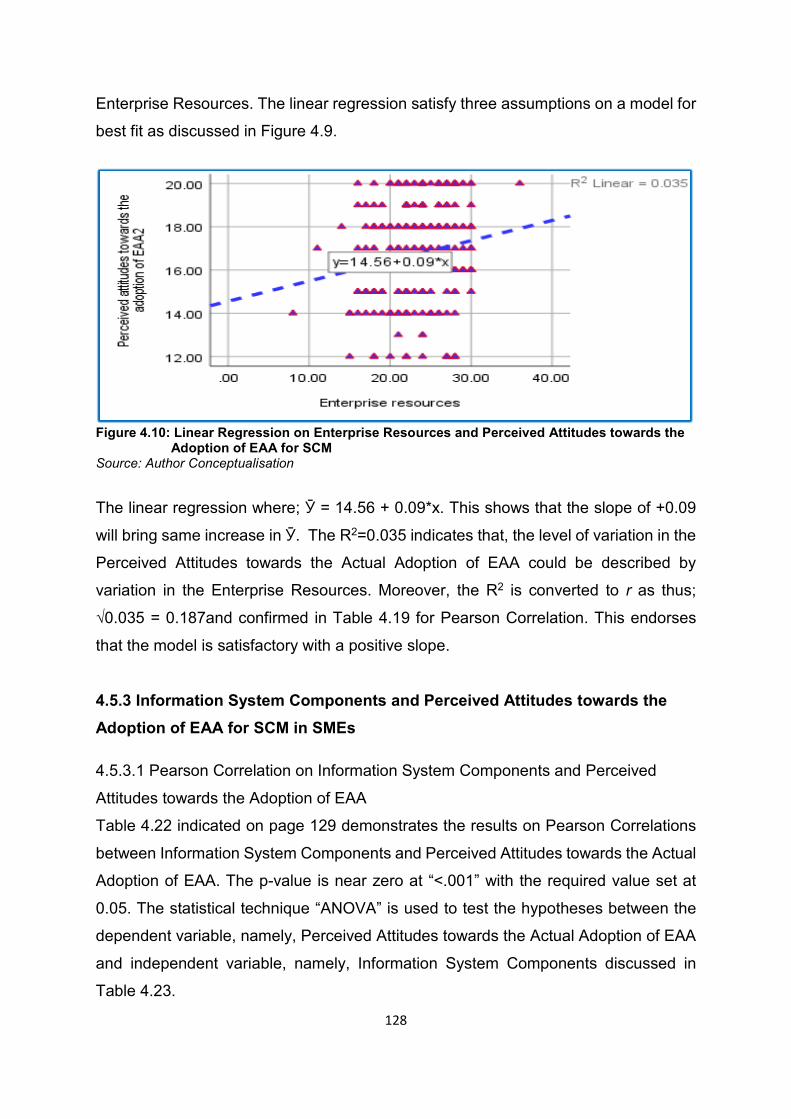
128
Enterprise Resources. The linear regression satisfy three assumptions on a model for
best fit as discussed in Figure 4.9.
Figure 4.10: Linear Regression on Enterprise Resources and Perceived Attitudes towards the
Adoption of EAA for SCM Source: Author Conceptualisation
The linear regression where; Ӯ = 14.56 + 0.09*x. This shows that the slope of +0.09
will bring same increase in Ӯ. The R2=0.035 indicates that, the level of variation in the
Perceived Attitudes towards the Actual Adoption of EAA could be described by
variation in the Enterprise Resources. Moreover, the R2 is converted to r as thus;
√0.035 = 0.187and confirmed in Table 4.19 for Pearson Correlation. This endorses
that the model is satisfactory with a positive slope.
4.5.3 Information System Components and Perceived Attitudes towards the Adoption of EAA for SCM in SMEs 4.5.3.1 Pearson Correlation on Information System Components and Perceived
Attitudes towards the Adoption of EAA
Table 4.22 indicated on page 129 demonstrates the results on Pearson Correlations
between Information System Components and Perceived Attitudes towards the Actual
Adoption of EAA. The p-value is near zero at “˂.001” with the required value set at
0.05. The statistical technique “ANOVA” is used to test the hypotheses between the
dependent variable, namely, Perceived Attitudes towards the Actual Adoption of EAA
and independent variable, namely, Information System Components discussed in
Table 4.23.
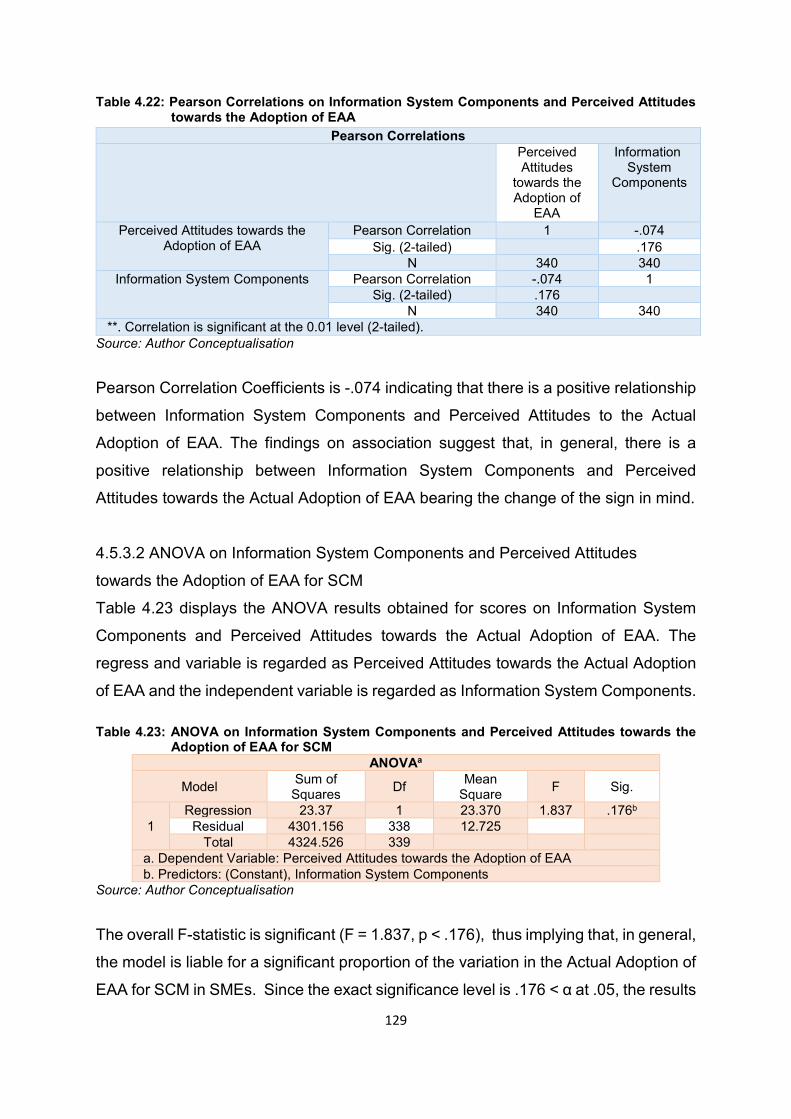
129
Table 4.22: Pearson Correlations on Information System Components and Perceived Attitudes towards the Adoption of EAA
Source: Author Conceptualisation
Pearson Correlation Coefficients is -.074 indicating that there is a positive relationship
between Information System Components and Perceived Attitudes to the Actual
Adoption of EAA. The findings on association suggest that, in general, there is a
positive relationship between Information System Components and Perceived
Attitudes towards the Actual Adoption of EAA bearing the change of the sign in mind.
4.5.3.2 ANOVA on Information System Components and Perceived Attitudes
towards the Adoption of EAA for SCM
Table 4.23 displays the ANOVA results obtained for scores on Information System
Components and Perceived Attitudes towards the Actual Adoption of EAA. The
regress and variable is regarded as Perceived Attitudes towards the Actual Adoption
of EAA and the independent variable is regarded as Information System Components. Table 4.23: ANOVA on Information System Components and Perceived Attitudes towards the
Adoption of EAA for SCM ANOVAa
Model Sum of Squares Df Mean
Square F Sig.
1 Regression 23.37 1 23.370 1.837 .176b
Residual 4301.156 338 12.725 Total 4324.526 339
a. Dependent Variable: Perceived Attitudes towards the Adoption of EAA b. Predictors: (Constant), Information System Components
Source: Author Conceptualisation
The overall F-statistic is significant (F = 1.837, p ˂ .176), thus implying that, in general,
the model is liable for a significant proportion of the variation in the Actual Adoption of
EAA for SCM in SMEs. Since the exact significance level is .176 ˂ α at .05, the results
Pearson Correlations Perceived
Attitudes towards the Adoption of
EAA
Information System
Components
Perceived Attitudes towards the Adoption of EAA
Pearson Correlation 1 -.074 Sig. (2-tailed) .176
N 340 340 Information System Components Pearson Correlation -.074 1
Sig. (2-tailed) .176 N 340 340
**. Correlation is significant at the 0.01 level (2-tailed).
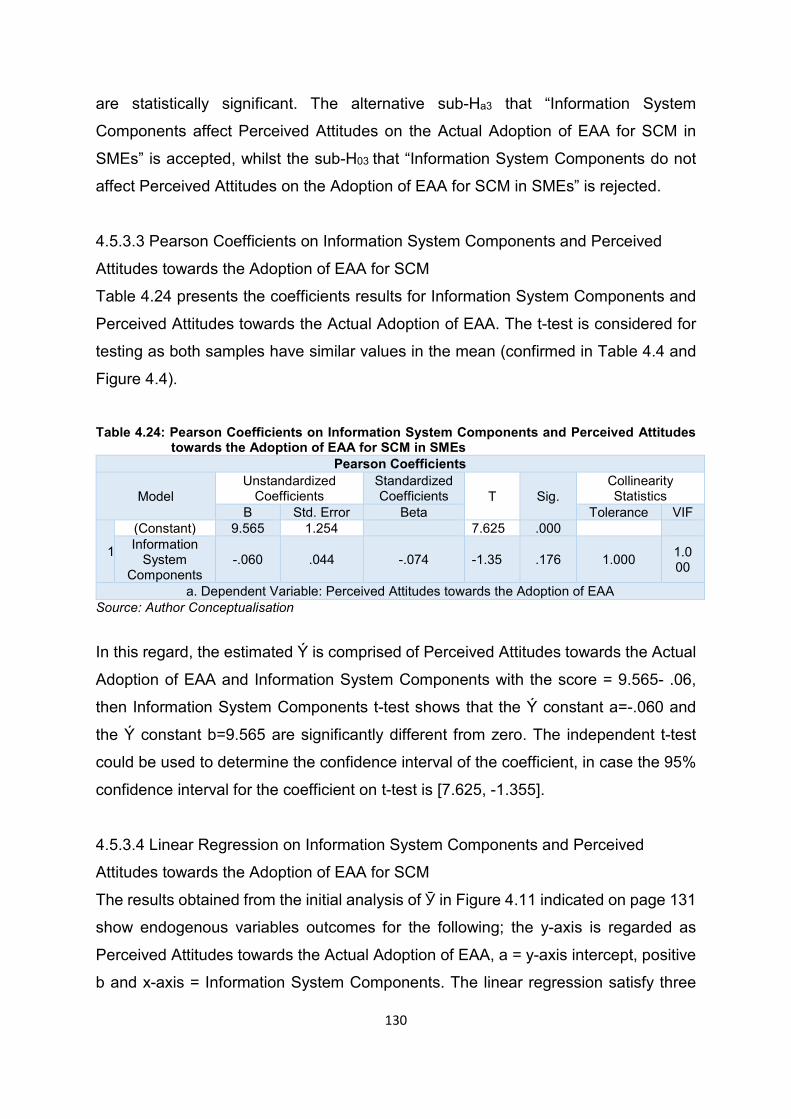
130
are statistically significant. The alternative sub-Ha3 that “Information System
Components affect Perceived Attitudes on the Actual Adoption of EAA for SCM in
SMEs” is accepted, whilst the sub-H03 that “Information System Components do not
affect Perceived Attitudes on the Adoption of EAA for SCM in SMEs” is rejected.
4.5.3.3 Pearson Coefficients on Information System Components and Perceived
Attitudes towards the Adoption of EAA for SCM
Table 4.24 presents the coefficients results for Information System Components and
Perceived Attitudes towards the Actual Adoption of EAA. The t-test is considered for
testing as both samples have similar values in the mean (confirmed in Table 4.4 and
Figure 4.4).
Table 4.24: Pearson Coefficients on Information System Components and Perceived Attitudes
towards the Adoption of EAA for SCM in SMEs Pearson Coefficients
Model Unstandardized
Coefficients Standardized Coefficients T Sig.
Collinearity Statistics
B Std. Error Beta Tolerance VIF
1
(Constant) 9.565 1.254 7.625 .000 Information
System Components
-.060 .044 -.074 -1.35 .176 1.000 1.000
a. Dependent Variable: Perceived Attitudes towards the Adoption of EAA Source: Author Conceptualisation
In this regard, the estimated Ý is comprised of Perceived Attitudes towards the Actual
Adoption of EAA and Information System Components with the score = 9.565- .06,
then Information System Components t-test shows that the Ý constant a=-.060 and
the Ý constant b=9.565 are significantly different from zero. The independent t-test
could be used to determine the confidence interval of the coefficient, in case the 95%
confidence interval for the coefficient on t-test is [7.625, -1.355].
4.5.3.4 Linear Regression on Information System Components and Perceived
Attitudes towards the Adoption of EAA for SCM
The results obtained from the initial analysis of Ӯ in Figure 4.11 indicated on page 131
show endogenous variables outcomes for the following; the y-axis is regarded as
Perceived Attitudes towards the Actual Adoption of EAA, a = y-axis intercept, positive
b and x-axis = Information System Components. The linear regression satisfy three
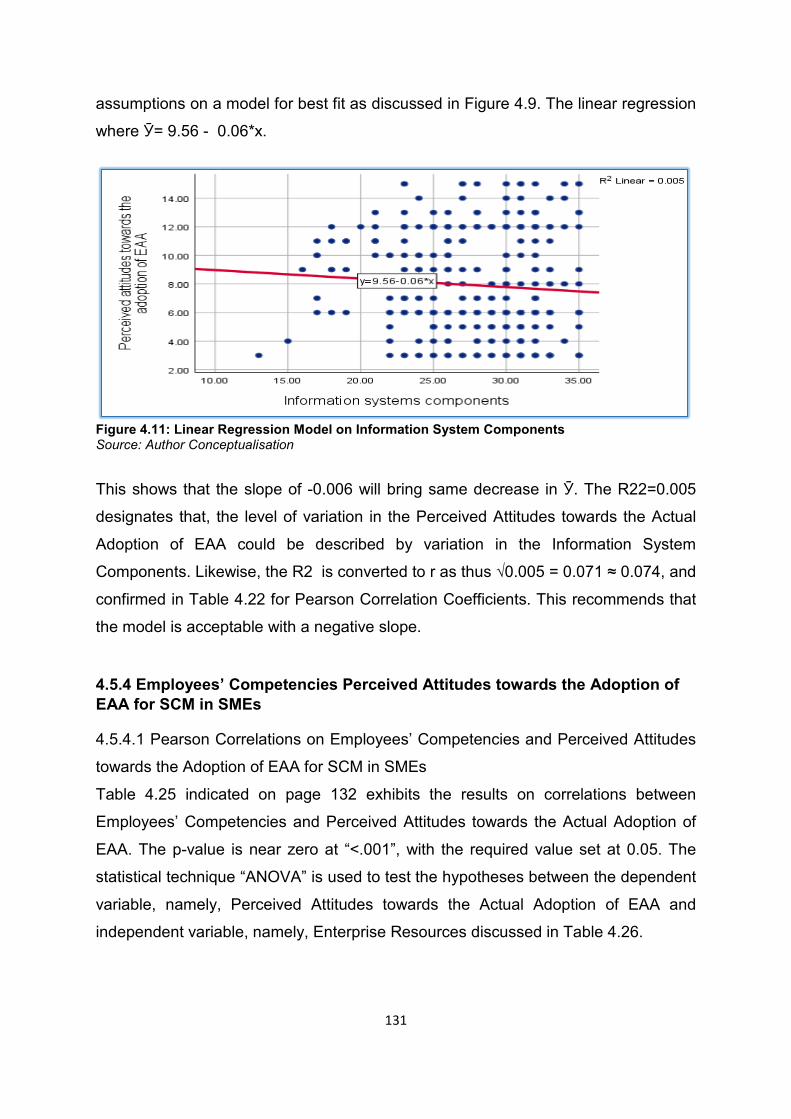
131
assumptions on a model for best fit as discussed in Figure 4.9. The linear regression
where Ӯ= 9.56 - 0.06*x.
Figure 4.11: Linear Regression Model on Information System Components Source: Author Conceptualisation
This shows that the slope of -0.006 will bring same decrease in Ӯ. The R22=0.005
designates that, the level of variation in the Perceived Attitudes towards the Actual
Adoption of EAA could be described by variation in the Information System
Components. Likewise, the R2 is converted to r as thus √0.005 = 0.071 ≈ 0.074, and
confirmed in Table 4.22 for Pearson Correlation Coefficients. This recommends that
the model is acceptable with a negative slope.
4.5.4 Employees’ Competencies Perceived Attitudes towards the Adoption of EAA for SCM in SMEs 4.5.4.1 Pearson Correlations on Employees’ Competencies and Perceived Attitudes
towards the Adoption of EAA for SCM in SMEs
Table 4.25 indicated on page 132 exhibits the results on correlations between
Employees’ Competencies and Perceived Attitudes towards the Actual Adoption of
EAA. The p-value is near zero at “˂.001”, with the required value set at 0.05. The
statistical technique “ANOVA” is used to test the hypotheses between the dependent
variable, namely, Perceived Attitudes towards the Actual Adoption of EAA and
independent variable, namely, Enterprise Resources discussed in Table 4.26.
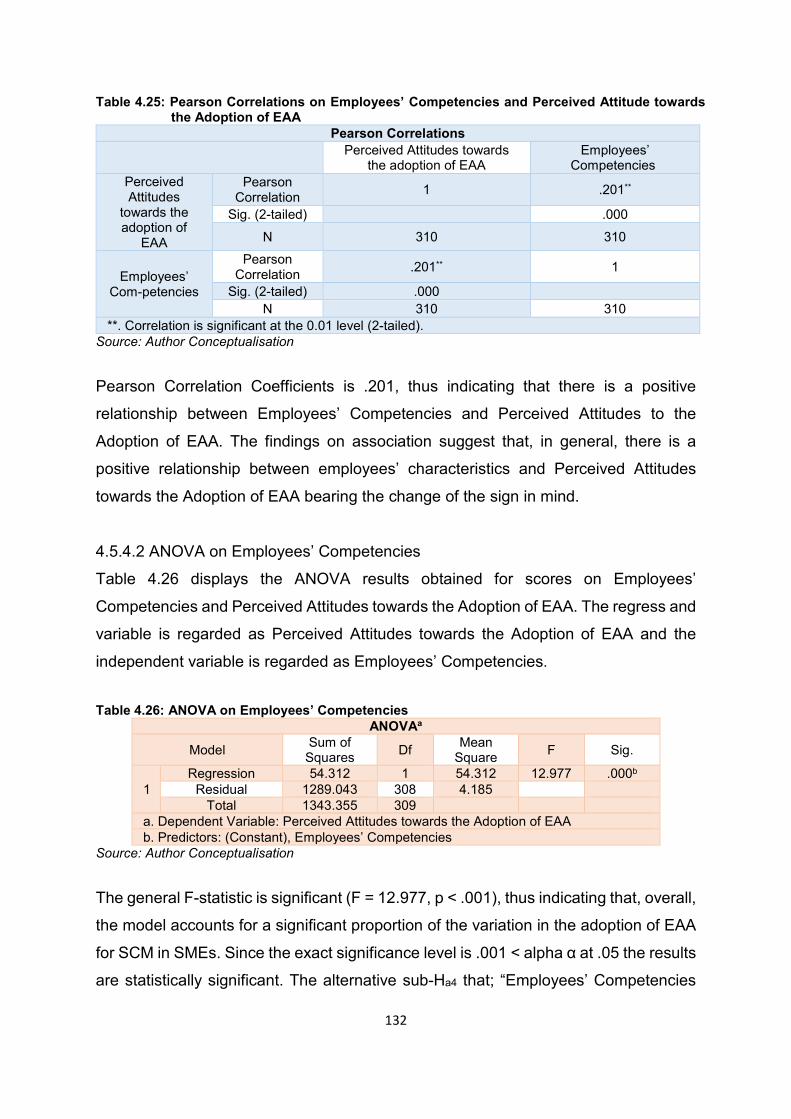
132
Table 4.25: Pearson Correlations on Employees’ Competencies and Perceived Attitude towards the Adoption of EAA
Pearson Correlations
Perceived Attitudes towards the adoption of EAA
Employees’ Competencies
Perceived Attitudes
towards the adoption of
EAA
Pearson Correlation 1 .201**
Sig. (2-tailed) .000 N 310 310
Employees’ Com-petencies
Pearson Correlation .201** 1
Sig. (2-tailed) .000 N 310 310
**. Correlation is significant at the 0.01 level (2-tailed). Source: Author Conceptualisation
Pearson Correlation Coefficients is .201, thus indicating that there is a positive
relationship between Employees’ Competencies and Perceived Attitudes to the
Adoption of EAA. The findings on association suggest that, in general, there is a
positive relationship between employees’ characteristics and Perceived Attitudes
towards the Adoption of EAA bearing the change of the sign in mind.
4.5.4.2 ANOVA on Employees’ Competencies
Table 4.26 displays the ANOVA results obtained for scores on Employees’
Competencies and Perceived Attitudes towards the Adoption of EAA. The regress and
variable is regarded as Perceived Attitudes towards the Adoption of EAA and the
independent variable is regarded as Employees’ Competencies.
Table 4.26: ANOVA on Employees’ Competencies ANOVAa
Model Sum of Squares Df Mean
Square F Sig.
1 Regression 54.312 1 54.312 12.977 .000b
Residual 1289.043 308 4.185 Total 1343.355 309
a. Dependent Variable: Perceived Attitudes towards the Adoption of EAA b. Predictors: (Constant), Employees’ Competencies
Source: Author Conceptualisation
The general F-statistic is significant (F = 12.977, p ˂ .001), thus indicating that, overall,
the model accounts for a significant proportion of the variation in the adoption of EAA
for SCM in SMEs. Since the exact significance level is .001 ˂ alpha α at .05 the results
are statistically significant. The alternative sub-Ha4 that; “Employees’ Competencies
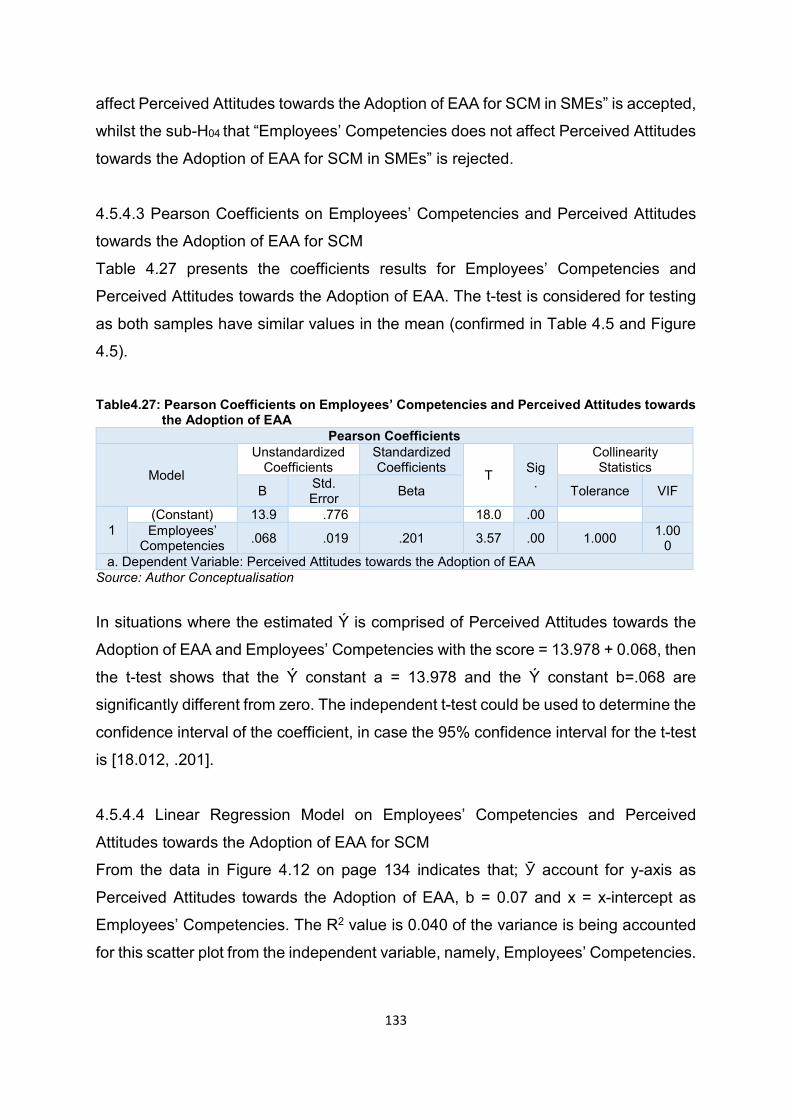
133
affect Perceived Attitudes towards the Adoption of EAA for SCM in SMEs” is accepted,
whilst the sub-H04 that “Employees’ Competencies does not affect Perceived Attitudes
towards the Adoption of EAA for SCM in SMEs” is rejected.
4.5.4.3 Pearson Coefficients on Employees’ Competencies and Perceived Attitudes
towards the Adoption of EAA for SCM
Table 4.27 presents the coefficients results for Employees’ Competencies and
Perceived Attitudes towards the Adoption of EAA. The t-test is considered for testing
as both samples have similar values in the mean (confirmed in Table 4.5 and Figure
4.5).
Table4.27: Pearson Coefficients on Employees’ Competencies and Perceived Attitudes towards
the Adoption of EAA Pearson Coefficients
Model
Unstandardized Coefficients
Standardized Coefficients T Sig
.
Collinearity Statistics
B Std. Error Beta Tolerance VIF
1 (Constant) 13.9 .776 18.0 .00 Employees’
Competencies .068 .019 .201 3.57 .00 1.000 1.000
a. Dependent Variable: Perceived Attitudes towards the Adoption of EAA Source: Author Conceptualisation
In situations where the estimated Ý is comprised of Perceived Attitudes towards the
Adoption of EAA and Employees’ Competencies with the score = 13.978 + 0.068, then
the t-test shows that the Ý constant a = 13.978 and the Ý constant b=.068 are
significantly different from zero. The independent t-test could be used to determine the
confidence interval of the coefficient, in case the 95% confidence interval for the t-test
is [18.012, .201].
4.5.4.4 Linear Regression Model on Employees’ Competencies and Perceived
Attitudes towards the Adoption of EAA for SCM
From the data in Figure 4.12 on page 134 indicates that; Ӯ account for y-axis as
Perceived Attitudes towards the Adoption of EAA, b = 0.07 and x = x-intercept as
Employees’ Competencies. The R2 value is 0.040 of the variance is being accounted
for this scatter plot from the independent variable, namely, Employees’ Competencies.
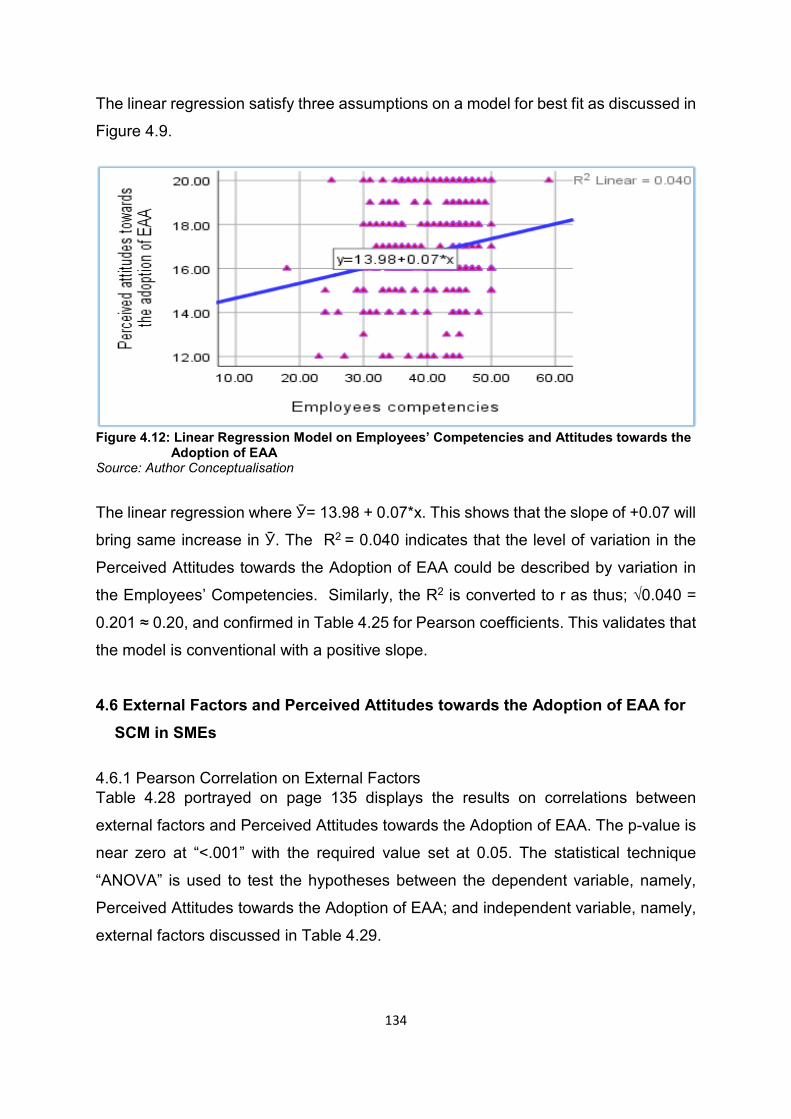
134
The linear regression satisfy three assumptions on a model for best fit as discussed in
Figure 4.9.
Figure 4.12: Linear Regression Model on Employees’ Competencies and Attitudes towards the
Adoption of EAA Source: Author Conceptualisation
The linear regression where Ӯ= 13.98 + 0.07*x. This shows that the slope of +0.07 will
bring same increase in Ӯ. The R2 = 0.040 indicates that the level of variation in the
Perceived Attitudes towards the Adoption of EAA could be described by variation in
the Employees’ Competencies. Similarly, the R2 is converted to r as thus; √0.040 =
0.201 ≈ 0.20, and confirmed in Table 4.25 for Pearson coefficients. This validates that
the model is conventional with a positive slope.
4.6 External Factors and Perceived Attitudes towards the Adoption of EAA for SCM in SMEs
4.6.1 Pearson Correlation on External Factors Table 4.28 portrayed on page 135 displays the results on correlations between
external factors and Perceived Attitudes towards the Adoption of EAA. The p-value is
near zero at “˂.001” with the required value set at 0.05. The statistical technique
“ANOVA” is used to test the hypotheses between the dependent variable, namely,
Perceived Attitudes towards the Adoption of EAA; and independent variable, namely,
external factors discussed in Table 4.29.
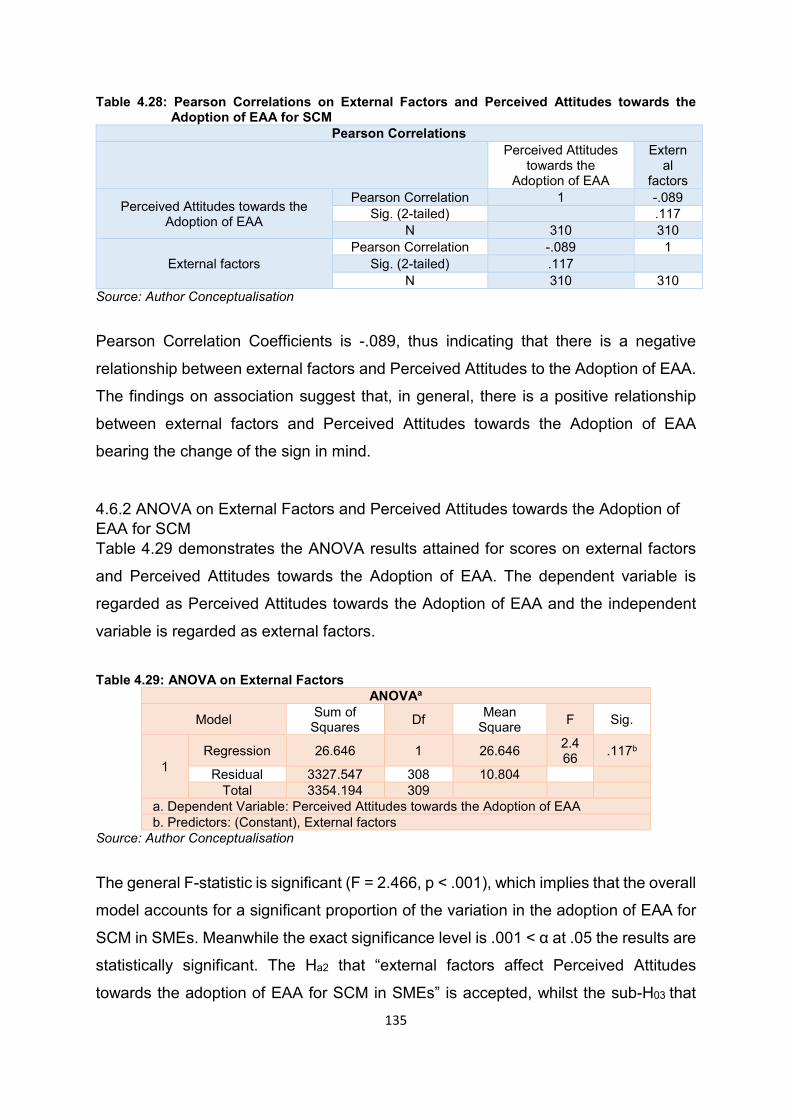
135
Table 4.28: Pearson Correlations on External Factors and Perceived Attitudes towards the Adoption of EAA for SCM
Pearson Correlations
Perceived Attitudes
towards the Adoption of EAA
External
factors
Perceived Attitudes towards the Adoption of EAA
Pearson Correlation 1 -.089 Sig. (2-tailed) .117
N 310 310
External factors Pearson Correlation -.089 1
Sig. (2-tailed) .117 N 310 310
Source: Author Conceptualisation
Pearson Correlation Coefficients is -.089, thus indicating that there is a negative
relationship between external factors and Perceived Attitudes to the Adoption of EAA.
The findings on association suggest that, in general, there is a positive relationship
between external factors and Perceived Attitudes towards the Adoption of EAA
bearing the change of the sign in mind.
4.6.2 ANOVA on External Factors and Perceived Attitudes towards the Adoption of EAA for SCM Table 4.29 demonstrates the ANOVA results attained for scores on external factors
and Perceived Attitudes towards the Adoption of EAA. The dependent variable is
regarded as Perceived Attitudes towards the Adoption of EAA and the independent
variable is regarded as external factors. Table 4.29: ANOVA on External Factors
ANOVAa
Model Sum of Squares Df Mean
Square F Sig.
1 Regression 26.646 1 26.646 2.4
66 .117b
Residual 3327.547 308 10.804 Total 3354.194 309
a. Dependent Variable: Perceived Attitudes towards the Adoption of EAA b. Predictors: (Constant), External factors
Source: Author Conceptualisation
The general F-statistic is significant (F = 2.466, p ˂ .001), which implies that the overall
model accounts for a significant proportion of the variation in the adoption of EAA for
SCM in SMEs. Meanwhile the exact significance level is .001 ˂ α at .05 the results are
statistically significant. The Ha2 that “external factors affect Perceived Attitudes
towards the adoption of EAA for SCM in SMEs” is accepted, whilst the sub-H03 that
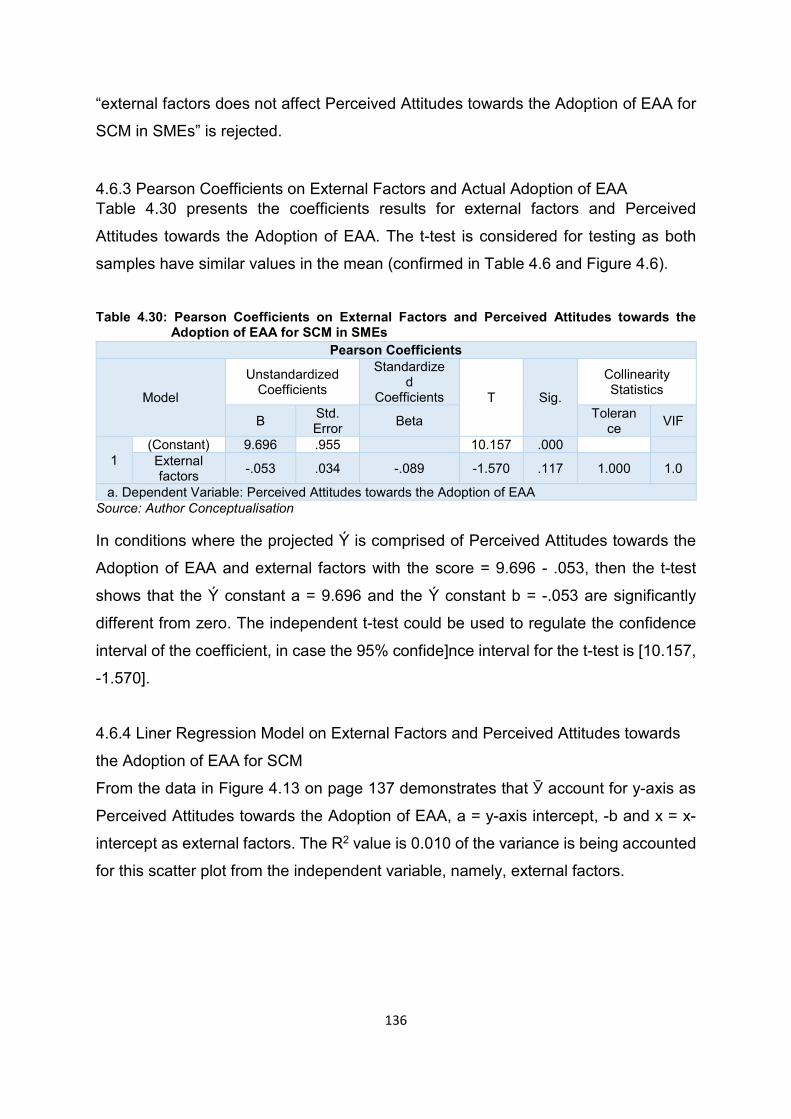
136
“external factors does not affect Perceived Attitudes towards the Adoption of EAA for
SCM in SMEs” is rejected.
4.6.3 Pearson Coefficients on External Factors and Actual Adoption of EAA Table 4.30 presents the coefficients results for external factors and Perceived
Attitudes towards the Adoption of EAA. The t-test is considered for testing as both
samples have similar values in the mean (confirmed in Table 4.6 and Figure 4.6).
Table 4.30: Pearson Coefficients on External Factors and Perceived Attitudes towards the
Adoption of EAA for SCM in SMEs
Source: Author Conceptualisation In conditions where the projected Ý is comprised of Perceived Attitudes towards the
Adoption of EAA and external factors with the score = 9.696 - .053, then the t-test
shows that the Ý constant a = 9.696 and the Ý constant b = -.053 are significantly
different from zero. The independent t-test could be used to regulate the confidence
interval of the coefficient, in case the 95% confide]nce interval for the t-test is [10.157,
-1.570].
4.6.4 Liner Regression Model on External Factors and Perceived Attitudes towards
the Adoption of EAA for SCM
From the data in Figure 4.13 on page 137 demonstrates that Ӯ account for y-axis as
Perceived Attitudes towards the Adoption of EAA, a = y-axis intercept, -b and x = x-
intercept as external factors. The R2 value is 0.010 of the variance is being accounted
for this scatter plot from the independent variable, namely, external factors.
Pearson Coefficients
Model
Unstandardized Coefficients
Standardized
Coefficients T Sig.
Collinearity Statistics
B Std. Error Beta Toleran
ce VIF
1 (Constant) 9.696 .955 10.157 .000 External factors -.053 .034 -.089 -1.570 .117 1.000 1.0
a. Dependent Variable: Perceived Attitudes towards the Adoption of EAA
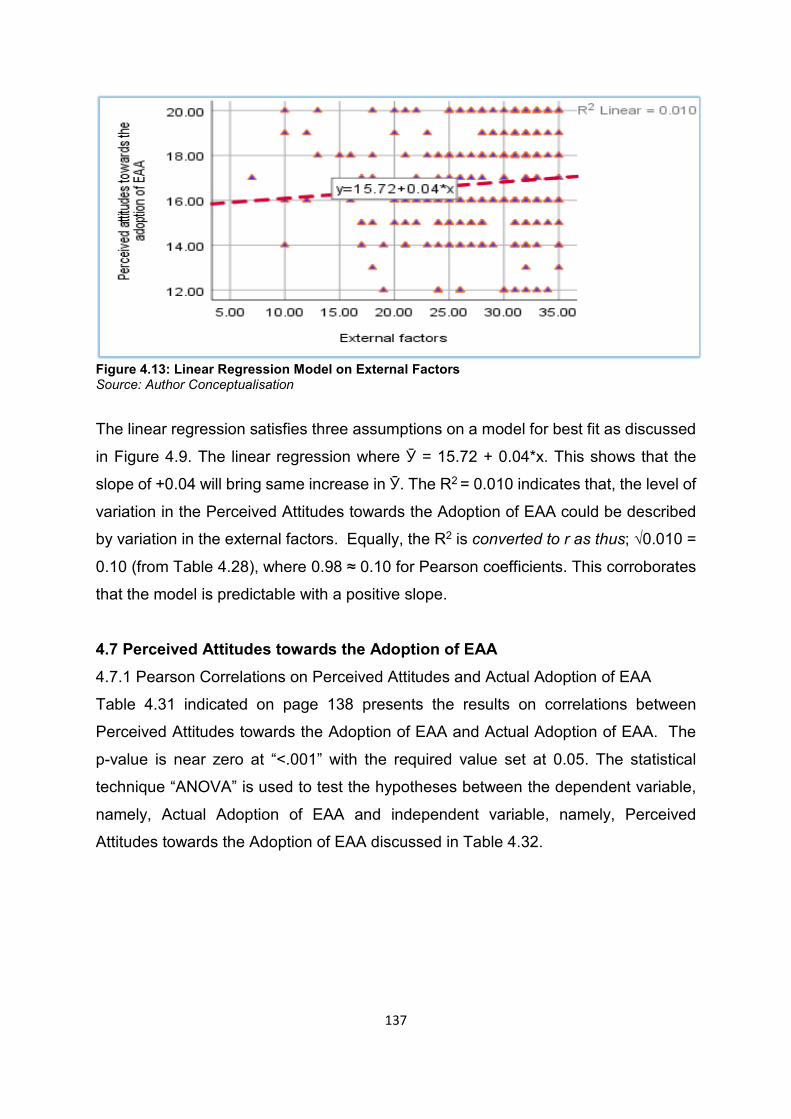
137
Figure 4.13: Linear Regression Model on External Factors Source: Author Conceptualisation
The linear regression satisfies three assumptions on a model for best fit as discussed
in Figure 4.9. The linear regression where Ӯ = 15.72 + 0.04*x. This shows that the
slope of +0.04 will bring same increase in Ӯ. The R2 = 0.010 indicates that, the level of
variation in the Perceived Attitudes towards the Adoption of EAA could be described
by variation in the external factors. Equally, the R2 is converted to r as thus; √0.010 =
0.10 (from Table 4.28), where 0.98 ≈ 0.10 for Pearson coefficients. This corroborates
that the model is predictable with a positive slope.
4.7 Perceived Attitudes towards the Adoption of EAA 4.7.1 Pearson Correlations on Perceived Attitudes and Actual Adoption of EAA
Table 4.31 indicated on page 138 presents the results on correlations between
Perceived Attitudes towards the Adoption of EAA and Actual Adoption of EAA. The
p-value is near zero at “˂.001” with the required value set at 0.05. The statistical
technique “ANOVA” is used to test the hypotheses between the dependent variable,
namely, Actual Adoption of EAA and independent variable, namely, Perceived
Attitudes towards the Adoption of EAA discussed in Table 4.32.
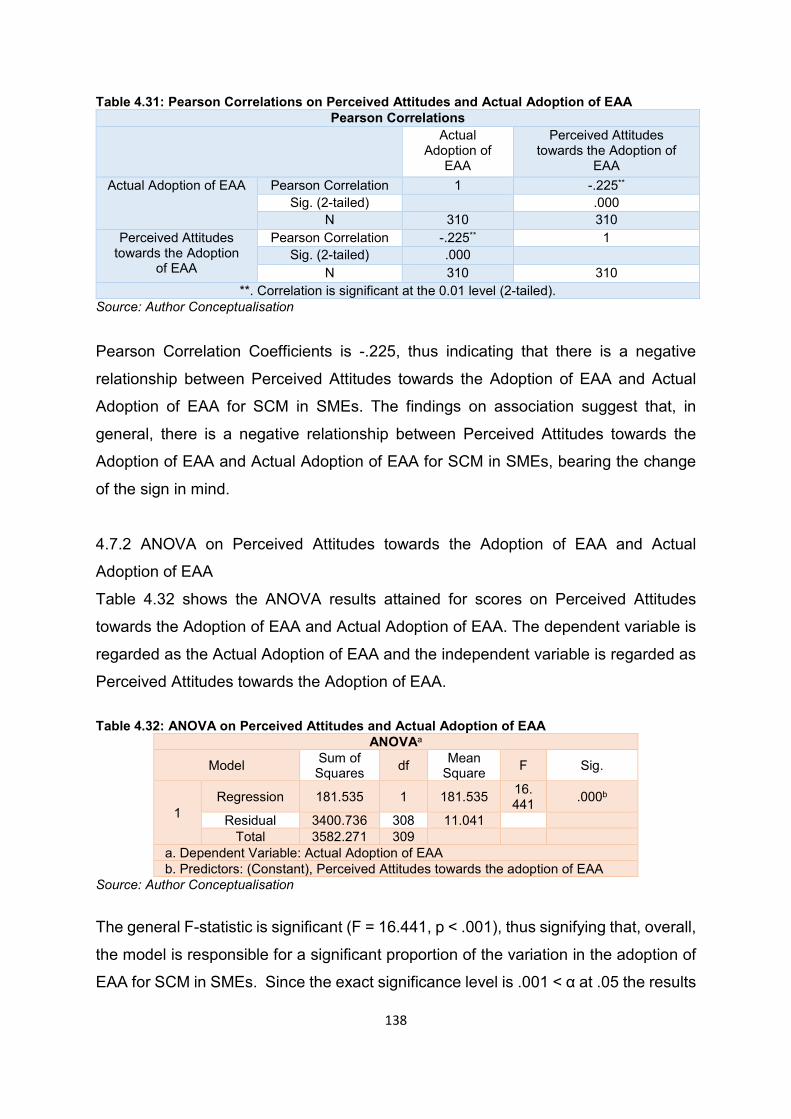
138
Table 4.31: Pearson Correlations on Perceived Attitudes and Actual Adoption of EAA Pearson Correlations
Actual Adoption of
EAA
Perceived Attitudes towards the Adoption of
EAA Actual Adoption of EAA Pearson Correlation 1 -.225**
Sig. (2-tailed) .000 N 310 310
Perceived Attitudes towards the Adoption
of EAA
Pearson Correlation -.225** 1 Sig. (2-tailed) .000
N 310 310 **. Correlation is significant at the 0.01 level (2-tailed).
Source: Author Conceptualisation
Pearson Correlation Coefficients is -.225, thus indicating that there is a negative
relationship between Perceived Attitudes towards the Adoption of EAA and Actual
Adoption of EAA for SCM in SMEs. The findings on association suggest that, in
general, there is a negative relationship between Perceived Attitudes towards the
Adoption of EAA and Actual Adoption of EAA for SCM in SMEs, bearing the change
of the sign in mind.
4.7.2 ANOVA on Perceived Attitudes towards the Adoption of EAA and Actual
Adoption of EAA
Table 4.32 shows the ANOVA results attained for scores on Perceived Attitudes
towards the Adoption of EAA and Actual Adoption of EAA. The dependent variable is
regarded as the Actual Adoption of EAA and the independent variable is regarded as
Perceived Attitudes towards the Adoption of EAA.
Table 4.32: ANOVA on Perceived Attitudes and Actual Adoption of EAA ANOVAa
Model Sum of Squares df Mean
Square F Sig.
1 Regression 181.535 1 181.535 16.
441 .000b
Residual 3400.736 308 11.041 Total 3582.271 309
a. Dependent Variable: Actual Adoption of EAA b. Predictors: (Constant), Perceived Attitudes towards the adoption of EAA
Source: Author Conceptualisation
The general F-statistic is significant (F = 16.441, p ˂ .001), thus signifying that, overall,
the model is responsible for a significant proportion of the variation in the adoption of
EAA for SCM in SMEs. Since the exact significance level is .001 ˂ α at .05 the results
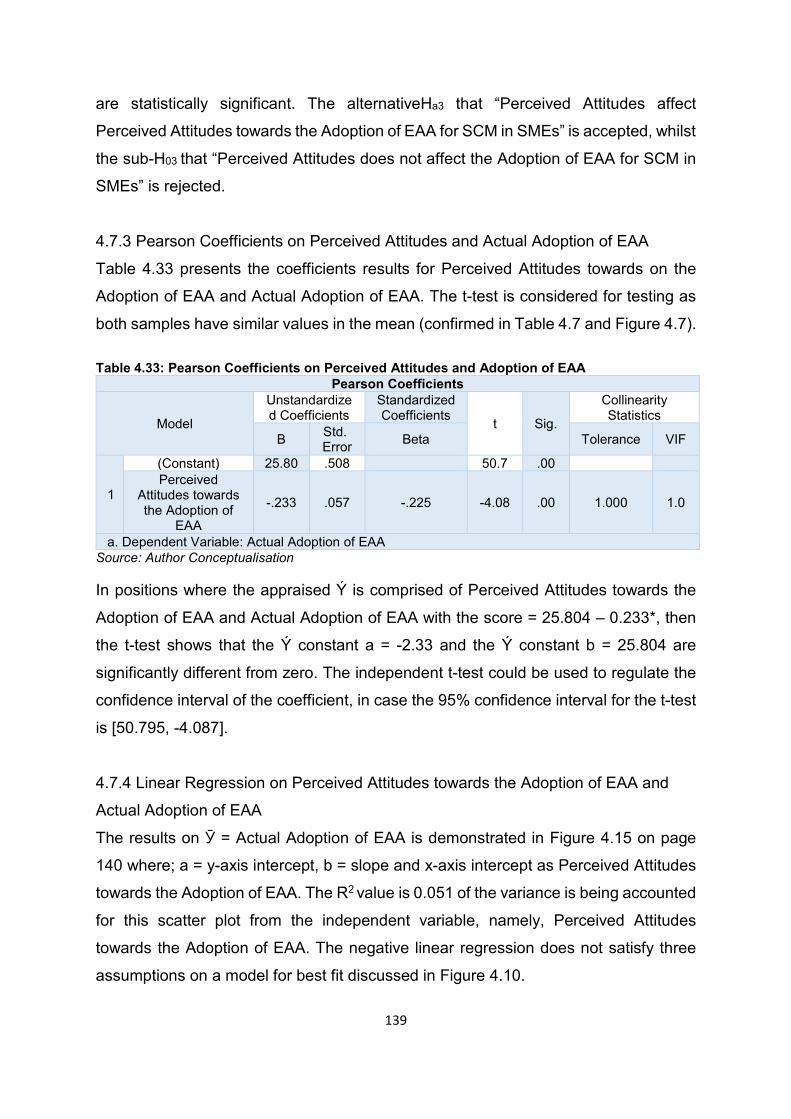
139
are statistically significant. The alternativeHa3 that “Perceived Attitudes affect
Perceived Attitudes towards the Adoption of EAA for SCM in SMEs” is accepted, whilst
the sub-H03 that “Perceived Attitudes does not affect the Adoption of EAA for SCM in
SMEs” is rejected.
4.7.3 Pearson Coefficients on Perceived Attitudes and Actual Adoption of EAA
Table 4.33 presents the coefficients results for Perceived Attitudes towards on the
Adoption of EAA and Actual Adoption of EAA. The t-test is considered for testing as
both samples have similar values in the mean (confirmed in Table 4.7 and Figure 4.7).
Table 4.33: Pearson Coefficients on Perceived Attitudes and Adoption of EAA Pearson Coefficients
Model
Unstandardized Coefficients
Standardized Coefficients t Sig.
Collinearity Statistics
B Std. Error Beta Tolerance VIF
1
(Constant) 25.80 .508 50.7 .00 Perceived
Attitudes towards the Adoption of
EAA
-.233 .057 -.225 -4.08 .00 1.000 1.0
a. Dependent Variable: Actual Adoption of EAA Source: Author Conceptualisation In positions where the appraised Ý is comprised of Perceived Attitudes towards the
Adoption of EAA and Actual Adoption of EAA with the score = 25.804 – 0.233*, then
the t-test shows that the Ý constant a = -2.33 and the Ý constant b = 25.804 are
significantly different from zero. The independent t-test could be used to regulate the
confidence interval of the coefficient, in case the 95% confidence interval for the t-test
is [50.795, -4.087].
4.7.4 Linear Regression on Perceived Attitudes towards the Adoption of EAA and
Actual Adoption of EAA
The results on Ӯ = Actual Adoption of EAA is demonstrated in Figure 4.15 on page
140 where; a = y-axis intercept, b = slope and x-axis intercept as Perceived Attitudes
towards the Adoption of EAA. The R2 value is 0.051 of the variance is being accounted
for this scatter plot from the independent variable, namely, Perceived Attitudes
towards the Adoption of EAA. The negative linear regression does not satisfy three
assumptions on a model for best fit discussed in Figure 4.10.
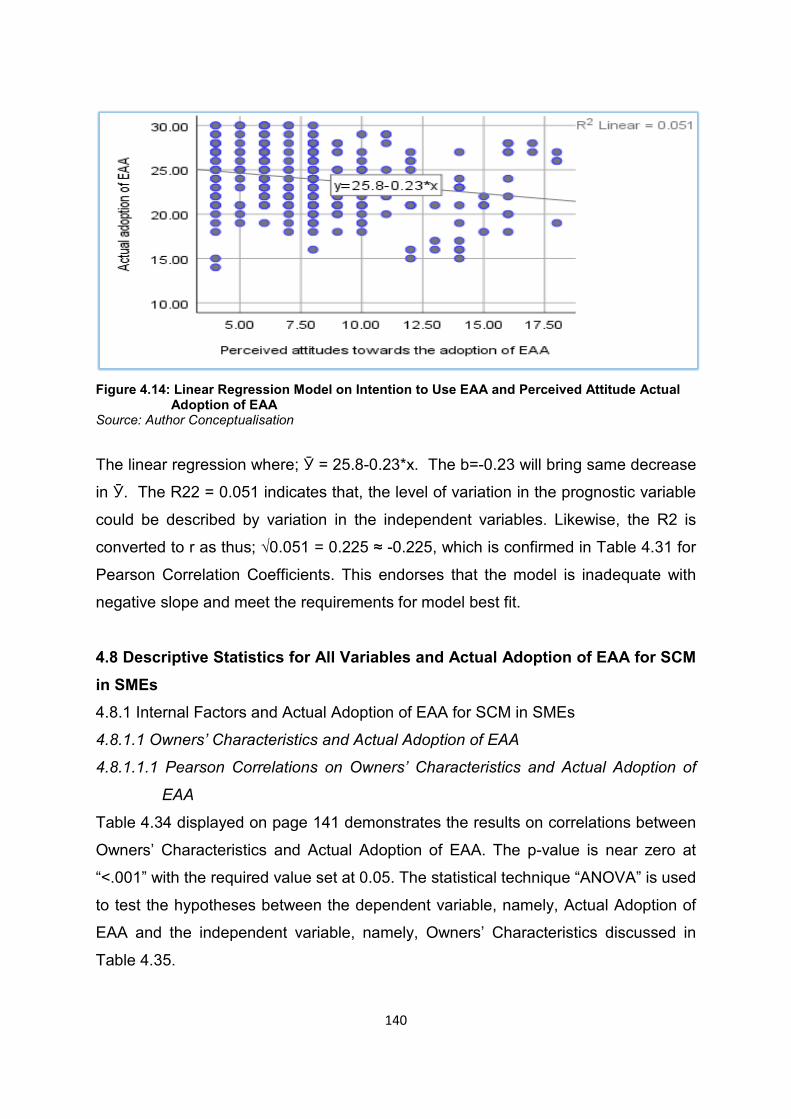
140
Figure 4.14: Linear Regression Model on Intention to Use EAA and Perceived Attitude Actual
Adoption of EAA Source: Author Conceptualisation
The linear regression where; Ӯ = 25.8-0.23*x. The b=-0.23 will bring same decrease
in Ӯ. The R22 = 0.051 indicates that, the level of variation in the prognostic variable
could be described by variation in the independent variables. Likewise, the R2 is
converted to r as thus; √0.051 = 0.225 ≈ -0.225, which is confirmed in Table 4.31 for
Pearson Correlation Coefficients. This endorses that the model is inadequate with
negative slope and meet the requirements for model best fit.
4.8 Descriptive Statistics for All Variables and Actual Adoption of EAA for SCM in SMEs 4.8.1 Internal Factors and Actual Adoption of EAA for SCM in SMEs
4.8.1.1 Owners’ Characteristics and Actual Adoption of EAA
4.8.1.1.1 Pearson Correlations on Owners’ Characteristics and Actual Adoption of
EAA
Table 4.34 displayed on page 141 demonstrates the results on correlations between
Owners’ Characteristics and Actual Adoption of EAA. The p-value is near zero at
“˂.001” with the required value set at 0.05. The statistical technique “ANOVA” is used
to test the hypotheses between the dependent variable, namely, Actual Adoption of
EAA and the independent variable, namely, Owners’ Characteristics discussed in
Table 4.35.
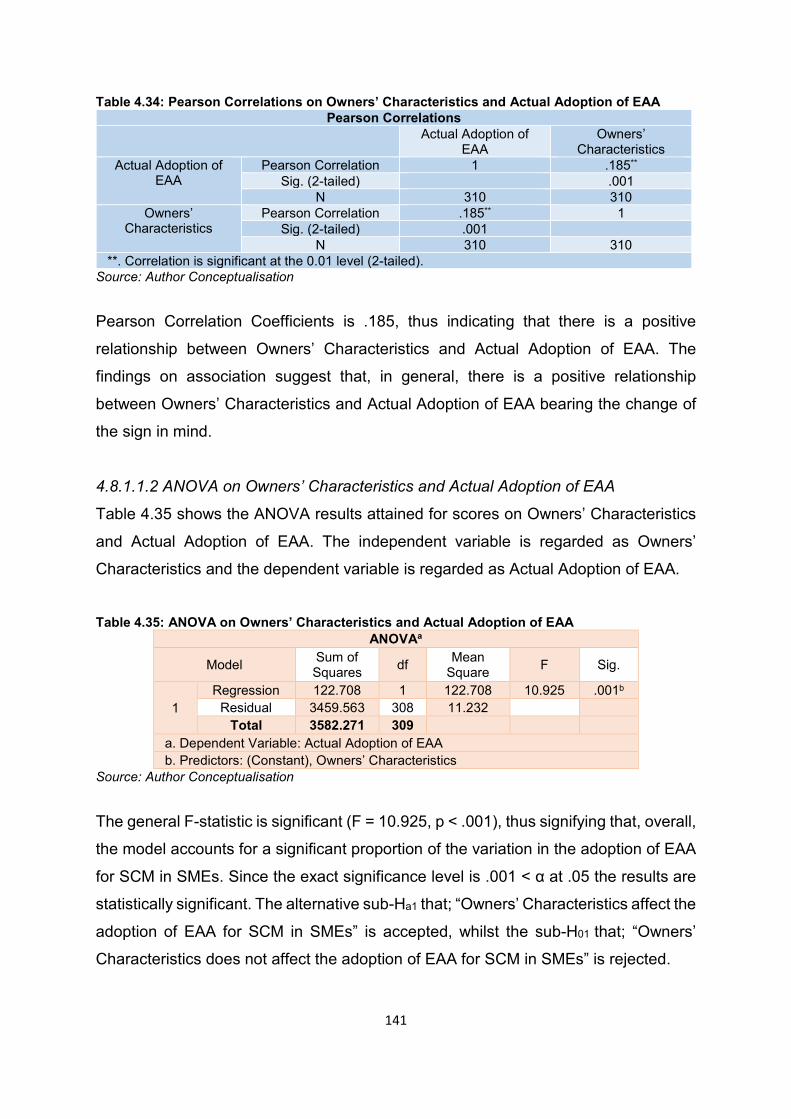
141
Table 4.34: Pearson Correlations on Owners’ Characteristics and Actual Adoption of EAA Pearson Correlations
Actual Adoption of EAA
Owners’ Characteristics
Actual Adoption of EAA
Pearson Correlation 1 .185** Sig. (2-tailed) .001
N 310 310 Owners’
Characteristics Pearson Correlation .185** 1
Sig. (2-tailed) .001 N 310 310
**. Correlation is significant at the 0.01 level (2-tailed). Source: Author Conceptualisation
Pearson Correlation Coefficients is .185, thus indicating that there is a positive
relationship between Owners’ Characteristics and Actual Adoption of EAA. The
findings on association suggest that, in general, there is a positive relationship
between Owners’ Characteristics and Actual Adoption of EAA bearing the change of
the sign in mind.
4.8.1.1.2 ANOVA on Owners’ Characteristics and Actual Adoption of EAA
Table 4.35 shows the ANOVA results attained for scores on Owners’ Characteristics
and Actual Adoption of EAA. The independent variable is regarded as Owners’
Characteristics and the dependent variable is regarded as Actual Adoption of EAA.
Table 4.35: ANOVA on Owners’ Characteristics and Actual Adoption of EAA
ANOVAa
Model Sum of Squares df Mean
Square F Sig.
1 Regression 122.708 1 122.708 10.925 .001b
Residual 3459.563 308 11.232 Total 3582.271 309
a. Dependent Variable: Actual Adoption of EAA b. Predictors: (Constant), Owners’ Characteristics
Source: Author Conceptualisation
The general F-statistic is significant (F = 10.925, p ˂ .001), thus signifying that, overall,
the model accounts for a significant proportion of the variation in the adoption of EAA
for SCM in SMEs. Since the exact significance level is .001 ˂ α at .05 the results are
statistically significant. The alternative sub-Ha1 that; “Owners’ Characteristics affect the
adoption of EAA for SCM in SMEs” is accepted, whilst the sub-H01 that; “Owners’
Characteristics does not affect the adoption of EAA for SCM in SMEs” is rejected.
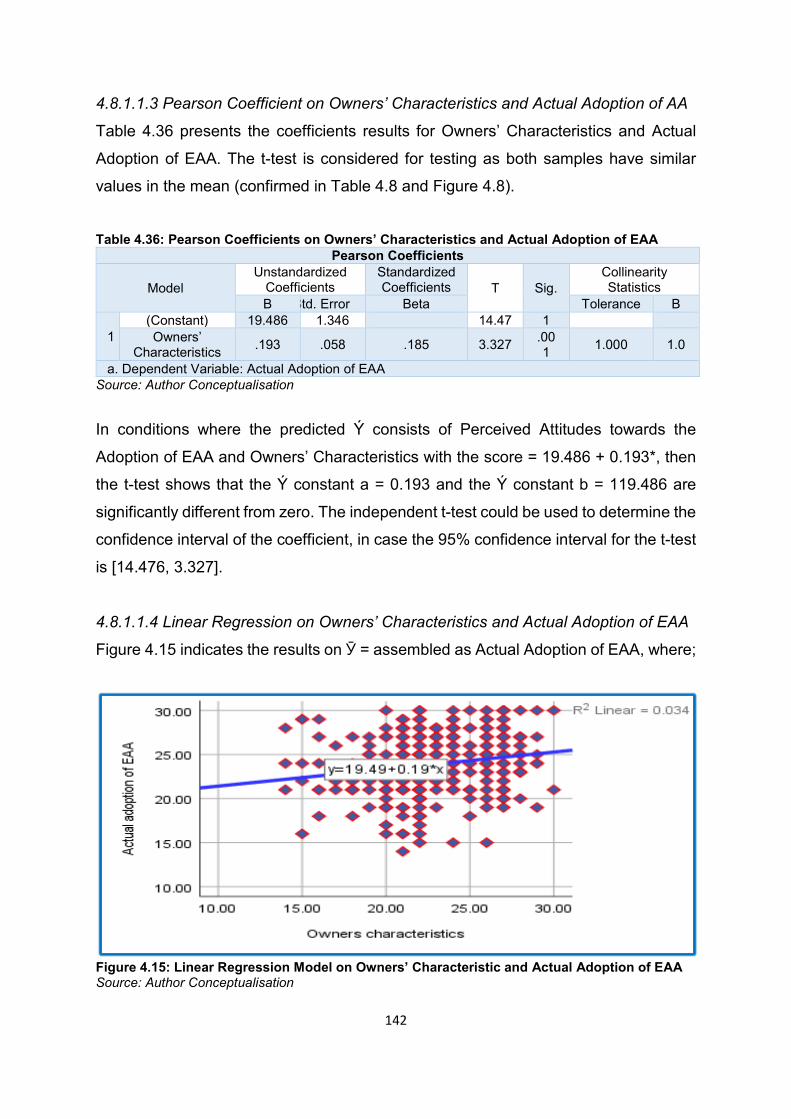
142
4.8.1.1.3 Pearson Coefficient on Owners’ Characteristics and Actual Adoption of AA
Table 4.36 presents the coefficients results for Owners’ Characteristics and Actual
Adoption of EAA. The t-test is considered for testing as both samples have similar
values in the mean (confirmed in Table 4.8 and Figure 4.8).
Table 4.36: Pearson Coefficients on Owners’ Characteristics and Actual Adoption of EAA
Pearson Coefficients
Model Unstandardized
Coefficients Standardized Coefficients T Sig.
Collinearity Statistics
B Std. Error Beta Tolerance B
1 (Constant) 19.486 1.346 14.47 1 Owners’
Characteristics .193 .058 .185 3.327 .001 1.000 1.0
a. Dependent Variable: Actual Adoption of EAA Source: Author Conceptualisation
In conditions where the predicted Ý consists of Perceived Attitudes towards the
Adoption of EAA and Owners’ Characteristics with the score = 19.486 + 0.193*, then
the t-test shows that the Ý constant a = 0.193 and the Ý constant b = 119.486 are
significantly different from zero. The independent t-test could be used to determine the
confidence interval of the coefficient, in case the 95% confidence interval for the t-test
is [14.476, 3.327].
4.8.1.1.4 Linear Regression on Owners’ Characteristics and Actual Adoption of EAA
Figure 4.15 indicates the results on Ӯ = assembled as Actual Adoption of EAA, where;
Figure 4.15: Linear Regression Model on Owners’ Characteristic and Actual Adoption of EAA Source: Author Conceptualisation
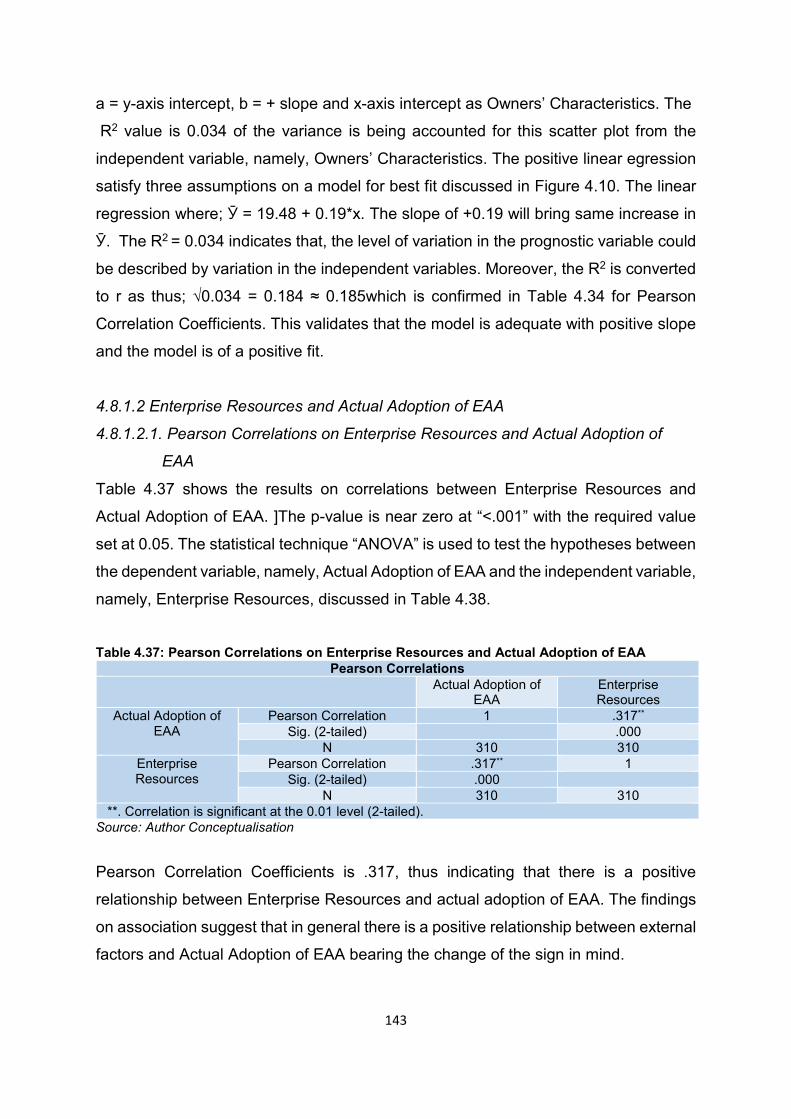
143
a = y-axis intercept, b = + slope and x-axis intercept as Owners’ Characteristics. The
R2 value is 0.034 of the variance is being accounted for this scatter plot from the
independent variable, namely, Owners’ Characteristics. The positive linear egression
satisfy three assumptions on a model for best fit discussed in Figure 4.10. The linear
regression where; Ӯ = 19.48 + 0.19*x. The slope of +0.19 will bring same increase in
Ӯ. The R2 = 0.034 indicates that, the level of variation in the prognostic variable could
be described by variation in the independent variables. Moreover, the R2 is converted
to r as thus; √0.034 = 0.184 ≈ 0.185which is confirmed in Table 4.34 for Pearson
Correlation Coefficients. This validates that the model is adequate with positive slope
and the model is of a positive fit.
4.8.1.2 Enterprise Resources and Actual Adoption of EAA
4.8.1.2.1. Pearson Correlations on Enterprise Resources and Actual Adoption of
EAA
Table 4.37 shows the results on correlations between Enterprise Resources and
Actual Adoption of EAA. ]The p-value is near zero at “˂.001” with the required value
set at 0.05. The statistical technique “ANOVA” is used to test the hypotheses between
the dependent variable, namely, Actual Adoption of EAA and the independent variable,
namely, Enterprise Resources, discussed in Table 4.38.
Table 4.37: Pearson Correlations on Enterprise Resources and Actual Adoption of EAA
Pearson Correlations Actual Adoption of
EAA Enterprise Resources
Actual Adoption of EAA
Pearson Correlation 1 .317** Sig. (2-tailed) .000
N 310 310 Enterprise Resources
Pearson Correlation .317** 1 Sig. (2-tailed) .000
N 310 310 **. Correlation is significant at the 0.01 level (2-tailed).
Source: Author Conceptualisation
Pearson Correlation Coefficients is .317, thus indicating that there is a positive
relationship between Enterprise Resources and actual adoption of EAA. The findings
on association suggest that in general there is a positive relationship between external
factors and Actual Adoption of EAA bearing the change of the sign in mind.
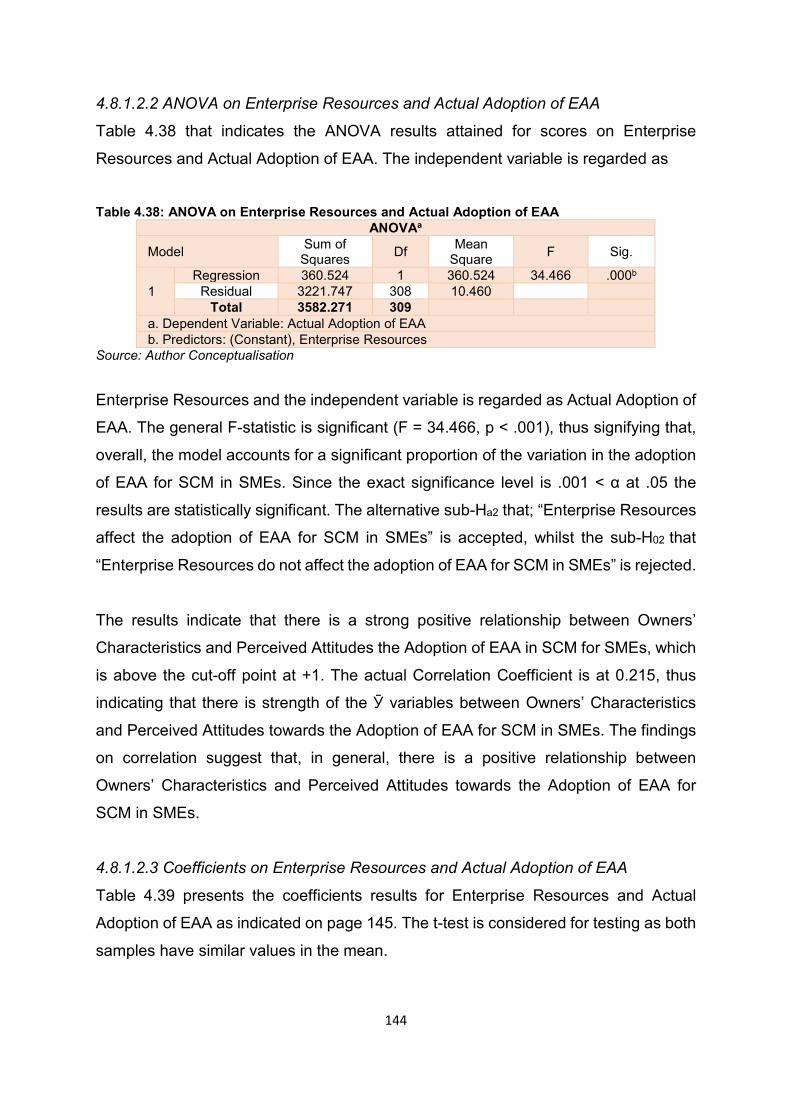
144
4.8.1.2.2 ANOVA on Enterprise Resources and Actual Adoption of EAA
Table 4.38 that indicates the ANOVA results attained for scores on Enterprise
Resources and Actual Adoption of EAA. The independent variable is regarded as
Table 4.38: ANOVA on Enterprise Resources and Actual Adoption of EAA
ANOVAa
Model Sum of Squares Df Mean
Square F Sig.
1 Regression 360.524 1 360.524 34.466 .000b
Residual 3221.747 308 10.460 Total 3582.271 309
a. Dependent Variable: Actual Adoption of EAA b. Predictors: (Constant), Enterprise Resources
Source: Author Conceptualisation
Enterprise Resources and the independent variable is regarded as Actual Adoption of
EAA. The general F-statistic is significant (F = 34.466, p ˂ .001), thus signifying that,
overall, the model accounts for a significant proportion of the variation in the adoption
of EAA for SCM in SMEs. Since the exact significance level is .001 ˂ α at .05 the
results are statistically significant. The alternative sub-Ha2 that; “Enterprise Resources
affect the adoption of EAA for SCM in SMEs” is accepted, whilst the sub-H02 that
“Enterprise Resources do not affect the adoption of EAA for SCM in SMEs” is rejected.
The results indicate that there is a strong positive relationship between Owners’
Characteristics and Perceived Attitudes the Adoption of EAA in SCM for SMEs, which
is above the cut-off point at +1. The actual Correlation Coefficient is at 0.215, thus
indicating that there is strength of the Ӯ variables between Owners’ Characteristics
and Perceived Attitudes towards the Adoption of EAA for SCM in SMEs. The findings
on correlation suggest that, in general, there is a positive relationship between
Owners’ Characteristics and Perceived Attitudes towards the Adoption of EAA for
SCM in SMEs.
4.8.1.2.3 Coefficients on Enterprise Resources and Actual Adoption of EAA
Table 4.39 presents the coefficients results for Enterprise Resources and Actual
Adoption of EAA as indicated on page 145. The t-test is considered for testing as both
samples have similar values in the mean.
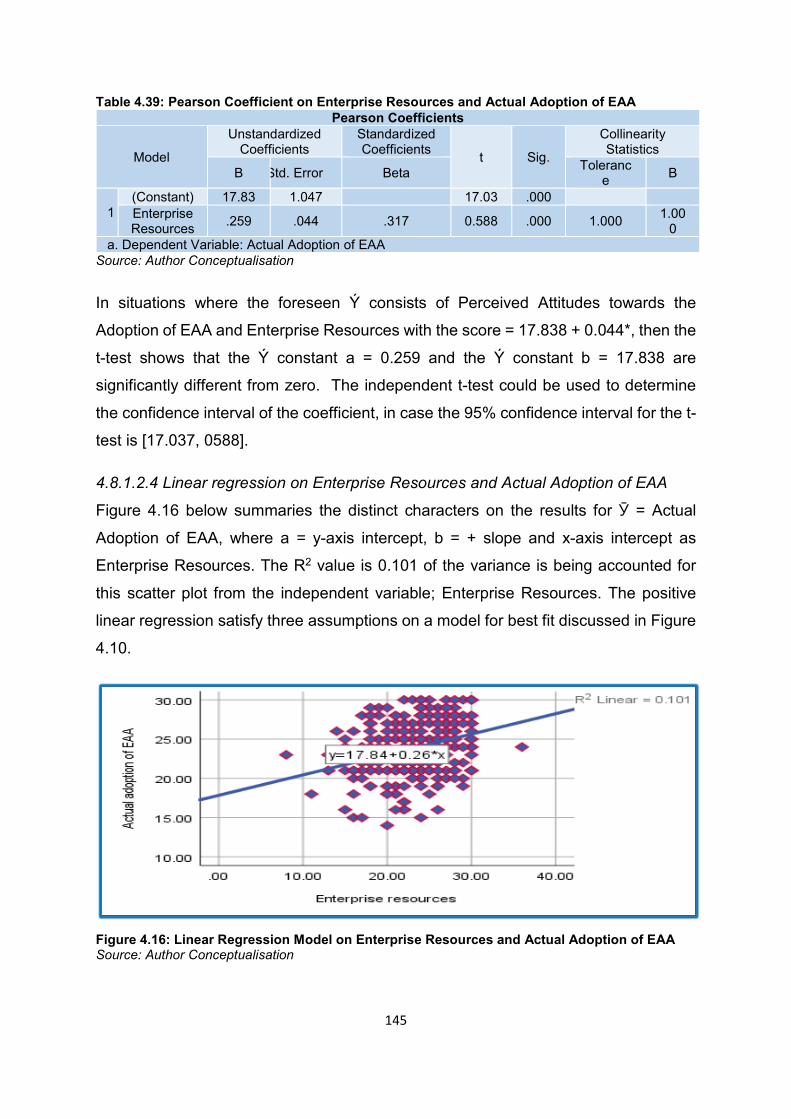
145
Table 4.39: Pearson Coefficient on Enterprise Resources and Actual Adoption of EAA Pearson Coefficients
Model
Unstandardized Coefficients
Standardized Coefficients t Sig.
Collinearity Statistics
B Std. Error Beta Tolerance B
1 (Constant) 17.83 1.047 17.03 .000 Enterprise Resources .259 .044 .317 0.588 .000 1.000 1.00
0 a. Dependent Variable: Actual Adoption of EAA
Source: Author Conceptualisation
In situations where the foreseen Ý consists of Perceived Attitudes towards the
Adoption of EAA and Enterprise Resources with the score = 17.838 + 0.044*, then the
t-test shows that the Ý constant a = 0.259 and the Ý constant b = 17.838 are
significantly different from zero. The independent t-test could be used to determine
the confidence interval of the coefficient, in case the 95% confidence interval for the t-
test is [17.037, 0588]. 4.8.1.2.4 Linear regression on Enterprise Resources and Actual Adoption of EAA
Figure 4.16 below summaries the distinct characters on the results for Ӯ = Actual
Adoption of EAA, where a = y-axis intercept, b = + slope and x-axis intercept as
Enterprise Resources. The R2 value is 0.101 of the variance is being accounted for
this scatter plot from the independent variable; Enterprise Resources. The positive
linear regression satisfy three assumptions on a model for best fit discussed in Figure
4.10.
Figure 4.16: Linear Regression Model on Enterprise Resources and Actual Adoption of EAA Source: Author Conceptualisation
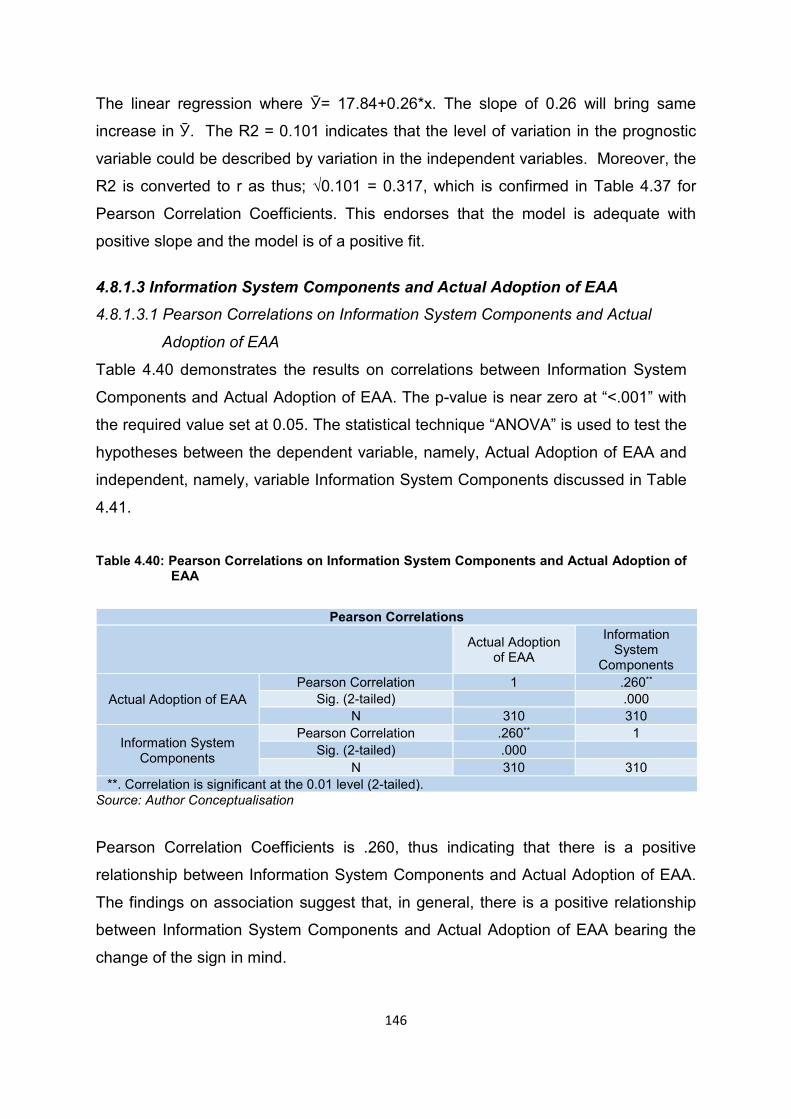
146
The linear regression where Ӯ= 17.84+0.26*x. The slope of 0.26 will bring same
increase in Ӯ. The R2 = 0.101 indicates that the level of variation in the prognostic
variable could be described by variation in the independent variables. Moreover, the
R2 is converted to r as thus; √0.101 = 0.317, which is confirmed in Table 4.37 for
Pearson Correlation Coefficients. This endorses that the model is adequate with
positive slope and the model is of a positive fit.
4.8.1.3 Information System Components and Actual Adoption of EAA 4.8.1.3.1 Pearson Correlations on Information System Components and Actual
Adoption of EAA
Table 4.40 demonstrates the results on correlations between Information System
Components and Actual Adoption of EAA. The p-value is near zero at “˂.001” with
the required value set at 0.05. The statistical technique “ANOVA” is used to test the
hypotheses between the dependent variable, namely, Actual Adoption of EAA and
independent, namely, variable Information System Components discussed in Table
4.41.
Table 4.40: Pearson Correlations on Information System Components and Actual Adoption of
EAA
Source: Author Conceptualisation Pearson Correlation Coefficients is .260, thus indicating that there is a positive
relationship between Information System Components and Actual Adoption of EAA.
The findings on association suggest that, in general, there is a positive relationship
between Information System Components and Actual Adoption of EAA bearing the
change of the sign in mind.
Pearson Correlations
Actual Adoption of EAA
Information System
Components
Actual Adoption of EAA Pearson Correlation 1 .260**
Sig. (2-tailed) .000 N 310 310
Information System Components
Pearson Correlation .260** 1 Sig. (2-tailed) .000
N 310 310 **. Correlation is significant at the 0.01 level (2-tailed).
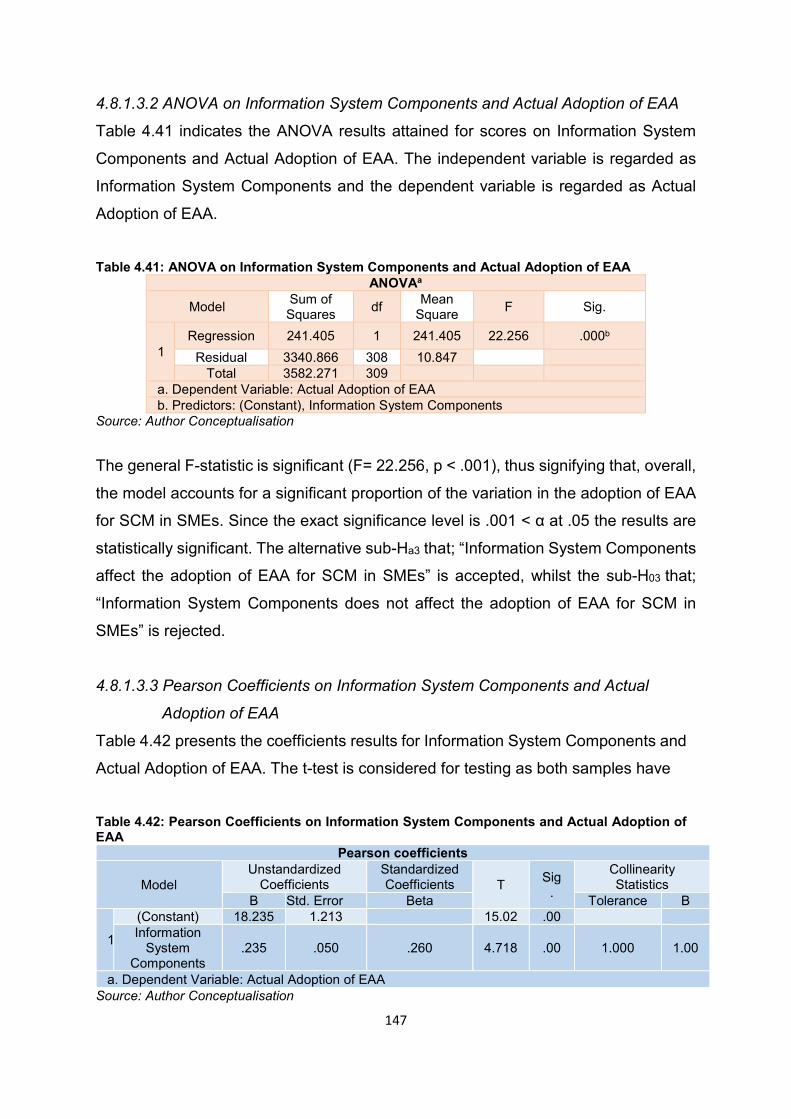
147
4.8.1.3.2 ANOVA on Information System Components and Actual Adoption of EAA
Table 4.41 indicates the ANOVA results attained for scores on Information System
Components and Actual Adoption of EAA. The independent variable is regarded as
Information System Components and the dependent variable is regarded as Actual
Adoption of EAA.
Table 4.41: ANOVA on Information System Components and Actual Adoption of EAA
ANOVAa
Model Sum of Squares df Mean
Square F Sig.
1 Regression 241.405 1 241.405 22.256 .000b
Residual 3340.866 308 10.847 Total 3582.271 309
a. Dependent Variable: Actual Adoption of EAA b. Predictors: (Constant), Information System Components
Source: Author Conceptualisation
The general F-statistic is significant (F= 22.256, p ˂ .001), thus signifying that, overall,
the model accounts for a significant proportion of the variation in the adoption of EAA
for SCM in SMEs. Since the exact significance level is .001 ˂ α at .05 the results are
statistically significant. The alternative sub-Ha3 that; “Information System Components
affect the adoption of EAA for SCM in SMEs” is accepted, whilst the sub-H03 that;
“Information System Components does not affect the adoption of EAA for SCM in
SMEs” is rejected.
4.8.1.3.3 Pearson Coefficients on Information System Components and Actual
Adoption of EAA
Table 4.42 presents the coefficients results for Information System Components and
Actual Adoption of EAA. The t-test is considered for testing as both samples have
Table 4.42: Pearson Coefficients on Information System Components and Actual Adoption of EAA
Pearson coefficients
Model Unstandardized
Coefficients Standardized Coefficients T Sig
.
Collinearity Statistics
B Std. Error Beta Tolerance B
1
(Constant) 18.235 1.213 15.02 .00 Information
System Components
.235 .050 .260 4.718 .00 1.000 1.00
a. Dependent Variable: Actual Adoption of EAA Source: Author Conceptualisation
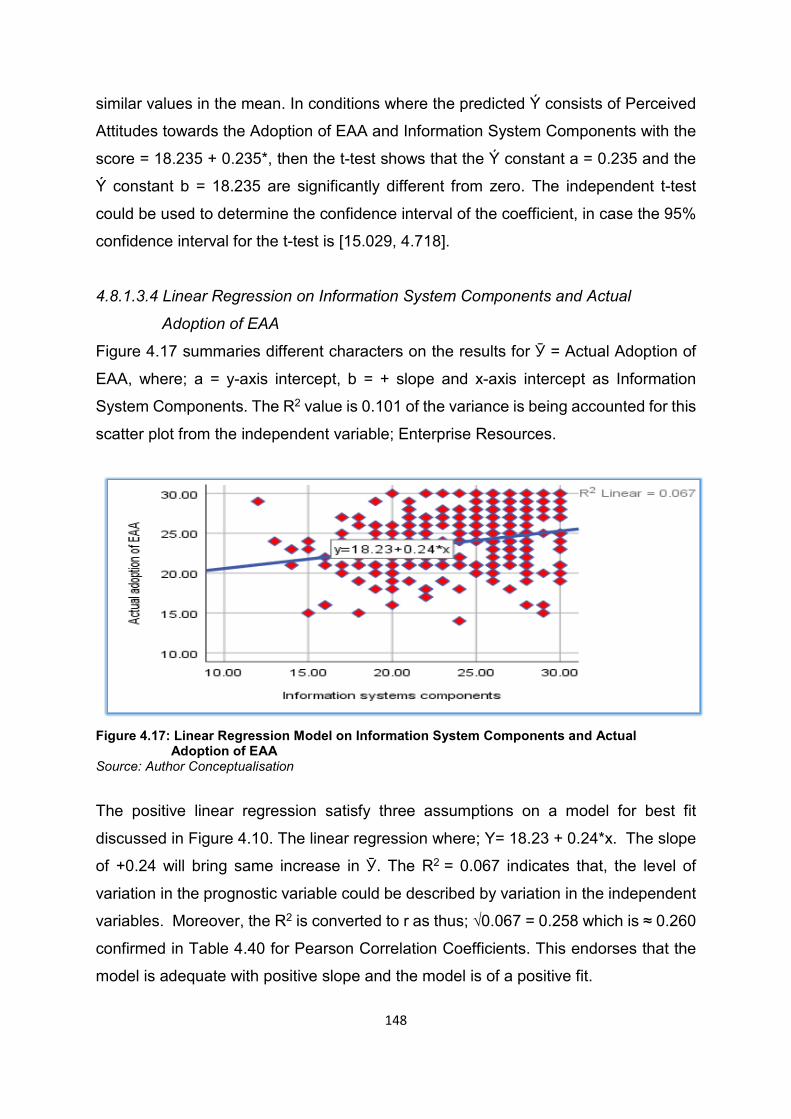
148
similar values in the mean. In conditions where the predicted Ý consists of Perceived
Attitudes towards the Adoption of EAA and Information System Components with the
score = 18.235 + 0.235*, then the t-test shows that the Ý constant a = 0.235 and the
Ý constant b = 18.235 are significantly different from zero. The independent t-test
could be used to determine the confidence interval of the coefficient, in case the 95%
confidence interval for the t-test is [15.029, 4.718].
4.8.1.3.4 Linear Regression on Information System Components and Actual
Adoption of EAA
Figure 4.17 summaries different characters on the results for Ӯ = Actual Adoption of
EAA, where; a = y-axis intercept, b = + slope and x-axis intercept as Information
System Components. The R2 value is 0.101 of the variance is being accounted for this
scatter plot from the independent variable; Enterprise Resources.
Figure 4.17: Linear Regression Model on Information System Components and Actual
Adoption of EAA Source: Author Conceptualisation
The positive linear regression satisfy three assumptions on a model for best fit
discussed in Figure 4.10. The linear regression where; Y= 18.23 + 0.24*x. The slope
of +0.24 will bring same increase in Ӯ. The R2 = 0.067 indicates that, the level of
variation in the prognostic variable could be described by variation in the independent
variables. Moreover, the R2 is converted to r as thus; √0.067 = 0.258 which is ≈ 0.260
confirmed in Table 4.40 for Pearson Correlation Coefficients. This endorses that the
model is adequate with positive slope and the model is of a positive fit.
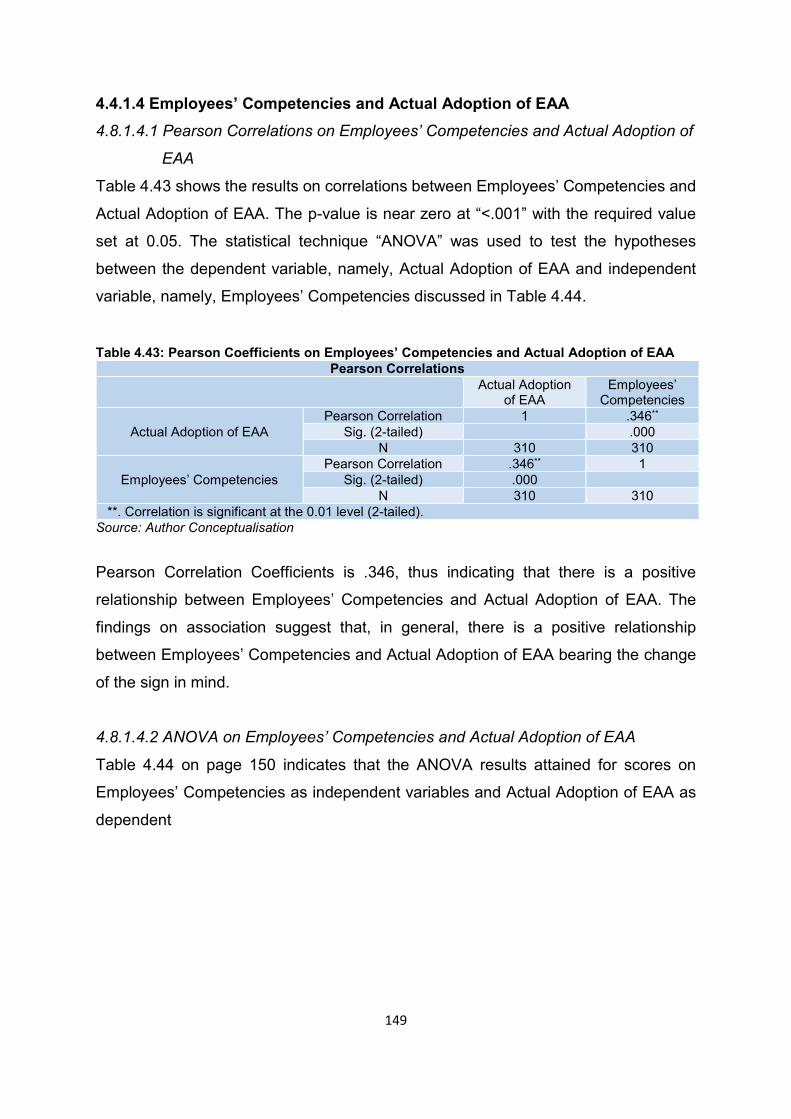
149
4.4.1.4 Employees’ Competencies and Actual Adoption of EAA 4.8.1.4.1 Pearson Correlations on Employees’ Competencies and Actual Adoption of
EAA
Table 4.43 shows the results on correlations between Employees’ Competencies and
Actual Adoption of EAA. The p-value is near zero at “˂.001” with the required value
set at 0.05. The statistical technique “ANOVA” was used to test the hypotheses
between the dependent variable, namely, Actual Adoption of EAA and independent
variable, namely, Employees’ Competencies discussed in Table 4.44. Table 4.43: Pearson Coefficients on Employees’ Competencies and Actual Adoption of EAA
Pearson Correlations
Actual Adoption of EAA
Employees’ Competencies
Actual Adoption of EAA Pearson Correlation 1 .346**
Sig. (2-tailed) .000 N 310 310
Employees’ Competencies Pearson Correlation .346** 1
Sig. (2-tailed) .000 N 310 310
**. Correlation is significant at the 0.01 level (2-tailed). Source: Author Conceptualisation
Pearson Correlation Coefficients is .346, thus indicating that there is a positive
relationship between Employees’ Competencies and Actual Adoption of EAA. The
findings on association suggest that, in general, there is a positive relationship
between Employees’ Competencies and Actual Adoption of EAA bearing the change
of the sign in mind.
4.8.1.4.2 ANOVA on Employees’ Competencies and Actual Adoption of EAA
Table 4.44 on page 150 indicates that the ANOVA results attained for scores on
Employees’ Competencies as independent variables and Actual Adoption of EAA as
dependent
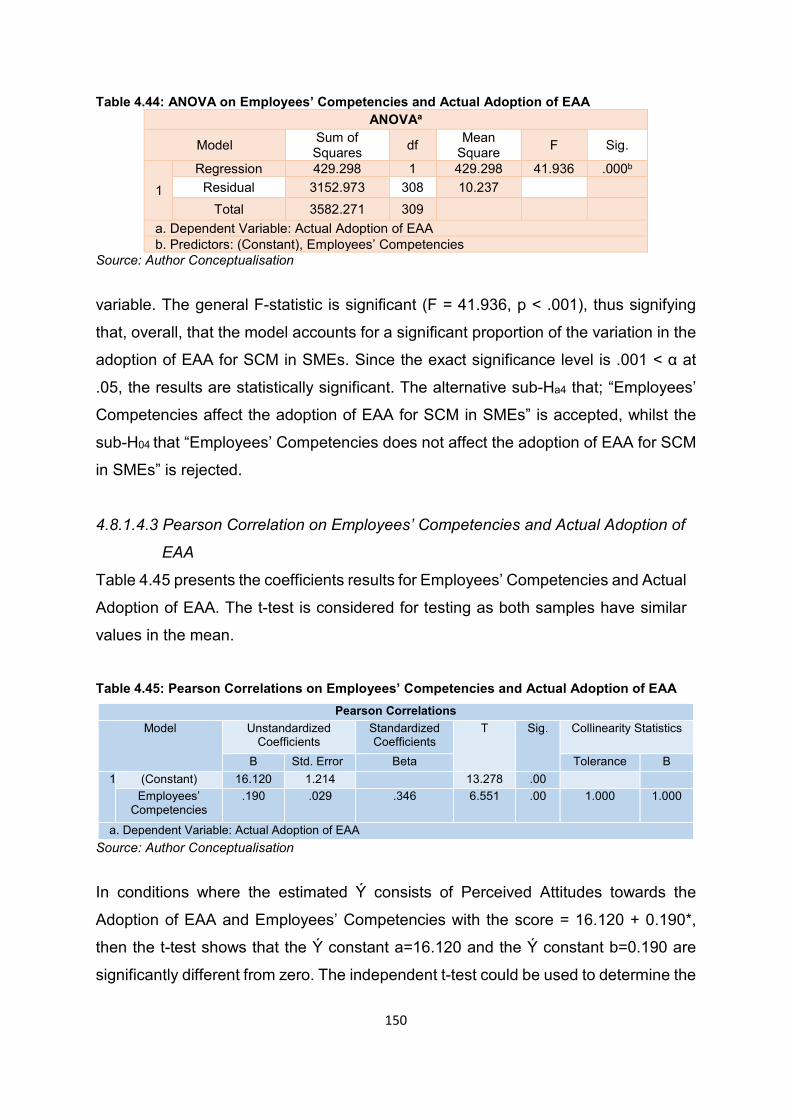
150
Table 4.44: ANOVA on Employees’ Competencies and Actual Adoption of EAA ANOVAa
Model Sum of Squares df Mean
Square F Sig.
1 Regression 429.298 1 429.298 41.936 .000b
Residual 3152.973 308 10.237 Total 3582.271 309
a. Dependent Variable: Actual Adoption of EAA b. Predictors: (Constant), Employees’ Competencies
Source: Author Conceptualisation
variable. The general F-statistic is significant (F = 41.936, p ˂ .001), thus signifying
that, overall, that the model accounts for a significant proportion of the variation in the
adoption of EAA for SCM in SMEs. Since the exact significance level is .001 ˂ α at
.05, the results are statistically significant. The alternative sub-Ha4 that; “Employees’
Competencies affect the adoption of EAA for SCM in SMEs” is accepted, whilst the
sub-H04 that “Employees’ Competencies does not affect the adoption of EAA for SCM
in SMEs” is rejected.
4.8.1.4.3 Pearson Correlation on Employees’ Competencies and Actual Adoption of
EAA
Table 4.45 presents the coefficients results for Employees’ Competencies and Actual
Adoption of EAA. The t-test is considered for testing as both samples have similar
values in the mean.
Table 4.45: Pearson Correlations on Employees’ Competencies and Actual Adoption of EAA
Source: Author Conceptualisation In conditions where the estimated Ý consists of Perceived Attitudes towards the
Adoption of EAA and Employees’ Competencies with the score = 16.120 + 0.190*,
then the t-test shows that the Ý constant a=16.120 and the Ý constant b=0.190 are
significantly different from zero. The independent t-test could be used to determine the
Pearson Correlations Model Unstandardized
Coefficients Standardized Coefficients
T Sig. Collinearity Statistics
B Std. Error Beta Tolerance B 1 (Constant) 16.120 1.214 13.278 .00
Employees’ Competencies
.190 .029 .346 6.551 .00 1.000 1.000
a. Dependent Variable: Actual Adoption of EAA
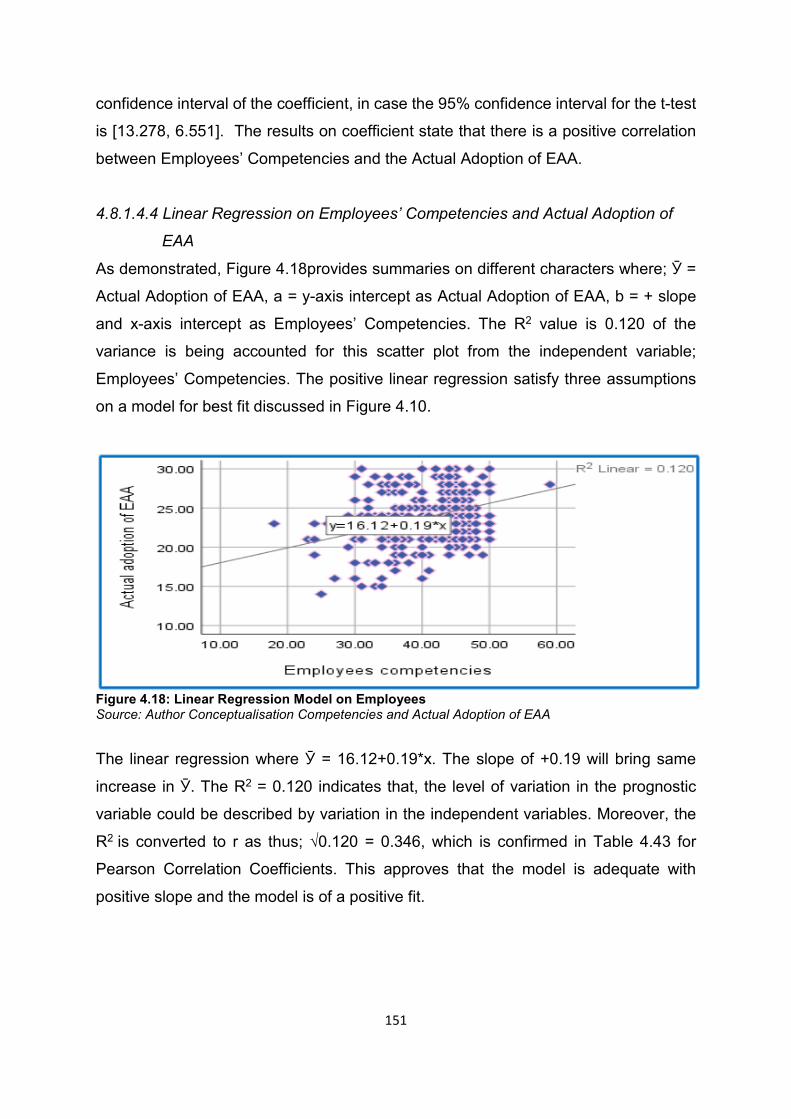
151
confidence interval of the coefficient, in case the 95% confidence interval for the t-test
is [13.278, 6.551]. The results on coefficient state that there is a positive correlation
between Employees’ Competencies and the Actual Adoption of EAA.
4.8.1.4.4 Linear Regression on Employees’ Competencies and Actual Adoption of
EAA
As demonstrated, Figure 4.18provides summaries on different characters where; Ӯ =
Actual Adoption of EAA, a = y-axis intercept as Actual Adoption of EAA, b = + slope
and x-axis intercept as Employees’ Competencies. The R2 value is 0.120 of the
variance is being accounted for this scatter plot from the independent variable;
Employees’ Competencies. The positive linear regression satisfy three assumptions
on a model for best fit discussed in Figure 4.10.
Figure 4.18: Linear Regression Model on Employees Source: Author Conceptualisation Competencies and Actual Adoption of EAA
The linear regression where Ӯ = 16.12+0.19*x. The slope of +0.19 will bring same
increase in Ӯ. The R2 = 0.120 indicates that, the level of variation in the prognostic
variable could be described by variation in the independent variables. Moreover, the
R2 is converted to r as thus; √0.120 = 0.346, which is confirmed in Table 4.43 for
Pearson Correlation Coefficients. This approves that the model is adequate with
positive slope and the model is of a positive fit.
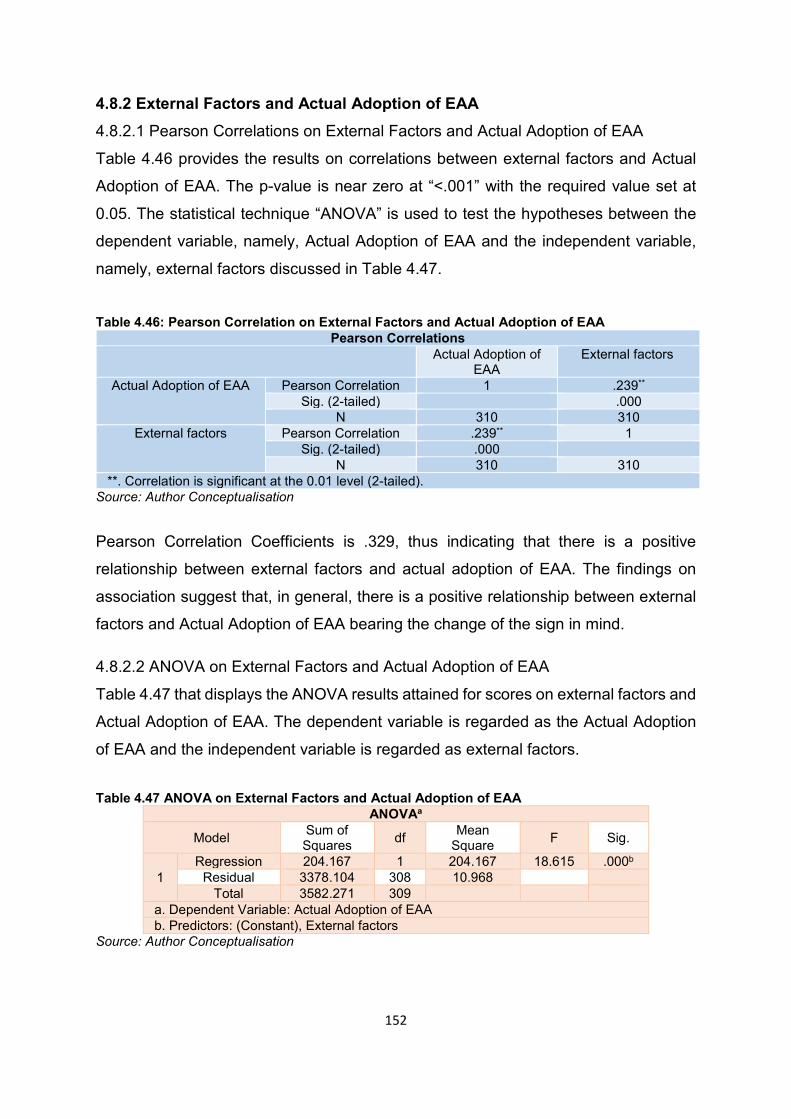
152
4.8.2 External Factors and Actual Adoption of EAA 4.8.2.1 Pearson Correlations on External Factors and Actual Adoption of EAA
Table 4.46 provides the results on correlations between external factors and Actual
Adoption of EAA. The p-value is near zero at “˂.001” with the required value set at
0.05. The statistical technique “ANOVA” is used to test the hypotheses between the
dependent variable, namely, Actual Adoption of EAA and the independent variable,
namely, external factors discussed in Table 4.47.
Table 4.46: Pearson Correlation on External Factors and Actual Adoption of EAA
Pearson Correlations Actual Adoption of
EAA External factors
Actual Adoption of EAA Pearson Correlation 1 .239** Sig. (2-tailed) .000
N 310 310 External factors Pearson Correlation .239** 1
Sig. (2-tailed) .000 N 310 310
**. Correlation is significant at the 0.01 level (2-tailed). Source: Author Conceptualisation
Pearson Correlation Coefficients is .329, thus indicating that there is a positive
relationship between external factors and actual adoption of EAA. The findings on
association suggest that, in general, there is a positive relationship between external
factors and Actual Adoption of EAA bearing the change of the sign in mind. 4.8.2.2 ANOVA on External Factors and Actual Adoption of EAA
Table 4.47 that displays the ANOVA results attained for scores on external factors and
Actual Adoption of EAA. The dependent variable is regarded as the Actual Adoption
of EAA and the independent variable is regarded as external factors.
Table 4.47 ANOVA on External Factors and Actual Adoption of EAA ANOVAa
Model Sum of Squares df Mean
Square F Sig.
1 Regression 204.167 1 204.167 18.615 .000b
Residual 3378.104 308 10.968 Total 3582.271 309
a. Dependent Variable: Actual Adoption of EAA b. Predictors: (Constant), External factors
Source: Author Conceptualisation
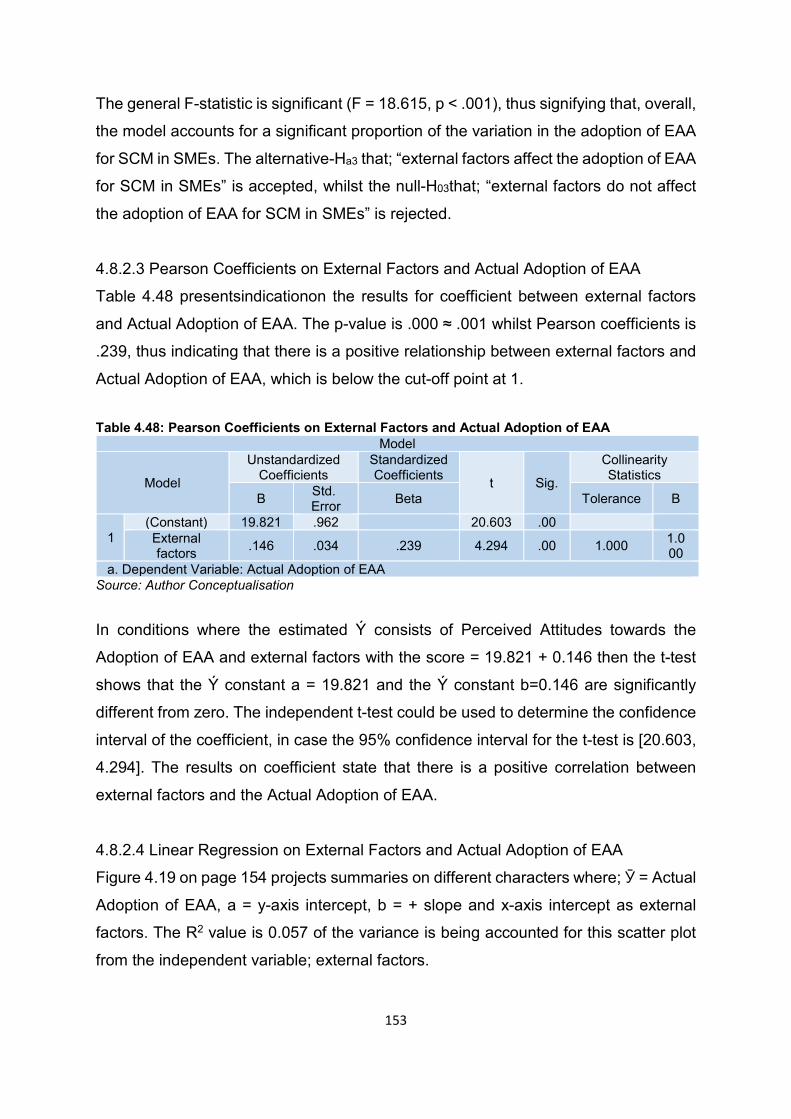
153
The general F-statistic is significant (F = 18.615, p ˂ .001), thus signifying that, overall,
the model accounts for a significant proportion of the variation in the adoption of EAA
for SCM in SMEs. The alternative-Ha3 that; “external factors affect the adoption of EAA
for SCM in SMEs” is accepted, whilst the null-H03that; “external factors do not affect
the adoption of EAA for SCM in SMEs” is rejected.
4.8.2.3 Pearson Coefficients on External Factors and Actual Adoption of EAA
Table 4.48 presentsindicationon the results for coefficient between external factors
and Actual Adoption of EAA. The p-value is .000 ≈ .001 whilst Pearson coefficients is
.239, thus indicating that there is a positive relationship between external factors and
Actual Adoption of EAA, which is below the cut-off point at 1.
Table 4.48: Pearson Coefficients on External Factors and Actual Adoption of EAA Model
Model
Unstandardized Coefficients
Standardized Coefficients t Sig.
Collinearity Statistics
B Std. Error Beta Tolerance B
1 (Constant) 19.821 .962 20.603 .00 External factors .146 .034 .239 4.294 .00 1.000 1.0
00 a. Dependent Variable: Actual Adoption of EAA
Source: Author Conceptualisation
In conditions where the estimated Ý consists of Perceived Attitudes towards the
Adoption of EAA and external factors with the score = 19.821 + 0.146 then the t-test
shows that the Ý constant a = 19.821 and the Ý constant b=0.146 are significantly
different from zero. The independent t-test could be used to determine the confidence
interval of the coefficient, in case the 95% confidence interval for the t-test is [20.603,
4.294]. The results on coefficient state that there is a positive correlation between
external factors and the Actual Adoption of EAA.
4.8.2.4 Linear Regression on External Factors and Actual Adoption of EAA
Figure 4.19 on page 154 projects summaries on different characters where; Ӯ = Actual
Adoption of EAA, a = y-axis intercept, b = + slope and x-axis intercept as external
factors. The R2 value is 0.057 of the variance is being accounted for this scatter plot
from the independent variable; external factors.
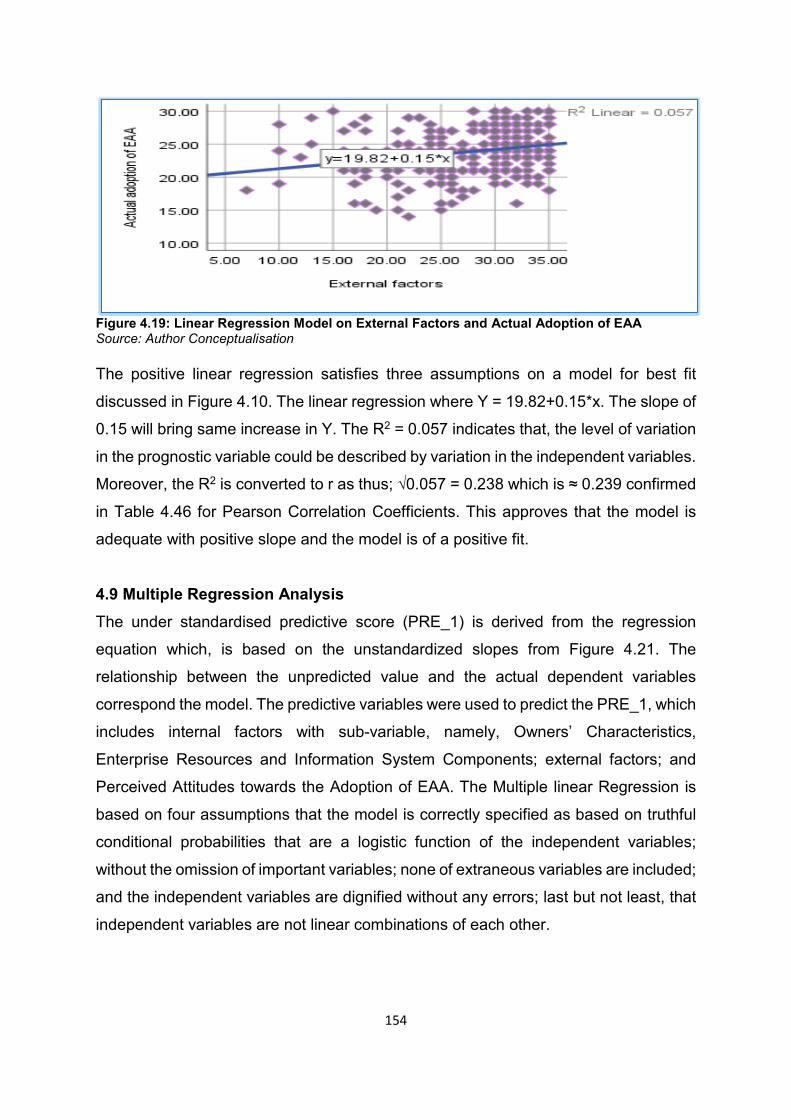
154
Figure 4.19: Linear Regression Model on External Factors and Actual Adoption of EAA Source: Author Conceptualisation The positive linear regression satisfies three assumptions on a model for best fit
discussed in Figure 4.10. The linear regression where Y = 19.82+0.15*x. The slope of
0.15 will bring same increase in Y. The R2 = 0.057 indicates that, the level of variation
in the prognostic variable could be described by variation in the independent variables.
Moreover, the R2 is converted to r as thus; √0.057 = 0.238 which is ≈ 0.239 confirmed
in Table 4.46 for Pearson Correlation Coefficients. This approves that the model is
adequate with positive slope and the model is of a positive fit.
4.9 Multiple Regression Analysis The under standardised predictive score (PRE_1) is derived from the regression
equation which, is based on the unstandardized slopes from Figure 4.21. The
relationship between the unpredicted value and the actual dependent variables
correspond the model. The predictive variables were used to predict the PRE_1, which
includes internal factors with sub-variable, namely, Owners’ Characteristics,
Enterprise Resources and Information System Components; external factors; and
Perceived Attitudes towards the Adoption of EAA. The Multiple linear Regression is
based on four assumptions that the model is correctly specified as based on truthful
conditional probabilities that are a logistic function of the independent variables;
without the omission of important variables; none of extraneous variables are included;
and the independent variables are dignified without any errors; last but not least, that
independent variables are not linear combinations of each other.
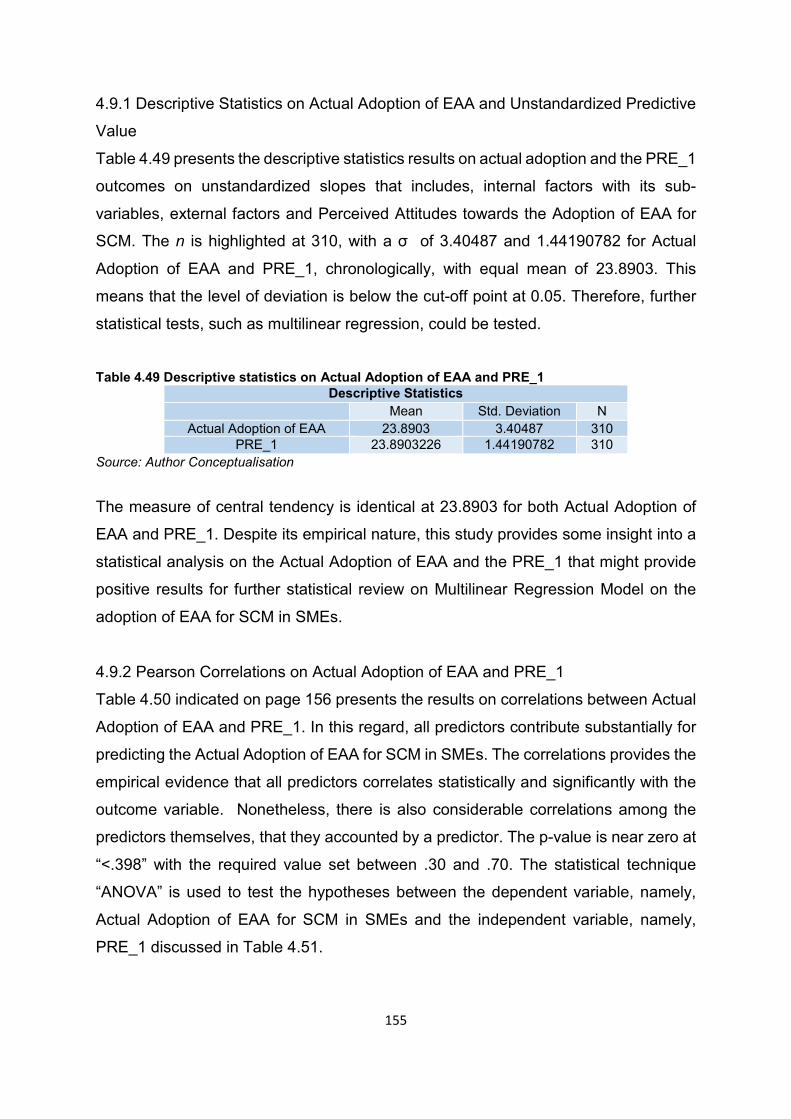
155
4.9.1 Descriptive Statistics on Actual Adoption of EAA and Unstandardized Predictive
Value
Table 4.49 presents the descriptive statistics results on actual adoption and the PRE_1
outcomes on unstandardized slopes that includes, internal factors with its sub-
variables, external factors and Perceived Attitudes towards the Adoption of EAA for
SCM. The n is highlighted at 310, with a σ of 3.40487 and 1.44190782 for Actual
Adoption of EAA and PRE_1, chronologically, with equal mean of 23.8903. This
means that the level of deviation is below the cut-off point at 0.05. Therefore, further
statistical tests, such as multilinear regression, could be tested.
Table 4.49 Descriptive statistics on Actual Adoption of EAA and PRE_1
Descriptive Statistics Mean Std. Deviation N
Actual Adoption of EAA 23.8903 3.40487 310 PRE_1 23.8903226 1.44190782 310
Source: Author Conceptualisation
The measure of central tendency is identical at 23.8903 for both Actual Adoption of
EAA and PRE_1. Despite its empirical nature, this study provides some insight into a
statistical analysis on the Actual Adoption of EAA and the PRE_1 that might provide
positive results for further statistical review on Multilinear Regression Model on the
adoption of EAA for SCM in SMEs.
4.9.2 Pearson Correlations on Actual Adoption of EAA and PRE_1
Table 4.50 indicated on page 156 presents the results on correlations between Actual
Adoption of EAA and PRE_1. In this regard, all predictors contribute substantially for
predicting the Actual Adoption of EAA for SCM in SMEs. The correlations provides the
empirical evidence that all predictors correlates statistically and significantly with the
outcome variable. Nonetheless, there is also considerable correlations among the
predictors themselves, that they accounted by a predictor. The p-value is near zero at
“˂.398” with the required value set between .30 and .70. The statistical technique
“ANOVA” is used to test the hypotheses between the dependent variable, namely,
Actual Adoption of EAA for SCM in SMEs and the independent variable, namely,
PRE_1 discussed in Table 4.51.

156
Table 4.50: Pearson Correlations on Actual Adoption of EAA and PRE_1 Pearson Correlations
Actual Adoption of EAA PRE_1 Actual Adoption of
EAA Pearson Correlation 1 .398**
Sig. (2-tailed) .000 N 310 310
PRE_1 Pearson Correlation .398** 1 Sig. (2-tailed) .000
N 310 310 **. Correlation is significant at the 0.01 level (2-tailed).
Source: Author Conceptualisation
Pearson Correlation Coefficients is .398, thus indicating that there is a positive
relationship between PRE_1 and actual adoption of EAA. The findings on association
suggest that, in general, there is a positive relationship between PRE_1 and Actual
Adoption of EAA.
4.9.3 ANOVA between Actual Adoption of EAA and PRE_1
Table 4.51 exhibits the ANOVA results attained for scores on Actual Adoption of EAA
and PRE_1. The dependent variable is regarded as the Actual Adoption of EAA
Table 4.51: ANOVA between Actual Adoption of EAA and PRE_1 ANOVAa
Model Sum of Squares Df Mean
Square F Sig.
1
Regression 566.070 1 566.070 57.804 .000b
Residual 3016.201 308 9.793 Total 3582.271 309
a. Dependent Variable: Actual Adoption of EAA b. Predictors: (Constant), PRE_1
Source: Author Conceptualisation
and the independent variable is regarded as PRE_1. The general F-statistic is
significant (F = 57.804, p ˂ .001), thus signifying that, overall, the model accounts for
a significant proportion of the variation in the adoption of EAA for SCM in SMEs. The
alternative sub-Ha4 that; “PRE_1 affect the adoption of EAA for SCM in SMEs” is
accepted, whilst the sub-H04 that; “PRE_1 does not affect the adoption of EAA for SCM
in SMEs” is rejected.
4.9.4 Coefficients between Actual Adoption of EAA and PRE_1
Table 4.52 indicated on page 157 presents signal on the results for coefficient between
Actual Adoption of EAA and PRE_1. The p-value is 1.000 whilst Pearson coefficients
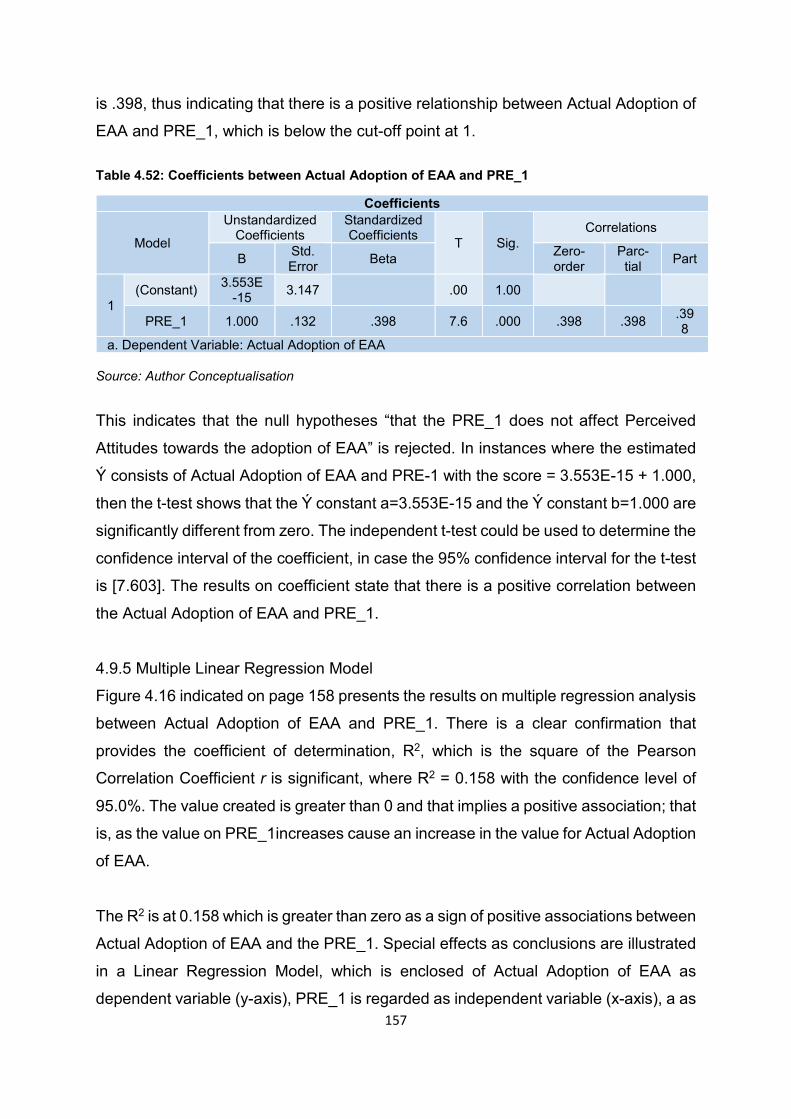
157
is .398, thus indicating that there is a positive relationship between Actual Adoption of
EAA and PRE_1, which is below the cut-off point at 1.
Table 4.52: Coefficients between Actual Adoption of EAA and PRE_1
Source: Author Conceptualisation
This indicates that the null hypotheses “that the PRE_1 does not affect Perceived
Attitudes towards the adoption of EAA” is rejected. In instances where the estimated
Ý consists of Actual Adoption of EAA and PRE-1 with the score = 3.553E-15 + 1.000,
then the t-test shows that the Ý constant a=3.553E-15 and the Ý constant b=1.000 are
significantly different from zero. The independent t-test could be used to determine the
confidence interval of the coefficient, in case the 95% confidence interval for the t-test
is [7.603]. The results on coefficient state that there is a positive correlation between
the Actual Adoption of EAA and PRE_1.
4.9.5 Multiple Linear Regression Model
Figure 4.16 indicated on page 158 presents the results on multiple regression analysis
between Actual Adoption of EAA and PRE_1. There is a clear confirmation that
provides the coefficient of determination, R2, which is the square of the Pearson
Correlation Coefficient r is significant, where R2 = 0.158 with the confidence level of
95.0%. The value created is greater than 0 and that implies a positive association; that
is, as the value on PRE_1increases cause an increase in the value for Actual Adoption
of EAA.
The R2 is at 0.158 which is greater than zero as a sign of positive associations between
Actual Adoption of EAA and the PRE_1. Special effects as conclusions are illustrated
in a Linear Regression Model, which is enclosed of Actual Adoption of EAA as
dependent variable (y-axis), PRE_1 is regarded as independent variable (x-axis), a as
Coefficients
Model
Unstandardized Coefficients
Standardized Coefficients T Sig.
Correlations
B Std. Error Beta Zero-
order Parc-tial Part
1 (Constant) 3.553E
-15 3.147 .00 1.00
PRE_1 1.000 .132 .398 7.6 .000 .398 .398 .398
a. Dependent Variable: Actual Adoption of EAA
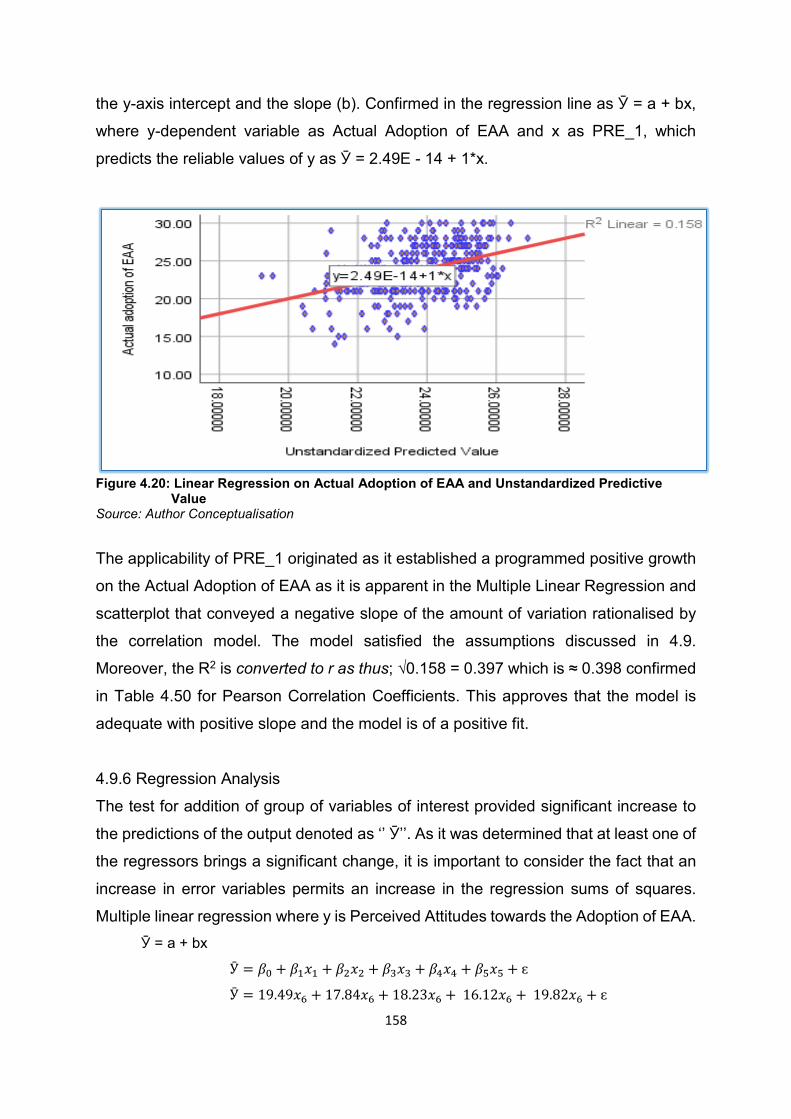
158
the y-axis intercept and the slope (b). Confirmed in the regression line as Ӯ = a + bx,
where y-dependent variable as Actual Adoption of EAA and x as PRE_1, which
predicts the reliable values of y as Ӯ = 2.49E - 14 + 1*x.
Figure 4.20: Linear Regression on Actual Adoption of EAA and Unstandardized Predictive
Value Source: Author Conceptualisation
The applicability of PRE_1 originated as it established a programmed positive growth
on the Actual Adoption of EAA as it is apparent in the Multiple Linear Regression and
scatterplot that conveyed a negative slope of the amount of variation rationalised by
the correlation model. The model satisfied the assumptions discussed in 4.9.
Moreover, the R2 is converted to r as thus; √0.158 = 0.397 which is ≈ 0.398 confirmed
in Table 4.50 for Pearson Correlation Coefficients. This approves that the model is
adequate with positive slope and the model is of a positive fit.
4.9.6 Regression Analysis
The test for addition of group of variables of interest provided significant increase to
the predictions of the output denoted as ‘’ Ӯ’’. As it was determined that at least one of
the regressors brings a significant change, it is important to consider the fact that an
increase in error variables permits an increase in the regression sums of squares.
Multiple linear regression where y is Perceived Attitudes towards the Adoption of EAA. Ӯ = a + bx
Ӯ = 𝛽𝛽0 + 𝛽𝛽1𝑥𝑥1 + 𝛽𝛽2𝑥𝑥2 + 𝛽𝛽3𝑥𝑥3 + 𝛽𝛽4𝑥𝑥4 + 𝛽𝛽5𝑥𝑥5 + ɛ
Ӯ = 19.49𝑥𝑥6 + 17.84𝑥𝑥6 + 18.23𝑥𝑥6 + 16.12𝑥𝑥6 + 19.82𝑥𝑥6 + ɛ
159
Where;
Ӯ = dependent variable: the y is the predicted variable in the model. It is plotted on the
vertical axis of a scatterplot.
a = intercept. This is the point at which the regression line crosses the vertical (Y) axis.
Strictly speaking this gives
b = regression Pearson Correlation Coefficients. It is also known as the slope and it
shows the average change in the Y variable (outcome) for a unit change in the X
variable (predictor/explanatory variable).
x = independent variable: the independent variable is used to make forecast about the
values of the response variable located on the horizontal axis of a scatter plot.
Simplified:
Ӯ = Actual Adoption of EAA
X1= Owners’ Characteristics
X2= Enterprise Resources
X3= Information System Components
X4= Employees’ Competencies
X5= External factors
X6= Perceived Attitudes towards the adoption of EAA
160
4.1 Conclusion
This chapter presented the research results and findings for the study that are in line
with the hypotheses and sub-hypotheses for internal factors, external factors,
perceived attitudes, the intention to use EAA and Actual Adoption of EAA. Research
instruments such as descriptive statistics, ANOVA, Pearson Correlation and Pearson
Coefficients on constructs and Linear Regression Model were used for analysing
variables in the form of constructs. Last but not least, the Multinomial Logistic
Regression was used to determine Model Summary, Collinearity Diagnostics and
Casewise Diagnostics; and regression analysis was used to analyse, compare and
make conclusion about all variables to provide joint results.
161
CHAPTER 5: SUMMARY FINDINGS, CONCLUSIONS AND RECOMMENDATIONS 5.1 Introduction The aim of the study was to investigate factors influencing the adoption of EAA for
SCM in SMEs within the Capricorn District Municipality. Both internal and external
factors together with the Perceived Attitudes towards the Adoption of EAA were
aligned and discussed in the conceptual research model. Variables and sub-variables
were identified through literature review and later analysed and interpreted in chapter
four. The sole intention was to explore new findings, draw conclusions and to make
recommendations about internal and external factors impact on the adoption of EAA
for SCM in SMEs for future research studies.
162
5.2 Summary Findings on Internal Factors The preliminary findings were generated under the guided help of both the supervisor
and the co-supervisor, given that they were responsible for the execution of this
research report. The researcher relied much upon their professional background and
level of expertise with regards to facilitating and overseeing this research project over
the previous two years. Its findings are summarised in four all-encompassing
categories below.
5.2.1 Summary of Findings for Internal Factors: Owners’ Characteristics
Internal factors on Owners’ Characteristics were described as assessment of interior
dynamics affecting the enterprise, of which the management have a full control over
them, such as employees, business culture, norms and ethics, processes and overall
functional activities (Voges & Pulakanam; 2011; and Jessee, 2019). In this study, the
internal factors included major variables such as Owners’ Characteristics, with a
number of sub-variables such as passion for enterprise success; creative thinking and
mind-set in risk taking; discipline for action orientation; innovation abilities for hard-
working; vision oriented; and owner’s resilience. Enterprise networks such as
personal, social and extended networking in local business areas and professional
organisations will help in worthwhile pursuits outside of business working hours
through social, personal and extended business networking.
This networking would be possible through business seminars offered by the Small
Enterprise Development Agency (SEDA), the Limpopo Economic Development
Agency (LEDA), the National Youth Development Agency (NYDA) and many of more.
If the enterprise owners would nominate or delegate employees to attend the
enterprise seminars and workshops, there will surely have positive attitudes and
perspectives towards the adoption of EAA. The Diffusion Theory of Innovation serves
as an essential concept in that both the Diffusion Theory of Innovation (DTI) and
Technology Acceptance Models focus on improvement of relationships between
internal factors and the adoption of EAA, which are improved concepts that replace
historical operational systems with entrepreneurial flair in the Fourth Industrial
Revolution.
163
5.2.2 Summary of Findings for Internal Factors: Enterprise Resources
Enterprise Resources were defined as production factors that includes; capital,
machinery, equipment and natural resource that provide SMEs with the means to
perform its operational activities for SCM (Toor, 2016; and Hersey & Blanchard, 2017).
In this study, the Enterprise Resources included sub-variables, such as, Financial
Resources, Competent Human Resources, mainframe or personal computers,
Application Software System, hardware systems and expert personnel. TAM
optimises Enterprise Resources and it becomes increasingly complex, hence the
nature of the product or service offering remains the driving force for the enterprise
success.
Both tangible and intangible resources should be invested into, so that the adoption of
EAA on SCM could be possible for enterprise success. Basic technology could include
the use of internet, fax mail, social media and many more. By approaching the
Department of Small Business Development, Department of Trade and Industry,
Industrial Development Corporation, Land Bank and many more, SMEs could gain
both mentorship and financial assistance for acquiring enterprise knowledge that
would make it possible towards the adoption of EAA for SCM. The Theory of Reasoned
Action (TRA) revealed that behavioural measures on Enterprise Resources that
depends on speculations about the intensions towards the adoption of EAA for SCM.
5.2.3 Summary of Findings for Internal Factors: Information System Components
In this study, Information System Components included sub-variables such as
transaction-support-system, Management Information System, Information System
Components Governance, Decision Support System, Executive Support System,
Knowledge Management Systems and internet and network connectivity. By
incorporating Information System Components with right strategies SMEs could
succeed in the adoption of EAA for SCM. All functional departments need to be linked
directly to Information System Components so that there is an easy flow of data and
information both internally and externally. Outsourcing the EAA activities will make it
easier not to worry about domain; engagement model and governance; business
architecture; and alignment. Architect specialist will focus on troubleshooting and
updating the system. Compatibility in Diffusion Theory of Innovation ascertains that
164
Technology Acceptance Models need to be linked with relevant Information System
Components to have a functional EAA for SCM.
5.2.4 Summary of Findings for Internal Factors: Employees’ Competencies
Employees’ Competencies in this study are seen as self-capabilities in using desktop
computers to process SCM activities in a proficient manner (Tolstoshev, 20117). In
this study, Employees’ Competencies included a handful of sub-variables that were
regarded as the ability to perform the following: using email and internet interfaces;
creating and formulating word documents, tables and columns usage; spreadsheets
utilisation and merging documents; employee communication skills; and creation of
business networking for suppliers and customers that would assist in performing the
SCM activities (Branscombe, 2018). By investing in Employees’ Skills Development
and Training, the SMEs would yield positive results as they will apply their knowledge
and expertise to run a successful SCM activities. The Theory of Planned Behaviour
(TPB) encourages apparent behaviour on control for supplementary forecaster on
intentions of employees towards the adoption of EAA for SCM in SMEs
5.3 Summary of Findings on External Factors External factors were regarded as outside world influences that the enterprise have
limited control over and they affect the internal enterprise decision making on SCM
activities (Hawks, 2019). In this study, the external factors included complex legal and
regulatory constraints; lack of external financing; low technological capacity; relative
advantage; compatibility of computer systems; customisability of EAA to the enterprise
and external users; and information security that hampers the adoption of EAA for
SCM. Legal and statutory requirements in Information Technology need to be
acknowledged and practised to avoid any legal actions against the SMEs.
Consultations with government parastatals or legal representatives of the enterprise
would save the SMEs against any unforeseen challenges such as product liabilities,
legal costs on lawsuit, tax evasion or avoidance penalties so forth.
5.4 Summary of Findings on Perceived Attitudes towards the Adoption of EAA Perceived attitudes are regarded as the state of psychological readiness and
enthusiasm to respond on certain aspect of enterprise challenges grounded on past
165
experience, exerting a directive or dynamic influence on the individual’s reaction to all
objects and situations to enhance the routine activities with excellent performance
(Harry et al., 2007). In this study, perceived attitudes include four aspects, namely,
Alternative User-Base Solutions; low Technological Aversion; vulnerability and
stochasticity; and resistance to change. The entrepreneurial or managerial risk is
linked to the attitudes of a firm’s owner-manager or management and the challenge of
mixing and confusing individual needs with organisational goals.
Proper procedure such as introduction, induction and orientation to the adoption of
EAA for SCM would help the employees to have better background and the ability to
confront any challenges as they arise. The Diffusion Theory of Innovation (TRA)
proposes that the Perceived Attitudes towards the Adoption of EAA have is affected
by behaviour challenges from employees’ personal conduct that affect SCM activities
within the SMEs.
5.5 Summary of Findings on Actual Adoption of EAA Actual adoption was well-defined as an instrument and apparatus that focuses on the
internal and external gaps faced by SMEs and by taking advantage of TAM such as
EAA that would ease the SCM activities across all functional departments of
specialisation that services as innovative practices for specific activities (Chen & Tsou,
2017). Summing up the results, it can be concluded that Actual Adoption of EAA was
measured with three major objective of EAA, namely, improving the job performance,
provision of critical support base and enhancing SCM activities. The Actual Adoption
of EAA is based on tangible evidence but not ambitious evidence, as based on the
assumption that most of SMEs owners are not enterprise architects meaning that they
are regarded as the end-user with limited background on the fundamentals of EAA.
The Diffusion Theory of Innovation (TRA) emphasises that the lack of employees’ level
of expertise and support makes the adoption of EAA difficult project based on critical
algorithms and extreme programming in SCM. The intention to use EAA was based
on the establishment of receiving positive feedback and competitive advantage for
SMEs to gain some expertise in computer programming for capturing data;
transforming it into useful information; and sharing it internally and externally via e-
166
mails, saving and activating inbox messages (regarded as the alarm processor for
notifications alert) with simplified processes (Kuehnhausen & Frost, 2011). For this
study, the intention to use EAA, considered three scenarios such as; to ease SCM
activities, to provide free-error mode in SCM and to ease SCM work-flow within the
SMEs and to the external users without any sign of difficulties. The adoption of EAA
was based on simplicity and easy work-flow that depends on thorough set-up for
algorithms in SCM and links with the external user for easy access and interactions.
SCM should be elaborated across all functional departments within and outside the
enterprise so as to maximize the intention to have positive view and understanding
revolving the adoption of EAA. The Diffusion Theory of Innovation (DTI) on the
intention towards the adoption of EAA for SCM provides the competence in limiting
some negative thoughts about the integrative phases or steps limiting the adoption of
EAA for SCM.
5.6 Summary of Conclusions on Internal Factors 5.6.1 Summary of Conclusions for Internal Factors: Owners’ Characteristics
In the context of this research, there appeared a need to understand the relationships
between Owners’ Characteristics and Perceived Attitudes towards the Adoption of
EAA for SCM represents the respondents in the Capricorn Municipality where the
sample was drawn. Statements like enterprise owners have “distinctive characters and
drive” (Kuhn, Galloway & Collins-Williams, 2016) have been memorable in SCM
activities in the economy and such information could have a positive effect on adoption
of EAA. This research has revealed that the adoption of EAA impact the bottom line
for SCM. Hence this research hypotheses was to cover the associations between
Owners’ Characteristics and the Actual Adoption of EAA for SCM in SMEs.
5.6.2 Summary of Conclusions for Internal Factors: Enterprise Resources
In the perspective of this research study, there was a need to master the relationships
between Enterprise Resources and Perceived Attitudes towards the Adoption of EAA
for SCM activities that were characterised by the respondents in the Capricorn
Municipality as sample of the whole universe. Affirmations like “gross-functional
activities leads to a sustainable economic success for SMEs” rely on tight cost
structure” for a successful SCM within SMEs” (Mills et al., 2013; Fotheringham &
167
Saunders, 2014; and Jenner, 2016) have been remarkable in SCM activities in the
global context that it could make the provision of positive shift towards the adoption of
EAA for SCM. There has been revelation that the adoption of EAA in SCM provide
optimistic results by adopting EAA in SMEs. Therefore, the research hypothesis was
to make the reassurance on the associations between current acceptances of EAA
linked to Enterprise Resources.
5.6.3 Summary of Conclusions for Internal Factors: Information System Components
The findings of the research are quite convincing, and thus the following conclusion
can be drawn, namely: it is important to assure the relationships amongst Information
System Components and Perceived Attitudes towards the Adoption of EAA for SCM
actions that were well-known by a number of respondents in the Capricorn Municipality
known as the research sample. Statements like “Information System Components
embraces a combined set of components for collecting data, packing data and
converting data in the form of practical structure known as information that could be
applied for indulging in rational-decisions making” (Zwass, 2018), have remained
remarkable in SCM activities in the international economy that it could accomplish
optimistic results on the adoption of EAA for SCM. It was discovered that the adoption
of EAA has a positive impact on the core activities for SCM in SMEs. Therefore, the
research hypothesis was to provide the assurance on the associations between
current acceptance of EAA, SCM and SMEs.
5.6.4 Summary of Conclusions for Internal Factors: Employees’ Competencies
From the outcomes of our investigation it is possible to conclude that it was necessary
to reassure the relationships amongst Employees’ Competencies and Perceived
Attitudes towards the Adoption of EAA for SCM engagements that were acknowledged
by a number of respondents in the Capricorn Municipality known as the symbolic
sample from the research population. Statements such as “Employees’ Competencies
cover a number of psychometric mechanisms, such as self-assessments and 360-
degree assessments of their routine role and work status quo” (Metcalf, 2015; and
Rees & Porter, 2015), have produced outstanding messages in SCM activities in
global economy that it could attain confident results on the adoption of EAA for SCM.
It was discovered that the adoption of EAA has a positive impact on the core activities
168
for SCM in SMEs. As a result, the research hypothesis was to provide the assurance
on the associations that the adoption of EAA for SCM and SMEs is based on the
Employees’ Competencies and cost-benefit analysis. It was revealed that for SCM to
be effective and efficient the adoption of EAA has to be in place to eliminate traditional
procedures as a linkage between the SMEs and its external counterparts.
5.7 Summary of Conclusions on External Factors
From the outcomes of the investigation, it is possible to conclude that it was necessary
to reassure the relationships amongst external factors and Perceived Attitudes
towards the Adoption of EAA for SCM activities that were accepted by a number of
respondents in the Capricorn Municipality, referred to as the representational sample
from the research population. Declarations were confirmed such as “external
environment has a substantial effect on SMEs and its role playing as decision towards
the adoption of EAA for SCM in SMEs and the justifications on its expenditures and
predictable benefits might be linked with future proceeds on investments” (Trinh-
Phuong et al., 2012; and Epe; 2015).
It was learned that the adoption of EAA has a constructive control on the core events
for SCM in SMEs. Nonetheless, the research hypothesis was for the SMEs to be
accountable for any change from external environment as they have direct impact on
the entity and relations between current acceptance of EAA, SCM and SMEs. It was
brought to attention that for the SCM to be productive, the adoption of EAA has to be
prioritised to provide assurance against any change that could hamper SMEs’
activities.
5.8 Summary of Conclusions on Perceived Attitudes towards the Adoption of EAA
Based on the results, it can be concluded that it was essential to reassure the
relationships among Perceived Attitudes towards the Adoption of EAA and the
intention to use EAA for SCM activities that existed in the recognition by most of the
respondents in the Capricorn Municipality. Affirmations were made, such as “the
industrial revolution has modernised the livelihood of most SMEs, despite the setbacks
during the process of adopting TAM such as EAA for SCM” (Anderson & Perrin, 2017).
169
It is knowledgeable that the constructive control measures need to be taken into
account to produce free-error operational system is SCM. Nonetheless, the research
hypothesis was for the SMEs to be accountable for any change from Perceived
Attitudes towards the Adoption of EAA as it has a significant impact to the SMEs for
SCM activities. It is therefore, acknowledged that significant focus should be dedicated
to Perceived Attitudes towards the Adoption of EAA.
5.9 Summary of Conclusions on Actual Adoption of EAA In this research review, the remarks typically highlighted the Actual Adoption of EAA
as a core dependent variable used at a last stage of which other independent variables
were indirectly linked with it. The relations between the Actual Adoption of EAA and
the indirect variables was also made possible with the SCM actions, such as,
improvement on-the-job performance, providing Critical Support-Base and enhancing
SCM activities. That also appeared in the recognition by a number of respondents in
the Capricorn Municipality that indirectedly, as the research sample, represented an
extensive percentage arising from the research population. Affirmations came up,
such as “SMEs using the current systems could make upgrades instead eradicating
the current system for SCM” (Harry et al., 2017). It is imperative to be acknowledged
that newly upgraded EAA has the greatest potential in advancing the SCM in SMEs.
5.10 Recommendations In this section, the research recommendations are organised per hypothesis and sub-
hypothesis. The research study had a conceptual model that was regarded as an
approach in the Actual Adoption of EAA. Based on this framework and the review of
TAM, SCM and EAA, three gaps are identified and discussed concisely in this chapter.
5.10.1 Recommendations on Internal Factors 5.10.1.1Summary of Recommendations for Internal Factors: Owners’ Characteristics
The internal factors on Owners’ Characteristics should be considered as a
technological aspect for the adoption of EAA. A coordinated program facilitation should
serve as a key priority in developing Owners’ Characteristics that would stimulate;
passion, creative thinking and mind-set in risk taking, discipline for action orientation,
innovation abilities for hard-working, vision oriented and owner’s resilience towards
170
the their Perceived Attitudes towards the Adoption of EAA.A well-coordinated program
for Owners’ Characteristics should be supported with online distance learning and
small business training that would cover accounting and finance; business operations
and management; business plan; finance; corporate governance; legal factors, and
integrated marketing communication. They could attain assistance in improving their
personal characteristics through education for both entrepreneurs and business
owners.
5.10.1.2 Recommendations for Internal Factors: Information System Components
The internal aspects on Information System Components should be focused on as a
critical basis for enhancing Information System Components so that effective and
efficient EAA would produce remarkable results for SCM in SMEs. A synchronised
EAA should at first establish five critical requirements, namely: organisational
architecture, business architecture, application architecture, information architecture
and technological architecture. Subsequently, the Information System Components
such as transaction-support-system, management-information-system, Information
System Components Governance, Decision Support System, Executive Support
System, Knowledge Management Systems, internet and network connectivity, need
to be aligned with EAA infrastructure for a successful SCM.
5.10.1.3 Recommendations for Internal Factors: Enterprise Resources
The internal challenges on Enterprise Resources should be prioritised in terms of
replacing the old ones or maintain them and even considering repairs in order to
facilitate a progressive EAA for SCM within the SMEs. Appropriate resources linked
with correct EAA systems could make functional activities more accessible and easy
to formulate strategies so as to simplify SCM activities. Efficient and effective
information flow could grant the assurance for custom-built product and design with
greater levels of satisfaction (Shamsuzzoha & Helo, 2012). The SMEs should be in
good position to integrate resources for gaining competitive advantage in the market
with the adoption of EAA (Toor, 2016). The SMEs need to be in possession of
Financial Resources, Competent Human Resources, mainframe or personal
computers, Application Software System, hardware systems and expert personnel so
that the adoption of EAA would not be dream but a reality.
171
5.10.1.4 Recommendations for Internal Factors: Employees’ Competencies
The in-house forces on Employees’ Competencies should be dealt without any sign of
reluctance as they are regarded as the core source of inputs to the enterprise so that
there will be effective and productive EAA for SCM. A well co-ordinated SME should
at least develop its employees with skills, such as using internet interfaces,
spreadsheets utilisation and merging documents, creating business networking,
enterprise integration and administration and so forth. However, more research on this
aspect needs to be undertaken with the association between the Adoption of EAA and
Employees’ Competencies.
5.10.2 Recommendations on External Factors There is a global trend towards the adoption of EAA. SMEs in a number of industries
are making research with regard to the evaluation and implementing the EAA
strategies and study programs that could build long-term relationships between
external factors and perceived attitudes, leading to the acceptance or rejection of EAA.
The external factors on Information System Components should be concentrated on
as an important foundation for improving the adoption of EAA for SCM in SMEs. A
coordinated EAA should at least have strong capabilities against any external threats
such as spyware, cyber-crime, hacking and so forth. On the other hand, the external
factors included complex legal and regulatory constraints; external financing; low
technological capacity; relative advantage; systems compatibility; and systems
customisability that need to be considered when processing the EAA for SCM.
5.10.3 Recommendations on Perceived Attitudes towards the Adoption of EAA This research objective has explored the relationship between Perceived Attitudes
towards the Adoption of EAA and the intention to use EAA for SCM in SMEs. SME
owners and employees are recommended to confront fear that perpetuates their
Perceived Attitudes on the Adoption of EAA for SCM. By eliminating and confronting
few aspects on perceived attitudes, that included; considering Alternative User-Base
Solutions that are ready to use just in a click of a button, minimising risks on low
Technological Aversion, detecting any chances of vulnerability and stochasticity and
lastly pushing away the fear and panic towards the resistance to change. Therefore,
172
both SME owners and employees need to access the contributing factors that would
yield positive attitudes towards the adoption of EAA for SCM.
5.10.4 Recommendations on Actual Adoption of EAA The internal traits on the Actual Adoption of EAA should be dedicated towards the
positive outcomes within the SMEs for SCM. A well-cooperated EAA should be
considered for rejuvenating the users’ level of interest. Although TAM originates with
more complicated upgrades, it is important to enhance employee competency;
updating both software and hardware systems; magnifying the security level against
cybercrime; and many of unforeseen circumstances. The in-house characters on the
intention to use EAA should be directed towards the optimistic results on the adoption
of EAA for SCM in SMEs. A sound collaborated EAA should be well thought-out for
renewing the users’ level of importance.
Although TAM comes with sophistication in user capabilities, it is advisable to consider
basic processes like transmitting information; discovering new methods of using email;
collaboration or linking other users; speed and convenience; integration of key
business processes from electronic data interchange; browser updates; computability
between the computer hardware and software systems; network configuration; flexible
access; and transmission media, all need to be taken into account that factors that
would bring positive light into the adoption of EAA for SCM, such as, EAA would ease
SCM activities, pursuit of free-error mode and ease SCM work-flow by establishing
critical requirements, such as, simplified processes; auto-response; ease of access;
collaboration; integrated media; multiple creators of content; interactivity; and browser
updates, need to be fully practised to have a competitive advantage evident in
maximum productive scale in SCM.
Actual Adoption of EAA will be possible only if the primary motive is to improve job
performance, provide Critical Support-Base and enhance SCM activities.
Consultation with architect expect will save the SMEs cash by gaining competitive
advantage on the SCM activities linked to EAA. To test the model using SMEs that are
considering the adoption of EAA to determine if training plays a more or less significant
role in the pre-adoption phase of diffusion (Harrison et al., 2013; Hazen et al., 2014;
173
and Itamir & Gibeon, 2015). Murthy and Mani (2013) have identified factors that that
discern technology rejection upon the following aspects:
5.10.4.1 Technical Complexity SMEs with capabilities for defining technological complexity have save themselves
against confusion and stress of exchanging data with wrong users, from both internal
and external business environments (Ruhl & Katz, 2015; and Vaesen & Houkes,
2017). The failure to achieve the correct EAA model would increase the confusion
(Leydesdorff, 2000). Economic and technological complexities playa meaningful role
in transforming the SMEs growth (Cohen, 2018). The complexity of the networks of
SMEs should be related to the economic growth (Rycroft & Kash, 1999). There should
be strict consequences for unethical actions of information theft and manipulation
(Paulo, 2014; and Arbesman, 2015). There is therefore a definite need to take into
account the technical complexity that affects the adoption of EAA within the SMEs for
SCM.
5.10.4.2 Technological Failure Technological failure is destruction on the system that includes power failure,
incompatibility to calibrate with internal and external electronic sources,
dysfunctionality of the computer systems and a failure to produce desired results
(Dasgupta & Kadjo, 2013; Ronny, 2017; and Regalado, 2018). Technological failures
could be linked directly with the SMEs’ averseness to hardware and software upgrades
(Chen, 2017; Cooke, 2018; and Bilbro, 2018). Some large corporations and banks
were facing the leaking of confidential sales information, which is a true reflection of
technological failure or non-adoption of effective EAA that includes protection against
system hacking (Gerstein, 2012; and Grothaus, 2018). An automatic backup system
is recommended to SMEs as a measure against unforeseen circumstances such as
theft and damage from natural disasters (Hamrouni, 2017). The use of cameras in
securing the SMEs and password authentications are absolute measures for securing
authorised-user activities (Regalado, 2018). An implication of these findings is that
both EAA and technological failure need measures to achieve efficient SCM.
174
5.10.4.3 Technological Intransigence Technological intransigence is regarded as the inability of the software and hardware
system to perform to expected commands at a given time throughout the SCM
operations (Vogt, 2015). Technological intransigence is dependent on flexibility within
the SMEs and its external stakeholders because of lack of compatibility among
different software application systems (Han, Wang & Naim, 2018; and Goldenberg &
Dyson, 2018). A flexible architecture model that is based on efficiency and
effectiveness will be required for a successful EAA adoption (Bawa, Buchholz, de
Villiers, Corless, & Kaliner, 2017; and Sanders, Zeng, Hellicar & Fagg, 2016).
Flexibility in the Supply Chain can be used to strengthen the business relationships
between different suppliers, distributors, wholesalers and retails stores (Pereira,
Sellitto, & Borchardt, 2018; and Han, Wang & Naim, 2018).
5.11 Conclusion on Recommendations Made Software programmes, such as Info CloudSuite Industrial (SyteLine), ERP Software,
Business Management Software, SAP Business By Design and Dynamics, 365
Business Central and many more, should be synchronised in EAA as the starting point
for both enterprise owners and managers. Information System Components,
Enterprise Resources and Employees’ Competencies that includes knowledge on
external factors, such as, spyware, cyber-crime and hacking should be improved.
Common threats on Perceived Attitudes towards the Adoption of EAA, such as,
Alternative User-Base Solutions, low Technological Aversion and vulnerability.
Resistance to change should be considered to have a successful adoption of EAA
for SCM in SMEs.
175
ANNEXURES Annexure A: CPASA for Master’s and Doctoral Students
Memorandum of Understanding Between Professor GPJ PELSER in the Department of BMAN who holds the following academic qualification (highest): DBL
And Candidate: Kingston Xerxes Theophilus Lamola: Student Number: DECLARATION BY CANDIDATE I have been presented with the following: “Record of your research and research Progress” with all relevant documents. Code of practice on the admission, supervision and examination of research students Policy and Procedures on Postgraduate Research and Supervision. Code of Conduct for Research. Promoting Research Integrity and the Responsible Conduct of Research – A checklist The University Calendar, the School Calendar, and the following other policies and
procedures documents (list these): I have read and understood the rules, regulations, codes and policies of the University and have discussed the general requirements of my research work, the work plan and the recommended courses and induction programmes with my supervisor. I understood and agreed to my obligations and responsibilities. I have read and understood the health and safety procedures of the University and have been advised of any particular hazards and precautions associated with my research work. I indemnify the University of all responsibility should anything happen to me, due to my own negligence, in the course of my research work. I agree that the University reserves the right to terminate my registration at any time should my conduct and progress not be satisfactory. DECLARATION BY SUPERVISOR I/We have met with the above named candidate, discussed with him/her the requirements and all relevant rules, regulations, procedures, codes and policies of the University and the roles and responsibilities of the supervisor. I agree to carry-out my supervisory duties and responsibilities and will endeavour to keep a healthy, cordial and academic relationship with the student to ensure that s/he completes in the prescribed minimum time for the degree without compromising academic standards. Duly signed: …………………………...... …….………………….…………. ………………….. (Supervisor) (Place) (Date)
…………...…………….….. ………………..………….………. …………………… (Candidate) (Place) (Date) Counter signed (HoD)…….……………… (Director of the School)………….….…… (Dean)………………………..............
176
Annexure B: Letter of Consent Lamola Kingston Xerxes Theophilus
University of Limpopo Private Bag X 1106 SOVENGA 0727 25th July 2019
Dear Respondent I would like to introduce myself as Lamola Kingston Xerxes Theophilus, a Post-Graduate Student at the University of Limpopo for academic year 2019. I am conducting data collection as a partial fulfilment for Masters of Commerce in Business Management, in the Faculty of Management and Law, under the School of Economics and Management in the Department of Business Management. The aim for this study is to investigate factors influencing the adoption of Enterprise Application Architecture for Supply Chain Management in Small and Medium Enterprises within the Capricorn District Municipality. The questionnaire comprises of fifty-five questions. It will take you approximately twenty minutes to complete it. The Likert scale “tick the box” questions is used. Should you have any difficulty in completing the questionnaire, please do not hesitate to contact the researcher @ [email protected] [email protected] or (015) 268 2538\2638 or (082) 361 0285.
Thank you very much in advance for your genuine participation. Kindest Regards: Lamola KXT
SIGNATURE
DATE
25th July 2020
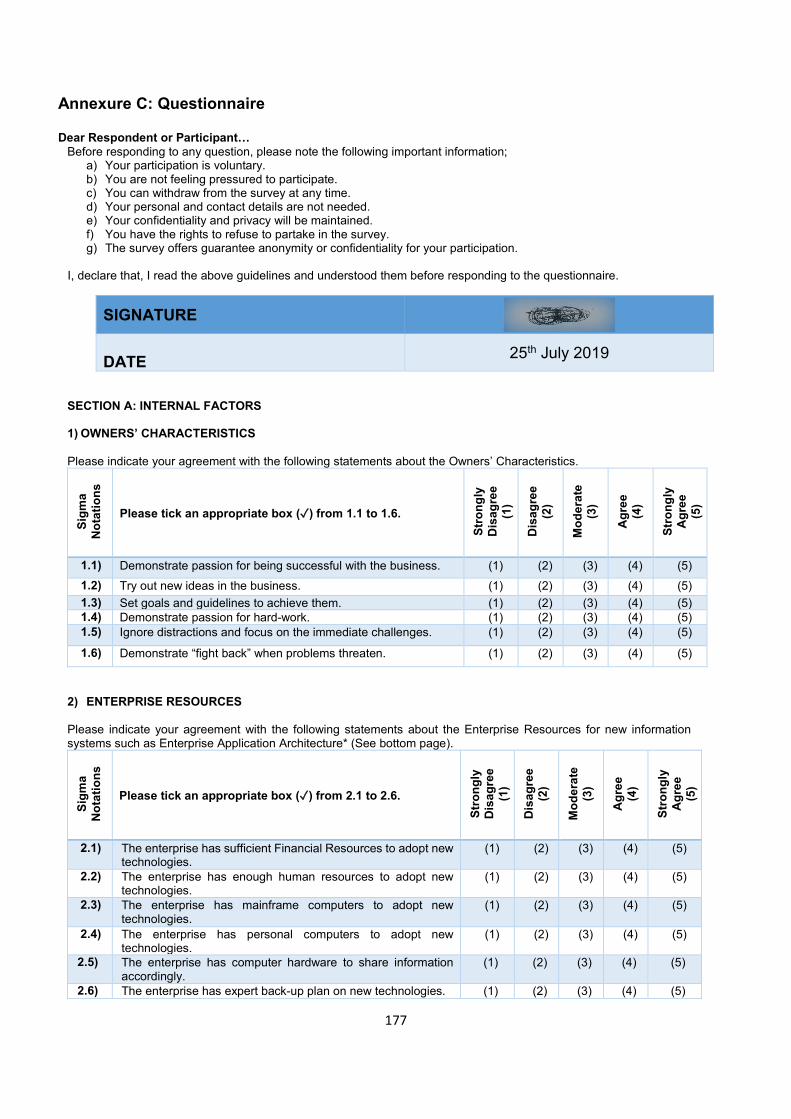
177
Annexure C: Questionnaire Dear Respondent or Participant…
Before responding to any question, please note the following important information; a) Your participation is voluntary. b) You are not feeling pressured to participate. c) You can withdraw from the survey at any time. d) Your personal and contact details are not needed. e) Your confidentiality and privacy will be maintained. f) You have the rights to refuse to partake in the survey. g) The survey offers guarantee anonymity or confidentiality for your participation.
I, declare that, I read the above guidelines and understood them before responding to the questionnaire.
SECTION A: INTERNAL FACTORS 1) OWNERS’ CHARACTERISTICS Please indicate your agreement with the following statements about the Owners’ Characteristics.
Sigm
a N
otat
ions
Please tick an appropriate box (✓) from 1.1 to 1.6.
Stro
ngly
D
isag
ree
(1)
Dis
agre
e (2
)
Mod
erat
e (3
)
Agr
ee
(4)
Stro
ngly
A
gree
(5
)
1.1) Demonstrate passion for being successful with the business. (1) (2) (3) (4) (5) 1.2) Try out new ideas in the business. (1) (2) (3) (4) (5) 1.3) Set goals and guidelines to achieve them. (1) (2) (3) (4) (5) 1.4) Demonstrate passion for hard-work. (1) (2) (3) (4) (5) 1.5) Ignore distractions and focus on the immediate challenges. (1) (2) (3) (4) (5)
1.6) Demonstrate “fight back” when problems threaten. (1) (2) (3) (4) (5)
2) ENTERPRISE RESOURCES Please indicate your agreement with the following statements about the Enterprise Resources for new information systems such as Enterprise Application Architecture* (See bottom page).
Sigm
a
Not
atio
ns
Please tick an appropriate box (✓) from 2.1 to 2.6.
Stro
ngly
D
isag
ree
(1)
Dis
agre
e (2
)
Mod
erat
e (3
)
Agr
ee
(4)
Stro
ngly
A
gree
(5
)
2.1) The enterprise has sufficient Financial Resources to adopt new technologies.
(1) (2) (3) (4) (5)
2.2) The enterprise has enough human resources to adopt new technologies.
(1) (2) (3) (4) (5)
2.3) The enterprise has mainframe computers to adopt new technologies.
(1) (2) (3) (4) (5)
2.4) The enterprise has personal computers to adopt new technologies.
(1) (2) (3) (4) (5)
2.5) The enterprise has computer hardware to share information accordingly.
(1) (2) (3) (4) (5)
2.6) The enterprise has expert back-up plan on new technologies. (1) (2) (3) (4) (5)
SIGNATURE
DATE 25th July 2019

178
3) INFORMATION SYSTEM COMPONENTS Please indicate your agreement with the following statements about the Information System Components of your enterprise for new information systems such as Enterprise Application Architecture* (See bottom page).
Sigm
a
Not
atio
ns
Please tick an appropriate box (✓) from 3.1 to 3.6.
N0t
at a
ll (1
) N
o (2)
Mod
erat
e le
vel
(3)
Yes
(4
)
Def
inite
ly
(5)
3.1) Does the enterprise have a way of making payment on-line? (1) (2) (3) (4) (5)
3.2) Does the enterprise have way of managing information on-line? (1) (2) (3) (4) (5)
3.3) Does the enterprise have information controlling measures? (1) (2) (3) (4) (5)
3.4) Does the enterprise have a system that support their decisions? (1) (2) (3) (4) (5)
3.5) Does the enterprise have the system that support the owner’s duties? (1) (2) (3) (4) (5)
3.6) Does the owner of the enterprise have knowledge about information systems? (1) (2) (3) (4) (5)
3.7) Does the enterprise use internet and network connectivity? (1) (2) (3) (4) (5)
4) EMPLOYEES’ COMPETENCIES Do the employees and managers possess the following competencies for new information systems such as Enterprise Application Architecture* (See bottom page)?
Sigm
a N
otat
ions
Please tick an appropriate box (✓), from 4.1 to 4.10.
Stro
ngly
D
isag
ree
(1)
Dis
agre
e (2
)
Mod
erat
e (3
)
Agr
ee
(4)
Stro
ngly
A
gree
(5
)
4.1) Do the employee have the skills for using the internet? (1) (2) (3) (4) (5)
4.2) Do the employees have the ability for creating and formulating word documents?
(1) (2) (3) (4) (5)
4.3) Do the employees have the ability to use tables and columns?
(1) (2) (3) (4) (5)
4.4) Do the employee have the ability for using spreadsheets and merging documents?
(1) (2) (3) (4) (5)
4.5) Do the employees have communication skills for dealing with customers?
(1) (2) (3) (4) (5)
4.6) Do the employees have network channel with suppliers and customers?
(1) (2) (3) (4) (5)
4.7) Does the enterprise control its website information? (1) (2) (3) (4) (5)
4.8.) Does the enterprise manage its administration files on-line?
(1) (2) (3) (4) (5)
4.9) Does the enterprise manage its information resources? (1) (2) (3) (4) (5)
4.10) Does the enterprise manage its resources as planned? (1) (2) (3) (4) (5)
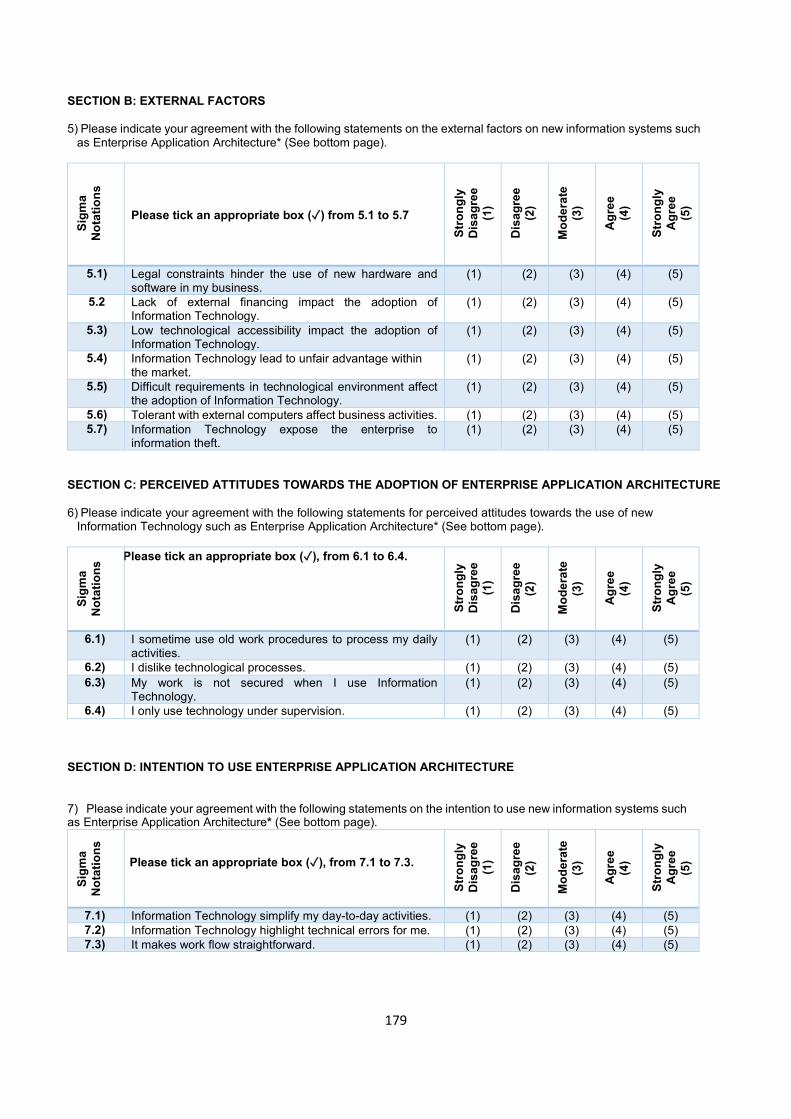
179
SECTION B: EXTERNAL FACTORS 5) Please indicate your agreement with the following statements on the external factors on new information systems such
as Enterprise Application Architecture* (See bottom page).
Sigm
a N
otat
ions
Please tick an appropriate box (✓) from 5.1 to 5.7
Stro
ngly
D
isag
ree
(1)
Dis
agre
e (2
)
Mod
erat
e (3
)
Agr
ee
(4)
Stro
ngly
A
gree
(5
)
5.1) Legal constraints hinder the use of new hardware and software in my business.
(1) (2) (3) (4) (5)
5.2 Lack of external financing impact the adoption of Information Technology.
(1) (2) (3) (4) (5)
5.3) Low technological accessibility impact the adoption of Information Technology.
(1) (2) (3) (4) (5)
5.4) Information Technology lead to unfair advantage within the market.
(1) (2) (3) (4) (5)
5.5) Difficult requirements in technological environment affect the adoption of Information Technology.
(1) (2) (3) (4) (5)
5.6) Tolerant with external computers affect business activities. (1) (2) (3) (4) (5) 5.7) Information Technology expose the enterprise to
information theft. (1) (2) (3) (4) (5)
SECTION C: PERCEIVED ATTITUDES TOWARDS THE ADOPTION OF ENTERPRISE APPLICATION ARCHITECTURE
6) Please indicate your agreement with the following statements for perceived attitudes towards the use of new
Information Technology such as Enterprise Application Architecture* (See bottom page).
Sigm
a N
otat
ions
Please tick an appropriate box (✓), from 6.1 to 6.4.
Stro
ngly
D
isag
ree
(1)
Dis
agre
e (2
)
Mod
erat
e (3
)
Agr
ee
(4)
Stro
ngly
A
gree
(5
)
6.1) I sometime use old work procedures to process my daily activities.
(1) (2) (3) (4) (5)
6.2) I dislike technological processes. (1) (2) (3) (4) (5) 6.3) My work is not secured when I use Information
Technology. (1) (2) (3) (4) (5)
6.4) I only use technology under supervision. (1) (2) (3) (4) (5) SECTION D: INTENTION TO USE ENTERPRISE APPLICATION ARCHITECTURE 7) Please indicate your agreement with the following statements on the intention to use new information systems such as Enterprise Application Architecture* (See bottom page).
Sigm
a N
otat
ions
Please tick an appropriate box (✓), from 7.1 to 7.3.
Stro
ngly
D
isag
ree
(1)
Dis
agre
e (2
)
Mod
erat
e (3
)
Agr
ee
(4)
Stro
ngly
A
gree
(5
)
7.1) Information Technology simplify my day-to-day activities. (1) (2) (3) (4) (5) 7.2) Information Technology highlight technical errors for me. (1) (2) (3) (4) (5) 7.3) It makes work flow straightforward. (1) (2) (3) (4) (5)
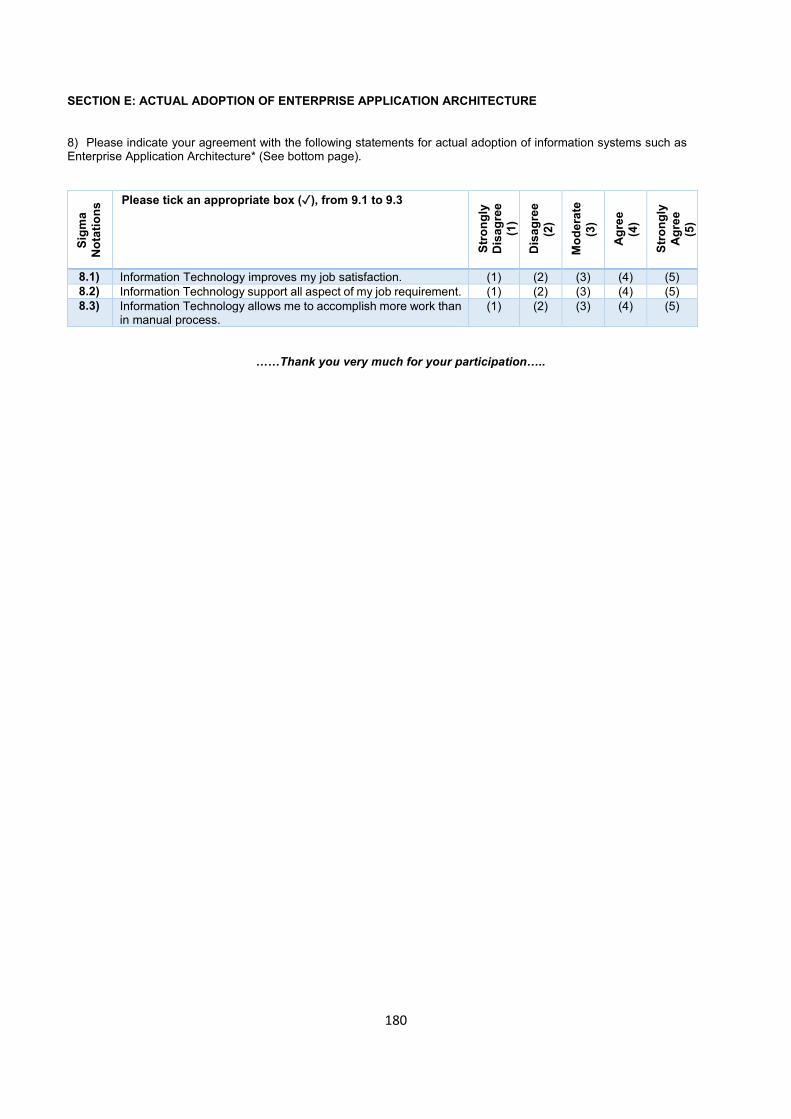
180
SECTION E: ACTUAL ADOPTION OF ENTERPRISE APPLICATION ARCHITECTURE 8) Please indicate your agreement with the following statements for actual adoption of information systems such as Enterprise Application Architecture* (See bottom page).
Sigm
a N
otat
ions
Please tick an appropriate box (✓), from 9.1 to 9.3
Stro
ngly
D
isag
ree
(1)
Dis
agre
e (2
)
Mod
erat
e (3
)
Agr
ee
(4)
Stro
ngly
A
gree
(5
)
8.1) Information Technology improves my job satisfaction. (1) (2) (3) (4) (5) 8.2) Information Technology support all aspect of my job requirement. (1) (2) (3) (4) (5) 8.3) Information Technology allows me to accomplish more work than
in manual process. (1) (2) (3) (4) (5)
……Thank you very much for your participation…..
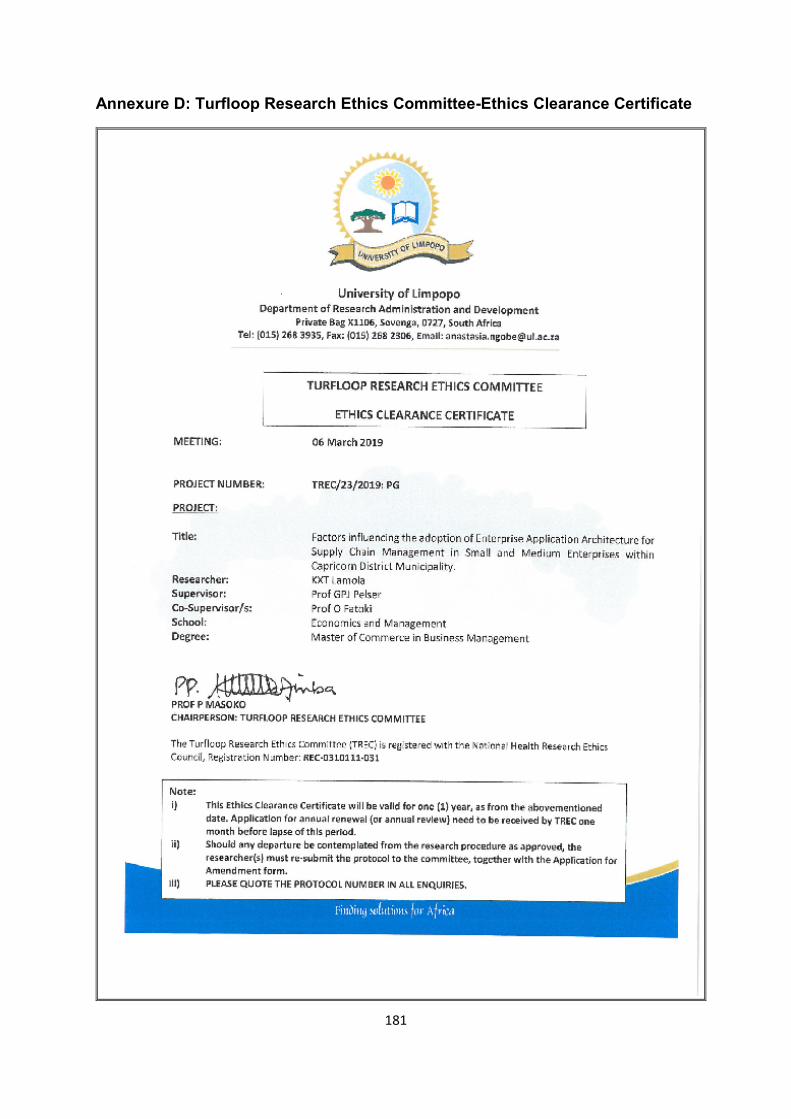
181
Annexure D: Turfloop Research Ethics Committee-Ethics Clearance Certificate
182
REFERENCES Abbott, P., Goosen, X. & Coetzee, J. 2013. The Human Resource Function Contribution to Human Development in South Africa. Vol. 11 Issue 1. From: https://sajhrm.co.za/index.php/sajhrm/article/view/408/680 (Accessed 20 May 2018). Abraham, R., Burnett, M.M. & Erwig, M. 2008. Spreadsheet Programming. Semantic scholar. From: https://www.semanticscholar.org/paper/Spreadsheet-Programming-Abraham-Burnett/e2b52b331a87762ae7f3e0cfeff8a7669281891b (accessed 16 June 2019). Accenture. 2012. Biometrics and Privacy: A positive match. How organisations can use biometrics technologies and protect individuals’ privacy in the journey to high performance. From: https://www.google.co.za/search?q=Biometrics+and+privacy:+A +positive+match.+How+Organisations+can+use+biometrics+technologies+and+protect+individuals%E2%80%99+privacy+in+the+journey+to+high+performance.&ei=VzFHXM_aOoOE1fAP2YCq0Ac&start=10&sa=N&ved=0ahUKEwiP4rGF1YHgAhUDQhUIHVmACnoQ8tMDCIQB&biw=1455&bih=667 (accessed 22 January 2019). Administrative Divisions of South Africa. 2018. List of Municipalities in Limpopo. From: https://en.wikipedia.org/wiki/List_of_municipalities_in_Limpopo (accessed 15 Nov 2018). Amine, S. 2018. Employment Protection Legislation in Emerging Economies. IGI Global. From: https://books.google.co.za/books?hl=en&lr=&id=rvBJDwAAQBAJ&oi=fnd&pg=PR1&dq=Employment+Protection+Legislation+in+Emerging+Economies.+IGI+Global&ots=rsdGiZCFva&sig=_bMdnlsjpW--3oPwwaxKq02jXus#v=onepage&q=Employment%20Protection%20Legislation%20in%20Emerging%20Economies.%20IGI%20Global&f=false (accessed 16 September 2019). Agrasuta. V. 2013. The Adoption of Green Dentistry among Dentists in Thailand. From:https://www.researchgate.net/publication/281629128_The_Adoption_ofGreen_Dentistry_among_Dentists_in_Thailand (accessed 07 February 2019). Ahmad, N. & Mehmood, R 2015. Enterprise Systems: Are we ready for future sustainable cities, Supply Chain Management: An International Journal 20(3):264-283. Ajzen, I. 1991. The Theory of Planned Behavior: Organisational behavior and human decision processes 50(2):179-211 (accessed: 4 June 2018). Alshamari, M. 2016. Usability Factors Assessment in Health Information System. From: https://www.scirp.org/journal/PaperInformation.aspx?PaperID=72201 (accessed 19 February 2019). Alsemgeest, L., du Toit, E., Ngwenya, S. & Thomas, K. 2014. Corporate Finance: A South African Perspective. Southern Africa: Oxford University Press.
183
Altexsoft. 2018. Legacy System Modernization: How to transform the enterprise for digital future. From: https://www.altexsoft.com/whitepapers/legacy-system-moderniza tion-how-to-transform-the-enterprise-for-digital-future/ (accessed 19 December 2018). Althuser, J. 2018. Funding. From: https://www.entrepreneurmag.co.za/advice/starting-a-business/start-up-advice/6-resources-for-start-ups-looking-for-funding/ (accessed: 15 May 2018). Alziari, L. 2017. A Chief HR Officer’s Perspective on Talent Management. Journal of Enterprise Effectiveness: People and Performance, Vol. 4 (4):379-383. Anayet, F.M.A. & Ali, K. 2014. Relation between Individual and Society. From:http:// file.scirp.org/Html/8-1760197_49227.htm (accessed 28 January 2019). Anderson, A. 2010. Case Study: The motivation for biometrics: convenience, as well as security, are key factors. From: https://www.healthcareinfosecurity.com/case-study-motivation-for-biometrics-a-2686 (accessed 2 December 2018). Anderson, D.R., Sweeney, D.J., Williams, T.A., Camm, J.D. & Martin, K. 2013. Quantitative Methods for Business, 12th edition. Canada: South-Western Cengage Learning. Anderson, M. & Perrin, A. 2017. Barriers to Adoption and Attitudes towards Technology.From:http://www.pewinternet.org/2017/05/17/barriers-to-adoption-and-attitudes-towards-technology/ (accessed 26 February 2019). Anesthesiol, K.J. 2017. Introduction of a Pilot Study. From: https://www.ncbi.nlm.nih. gov/pmc/articles/PMC5716817/ (accessed: 19 November 2018). Ansara, D., Endres, R. & Mothibatsela, B. 2019. OPINION: Open for business? How SMMEs in South Africa can thrive. From: wwwnews24.com/fin24/opinion/opinion-how-smmes-in-south-africa-can-thrive-20191118 (accessed 04 July 2020). Ann, P.J. 2019. Poor Technological Capability Undermining Africa’s Growth Potential. From: https://www.afdb.org/en/news-and-events/poor-technological-capability-under mining-africas-growth-potential-13684/ (accessed 15 February 2019). Appelbaum, S.H., Kryvenko, O., Parada, M.R., Soochan, R.M. & Shapiro, B.T. 2015. Racial-Ethnic Diversity in Canada: Competitive edge or corporate encumbrance? Part one. Journal of Industrial and Commercial Training 47(6): 302 – 309. From: https://www.emerald.com/insight/content/doi/10.1108/ICT-03-2014-0012/full/html (accessed 11 June 2019). Arbesman, S. 2015. The Problem with Technological Ignorance: And why we need to teach abstraction. From: http://www.slate.com/articles/technology/future_tense/2015/12/the_problem_with_technological_ignorance.html (accessed 4 August 2018).
184
Ardley, B., Moss, P. & Taylor, N. 2016. Strategies Snarks and Stories: SMES owner manager perceptions of business advisers. Journal of Research in Marketing and Entrepreneurship 18(2):211-231. From: https://www.researchgate.net/publication/311477845_Strategies_Snarks_and_stories_SME_owner_manager_perceptions_of_business_advisers (accesed 12 May 2020). Arisar, J. 2016. A Communication Model. From: http://datacombasic.blogspot.com/ 2011/03/communication-model.html (accessed: 5 August 2018). Asetpartners. 2018. Enterprise Application Architecture. From: http://asetpartners. com/enterprise-architecture.php (accessed 28 October 2018). Asif, Q.G. Braytee, A. & Hussain, F.K. 2017. Adaptive Service e-Contract Information Management Reference Architecture: VINE. Journal of Information and Knowledge Management Systems 47(3):395-410. Asmundson, I. 2017. Supply and Demand: Why markets tick. From: http://www.imf.org /external/pubs/ft/fandd/basics/suppdem.htm(accessed: 14 May 2018). Atlassian. 2018. Tables. From: https://confluence.atlassian.com/doc/tables-136463. html (accessed 26 December 2018). Ayer, B. 2010. Mainframe to Desktop: Why was the PC born? From: http://history.msu.edu/hst250-hybrid/2010/01/27/mainframe-to-desktop-why-was-the-pc-born/ (accessed 20 May 2018). Banaeianjahromi, N. & Smolander, K. 2016. What Do We Know about the Role of Enterprise Architecture in Enterprise Integration? A systematic mapping study. Journal of enterprise information management 29(1):140-164. Azad, M.A.K. 2018. What are the Merits and Demerits of Multi-Stage Random Sampling? From:http://www.preservearticles.com/201107189307/what-are-the-merits-and-demerits-of-multi-stage-random-sampling.html (accessed 14 November 2018). Azoulay, A., Jones, B., Kim, J.D. & Miranda, J. 2018. Age and High-Growth Entrepreneurship. From:http://www.nber.org/papers/w24489 (accessed 17 August 2018). Bawa, R., Buchholz, S., de Villiers, J. Corless, K. & Kaliner, E. 2017. Inevitable Architecture: Complexity gives way to simplicity and flexibility. From: https://www2. deloitte.com/insights/us/en/focus/tech-trends/2017/simplifying-it-systems-architecture .html (accessed 4 August 2018).
Badenhorst-Weiss, H., Strydom, S., Strydom, J., Heckroodt, S., Howell, J., Cook, G. & Phume, T.B. 2016a. Supply Chain Management: A South African Approach. Cape Town: Oxford University Press.
185
Badenhorst-Weiss, J.A., van Biljon, E.H.B. & Ambe, I.M, 2018b. Supply Chain Management: A Balance Approach, 2ndedition, South Africa: Pretoria. Beal, V. 2018. MIS-Management Information System. From: https://www.webopedia. com/TERM/M/MIS.html (accessed 24 May 2018b). Baker, R., Brick, J.M., Bates, N.A., Battaglia, M., Couper, M.P., Dever, J.A., Gile, K.J. & Tourangeau R. Summary Report of the AAPOR Task Force on Non-probability Sampling. From: https://academic.oup.com/jssam/article-abstract/1/2/90/941418 (accessed 18 January 2021). Benade, S.J. & Pretorius, L. 2012.System Architecture and Enterprise Architecture: A juxtaposition? From:http://www.scielo.org.za/scielo.php?script=sci_arttext&pid=S2224-7890201200 0200005(accessed 24 July 2018). Bennett, M. 2017. Why External Partners are Essential for Innovation and Efficiency. From: https://www.telegraph.co.uk/business/ready-and-enabled/collabora ting-with-external-partners/ (accessed: 12 May 2018). Bilbro, J. 2018. Technological Failures, New Localism and More. From: https://www. frontporchrepublic.com/2018/02/water-dipper/ (accessed 4 August 2018). Brandeisky, K. 2015. 5 Things You Didn't Know about Using Personal email at Work. From:http://time.com/money/3729939/work-personal-email-hillary-clinton-byod/ (accessed: 10 May 2018). Blackburn, R.A., Hart, M. & Wainwright, T. 2013.Small Business Performance: Business, Strategy and Owner‐Manager Characteristics, Journal of Small Business and Enterprise Development (20)1:8-27. From https://doi.org/10.1108/146260013 11298394 (accessed 06 July 2020). Branscombe, M. 2018. You've Been Using Excel Wrong All Along (and that's OK). From: https://www.zdnet.com/article/youve-been-using-excel-wrong-all-along-and-thats-ok/ (accessed 16 June 2018). Bridges, D. 2012. 5 Tips on Using BCC in Outlook Email. From: https://www.microsoft. com/en-us/microsoft-365/blog/2012/03/23/5-tips-on-using-bcc-in-outlook-email/ (accessed 10 May 2018). Brunello, A. 2013. The Relationship between Integrated Marketing Communication and Brand Equity. International Journal of Communication Research 3(1):9-12. Bugg, L. 2018. 5 Tech Failures That Can Turn Your Life into a Horror Movie. From: http://www.cracked.com/blog/5-tech-failures-that-can-turn-your-life-into-horror-movie/ (accessed 4 August 2018). Burson, J. 2015. Standardization and the Open Web. From: https://alistapart.com/ article/standardization-and-the-open-web (accessed 5 June 2018).
186
Cadarette, M.S., Ban, K.J., aGiulia, J.K., Consiglio, P.G., Black, C.D., Dubins, D., Marin, A. & Tadrous, M. 2017. Diffusion of Innovations Model Helps Interpret the Comparative Uptake of Two Methodological Innovations: Co-Authorship network analysis and recommendations for the integration of novel methods in practice. From: https://www.sciencedirect.com/science/article/pii/S0895435616308356 (accessed 02 April 2019). Callaghan, C.W. 2013. Individual Values and Economic Performance of Inner-City Street Traders. Journal of Economics 4(2):145-156. Callen, T. 2020. Gross Domestic Product: An Economy’s all. Finance and development. From: https://imf.org/external/pubs/ft/fandd/basics/gdp.htm (accessed 09 July 2020). Camadan, F., Reisoglu, I., Ursavas, Ö.F. & Mcilroy, D. 2018. How Teachers’ Personality Effect on Their Behavioral Intention to Use Tablet PC. The International Journal of Information and Learning Technology, 35(1):12-28. Catley, S. & Hamilton, R.T. 1998. Small Business Development and Gender of Owner. Journal of Management Development (17)1:75-82. From:https://doi.org/10.1 108/02621719810368718 (21 July 2020). Chatterjee, N. & Das, H. 2016. A Study on the Impact of Key Entrepreneurial Skills on Business Success of Indian Micro-Entrepreneurs: A case of Jharkhand Region, http://journals.sagepub.com/doi/full/10.1177/0972150915610729(accessed 20 August 2018). Chen, B. 2017. The Biggest Tech Failures and Successes of 2017. From: https://www.wral.com/the-biggest-tech-failures-and-successes-of-2017/17183921/ (accessed 4 August 2018). Campbell, M. 2018. Postmodernism and Educational Research: Scientific research. From: https://file.scirp.org/Html/6-1761969_86024.htm(accessed 14 Sept 2019). Capricorn District Municipality. 2017. Final IDP/Budget, 2017. From: http://www.cdm. org.za/attachments/article/344/APPROVED%20IDP%202016-2021.pdf (accessed 2 May 2018). Carroll, J.S., Goodman, P.S., Ramanujam, R., Edmondson, A.C., Hofmann, D.A. & Sutcliffe, K.M. 2011. Organisational Errors: Directions for future research. MIT. Castronovo, C. & Huang, L. 2012. Social Media in an Alternative Marketing Communication Model. Journal of Marketing Development and Competitiveness, (6), 117-136. Cedarville University. 2019. Microsoft Office: Compatibility mode. From: https://www.cedarville.edu/help/Microsoft-Office-Compatibility-Mode (accessed 18 February 2019).
187
Centre for Innovation in Research and Teaching. 2018. Ethical Considerations. From: https://cirt.gcu.edu/research/developmentresources/tutorials/ethics(accessed 11 February 2018). Chadwick, K. 2018. Supply Chain Organisation: Design for a digital future. From: https:/ /www.gartner.com/webinar/3838574 (accessed 28 October 2018). Chamber of Commerce of Metropolitan Montreal. 2018. Customer Relationship Management. From: https://Www.Infoentrepreneurs.Org/En/Guides/Customer-Rela tionship-Management/ (accessed 5 November 2018). Chappelow, J., 2019. Porter’s 5 Forces Definition. Investopedia. Accessed 20 February 2021. Chatterjee, R. 2013. Breaking the Mold: An educational perspective on diffusion of innovation/rogers’ diffusion of innovations. From: https://en.wikibooks.org/wiki/ Breaking_the_Mold:_An_Educational_Perspective_on_Diffusion_of_Innovation/Rogers%E2%80%99_Diffusion_of_Innovations (accessed 11 April 2019). Chatterjee, R. 2017. What is the Role of Communication in Supply Chain Management? From: https://www.quora.com/What-is-the-role-of-communication-in-supply-chain-management (accessed 21 March 2018). Chauri, P. & Grønhaug, K. 2010.Research Methods in Business Studies, 4thedition. London: British Library Cataloguing-in-Publication Data. Chen, B. 2017. The Biggest Tech Failures and Successes of 2017.From: https://www.wral.com/the-biggest-tech-failures-and-successes-of-2017/17183921/ (accessed 4 August 2018). Chen, H., Hailey, D., Wang, N. & Yu, P. 2018. A Review of Data Quality Assessment Methods for Public Health Information Systems. From: https://www.ncbi.nlm.nih. gov/pmc/articles/PMC4053886/ (accessed 5June 2018). Chen, H.C., Sheu, L., O’Sculliavan, P., Cate, O.T. & Teherani, A. 2014. Workplace‐based Learning: Legitimate workplace roles and activities for early learners. From: https://onlinelibrary.wiley.com/doi/abs/10.1111/medu.12316 (accessed 09 August 2019). Chen, J. 2014. Gait Correlation Analysis Based Human Identification. From: https://www.ncbi.nlm.nih.gov/pmc/articles/PMC3925574/ (accessed 18 January 2019). Christin. 2018. What is the Best Gmail App for Windows in 2018? From: https://www.getmailbird.com/best-gmail-app-for-windows/ (accessed 20 May 2018). Claidio, D. 2016. Data Communications and IT Components or Elements. From: http://www.tipsandarticles.com/data-communication-and-components/ (accessed 12 March 2018).
188
Cloud, D. 2019. Interpretivism in Sociology: Definition & origin. From: https://study. com/academy/lesson/interpretivism-in-sociology-definition-and-lesson.html (accessed 28 January 2019). Cognite, S.S. 2018. Why is Customer Relationship Management Critical for Growth? From: https://www.itweb.co.za/content/xA9PO7NY4zOvo4J8 (accessed: 5 November 2018). Cohen, S. 2018. The Politics of Technical Complexity. From: https://blogs.ei.columbia. edu/2018/02/05/politics-technical-complexity/ (accessed 4 August 2018). Collis, J. & Hussey, R. 2013. Business Research: A practical guide for undergraduate and postgraduate students, 4thedition. England: Palgrave Macmillan. Cooke, N.J. 2018. Stories of Modern Technology Failures and Cognitive Engineering Successes. From: https://www.amazon.com/gp/product/0805856714?ie=UTF8&tag =donnorman&linkCode=as2&camp=1789&creative=9325&creativeASIN=0805856714(accessed, 4 August 2018). Coster, F. 2019. Business IT Alignment: Business-IT alignment is a discipline that matches IT strategy with business strategy with the goal of maximizing value created by the enterprise. CioWiki. From: https://cio-wiki.org/wiki/Business_IT_Alignment (accessed 08 April 2019). Coté. 2016. Roles and Responsibilities for DevOps and Agile Teams. From: https://medium.com/@cote/roles-and-responsibilities-for-devops-and-agile-teams-fdacbffb4cb4(accessed 19 December 2018). Coulson‐Thomas, C. 2012. Talent Management and Building High Performance Organisations. Journal of Industrial and Commercial Training 44(7):429-436. Crain, A. 2018. Cracking the SAFE: An expert's take on the scaled agile framework. From: https://techbeacon.com/cracking-safe-experts-take-scaled-agile-framework (accessed 19 December 2018). Crossman, A. 2019. Positivism in the Study of Sociology: Defining what this theory means. From: https://www.thoughtco.com/positivism-sociology-3026456 (accessed 19 November 2019). Csikszentmihalyi, M. & Larson, R. 2014.Validity and Reliability of the Experience-Sampling method in flow and the foundations of positive psychology. The collected works of Mihaly Csikszentmihalyi. Springer: Netherlands, pp. 35-54. Dascalescu, A. 2018. Biometric Authentication Overview: Advantages & disadvantages: How popular biometric methods work, and how to hack them. From: https://heimdalsecurity.com/blog/biometric-authentication/# (accessed 5 August 2018).
189
Dasgupta, P.K. & Kadjo. A. 2013. Tutorial: Simulating chromatography with Microsoft Excel Macros. From:https://www.sciencedirect.com/science/article/pii/S000326701 2017321(accessed 26 December 2018). DataStax 2018. CQL for Apache Cassandra 3.0 (Earlier version). From: https://docs.datastax.com/en/cql/3.3/cql/cql_using/useCreateTable.html (accessed 26 December 2018). Daudi, M. 2019. The advantage of automating assets management. From: https://www.zenruption.com/zenbusiness/6/30/the-advantages-of-automating-asset-management (accessed 08 February 2021) David. 2019. Complete Dissertation by Statistics Solutions: Expert guidance every step of the way. From: https://www.statisticssolutions.com/what-is-the-difference-between-population-and-sample/ (accessed 27 January 2019). Davis, F.D., Bagozzi, R.P. & Warshaw, P.1989. User Acceptance of Computer Technology: A comparison of the two theoretical models. Journal of Management Science, 35(8):982-1003. De Beer, A.A., Mpofu, R.T., Cant, M.C., Steenkamp, R.J., Badenhorst-Wess, J.A., Ferreira, D. & Groenewald, D. 2011. Business Management for Entrepreneurs. 2ndedition. Cape Town: JUTA. De Groot, J.A. 2014. Biometric Security on Body Sensor Networks. Eindhoven University of Technology. From: https://translate.google.co.za/translate?hl=en&sl =nl&u=https://research.tue.nl/en/publications/biometric-security-on-body-sensor-net works&prev=search (accessed 30 January 2019). De Oliveira, N.B. & Peres, H.H.S. 2015. Evaluation of the Functional Performance and Technical Quality of an Electronic Documentation System of the Nursing Process. From: https://www.ncbi.nlm.nih.gov/pmc/articles/PMC4458997/ (accessed 19 February 2019). De Valence, G. 2017. Market Structure in Building and Construction. Oligopolies in a fragmentedindustry.From:http://gerard-de-valence.blogspot.com/2017/08/market-structure-in-building-and.html(accessed 23 August 2018). De Vos, A., Strydom, H., Fouche, C.B. & Delpot, C.S.L. 2011. Research at GrassRoots: For the social sciences and human service professions, 4thedition. Pretoria: Van Schaik. Dearing, J.W. 2009. Applying Diffusion of Innovation Theory to Intervention Development. NCBI. From: https://www.ncbi.nlm.nih.gov/pmc/articles/PMC2957672/ (accessed 11 April 2019). Del Carpio, J.F. & Miralles, F. 2018. Absorptive Capacity and Innovation in Low-Tech Companies in Emerging Economies. From: http://www.jotmi.org/index.php/GT/article/ view/2640 (accessed 15 February 2019).
190
Delony, D. 2019. What is Information Security? - Definition & Best Practices. From: https://study.com/academy/lesson/what-is-information-security-definition-best-practices.html (accessed 12 June 2019).
Department of Small Business Development: Revised schedule 1 of the national definition of small enterprise in South Africa Act 2. Government Gazette, 15 March 2019, no: 399 (accessed 11 May 2019).
DesMarais, C. 2014. Why Risk-Takers Do Better in Business and in Life? From: https://www.inc.com/christina-desmarais/why-risk-takers-do-better-in-business-and-life.html/(Accessed 21 March 2018). Desmet, D., Maerkedahl, N. & Shi, P. 2014. Adopting an Ecosystem View of Business Technology. From: https://www.mckinsey.com/business-functions/digital-mckinsey/our-insights/adopting-an-ecosystem-view-of-business-technology (accessed 19 February 2019). Devkota, R. 2018. Snowball Sampling. From: https://www.mathstopia.net/sampling/ snowball-sampling (accessed 13 November 2018). Deyto, M. 2015. 6 Benefits of Text Messaging: Why your organisation should use SMS. From: https://blog.textmarks.com/benefits-of-text-messaging/(accessed 4 June 2018). Dias, C. Data Communications and Its Components or Elements. From: http://www. tipsandarticles.com/data-communication-and-components/ (accessed 5 Aug 2018). Dillon, A. & Morris, M. 1996a. User Acceptance of New Information Technology: Theories and models. Journal of Annual Review of Information Science and Technology 31(2):3-32. Dillon, A. & Morris, M.G. 2018b. Acceptance of Information Technology: Theories and models. From: https://www.ischool.utexas.edu/~adillon/BookChapters/User%20 acceptance (accessed 27 April 2018). Dudovskiy, J. 2019. Interpretivism (Interpretivist) Research Philosophy. From: https://research-methodology.net/research-philosophy/interpretivism/(accessed 14 September 2019). Dudovskiy, J. 2016. The Ultimate Guide to Writing a Dissertation in Business Studies: A step-by-step assistance. From: https://research-methodology.net/research-metho dology/reliability-validity-and-repeatability/research-validity/ (accessed 23 September 2017). Duermyer, R. 2017. From: https://www.thebalance.com/entrepreneur-what-is-an-entrepreneur-1794303/ (accessed 3/10/2017). Duffy, J. 2017. The Best Productivity Apps of 2018. From: https://www.pcmag.com/ article2/0,2817,2395938,00.asp (accessed: 20 May 2018).
191
Durcevic, S. 2020. Your Modern Business Guide To Data Analysis Methods And Techniques. From: https://www.datapine.com/blog/data-analysis-methods-and-techniques/, accessed 18 January 2021. Eberechukwu, A.J. & Chukwuma, A. 2016. Integrated Marketing Communication in Building Customer-Based Brand Equity: A review paper. International Journal of Management and Economics 2(3):573-582. Eckler, P. & Bolls, P. 2011. Spreading the Virus: Emotional tone of viral advertising and its effect on forwarding intentions and attitudes. Journal of Interactive Advertising 11(2):1-11. Elsoudy, M. 2016. Primary, Secondary and Tertiary Data. From: https://prezi.com/ 5g7jhyhhieft/primary-secondary-tertiary-data/ (accessed June 2018). Filson, C.K. 2018. Comparative Study of Collection Management Practices of Academic Libraries. Journal of Library Management 39(1/2):66-77. Ford, S. 2019. Building a comprehensive it asset management strategy. From: https://www.forescout.com/company/blog/building-a-comprehensive-it-asset-management-strategy/ (accessed 08 February 2021). Fourie, C.J. & Umeh, N.E. 2017. Application of Lean Tools in the Supply Chain of a Maintenance Environment. From: http://www.scielo.org.za/scielo.php?script=sciart text&pid=S22247890201700010016 (accessed 03 August 2019). Gaille, B. 2018. 25 Advantages and Disadvantages of Qualitative Research. From: https://brandongaille.com/25-advantages-disadvantages-qualitative-research/ (accessed 2 June 2018). Gitman, L.J., 2015. Principles of managerial finance. 2nd Edition, Pearson International Edition. Cape Town: Baseline Publishing Services. Gitman, L.J. & Zutter, C.J. 2015. Principles of managerial finance. 14th Edition, Pearson International Edition. United States: Malaysia. Goldenberg, C. & Dyson, D. 2018b. Demand Flexibility: The key to enabling a low-cost, low-carbon grid oligopolies in a fragmented industry. From:http://gerard-de-valence.blogspot.com/2017/08/market-structure-in-building-and.html (accessed 23 August 2018). Green, L.W. Ottoson, J.M., García, C., Hiatt, R.A. & Roditis, M.L. 2015. Diffusion Theory and Knowledge Dissemination, Utilization and Integration. From: https://www. ncbi.nlm.nih.gov/pmc/articles/PMC4524659/ (accessed 11 April 2019). Grossman, J. 2018. What are the Advantages and Disadvantages of Biometric Identification? From: https://www.hunker.com/12491982/what-are-the-advantages-disadvantages-of-biometric-identification (accessed 5 August 2018).
192
Grothaus, M. 2018. Amazon is Investigating Employees Leaking Sales Data for Bribes. From: https://www.fastcompany.com/90237665/amazon-is-investigating-em ployees-leaking-sales-data-for-bribes (accessed 22 October 2018). Fatoki, O.O. 2014. Factors Influencing the Financing of Business Start-Ups by Commercial Banks in South Africa. Mediterranean Journal of Social Science. 5(20):94-100. Janvier-James, A.M. 2011. A New Introduction Chain Management: Definitions and theories perspective. Journal of International Business Research 5(1). From: http://citeseerx.ist.psu.edu/viewdoc/download?doi=10.1.1.654.8716&rep=rep1&type=pdf (accessed 16 June 2019). Hoque, F. 2016. E-enterprise: Business models, architecture, and components: Breakthroughs in application development. 1st Edition. From: https://www.amazon. com/Enterprise-Architecture-Breakthroughs-Application-Development/dp/052177487 X (accessed 24 July 2018). Halabisky, 2017. 5 Ways Policy Could Close the Gender Gap in Entrepreneurship. From: https://www.weforum.org/agenda/2017/10/five-ways-policy-could-close-the-gender-gap-in-entrepreneurship/ (accessed 17 August 2018). Holzherr, N. 2013. Even Entrepreneurs Shouldn't Bypass Work Experience. From: https://www.theguardian.com/careers/nick-holzherr-entrepreneurs-work-experience (accessed 17 August 2018). Hazen. B.T., Kung, L., Cegielski, C.G. & Jones-Farmer, L.A. 2014. Performance Expectancy and Use of Enterprise Architecture: Training as an intervention. Journal of Enterprise Information Management 27(2):180-196. Heakal, R. 2018. What are Economies of Scale? From: https://www.investopedia.com/ insights/what-are-economies-of-scale/ (accessed 13 March 2018). Hebert, P.R. 2012. In Situ Perceptions of a Move: Facility management interns consider scientist end‐users at a national lab. Journal of Facilities Management 10(2):114-132. Heizer, J. & Render, B. 2008. Operations Management, 9thedition. New Jersey: Upper Saddle River. Hersey, P. & Blanchard, K. 2017. Business Dictionary. From: http://www.business dictionary.com/definition/business-resources.html/ (accessed 3/10/2017). Hickey, K. 2015. The Role of an Enterprise Architect in a Lean Enterprise. From: https://martinfowler.com/articles/ea-in-lean-enterprise.html (accessed 5 November 2018). Hillstrom, L.C. 2018. Value Creation. From: http://www.referenceforbusiness.com/ management/Tr-Z/Value-Creation.html (accessed 15 May 2018).
193
Hamid, A. 2016. Work Experience through Social Entrepreneurship. From: http://coins foundation.org/blog/work-experience-through-social-entrepreneurship/ (accessed 17 August 2018). Hackman, L.C. &Knowlden, A.P. 2014. Theory of Reasoned Action and Theory of Planned Behavior-Based Dietary Interventions in Adolescents and Young Adults: A systematic review. Dove press. From: https://www.ncbi.nlm.nih.gov/pmc/articles/ PMC4057331/ (accessed 6 August 2019). Hagmann, J. 2013. Information Governance beyond the Buzz. Journal of Records management 23(3):228-240. Hair, H., Boshoff, M. & Klopper, T.E. 2015 Marketing, 4thedition. Cape Town: Oxford. Hamel, G. 2019. Legal Constraints on a Business. From: https://smallbusiness.chron. com/legal-constraints-business-23712.html (accessed 05 February 2019). Hamlett, K. 2018. About Management Information Systems. From: http://small business.chron.com/management-information-systems-3957.html (accessed 24 May 2018). Han, J.H., Wang, Y. & Naim. M. 2018. Reconceptualization of Information Technology Flexibility for Supply Chain Management: An empirical study. From: https://www. sciencedirect.com/science/article/pii/S0925527317300555(accessed, 4 August 2018) Harvey, C.R. 2012. External Finance: The free dictionary. From: https://financial-dictionary.thefreedictionary.com/External+finance (accessed 10 June 2019). Hawks, D. 2019. External Factors of a Business: Definition & explanation. From: https://study.com/academy/lesson/external-factors-of-a-business-definition-lesson-quiz.html (accessed 10 February 2019). Hellriegel. D., Slocum. J.W., Jackson. S.E., Staude, L.L.G., Amos, T., Klopper, H.B., Oosthuizen, M.L., Perks, S. & Zindiye, S. 2012. Management, 4th Edition. Pretoria: Oxford Publishers. Hendricks, D. 2018. Being an Entrepreneur Can Prove Difficult, But Understanding These 10 Traits of Other Successful Entrepreneurs Should Help. From: https://www.inc.com/drew-hendricks/10-habits-of-the-successful-entrepreneur.html (accessed 9 May 2018). Herman, E. & Stefanescu, D. 2017. Can Higher Education Stimulate Entrepreneurial Intentions among Engineering and Business Students? Journal of Educational Studies 43(3), pp.312-327. Holden, R.J. 2010. The Technology Acceptance Model: Its past and its future in health care. From: https://www.sciencedirect.com/science/article/pii/S1532046409000963 (accessed 3 June 2018).
194
Hon, A.H.Y. & Lui., S.S. 2016. Employee Creativity and Innovation in Enterprises: Review, integration, and future directions for hospitality research. International journal of contemporary hospitality management 28(5):862-885. From:https://cirt.gcu.edu/ research/developmentresources/research_ready/quantresearch/sample_meth (accessed 13 November 2018). Hordos, L. 2018. What is the Definition of Job Performance? From: https://bizfluent. com.info-7856570-definition-job-performance.html (accessed 04 July 2020). Hughes, J.A. & Sharrock, W.W. 2016. The Philosophy of Social Research, 3rd edition. London: Imprint Routledge. From: https://doi.org/10.4324/9781315840710 (accessed 28 September 2019). Hwang, D. & Min. H. 2015: Identifying the Drivers of Enterprise Resource Planning and Assessing Its Impacts on Supply Chain Performances. Journal of Industrial Management and Data Systems 115(3): 541-569. Hyde, M. 2018. Andre Marriner Debacle Highlights FIFA Aversion to Video Technology. From: https://www.theguardian.com/football/blog/2014/mar/26/andre-marriner-referee-fifa-video-technology(accessed 5 August 2018). Ingram, S.V., 2017. Call to the post: An analysis of Montgomery County equine operators’ motivation for adoption of conservation practices (Doctoral dissertation, Kansas State University). Ingram, D. (2018). About Supply Chain Management Systems. https://smallbusiness.chron.com/supply-chain-management-systems-43344.html, (accessed 28 October 2018). Ismail, N. 2018. A CTO Guide to Digital Transformation in Financial Services. From: https://www.information-age.com/cto-guide-digital-transformation-financial-services-123474478/(accessed, 5 August 2018). Ittana. 2018. 23 Advantages and Disadvantages of Qualitative Research. From: https://vittana.org/23-advantages-and-disadvantages-of-qualitative-research (accessed 22 June 2018). Jacobson, L. 2018. Computer System Components: Computer parts & functions. From: https://study.com/academy/lesson/computer-system-components-computer-parts-functions.html (accessed 20 May 2018). James, B.F. &Kim, J.D. 2018. Most Successful Entrepreneurs are Older than You Think. From: http://theconversation.com/most-successful-entrepreneurs-are-older-than-you-think-95402(accessed: 17 August 2018). Javan, M. 2019. Must-Have Small Business Software and Tech Tools. https://smesouthafrica.co.za/small-business-software-tools/ (accessed 25 February 2021).
195
Jenic, I. 2018. Best Free Android Emulators for Windows 10/8.1/7. From: https://windowsreport.com/best-android-emulators-windows-10/ (accessed 20 May 2018). Jones-Imhotep, E. 2018. Natural Disasters and Technological Failures. From: https://edwardjonesimhotep.com/2018/04/02/natural-disasters-and-technological-failures/(accessed 4 August 2018). Kahraman, C., Kaya, H. & Çevikcan, E. 2011. Intelligence Decision Systems in Enterprise Information Management. Journal of Enterprise Information Management Vol. 24(4)360–379. Kamleitner, B., Korunka, C. & Kirchler, E. 2012. Tax Compliance of Small Business Owner’s: A review. International Journal of Entrepreneurial Behavior & Research 18(3):330-351. Kamleitner, B., Korunka, C. & Kirchler, E. 2012. Tax compliance of small business owner’s: A review. International Journal of Entrepreneurial Behavior & Research. 18(3)330-351. Karim, A.J. 2011. The Significance of Management Information Systems for Enhancing Strategic and Tactical Planning. Journal of Information Systems and Technology Management.8(2). Kayo, A. 2018. The Uses of Mainframe Computers. From: https://www.techwalla.com/ articles/the-uses-of-mainframe-computers (accessed 20 May 2018). Kehring, D. 2018. Finance and HR. From: https://go.oracle.com/LP=67231?elq CampaignId=52212&src1=ad:pas:go:dg:hcm&src2=wwmk160606p00115c0014&SC=sckw=WWMK160606P00115C0014&mkwid=sS1GZ9MBS%7cpcrid%7c265000317580%7cpkw%7cbusiness%20finance%7cpmt%7cp%7cpdv%7cc%7csckw=srch:business%20finance (accessed 15 May 2018). Keith, F.P. 2014. Introduction to Social Research: Qualitative and quantitative approaches, 3rd edition. London: SAGE Publication Inc. Kelly, K. 2018. How to Combine Word Documents & Maintain Different Headers. From: http://smallbusiness.chron.com/combine-word-documents-maintain-different-headers-54802.html (Accessed 3 June 2018). Kelly, L., Kerr, G. & Drennan, J. 2010. Avoidance of Advertising in Social Networking Sites. The Teenage Perspective Journal 10(2):16-27. Kent, D.M., & Tsang, E.W.K. 2010. Testing Management Theories: Critical realist philosophy and research methods. From: https://doi.org/10.1002/smj.868 (accessed 11 May 2019). Ketteni, E., Mamuneas, T. & Stengos, T. 2011. The Effect of Information Technology and Human Capital on Economic Growth. From: https://www.cambridge.org/core/
196
journals/macroeconomic-dynamics/article/effect-of-information-technology-and-human-capital-on-economic-growth/B39EE14413BE604D13D81602C7C524F8 (accessed 27 January 2019). Khalifa, A.B. 2016. Determinants of Information and Communication Technologies Adoption by Tunisian Firms. From: https://www.cairn.info/revue-journal-of-innovation-economics-2016-2-page-151.htm# (accessed 15 February 2019). Kharytonov, S. & Sukholeyster, O. 2012. Enterprise IT Architecture: Goals, trends and perspectives. From: http://sandhill.com/article/enterprise-it-architecture-goals-trends-and-perspectives/ (accessed 19 December 2018). Kihn, S. 2018. Common Mistakes Made When Using email. From: http://careerminer. infomine.com/common-mistakes-made-when-using-email/, (accessed 10 May 2018). Kim, H.Y. 2014. Analysis of Variance (ANOVA) Comparing Means of More Than Two Groups. From: https://www.ncbi.nlm.nih.gov/pmc/articles/PMC3916511/ (accessed 06 August 2019). Kirlidog, M. & Kaynak, A. 2013.Technology Acceptance Model and Determinants of Technology Rejection. From: https://www.igi-global.com/chapter/technology-acceptance Z-model-determinants-technology/73603(accessed 11June 2018). Kivunja, C. & Kuyini, A.B. 2017. Understanding and Applying Research Paradigms in Educational Context. From: https://files.eric.ed.gov/fulltext/EJ1154775.pdf (accessed 28 September 2019). Klein, M. 2014. Tables and Other Formatting Controls. From: https://www.howtogeek. com/school/microsoft-word-document-formatting-essentials/lesson3/ (accessed 26 December 2018). Knight, D. 2014. Welcome to Low End Mac: Personal computer history: 1975-1984. From: http://lowendmac.com/2014/personal-computer-history-the-first-25-years/ (accessed: 20 May 2018). Knox, C.C. & Haupt, B. 2015. Incorporating Cultural Competency Skills in Emergency Management Education: Journal of Disaster Prevention and Management 24(5), pp.619-634. Kocoglu, D. & Kirmaci, S.K. 2012. Banking Sector Performance. Journal of Research in Humanities & Social Sciences 3(2):33-35. Kooser, A.C. 2018. Advantages and Benefits of Email for a Business. From: http://smallbusiness.chron.com/advantages-benefits-email-business-846.html (accessed 7 May 2019). Kousar, S. 2017. Technological Factors and Adoption of Green Innovation-Moderating Role of Government Intervention: A case of SMEs in Pakistan. From: https://www. researchgate.net/publication/324834766_Technological_Factors_and_Adoption_of_
197
Green_Innovation-Moderating_Role_of_Government_Intervention_A_ Case_of_SMEs_in_Pakistan/figures?lo=1 (accessed 02 April 2019). Kowalczyk, D. 2019. What is Informed Consent in Research? Definition & purpose. From: https://study.com/academy/lesson/what-is-informed-consent-in-research-definition-purpose.html (accessed 29 January 2019). Kozicki, L. 2017. What is the Role of Communication in Supply Chain Management? From: https://www.quora.com/What-is-the-role-of-communication-in-supply-chain-management (accessed 21/03/2018). Kraemer-Eis, H., Botsari, A., Gvetadze, S., Lang, F. & Torfs, W. 2018. European Small Business Finance Outlook. From: https://www.econstor.eu/handle/10419/180655 (accessed 21 July 2019). Kramer, L. 2018. What are Common Examples of Monopolistic Markets? From: https://www.investopedia.com/ask/answers/041415/what-are-common-examples-monopolistic-markets.asp (accessed 23 August 2018). Krishnaraju, V. & Mathew, S.K. 2013. Web Personalization Research: An information systems perspective. Journal of Systems and Information Technology, Vol. 15(3)254-268. Kruger, N. 2016. South Africa Has a Skills Shortage: How do we fix it? From: https://www. weforum.org/agenda/2016/05/south-africa-skills-shortage-how-do-we-fix-it/ (accessed 27 January 2019). Kshetri, 2019. Diffusion Pattern of Linux: An assessment on major technology dimensions. From: https://firstmonday.org/article/view/1263/1183 (accessed 18 February 2019). Kshetri, 2019. Diffusion Pattern of Linux: An assessment on major technology dimensions. From: https://firstmonday.org/article/view/1263/1183 (accessed 18 February 2019). Kubberød, E. & Pettersen, I.B. 2018. The Role of Peripherality in Students’ Entrepreneurial Learning, Education & Training, Vol. 60(1)2-15. Kuehnhausen, M. & Frost, V.S. 2011. Transportation Security Sensornet: A service‐oriented architecture for cargo monitoring", Journal of Systems and Information Technology 13(4). Kuhn, K., Galloway, T. & Collins-Williams, M. 2016. Near, Far and Online: Small business owner’s advice-seeking from peers. Journal of Small Business and Enterprise Development. 23(1)189-206. Kumar, C.C.S. 2000. An Application of a System Analysis Methodology to Manage Logistics in a Textile Supply Chain. An International Journal of Supply Chain Management, Vol. 5 (5)234 – 245.
198
Kuntz, J., Connell, P. & Näswall, K. 2017. Workplace Resources and Employee Resilience: The role of regulatory profiles. International Journal of Career Development 22(4): 419-435. Leydesdorff, L. 2000. Complexity and Technology. From: https://www.leydesdorff. net/compltech/ (accessed 4 August 2018). Ladner, S. 2018. Sampling Methods in Qualitative and Quantitative Research. Sampling Methods. Lamb, C.W., Hair, J.F., McDaniel, C., Boshoff, C. & Terblanche, N. 2019. Marketing, 5th edition. Cape Town: Oxford. LaMorte, W.W. 2018. Diffusion of Innovation Theory. Boston University School of Public Health. From: http://sphweb.bumc.bu.edu/otlt/MPH-Modules/SB/Behavioral ChangeTheories/BehavioralChangeTheories4.html (accessed 02 April 2019). Landgraf, M. 2016. Risk Aversion Impedes Innovation in Information Technology. From: http://www.kit.edu/kit/english/pi_2016_060_risk-aversion-impedes-innovation-in-information-technology.php (accessed 6 September 2018). Lani, J. 2018. ANOVA (Analysis of Variance). From:http://www.statisticssolutions.com /manova-analysis-anova/ (accessed 29 April 2018). Laudon, K.C. & Laudon, J.P. 2018. Management Information Systems: Managing the digital SMEs, 15th Edition. New York University: Person Education. Lawrence, B. 2017. Nine Competencies for HR Excellence Emerge. From: https://www.hrci.org/community/blogs-and-announcements/hr-leads-business-blog/ certification-matters/2017/04/04/nine-competencies-for-hr-excellence-emerge (accessed 20 May 2018). Lee, E. & Rhim, H. 2014. An Application of Conjoint Analysis to Explore User Perceptions on Management Information Systems: A case study. Journal of Management Research Review 37(1):69-88. Learch, J.C. & Melicher R.W. 2018. Enterpreneurial Finance. 6th Edition. Cengage Learning. United States of America. Lechesa M., Seymour L., Schuler J. (2012) ERP Software as Service (SaaS): Factors Affecting Adoption in South Africa. In: Møller C., Chaudhry S. (eds) Re-conceptualizing Enterprise Information Systems. Lecture Notes in Business Information Processing, vol 105. Springer, Berlin, Heidelberg. From: https://doi.org/10.1007/978-3-642-28827-2_11 (accessed 25 February 2021). Leedy, P.D. & Ormrod, J.E. 2014. Practical Research, Planning and Design, 10th edition. United States of America: British Library Cataloguing-in-publication data. From: https://cirt.gcu.edu/research/developmentresources/researchready/quantre search/sample_meth (accessed 13 November 2018).
199
Leenes, R., Palmerini, E., Koops, B.J., Bertolini, A., Salvini, P. & Lucivero. 2017. Regulatory Challenges of Robotics: Some guidelines for addressing legal and ethical issues.From:https://www.tandfonline.com/doi/full/10.1080/17579961.2017.1304921 (accessed 05 February 2019). Leonard, K. 2018. Examples of Core Competencies of a Human Resource Manager. From: http://smallbusiness.chron.com/examples-core-competencies-human-resource -manager-10027.html (accessed 20 May 2018). Liedtke, L. 2019. SME Sector ‘Critical’ to Growing South Africa’s Economy – Pityana. From: https://www.engineeringnews.co.za/article/sme-sector-critical-to-growing-south-africas-economy-pityana-2019-04-11 (accessed 29 July 2019). Lin, V. 2016. Three Tips to Reduce Your Supplier Lead Time. From: https://www.trade gecko.com/blog/supply-chain-management/three-tips-to-reduce-your-supplier-lead-time (accessed 03 August 2019). Little, L. 2010. Talent Management and Its Technological Partners. Journal of Industrial and Commercial Training 42(7):389-393. Liu, Y. 2017. Risk-Taking and Persistence Make Successful Entrepreneurs, says Sequoia’s Shen. From: http://www.scmp.com/business/money/markets-investing/ article/2113463/risk-taking-and-persistence-make-successful/ (accessed 21/03/ 2018). Lobiondo-Wood, G., & Haber, J. 2013. Nursing Research in Canada: Methods, critical appraisal, and utilization, 3rdedition. Canada. Lombardo, C. 2018. 17 Advantages and Disadvantages of Random Sampling. From: https://vittana.org/17-advantages-and-disadvantages-of-random-sampling (accessed 14 November 2018). Lorette, K. 2018. Sources of Finance for a Partnership. From: http://smallbusiness. chron.com/sources-finance-partnership-3663.html (accessed 15 May 2018). Lund Research Ltd. 2012. Stratified Random Sampling. From: http://dissertation.laerd. com/stratified-random-sampling.php#step5, (accessed 19 November 2018). MacVaugh, 2019. Limits to the Diffusion of Innovation: A literature review and integrative model. From: https://www.emeraldinsight.com/doi/full/10.1108/146010610 11040258 (accessed 11 April 2019). Marais, J. 2018. Policy and Regulations: SA ‘completely out of step’ with global SME growth trends. From: https://www.businesslive.co.za/bd/business-and-economy/ 2018-07-25-sa-completely-out-of-step-with-global-sme-growth-trends/ (accessed 29 July 2019).
200
Martin, G. 2019. The Meaning and Origin of the Expression: Carbon-copy. Phrase Finder. Phrases. From: https://www.phrases.org.uk/meanings/carbon-copy.html (accessed 16 June 2019). Martínez, R.A. 2017. The Importance of the Languages of Scientific Publications: Main types of limitations.School of authors. From: https://schoolofauthors.wordpress. com/2017/04/07/main-types-of-limitations/ (accessed 01 April 2019). Matin, M.A. & Islam, M.M. 2012. Open Access Peer-Reviewed Chapter: Overview of wireless sensor network. intecopen. From: https://www.intechopen.com/books/wire less-sensor-networks-technology-and-protocols/overview-of-wireless-sensor-network (accessed 16 June 2019). McKinlay, J., Pithouse, D., McGonagle, J. & Sanders, J. 2018. Blockchain: Background, challenges and legal issues. From: https://www.dlapiper.com/en/den mark/insights/publications/2017/06/blockchain-background-challenges-legal-issues/ (accessed 05 February 2019). Merrick, P. & Allen, C. 2018. Web Interface Definition Language (WIDL). W3C. Web Interface Definition Language (WIDL) (accessed 12 June 2019). Merritt, T. 2019. Top 5: Ways to End Resistance to Digital Transformation. From: https://www.techrepublic.com/article/top-5-ways-to-end-resistance-to-digital-transfor mation/ (accessed 10 May 2019). Mitchell, B. 2019. What is a Wide Area Network (WAN)? What is a wan and how does it work? Lifewire. From: https://www.lifewire.com/wide-area-network-816383 (accessed 09 August 2019). Mkansi, M. & Acheampong. E.A. 2012.Research Philosophy Debates and Classifications: Students’ Dilemma. Journal of business research methods provides perspectives on topics relevant to research in the field of business and management. 10(2):132-140). From: http://www.ejbrm.com/front/search/index.html (accessed 28 September 2019). Mlangeni, T. 2017. Youth Development Strategy, An Entrepreneurial Programme Launched in Mbombela: Minister Lindiwe Zulu says the youth needs to be clever, smart and educated to enter into the business world. Mpumalanga news. From:https://mpumalanganews.co.za/308951/youth-development-strategy-entre preneurial-programme-launched-mbombela/ (accessed 15 April 2019). Montilva, J., Barrios, J. & Besembel, I. 2014. A Business Process Model for IT Management Based on Enterprise Architecture. From: http://www.scielo.edu.uy/ scielo.php?script=sci_arttext&pid=S0717-50002014000200004 (accessed 06 Feb 2019). Marshall, P.A., Adebamowo, C.A., Ogundrian, T.O., Vekich, M., Strenski, T., Zhou & Maurer, R. 2018. More Employers are Using Biometric Authentication: But security concerns mean that passwords aren’t going away just yet. From:
201
https://www.shrm.org/resourcesandtools/hr-topics/technology/pages/employers-using-biometric-authentication.aspx (accessed 18 January 2019). Mayhew, S. 2019. What is Fingerprint Identification? From: https://www.biometricup date.com/201205/what-is-fingerprint-identification (accessed 18 January 2019). McDonald, M. & Conner, N. 2018. The Missing Manual. From: https://www.oreilly.com/ library/view/office-2013-the/9781449359416/ch04.html, (accessed: 26 December 2018). Morgado, F.F.R., Juliana, F.F., Meireles, J.F.F., Neves, C.M., Amaral, A.C.S. & Ferreira, M.E.C. 2017. Scale Development: Ten main limitations and recommendations to improve future research practices. Scielo. From: http://www. scielo.br/scielo.php?script=sciarttext&pid=S0102-79722017000103301 (accessed 01 April 2019).
Morosan, C. 2011. Opportunities and Challenges for Biometric Systems in Travel: A review. University of Massachusetts Amherst: International Conference. From: https:// scholarworks.umass.edu/cgi/viewcontent.cgi?article=1686&context=ttra (accessed 30 January 2019). Mulder, P. 2012. Diffusion of Innovations Theory. From: https://www.toolshero.com/ marketing/diffusion-of-innovations-rogers/ (accessed 26 February 2019). Mulder, P. 2019. Business IT Alignment. From: https://www.toolshero.com/strategy/ business-it-alignment/ (accessed 08 April 2019). Mulesoft. 2009. Financial Services and Legacy Systems. From: https://www.mule soft.com/resources/esb/financial-services-legacy-systems-modernization (accessed 6 February 2019). Mutoko, W.R. & Kapund, S.M. 2017. Factors Influencing Small, Medium and Micro-Sized Enterprises' Borrowing from Banks: The case of the Botswana manufacturing sector. Scielo. From: http://www.scielo.org.za/scielo.php?script=sci_arttext&pid=S168 4-19992017000100013 (accessed 15 April 2019). Mzekandaba, S. 2018a. Government Steps up SME Support. From:https://www.it web.co.za/content/JN1gPvO16JrMjL6m (accessed 29 July 2019). Mzekandaba, S. 2018b. Union Takes Issue with SASSA Biometrics. From: https:// www.itweb.co.za/content/KA3WwMdlORoMrydZ (accessed 2 December 2018). Mayhew, S. 2019. What is Fingerprint Identification? From: https://www.biometricup date.com/201205/what-is-fingerprint-identification (accessed 18 January 2019). Murphy, B. 2018. What are the Pros and Cons of Stratified Random Sampling? From: https://www.investopedia.com/ask/answers/041615/what-are-advantages-and-disad vantages-stratified-random-sampling.asp (accessed 14 November 2018).
202
Martin, M. 2017. Porter's Five Forces: Analyzing the Competition. From: https://www. businessnewsdaily.com/5446-porters-five-forces.html (accessed 21/03/2018). Manning, T. & Robertson, R. 2015. Explorations into Sex, Gender and Leadership in the UK Civil Service Part 2: Hypotheses and research findings. Journal of Industrial and Commercial Training 47(6):310 – 319. Mathaisel, D.F.X. 2013. A Lean Architecture for Transforming the Aerospace Maintenance, Repair and Overhaul (MRO) Enterprise. International Journal of Productivity and Performance Management 54(8):62-644. Metcalf, A. 2015. Nationwide Training Limited were Chosen by Action for Blind People to Design an ILM Middle Manager Leadership and Management Programme. Journal of Industrial and Commercial Training 47(6):326 – 329. Mills, J., Purchase, V.C. & Parry, G. 2013. Enterprise Imaging: Representing complex multienterprise service enterprises. International Journal of Operations & Production Management 33(2):159-180. Mantzana, V., Themistocleous, M. & Morabito, V. 2010. Healthcare Information Systems and Older Employees' Training. Journal of Enterprise Information Management. (23)6:680-693. Mohamed, N., Kaur, J. & Singh, G. 2012. A Conceptual Framework for Information Technology Governance Effectiveness in Private Enterprises. Journal of Information Management & Computer Security 20(2):88-106. Mishra, S. 2015. Enterprise Objectives for Information Security Governance: A value focused assessment. Journal of Information & Computer Security 23(2):122-144. Mantzana, V., Themistocleous, M. & Vincenzo, M. 2010. Healthcare Information Systems and Older Employees’ Training. Journal of Enterprise Information Management, Vol. 23(6):680-693. Markgraf, D. 2018.Describe the Three Levels of Strategy for a Single-Business Company. From: http://smallbusiness.chron.com/describe-three-levels-strategy-singlebusiness-company-23508.html (accessed 12 May 2018). Marks, G. 2018. Sorry, Millennials: The average age of a successful entrepreneur is a lot older than you think. From: https://www.washingtonpost.com/news/on-small-business/wp/2018/04/24/sorry-millennials-the-average-age-of-a-successful-entrepre neur-is-a-lot-older-than-you-think/?noredirect=on&utm_term=.2872f42d5762 (accessed: 17 August 2018). McLaughlin, L. 2016. How to Work with Executive Recruiters. From: http://www.busi nessdictionary.com/article/1266/work-executive-recruiters-wsj1604/ (accessed 24 May 2018).
203
McPeak, D. 2018. Strengthening Organisations: Advancing economies. Revised definition of the professional accountant. From: https://www.iaesb.org/projects/revised -definition-professional-accountant, Strengthening Organisations, Advancing Economies (accessed 5th June 2018). Magubane, K. 2018. Finance Minister Tito Mboweni Demands Consequences for VBS ‘bank heist. From: https://www.fin24.com/Economy/finance-minister-demands-consequences-for-vbs-bank-heist-20181016-2 (accessed 22 October 2018). Maverick, 2018. Which Types of Industries Have the Largest Capital Expenditures? From: https://www.investopedia.com/ask/answers/020915/which-types-industries-have-largest-capital-expenditures.asp (accessed 4 June 2018). McKinlay, J., Pithouse, D., McGonagle, J. & Sanders, J. 2018. Blockchain: Background, challenges and legal issues. From: https://www.dlapiper.com/en/den mark/insights/publications/2017/06/blockchain-background-challenges-legal-issues/ (accessed 05 February 2019). Michael, M. & Mike, P. 2014. Refurbished IBM Mainframes. From: https://simonsys. com/?gclid=EAIaIQobChMI3tuyuIWU2wIVloXVCh1auwPJEAMYASAAEgL05_D_BwE (accessed 20 May 2018). Misra, V., Khan, I.M. & Singh, U.K. 2010. Supply Chain Management Systems: Architecture, design and vision. Journal of Strategic Innovation and Sustainability 6(1):96–101. Moran, R. 2016. Mainframe or Personal Computers. From: http://www.roymoran.com/ personal-computer-vs-main-frame/ (accessed 19 June 2018). Mote. S. 2017. Four Types of Entrepreneurship: Because one definition does not fit all. From: https://www.kcsourcelink.com/blog/blog/2017/01/30/four-types-of-entrepre neurship-because-one-definition-does-not-fit-all (accessed 20 August 2018). MTN Group. 2019. Group SCM Overview. From: https://www.mtn.com/en/mtn-group/ supplier/Pages/default.aspx (accessed 20 February 2019). Muhamad, A. 2018. Analyzing Quantitative Research. https://cirt.gcu.edu/research/ developmentresources/research_ready/quantresearch/analyze_data (accessed 19 June 2018). Murthy, S.R. & Mani, M. 2013. Discerning Rejection of Technology. From: http:// journals.sagepub.com/doi/pdf/10.1177/2158244013485248 (accessed 4 Aug 2018). Mustafa, E., Yusof, K.N. & Iranmanesh, M. 2016. Innovation Creation, Innovation Adoption, and Firm Characteristics in the Construction Industry. Journal of Science & Technology Policy Management 7(1). Naim, M.F. & Lenka, U. 2017. Talent Management: A burgeoning strategic focus in Indian IT industry. Industrial and Commercial Training 49(4):183-188.
204
Nair, P.R. 2010. Benefits of Information Technology Implementations for Supply Chain Management: An explorative study of progressive Indian companies. From: https://www.igi-global.com/chapter/benefits-information-technology-implementations-supply/42266 (accessed 25 February 2019). Najafabadi, M.I. & Aziz, N.A. 2013. Homogeneous Charge Compression Ignition Combustion: Challenges and proposed solutions. From: https://www.hindawi.com/ journals/jc/2013/783789/ (accessed 08 April 2019). Naser, D. 2018. Application-Driven Advances in Multi-Biometric Fusion. From: http:// tuprints.ulb.tu-darmstadt.de/7324/ (accessed 30 January 2019). National Academy of Sciences Engineering Medicine. 2009. Introduction to instrumentation. From: https://www.nap.edu/read/11520/chapter/4 (accessed 29 Jan 2019). Naudé, W. & Minniti, M. 2011. Examining the Entrepreneur Gender Gap. From: https:// unu.edu/publications/articles/examining-entrepreneur-gender-gap.html#info, (accessed: 17 August 2018). Nazir, M. & Zhu, X. 2018. E-commerce Adoption Factors Affecting the SMEs: A case study investigation of a developing economy-Pakistan. Scholar Teesside University: Business School Teesside University United Kingdom. From: https://research.tees.ac.uk/en/publications/e-commerce-adoption-factors-affecting-the-smes-a-case-study-inves (accessed 18 May 2019). Nel, N.M., Tlale, L.D.N, Engelbrecht, P. & Nel, M. 2016. Teacher’s Perfections of Education Support Structures in the Implementation of Inclusive Education in South Africa. From: http://www.scielo.org.za/pdf/koers/v81n3/03.pdf (accessed 16 June 2019). Nemoto, T, and Beglar, D. 2014. Developing Likert-scale questionnaires. In Sonda, N. and Krause (Eds.), A. JALT2013 Conference Proceedings. Tokyo. From: https://jalt-publications.org/files/pdf-article/jalt2013_001.pdf (accessed 19 December 2020). Ness, L. 2008. Exploring Information Technology Flexibility and Increased Complexity: is Management Prepared? From: https://www.researchgate.net/publication/25471847 8_Exploring_Information_Technology_Flexibility_and_Increased_Complexity_Is_Management_Prepared(accessed 4 August 2018). Neubauer, K. 2009.Advantages and Disadvantages of Different Column Types for Speciation Analysis by LC-ICP-MS. From: http://www.spectroscopyonline.com/advan tages-and-disadvantages-different-column-types-speciation-analysis-lc-icp-ms (accessed 26 December 2018). Neurosc, R.N. 2017. Restorative Neurology and Neuroscience: Waist-up protection for blind individuals using the EyeCane as a primary and secondary mobility aid. NCBA. From: https://www.ncbi.nlm.nih.gov/pmc/articles/PMC5366249/ (accessed 16 June 2019).
205
Newlands, M. 2018. Managing Your Personal Finances as an Entrepreneur: 14 tips from leading experts.From:https://www.inc.com/murray-newlands/managing-your-personal-finances-as-an-entrepreneur-14-tips-from-leading-experts.html (accessed 15 May 2018). Nickolaisen, N. 2018. Why an Enterprise Application Architecture Strategy is Still Needed. From: https://searchcio.techtarget.com/tip/Why-an-enterprise-application-architecture -strategy-is-still-needed (accessed 6 November 2018). Nieman, G.H. 2013. Small Business Management: A South African approach. Pretoria: Van Schaik. Nimsaj, J. 2016. Executive Support Systems. From: https://prezi.com/wdnjhpiyinm9/ executive-support-system/ (accessed 24 May 2018). Nkosi, S. 2019. A Capable State to Support Small Business. From: https://city-press.news24.com/Business/a-capable-state-to-support-small-business-20190321 (accessed 29 July 2019). Nordmeyer, B. 2019. Three Different Types of Enterprise Systems. From: https://small business.chron.com/three-different-types-enterprise-systems-73267.html (accessed February 2019). Ntalianis, F., Dyer, L. & Vandenberghe, C. 2015. Owner-Employee Relations in Small Firms. Journal of Managerial Psychology 30(7):832-846. O'Gorman, K.D. & MacIntosh, R. 2015. Chapter 4 Mapping Research Methods. From: https://www.goodfellowpublishers.com/academicpublishing.php?promoCode=&partnerID=&content=doi&doi=10.23912/978-1-910158-51-7-2772 (accessed 28 Sept 2019). Olsson, A., Skovdahl, K. & Engström, M. 2016. Using Diffusion of Innovation Theory to Describe Perceptions of a Passive Positioning Alarm among Persons with Mild Dementia: A repeated interview study. US National Library of Medicine. From: https://www.ncbi.nlm.nih.gov/pmc/articles/PMC4706660/ (accessed 11 April 2019). Oyugi, C., Nocera, J.A., Dunckley, L. & Dray, S. 2008. The Challenges for Participatory Design in the Developing World. From: https://dl.acm.org/citation.cfm?id=1795308 (accessed 08 April 2019). Pashaei, S. & Olhager, J. 2015. Product Architecture and Supply Chain Design: A systematic review and research agenda. An International Journal of Supply Chain Management: 20(1): 98–112. Pristine, P. 2017.Different Types of Financial Models for Financial Modelling. From:https://www.edupristine.com/blog/different-types-financial-models-financial-modelling (accessed 31 July 2019).
206
Rafeedalie, E. 2019. Positivist and Non-Positivist Paradigm of Research as a Generating Knowledge. Top Hat: Marketplace. From: https://tophat.com/marketplace/ social-science/education/course-notes/oer-positivist-and-non-positivist-paradigm-of-research-dr-rafeedalie/1192/ (accessed 14 September 2019). Ramlee, S. & Berma. B. 2013. Financing Gap in Malaysian Small-Medium Enterprises: A supply-side perspective. From: http://www.scielo.org.za/scielo.php?script=sci_art text&pid=S222234362013000500012 (accessed 27 January 2019). Rampersad, G., Plewa, C. & Troshani, I. 2012. Investigating the Use of Information Technology in Managing Innovation: A case study from a university technology transfer office. From:https://www.sciencedirect.com/science/article/pii/S0923474811 000403(accessed 27 January 2019). Ray, S. 2015. Analytics Vidhya. Commonly Used Machine Learning Algorithms (with Python and R Codes). From: https://www.analyticsvidhya.com/blog/2017/09/common-machine-learning-algorithms/(accessed 03 August 2019). Reichert, F.M. & Zawislak, P.A. 2014. Technological Capability and Firm Performance. Journal of Technology Management & Innovationversión On-line ISSN 0718-2724. From: https://scielo.conicyt.cl/scielo.php?script=sci_arttext&pid=S0718-27242014000 400002 (accessed 10 June 2019). Rehman, M.H., Majumdar, S. & Krishna, C.Y.S. 2017. Assessment of factors impacting customer buying behaviour in software product companies. IUJ Journal of management, 5, pp.21-25. From: https://scholar.google.com/citations?user=3GsDGCMAAAAJ&hl=en#d=gs_md_cita-d&u=%2Fcitations%3Fview_op%3Dview_citation%26hl%3Den%26user%3D3GsDGCMAAAAJ%26citation_for_view%3D3GsDGCMAAAAJ%3AhqOjcs7Dif8C%26tzom%3D-120 (accessed 21 November 2020). Rhodes, P. & Bryant, J.H. 2019. Public Health. Encyclopaedia Britannica. From: https://www.britannica.com/topic/public-health (accessed 02 April 2019). Russel, J.E.A. 2013. How to Create Change in the Workplace. From: https://www. washingtonpost.com/business/capitalbusiness/how-to-create-change-in-the-work place/2013/11/27/9d62f8de-5548-11e3-835d-e7173847c7cc_story.html?noredirect= on&utm_term=.2958a573402e (accessed 25 February 2019). Ruhl, J.B. & Katz, D.M. 2015.Measuring, Monitoring and Managing Legal Complexity. Lowa Law Review. From:https://ilr.law.uiowa.edu/print/volume-101-issue-1/measu ring-monitoring-and-managing-legal-complexity/ (accessed 10 June 2019). Rosenberg, A. 2011. Philosophy of Science: A contemporary introduction, 3rd edition. New York. From: https://doi.org/10.4324/9780203807514 (accessed 28 September 2019).
207
Rossi, B. 2014. Legal Issues Currently Affecting the Tech Sector. From: https://www.in formation-age.com/legal-issues-currently-affecting-tech-sector-123458694/ (accessed 27 January 2019). Nguyen, S. 2010. Industrial & Organisational Psychology, Leadership, Teams, Training & Development: 6 steps to manage resistance to change. From: https://work placepsychology.net/2010/05/13/6-steps-to-manage-resistance-to-change/ (accessed 25 February 2019). Oldewage, E.T., Engelbrecht, A.P. & Wesley, C.C. 2019. The Importance of Component-Wise Stochasticity in Particle Swarm Optimization. From: https://repo sitory.up.ac.za/handle/2263/67359 (accessed 24 February 2019). Parise, F., Lygeros, J. & Ruess, J. 2015. Bayesian Inference for Stochastic Individual-Based Models of Ecological Systems: A pest control simulation study. From: https://www.frontiersin.org/articles/10.3389/fenvs.2015.00042/full (accessed 24 Feb 2019). Price, J.H. & Murnan, J. 2019. Research Limitations and the Necessity of Reporting Them. Libguides. American Journal of Health Education 35(2004):66-67. From: http://libguides.usc.edu/writingguide/limitations (accessed 01 April 2019). Ray, L. 2019. Seven External Factors of Business. https://smallbusiness.chron.com/ seven-external-factors-business-21960.html (accessed 01 April 2019). Ross, S.M. 2019. Legal Environment of Business. From: https://michiganross.umich. edu/courses/legal-environment-business-9723 (accessed 23 February 2019). Rossi, B. 2014. Legal Issues Currently Affecting the Tech Sector. From: https://www. information-age.com/legal-issues-currently-affecting-tech-sector-123458694/ (accessed 18 February 2019). Ruiz, S.L.C. & Kovács, T. 2016. Biometric Information Acquisition, Privacy Issues at the Workplace: Monitoring vs Security. From:http://bgk.uni-obuda.hu/iesb/2016/ publication/10.pdf (accessed 30 January 2019). Rungta, A. 2016. What is Technophobia and How to Overcome It? From: https://www. indusnet.co.in/what-is-technophobia-and-how-to-overcome-it/ (accessed 24 February 2019). Saeed, S. 2018. What is Pragmatism? Is it a suitable worldview for mixed methods research design? From: https://www.researchgate.net/post/whatis_pragmatism_ Isit_a_suitable_worldview_for_mixed_methods_researchdesign (accessed 14 September 2019). Sahab, S.A., Rose, R.C. & Osman, S.I.W. 2012. Defining the Concepts of Technology and Technology Transfer: A literature analysis. Research Gate. From: https://www. researchgate.net/publication/318015152_Defining_the_Concepts_of_Technology_and_Technology_Transfer_A_Literature_Analysis (accessed 16 June 2019).
208
Sahni, J., Levine, E. & Shinghal, S. 2019. The Productivity Imperative for Healthcare Delivery in the United States. From: https://www.mckinsey.com/~/media/McKinsey/ Industries/Healthcare%20Systems%20and%20Services/Our%20Insights/The%20productivity%20imperative%20for%20healthcare%20delivery%20in%20the%20United%20States/The-productivity-imperative-for-healthcare-delivery-in-the-United-States.ashx (accessed 03 August 2019). Salthouse, T.A. 2011. All Data Collection and Analysis Methods Have Limitations. From: https://www.ncbi.nlm.nih.gov/pmc/articles/PMC3160711/ (accessed 01 April 2019). Sanson-Fisher, R.W. 2014. Diffusion of Innovation Theory for Clinical Change. From: https://www.mja.com.au/journal/2004/180/6/diffusion-innovation-theory-clinical-change (accessed 26 February 2019). Sarniak, R. 2015. 9 Types of Research Bias and How to Avoid Them. From: https://www.quirks.com/articles/9-types-of-research-bias-and-how-to-avoid-them (accessed 31 July 2019). Schulz, W. & Dankert, D. 2016. Governance by Things’ as a Challenge to Regulation by Law. From: https://policyreview.info/articles/analysis/governance-things-challenge-regulation-law (accessed 05 February 2019). Sebetci, Ö. 2019. Enhancing End-User Satisfaction through Technology Compatibility: An assessment on health information system. Science Direct. From: https://www. sciencedirect.com/science/article/pii/S2211883718301412#! (accessed 02 April 2019). Sharrock, W. & Button, G. 2016. In Support Of Conversation Analysis’ Radical Agenda. Sagepub. From: https://journals.sagepub.com/doi/full/10.1177/1461445616 657955 (accessed 28 September 2019). Sherman, F. 2018. What are Internal & External Environmental Factors That Affect Business? From: https://smallbusiness.chron.com/internal-external-environmental-factors-affect-business-69474.html (accessed 10 February 2019). Shrivastava. S. 2019. Karl Pearson's Coefficient of Skewedness. From: https://www. youtube.com/watch?v=Ye10VS81KAM&t=4s (accessed 08 May 2019). Shrourou, A. 2019. Researchers Identify Brain Pathways of Aversion. From: https://www.news-medical.net/news/20190214/Researchers-identify-brain-pathways-of-aversion.aspx (accessed 24 February 2019). Shuttleworth, M. 2008. Validity and Reliability. From: https://explorable.com/validity-and-reliability (accessed 29 January 2019). Silverman, B.G. & Lim, S. 2016. Artificial Intelligence and Human Behavior Modeling and Simulation for Mental Health Conditions. From: https://www.sciencedirect.com/ science/article/pii/B9780124202481000076 (accessed 06 August 2019).
209
Simonds, V.W. & Rudd, R.E. 2019. Public Health. From: https://www.britannica.com/ topic/public-health (accessed 02 April 2019). Skoko, H., Ceric, A. & C. Huang C. 2008. Electronic Commerce Adoption Model of Chinese SMEs. Journal of Business Research 161-165. Small Business Development. 2019. These are the New Definitions for Micro, Small and Medium Enterprises in South Africa. Business Stech. From: https://businesstech. co.za/news/business/305592/these-are-the-new-definitions-for-micro-small-and-medium-enterprises-in-south-africa/ (accessed 31 July 2019). Susan, B., Forte, A. & Bruckman, A. (2005). Becoming Wikipedian: Transformation of participation in a collaborative online encyclopedia, Proceedings of GROUP International Conference on Supporting Group Work, pp 1.-10. https://en.wikipedia.org/wiki/Legitimate_peripheral_participation, (accessed: 4th June 2018). Moran, R. 2016. Mainframe or Personal Computers. From: http://www.roymoran.com/ personal-computer-vs-main-frame/ (accessed 19 June 2018). O’Kelly, A. 2016. Gender Equality: Where do female entrepreneurs stand today? From: https://www.huffingtonpost.com/allison-okelly/gender-equality-where-do-_b_12428910.html(accessed 18 August 2018). Ocean, D. 2018. What is the Difference between a Server and a Router? From: https://www.quora.com/What-is-the-difference-between-a-server-and-a-router (accessed 19 June 2018). Ochoa, C. 2017. Random Sampling: Cluster Sampling. From: https://www.netquest. com/blog/en/cluster-sampling (accessed 13 November 2018). Ogrinja, G. 2013.What are the Processes of a SCM? From:https://www.seniorerp. ro/en/resurse_utile/what-are-the-processes-of-a-scm/ (accessed 28 October 2018). Oracle. 2018. Supply Chain Management: What is a Supply Chain Management System? From: https://www.oracle.com/za/applications/supply-chain-management/ what-is-supply-chain-management-system.html (accessed 28 October 2018). Palinkas, L.A., Horwitz, S.M., Green, C.A.., Wisdom, J.P., Duan, N. & Hoagwood, K. 2016. Purposeful Sampling for Qualitative Data Collection and Analysis in Mixed Method Implementation Research. From: https://www.ncbi.nlm.nih.gov/pmc/articles/ PMC4012002/ (accessed 13 November 2018). Pallant, J.2013. SPSS Survival Manual. United Kingdom: McGraw-Hill Education. Parise, F., Lygeros, J. & Ruess, J. 2018. Bayesian Inference for Stochastic Individual-Based Models of Ecological Systems: A pest control simulation study. Frontiersin. From: https://www.frontiersin.org/articles/10.3389/fenvs.2015.00042/full (accessed 12 June 2019).
210
Park, S.Y. & Yun, G.W. 2017. The Impact of Internet-Based Communication Systems on Supply Chain Management: An application of transaction cost analysis. From: https://academic.oup.com/jcmc/article/10/1/JCMC1013/4614507 (accessed 12 May 2018). Pashaei, S. & Olhager, J. 2015. Product Architecture and Supply Chain Design: A systematic review and research agenda, Supply Chain Management: An International Journal, 20(1):98 – 112. Paulo, S. 2014.Complexity and Information Technologies: An ethical inquiry into human autonomous action. From: http://www.scielo.br/scielo.php?script=sciarttext& pid=S1678-31662014000500009 (accessed 4 August 2018). Penaluna, K., Penaluna, A., Usei, C. & Griffiths, D. 2015. Enterprise Education Needs Enterprising Educators: A case study on teacher training provision. Journal of Education & Training 57(8/9):948-963. Pereira, G.M., Sellitto, M.A. & Borchardt, M. 2018. Flexibility and Orientation for Two Supply Chains Fashion Industry Markets: Analysis and model for future research. From: http://www.scielo.br/scielo.php?pid=S0104530X2018000200319&script=sci_ arttext&tlng=en (accessed 4 August 2018). Picks, B. 2018. The Best VPN Services and Apps of 2018. From:https://www.toms guide.com/us/best-vpn,review-4292.html (accessed 20 May 2018). Pilon, A. 2017. 20 Successful Entrepreneurs with No Experience. From: https://small biztrends.com/2016/03/successful-entrepreneurs-with-no-experience.html (accessed 17 August 2018). Pinho, J.C. & Sampaio de Sá, E. 2014. Personal Characteristics, Business Relationships and Entrepreneurial Performance: Some empirical evidence. Journal of Small Business and Enterprise Development. (21)2:284-300. From: https://doi.org/10. 1108/JSBED-10-2013-0150. (accessed 08 July 2020). Poba-Nzaou, P., Raymond, L. & Fabi, B. 2014. Risk of Adopting Mission-Critical OSS Applications: An interpretive case study. International Journal of Operations & Production Management 34(4):477-512. Poirier, G. 2018. Advantages of Fax Transmissions. From: http://smallbusiness.chron. com/advantages-fax-transmissions-29710.html (accessed 4 June 2018). Porteous, E. 2014. 5 How to Improve the Perception of Procurement. From: http://www.smartprocurement.co.za/archives/5_hows_to_improve_the_perception_of_procurement.php#sthash.JWzXViXY.dpbs (accessed 4 June 2018). Portugal, L. 2016. Information Management: Information systems and technologies management, master. From: https://www.mastersportal.com/studies/43376/infor mation-management-information-systems-and-technologies-management.html (accessed 24 May 2018).
211
Post, J. 2017. What Traits Do the Most Successful Entrepreneurs Have in Common? From: https://www.businessnewsdaily.com/8128-traits-of-successful-entrepreneurs. html (accessed 9 May 2018). Power, D. 2008a. What are Challenges of Real-Time Decision Support? From: http://dssresources.com/faq/index.php?action=artikel&id=178 (accessed 10 May 2018). Power, D. 2008b. Executive Information Systems Revisited. From: http://www.b-eye-network.com/view/10498 (accessed 10 May 2018). Pradhan, S.K. 2013. IT Architecture Design Framework: ADMIT. From: https:// www.infoq.com/articles/admit-architecture-framework (accessed 19 December 2018). Prasanna, R., Yang, L., King, M. & Huggins, T.J. 2017. Information Systems Architecture for Fire Emergency Response. Journal of Enterprise Information Management 30(4). Priyankara, D. 2015. Types of Database End Users. From: http://dinesql.blogspot.com/ 2015/10/types-of-database-ECs.html (accessed 3 June 2018). Quintia, L. 2015. Legal and Ethical Issues in Information Technology. From: https://prezi.com/7g6gxh7aea1i/legal-and-ethical-issues-in-information-technology/ (accessed 19 February 2019). Ramsey, E. & McCole, P. 2013. E-business in Professional SMEs: The case of New Zealand. Journal of Small Business and Enterprise Development. Rana, G., Goel, A.K. & Rastogi, R. 2013. Talent Management: A paradigm shift in Indian public sector. Journal of Strategic HR Review 12(4):197-202. Rees, W.D. & Porter, C. 2015. Delegation: A crucial but sadly neglected management skill. Journal of industrial and commercial training 47(6):320–325. Regalado, A. 2018. The Biggest Technology Failures of 2017. From: https://www.tech nologyreview.com/s/609626/the-biggest-technology-failures-of-2017/ (accessed 4 August 2018). Repplinger, J. 2015. Primary, Secondary, & Tertiary Sources. From: https://libguides. willamette.edu/primary-sources (accessed June 2018). Reynolds, A. 2018. The Uses of Mainframe Computers. From: https://www.techwalla. com/articles/why-does-my-hard-drive-run-all-the-time (accessed 20 May 2018). Richards, L. 2018.What Types of Information Resources Does a Business Usually Need? From: http://smallbusiness.chron.com/types-information-resources-business-usually-need-4753.html (accessed 5 June 2018).
212
Riezebos, R. 2017. 09 Living Brands: The characteristics of living brand companies. Branding Inside Out: Internal Branding in Theory and Practice, p.133. Robbins, S.P. & Coulter, M. 2014. Management Global, 12th edition. Kendallville: Pearson Publishers. Robbins, S.P. & DeCenzo, D.A. 2014. Fundamentals of Management: Essential concepts and applications, 6th edition. New Jersey: Pearson Publishers. Robinson, A. 2015. [INFOGRAPHIC] The Evolution and History of Supply Chain Management. From: https://cerasis.com/2015/01/23/history-of-supply-chain-manage ment/ (accessed 6 November 2018). Roger, E.K. 2015. Random Sample. From: https//doi.org/10.1002/9781405165518. wbeosr018.pub2 (accessed 11 June 2019). Rohit. 2017. 10 Best Android Emulators for Windows 10 PC & Laptop in 2018 | Windows 7/8.1 [Download Links]. From: http://www.technorange.com/2017/06/10-best-android-emulators-for-windows-10-pc-laptop-in-2017-windows-7-8-1-download-links/ (accessed 20 May 2018). Rojon, C. & Saunders, M.N.K. 2012. Formulating a Convincing Rationale for a Research Study, Coaching: An International Journal of Theory, Research and Practice, 5 (1). pp. 55-61. Roland, K., Yeo, J., Gold, M. & Marquardt, J. 2015. Becoming Leaderful: Leading forward in turbulent times. Journal of Industrial and Commercial Training 47(6): 285-292. Ronny, 2017. Biggest Technological Failures of 2017. From: http://techconnectmaga zine.com/biggest-technological-failures-2017/ (accessed 4 August 2018). Root III, G.N. 2018. The Advantages of a Business Using Email. From: http://small business.chron.com/advantages-business-using-email-4010.html (accessed 10 May 2018). Ross, S. 2018a. How does Enterprise Resource Planning (ERP) Assist in Human Resources Planning? From: https://www.investopedia.com/ask/answers/021115/how-does-enterprise-resource-planning-erp-assist-human-resources-planning.asp (accessed 16 May 2018). Ross, S. 2018b. What are the Advantages and Disadvantages of Using Systematic Sampling? From:https://www.investopedia.com/ask/answers/042415/what-are-advan tages-and-disadvantages-using-systematic-sampling.asp (accessed 14 November 2018). Rouse, M. 2018a. Hardware. From: https://searchnetworking.techtarget.com/defini tion/hardware (accessed 19 June 2018).
213
Rouse, M. 2018b. Decision Support System (DSS). From: https://searchcio.tech target.com/definition/decision-support-system (accessed 19 June 2018) Rouse, M. 2018c. Local Area Network (LAN). From: https://searchnetworking.tech target.com/definition/local-area-network-LAN (accessed 19 June 2018). Rubin, A. & Babbie, E. 2013. Brooks/Cole Empowerment Series: Research methods for social work, 8th edition. Texas: Cengage Learning. Rundell. S.D., Kumar, A. & Thorpe, D. 2017. Current Pilot Studies: Developing a prognostic model for risk adjustment in patients with back pain. From: http://www.bu. edu/cohstar/research/current-pilot-studies/ (accessed 19 November 2018). Rupeika-Apoga, R. & Danovi, A. 2015. Availability of Alternative Financial Resources for SMEs as a Critical Part of the Entrepreneurial Eco-System: Latvia and Italy. From: Https://Www.Sciencedirect.Com/Science/Article/Pii/S2212567115017050 (accessed 19 June 2018). Rycroft, R.W. & Kash, D.E. 1999. Innovation Policy for Complex Technologies. From: http://issues.org/16-1/rycroft/(accessed 4 August 2018). Saha, V. 2018. The Ultimate Guide to Supply Chain Management. From: https://www. camcode.com/asset-tags/supply-chain-management-guide/ (accessed 28 October 2018). Said, R., Omar, N. & Abdullah, W.N. 2013. Empirical Investigations on Boards, Business Characteristics, Human Capital and Environmental Reporting. Journal of Social Responsibility 9(4):534-553. Saito, G., Sakurazawa, H. & Nakamura, T. 2017. Development of New Enterprise Applications to Achieve Financial Innovation. From:http://www.hitachi.com/rev/archive /2017/r2017_01/112/index.html?WT.mc_id=ksearch_104 (accessed 12 November 2018). Salkind, N.J. 2010. Pilot Study: Encyclopedia of Research Design. From: http:// methods.sagepub.com/reference/encyc-of-research-design/n312.xml (accessed 14 November 2018). Sambartolo, M. 2015. Keys to Optimising Workforce Resources across the Enterprise. Journal of Strategic HR Review Vol. 14. Samuel, B.G. & Neil, J.S. 2016.Using SPSS for Windows and Macintosh, 8th edition. Books a la Carte. Sanders, M., Zeng, G., Hellicar, M. & Fagg, K. 2016. The Power of Flexibility: A key enabler to boost gender parity and employee engagement. From: https://www. bain.com/insights/the-power-of-flexibility/ (accessed 4 August 2018).
214
Sanghani, R. 2014. How Did a Work Experience Girl Make a Major Cystic Fibrosis Breakthrough? From: https://www.telegraph.co.uk/women/womens-health/10937687/ Work-experience-How-did-a-work-experience-girl-make-a-major-cystic-fibrosis-break through.html (accessed 21 August 2018). Sarri, K.K., Bakouros, I.L. & Petridou, E. 2010. Entrepreneur Training for Creativity and Innovation. Journal of European Industrial Training (34)3:270-288. From: https:// doi.org/10.1108/03090591011031755 (accessed 08 July 2020). Saunders, M, Lewis, P. & Thornhil, A. 2012. Research Methods for Business Students, 6thedition. Italy: Library of Congress Cataloguing-in-Publication Data. Saunders, M., Lewis, P. & Thornhill, A. 2012. Research Methods for Business Students. Harlow, England: Pearson. Sawers, P. 2012. Hardwired Humans: Why our aversion to technological advances is about to change. From: https://thenextweb.com/socialmedia/2012/07/08/hardwired-humans-why-our-aversion-to-technological-advances-is-about-to-change/ (accessed 24 February 2019). Schiller, B.R. 2008b. The Economy Today, 11th edition. New York: McGraw-Hill Irwin. Schnädelbach, H. 2010. Adaptive Architecture - A Conceptual Framework. From: https://www.quora.com/What-is-a-conceptual-framework-in-the-field-of-architecture (accessed 6 November 2018). Schofield, J. 2018. Do I Still Need PC Tuning Software for Windows 10? From: https://www.theguardian.com/technology/askjack/2018/jan/11/pc-tuning-software-windows-10-clean-up (accessed: 20 May 2018). Schwab, K. 2016. The Fourth Industrial Revolution: What it means, how to respond. World Economic Forum. From: https://www.weforum.org/agenda/2016/01/the-fourth-industrial-revolution-what-it-means-and-how-to-respond/ (accessed 08 April 2019). Sedgwick, P. 2013. Proportional Quota Sampling. From: https://www.bmj.com/content /345/bmj.e6336 (accessed 13 November 2018). Segal, 2018. Information Technology (IT). From: https://www.investopedia.com/ask/ answers/040315/what-difference-between-mis-management-information-system-and -information-technology.asp (accessed, 24 May 2018). Sekaran, U. & Bougie, R. 2009. Research Methods for Business. John Wiley & Sons Ltd: Great Britain. Source: Boundless. "Characteristics of business-customer interactions." boundless marketing boundless”. From: https://www.boundless.com/ marketing/textbooks/boundless-marketing-textbook/business-to-business-marketing-5/business-customers-45/characteristics-of-business-customer-interactions-223-662 2/ (accessed 8 September 2019).
215
Seth, S. 2017a. 10 Characteristics of Successful Entrepreneurs. From: https://www.inve stopedia.com/articles/personal-finance/101014/10-characteristics-successful-entre preneurs.asp (accessed 9 May 2018). Seth, S. 2017b. Why Entrepreneurs? Are Important for the Economy? From: https://www.investopedia.com/articles/personal-finance/101414/why-entrepreneurs-are-important-economy.asp (accessed 20 August 2018). Sewdass, N. 2012. Proposing a Competitive Intelligence (CI) Framework for Public Service Departments to Enhance Service Delivery. South African Journal of Information Management 14(1) pp.1-13. Shamsuzzoha, A.H.M. & Helo, P.T. 2012: Development of Modular Product Architecture through Information Management, VINE. 42(2):172–190. Sharma, P. 2018a. 6 Main Components of Decision Support System (DSS). From: http://www.yourarticlelibrary.com/management/decision-making-management/6-main -components-of-decision-support-system-dss/70302 (accessed 3/25/2018). Sharma, S. 2015b.Supply Chain Management. India: Oxford University Press. Shefer, D. 2018. Desktop vs. Enterprise Applications: The Impact on Product Management. From:https://www.pragmaticmarketing.com/resources/articles/desktop -vs-enterprise-applications-the-impact-on-product-management (accessed 12 November 2018). Shelat, M. 2016. Node.js for Enterprise Applications! Are You Kidding? From: https://dzone.com/articles/nodejs-for-enterprise-applications-are-you-kidding (accessed 12 November 2018). Shelly, G.B. & Vermaat, M.E. 2011. Discovering Computers Complete: Living in a digital world, course technology Cengage Learning. United States of America, Boston. Sherman, F. 2018.Why is It Important to Combine Functions in Business? From: http://smallbusiness.chron.com/important-combine-functions-business-39866.html, (accessed: 12 May 2018). Shilman, D. 2017. Solution Architecture vs. Software Architecture. From: https://dzone .com/articles/solution-architecture-vs-software-architecture (accessed: 12 November 2018). Shuttleworth, M. 2010. Pilot Study. From: https://explorable.com/pilot-study (accessed 14 November 2018). Shuttleworth, M. 2015. Internal Consistency Reliability. From: https:// explorable.com/ internal-consistency-reliability (accessed 01 September 2019).
216
Simchi-Levi, D., Kaminsky, P. & Simchi-Levi, E. 2009. Designing and Managing the Supply Chain: Concepts, strategies and case studies, 3rdedition. New York: McGraw Hill International. Singh, J. 2018. Factors of Production: Land, labour, capital and entrepreneur/national income. From: http://www.economicsdiscussion.net/production/factors-of-production-land-labour-capital-and-entrepreneur-national-income/541 (accessed: 28 April 2018). Sinha, S., Zande, J.V. & Smith, G. 2015. Exceed Revenue Goals and Deliver Personalised Buyer Engagements. From: https://www.sap.com/africa/products/crm-commerce/sales.html (accessed 5 November 2018). Sjögrén, H., Flainen, K. & Syrjä, P. 2011. What Does the Owner‐Manager Want and Get Out of the Business? International Journal of Law and Management 53(5)355-374. Small Enterprise Development Agency. 2018a. SMME Quarterly Update: 1st Quarter 2018. From: http://www.seda.org.za/Publications/Publications/SMME%20Quarterly% 202018-Q1.pdf (accessed 19 November 2018). Small Enterprise Development Agency. 2019b. SEDA-eServices Portal. From: http:// www.seda.org.za/ (accessed 23 February 2019). Small Enterprise Development Agency 2019. SMME Quarterly Update: 1st Quarter. From: www.seda.org.za (accessed 09 July 2020). Smallwood. 2014. Defining the Differences between Information Governance, IT Governance, & Data Governance. From: http://community.aiim.org/blogs/robert-smallwood/2014/08/18/defining-the-differences-between-information-governance-it-governance--data-governance (accessed 04June 2018). Smit. W. 2017. SMMEs Contribute 36% to Economy. From: https://www.iol.co.za/ business-report/opinion/smmes-contribute-36-to-economy-8269623(accessed 29 July 2019). Smith, C. 2013.What is a Knowledge Management System?From: http://www.dzone software.com/blog/what-is-knowledge-management (accessed 28 May 2015). Smith, T. & Barrett, R. 2016. Online Learning: An effective means for developing small business owner-managers’ capabilities? Journal of Small Business and Enterprise Development 23(1):207-223. Somerville, M. 2018. Lack of Managerial Skill Causes Problems for Staff. From: https://smallbusiness.co.uk/lack-of-managerial-skill-causes-problems-for-staff-331801/ (accessed 27 January 2019). Spacey, J. 2015. 10 Types of Business Constraint: Simplicable. From: https://simpli cable.com/new/business-constraints (accessed 10 June 2019).
217
Stephani. 2014. Statistics How to Statistics for the Rest of Us: Modal Instance Sampling. From: https://www.statisticshowto.datasciencecentral.com/modal-instance-sampling/ (accessed 20 November 2019). Sternad, S. & Bobek, S. 2013. Impact of TAM-Based External Factors on ERP Acceptance: Conference on enterprise information systems/ProjMAN 2013. International Conference on health and social care information systems and technologies. Report. Maribor: Slovenia: (RP34-42/2013). Stet, M. 2014. Benefits and Drawbacks of Technology in Supply Chain Management. From: https://ideas.repec.org/a/cmj/seapas/y2014i5p617-622.html (accessed 25 February 2019). Strom, E. 2017. What is the Most Used Mobile Biometric? From: https://www.asmag. com/showpost/27304.aspx (accessed 18 January 2018). Suhadak, R.O. & Mawardi, K.M. 2017. Analysis of the Influence of External and Internal Environmental Factors on Business Performance: A study on micro small and medium enterprises (MSMEs) of food and beverage. From: https://www.researchgate. net/publication/318214243_analysis_of_the_influence_of_external_and_internal_environmental_factors_on_business_performance_a_study_on_micro_small_and_ medium_enterprises_msmes_of_food_and_beverage (accessed 27 January 2019). Sun, H. 2011. The 3‐3‐3 Framework and 7P Model for Teaching Creativity, Innovation and Entrepreneurship. Journal of Chinese Entrepreneurship. (3)2:159-166. From: https:// doi.org/10.1108/17561391111144582 (accessed 08 July 2020). Sun, H. 2011. The 3‐3‐3 Framework and 7P Model for Teaching Creativity, Innovation and Entrepreneurship. Journal of Chinese Entrepreneurship 3(2):159-166. Surbhi, S. 2016. Difference between T-test and ANOVA. From: https://keydifferences. com/difference-between-t-test-and-anova.html (accessed 19 June 2018). Susman, S. 2017. Why SMEs Have the Potential to Transform the Economy? From: https://www.fin24.com/Companies/Retail/why-smes-have-the-potential-to-transform-the-economy-20171030 (accessed 29 July 2019). Svärd, P. 2013. Enterprise Content Management and the Records Continuum Model as Strategies for Long-Term Preservation of Digital Information. Records Management Journal 23(3):159-176. Sweeney, M. 2011. Relative Advantage of Technology Use in the Classroom. From: https://melodeesweeney.wordpress.com/2011/04/16/relative-advantage-of-techno logy-use-in-the-classroom/ (accessed 18 February 2019). Székely, T. & Burrage, K. 2014. Stochastic Simulation in Systems Biology. From: https://www.ncbi.nlm.nih.gov/pmc/articles/PMC4262058/ (accessed 24 Feb 2019).
218
Szigligetius, G. 2019. Nonlinear Dynamics and Stochasticity: A piece on meromorphic anstochasticity. From: https://www.academia.edu/Documents/in/Nonlinear_Dynamics _and_Stochasticity (Accessed 24 February 2019). Tagged, H.B. 2019. What is Relative Advantage? Concept, Advantage and Application. Marketing G91. From: https://www.marketing91.com/relative-advantage/ (accessed 10 June 2019). Tamrin, S.I., Norman, A.A. & Hamid, S. 2017. Information Systems Security Practices in Social Software Applications: A systematic literature review, Aslib. Journal of Information Management 69(2):131-157. Tamrin, S.I., Norman, A.A. & Hamid, S. 2017. Information Systems Security Practices in Social Software Applications: A systematic literature review. Aslib Journal of Information Management 69(2): 131-157. Tani, G. & Gimatti, B. 2009. Technological Complexity: A support to management decisions for product engineering and manufacturing. From: https://www.researchgate .net/publication/224366847_Technological_complexity_A_support_to_management_decisions_for_product_engineering_and_manufacturing (accessed 4 August 2018). Tavakol, M. & Dennick, R. 2014. Data Science Central. Cronbach’s Alpha: Simple definition, use and interpretation. From: https://www.statisticshowto.datascience central.com/cronbachs-alpha-spss/ (accessed 31 July 2019). Taylor, M., Higgins, E. & Lisboa, P. 2012. Testing Geographical Information Systems: A case study in a fire prevention support system. Journal of Systems and Information Technology 14(3):184-199. Technopedi. 2018. Biometrics. From: https://www.techopedia.com/definition/10239/ biometrics (accessed 2 December 2018). Thakur, D. 2018. Personal Computer - What is personal computer (PC)? From: http://ecomputernotes.com/fundamental/introduction-to-computer/personal-computer (accessed 20 May 2018). Thulo, L. 2019. This African Online Marketplace Delivers Uniquely African Products to the World. From: http://sme.adclickmobile.com (accessed 09 July 2020). Thomas, J. 2011. Search for Solutions: Manage engine. From: https://www.manage engine.com/products/service-desk/help/userguide/solutions/self-service-search-solution.html (accessed 10 June 2019). Thompson, K. 2015a. Positivism and Interpretivism in Social Research. From: https:// revisesociology.com/2015/05/18/positivism-interpretivism-sociology/ (accessed 28 January 2018).
219
Thompson, V. 2018b. Should Entrepreneurs Have a Risk-Taking Spirit? From: https://yourbusiness.azcentral.com/should-entrepreneurs-risktaking-spirit-9352.html/ (accessed 21/03/2018). Thorne, S. 2016. Interpretive Description: Qualitative research for applied Practice, 2nd edition. From: https://doi.org/10.4324/9781315545196. New York: Imprint Routledge (accessed 15 June 2019). Thurik, R. 2018. Entrepreneurship and the Business Cycle. From: https://wol.iza. org/articles/entrepreneurship-and-the-business-cycle/long (accessed 20 Aug 2018). Ticlo, I. 2018. 4 Ways to Achieve Operational Efficiency across Your Supply Chain. From: https://www.insight.com/en_US/learn/content/2018/02072018-4-ways-to-achieve-operational-efficiency-across-your-supply-chain.html (accessed 12 May 2018). Tolstoshev, N. 2017. Guide for Writing Functional Competencies. From: https://com munity.spiceworks.com/how_to/40913-assess-EC-competency-level/ (accessed 3/10/2017). Tong, K. 2019. EHR Compatibility and Connectivity: Two obstacles to patient care. Ehrintelligence. From:https://ehrintelligence.com/news/ehr-compatibility-and-connec tivity-two-obstacles-to-patient-care (accessed 02 April 2019). Toor, T. 2016. Designing Future Enterprises: Aligning enterprise design with business strategy. Journal of Strategic Direction 32(10): 33-34. Tourish, D. 2020. Leadership for the Greater Good: Reflections on Today’s Challenges From Around the Globe: The Coronavirus Crisis and Leadership in Business. From: https://theila.org/the-coronavirus-crisis-and-leadership-in-business/?gclid=CjwKCAiAxp-ABhALEiwAXm6IyYIIDTRDNpee91KZKktQmyDij9__sFZO1dldlWC50alrRNkPgS657xoCyDAQAvD_BwE (accessed 20 January 2021 Travis, D. 2017. The 8 Competencies of User Experience: A tool for assessing and developing UX Practitioners. From: https://www.userfocus.co.uk/articles/8-competen cies-of-user-experience.html (accessed 4th June 2018). Trigo, A. & Belfo, F. 2013.Accounting Information Systems: Tradition and future directions. From: https://www.researchgate.net/publication/259638678_Accounting_ Information_Systems_Tradition_and_Future_Directions/figures?lo=1 (accessed 12 November 2018). Trinh-Phuong, T., Molla, A. & Peszynski, K.J. 2012. Enterprise Systems and Organisational Agility: A review of the literature and conceptual framework, semantic scholar, enterprise systems and organisational agility: From:http://www.pacis-net.org/file/2012/PACIS2012-166.pdf (accessed 21 July 2019). Truong, H.L. & Dustdar, S. 2012. A Survey on Cloud‐Based Sustainability Governance Systems. International Journal of Web Information Systems 8(3):278-295.
220
Tumenta, D. 2016. Top 20 Powerful Traits of Most Successful Entrepreneurs. From: https://www.backlinkfy.com/news/top-20-powerful-traits-of-most-successful-entrepreneurs (accessed: 9 May 2018). Usoro, A., Shoyelu, S. & Kuofie, M. 2010. Task-Technology Fit and Technology Acceptance Models Applicability to e-tourism. Journal of Economic Development Management IT Finance and Marketing, pp. 1-32 Vaesen, K. & Houkes, W. 2017. Biology and Philosophy: Complexity and technological evolution. From: https://www.ncbi.nlm.nih.gov/pmc/articles/PMC5842246/ (accessed 16 June 2019). Vaiman, V., Scullion, H. & Collings, D. 2012. Talent Management Decision Making. Journal of Management Decision 50(5):925-941. Van Aardt, I., Barros, M., Clarence, W., Van Rensburg, L.J., Radipere, S., Rankhumise, E.M., Venter, E. & Visser, D.J. 2016. Principles of Entrepreneurship and Small Business Management. Southern Africa: Oxford University Press. Van der Meulen, R. 2018. From: https://www.gartner.com/smarterwithgartner/build-a-modern-supply-chain-workforce/ (accessed 28 October 2018). Van Druten, J. 2019. Data, Sampling, and Variation in Data and Sampling. Open stax. From: https://cnx.org/contents/2W5NXrTD@1/Data-Sampling-and-Variation-in-Data-and-Sampling (accessed 03 August 2019). Vasilaki, E. & Allwood, D.A. 2018. Details of Grant. From: https://gow.epsrc.ukri.org/ NGBOViewGrant.aspx?GrantRef=EP/S009647/1 (accessed 24 February 2019). Vatsa. A.K. 2010. Basics of Data Communication Part 1. From: https://www.c-sharpcorner.com/uploadfile/abhikumarvatsa/basics-of-data-communication-part-1/ (accessed 5 August 2018). Vejlgaard, H. 2018. Culture as a Determinant in Innovation Diffusion. Intechopen. From: https://www.intechopen.com/books/the-future-of-television-convergence-of-content-and-technology/culture-as-a-determinant-in-innovation-diffusion (accessed 12 April 2019). Verial, D. 2018. Advantages and Disadvantages of Multi-Stage Sampling. From: https://classroom.synonym.com/advantages-disadvantages-multistage-sampling-8544049.html (accessed 14 November 2018). Vetráková, M., Smerek, L. & Seková, M. 2017. The Importance of Human Resources Management in Business Practice in Slovakia. From: http://ibima.org/accepted-paper/importance-human-resources-management-business-practice-slovakia/ (accessed 20 May 2018). Viets, A. 2014. 7 New Competencies for a Competent HR Department. From: http://playbook.amanet.org/international-hr-for-everyone/ (accessed 20 May 2018).

221
Vikas, M., Khan, M.I. & Sultanpur, K.N.I.T. 2010. SCM Systems: Architecture, design and vision. Journal of Strategic Innovation and Sustainability 6 4:102-108. Vodafone. 2019. Working with Vodafone. From: https://www.vodafone.com/content/ index/about/suppliers.html# (accessed 20 February 2019). Vogt, V. 2015. How Technology is Going to Impact on Deep Level Mining in SA. From: https://www.moneyweb.co.za/news-fast-news/how-technology-is-going-to-impact-on-deep-level-mining-in-sa/(accessed 4 August 2018). Vogt, W.P., Gardner, D.C. & Haeffele, L.M. 2012. When to Use What Research Design. New York: The Guilford Press. Vogt, P. 2017. Business Logistics Management. Cape Town: Oxford University Press. Vuba, S. 2019. The Missed Opportunity: SMMEs in the South/ African economy. From: https://mg.co.za/article/2019-04-12-00-the-missed-opportunity-smmes-in-the-south-african-economy (accessed 29 July 2019). Wade, H. 2018. Disadvantages to Biometric Identification Systems. From: https://www.techwalla.com/articles/disadvantages-to-biometric-identification-systems (accessed 5 August 2018). Walcerz, M. 2018. Legal and Ethical Issues in Technology. From: https://legalbeagle. com/7640133-legal-ethical-issues-technology.html (accessed 19 February 2019). Walport, M. & Rothwell, D.N. 2013. Council for Science and Technology. From: https://assets.publishing.service.gov.uk/government/uploads/system/uploads/attachment_data/file/224953/13-923-age-of-algorithms-letter-to-prime-minister__1_.pdf (accessed 16 June 2019). Weber, P., Geneste, L.A. & Connell, J. 2015. Small Business Growth: Strategic goals and owner preparedness. Journal of Business Strategy (36)3:30-36. From: https://doi. org/10.1108/JBS-03-2014-0036 (accessed 07 July 2020). Sangam, V. 2010. Supply Chain World: Supply chain optimization. From: https://vijay sangamworld.wordpress.com/2010/10/21/supply-chain-insourcing-vs-outsourcing/ (accessed 16 June 2019). Walsh, D. & House, C. 2019. Rescue Your Java Script with Javascript Error Tracking. From: https://trackjs.com/ (accessed 25 February 2019). Trinh-Phuong, T., Molla, A. & Peszynski, K.J. 2012. Enterprise Systems and Organizational Agility: A Review of the Literature and Conceptual Framework. Semantic Scholar. (accessed 21 July 2019). Trinh-Phuong, K.S. 2018. Journal of Entrepreneurship & Organisation Management. From: https://www.omicsonline.org/open-access/the-impact-of-customer-relationship-
222
management-on-Organisation-profit-of-in-somali-2169-026X-1000221-101362.html (accessed 5 November 2018). Watson, H.J. & RainerJr, R.K. 1991. A Manager's Guide to Executive Support Systems. From: https://www.sciencedirect.com/science/article/pii/000768139190065 4(accessed 24 May 2018). Wayner, P. 2019. The Top 5 Software Architecture Patterns: How to make the right choice. From: https://techbeacon.com/app-dev-testing/top-5-software-architecture-patterns-how-make-right-choice (accessed 06 February 2019). Weber, P., Geneste, L.A. & Connell, J. 2015. Small Business Growth: Strategic goals and owner preparedness. Journal of Business Strategy 36(3):pp.30-36. Webster, M. 2019. Examples of Stochastic in a Sentence. From: https://www.merriam-webster.com/dictionary/stochastic (accessed 12 June 2019). Wegner, T. 2015. Applied Business Statistics: Methods and excel-based applications, 4th edition. Cape Town: Juta and Company. Wempen, F. 2018. 5 Types of Personal Computers. From:http://www.dummies.com/ computers/5-types-of-personal-computers/ (accessed 20 May 2018). Whittaker, R.H. (Ed.). 2012. Ordination of Plant Communities. 5(2). Springer Science & Business Media. Wiid, J. & Diggines, C. 2009. Marketing Research. Cape Town: Juta & Co. Ltd. Wiredu, G.O. 2012. Information Systems Innovation in Public Organisations: An institutional perspective. Journal of Information Technology & People 25 (2): 188-206. Wisner, J.D., Tan, K.C. & Leong, G.K. 2012. Supply Chain Management: A Balanced Approach. Canada: South-Western Cengage Learning. Wisniewski, M. 2009, Quantitative Methods for Decision Makers, 5th Edition. United Kingdom: Library of Congress Cataloguing-in-Publication Data, London. Wittrock, C. & Heiden, M.K. 2020. Asset Management—What is it? Definition and development. From: https://www.bankinghub.eu/themen/asset-management (accessed 08 February 2021). Writing, A. 2017. Processes in Supply Chain Management. From: https://bizfluent. com/info-8197960-processes-supply-chain-management.html (accessed 28 October 2018). Yasuhiro, A., Takatoshi, T. & Kazuhiro, Y. 2012. Market Size and Entrepreneurship: The research institute of economy, trade and industry. From: http://www.rieti.go.jp/en/ (accessed 20 August 2018).
223
Zandbergen, J. 2018a. What is Computer Hardware? Components, definition & examples. From:https://study.com/academy/lesson/what-is-computer-hardware-com ponents-definition-examples.html (accessed 20 May 2018). Zandbergen, P. 2018b. Executive Information Systems (EIS): Upper management decision-making tools. From: https://study.com/academy/lesson/executive-informa tion-systems-eis-upper-management-decision-making-tools.html (accessed 24 May 2018). Zaugg, H. & Warr, M.C. 2018. Integrating a Creativity, Innovation and Design Studio within an Academic Library. Journal of Library Management 39(3/4):172-187. Zentis, N. 2020. 10 Reasons for Using the Action Research Model for Successful OD Interventions. From: www.instituded.com (accessed 02 July 2020). Zayra, V. 2016. Men with 2 Years of Work Experience Earn More Than Women with 6. From: http://fortune.com/2016/09/13/ivy-league-wage-gap/(accessed 21 August 2018). Zhang, R., Brennan, T.J. & Lo, A.W. 2014. The Origin of Risk Aversion. From: https://www.ncbi.nlm.nih.gov/pubmed/25453072 (accessed 24 February 2019). Zhou, J. & Ning, D. 2017. Microbiology and Molecular Biology Review: Stochastic community assembly: Does It Matter in Microbial Ecology? From:https://mmbr.asm. org/content/81/4/e00002-17 (accessed 24 February 2019). Zide, J.S., Mills, M.J., Shahani-Denning, C. & Sweetapple, C. 2017. Work Interruptions Resiliency toward an Improved Understanding of Employee Efficiency. Journal of Enterprisesal Effectiveness, People and Performance (4)1:39-58. Zide, J.S., Mills, M.J., Shahani-Denning, C. & Sweetapple, C. 2017. Work Interruptions Resiliency toward an Improved Understanding of Employee Efficiency. Journal of Enterprise Effectiveness, People and Performance (4)1:39-58. Zwass, V. 2018. Information Systems. From: https://www.britannica.com/topic/infor mation-system (accessed: 27 April 2018).

224
Annexure E: Proof of Registration
225
Annexure F: Editor’s Letter
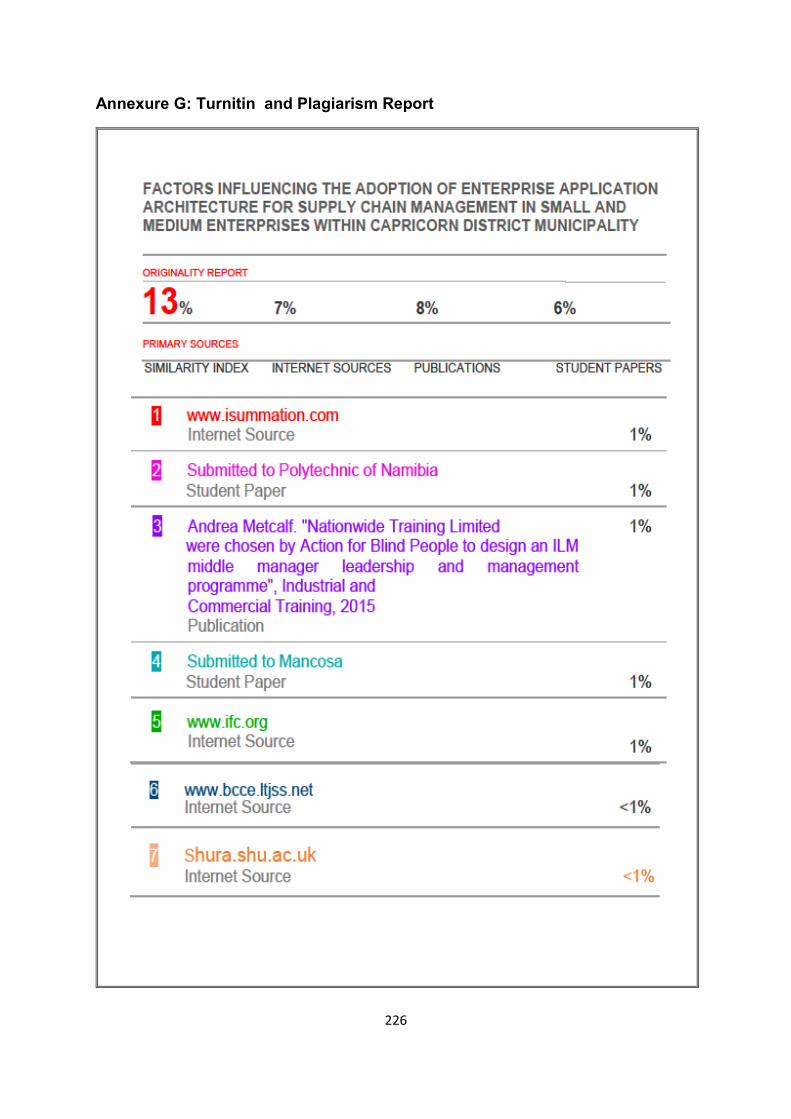
226
Annexure G: Turnitin and Plagiarism Report


