
1
Facts and Statistics
Gerry Rice
………… STATISTICS
(without the LIES or the DAMNLIES)
(attributed by Mark Twain to Benjamin Disraeli)

2
Totals Paid under REPS 1994-2006
1.5
330.8
284.6
208.9
183.9172.6164.8
205.6
183.2167.9
37.4
70.9
127.6
0
50
100
150
200
250
300
350
1994 1995 1996 1997 1998 1999 2000 2001 2002 2003 2004 2005 2006
€m
REPS Payments
• In 2006, €330m was paid out to farmers.
• The three biggest earners were Galway andMayo (€34m each) and Cork (€27m)
• The lowest payout was to Dublin (€0.5m)

3
• What has REPS got in common with SirRichard Branson ?
Did you know
REPS Payments
• Richard Branson’s personal fortune isestimated at €2.3 billion(Forbes 2005)
• That’s the same as has been paid out underREPS since 1994.

4
REPS 2 & 3 Participation Trendduring 2006
0
5,000
10,000
15,000
20,000
25,000
30,000
35,000
40,000
45,000
50,000
Jan Feb Mar Apr May Jun Jul Aug Sep Oct Nov Dec
No
ofP
arti
cipa
nts
REPS 2
REPS 3
Overall REPS Participation Trend1994-2006
0
10,000
20,000
30,000
40,000
50,000
60,000
1994 1996 1998 2000 2002 2004 2006
No
ofPa
rtic
ipan
ts

5
Overall REPS Participation Trend2005-2007
40,000
45,000
50,000
55,000
60,000
Apr-05 Jul-05 Oct-05 Jan-06 Apr-06 Jul-06 Oct-06 Jan-07 Apr-07 Jul-07
No
ofP
artic
ipan
ts
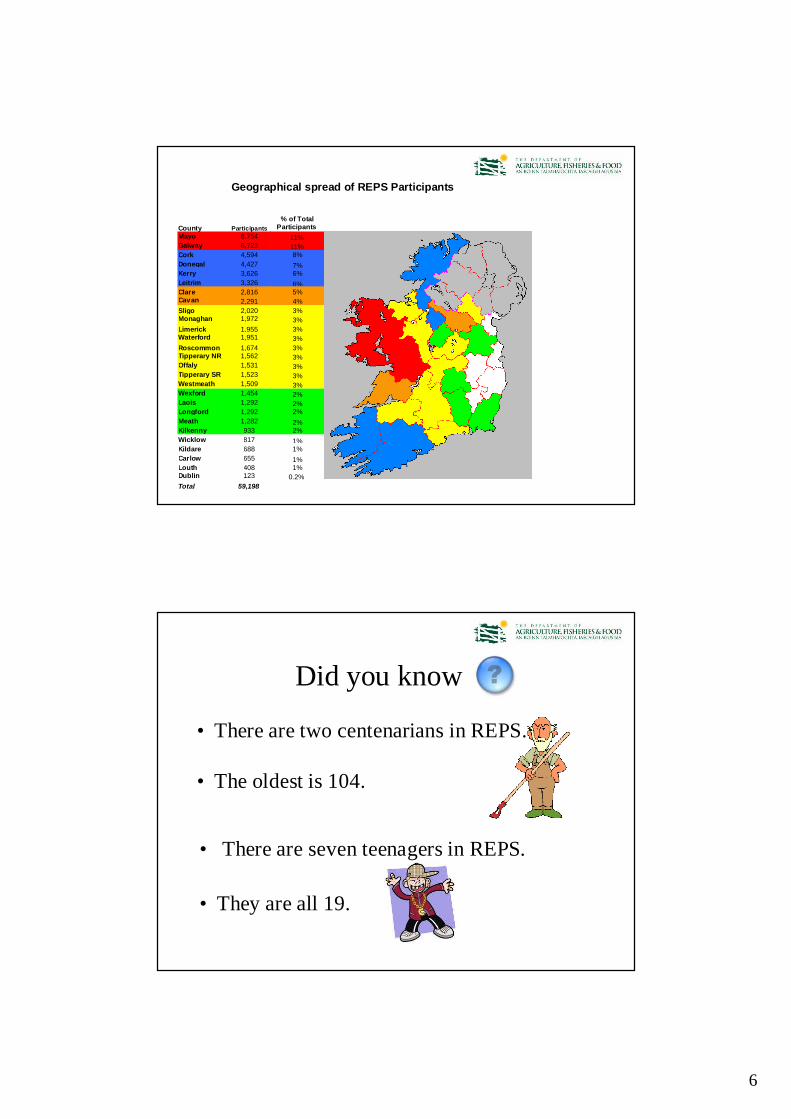
• Over a quarter of all REPS participants arein Mayo, Galway and Clare
• 61% of the participants are in coastalcounties along the West coast
Did you know
6
Geographical spread of REPS Participants
County Participants% of Total
ParticipantsMayo 6,754 11%Galway 6,723 11%Cork 4,594 8%Donegal 4,427 7%Kerry 3,626 6%Leitrim 3,326 6%Clare 2,816 5%Cavan 2,291 4%Sligo 2,020 3%Monaghan 1,972 3%Limerick 1,955 3%Waterford 1,951 3%Roscommon 1,674 3%Tipperary NR 1,562 3%Offaly 1,531 3%Tipperary SR 1,523 3%Westmeath 1,509 3%Wexford 1,454 2%Laois 1,292 2%Longford 1,292 2%Meath 1,282 2%Kilkenny 933 2%Wicklow 817 1%Kildare 688 1%Carlow 655 1%Louth 408 1%Dublin 123 0.2%Total 59,198
Figures based on active approved participants as of 1/3/07
• There are two centenarians in REPS.
• The oldest is 104.
Did you know
• There are seven teenagers in REPS.
• They are all 19.

7
Men V. Women
• There are proportionally more young men than young women• There are proportionally more older women than older men
Age ProfileFemale REPS Participants
Under 302%
Over 7018%
30 to 4011%
40 to 5023%
50 to 6028%
60 to 7018%
Age ProfileMale REPSParticipants
60 to 7016%
50 to 6027%
40 to 5029%
30 to 4017%
Over 708%
Under 303%
• There are 5,460 women in REPS
Did you know
• The oldest is 97 years old.
• The youngest is 20.(No, you cant have her phone no.)

8
REPS 3 Farm Size
133 48 14 5
2554
1010
8787
7423
9003
10366
9591
0
2,000
4,000
6,000
8,000
10,000
12,000
10 20 30 40 50 100 200 300 400 500 Over500
Farm Size (Ha)
No of Farms
Did you know• The current area under REPS is 2,079,103 hectares
• Which is roughly 30% of the land area of Ireland
• Or an area larger thanthe country of Slovenia
9
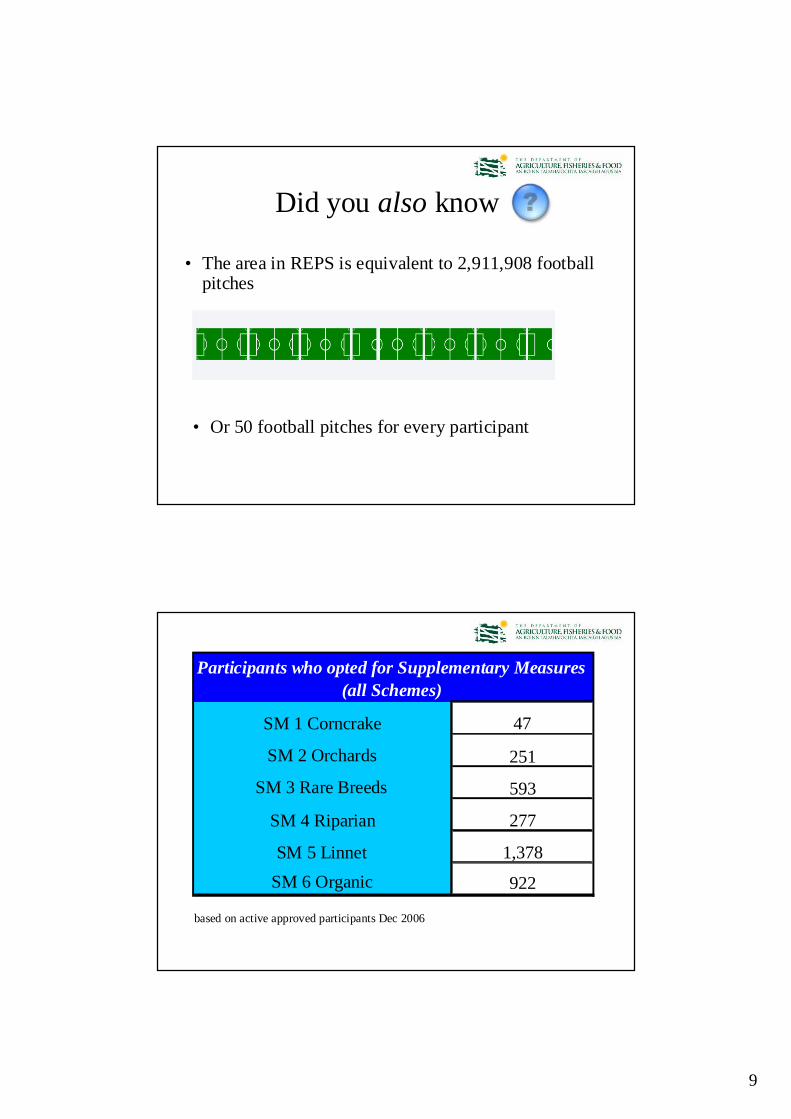
Did you also know
• The area in REPS is equivalent to 2,911,908 footballpitches
• Or 50 football pitches for every participant
SM 1 Corncrake 47
SM 2 Orchards 251
SM 3 Rare Breeds 593
SM 4 Riparian 277
SM 5 Linnet 1,378
SM 6 Organic 922
based on active approved participants Dec 2006
Participants who opted for Supplementary Measures(all Schemes)

10
Ratio of REPS 3 SupplementaryMeasures opted for *
Measure 1Corncrake
1.4%
Measure 2Orchards
8%
Measure 3 RareBreeds
17%
Measure 4Riparian
8%
Measure 5Linnet42%
Measure 6Organic
24%
*Total participants who opted for a Supplementary Measure : 3,269
2006 Area (ha) ExpenditureSM1 Corncrake 271.420 €8,403.00
SM2 Orchards 30.890 €14,112.00SM3 Rare Breeds n/a €164,797.60
SM4 Riparian 427.606 €188,799.18
SM5 Linnet 2,112.360 €412,619.10SM6 Organics 35,146.756 €2,517,892.59
* figures relate to area and payments made under the Supplementary Measure only.
Area & Expenditure for Supplementary Measures*(all Schemes)

11
Supplementary Measure 3Breakdown of Rare Breeds paid under REPS 3*
45%
36%
16%3% Kerry
Dexter
Irish Maol
Irish Draft
Connemara Pony
Galway Sheep
Kerry Bog Pony
*Total REPS 3 participants paid under SM3: 212
Gender BreakdownREPS Participants
MALE82%
JOINT8%
FEMALE10%
Gender BreakdownOrganic
REPS Participants
MALE74%
FEMALE13%
JOINT13%
REPS & Organic REPS Gender Comparison

12
Age ProfileREPS Participants
Over 7010%
60 to 7017%
20 to 303%
30 to 4016%
40 to 5027%
50 to 6027%
Below 200.01%
Age ProfileOrganic REPS Participants
Below200.1%
50 to 6030%
40 to 5035%
30 to 4016%
20 to 302%
60 to 7012%
Over 705%
REPS & Organic REPS Age Comparison
Did you know that…
€22,143 was the highest payment made inREPS in 2006

13
Did you also know that…
€602 was the lowest amount paid out in 2006
Area & Expenditure for Measure A (all Schemes)
2006 Total under REPS Measure A*% under
Measure A
Participants
Area (ha)
* Expenditure figure relates to paytsmade under Measure A only, ie basic REPS payment notincluded.
59,200 17,163 29%
2,143,570.20 376,302.31 18%
Expenditure €330,875,548.17 €63,577,097.37 19%

14
Ratio of Category 1 Biodiversity Options
30%
26%
31%
12%
1%
0.1%
0.2%
4A NEW HABITAT
5A HEDGEROWREJUVENATION
5B NEW HEDGEROWESTABLISHMENT
5C STONEWALLS
9A GREEN COVER CAT1
9B ENVIRONMENTALSETASIDE
9C ARABLE MARGINSCAT1
Ratio of Category 2 Biodiversity Options
0.1%0.2%
3%
1%7%
9%3%
13%11.6%
15.7%
36%
2A HAY MEADOWS
2B SPECIES RICHGRASSLAND
3A WATERCOURSEMARGIN3B NO BOVINE ACCESS
4B TREE PLANTING
4C NATURE CORRIDORS
7A ARCHAEOLOGICALBUFFER MARGINS
7B ARCHAEOLOGICALSITE ACCESS
8A LANDSCAPINGAROUND YARD
9A GREEN COVER CAT2
9C ARABLE MARGINSCAT2
15
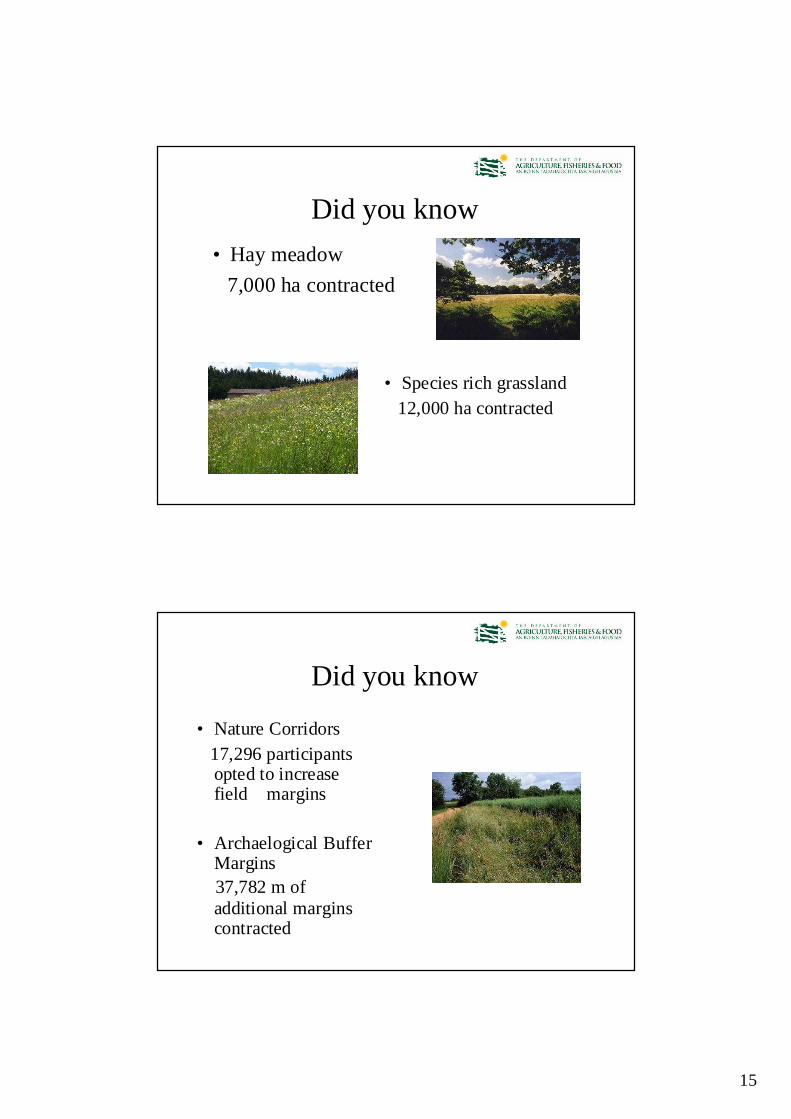
Did you know• Hay meadow
7,000 ha contracted
• Species rich grassland12,000 ha contracted
Did you know
• Nature Corridors17,296 participantsopted to increasefield margins
• Archaelogical BufferMargins37,782 m ofadditional marginscontracted

16
Did you know• Tree planting
221,666 broadleaf treescontracted for planting
• New habitats13,697 ha contractedfor creation
Did you know
• Hedgerow Rejuvenation2,700 km contracted forrejuvenation(a distance of roughly from here toMoscow)
• New hedgerow establishment4,000 km contracted forestablishment(a distance of roughly from here toCairo)

17
Did you know
• The total length of hedgerowmanaged under REPS would stretchabout 1/6th of the way around theEquator
Number of REPS 2 Plans Ending per Month
0
100
200
300
400
500
600
May 2007 Oct 2007 Mar 2008 Aug 2008 Jan 2009 Jun 2009

18
Number of REPS 3 Plans Ending per Month
0
1000
2000
3000
4000
5000
6000
Feb2009
Apr2009
Jun2009
Aug2009
Oct2009
Dec2009
Feb2010
Apr2010
Jun2010
Aug2010
Oct2010
Dec2010
Feb2011
Apr2011
Jun2011
Aug2011
Oct2011
Dec2011
Penalties
• In 2005, €3.6m was imposed in penalties underREPS.
• Of these, €2.4m (67%) were in respect of NonCompliance penalties
• €1.2m (33%) were in respect of Administrativepenalties (late submission of 1Cs, wrong areadeclared, etc.)
• Penalties imposed represent 1.2% of the total paidout under REPS in 2005.

19
Top 10 Penalties for Non-Compliance in 2006PENALTY DESCRIPTION Occurrences
UNDERTAKINGS IN RESPECT OF FARMYARD NOT CARRIED OUT AS PLANNED 353
FARM BOUNDARIES NOT STOCKPROOFED 124
BOVINES NOT EXCLUDED FROM WELLS AND WATERCOURSES MARKED BLUE ON MAP 107
HEDGEROWS/STONEWALLS NOT MAINTAINED AS SPECIFIED IN PLAN 100
NON COMPLIANCE WITH REQUIREMENTS OF CATEGORY 1 BIODIVERSITY OPTION 67
STOCK NOT WINTERED AS SET OUT IN PLAN 65
RECOMMENDED QUANTITY OF LIME NOT APPLIED 53
PLANNED WASTE STORAGE FACILITIES NOT PROVIDED 44
PLANNED ANIMAL HOUSING FACILITIES NOT PROVIDED 29
NON COMPLIANCE WITH REQUIREMENTS OF CATEGORY 2 BIODIVERSITY OPTION 21


