1 | P a g e
Farm Labor Housing in the Salinas and Pajaro Valleys Don Villarejo February 13, 2018; revised August 8, 2018
Contents Executive Summary .......................................................................................................... 2
Agricultural worker affordable housing in the Salinas-Pajaro Valleys....................... 4
Agricultural workers are densely congregated in relatively few neighborhoods
in the Salinas-Pajaro Valleys ...................................................................................... 10
The 2017 SPAWHS farmworker survey finds extremely crowded dwellings ........ 12
Discussion ......................................................................................................................... 16
Appendix I. Affordable Rental Projects in Monterey County, California
Department of Housing and Community Development, May 31, 2016. ............... 19
Appendix II. Estimate of Crowded Farmerker Housing Dwellings-Census/ACS.....23
Bibliography ..................................................................................................................... 24
2 | P a g e
Executive Summary
There are only two principal sources of current information about where
agricultural workers reside among communities of the Salinas and Pajaro
Valleys. Even more limited is detailed information about their housing conditions.
This report relies on two primary sources of information. The US Census Bureau
reported detailed 2016 information about residents of Monterey and Santa Cruz
Counties. The 2017 Salinas-Pajaro Agricultural Worker Housing Survey (SPAWHS),
reported findings from about 400 face-to-face interviews with a representative
sample of current agricultural workers who were employed in this region.
The only source of primary information about housing conditions at all levels of
geography – nation, state, county, city, unincorporated areas and within
neighborhoods – is the Census Bureau’s American Community Survey (ACS)
(United States Census Bureau, 2018). The ACS is an on-going survey, gathering
information year-round. The Census does not identify specific dwellings where
agricultural workers live, providing only summary data for neighborhoods where
such dwellings are located.
The 1-year (2016) ACS finds an annual average of 42,544 private-sector, wage
and salary agricultural workers in the two-county region. By contrast, summaries
of reports by employers to the California Department of Employment
Development indicate annual average, agricultural worker employment for the
two-county region was 61,169 during 2016, 44% higher than the Census report.
Detailed information about where agricultural workers live is available from the
Census. The ACS aggregates information over longer periods than just one year
to attain statistically reliable results. The 5-year (2012-16) ACS annual average
found 17,000 private-sector, wage and salary, agricultural workers lived in the
City of Salinas, and 4,319 in Watsonville. The earlier 5-year (2007-11) report found
12,036 such workers in Salinas and 4,343 in Watsonville.
The ACS finds the agricultural workforce in the Salinas-Pajaro Valleys has
increased substantially during the past five years, and the City of Salinas
absorbed most of the increase of residents. Along with this growth, there is
substantial evidence of significant crowding in neighborhoods where
agricultural workers are able to find places to live.
The two-county region has a well-publicized shortage of affordable housing that
affects agricultural workers: relatively few Census tracts account for most

3 | P a g e
dwellings that house agricultural workers. Of the region’s 145 census tracts, just
six tracts in Santa Cruz County house 67% of that county’s agricultural workers,
while thirty-one in Monterey County are home to 84% of its agricultural workers.
Crowding within dwellings is also reported by the ACS. A statistical analysis of the
113 tracts where agricultural workers reside finds positive, statistically significant
associations between the proportion of agricultural workers living in each tract
and measures of housing conditions: greater proportion of crowded dwellings,
increased proportion of extremely crowded dwellings, greater proportion of
renters vs. owners, both lower total and per-person rental expense per dwelling.
There were no statistically significant associations between the proportion of
agricultural workers living in a Census tract and two measures of housing
conditions: housing vacancy rates per tract, and housing affordability per tract.
Agricultural worker or not, everyone in the region is affected by the shortage of
affordable housing.
An analysis of Census data estimates the proportion of crowded dwellings
where agriculture workers reside is 55% and the proportion living in extremely
crowded dwellings is 22%. The statistical reliability of these findings is unknown,
primarily because of the large disparity between Agriculture Worker
employment reported by the Census and reports published by the Bureau of
Labor Statistics.
Preliminary findings from the Salinas-Pajaro Agricultural Workers Housing Survey
(SPAWHS) indicate an extraordinarily large proportion of unrelated families
and/or persons sharing dwellings: 54% of dwelling surveyed had unrelated
occupants. The extent of crowding in the SPAWHS sample far exceeded findings
based on the Census Bureau’s ACS: 93% of participants in the SPAWHS lived in
crowded dwellings, and 67% lived in extremely crowded dwellings.
The SPAWHS finds 11% or fewer live in a dwelling owned by the survey
participant or a family member; 89% rent their dwelling, or rent a room in a
dwelling, or rent space on a floor in a rented dwelling. The monthly average
cash rental payments by survey participants was $215.66 per person.
There are major disparities between the Census Bureau’s ACS findings and the
SPAWHS. Mines has emphasized that only targeted surveys of farmworkers can
yield reasonably accurate information about their living and working conditions
(Mines. 2005). The findings discussed in the present report underscores the
importance of Mines’ comment.
4 | P a g e
Agricultural worker affordable housing in the Salinas-
Pajaro Valleys
At a meeting of the 2013 Task Force on Farm Labor Housing and Transportation
in California, sponsored by Karen Ross, Secretary of Food and Agriculture for the
state, Sergio Sanchez, with the California Strawberry Commission, described his
visits with workers in East Salinas, a low-income, mostly Hispanic neighborhood
where many hired farm workers live.1 He visited a number of homes where the
rooms had lines of mattresses leaning against the walls. This arrangement of
mattresses during daylight hours was necessary because it wouldn’t be possible
to otherwise walk through the rooms without stepping on someone’s sleeping
space on the floor. He described sanitation problems as “devastating” in these
conditions of extremely crowded housing.
The Salinas-Pajaro Valleys are home to two state-funded Migrant Housing
Centers: one in Watsonville and the other in King City. Reportedly, on the
season’s opening day of the Watsonville camp long lines form of those hoping
to gain a home near their jobs.2 These centers are limited to families and most
residents are accompanied by their children. Recently, the official qualifying
minimum distance of the Migrant Housing Center from a resident family’s
permanent home was proposed to be reduced to 50 miles, in recognition that
commuting to a job from longer than such a distance would likely unnecessarily
burden families with young children, and thereby possibly diminish the supply of
available domestic labor.
Affordable rental housing in the Salinas-Pajaro Valleys is quite limited. The U.S.
Department of Housing and Urban Development’s published criterion for
housing affordability indicates that housing expense, such as cash rent, shall be
30% or less of household income. For a household income of $30,000,
affordability translates to not more than $750 cash rent per month.
During the past several decades, the region has been the focus of significant
efforts by non-profit developers of affordable housing, local government
housing agencies, private developers, and, recently, by farm employers, to
provide affordable housing for agricultural workers in the region. The California
Department of Housing and Community Development reports there were 44
1 Presentation by Sergio Sanchez on May 8, 2013, at the forum on farm worker housing and
transportation, sponsored by AgInnovations, California Department of Food and Agriculture,
Sacramento. 2 Daniela Vargas, private communication.
5 | P a g e
rental projects operated by non-profit agencies and local government
agencies in Monterey County providing a total of 2,053 units of affordable
housing to local residents (see Appendix I). Many, if not most, were intended to
serve agricultural worker families.
Recently, farm employers have undertaken new initiatives to provide company
operated rental housing for employees. The most widely known of these, and
also widely admired, is Spreckels Crossing, owned and operated by Tanimura
and Antle, a large-scale vegetable grower-packer-shipper and manager of a
large labor force. This housing complex offers apartment-style living on a
seasonal basis to company employees, along with an attractive package of
employee benefits. The development has succeeded in attracting hundreds of
domestic workers eager to obtain safe, decent, and affordable housing for as
little as $125 per month cash rental in a shared, four-person bedroom, or a
husband and wife can pay $500 per month for a private bedroom. Full kitchen
facilities are shared among as many as eight persons per apartment.
Farm employers who are able to obtain certification of the lack of local
domestic labor can hire non-immigrant, temporary, foreign agricultural workers
under terms of the H-2A visa program. Employers are required by law to provide
housing, transportation and meals for these employees, as well as comply with
the other regulations. Some employers have rented Salinas Valley motels for this
purpose, or leased privately-owned dwellings, or purchased private dwellings to
house the approximately 4,300 H-2A workers certified for employment in the
region during FY 2017. Portions of a large abandoned warehouse in downtown
King City was recently converted to dormitory-style housing for H-2A workers.
Among most Americans, the image of farm labor housing is typically a labor
camp, with bunkhouses, communal washrooms and dining rooms located in a
remote, rural area. But the reality in the Salinas-Pajaro Valleys is very different.
The ACS survey does not specifically identify “farm laborers” or “agricultural
workers.” Rather, ACS summarizes employment for all types of natural resource
industries combined, namely, agriculture, forestry (including logging), fishing,
hunting and mining, which together are termed AFF herein. Annual average
employment in agriculture alone within the region accounts for 99.8% of the AFF
6 | P a g e
total, which indicates this to be a reasonable approximation for identifying the
population of interest.3
The ACS is a continuous, on-going survey based on US Census Bureau Master
Address Files. Thus, the 1-year annual average is a 12-month average of survey
findings collected on a month-by-month basis. The 1-year sample size is too
small to provide statistically reliable housing findings for Salinas-Pajaro Valley
communities smaller than Salinas city. Some findings, such as wage and salary
agricultural worker employment for Salinas city, or data at the neighborhood
(census tract) level are unavailable from the 1-year ACS.
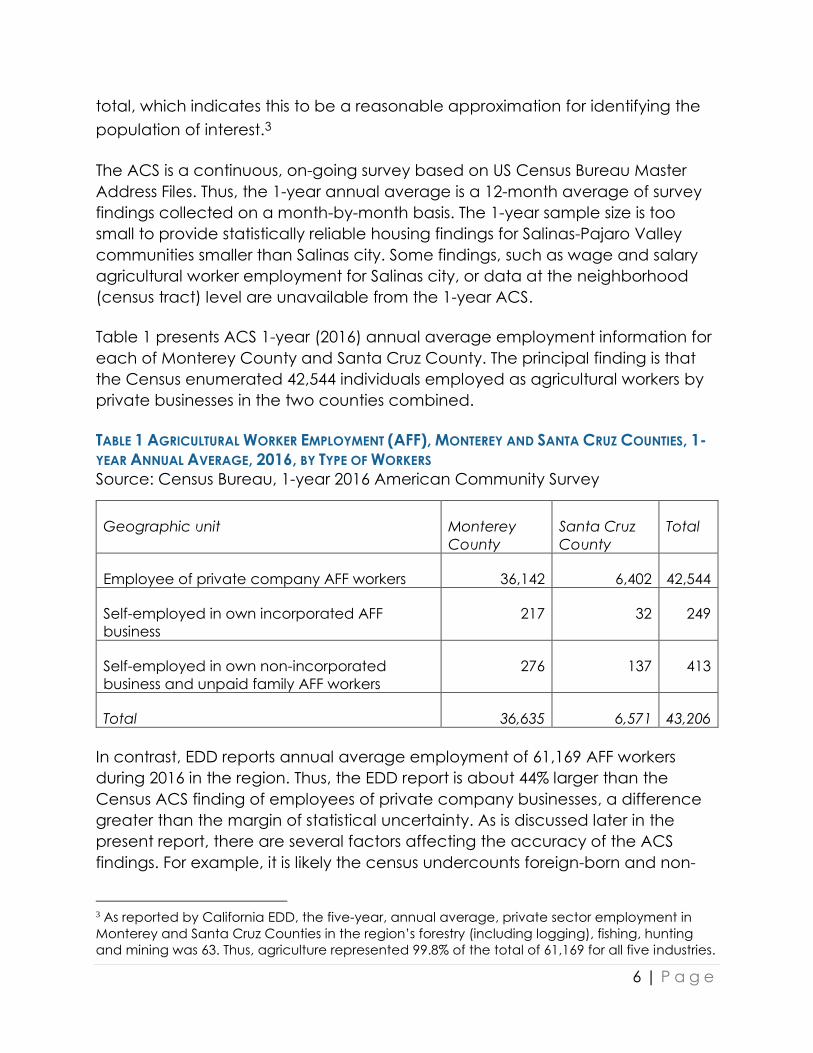
Table 1 presents ACS 1-year (2016) annual average employment information for
each of Monterey County and Santa Cruz County. The principal finding is that
the Census enumerated 42,544 individuals employed as agricultural workers by
private businesses in the two counties combined.
TABLE 1 AGRICULTURAL WORKER EMPLOYMENT (AFF), MONTEREY AND SANTA CRUZ COUNTIES, 1-
YEAR ANNUAL AVERAGE, 2016, BY TYPE OF WORKERS
Source: Census Bureau, 1-year 2016 American Community Survey
Geographic unit Monterey
County
Santa Cruz
County
Total
Employee of private company AFF workers 36,142 6,402 42,544
Self-employed in own incorporated AFF
business
217 32 249
Self-employed in own non-incorporated
business and unpaid family AFF workers
276 137 413
Total 36,635 6,571 43,206
In contrast, EDD reports annual average employment of 61,169 AFF workers
during 2016 in the region. Thus, the EDD report is about 44% larger than the
Census ACS finding of employees of private company businesses, a difference
greater than the margin of statistical uncertainty. As is discussed later in the
present report, there are several factors affecting the accuracy of the ACS
findings. For example, it is likely the census undercounts foreign-born and non-
3 As reported by California EDD, the five-year, annual average, private sector employment in
Monterey and Santa Cruz Counties in the region’s forestry (including logging), fishing, hunting
and mining was 63. Thus, agriculture represented 99.8% of the total of 61,169 for all five industries.
7 | P a g e
literate workers, partially accounting for this difference. A study of the 2010
Census undercount of hired farm workers in 33 hard-to-count California Census
Tracts estimated the undercount to be 10% (Kissam, 2012)
The most complete ACS findings at all
levels of geography are reported in 5-
year annual average summaries. The
five-year (2012-16) ACS provides
summary data at the community level of
annual average employment, by industry
category (United States Census Bureau,
2018). The 5-year “annual average
employment” is a 60-month average of
the number of persons employed in a
specified industry, and also provides
information about population and
housing in neighborhoods (census tracts).
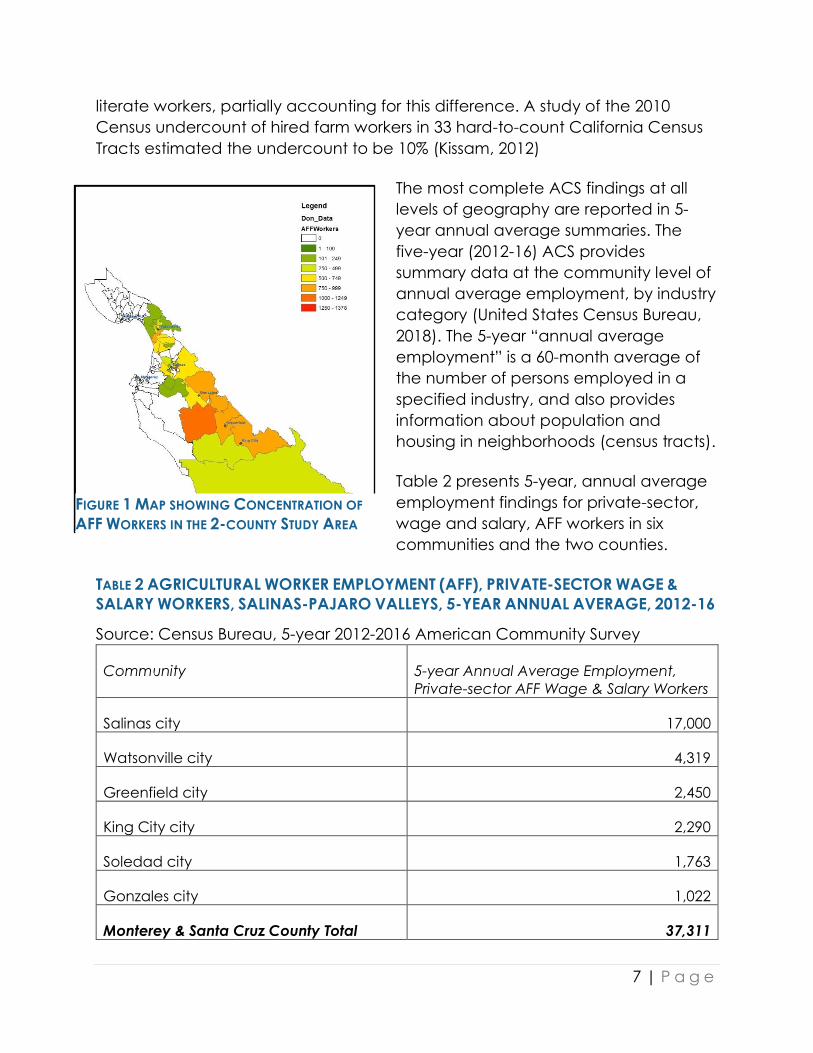
Table 2 presents 5-year, annual average
employment findings for private-sector,
wage and salary, AFF workers in six
communities and the two counties.
TABLE 2 AGRICULTURAL WORKER EMPLOYMENT (AFF), PRIVATE-SECTOR WAGE &
SALARY WORKERS, SALINAS-PAJARO VALLEYS, 5-YEAR ANNUAL AVERAGE, 2012-16
Source: Census Bureau, 5-year 2012-2016 American Community Survey
Community 5-year Annual Average Employment,
Private-sector AFF Wage & Salary Workers
Salinas city 17,000
Watsonville city 4,319
Greenfield city 2,450
King City city 2,290
Soledad city 1,763
Gonzales city 1,022
Monterey & Santa Cruz County Total 37,311
FIGURE 1 MAP SHOWING CONCENTRATION OF
AFF WORKERS IN THE 2-COUNTY STUDY AREA

8 | P a g e
The most surprising aspect of the ACS annual average employment findings is
the vast majority of hired agricultural workers today likely reside in six of the
region’s incorporated cities. All six are
centrally located within the heart of
the region’s cropland. Together,
these six cities account for a full
three-fourths share of the region’s
reported 5-year average agricultural
worker employment.
There are many advantages to
residing in those cities: close proximity
to crop fields and/or salad plants;
lower rents as compared with the
region’s coastal communities; and,
possibly, facing less discrimination in
accessing housing. For foreign-born
workers, there will also be greater
cultural cohesion in these cities with
others who migrated from the same
village or municipio.
The reported total of agricultural
workers residing in Salinas city during
2012-16 was more than 5,000 greater than the corresponding total for the
preceding five-year period reported by the census (2007-11), which was a total
of 12,036 employees of AFF private-sector businesses. This growth amounts to
+42% during the five-year interval between those two periods.
By contrast, the employment total for Watsonville in 2012-16, 4,319, was
essentially unchanged as compared with the level in 2007-11, 4,343.
Nevertheless, more than two-thirds of Santa Cruz County’s private-sector, wage
and salary agricultural workers lived in Watsonville.
Apart for these six cities, the next largest concentration of private-sector, wage
and salary, agricultural workers in the Salinas-Pajaro Valleys was located in
Castroville, an unincorporated Census Designated Place. The five-year (2012-
16), annual average reported agricultural worker employment in Castroville was
976.
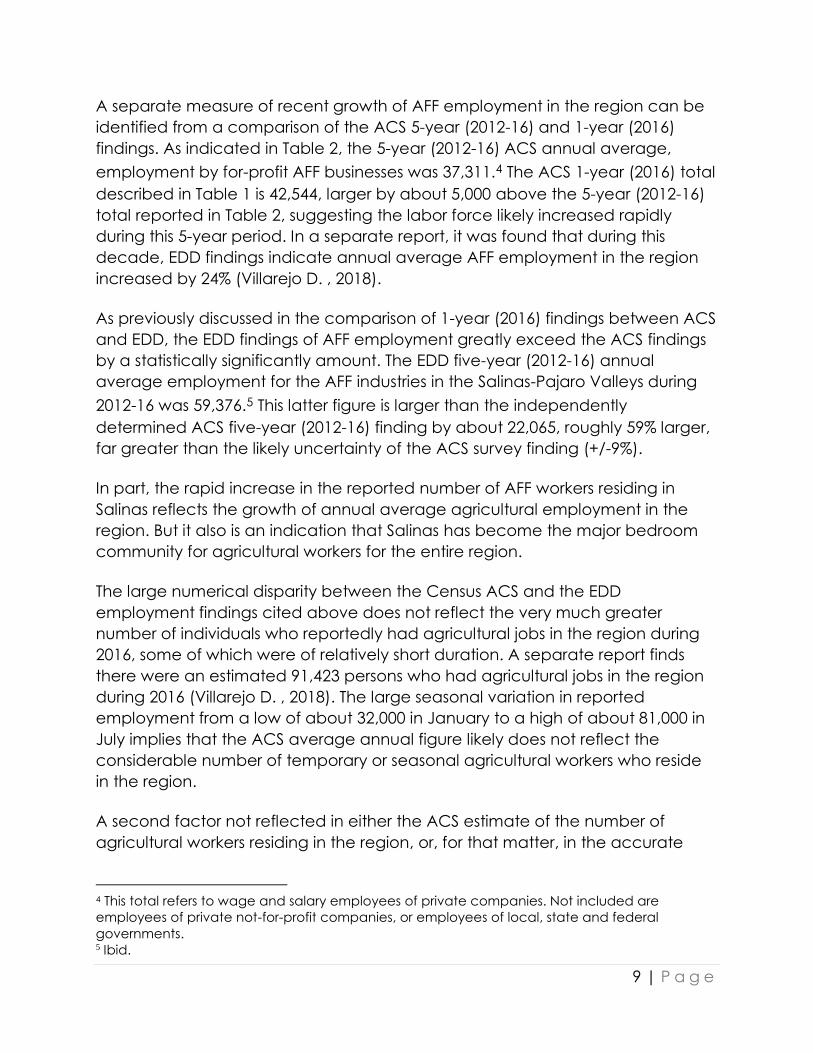
FIGURE 2 MAP SHOWING CONCENTRATION OF
AFF WORKERS IN THE CITY OF SALINAS
9 | P a g e
A separate measure of recent growth of AFF employment in the region can be
identified from a comparison of the ACS 5-year (2012-16) and 1-year (2016)
findings. As indicated in Table 2, the 5-year (2012-16) ACS annual average,
employment by for-profit AFF businesses was 37,311.4 The ACS 1-year (2016) total
described in Table 1 is 42,544, larger by about 5,000 above the 5-year (2012-16)
total reported in Table 2, suggesting the labor force likely increased rapidly
during this 5-year period. In a separate report, it was found that during this
decade, EDD findings indicate annual average AFF employment in the region
increased by 24% (Villarejo D. , 2018).
As previously discussed in the comparison of 1-year (2016) findings between ACS
and EDD, the EDD findings of AFF employment greatly exceed the ACS findings
by a statistically significantly amount. The EDD five-year (2012-16) annual
average employment for the AFF industries in the Salinas-Pajaro Valleys during
2012-16 was 59,376.5 This latter figure is larger than the independently
determined ACS five-year (2012-16) finding by about 22,065, roughly 59% larger,
far greater than the likely uncertainty of the ACS survey finding (+/-9%).
In part, the rapid increase in the reported number of AFF workers residing in
Salinas reflects the growth of annual average agricultural employment in the
region. But it also is an indication that Salinas has become the major bedroom
community for agricultural workers for the entire region.
The large numerical disparity between the Census ACS and the EDD
employment findings cited above does not reflect the very much greater
number of individuals who reportedly had agricultural jobs in the region during
2016, some of which were of relatively short duration. A separate report finds
there were an estimated 91,423 persons who had agricultural jobs in the region
during 2016 (Villarejo D. , 2018). The large seasonal variation in reported
employment from a low of about 32,000 in January to a high of about 81,000 in
July implies that the ACS average annual figure likely does not reflect the
considerable number of temporary or seasonal agricultural workers who reside
in the region.
A second factor not reflected in either the ACS estimate of the number of
agricultural workers residing in the region, or, for that matter, in the accurate
4 This total refers to wage and salary employees of private companies. Not included are
employees of private not-for-profit companies, or employees of local, state and federal
governments. 5 Ibid.
10 | P a g e
EDD enumeration of employment, is that an unknown portion of those residing
within the region, and employed by firms based there, may be working in
adjacent counties for at least part of the duration of their farm employment. As
was demonstrated in a separate report, San Benito County agriculture is clearly
fully integrated with the region’s farms and, especially, its agricultural services
industry, not to mention the agriculture of other counties which are adjacent to
the region (Villarejo D. , 2018)
Agricultural workers are densely congregated in relatively
few neighborhoods in the Salinas-Pajaro Valleys
The most recent (2016) ACS summary of county-wide, housing findings are
available for each of Monterey County, Santa Cruz County, and Salinas city.
There are 145 census tracts in the two counties. Of these, most have only a very
few, if any, private sector, wage and salary, agricultural workers as residents. By
contrast, most of the region’s agricultural workers live in neighborhoods which
are densely populated by similar workers.
Just six census tracts account for 67% of the Pajaro Valley’s resident agricultural
workers, averaging 672 agricultural workers per tract. In the Salinas Valley region,
thirty-one census tracts accounted for 84% of the Salinas Valley’s resident
agricultural workers, averaging 855 such workers per tract; in each of just seven
Salinas Valley census tracts, an absolute majority of resident workers were
employed in the region’s agriculture, averaging 1,105 workers per tract.6 One of
these seven is Census Tract 5.01, known locally as East Salinas.
Absent the ability to identify specific dwellings in Census data where agricultural
workers reside, it proved necessary to examine the demographic and
employment profile of census tracts, seeking to characterize the neighborhood
housing profile where such workers reside. The present report included analysis
of data for the 113 census tracts in the two counties in which the 5-year (2012-
16) ACS finds agricultural workers were among the residents of each tract. These
tracts account for virtually all of the reported total number of agricultural
workers in the entire region.7
6 The comparable annual average, civilian, non-institutionalized employed persons age 16 and
older per census tract was 1,963 in Monterey County and 2,493 in Santa Cruz County. 7 The 113 tracts account for 37,267 of the total number of agricultural workers in the region,
which was 37,311 as reported in Table 2. The two totals differ by 44 agricultural workers, or 0.1%.
11 | P a g e
From this analysis, the present report finds likely associations between the
percentages of agricultural workers resident in these 113 census tracts with
particular housing characteristics. The specific characteristics for which
statistically significant associations were found pertained to owner vs. renter,
crowding (measured by persons per room) and amount of cash rental expense.
However, there were no statistically significant associations found for cash rental
expense affordability or for vacancy rates in renter occupied dwellings.
• First, there is a statistically robust correlation between the proportion of
agricultural workers per tract and crowded dwellings, measured by the
number of persons per room, excluding bathrooms, equal to 1.01 per
room, or greater (Pearson coefficient equal to 0.834). Perfect, 100%,
correlation corresponds to a Pearson coefficient equal to 1.000, while no
correlation whatsoever corresponds to a coefficient equal to 0.000.
• Second, the present report also finds a statistically robust correlation
between percent agricultural workers and extremely crowded dwellings,
equal to 1.51 persons per room or greater (Pearson coefficient equal to
0.754). Though not as strong as the correlation found for crowded
dwellings, this is a robust finding: where more agricultural workers reside,
there was a greater prevalence of extremely crowded dwellings.
• Third, there is a statistically significant correlation between the proportion
of rental dwellings and the percent of agricultural workers per tract
(Pearson coefficient equal to 0.400). Proportionately fewer owner-
occupied dwellings are located in census tracts with a greater
percentage of agricultural workers.
• Fourth, there is a statistically significant negative correlation between the
median cash rental expense and the percent of agricultural workers in the
tract per dwelling (Pearson coefficient equal to -0.539).8 Significantly lower
cash rentals are found in tracts with larger proportions of agricultural
workers. The degree of statistically significant negative association is
greater on the rental cost per person basis (-0.707).
• Fifth, there is no statistically significant association of rental vacancy rates
in these census tracts with an increased proportion of agricultural workers
(Pearson coefficient equal to -0.098). This indicates that the rental
vacancy rates in the 113 census tracts examined were typically low
throughout but might possibly be slightly lower in a few tracts with a large
proportion of agricultural workers.
8 A negative Pearson coefficient corresponds to an inverse correlation: A is negatively
associated with B, e.g., high cash rental is negatively associated with poverty status.

12 | P a g e
The measure of crowding for the 113 census tracts where agricultural workers
reside refers to all rental units in the tract, not just those dwellings where
agricultural workers were living. In order to estimate the extent of crowding in
only those dwellings occupied by agricultural workers, the present report
examined the variation of increased crowding per tract with the increase of the
percentage of agricultural workers living in the tract. Extrapolation of this
variation of crowding with increased percent of agricultural workers resident
made it possible to estimate the likely extent of crowding in the hypothetical
census tract in which all residents were agricultural workers (see Appendix II).
The principal findings of the above analysis are an estimated 55% of agricultural
workers in the region reside in crowded dwellings and 22% reside in extremely
crowded dwelling (Table 3). These Census findings indicate extreme crowding is
prevalent in more than one-fifth of dwellings in which agricultural workers reside.
TABLE 3 PERSONS PER ROOM, DWELLINGS IN 113 SELECT CENSUS TRACTS (MORE
THAN 100 AGRICULTURAL WORKERS PER TRACT) VS. SALINAS CITY, MONTEREY AND
SANTA CRUZ COUNTIES, 5-YEAR ANNUAL AVERAGE, 2012-16
Source: Census Bureau, 5-year (2012-16) American Community Survey
Persons per room Dwellings in 113 Select
Census Tracts in the
Salinas and Pajaro Valleys
Less than 1.00 45%
1.01 or more (crowded) 55%
1.51 or more (extremely crowded) 22%
The 2017 SPAWHS farmworker survey finds extremely
crowded dwellings
The Salinas-Pajaro Agricultural Worker Housing Survey (SPAWHS)9), conducted
among about 400 current agricultural workers during 2017, finds 54% of dwellings
included persons unrelated to the participant’s household. This is highest
proportion of non-family residents ever found in surveys among California
farmworkers.
9 Rick Mines, director of the SPAWHS survey, kindly provided preliminary data for the present report, which are
presented in full https://donvillarejo.github.io/Fulltext/Farmworker-Housing-Study-and-Action-Plan-for-Salinas-
Valley-and-Pajaro-Valley_2018-Jume.pdf
.

13 | P a g e
The SPAWHS findings regarding crowding demonstrate far greater degrees of
crowding than found in census tract data for the region. These findings are
summarized in the Figure 3.
FIGURE 3 DISTRIBUTION: 391 DWELLINGS BY CATEGORIES OF PEOPLE PER ROOM
The findings presented in Figure 3 are extraordinary. Whereas census findings for
Salinas city indicated 82% of dwellings were not crowded (had 1.00 or fewer
persons per room), the direct evidence of the SPAWHS indicates that in 2017,
only 7% of agricultural workers in the Salinas-Pajaro region lived in households
that were not crowded.
The SPAWHS found 67% of dwellings occupied by agricultural workers had 1.51
or more persons per room, indicating severe crowding. Even more striking, the
SPAWHS found 18% of agricultural worker dwellings had more than 3.01 persons
per room. The Census does not even present data for this category because the
prevalence of this level of crowding in census data is vanishingly small.
The major factor in the extent of crowding is the degree to which unrelated
persons share dwellings with families or householders. In one case, the SPAWHS
found 40 persons sharing a dwelling, most of whom were not related to the
7%
26%
28%
11% 10%
18%
0%
5%
10%
15%
20%
25%
30%
Figure 3. Distribution: 391 Dwellings
by Categories of People per Room

14 | P a g e
family of the participant in the survey. The SPAWHS found 337 participants were
renters and only 42 participants were residing in the family’s owned dwelling.
Eleven of the latter had complex arrangements for the trailers where they lived.
Just 8.4% of SPAWHS participants were paying a mortgage and the other 91.5%
were renters.
Rental expenses are difficult to measure among agricultural workers because a
dwelling may contain multiple individual households. In research on agricultural
worker demographics, it has become customary to define a household, apart
from the physical structure of a dwelling, by identifying individuals or family
groups who share the expenses among themselves for food, rent and other
necessities. Typically, as in the Salinas-Pajaro region, a family in a household will
take in others as “sub-renters.” These renters pay the family a fee for use of a
room, or --in some cases, use of a portion of a floor for sleeping-- but they have
separate responsibility for their own food and other necessities. In some cases, a
non-resident landlord will charge a rental fee to each of several householders
who share the dwelling.
For this reason, measures of rental or mortgage expense are usually measured
on a per-person basis. Table 4 presents findings from the SPAWHS of the per
person rental and mortgage expense.
TABLE 4 CASH RENTAL EXPENSE, PER PERSONS, MONTEREY AND SANTA CRUZ
COUNTIES, 378 DWELLINGS.
SOURCE: SPAWHS, 2017
Type of Expense (monthly) Average expense per
person
Number of Observations
Rent $215.66 346
Mortgage $329.79 32
The previously discussed analysis of financial data for 113 census tracts in which
agricultural workers were among the residents found a strong negative
correlation between the per-person cash median rental expense and percent
of agricultural worker residing in the tract’s dwellings. Roughly one-fifth of the 113
tracts had a reported per person median rental in close agreement with the
average per person rental expense reported by the SPAWHS in Table 4.
The SPAWHS also identified the type of dwelling in which participants resided
(Figure 4). Most agricultural workers (69%) lived in a house or apartment
structure; nearly one-fifth (19%) rented a single room in a house or apartment.

15 | P a g e
FIGURE 4 DISTRIBUTION BY TYPE OF DWELLING
The living arrangements in dwellings where SPAWHS participants reside is
presented in Figure 5. Most dwellings are shared with unrelated persons.
FIGURE 5 DISTRIBUTION BY JOINT OR FAMILY
40%
29%
19%
6%4%
2%
0%
5%
10%
15%
20%
25%
30%
35%
40%
45%
house apartment room in apt or
house
trailer garage or
studio
other
SPAWHS N=388
Figure 4. Distribution by Type of Dwelling
17%
46%
37%
0%
5%
10%
15%
20%
25%
30%
35%
40%
45%
50%
Solo person & others* only family family and others (Joint)
SPAWHS N=391 * 6 solos live alone
Distribution by Joint or Family

16 | P a g e
Discussion
The most significant development for housing hired farm workers in California
during the past several decades is the very great increase in their reliance on
unsubsidized, private-market, off-farm housing, especially in cities within
agricultural regions of the state (Villarejo D. , 2014). But their housing conditions
likely have not improved. Widespread sharing of dwellings among unrelated
persons is commonplace (Villarejo D. , 2011).
This is a major shift in the responsibility, and the cost, for their housing from
employers and government agencies to the workers themselves. Employers
have sharply curtailed their on-farm housing: only 3.9% of farm employers
participating in the 2015 annual survey of wages and benefits indicated they
provided housing for seasonal employees; the 1986 survey of farm employers,
the first to separately report benefits for seasonal employees, found 20.6% of
employers said they provided housing for seasonal workers (Wage and Benefit
Survey, 1986; 2015). The proportion of employers who provided housing for
permanent, year-round workers was greater in 2015 than in 1986, but the
number of employers providing housing also declined during this 29-year
interval.
Consistent with the findings of a decline in housing provided by farm employers
were reports of a very substantial decrease in the number of registered
employer-run farm labor camps in the state. From a high of an estimated 5,000
such camps at the end of the Bracero program on December 31, 1964, fewer
than 800 remained by 2000 (Villarejo D, 2009).10 But registered camps have not
been surveyed in recent years, so the total may even be smaller. In counties
with a large agricultural workforce, County health officials are responsible for
inspections, but in other counties, state officials are responsible for registration
and inspection.
At the same time, there has been only a marginal increase in the number of
subsidized, farm labor housing units developed by either government agencies
or non-profit groups. Generally, housing developed by these groups is of good
quality. USDA’s Rural Housing Service Farm Labor Housing program faces a
continuing demand for farm labor housing, but the state’s total of such units is
10 Manuel Mejia, California Department of Housing and Community Development, indicated
farmer-operated labor camps in the state fell to 800 in 1989 from 1,504 in 1987, a result of
enforcement of new regulations.

17 | P a g e
just 5,579 [United States. GAO. 2011]. USDA funding is quite limited, supporting
only a handful of new projects in the past couple of years (USGAO, 2011).
Philanthropy, notably The California Endowment, made a $30 million
commitment to improve the health of farm laborers through better housing
twelve years ago, but ended its 10-year-long program focused on farm worker
health. Grants by this foundation to support new housing projects were required
to seek to improve healthful living as well as access to health care services.
The ACS findings indicate a substantial increase in the number of agricultural
workers residing in the Salinas-Pajaro Valleys in the past several years, notably
adding an estimated 5,000 such workers who reside in Salinas city. But the ACS
also consistently finds substantially lower numbers of employees than are
reported by employers and published by EDD.
There are two factors to consider in interpreting this apparent discrepancy.
• First, the Census Bureau has difficulty reaching foreign-born and
workers with little schooling.
• Second, while the Census Bureau considers “households” or
“families” to be the occupants of dwellings; among agricultural
workers it is commonplace for unrelated persons, or households, to
share dwellings with families or unaccompanied individuals.
The Census Bureau faces a difficult challenge: how to find and enumerate
persons who are not part of its own definitions of either “families” or
“households.” Among agricultural workers living in the Salinas-Pajaro Valleys
there may even be an incentive not to cooperate with the ACS because renters
or other occupants may be living there in violation of local housing codes.
For agriculture, with large seasonal variations in employment, “annual average
employment” understates the actual number of persons employed in a given
year, let alone the effect of new workers entering farm jobs for the first time, and
others departing. The ACS may also under-count some of the smallest
communities as well as hard-to-reach populations.
Nevertheless, it proved possible to construct an analysis of Census summary
findings to obtain estimates of crowding, and associations of agricultural worker
residential density with factors of importance in characterizing housing costs and
conditions. This analysis of ACS data indicated a greater degree of crowding in
dwellings where agricultural workers reside, as well as a much greater reliance
18 | P a g e
on rental housing among agricultural workers than is typical for the populations
of either Salinas city specifically, or for the two counties in general.
At the same time, the rental housing vacancy rates in neighborhoods where
agricultural workers resided were not significantly lower than vacancy rates in
the cities of the region. The lack of affordable housing may, in fact, reflect the
lack of increase of the region’s housing stock commensurate with the sharply
rising demand for agricultural labor.
The most notable findings of the present report are from the SPAWHS, the in-
person survey of about 400 agricultural workers. Most significantly, the survey
found extremely higher degrees of crowding than those reported by the Census
Bureau, largely the result of the unexpectedly wide prevalence of shared
dwellings among unrelated persons.
The highest average occupancy per room found in a previous survey of a
farmworker population was 1.75, reported by the authors of indigenous
farmworker survey.11 An earlier farmworker survey found an average of 1.78
persons per room used for sleeping.12 Migrant workers from villages in Mexico
and Central America where indigenous languages are spoken face major
challenges obtaining employment and housing in the U.S. (Zabin C, 1993).
The SPAWHS also finds occupancy of rental dwellings is extremely high as
compared with occupant ownership. Just 11% or less of participants in the
survey lived in a dwelling owned by them or a resident family member.
Both factors may result in a low housing expense for individual agricultural
workers, but at a high personal cost, such as lack of privacy and the discomfort
with the condition of bathrooms that must be shared with many other persons.
Finally, a comparison of the relative proportions SPAWHS participants among
specific communities with similar findings of the Census ACS five-year (2012-16),
indicated very close general agreement, indicating SPAWHS reliability. These
results are indicated in Figure 6.
For Salinas and Watsonville, the proportions are in especially close agreement.
The only community for which the proportions are not similarly close is Chualar,
11 http://www.indigenousfarmworkers.org/housing.shtml 12 The California Agricultural Workers Health Survey (CAWHS) found an average of 1.78 persons per room used
for sleeping during 1999-2000.

19 | P a g e
which has a much smaller total population for which the Census is notably less
reliable.
FIGURE 6 DISTRIBUTION OF AGRICULTURAL WORKERS, BY COMMUNITY
Finally, the movement of rural workers to urban centers is a global
phenomenon.13 The search for jobs and amenities often lacking in rural areas
are strong enticements. Among agricultural workers in California - some 95% or
more are foreign-born - urban spaces often have a “critical mass” of folks who
speak the same language and share their culture. Access to high-speed internet
connectivity is far superior in most urban areas than in many rural spaces, even
in California.
There are major disparities between the Census Bureau’s ACS findings and the
SPAWHS which raise serious questions about knowledge concerning farm labor
housing and the conditions in which many workers live. Mines has emphasized
that only targeted surveys of farmworkers can yield reasonably accurate
information about their living and working conditions (Mines. 2005). The findings
discussed in the present report underscores the importance of Mines’ comment.
13 See http://www.pewsocialtrends.org/2013/12/17/chapter-2-migrant-destinations/
0.00%
10.00%
20.00%
30.00%
40.00%
50.00%
60.00%
Figure 6. Distribtion of Agricultural Workers, by
Community of Residence, SPAWHES & Census
ACS
Census ACS (2012-16) SPAWHS (2017)

20 | P a g e
Appendix I. Affordable Rental Projects in Monterey County,
California Department of Housing and Community Development,
May 31, 2016.
Project Name City
Tota
l
Un
its
City Sponsor
Acacia House Salinas 6 Salinas Interim, Inc.
Benito St
Affordable Hsng Soledad 70 Soledad
Housing Authority of the County
of Monterey
California St Hsng Salinas 8 Salinas Interim, Inc.
Camphora Apts Soledad 44 Soledad South County Housing
Corporation
Canyon Creek
Townhomes Gonzales 36 Gonzales CHISPA
Casa de Paloma Salinas 6 Salinas Interim, Inc.
Casa de Perla Monterey 6 Monterey Interim, Inc.
Chular Farm Labor
Ctr Chualar 29 Chualar
Housing Authority of the County
of Monterey
Cynara Ct Castroville 58 Castroville MidPen Housing Corp.
Estrella Apts. Monterey 8 Monterey City of monterey
Geil Street Castroville 11 Castroville MidPen Housing Corp.
Jardines de
Boronda Salinas 30 Salinas
South County Housing
Corporation
Kings Station King City 57 King City Pacific West Communities
La Buena
Esperanza (King
City Farm Labor
Hsng)
King City 40 King City La Buena Esperanza
Cooperative
Lakeview Towers Salinas 50 Salinas Housing Authority of the County
of Monterey
Las Casas de
Madera Salinas 75 Salinas Las Casas de Madera Co-Op
Las Jicamas Apts Soledad 46 Soledad Soledad Local Development
Corporation
Lincoln Square Pajaro 19 Pajaro Pajaro Valley Housing Corp.
Loma El Paraiso Salinas 43 Salinas CHISPA

21 | P a g e
Los Abuelitos Sr
Apts Salinas 25 Salinas CHISPA
Lupine Gardens
Apts Salinas 21 Salinas Interim, Inc.
Manzanita Place Marina 66 Marina MidPen Housing Corp.
Marina Manor Marina 39 Marina CHISPA
Market St
Townhomes Soledad 60 Soledad CHISPA
Nuevo Amanecer
Apts (Salinas Rd) Pajaro 63 Pajaro
South County Housing
Corporation
Pacific Meadows
Sr. Carmel 200 Carmel Pacific Meadows Housing LP
Orchard Gabilan Soledad 84 Soledad Orchard Gabilan Asst., CA LP
Pueblo del Mar
(17th Regiment) Marina 46 Marina Monterey County Housing, Inc.
Pueblo del Mar
(Kwajalein Ct) Marina 10 Marina Monterey County Housing, Inc.
Rippling River Sr.
Apys. Carmel 76 Carmel
Rippling Affordable Housing CA
LP
Rockrose Gardens Marina 21 Marina Rockrose Housing Corp.
Salinas Farm Labor
Ctr Salinas 57 Salinas
Monterey County Housing
Authority
Sandy Shores Marina 28 Marina Interim, Inc.
Sea Garden Apts
(Axtell Street) Castroville 59 Castroville CHISPA
Sunflower Gardens
(Casas del Sol) Salinas 18 Salinas Interim, Inc.
Tynan Village Apts Salinas 171 Salinas Monterey County Housing
Authority
University Village
Apts Marina 108 Marina
South County Housing
Corporation
Villa San Miguel King City 50 King City CHISPA
Villa Santa Clara Greenfield 30 Greenfield CHISPA
Vineyard Green
Townhomes Greenfield 40 Greenfield CHISPA
Vista de la Terraza Salinas 40 Salinas CHISPA
Vista Point Pacific
Grove 49
Pacific
Grove
South County Housing
Corporation
Walnut Place
Townhomes Greenfield 40 Greenfield CHISPA

22 | P a g e
Wesley Oaks Salinas 10 Salinas CHISPA 2053

23 | P a g e
Appendix II. Estimate of Crowded Farmerker Housing
Dwellings from Census/ACS, 5-year (2012-16) Scatter-plot of the proportion of rental units with Persons per room, 1.01 or more,
within 113 individual Census Tracts of the Salinas-Pajaro Valleys in which
agricultural workers were among the residents, versus percent of agricultural
workers per tract.
A straight-line fit to the data (dotted trendline) yields an estimate of the
proportion of rental units with 1.01 persons per room or more for the
extrapolated value of 100 percent agricultural workers within a Census Tract.
Regression analysis (least-squares) find the proportion to be 55.4%.
A similar analysis of the proportion of rental units with 1.51 Persons per room, or
more, in 113 individual Census Tracts, versus percent of agricultural workers per
tract, finds, again by extrapolation, the share is 22.3% of rental units.
0
0.1
0.2
0.3
0.4
0.5
0.6
0.00% 10.00% 20.00% 30.00% 40.00% 50.00% 60.00% 70.00%
Pe
rso
ns
pe
r ro
m,
1.0
1 m
ore
mo
re,
pe
rce
nt
of
resi
de
nts
of
ren
tal u
nits
Agricultural Workers, Pecent, Census Tract
Scatter Plot, 113 Census Tracts
Source: Census ACS, 5-year (2012-16)
24 | P a g e
Bibliography Farm Employers Labor Service. (1986). Wage and Benefit Survey. California Farm
Bureau Federation.
Farm Employers Labor Service. (2015). Wage and Benefit Survey. California Farm
Bureau Federation.
Kissam, E. (2012). Census Enumeration of Immigrant Communities in Rural
California: Dramatic Improvements but Challenges Remain. . Proceedings
of the Conference on Survey Methods for Hard-to-Reach Populations,
American Statistical Association, (p. 12).
Mines R. Hausman J. Tabshouri L. (2005). The Need for Targeted Surveys of
Farmworkers: A Comparison of the California Health Interview Survey
(CHIS) and the California Agricultural Workers Health Survey (CAWHS).
United States Census Bureau. (2018). United States, Census Bureau. 2018.
American Community Survey, . Retrieved January 2018, from
https://factfinder.census.gov/faces/nav/jsf/pages/searchresults.xhtml?refr
esh=t
USGAO. (2011). Rural Housing Service: Opportunities Exist to Strengthen Farm
Labor Housing Program Management and Oversight. United States,
General Accountability Office. Washington, DC: United States.
Villarejo D, S. M.-J. (2009). (Un)Safe at Home: The Health Consequences of Sub-
Standard Farm Labor Housing, Policy Research Report. Sacramento:
California Rural Legal Assistance, Rural Justice Forum.
Villarejo, D. (2011). Rural Housing, Exurban Expansion, and Amenity-Driven
Development. In M. L. David Marcoullieur, The Challenge of Housing
California’s Hired Farm Laborers. Hampshire, UK: Ashgate.
Villarejo, D. (2014). California’s Hired Farm Workers Move to the CitiesThe
Outsourcing of Responsibility for Farm Labor Housing., (p. 36).
Villarejo, D. (2018). Salinas-Pajaro Valleys Farms, Agricultural Production and
Employment. Davis: California Institute for Rural Studies.
Villarejo, D. (2018). Salinas-Pajaro Valleys Farms, Agricultural Production and
Employment,. Davis, CA: California Institute for Rural Studies.
Zabin C, K. M. (1993). Mixtec Migrants in California Agriculture: A New Cycle of
Poverty. Davis: California Institute for Rural Studies,.


