Download - Farmland Values – Will the Boom Turn Bust?

Farmland Values – Will the Boom Turn Bust?
Top Producer SeminarJanuary 30, 2013
Brent GloyDirector, Center for Commercial Agriculture
[email protected]‐494‐0468

Agenda
• Is it a bubble?• How much higher will they go? Are they too high already?
• What could change things?• What are the concerns/risks?

Is it a Bubble?
• Economists – almost certainly not• Is this reassuring?
– Not very– We have a very difficult time identifying irrationality (disconnect from fundamentals) ex ante
• Are there troubling signs in the marketplace?– Yes a few

Putting it in Perspective • Agriculture’s history includes periods of remarkable boom and bust
• Agriculture is capital intensive– Large increases in profitability make fixed assets priced in less profitable times look cheap
– MAJOR capital restructuring underway
Key Questions:– Will these times last or will we retreat to previous levels?– Are farmland values in a speculative bubble or responding normally to economic conditions?

Types of Shocks which Alter Farming Profitability • Demand driven: Expansion of demand which calls for more
output at all price levels– For example, biofuels and income growth and food demand in
emerging markets– Persistent demand growth can substantially increase land values and
capital investment
• Supply induced: Supply contraction where less is available at all price levels– Short‐term weather shocks do not typically impact fixed asset values– Inability of supply to keep up with normal demand expansion. If true
could lead asset value increases
Current situation is complicated by interaction of both impacts and extremely low interest rates which make future income more valuable

So How Big are the Recent Increases in Farmland Values?

Region Nominal Change Annualized Growth Rate
Real Change and Annualized Growth Rate
Iowa ‐‐‐‐‐‐‐‐‐‐‐‐‐‐‐‐‐‐‐‐‐‐‐‐‐‐‐‐‐‐‐‐Percent ‐‐‐‐‐‐‐‐‐‐‐‐‐‐‐‐‐‐‐‐‐‐‐‐‐‐‐‐
1971‐1981 399 12217.4 8.3
2001‐2011 248 17613.3 10.7
Illinois1971‐1981 343 97
16.1 7.02001‐2011 149 97
9.6 7.0Indiana
1971‐1981 381 11417.0 7.9
2001‐2011 104 627.4 4.9
a Iowa farmland values from the Iowa State Farmland Survey (Duffy). Indiana, Illinois, and U.S. Values from National Agricultural Statistics Service. Real values calculated using the CPI index.
In Real Terms, Today’s Farmland Value Increases are on Par with those of the 70’s
Dramatic Price Increases Set Against Backdrop of:• Numerous spectacular price increases and declines in the broader economy– Housing, tech stocks
• Will farmland follow suit?

Bubbles…. you get a bubble when a very high percentage of the population buys into some originally sound premise…. that (the premise) becomes distorted as time passes and people forget the original sound premise and start focusing solely on the price action….
Excerpt from Warren Buffett’s interview with the Financial Crisis Inquiry Commission

How Does This Apply to the Farmland Situation?• Fundamentals have undergone dramatic changes– Increased demand – Reduced interest rates– Supply shocks Are market participants evaluating these factors when pricing farmland?

These multiples require either sustained income growth or continuing low interest rates (and likely both)

• Will rates move up as slowly as they have moved down?
• Rate impact would likely felt on valuations today
• Cash flow impact will be secondary impact unlike 70’s
• Warning sign 1 – something changes to take us out of accommodation

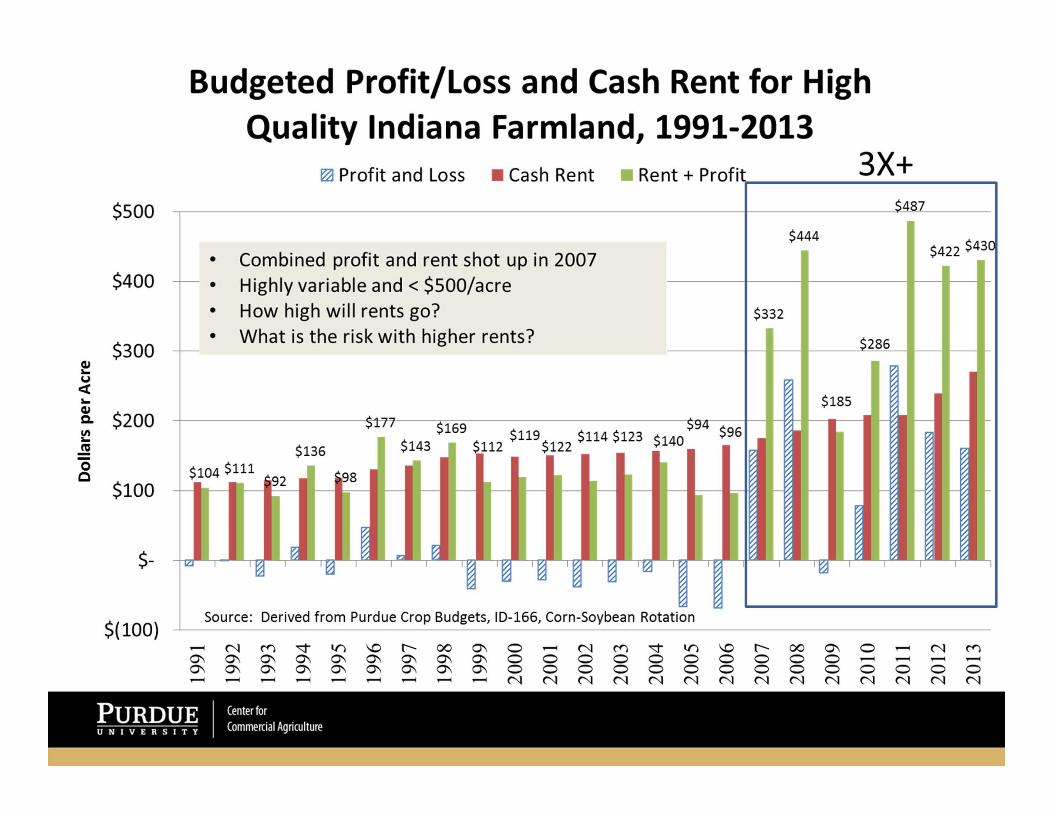
Aside from last two, recent years have been good but not spectacular

‐
2,000
4,000
6,000
8,000
10,000
12,000
150
170
190
210
230
250
270
290
310
330
350
370
390
410
430
450
470
Value pe
r Acre
Income per Acre
Land Values Under Alternative Capitalization Rates (Multiples) and Income Levels
3% (33) 4% (25) 5% (20) 6% (17) 8% (13)
2012 Value HQ IN Farmland $7,704
Current Cash Rental Rate HQ IN Farmland, $265 per Acre

Cap Rate Risk
• Monetary policy change = cap rate ↑• Economic recovery = cap rate ↑• Inflation = cap rate ↑• Increased volatility/risk = cap rate ↑• Slowing income growth in ag = cap rate ↑

0
20
40
60
80
100
120
140
‐4.00
‐2.00
0.00
2.00
4.00
6.00
8.00
1962196419661968197019721974197619781980198219841986198819901992199419961998200020022004200620082010
Billion
2005 USD
Percen
t Relationship Between Real Interest Rate and Returns to Operators,
1962‐2011
Real Interest Rate on 1 Yr UST (Left Axis) Ret to Op (Right Axis)
It is somewhat unlikely that incomes would rise with increasing real rates

SOURCE: Henderson, J., B.A. Gloy, and M.D. Boehlje. “Agriculture’s Boom‐Bust Cycles: Is This Time Different.” The Economic Review, Kansas City Federal Reserve Bank, 96:4(2011): 83‐101.
Exports Play a Key Role In Price Increases

1972/73=1,872
1981/82=2,115
1996/07=2,104
2002=2,033
2005/06=2,144
2012/13=2,267
1,600
1,700
1,800
1,900
2,000
2,100
2,200
2,300
2,400
Million Ac
res
Figure 6: World Harvested ACRES 13 Major Crops Total: (Millions)
123 Million acres added in 7 years
Acreage response is underway!

2006 2007 2008 2009 2010 2011 2012 2013 2014 2015 2016 2017 2018 2019 2020 2021 2022Biomass-based Diesel 0.5 0.65 0.8 1 1 1 1 1 1 1 1 1 1 1Non-celulosic Advanced 0.1 0.2 0.3 0.5 0.75 1 1.5 2 2.5 3 3.5 3.5 3.5 4Celulosic Advanced 0.1 0.25 0.5 1 1.75 3 4.25 5.5 7 8.5 10.5 13.5 16Conventional Biofuels 4 4.7 9 10.5 12 12.6 13.2 13.8 14.4 15 15 15 15 15 15 15 15
0
5
10
15
20
25
30
35
Billi
ons
of G
allo
ns
Renewable Fuel Standard (2007-2022)
Where to with biofuels?
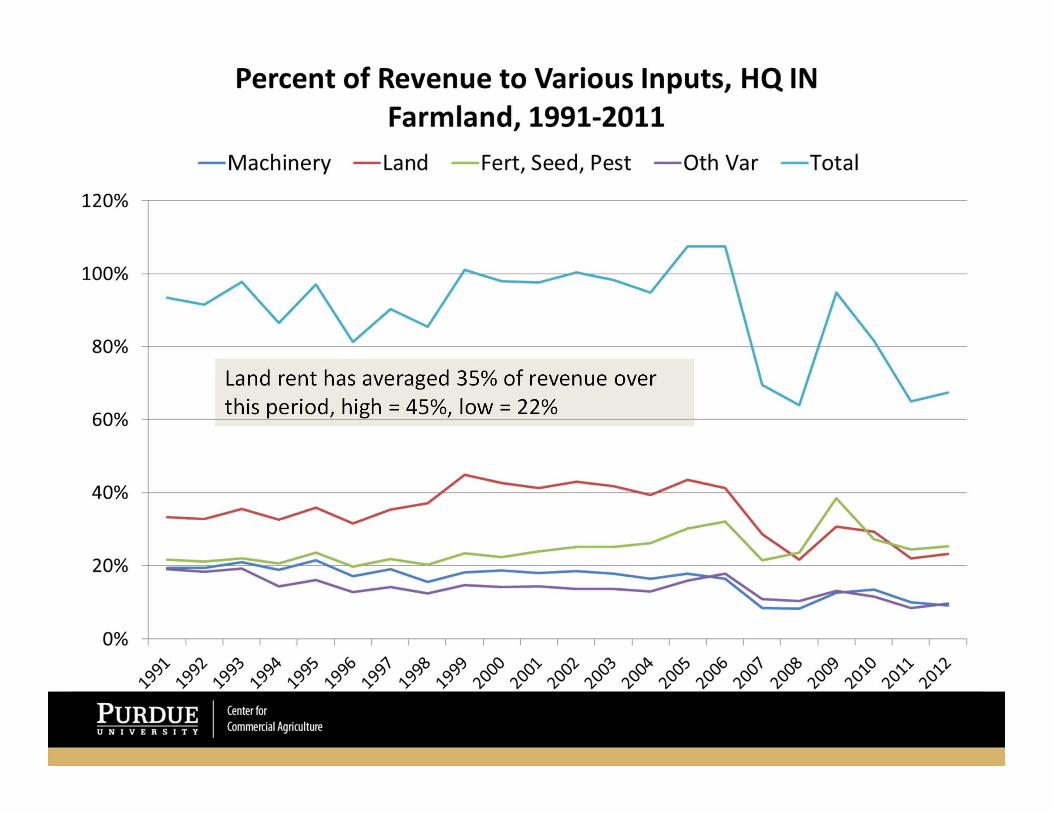
Land rent has averaged 35% of revenue over this period, high = 45%, low = 22%


So What About Corn Prices?• Darrel Good and Scott Irwin forecast the new plateau prices as follows:
SOURCE: Good, D. and S. Irwin. “The New Era of Corn, Soybean, and Wheat Prices.” Marketing and Outlook Briefs, MOBR 08‐04, September 2, 2008 Dept. of Agr. Cons. Econ, University of Illinois.
Corn Soybeans Wheat
Post Dec 2006 Monthly Price
‐‐‐‐‐‐‐‐‐‐$’s per Bushel‐‐‐‐‐‐‐‐‐‐‐
Average 4.60 11.50 5.80
High 6.70 19.10 10.15
Low 3.00 8.20 3.30

Box captures I&G’s price range if land receives 35% of gross revenueCurrent yield = 192bpa, current rent = $265/acre
$0
$2,000
$4,000
$6,000
$8,000
$10,000
$12,000
$0.78
$0.89
$0.99
$1.09
$1.20
$1.30
$1.41
$1.51
$1.61
$1.72
$1.82
$1.93
$2.03
$2.14
$2.24
$2.34
$2.45
Value pe
r Acre
Rent per Bushel
Land Values Under Alternative Capitalization Rates (Multiples) and Rent per Bushel, HQ IN Farmland
3% (33) 4% (25) 5% (20) 6% (17) 8% (13)
Curren
t IN Ren
tper Bu.
35% of G
&I N
ewAv
g. Corn Price = $1.61
LastYear's
IN Ren
tper Bu.
Still room for averages to move higher ‐‐ but sales over $10,000/acre?$12,000 per acre!?!!?

What Do Landowners Think? • Current values are dependent upon continuation of low interest rates and high farm returns over variable costs
• Conducted and internet survey in Spring 2012– What do farmland investors think about future
• Farmland prices• Cash rents• Crop prices

The Respondents• Individuals in CCA database
with interest in farmland and farming
• 246 complete responses (28%)• 73% owned farmland• 74% want to purchase more
farmland in the next 5 years• Median acres
– owned = 500– rented from others = 1,200– rented to others = 240


Respondents asked to consider:80 Acres of Farmland with a production capability of 165 bushels of corn per acre under normal rain‐fed conditions


On average, respondents expect similar multiples in the future

$0.00
$1.00
$2.00
$3.00
$4.00
$5.00
$6.00
$7.00
$8.00
$9.00
$10.00
$11.00
$12.00
1 5 9 13 17 21 25 29 33 37 41 45 49 53 57 61 65 69 73 77 81 85 89 93 97 101105109113117121125129133137141145149153157161165169173177181185189
$'s pe
r Bushe
l
Respondents
Distribution of Expected Average Cash Corn Prices Over the Next 5 Years, 189 Farmland Value Survey Respondents
There is a 1 in 10 chance the average corn price will be less than: The average corn price will most likely be:There is a 1 in 10 chance the average corn price will be greater than:
Box captures I&G’s corn price range
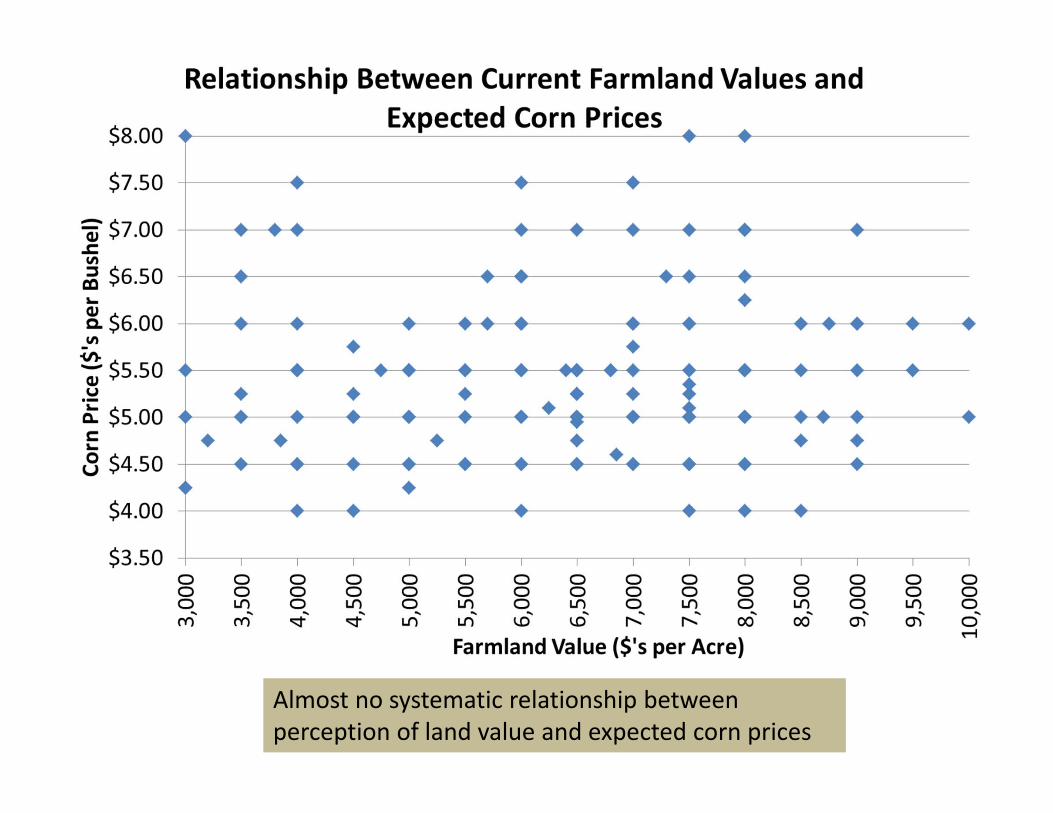
Almost no systematic relationship between perception of land value and expected corn prices

Most would use some debt to fund additional purchases

Summary• Price increases are on par with most dramatic seen in the last 50 years
• Prices clearly reflect view that returns over variable costs stay high and rates stay low
• It is unlikely that farmland fits the classic economic definition of a bubble, but this does not rule out the possibility that prices could fall substantially
• Negative demand shock would create significant pressure on land prices

SummaryInvestors:• Show cautious optimism about farmland investments• Have some concern that market in a bubble• Appear to be comfortable with multiples approaching 30 ‐‐ expect them to be maintained
• Expect corn prices to exceed $5.00/bu on average• Despite some warning signs investors appear to be rationally evaluating fundamentals
• Those with very optimistic views may push prices higher but there is obvious concern on part of others

Final Thoughts • The credit cycle will start to heat up – there will be significant pressure to finance rising land values – Many farmers have spectacular equity positions– Many new entrants and expansions will take place
• Land market should start to level off – if rates/fundamentals change watch the market closely
Final Thoughts• Tremendous volatility in the ag marketplace• For crop farmers it has been all favorable
– How good are you at managing risk? (It has been easy so far)
– How exposed are you to other’s risk management activities? Volatility creates winners and losers
– How are you managing costs?– What about non‐land capital investment?– When need for operating capital comes it will be substantial and much larger than before the boom

Final Thoughts
• Times in row‐crop are very good– It is conceivable they could get better– It is also conceivable they could be worse – It is very difficult to predict what takes us out of this cycle, but credit can magnify the outcome either way
• How favorable is the current risk/return tradeoff for farmland?


