IJDAR (2013) 16:413–424DOI 10.1007/s10032-012-0194-8
ORIGINAL PAPER
Fast self-generation voting for handwritten Chinese characterrecognition
Yunxue Shao · Chunheng Wang · Baihua Xiao
Received: 20 May 2012 / Revised: 7 October 2012 / Accepted: 11 October 2012 / Published online: 27 October 2012© Springer-Verlag Berlin Heidelberg 2012
Abstract In this paper, a fast self-generation voting methodis proposed for further improving the performance in hand-written Chinese character recognition. In this method, firstly,a set of samples are generated by the proposed fast self-generation method, and then these samples are classifiedby the baseline classifier, and the final recognition result isdetermined by voting from these classification results. Twomethods that are normalization-cooperated feature extractionstrategy and an approximated line density are used for speed-ing up the self-generation method. We evaluate the proposedmethod on the CASIA and CASIA-HWDB1.1 databases.High recognition rate of 98.84 % on the CASIA databaseand 91.17 % on the CASIA-HWDB1.1 database are obtained.These results demonstrate that the proposed method outper-forms the state-of-the-art methods and is useful for practicalapplications.
Keywords Handwritten Chinese character recognition ·Fast self-generation voting · Line density equalization ·Normalization-cooperated feature extraction ·Modified quadratic discriminant function
1 Introduction
The problem of handwritten Chinese character recognition(HCCR) has been investigated over a long time for its
Y. Shao (B) · C. Wang · B. XiaoInstitute of Automation Chinese Academy of Sciences,95 Zhongguancun East Road, 100190 Beijing, Chinae-mail: [email protected]
C. Wange-mail: [email protected]
B. Xiaoe-mail: [email protected]
potential in many applications. Many methods have beenproposed and very high recognition rate has been obtained onmost of the databases. In the character normalization stage,many methods have been proposed to reduce the within-classshape variation, including the nonlinear normalization meth-ods [1–3], the bi-moment method [4] and the pseudo 2Dnormalization method [5]. In feature extraction stage, a largevariety of feature extraction methods are proposed [6]. Thestroke direction feature which can be measured from skeleton[7], chain-code [8] or gradient [9–11] is the most popularlyused due to the high performance and the ease of implemen-tation. Previous studies have shown that the gradient feature[11] outperforms the other stroke direction features and theGabor filter feature [12]. After character normalization andfeature extraction, classifiers based on quadratic discriminantfunctions (QDFs) are usually applied to HCCR. The mostpopular one is the modified quadratic discriminant functions(MQDF1 and MQDF2) proposed by Kimura et al. [8]. TheMQDF improves the generalization performance via replac-ing the eigenvalues in the minor subspace of each class witha constant. Besides MQDF1 and MQDF2, the pseudo Bayesclassifier [13], asymmetric Mahalanobis distance (MD) [14],determinant normalized QDF [15] and MQDF3 [16] are someother improvements of QDF and comparable performance isachieved.
Many pairwise classifiers are proposed for furtherimproving the recognition rate. The compound Mahalanobisfunction (CMF) method, proposed by Suzuki et al. [17],combines pair discrimination measures with classwise Maha-lanobis distance. Gao and Liu [18,19] proposed a LDA-basedcompound distance to discriminate similar character pairs.They showed that under restrictive assumptions, the previ-ous CMF is a special case of the LDA-based compounddistance method. Their experiments demonstrated that theLDA-based compound distance method outperforms the
123
414 Y. Shao et al.
previous CMF methods. Leung and Leung [20] proposedthe critical region analysis method to tackle the problem ofsimilar character classes. Additional features are extractedfrom these critical regions and used to train the similar pair’sclassifier. Xu et al. [21] proposed an average symmetricuncertainty-based critical region selection method, and theyshowed that the critical regions selected by their methodcontain more discriminative information than by the methodproposed in [20]. Shao et al. [22] proposed a self-adaptivecritical region-based method for similar pair discrimination.This method tries to tackle the problem that the criticalregion’s scale and position may change due to the wide vari-ability of writing styles.
The combination of multiple classifiers can overcome thelimitations of individual classifiers and many works havebeen performed on it [23–26]. An effective method whichuses a single classifier to classify multiple deformations ofthe input image and combines the decisions of these defor-mations as the final decision is proposed for handwritten digitrecognition [27,28]. The variations of handwriting digits dueto the writing habits and writing instruments are modeledvia a set of geometric transformations (rotation, slant, per-spective and shrink) and two morphological operations ofdilation and erosion, respectively. However, the variationsof handwriting Chinese character are more complex, andthese variations usually tend to be local; hence, these meth-ods are not suitable for HCCR problem. In this paper, a fastself-generation voting method is proposed for HCCR. Thismethod first generated a set of virtual samples from the inputsample by the proposed fast self-generation method, and thenthe generated samples are classified by the baseline classi-fier, and the final decision is given by voting. For each inputsample x , the center of the generated samples is denotedas cx . Experiment on two similar classes shows that thespace constructed by cx is easier to discriminate by PCA andLDA than the space constructed by x . This partially provesthat the generated samples lie on the original manifold,and the voting from these generated samples is reasonableand effective.
Speeding up of the self-generation method is inspiredby the normalization-cooperated feature extraction (NCFE)[29] method. The NCFE method is proposed for solvingthe problem that nonlinear normalization may deform orig-inal character’s shape and stroke direction. In this paper,we find that not only the stroke direction but also the linedensity can be calculated by the normalization-cooperatedmethod. Two methods that are NCFE strategy and the approx-imated line density are used in the fast self-generationmethod.
Unlike other similar character discrimination methods, theproposed method has a number of desirable properties. Thefirst one is that this method need not determine the confus-ing pairs for training and testing. This makes the proposed
method well adapted to the extension of the classes. Thesecond one is that the proposed method need not extractnew features or to train new classifiers for similar characterdiscrimination. Finally, this method is very effective, easyto implement and suitable for parallel processing. The pro-posed method achieves the best recognition accuracy on theCASIA database. Experimental results show that the pro-posed method is effective and useful for practical appli-cations. The rest of the paper is organized as follows. Anoverview of the recognition system is given in Sect. 2. Thefast self-generation method is proposed in Sect. 3. Section 4presents the voting and the parameter learning method. Theexperimental setup and results are given in Sect. 5. Section 6gives concluding remarks.
2 Overview of the system
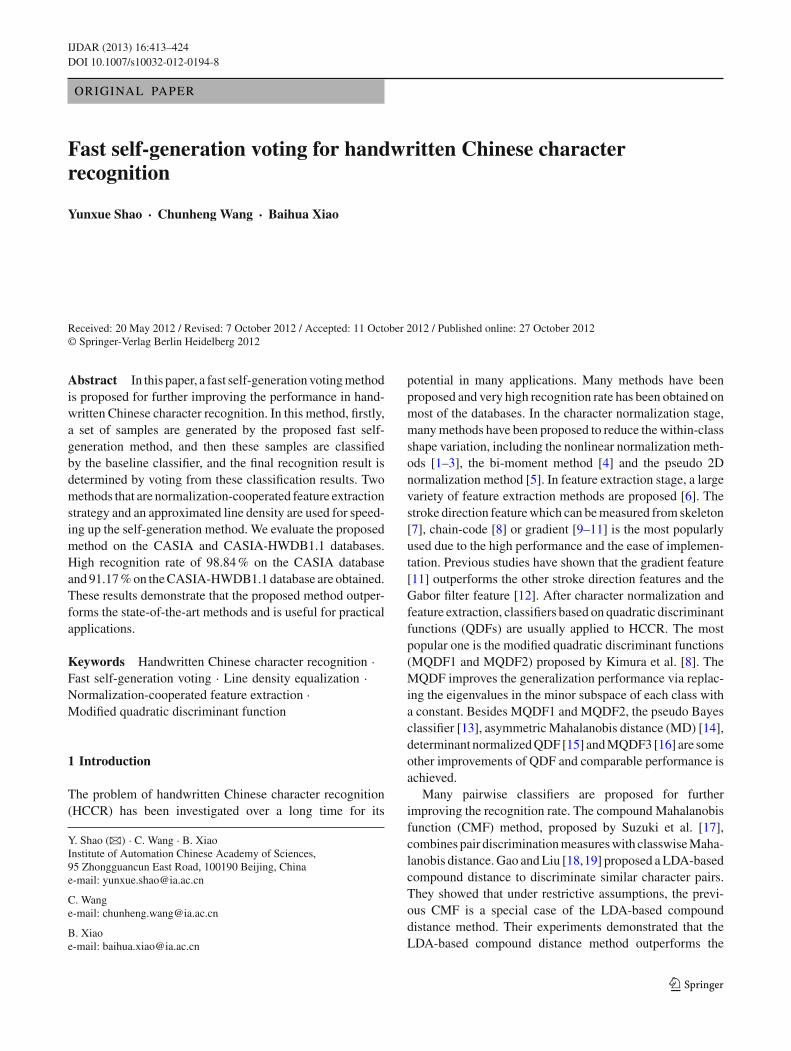
The diagram of the proposed HCCR system is shown inFig. 1. At the training stage, firstly, the proposed fast self-generation (FSG) method is used for extracting Ng fea-ture vectors from each input sample. Then, the Fisherlinear discriminant analysis (LDA) is used for feature dimen-sion reduction. Finally, the class statistics for classifiers arecalculated. In the recognition stage, firstly, FSG is used forextracting feature vectors. Then, a coarse classifier and theMQDF are used to selected Nc candidate classes. Finally, theproposed fast self-generation voting (FSGV) method is usedto give the final recognition result. Details of these meth-ods in this framework will be introduced in the followingsections.
Fig. 1 The framework of the system
123
Fast self-generation voting 415
3 Fast self-generation method
In this section, a short introduction to the self-generationmethod for HCCR is first given in Sect. 3.1. Then, the fastself-generation method is proposed in Sect. 3.2.
3.1 Self-generation method
A distortion model is proposed in [30,31] for generatinga large number of virtual training samples from existingones. The distorted samples are then normalized by a non-linear normalization method, and stroke direction featuresare extracted on the normalized image. Their experimentalresults show that the generated samples are helpful for solv-ing the problem of insufficient training samples. This methodis referred to as the self-generation (SG) method in this paper.
Let I (i, j) be the original character image and D(r, c) bethe distorted image. The distortion is implemented by themapping functions.
{r = u1(i, j) = wn(d1, b1(i)) + k1b2( j) + c1,
c = v1(i, j) = wn(d2, b2( j)) + k2b1(i) + c2,(1)
where k1 and k2 are shearing slopes, d1 and d2 control theextent of local resizing, c1 and c2 are constants to align thecentroid back to the original centroid, b1 and b2 are functionsto linearly scale the original coordinates to the interval [0,1],and wn is a nonlinear warping function for producing localvariations on the size of subpatterns.
In [31], k1 and k2 are randomly picked from [−0.17, 0.17]and [−0.20, 0.20], respectively, d1 �= 0 and d2 �= 0 arerandomly taken from the interval [−1.6, 1.6]. The followingtwo nonlinear warping functions are used for generating morevirtual samples. The probabilities of using w1 and w2 arefixed at 0.8 and 0.2, respectively.
w1(d, t) = 1 − e−dt
1 − e−d, 0 ≤ t ≤ 1, (2)
w2(d, t) ={
0.5w1(d, 2t), 0 ≤ t ≤ 0.5,
0.5 + 0.5w1(−d, 2(t − 0.5)), 0.5 < t ≤ 1,(3)
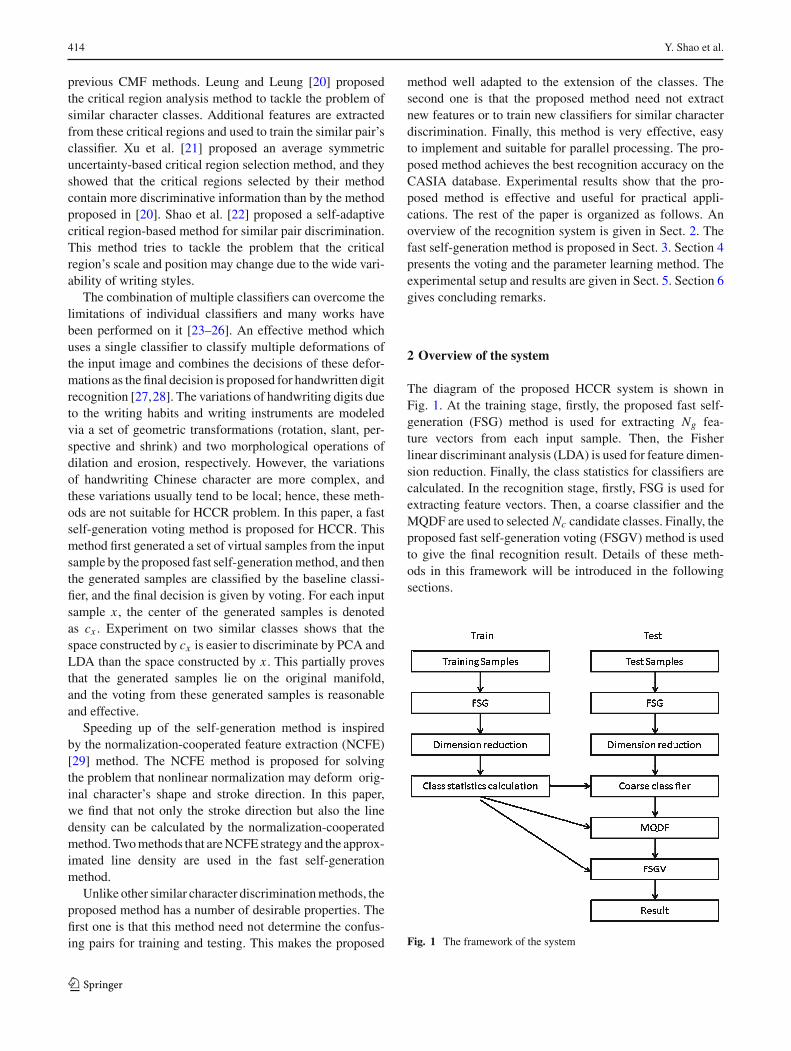
Figure 2 shows some examples of distorted samples. Thefirst column is the original images and the other columns aredistorted images. We can see that the distorted images belongto the same character class with the original one while theshapes are different.
In this paper, the nonlinear normalization method basedon line density equalization [2] is used to normalize the orig-inal and distorted image. Denote the input image and thenormalized image as I (i, j) and N (s, t), respectively. Nor-
Fig. 2 Examples of the distorted character image. The first column isthe original images and the other columns are the distorted images
malization is implemented by coordinate mapping⎧⎪⎪⎪⎨⎪⎪⎪⎩
s = u2(i, j) =i∑
m=0hu(m),
t = v2(i, j) =j∑
m=0hv(m),
(4)
where⎧⎪⎪⎪⎪⎪⎪⎪⎨⎪⎪⎪⎪⎪⎪⎪⎩
hu(m) = 1sum
w∑n=0
ρ(m, n),
hv(m) = 1sum
h∑n=0
ρ(n, m),
sum =h∑
m=0
w∑n=0
ρ(m, n),
(5)
Line intervals Lx along x-direction and L y alongy-direction at (i, j) are computed. The line density ρ is cal-culated as the maximum of the inverse values of Lx and L y .
ρ(i, j) ={
max(W/Lx , W/L y), if Lx + L y < 6W,
0, if Lx + L y ≥ 6W,(6)
where W is the image’s width.On each normalized image N (s, t), the eight-direction
gradient feature [11] is extracted. The gradient at pixel (s, t)is calculated by
⎧⎪⎪⎪⎪⎪⎪⎨⎪⎪⎪⎪⎪⎪⎩
gx (s, t) = N (s + 1, t − 1) + 2N (s + 1, t)+N (s + 1, t + 1) − N (s − 1, t − 1)
−2N (s − 1, t) − N (s − 1, t + 1),
gy(s, t) = N (s − 1, t + 1) + 2N (s, t + 1)
+N (s + 1, t + 1) − N (s − 1, t − 1)
−2N (s, t − 1) − N (s + 1, t − 1),
(7)
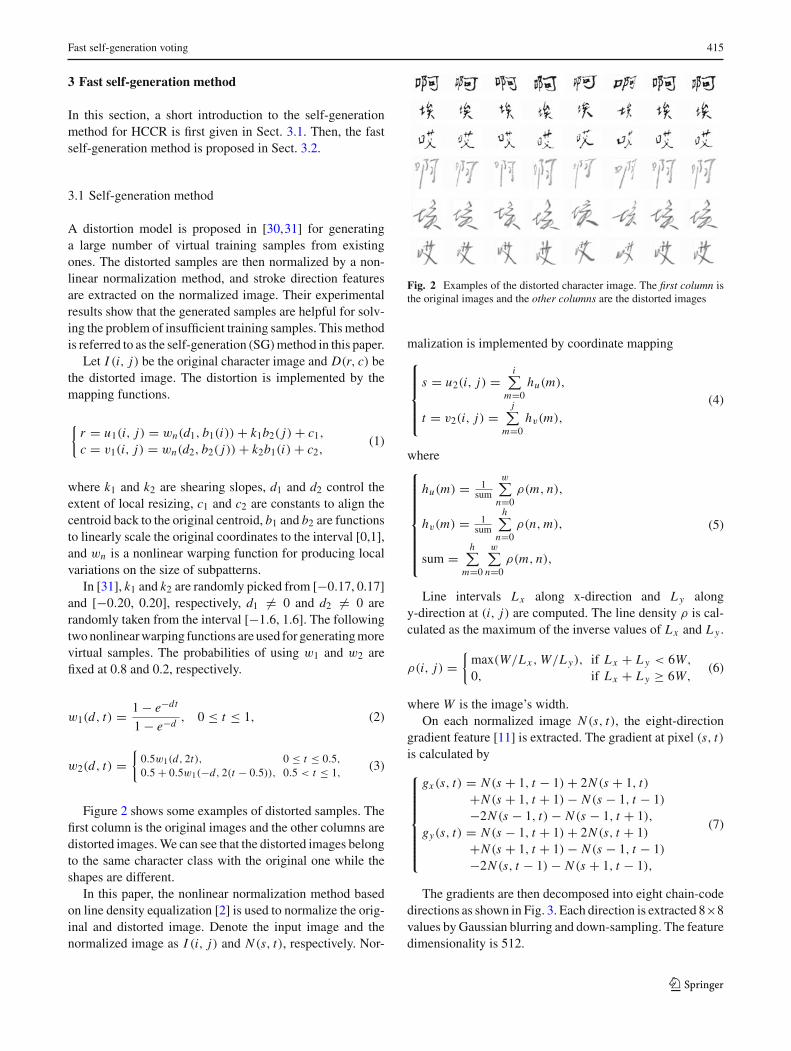
The gradients are then decomposed into eight chain-codedirections as shown in Fig. 3. Each direction is extracted 8×8values by Gaussian blurring and down-sampling. The featuredimensionality is 512.
123
416 Y. Shao et al.
Fig. 3 Decomposition of gradient vector
3.2 Fast self-generation method
Suppose we need to generate Ng samples, the time usedby the self-generation method described in Sect. 3.1 isT1 ∗ Ng , where T1 is the time needed to generate one sam-ple. As we can see from the experiments, this method isvery time consuming. In this paper, the proposed fast self-generation method tries to find the relationships between theNg samples to reduce the generation time. Speeding up ofthe self-generation method is inspired by the normalization-cooperated feature extraction (NCFE) method. The NCFEmethod is proposed in [29] for solving the problem that non-linear normalization may deform original character’s shapeand stroke direction. This method can extract orientation fea-tures whose orientations are not distorted by the nonlinearnormalization but whose locations are adjusted by it.
Denote I (i, j) as the input image and N (s, t) as thenormalized image. Nonlinear mapping functions are s =u2(i, j), t = v2(i, j). The nonlinear mapping may changethe gradient of N (s, t). In the NCFE strategy, however, thegradient of the normalized image ( ∂ N
∂x , ∂ N∂y ) can be calculated
by the gradient of the input image ( ∂ I∂x , ∂ I
∂y ).{∂ N∂x (s, t) = ∂ I
∂x (i, j),
∂ N∂y (s, t) = ∂ I
∂y (i, j),(8)
In the self-generation method, for each input imageI (i, j), the distorted image D(r, c) is calculated by the non-linear mapping function s = u1(i, j), t = v1(i, j) which isdefined in Eq. 1. The NCFE method can be used to calculatethe gradient of the distorted image from the gradient of theinput image. Similarly, the gradient of the normalized imageN (s, t) can be calculated by the gradient of the distortedimage. Joining these two steps together, the gradient of thenormalized image can be calculated by the gradient of theinput image directly. Denote the input image’s eight orienta-tion planes as G I {G I
1, . . . , G I8}, the distorted image’s eight
orientation planes as G D{G D1 , . . . , G D
8 } and the normalizedimage’s eight orientation planes as G N {G N
1 , . . . , G N8 }. The
orientation planes are calculated by the decomposition of thegradient. Therefore, the orientation planes of the normalizedimages can be calculated by the orientation planes of theinput image directly.
In the mapping from the input image to the distortedimage, G D is calculated by
G Dm (r, c) = G I
m(i, j), m = 1, . . . , 8, (9)
where{r = u1(i, j) = wn(d1, b1(i)) + k1b2( j) + c1,
c = v1(i, j) = wn(d2, b2( j)) + k2b1(i) + c2,(10)
The distortion mapping functions u1 and v1 are only deter-mined by the parameter set p{d1, d2, k1, k2, wn}. Therefore,lookup tables LTi (r, c) and LTj (r, c) for each parameter setp can be designed for calculating the orientation planes ofthe distorted image quickly.{
i = LTi (r, c),j = LTj (r, c),
(11)
The lookup tables LTi (r, c) and LTj (r, c) can be seen as thereverse function of u1 and v1 and can be calculated by Eq. 10.From Eqs. 9 and 11, the orientation planes of the distortedimage can be calculated quickly by the lookup tables.
G Dm (r, c) = G I
m(LTr (r, c), LTc(r, c)), m = 1, . . . , 8,
(12)
In the mapping from the distorted image to the normalizedimage, G N can be calculated by
G Nm (s, t) = G D
m (u2(s, t), v2(s, t)), m = 1, . . . , 8, (13)
where the mapping functions u2 and v2 are the nonlinearnormalization mapping functions defined in Eq. 4. JoiningEqs. 12 and 13 together, we get
G Nm (s, t) = G D
m (u2(s, t), v2(s, t))
= G Im(LTr (u2(s, t), v2(s, t)),
LTc(u2(s, t), v2(s, t))), m = 1, . . . , 8, (14)
For mapping from the normalized direction planes G Nm to
the input direction planes G Im directly, the nonlinear map-
ping functions u2(s, t) and v2(s, t) need to be computedfirst according to the predefined lookup tables LTr (r, c) andLTc(r, c), which means that the line density of each distortedimage needs to be computed. The nonlinear normalizedmethod used in this paper uses the line interval alongx-direction (Lx ) and y-direction (L y) to approximate thediameter of the inscribed circle at each point. And the linedensity ρ is calculated as the maximum of the inverse valuesof Lx and L y . In this paper, we assume that the line densityat location (i, j) is not changed too much after it is mappedto (r, c) by the distortion. This assumption is based on thestatistics of the line density on the CASIA databases.
123
Fast self-generation voting 417
Denote ρI (i, j) and ρD(r, c) as the line density of the inputimage and distorted image, respectively. We want to use theρ′
D(r, c) to approximate ρD(r, c). ρ′D(r, c) is calculated by
ρ′D(r, c) = ρI (LTi (r, c), LTj (r, c)), (15)
Define ε(r, c) as the rate of change of the line density at (r, c)
ε(r, c) =∣∣∣∣ρ
′D(r, c) − ρD(r, c)
ρ′D(r, c) + ρD(r, c)
∣∣∣∣ , (16)
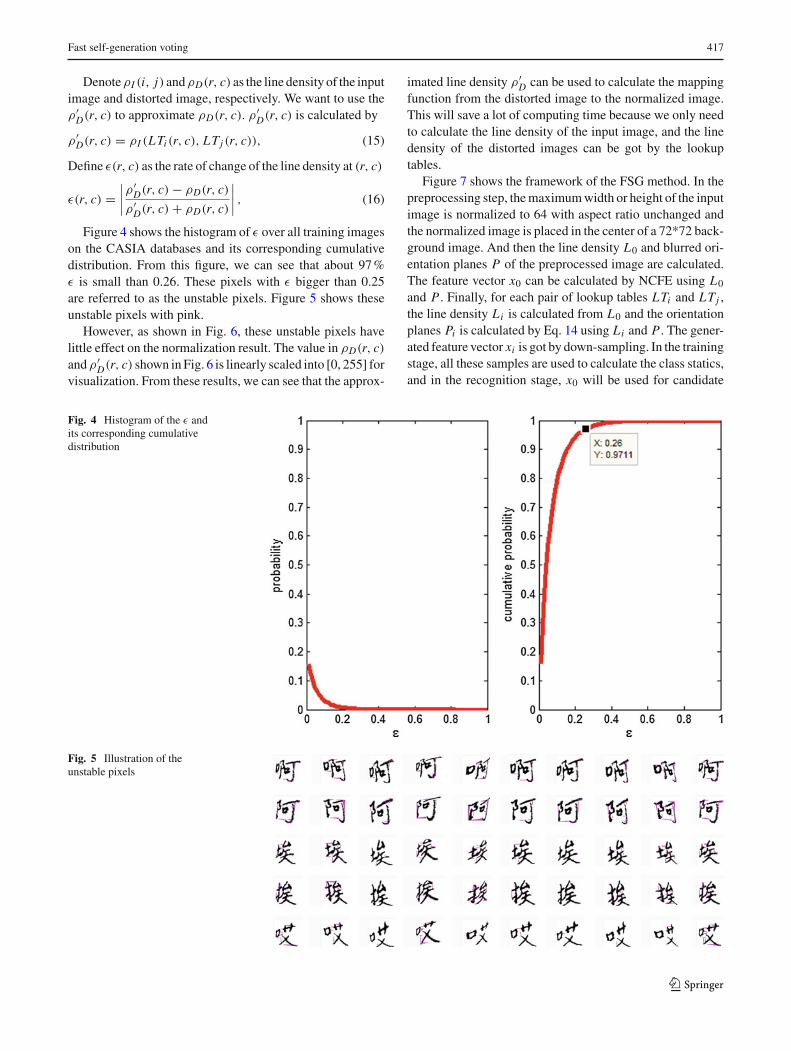
Figure 4 shows the histogram of ε over all training imageson the CASIA databases and its corresponding cumulativedistribution. From this figure, we can see that about 97 %ε is small than 0.26. These pixels with ε bigger than 0.25are referred to as the unstable pixels. Figure 5 shows theseunstable pixels with pink.
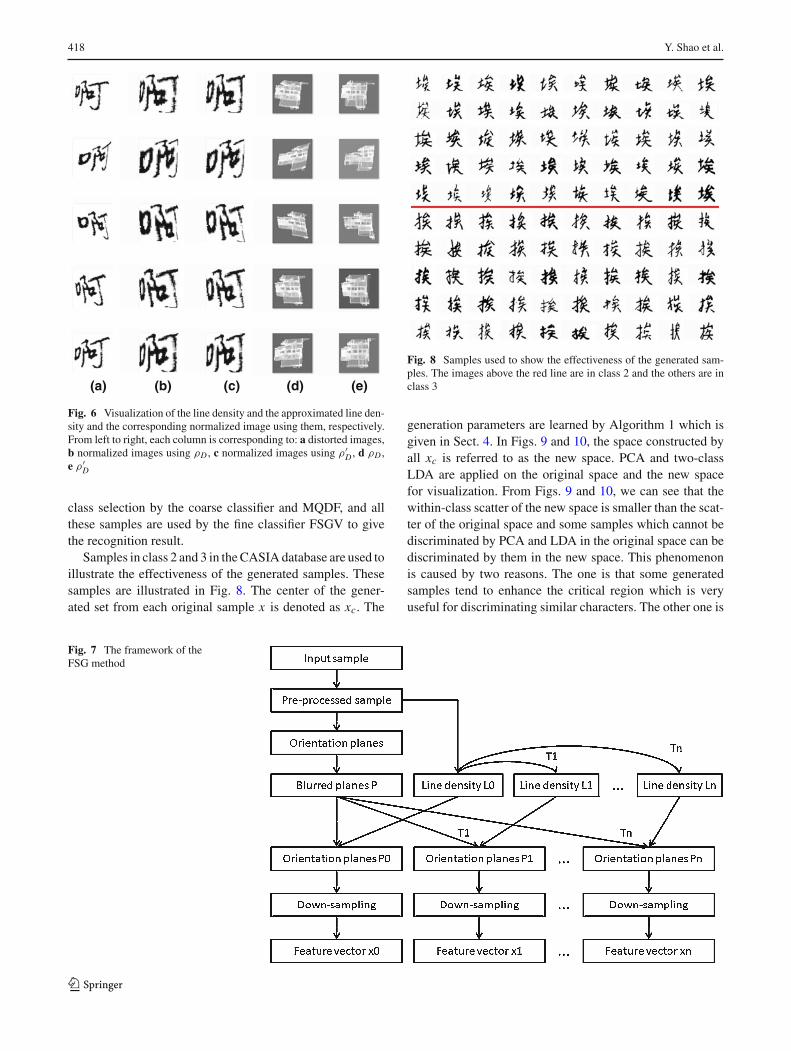
However, as shown in Fig. 6, these unstable pixels havelittle effect on the normalization result. The value in ρD(r, c)and ρ′
D(r, c) shown in Fig. 6 is linearly scaled into [0, 255] forvisualization. From these results, we can see that the approx-
imated line density ρ′D can be used to calculate the mapping
function from the distorted image to the normalized image.This will save a lot of computing time because we only needto calculate the line density of the input image, and the linedensity of the distorted images can be got by the lookuptables.
Figure 7 shows the framework of the FSG method. In thepreprocessing step, the maximum width or height of the inputimage is normalized to 64 with aspect ratio unchanged andthe normalized image is placed in the center of a 72*72 back-ground image. And then the line density L0 and blurred ori-entation planes P of the preprocessed image are calculated.The feature vector x0 can be calculated by NCFE using L0
and P . Finally, for each pair of lookup tables LTi and LTj ,the line density Li is calculated from L0 and the orientationplanes Pi is calculated by Eq. 14 using Li and P . The gener-ated feature vector xi is got by down-sampling. In the trainingstage, all these samples are used to calculate the class statics,and in the recognition stage, x0 will be used for candidate
Fig. 4 Histogram of the ε andits corresponding cumulativedistribution
Fig. 5 Illustration of theunstable pixels
123
418 Y. Shao et al.
(a) (b) (c) (d) (e)
Fig. 6 Visualization of the line density and the approximated line den-sity and the corresponding normalized image using them, respectively.From left to right, each column is corresponding to: a distorted images,b normalized images using ρD , c normalized images using ρ′
D , d ρD ,e ρ′
D
class selection by the coarse classifier and MQDF, and allthese samples are used by the fine classifier FSGV to givethe recognition result.
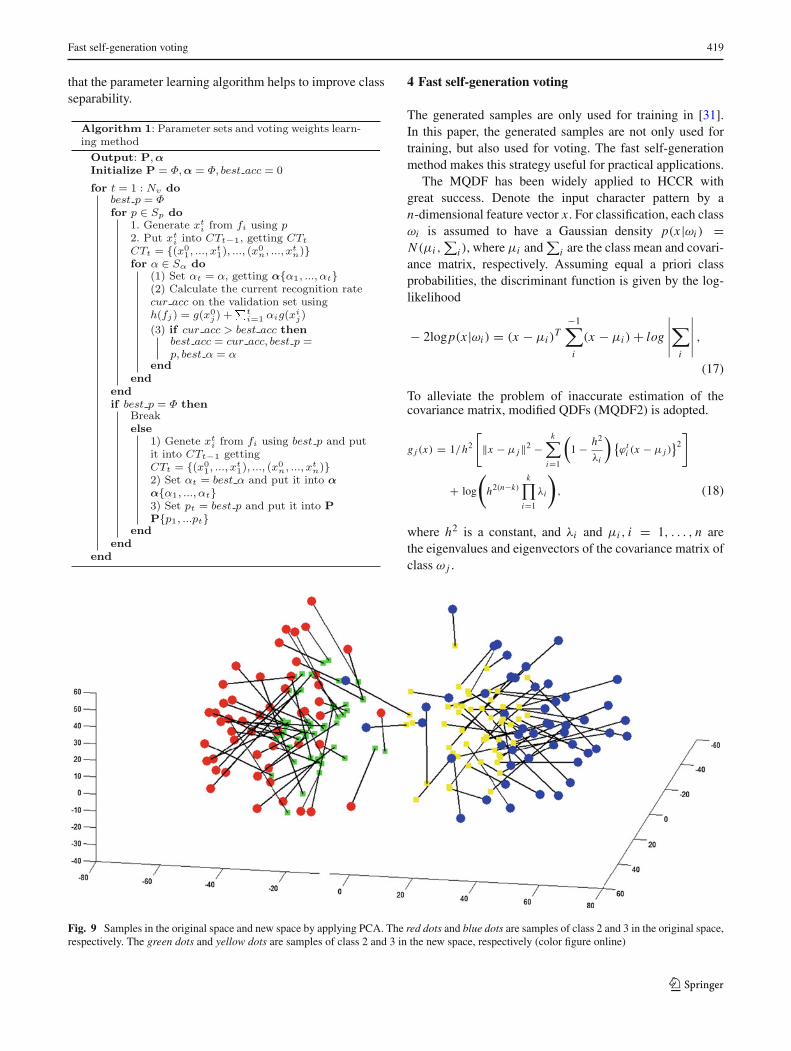
Samples in class 2 and 3 in the CASIA database are used toillustrate the effectiveness of the generated samples. Thesesamples are illustrated in Fig. 8. The center of the gener-ated set from each original sample x is denoted as xc. The
Fig. 8 Samples used to show the effectiveness of the generated sam-ples. The images above the red line are in class 2 and the others are inclass 3
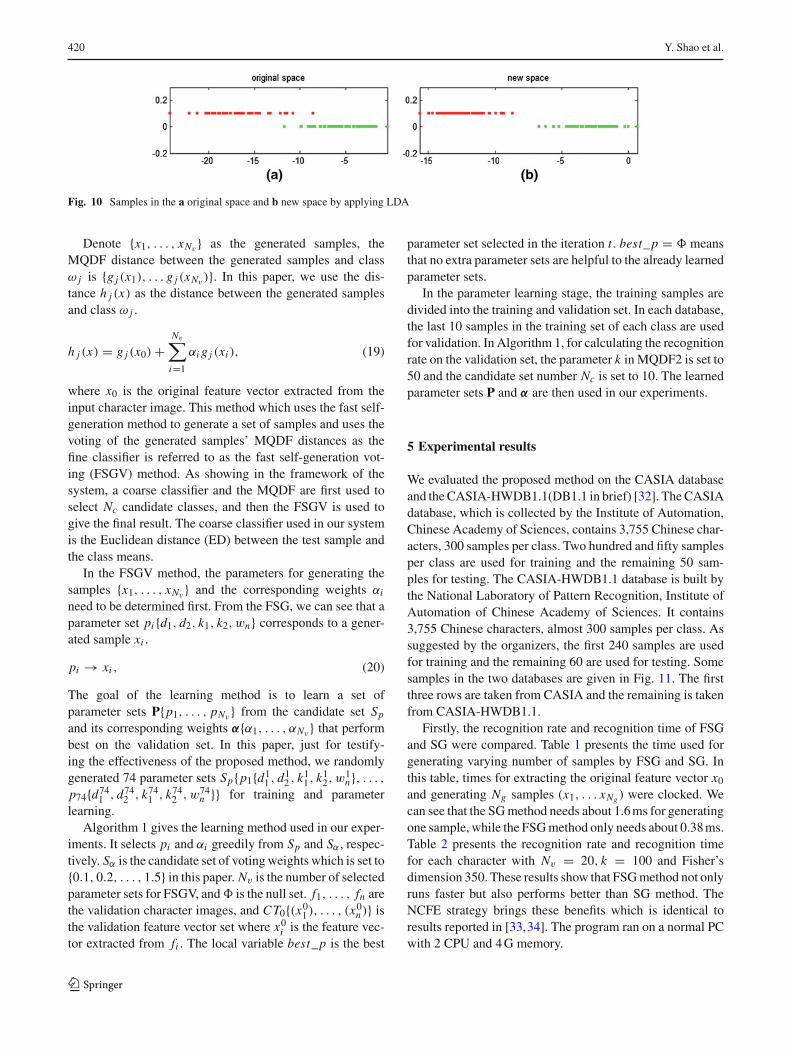
generation parameters are learned by Algorithm 1 which isgiven in Sect. 4. In Figs. 9 and 10, the space constructed byall xc is referred to as the new space. PCA and two-classLDA are applied on the original space and the new spacefor visualization. From Figs. 9 and 10, we can see that thewithin-class scatter of the new space is smaller than the scat-ter of the original space and some samples which cannot bediscriminated by PCA and LDA in the original space can bediscriminated by them in the new space. This phenomenonis caused by two reasons. The one is that some generatedsamples tend to enhance the critical region which is veryuseful for discriminating similar characters. The other one is
Fig. 7 The framework of theFSG method
123
Fast self-generation voting 419
that the parameter learning algorithm helps to improve classseparability.
4 Fast self-generation voting
The generated samples are only used for training in [31].In this paper, the generated samples are not only used fortraining, but also used for voting. The fast self-generationmethod makes this strategy useful for practical applications.
The MQDF has been widely applied to HCCR withgreat success. Denote the input character pattern by an-dimensional feature vector x . For classification, each classωi is assumed to have a Gaussian density p(x |ωi ) =N (μi ,
∑i ), where μi and
∑i are the class mean and covari-
ance matrix, respectively. Assuming equal a priori classprobabilities, the discriminant function is given by the log-likelihood
− 2logp(x |ωi ) = (x − μi )T
−1∑i
(x − μi ) + log
∣∣∣∣∣∑
i
∣∣∣∣∣ ,(17)
To alleviate the problem of inaccurate estimation of thecovariance matrix, modified QDFs (MQDF2) is adopted.
g j (x) = 1/h2
[‖x − μ j ‖2 −
k∑i=1
(1 − h2
λi
) {ϕt
i (x − μ j )}2
]
+ log
(h2(n−k)
k∏i=1
λi
), (18)
where h2 is a constant, and λi and μi , i = 1, . . . , n arethe eigenvalues and eigenvectors of the covariance matrix ofclass ω j .
Fig. 9 Samples in the original space and new space by applying PCA. The red dots and blue dots are samples of class 2 and 3 in the original space,respectively. The green dots and yellow dots are samples of class 2 and 3 in the new space, respectively (color figure online)
123
420 Y. Shao et al.
Fig. 10 Samples in the a original space and b new space by applying LDA
Denote {x1, . . . , xNv } as the generated samples, theMQDF distance between the generated samples and classω j is {g j (x1), . . . g j (xNv )}. In this paper, we use the dis-tance h j (x) as the distance between the generated samplesand class ω j .
h j (x) = g j (x0) +Nv∑
i=1
αi g j (xi ), (19)
where x0 is the original feature vector extracted from theinput character image. This method which uses the fast self-generation method to generate a set of samples and uses thevoting of the generated samples’ MQDF distances as thefine classifier is referred to as the fast self-generation vot-ing (FSGV) method. As showing in the framework of thesystem, a coarse classifier and the MQDF are first used toselect Nc candidate classes, and then the FSGV is used togive the final result. The coarse classifier used in our systemis the Euclidean distance (ED) between the test sample andthe class means.
In the FSGV method, the parameters for generating thesamples {x1, . . . , xNv } and the corresponding weights αi
need to be determined first. From the FSG, we can see that aparameter set pi {d1, d2, k1, k2, wn} corresponds to a gener-ated sample xi .
pi → xi , (20)
The goal of the learning method is to learn a set ofparameter sets P{p1, . . . , pNv } from the candidate set Sp
and its corresponding weights α{α1, . . . , αNv } that performbest on the validation set. In this paper, just for testify-ing the effectiveness of the proposed method, we randomlygenerated 74 parameter sets Sp{p1{d1
1 , d12 , k1
1, k12, w1
n}, . . . ,p74{d74
1 , d742 , k74
1 , k742 , w74
n }} for training and parameterlearning.
Algorithm 1 gives the learning method used in our exper-iments. It selects pi and αi greedily from Sp and Sα , respec-tively. Sα is the candidate set of voting weights which is set to{0.1, 0.2, . . . , 1.5} in this paper. Nv is the number of selectedparameter sets for FSGV, and is the null set. f1, . . . , fn arethe validation character images, and CT0{(x0
1 ), . . . , (x0n )} is
the validation feature vector set where x0i is the feature vec-
tor extracted from fi . The local variable best_p is the best
parameter set selected in the iteration t . best_p = meansthat no extra parameter sets are helpful to the already learnedparameter sets.
In the parameter learning stage, the training samples aredivided into the training and validation set. In each database,the last 10 samples in the training set of each class are usedfor validation. In Algorithm 1, for calculating the recognitionrate on the validation set, the parameter k in MQDF2 is set to50 and the candidate set number Nc is set to 10. The learnedparameter sets P and α are then used in our experiments.
5 Experimental results
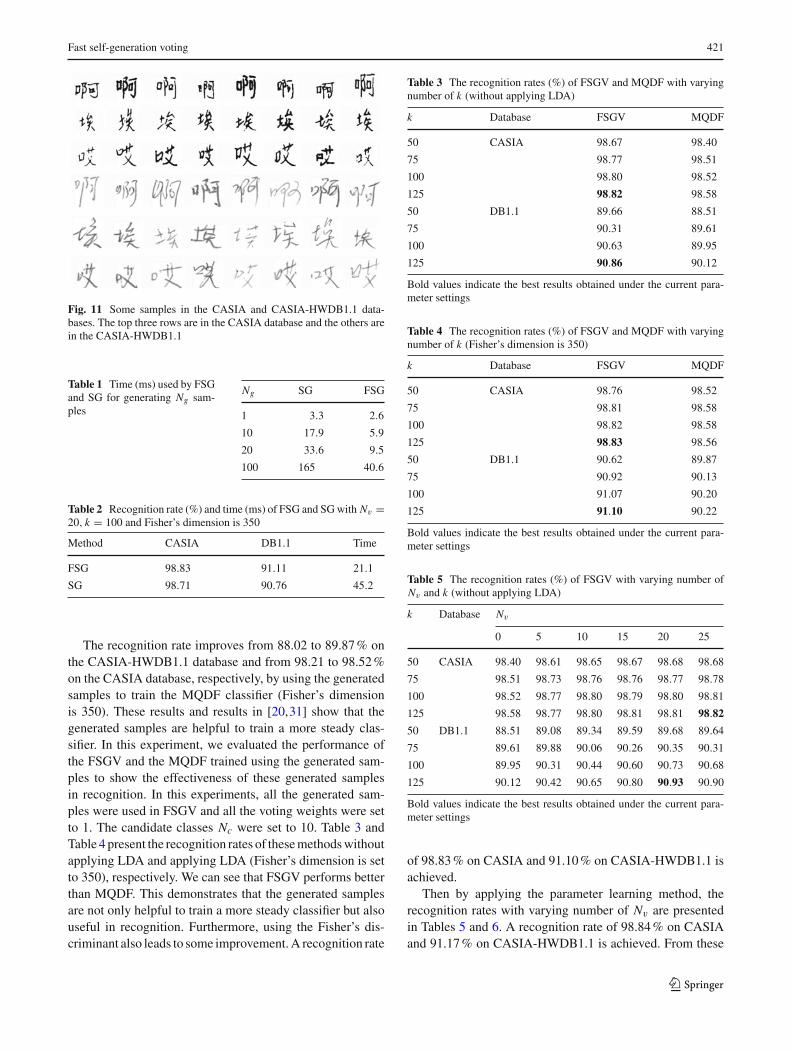
We evaluated the proposed method on the CASIA databaseand the CASIA-HWDB1.1(DB1.1 in brief) [32]. The CASIAdatabase, which is collected by the Institute of Automation,Chinese Academy of Sciences, contains 3,755 Chinese char-acters, 300 samples per class. Two hundred and fifty samplesper class are used for training and the remaining 50 sam-ples for testing. The CASIA-HWDB1.1 database is built bythe National Laboratory of Pattern Recognition, Institute ofAutomation of Chinese Academy of Sciences. It contains3,755 Chinese characters, almost 300 samples per class. Assuggested by the organizers, the first 240 samples are usedfor training and the remaining 60 are used for testing. Somesamples in the two databases are given in Fig. 11. The firstthree rows are taken from CASIA and the remaining is takenfrom CASIA-HWDB1.1.
Firstly, the recognition rate and recognition time of FSGand SG were compared. Table 1 presents the time used forgenerating varying number of samples by FSG and SG. Inthis table, times for extracting the original feature vector x0
and generating Ng samples (x1, . . . xNg ) were clocked. Wecan see that the SG method needs about 1.6 ms for generatingone sample, while the FSG method only needs about 0.38 ms.Table 2 presents the recognition rate and recognition timefor each character with Nv = 20, k = 100 and Fisher’sdimension 350. These results show that FSG method not onlyruns faster but also performs better than SG method. TheNCFE strategy brings these benefits which is identical toresults reported in [33,34]. The program ran on a normal PCwith 2 CPU and 4 G memory.
123
Fast self-generation voting 421
Fig. 11 Some samples in the CASIA and CASIA-HWDB1.1 data-bases. The top three rows are in the CASIA database and the others arein the CASIA-HWDB1.1
Table 1 Time (ms) used by FSGand SG for generating Ng sam-ples
Ng SG FSG
1 3.3 2.6
10 17.9 5.9
20 33.6 9.5
100 165 40.6
Table 2 Recognition rate (%) and time (ms) of FSG and SG with Nv =20, k = 100 and Fisher’s dimension is 350
Method CASIA DB1.1 Time
FSG 98.83 91.11 21.1
SG 98.71 90.76 45.2
The recognition rate improves from 88.02 to 89.87 % onthe CASIA-HWDB1.1 database and from 98.21 to 98.52 %on the CASIA database, respectively, by using the generatedsamples to train the MQDF classifier (Fisher’s dimensionis 350). These results and results in [20,31] show that thegenerated samples are helpful to train a more steady clas-sifier. In this experiment, we evaluated the performance ofthe FSGV and the MQDF trained using the generated sam-ples to show the effectiveness of these generated samplesin recognition. In this experiments, all the generated sam-ples were used in FSGV and all the voting weights were setto 1. The candidate classes Nc were set to 10. Table 3 andTable 4 present the recognition rates of these methods withoutapplying LDA and applying LDA (Fisher’s dimension is setto 350), respectively. We can see that FSGV performs betterthan MQDF. This demonstrates that the generated samplesare not only helpful to train a more steady classifier but alsouseful in recognition. Furthermore, using the Fisher’s dis-criminant also leads to some improvement. A recognition rate
Table 3 The recognition rates (%) of FSGV and MQDF with varyingnumber of k (without applying LDA)
k Database FSGV MQDF
50 CASIA 98.67 98.40
75 98.77 98.51
100 98.80 98.52
125 98.82 98.58
50 DB1.1 89.66 88.51
75 90.31 89.61
100 90.63 89.95
125 90.86 90.12
Bold values indicate the best results obtained under the current para-meter settings
Table 4 The recognition rates (%) of FSGV and MQDF with varyingnumber of k (Fisher’s dimension is 350)
k Database FSGV MQDF
50 CASIA 98.76 98.52
75 98.81 98.58
100 98.82 98.58
125 98.83 98.56
50 DB1.1 90.62 89.87
75 90.92 90.13
100 91.07 90.20
125 91.10 90.22
Bold values indicate the best results obtained under the current para-meter settings
Table 5 The recognition rates (%) of FSGV with varying number ofNv and k (without applying LDA)
k Database Nv
0 5 10 15 20 25
50 CASIA 98.40 98.61 98.65 98.67 98.68 98.68
75 98.51 98.73 98.76 98.76 98.77 98.78
100 98.52 98.77 98.80 98.79 98.80 98.81
125 98.58 98.77 98.80 98.81 98.81 98.82
50 DB1.1 88.51 89.08 89.34 89.59 89.68 89.64
75 89.61 89.88 90.06 90.26 90.35 90.31
100 89.95 90.31 90.44 90.60 90.73 90.68
125 90.12 90.42 90.65 90.80 90.93 90.90
Bold values indicate the best results obtained under the current para-meter settings
of 98.83 % on CASIA and 91.10 % on CASIA-HWDB1.1 isachieved.
Then by applying the parameter learning method, therecognition rates with varying number of Nv are presentedin Tables 5 and 6. A recognition rate of 98.84 % on CASIAand 91.17 % on CASIA-HWDB1.1 is achieved. From these
123
422 Y. Shao et al.
Table 6 The recognition rates (%) of FSGV with varying number ofNv and k (Fisher’s dimension is 350)
k Database Nv
0 5 10 15 20 25
50 CASIA 98.52 98.71 98.75 98.77 98.78 98.77
75 98.58 98.76 98.80 98.82 98.83 98.83
100 98.58 98.77 98.81 98.82 98.83 98.84
125 98.56 98.77 98.81 98.82 98.82 98.83
50 DB1.1 89.87 90.39 90.49 90.60 90.71 90.70
75 90.13 90.65 90.74 90.92 91.04 91.05
100 90.20 90.71 90.85 91.02 91.11 91.11
125 90.22 90.74 90.91 91.05 91.17 91.15
Bold values indicate the best results obtained under the current para-meter settings
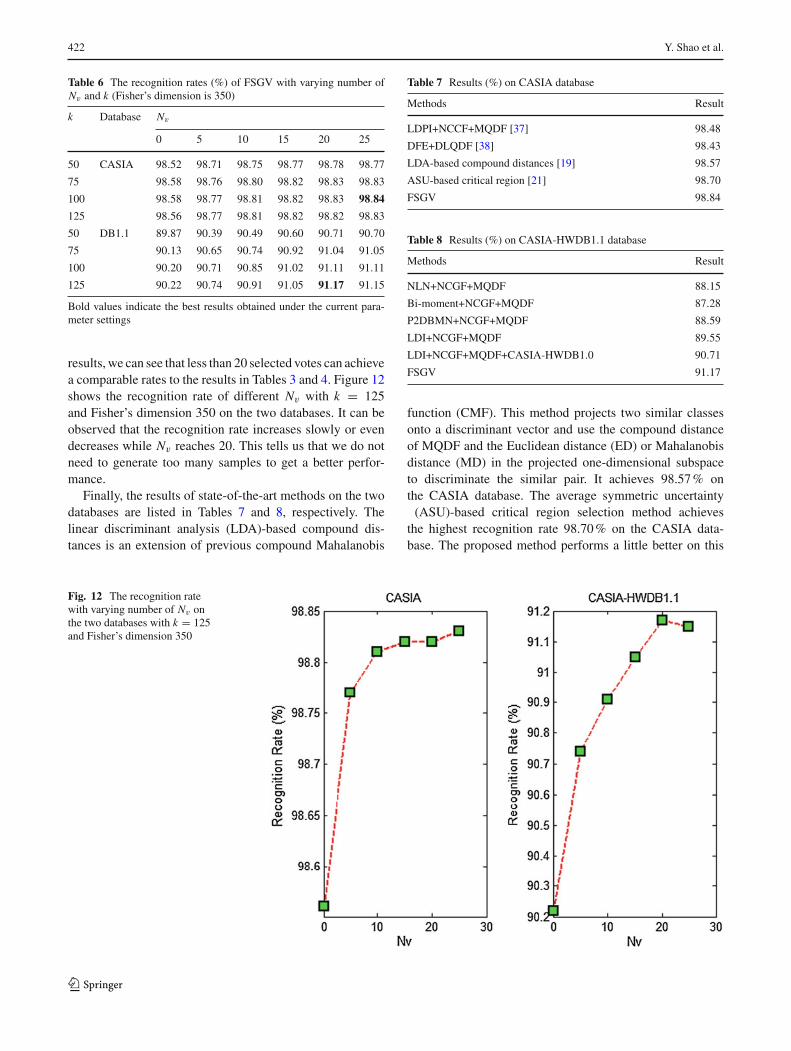
results, we can see that less than 20 selected votes can achievea comparable rates to the results in Tables 3 and 4. Figure 12shows the recognition rate of different Nv with k = 125and Fisher’s dimension 350 on the two databases. It can beobserved that the recognition rate increases slowly or evendecreases while Nv reaches 20. This tells us that we do notneed to generate too many samples to get a better perfor-mance.
Finally, the results of state-of-the-art methods on the twodatabases are listed in Tables 7 and 8, respectively. Thelinear discriminant analysis (LDA)-based compound dis-tances is an extension of previous compound Mahalanobis
Table 7 Results (%) on CASIA database
Methods Result
LDPI+NCCF+MQDF [37] 98.48
DFE+DLQDF [38] 98.43
LDA-based compound distances [19] 98.57
ASU-based critical region [21] 98.70
FSGV 98.84
Table 8 Results (%) on CASIA-HWDB1.1 database
Methods Result
NLN+NCGF+MQDF 88.15
Bi-moment+NCGF+MQDF 87.28
P2DBMN+NCGF+MQDF 88.59
LDI+NCGF+MQDF 89.55
LDI+NCGF+MQDF+CASIA-HWDB1.0 90.71
FSGV 91.17
function (CMF). This method projects two similar classesonto a discriminant vector and use the compound distanceof MQDF and the Euclidean distance (ED) or Mahalanobisdistance (MD) in the projected one-dimensional subspaceto discriminate the similar pair. It achieves 98.57 % onthe CASIA database. The average symmetric uncertainty
(ASU)-based critical region selection method achievesthe highest recognition rate 98.70 % on the CASIA data-base. The proposed method performs a little better on this
Fig. 12 The recognition ratewith varying number of Nv onthe two databases with k = 125and Fisher’s dimension 350
123
Fast self-generation voting 423
database, with the best recognition rate 98.84 % on thisdatabase. In paper [33], some state-of-the-art methods areevaluated on the CASIA-HWDB1.1, which establishes abenchmark for further research. The implemented meth-ods include advanced character normalization methods [5],feature extraction methods [11,34], as well as classifierdesign methods [8,35,36]. These results are cited from [33].CASIA-HWDB1.0 is another database released at the sametime with CASIA-HWDB1.1. The accuracy on the test setof CASIA-HWDB1.1 is further improved from 89.55 to90.71 % using merged training data of databases CASIA-HWDB1.0 and CASIA-HWDB1.1. The proposed methodobtains a recognition rate of 91.17 % on this database; how-ever, the recognition performance on this database reveals abig challenge to attack.
6 Conclusion
A fast self-generation voting method is proposed for furtherimproving the recognition rate in handwritten Chinese char-acter recognition. In this method, firstly, a set of samplesare generated by the proposed fast self-generation method,and then these samples are classified by the baseline classi-fier, and the final recognition result is determined by votingfrom these classification results. The proposed method wasevaluated on the CASIA and CASIA-HWDB1.1 databases.A high recognition rate of 98.84 % on CASIA and 91.17 %on CASIA-HWDB1.1 is obtained. These results demonstratethat the proposed method is effective and useful for practicalapplications.
In our future work, three aspects will be concerned: firstly,other normalization methods will be tried to add into thefast self-generation framework to check which is better. Sec-ondly, in our experiments, the candidate parameter set Sp
was randomly selected, and we will try to determine the bestcombination of these parameters. Finally, the self-generationmethod in this paper is unsupervised, and the supervised self-generation method will be concerned.
Acknowledgments We would like to express our sincere apprecia-tion to the anonymous reviewers for their insightful comments, whichhave greatly aided us in improving the quality of the paper. Thiswork was supported by National Natural Science Foundation of China(61172103,60933010,60835001).
References
1. Tsukumo, J., Tanaka, H.: Classification of handprinted Chinesecharacters using nonlinear normalization and correlation methods.In: Proceedings of the International Conference on, Pattern Recog-nition, pp. 168–171 (1988)
2. Yamada, H., Yamamoto, K., Saito, T.: A nonlinear normalizationmethod for handprinted Kanji character recognition-line densityequalization. Pattern Recognit. 23(9), 1023–1029 (1990)
3. Horiuchi, T., Haruki, R., Yamada, H., Yamamoto, K.: Two-dimensional extension of nonlinear normalization method usingline density for character recognition. In: Proceedings of theInternational Conference on Document Analysis and Recognition,pp. 511–514 (1997)
4. Liu, C.-L., Sako, H., Fujisawa, H.: Handwritten Chinese characterrecognition: alternatives to nonlinear normalization. In: Proceed-ings of the International Conference on Document Analysis andRecognition, pp. 524–528 (2003)
5. Liu, C.-L., Marukawa, K.: Pseudo two dimensional shape nor-malization methods for handwritten Chinese character recognition.Pattern Recognit. 38(12), 2242–2255 (2005)
6. Trier, O.D., Jain, A.K., Taxt, T.: Feature extraction methods forcharacter recognition-a survey. Pattern Recognit. 29(4), 641–662(1996)
7. Yasuda, M., Fujisawa, H.: An improvement of correlation methodfor character recognition. Trans. IEICE Jpn. J62–D(3), 217–224(1979)
8. Kimura, F., Takashina, K., Tsuruoka, S., Miyake, Y.: Modifiedquadratic discriminant functions and the application to Chinesecharacter recognition. IEEE Trans. Pattern Anal. Mach. Intell. 9(1),149–153 (1987)
9. Srikantan, G., Lam, S.W., Srihari, S.N.: Gradient-based contourencoder for character recognition. Pattern Recognit. 29(7), 1147–1160 (1996)
10. Shi, M., Fujisawa, Y., Wakabayashi, T., Kimura, F.: Handwrittennumeral recognition using gradient and curvature of gray scaleimage. Pattern Recognit. 35(10), 2051–2059 (2002)
11. Liu, C.-L., Nakashima, K., Sako, H., Fujisawa, H.: Handwrittendigit recognition: investigation of normalization and feature extrac-tion techniques. Pattern Recognit. 37(2), 265–279 (2004)
12. Ding, K., Liu, Z.B., Jin, L.W., Zhu, X.H.: A comparative study ofgabor feature and gradient feature for handwritten chinese charac-ter recognition. in: Proceedings of the International Conferenceon Wavelet Analysis and, Pattern Recognition, pp. 1182–1186(2007)
13. Kimura, F., Wakabayashi, T., Tsuruoka, S., Miyake, Y.: Improve-ment of handwritten Japanese character recognition using weighteddirection code histogram. Pattern Recognit. 30(8), 1329–1337(1997)
14. Kato, N., Suzuki, M., Omachi, S., Aso, H., Nemoto, Y.: A handwrit-ten character recognition system using directional element featureand asymmetric mahalanobis distance. IEEE Trans. Pattern Anal.Mach. Intell. 21(3), 258–262 (1999)
15. Kawatani, T.: Handwritten Kanji recognition with determinant nor-malized quadratic discriminant function. In: Proceedings of theInternational Conference on, Pattern Recognition, pp. 343–346(2000)
16. Liu, C.-L., Sako, H., Fujisawa, H.: Performance evaluation of pat-tern classifiers for handwritten character recognition. Int. J. Docu-ment Anal. Recognit. 4, 191–204 (2002)
17. Suzuki, M., Ohmachi, S., Kato, N., Aso, H., Nemoto, Y.: A discrim-ination method of similar characters using compound Mahalanobisfunction. Trans. IEICE Jpn J80–D–II(10), 2752–2760 (1997)
18. Gao, T.-F., Liu C.-L.: LDA-based compound distance for hand-written Chinese character recognition. In: Proceedings of theInternational Conference on Document Analysis and Recognition,pp. 904–908 (2007)
19. Gao, T.-F., Liu, C.-L.: High accuracy handwritten Chinese char-acter recognition using LDA-based compound distances. PatternRecognit. 41(11), 3442–3451 (2008)
20. Leung, K.C., Leung, C.H.: Recognition of handwritten Chinesecharacters by critical region analysis. Pattern Recognit. 43(3), 949–961 (2010)
21. Xu, B., Huang, K.Z., Liu, C.-L.: Similar handwritten Chinese char-acters recognition by critical region selection based on average
123
424 Y. Shao et al.
symmetric uncertainty. In: Proceedings of the International Confer-ence on Frontiers in Handwriting Recognition, pp. 527–532 (2010)
22. Shao, Y.X., Wang, C.H., Xiao, B.H., Zhang, R.G., Zhang, Y.: Multi-ple instance learning based method for similar handwritten Chinesecharacters discrimination. In: Proceedings of the International Con-ference on Document Analysis and Recognition, pp. 1002–1006(2011)
23. Rahman, A.F.R., Fairhurst, M.C.: Multiple classifier decision com-bination strategies for character recognition: a review. Int. J. Doc-ument Anal. Recognit. 5(4), 166–194 (2003)
24. Xu, L., Krzyzak, A., Suen, C.Y.: Methods of combining multipleclassifiers and their applications to handwriting recognition. IEEETrans. Syst. Man Cybern. 22(3), 418–435 (1992)
25. Kittler, J., Hatef, M., Duin, R.P.W., Matas, J.: On combining clas-sifiers. IEEE Trans. Pattern Anal. Mach. Intell. 20(3), 226–239(1998)
26. Beymer, D., Poggio, T.: Face recognition from one example view.In: Proceedings of the International Conference on ComputerVision, pp. 500–507 (1995)
27. Ha, T., Bunke, H.: On line handwritten numeral recognition byperturbation method. IEEE Trans. Pattern Anal. Mach. Intell. 19(5),535–539 (1997)
28. Dahmen, J., Keysers, D., Ney, H.: Combined classification of hand-written digits using the virtual test sample method. Multiple Clas-sifier Systems, pp. 99–108 (2001)
29. Hamanaka, M., Yamada, K., Tsukumo, J.: Normalization-cooperated feature extraction method for handprinted Kanji char-acter recognition. In: Proceedings of the International Workshopon Frontiers of Handwriting Recognition, pp. 343–348 (1993)
30. Leung, C.-H., Cheung, Y.-S., Chan, K.-P.: A distortion model forChinese character generation. In: Proceedings of the InternationalConference on Systems, Man and, Cybernetics, pp. 38–41 (1985)
31. Leung, K.C., Leung, C.H.: Recognition of handwritten Chinesecharacters by combining regularization, fisher’s discriminant anddistorted sample generation. In: Proceedings of the InternationalConference on Document Analysis and Recognition, pp. 1026–1030 (2009)
32. Liu, C.-L., Yin, F., Wang, D.-H., Wang, Q.-F.: CASIA onlineand offline Chinese handwriting databases. In: Proceedings of theInternational Conference on Document Analysis and Recognition,pp. 37–41 (2011)
33. Liu, C.-L., Yin, F., Wang, D.-H., Wang, Q.-F.: Online and offlinehandwritten Chinese character recognition: benchmarking on newdatabases. Pattern Recognit. 46(1), 155–162 (2013)
34. Liu, C.-L.: Normalization-cooperated gradient feature extractionfor handwritten character recognition. IEEE Trans. Pattern Anal.Mach. Intell. 29(8), 1465–1469 (2007)
35. Liu, C.-L., Mine, R., Koga, M.: Building compact classifier forlarge character set recognition using discriminative feature extrac-tion. In: Proceedings of the International Conference on DocumentAnalysis and Recognition, pp. 846–850 (2005)
36. Jin, X.-B., Liu, C.-L., Hou, X.: Regularized margin-based condi-tional log-likelihood loss for prototype learning. Pattern Recognit.43(7), 2428–2438 (2010)
37. Liu, C.-L.: Handwritten Chinese character recognition: effects ofshape normalization and feature extraction. In: Arabic and ChineseHandwriting Recognition, pp. 104–128 (2008)
38. Liu, C.-L.: High accuracy handwritten Chinese character recogni-tion using quadratic classifiers with discriminative feature extrac-tion. In: Proceedings of the International Conference on, PatternRecognition, pp. 942–945 (2006)
123


