
Feasibility of Capacity Spectrum method for seismic
analysis of concrete bridges for Indian terrain as a step
towards performance based Design Philosophy
Taher S Najmi1 Mayank Desai
2
PG student at SDMCET Dharwad1
Assistant Professor of Applied Mechanics Department at S.V.N.I.T Surat2
[email protected] , [email protected]
2
ABSTRACT
Bridge Structures are of vital importance to our daily activities and economy.
History has shown that such structural systems are vulnerable to earthquakes. Bridge
damage resulting from a significant earthquake could be devastating because casualties
and economical loss are usually large. But they are equally important as residential and
commercial buildings because they are the strategic structures and they serve as passages
and connectors to provide the easy access to the unaffected area for transportation of both
goods and people in post natural calamity needs and emergencies in grief stricken area.
They not only serve as the over-ground paths for crossing the water bodies and valleys,
but they constitute the networked system to connect communities to aid the commerce
and people of the nation.
The principal aim of this study is use the advanced and newly developed analysis
and design procedures. Because this study mainly concentrates on the Seismic safety
aspects of the concrete bridges, it is taken for granted that the bridge under consideration
satisfies all static stress criteria and is serviceable as far as static loading is concerned.
The bridge adopted for the study is safe, serviceable under the condition of no earthquake.
The study carried out here employs implementation of advanced method called Capacity
Spectrum Method as a suggested method for evaluation of the structural capacity of the
bridge for given demand in terms of target displacement posed by Design Basis
Earthquake (DBE) and Maximum Considered Earthquake (MCE). Demand is estimated
both using Response Spectrum and Time History Analyses and Capacity is evaluated
using Nonlinear Static Procedure prescribed in FEMA-273 and ATC-40.
Keywords: Capacity Spectrum Method, Pushover Analysis, Time History Analysis,
DBE, MCE

INTRODUCTION
Bridges give the impression of being rather simple structural systems. Indeed they
have always occupied a special place in the affections of structural designers because
their structural form tends to be a simple expression of their functional requirement. As
such, structural solutions can often be developed that are both functionally efficient and
aesthetically satisfying, as evidenced by the many excellent texts on aesthetic aspects of
bridge design.
Despite, or possibly because of their structural simplicity, bridges in particular
those constructed in reinforced or pre-stressed concrete, have not performed as well as
might be expected under seismic attack. In recent earthquakes in California, Japan, and
Central and South America, modem bridges designed specifically for seismic resistance
have collapsed or have been severely damaged when subjected to ground shaking of an
intensity that has frequently been less than that corresponding to current code intensities.
As will be seen subsequently, this unexpectedly poor performance can in the majority of
cases be attributed to the design philosophy adopted coupled with a lack of attention to
design details. Earthquakes have a habit of identifying structural weaknesses and
concentrating damage at these locations. With building structures, the consequences may
not necessarily be disastrous, because of the high degree of redundancy generally inherent
in building structural systems. This enables alternative load paths to be mobilized if
necessary. Typically, bridges have little or no redundancy in the structural systems. And
failure of one structural element or connection between elements is thus more likely to
result in collapse than is the case with a building. This leads to the above-mentioned
warning that the structural simplicity of bridges may be a mixed blessing. While the
simplicity should lead to greater confidence in the prediction of seismic response, this
also results in greater sensitivity to design errors.
To be able to effectively design either new bridges or retrofit measures for
existing bridges, a clear understanding of potential problem areas is essential. There is no
better way of developing this understanding than by a systematic examination and
categorization of failures and damage that have occurred to bridges in earlier
earthquakes. It has often been said that those who ignore the lessons of history are
doomed to repeat its mistakes. In no area is this truer than in seismic design. It is thus
appropriate, before developing design philosophy or design details, to spend some time
in reviewing past earthquake damage to bridges and common design deficiencies.

Basic Principles of Seismic Design of Concrete Bridges
The newly developed Seismic design of bridges envisages the advanced and more
practical approach to design the bridges which can withstand the earthquake safely for
which it is designed. The newer methodologies of design and analysis procedures have
been implemented to build new bridges and are still being refined to minimize the
earthquake hazards to the bridges. The following are the some of the key points for the
Seismic Design of Bridges:
� Determining the design earthquake(s) for the site
� Determining the seismic hazards at the site
� Determining the seismic demands on the bridge
� Designing and detailing the bridge and its components/elements so that their
capacity meets the performance requirements for the seismic demand.
MODELLING
Software Tools
For modeling and analysis the following software tools are taken help of.
(1) CSI BRIDGE 15 Nonlinear Version (Structural Analysis Program)
A product of
Computers and Structures, Inc.
1995 University Ave, Berkeley,
California.
About CSI BRIDGE 15:
CSI BRIDGE 15 is an eminent and versatile software tool for carrying out the
linear as well as nonlinear finite element analysis of the Bridge. It is equipped with some
of the advanced modeling, analysis and design capabilities. The bridge is modeled using
CSI BRIDGE 15. This software tool is used for Bridge analysis.
DETAILS OF BRIDGE MODEL
The bridge of the following geometry and configuration has been chosen for the
study. The bridge is a simply supported pre stressed concrete box girder bridge
constructed on the medium to hard strata. The bridge is having a total of five equal spans.
The geometry of the bridge along with the necessary span and section data is given on the
following pages. Before modeling the bridge all the sectional properties and required
constants were calculated and are incorporated in model.

FIG 1.1 Cross section details of the Bridge
Table 1.1 Span data
Pier/ Abutment Location (m)
Abutment1 0
Pier1 30
Pier2 60
Pier3 90
Pier4 120
Abutment2 150
FIG 1.2 Isometric View of the Bridge Model

FIG 1.3 Deck Section Details
FIG 1.4 Load case Tree
ANALYSIS
Pushover Analysis:
One such nonlinear static procedure as mentioned above is an analysis called Push
Over analysis. The recent advent of performance based design has brought the nonlinear
static pushover analysis procedure to the forefront. Pushover analysis is a static, nonlinear

procedure in which the magnitude of the structural loading is incrementally increased in
accordance with a certain predefined pattern. With the increase in the magnitude of the
loading, weak links and failure modes of the structure are found. The loading is
monotonic with the effects of the cyclic behavior and load reversals being estimated by
using a modified monotonic force-deformation criteria and with damping approximations.
Static pushover analysis is an attempt by the structural engineering profession to evaluate
the real strength of the structure and it promises to be a useful and effective tool for
performance based design.
The ATC-40 and FEMA-273 documents have developed modeling procedures,
acceptance criteria and analysis procedures for pushover analysis. These documents
define force-deformation criteria for hinges used in pushover analysis. As shown in figure
below, five points labeled A, B, C, D, and E are used to define the force deflection
behavior of the hinge and three points labeled IO, LS and CP are used to define the
acceptance criteria for the hinge. (IO, LS and CP stand for Immediate Occupancy, Life
Safety and Collapse Prevention respectively.) The values assigned to each of these points
vary depending on the type of member as well as many other parameters defined in
theATC-40 and FEMA-273 documents.
Force deformation for Pushover hinge
Capacity spectrum method
One of the methods used to determine the performance point is the Capacity
Spectrum Method, also known as the Acceleration-Displacement Response Spectra
method (ADRS). The Capacity Spectrum method requires that both the capacity curve
and the demand curve be represented in response spectral ordinates.
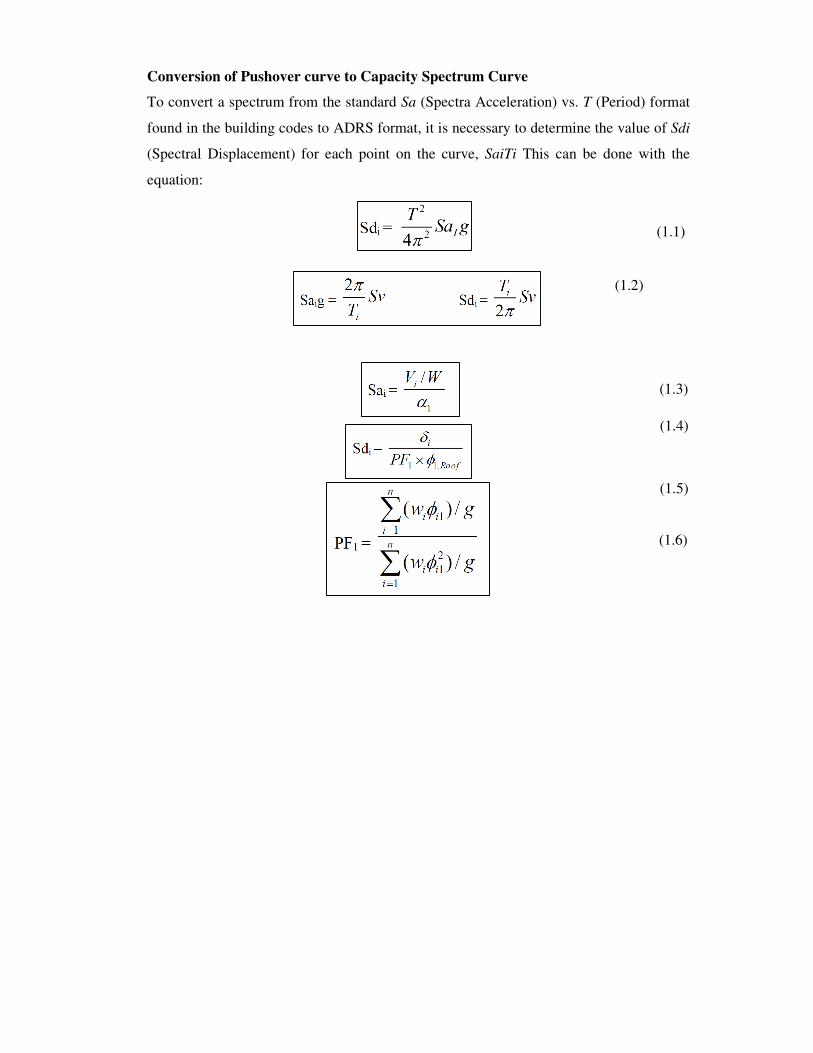
Conversion of Pushover curve to Capacity Spectrum Curve
To convert a spectrum from the standard Sa (Spectra Acceleration) vs. T (Period) format
found in the building codes to ADRS format, it is necessary to determine the value of Sdi
(Spectral Displacement) for each point on the curve, SaiTi This can be done with the
equation:
(1.1)
(1.2)
(1.3)
(1.4)
(1.5)
(1.6)

RESULTS & DISCUSSION
In order to run the pushover analysis, the first requirement is the moment
curvature analysis data of the bridge pier section and the specification of push load
pattern. However, here, the hinges are defined using the FEMA-356 definitions and two
types of push pattern namely uniform and modal have been defined.
The target displacements are set up using the response spectrum and time history
analysis and control node which in this study is the c.g of the superstructure at each bent
beam is pushed to the target displacement. The hinge formation is controlled by
displacement control.
Figure 1.5 Response spectrums of DBE and MCE for medium soil site

Table 1.2 Modal Periods and Frequencies
Output Case
Text Step Type
Text Step Num
Unitless
Period
Sec
Frequency
Cyc/sec
Circ Freq
rad/sec
Eigen value
rad2/sec2
MODAL Mode 1 0.232134 4.3079 27.067 732.62
MODAL Mode 2 0.221893 4.5067 28.316 801.81
MODAL Mode 3 0.18305 5.463 34.325 1178.2
MODAL Mode 4 0.174454 5.7322 36.016 1297.2
MODAL Mode 5 0.159506 6.2694 39.392 1551.7
MODAL Mode 6 0.151901 6.5832 41.364 1711
MODAL Mode 7 0.139517 7.1676 45.035 2028.2
MODAL Mode 8 0.138598 7.2151 45.334 2055.2
MODAL Mode 9 0.133809 7.4733 46.956 2204.9
MODAL Mode 10 0.116974 8.5489 53.714 2885.2
MODAL Mode 11 0.114503 8.7334 54.874 3011.1
MODAL Mode 12 0.114396 8.7416 54.925 3016.7
Push Over Analysis
1) Uniform Pushover analysis data for BENT-2 in X direction
Table 1.3 Pushover Curve for Bent-2
Step
Displacement
m
Base Force
KN
A
to
B
B
to
IO
IO
to
LS
LS
to
CP
CP
To
C
C
to
D
D
to
E
Beyond
E
Total
0 0.000701 0 24 0 0 0 0 0 0 0 24
1 0.01656 228894.053 22 2 0 0 0 0 0 0 24
2 0.123735 1383578.171 8 4 7 3 0 2 0 0 24
3 0.169624 1829723.123 0 5 3 6 2 8 0 0 24
4 0.178239 1867301.906 0 2 4 6 3 9 0 0 24
Table 1.4 Pushover Curve Demand Capacity for Bent-2
Step
Teff
Beff
SdCapacity
m
SaCapacity
Alpha
PFPhi
0 0.111125 0.05 0.003933 0 1 1
1 0.111125 0.05 0.096564 2.038123 0.866561 0.962152
2 0.122177 0.062595 0.658095 11.93058 0.894823 1.054876
3 0.12469 0.069962 0.899284 15.67675 0.900584 1.058249
4 0.125238 0.072701 0.92461 15.98066 0.901602 1.081537

Figure 1.5 Capacity and Demand of Bent 2 for DBE in ADRS
Figure 1.6 Capacity and Demand of Bent 2 for MCE in ADRS
2) Modal Pushover analysis data for BENT-2 in X direction
Table 1.5 Pushover Curve for Bent-2
Step
Displacement
m
Base Force
KN
A
to
B
B
to
IO
IO
to
LS
LS
to
CP
CP
To
C
C
to
D
D
to
E
Beyond
E
Total
0 0.000701 0 24 0 0 0 0 0 0 0 24
1 0.018018 88921.385 23 1 0 0 0 0 0 0 24
2 0.054574 221609.583 3 10 8 0 0 2 0 1 24
Table 1.6 Pushover Curve Demand Capacity for Bent-2
Step
Teff
Beff
SdCapacity m
SaCapacity
Alpha
PFPhi
0 0.159506 0.05 0.012845 0 1 1
1 0.159506 0.05 0.27151 0.85469 0.802773 1.216005
2 0.178002 0.085606 0.777427 2.018377 0.847191 1.286295

Figure 1.7 Capacity and Demand of Bent 2 for DBE in ADRS
Figure 1.8 Capacity and Demand of Bent 2for MCE in ADRS
1) Uniform Pushover analysis data for BENT-2 in Y direction
Table 1.7 Pushover Curve for Bent-2
Step
Displacement
m
Base Force
KN
A
to
B
B
to
IO
IO
to
LS
LS
to
CP
CP
To
C
C
to
D
D
to
E
Beyond
E
Total
0 -4.69E-14 0 24 0 0 0 0 0 0 0 24
1 0.012847 95711.696 22 2 0 0 0 0 0 0 24
2 0.015327 110071.083 18 6 0 0 0 0 0 0 24
3 0.025219 135437.849 10 14 0 0 0 0 0 0 24
4 0.04313 158478.134 4 18 2 0 0 0 0 0 24
5 0.127501 211318.033 0 2 12 8 0 2 0 0 24
6 0.143904 217138.747 0 2 12 4 2 4 0 0 24
7 0.150302 215871.466 0 2 12 0 4 6 0 0 24
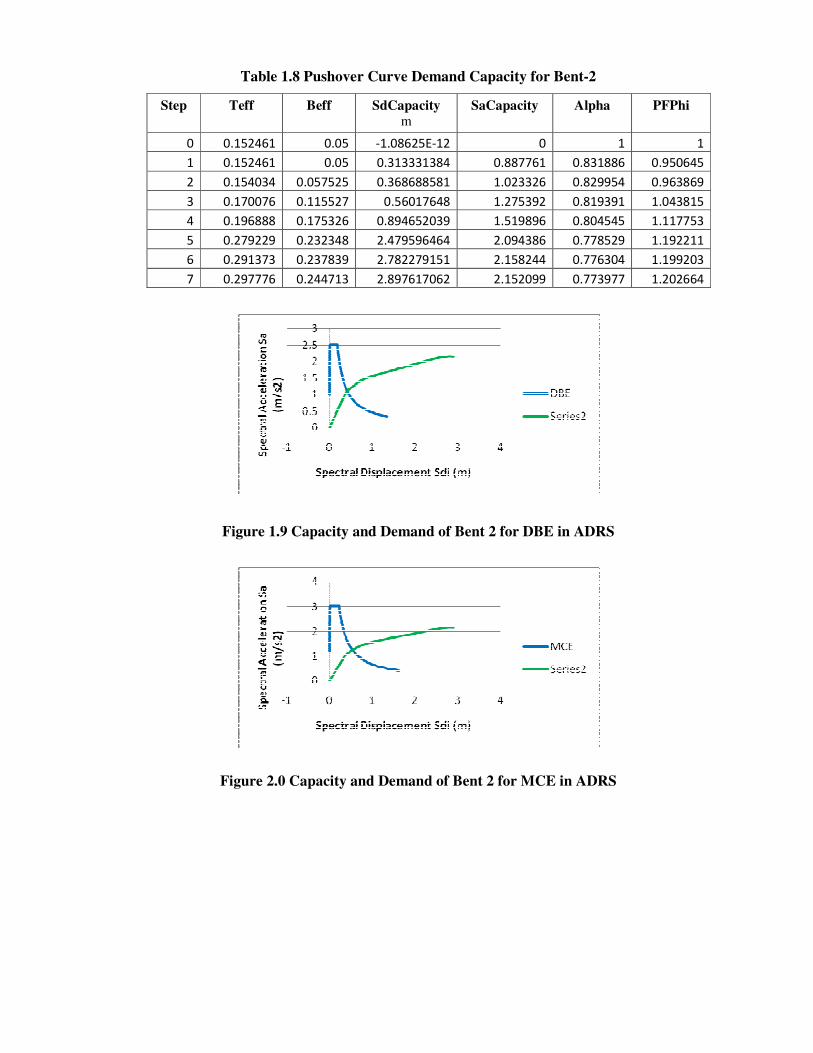
Table 1.8 Pushover Curve Demand Capacity for Bent-2
Step
Teff
Beff
SdCapacity
m
SaCapacity
Alpha
PFPhi
0 0.152461 0.05 -1.08625E-12 0 1 1
1 0.152461 0.05 0.313331384 0.887761 0.831886 0.950645
2 0.154034 0.057525 0.368688581 1.023326 0.829954 0.963869
3 0.170076 0.115527 0.56017648 1.275392 0.819391 1.043815
4 0.196888 0.175326 0.894652039 1.519896 0.804545 1.117753
5 0.279229 0.232348 2.479596464 2.094386 0.778529 1.192211
6 0.291373 0.237839 2.782279151 2.158244 0.776304 1.199203
7 0.297776 0.244713 2.897617062 2.152099 0.773977 1.202664
Figure 1.9 Capacity and Demand of Bent 2 for DBE in ADRS
Figure 2.0 Capacity and Demand of Bent 2 for MCE in ADRS

2) Modal Pushover analysis data for BENT-2 in Y direction
Table 1.9 Pushover Curve for Bent-2
Step
Displacement
m
Base Force
KN
A
to
B
B
to
IO
IO
to
LS
LS
to
CP
CP
To
C
C
to
D
D
to
E
Beyond
E
Total
0 -4.69E-14 0 24 0 0 0 0 0 0 0 24
1 0.013311 68371.549 22 2 0 0 0 0 0 0 24
2 0.015937 77689.352 18 6 0 0 0 0 0 0 24
3 0.030399 104071.641 12 12 0 0 0 0 0 0 24
4 0.147419 174919.98 0 2 12 2 2 6 0 0 24
5 0.148117 174817.23 0 2 12 2 2 6 0 0 24
Table 2.0 Pushover Curve Demand Capacity for Bent-2
Step
Teff
Beff
SdCapacity
m
SaCapacity
Alpha
PFPhi
0 0.174454 0.05 -3.17802E-13 0 1 1
1 0.174454 0.05 0.09696525 0.717175 0.735606 0.931196
2 0.177325 0.062018 0.114258623 0.817932 0.732891 0.946159
3 0.199121 0.119079 0.198620265 1.127621 0.712138 1.038203
4 0.322732 0.220768 0.850850212 1.838829 0.733995 1.175295
5 0.323517 0.221772 0.854606142 1.838004 0.733893 1.17567
Figure 2.1 Capacity and Demand of Bent 2 for DBE in ADRS

Figure 2.2 Capacity and Demand of Bent 2for MCE in ADRS
Time History
The requirements for the mathematical model for Time-History Analysis are
identical to those developed for Response Spectrum Analysis. The damping matrix
associated with the mathematical model shall reflect the damping inherent in the building
at deformation levels less than the yield deformation. Time-History Analysis shall be
performed using time histories prepared according to the requirements given below.
Time-History Analysis shall be performed with no fewer than three data sets (two
horizontal components or, if vertical motion is to be considered, two horizontal
components and one vertical component) of appropriate ground motion time histories that
shall be selected and scaled from no fewer than three recorded events. Appropriate time
histories shall have magnitude, fault distances, and source mechanisms that are consistent
with those that control the design earthquake ground motion. Where three appropriate
recorded ground motion time history data sets are not available, appropriate simulated
time history data sets may be used to make up the total number required. For each data
set, the square root of the sum of the squares (SRSS) of the 5%-damped site-specific
spectrum of the scaled horizontal components shall be constructed. The data sets shall be
scaled such that the average value of the SRSS spectra does not fall below 1.4 times the
5%-damped spectrum for the design earthquake for periods between 0.2T seconds and
1.5T seconds (where T is the fundamental period of the building).
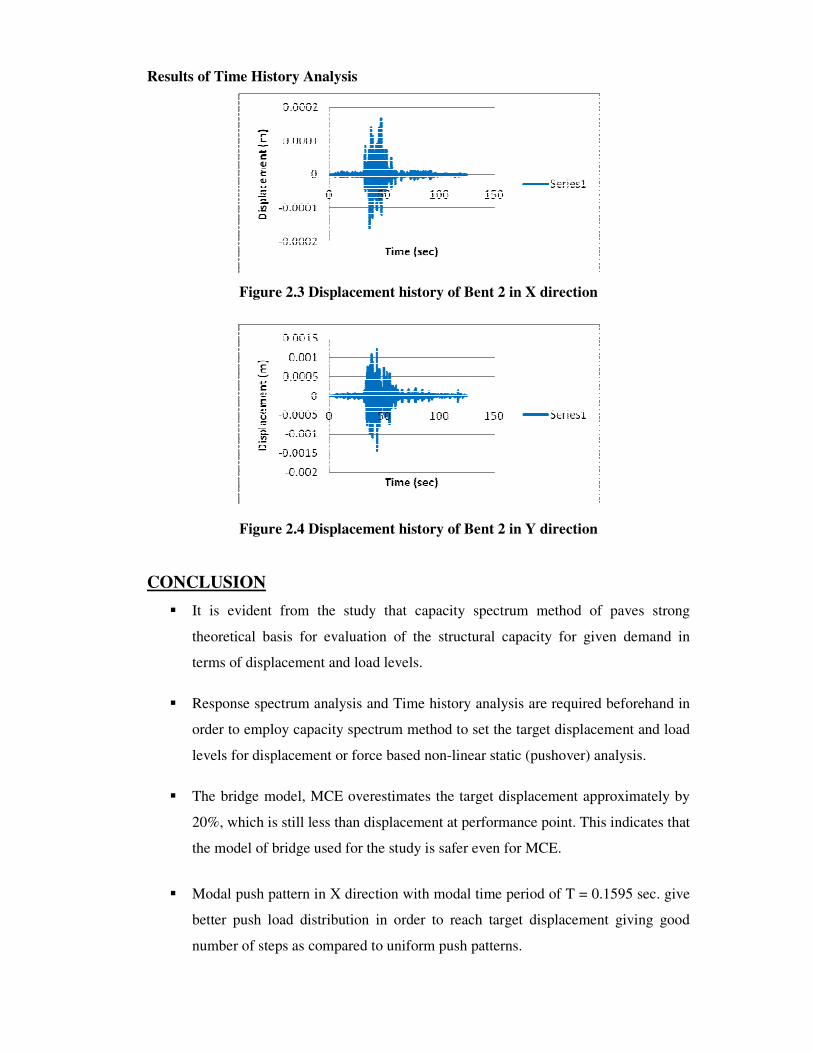
Results of Time History Analysis
Figure 2.3 Displacement history of Bent 2 in X direction
Figure 2.4 Displacement history of Bent 2 in Y direction
CONCLUSION
� It is evident from the study that capacity spectrum method of paves strong
theoretical basis for evaluation of the structural capacity for given demand in
terms of displacement and load levels.
� Response spectrum analysis and Time history analysis are required beforehand in
order to employ capacity spectrum method to set the target displacement and load
levels for displacement or force based non-linear static (pushover) analysis.
� The bridge model, MCE overestimates the target displacement approximately by
20%, which is still less than displacement at performance point. This indicates that
the model of bridge used for the study is safer even for MCE.
� Modal push pattern in X direction with modal time period of T = 0.1595 sec. give
better push load distribution in order to reach target displacement giving good
number of steps as compared to uniform push patterns.

� Modal push pattern in Y direction with modal time period of T = 0.1744 sec.
gives better push load distribution in order to reach target displacement giving
good number of steps as compared to uniform push patterns.
� Results of Non linear static pushover analysis are compared with acceptance
criteria prescribed in FEMA-273 and ATC-40 document in order to meet the
serviceability criteria of structure. However capacity spectrum method employing
NSP gives freedom to the user to harness Non-linearity of structural material and
geometry in terms of custom ductility ratio meeting collapse prevention levels at
the most.
REFERENCES
Research Papers
1) Applied Technology council (ATC). (1996) “Seismic Evaluation and Retrofit of
Concrete Buildings”: Vol. 1, ATC-40, Redwood city calif.
2) ASCE, 2000, Prestandard and Commentary for the Seismic Rehabilitation of
Buildings, FEMA 356 Report, prepared by the American Society of Civil
Engineers for the Federal Emergency Management Agency, Washington, D.C.
3) ASCE, 2006, “Seismic Rehabilitation of Existing Buildings”, Standard No. ASCE-
41. American society of civil engineering, Reston, Virginia.
4) ATC, 1997a, NEHRP Guidelines for the Seismic Rehabilitation of Buildings,
FEMA 273 Report, prepared by the Applied Technology Council for the Building
Seismic Safety Council, published by the Federal Emergency Management
Agency, Washington, D.C.
5) ATC, 1997b, NEHRP Commentary on the Guidelines for the Seismic
Rehabilitation of Buildings, FEMA 274 Report, prepared by the Applied
Technology Council, for the Building Seismic Safety Council, published by the
Federal Emergency Management Agency, Washington, D.C.
6) Ballard. T. A., Krimotat. A., Mutobe. R.,(2000) “Utilizing Pushover Analysis for
Seismic Performance of Steel Bridge Structures”.
7) Chiorean, C.G., (2003) “Application of pushover analysis on reinforced concrete
bridge model”, 4th European Workshop on the Seismic Behaviour of Irregular and
Complex Structures, Thessaloniki, Greece.
8) Chopra, A.K. and Goel, R.K. (2002). “A modal pushover analysis procedure for
estimating seismic demands for buildings”, Earthquake Engineering and Structural
Dynamics, 31, 561-582.

9) Chung. C. Fu, Hamed. AlAyed.,(2003) “Seismic analysis of bridges using
displacement-based approach”, University of Maryland. A2C08 seismic design of
bridge.
10) Dalal.S.P, Vasanwala. S. A, Desai. A. K.,(2011) “Performance based seismic
design of structure: A review.” International journal of civil and structural
engineering volume 1, no 4.
11) Euro code 8 (2004), “Design of Structures for Earthquake Resistance, Part-1:
General Rules, Seismic Actions and Rules for Buildings”, European Committee for
Standardization (CEN), Brussels.
12) Fajfar, P. (2000). “A nonlinear analysis method for performance-based seismic
design”. Earthquake Spectra, 16(3), 573–592.
13) Floren. A., and Mohammadi. J.,(2001) “performance-based design approach In
seismic analysis of bridges”, journal of bridge engineering / january/february 2001.
14) Fukui. J and Shirato. M., (2005) “Performance-based specifications for Japanese
a highway bridges”, © 2005 Millpress, Rotterdam, ISBN 90 5966 040 4.
15) Goel. R. K. and Chopra. A. K. (2004) “Evaluation of modal and FEMA pushover
analyses: SAC buildings”, Earthquake Spectra. 20(1), 225-254.
16) Hasan. R., L. Xu., and Grierson. D. E.,(2002) “Push-over analysis for
performance-based seismic design”, Computers and Structures 80 (2002) 2483–
2493.
17) Inokuma. A., (2002) “Basic Study Of Performance-Based Design In Civil
Engineering” 10.1061/-ASCE 1052-3928-2002 128:1-30.
18) Kappos. A., Paraskeva .T., Sextos. A.,(2005) “Modal pushover analysis as a
means for the seismic assessment of bridge structures”,4th
European workshop on
the seismic behaviour of irregular and complex structures, Thessaloniki, Greece.
19) Krawinkler. H. and Seneviratna, G.D.P.K (1998). “Pros and cons of a pushover
analysis of seismic performance evaluation”. Engineering Structures, 20, 452-464.
20) Martino.R., Spacone.E., and Kingsley.G., (2000), “Nonlinear Pushover Analysis of
RC Structures”,ASCE Structures 2000.
21) Monteiro. R., Monteiro. R., Marques. M., Delgado. R., Costa. A.,(2008)
“Pushover analysis of rc bridges using fiber models or Plastic hinges”, The 14th
World Conference on Earthquake Engineering October 12-17, 2008, Beijing,
China.
22) Muljati, I and Warnitchai, P (2007) “A modal pushover analysis on multi-span
concrete bridges to estimate inelastic seismic responses”, Civil Engineering
Dimension, Vol. 9, No. 1, 33–41.

Design Standards and Manuals
1. IS 456 -2000 and IS 1893 -2002 (Part – I)
2. IS 2911 Part – 4 Load Test on Pile
3. IRC: 6 -2000 Part-II Standard Specification and Code Practice for road
bridges.
Text Books
1. Bridge engineering, Wai-Fan Chen, Lian Duan, CRC Press.
2. Seismic design and retrofit of bridges, M. J. Preistly, F. Seibal, G. M. Calvi,
John willey and Sons.
3. Seismic Design Aids for Nonlinear Pushover Analysis of Reinforced Concrete
and steel bridges, Jeffrey Ger, Fronklin Y. Cheng, CRC Press.
4. Foundation Analysis and Design, Joseph E. Bowels P.E, S.E
Web Sites. 1. www.sciencedirect.com
2. www.pubs.asce.org
3. www.structurae.com
4. www.proquest.com
5. www.scopus.com
Search Engines.
1. www.google.co.in
2. www.4shared.com
3. www.scibd.com
4. www.osun.org
5. www.pdf-search-engine.com


