
Accep
ted M
anus
cript
Not Cop
yedit
ed
1
Feasibility of Using Coal Fly Ash for Mine Waste Containment
Muluken B. Yeheyis1, Julie Q. Shang
2, Ernest K. Yanful
3
ABSTRACT
This study investigates the feasibility of using coal fly ash and fly ash-bentonite mixtures as a
barrier material for mine waste. The hydraulic conductivity of the coal fly ash was measured to
be in the order of 2 x 10⁻⁹
m/s when it was permeated with deionized water, and this value
decreased significantly when the permeant was switched to acid mine drainage (AMD). Addition
of bentonite to coal fly ash lowered the hydraulic conductivity during water permeation but no
further significant change was observed upon switching the permeant to AMD. Chemical
analyses on the effluent from the hydraulic conductivity tests indicated that heavy metals present
in AMD were attenuated and were well below the leachate criteria set by the Ontario
Government. X-ray diffraction and scanning electron microscopy analyses results of post
permeation samples showed significant structural differences and formation of secondary
minerals after AMD permeation. The results of this study suggest that the addition of 10%
bentonite to coal fly ash reduced the hydraulic conductivity of the coal fly ash to less than 1 x
10−9
m/s and improved the chemical compatibility for mine waste containment.
Key words: fly ash; bentonite; acid mine drainage; mine waste containment; hydraulic
conductivity; saturation index.
1Research Assistant, Department of Civil and Environmental Engineering, The University of
Western Ontario, London, Ontario, Canada. N6A 5B9
Tel. 519-694-3006; Fax (519) 661-3779
Email: [email protected]
2Professor, Department of Civil and Environmental Engineering, The University of Western
Ontario, London, Ontario, Canada, N6A 5B9
Email: [email protected]
3Professor, Department of Civil and Environmental Engineering, The University of Western
Ontario, London, Ontario, Canada. N6A 5B9
Email: [email protected]
Journal of Environmental Engineering. Submitted January 16, 2009; accepted August 27, 2009; posted ahead of print December 18, 2009. doi:10.1061/(ASCE)EE.1943-7870.0000211
Copyright 2009 by the American Society of Civil Engineers

Accep
ted M
anus
cript
Not Cop
yedit
ed
2
INTRODUCTION
Acid mine drainage (AMD), the leachate from oxidized mine waste rock and tailings, has been a
major environmental challenge for the mining industry. AMD is formed when sulfide-rich mine
waste oxidize in the presence of water and oxygen, and is characterized by low pH, high acidity,
elevated heavy metal and sulphate concentrations. AMD has been known to cause severe impacts
on surface and ground water systems. Current practices of prevention and mitigation measures
include the use of water covers or underwater disposal, use of soil covers as oxygen and
infiltration barriers, and treatment of acidic effluent by lime neutralization.
Solid contaminant barriers can provide efficient and relatively inexpensive means of containing
mine wastes. Many different barrier materials, notably compacted soil liners and geotextiles,
have been used for the containment of municipal solid wastes. Compacted soil liners are
commonly used to control or restrict contaminant migration from the landfill into the
environment. When suitable natural soils are not available for use as a compacted clay liner,
bentonite may be added to a non-cohesive soil (e.g., silty sand) to achieve a liner with acceptable
hydraulic conductivity (Daniel 1993). Bentonitic clay materials are preferred because of their
low hydraulic conductivity and good adsorption or retention capacity (Daniel 1993). However,
application of clay, clay-bentonite mixtures and polymer based synthetic liners may become
extremely expensive because of the lack of suitable clay materials at or near the disposal site or
because of high costs of synthetic liners (Cokca and Yilmaz 2004). Therefore, re-use of
industrial waste products and by-products such as coal fly ash can be a viable alternative for
barrier construction and an important step toward sustainability.
Owing to its pozzolanic and highly alkaline properties resulting from its high calcium content,
fly ash from coal-fired power generating stations has the potential to serve as a hydraulic and
contaminant barrier. Various applications of coal fly ash as hydraulic barriers have been studied
by a number of researchers. Usmen et al. (1988) investigated the use of fly ash in landfill liners
and landfill covers because of its low permeability characteristics. They reported permeabilities
on the order of 7x10⁻⁶
to 2x10⁻⁷
m/sec for two Class C fly ashes. Edil et al. (1992) also reported
the use of fly ash with or without sand, as a construction material for waste containment liners
and impermeable covers. Bowders et al. (1987) evaluated the potential for using Harrison and
Amos Class F fly ashes from West Virginia in hydraulic barriers. Varying amounts of lime or
Journal of Environmental Engineering. Submitted January 16, 2009; accepted August 27, 2009; posted ahead of print December 18, 2009. doi:10.1061/(ASCE)EE.1943-7870.0000211
Copyright 2009 by the American Society of Civil Engineers

Accep
ted M
anus
cript
Not Cop
yedit
ed
3
cement were mixed with the fly ashes and test specimens were compacted at their optimum
water content using the standard Proctor method. The hydraulic conductivity tests showed that
unstabilized Harrison and Amos fly ashes had hydraulic conductivities of 7.2×10⁻⁸
and 5×10⁻⁷
m/s, respectively using distilled-deionized water as permeant. Hydraulic conductivity of Harrison
ash dropped about an order of magnitude when 15% lime was added. Studies on the utilization of
coal fly ash in combination with clay in landfill bottom liners were also performed by Nhan et al.
(1996) and Cokca and Yilmaz (2004). Nhan et al. (1996) investigated the hydraulic conductivity
of Lakeview Class F fly ash mixed with lime kiln dust and bentonite. They found that with the
addition of lime dust and bentonite, coal fly ash liner has a hydraulic conductivity of
4.3 1.6x10⁻⁸
m/s. They also found the addition reduced the dissolved metal concentration in the
synthetic municipal solid waste leachate. Cokca and Yilmaz (2004) investigated the combination
of rubber, bentonite and coal fly ash as a liner material. The composite material had a hydraulic
conductivity of less than 10-9
m/s using water as permeant and the effluent leachate was found to
be non-hazardous.
The permeants used in previous laboratory studies were mostly distilled water or synthetic
alkaline solution such as municipal solid waste leachate. In the present study, the use of acidic
permeant in the utilization of coal fly ash as a barrier for AMD containment was investigated.
Further investigation of the enhancement of the barrier performance by addition of bentonite was
also undertaken. The specific tasks performed in order to achieve the above objective are
itemized as follows: (i) evaluation of the hydraulic conductivity of compacted Atikokan coal fly
ash (referred to as AFA hereafter) and fly ash-bentonite mixture (referred to as BAF hereafter)
permeated with distilled water and acid mine drainage; (ii) evaluation of the efficiency of AFA
and BAF samples in neutralizing AMD and removing contaminants contained in the AMD; and
(iii) determination of the optimum mix of the compacted fly ash-bentonite mixture in terms of
the hydraulic conductivity and overall chemical compatibility.
MATERIALS AND EXPERIMENTAL METHODS
Materials Used
Characterization of fly ash and bentonite used
Journal of Environmental Engineering. Submitted January 16, 2009; accepted August 27, 2009; posted ahead of print December 18, 2009. doi:10.1061/(ASCE)EE.1943-7870.0000211
Copyright 2009 by the American Society of Civil Engineers

Accep
ted M
anus
cript
Not Cop
yedit
ed
4
The fly ash used in this study was collected in the dry state from Atikokan Thermal Generating
Station located 190 km west of Thunder Bay, Ontario, Canada. The physico-chemical properties
and environmental evaluation of Atikokan coal fly ash for environmental applications are
described in detail in Yeheyis et al. (2008). The major chemical composition of Atikokan fly ash
calculated as major oxides are SiO2, Al2O3, Fe2O3, CaO and Na2O contributing 43.83%, 21.85%,
4.01%, 14.36% and 7.15% (w/w) of the total , respectively. The next most abundant components
are MgO, K2O, P2O5 and SO3, contributing about 2.71%, 0.51%, 0.54% and 1.05% (w/w) each.
It also consists of trace elements such as manganese, barium, zinc, lead, chromium, copper and
vanadium. According to American Society for Testing and Materials Standard Specification for
Coal Fly Ash and Raw or Calcined Natural Pozzolan for Use as a Mineral Admixture in Portland
Cement Concrete (ASTM C 618), Atikokan fly ash is classified as a Class C fly ash. The specific
surface area and specific gravity of the AFA were found to be 0.6357 m2/g and 2.73,
respectively. AFA contains 88% fines (< 0.075 mm) with predominantly silt-sizes (0.075 mm -
0.002 mm). The results obtained from Yeheyis et al. (2008) also demonstrated that Atikokan fly
ash are non-toxic and can be re-utilized for various environmental applications.
In addition to pure fly ash, bentonite added fly ash samples were prepared and tested to study its
engineering property as a potential mine waste barrier material. The bentonite used in this study
was sodium montmorillonite from Wyoming, USA. The liquid limit (LL) of the bentonite was
500% and the plastic index (PI) was 400%. Its cation exchange capacity (CEC) measured by
silver thiourea method (Chhabra et al. 1975) and KCl extraction (Barone et al. 1989) amounts to
76 meq/100g and the predominant minerals present in the bentonite were quartz, feldspar,
calcite, montmorillonite and mica. Two fly ash-bentonite mixtures were tested in this study,
containing 5% bentonite (5% BAF) and 10% bentonite (10% BAF), respectively. The mixtures
were prepared on the basis of dry weight and proper care was taken to ensure homogeneity of
the mixes. The fly ash-bentonite mixtures tested were chosen to represent the probable field
range of bentonite contents.
Acid mine drainage permeant
The samples were first permeated with distilled water and then with AMD generated in
the laboratory from reactive mine rocks and tailings. The AMD used in the study had a pH of
Journal of Environmental Engineering. Submitted January 16, 2009; accepted August 27, 2009; posted ahead of print December 18, 2009. doi:10.1061/(ASCE)EE.1943-7870.0000211
Copyright 2009 by the American Society of Civil Engineers
Accep
ted M
anus
cript
Not Cop
yedit
ed
5
2.78 and contained many of the chemical constituents of natural AMD. It had high concentration
of metals including Fe (738.9 mg/L), Mn (106.7 mg/L), Zn (880.5 mg/L), Cu (53.4 mg/L), Ni
(89.8 mg/L), Cr (6.7 mg/L), Cd (4.5 mg/L), Pb (8.7 mg/L), As (1.4 mg/L), Si (25.3 mg/L), Ca
(512.1 mg/L) and Al (83.2 mg/L). It also contained high sulphate concentration (10,100 mg/L)
and electrical conductivity of 9.31 mS/cm (@ 25 ºC).
Experimental Methods
Hydraulic conductivity measurement
In order to assess the suitability of AFA and BAF samples as barrier materials, laboratory
hydraulic conductivity tests were carried out and the results were evaluated to see if they satisfy
the general requirement of hydraulic conductivity for contaminant barriers (i.e. 10-9
m/s or less;
Daniel 1993) and to assess the chemical compatibility with AMD. The tests were performed on
fly ash with 0, 5 and 10% bentonite contents using a fixed-wall constant-flow-rate permeameter
consisting of four permeameter cells that run at the same flow rate (Fernandez and Quigley
1985). The relative advantages of the fixed-wall permeameter have been discussed by Bowders
et al. (1986) and Daniel et al. (1985). At the beginning of the test, the samples were compacted in
the sampling cylinder (permeameter cell) in three layers with a small spring-loaded compactor.
The samples were compacted at about 2% above optimum moisture content (2% wet of
optimum) determined from the standard Proctor moisture-density relationships. Each test sample
had a diameter of 5 cm and was trimmed to 2 cm by the rotation of a T-shaped trimming plate. A
confining pressure of 32 kPa was applied to the samples by means of a calibrated stainless steel
spring-loaded device, to prevent the swelling of the samples and eliminate sidewall leakage
(Kashir and Yanful 2001). Subsequently, each sample specimen was subjected to a constant
hydraulic flow that was applied via a motor driven piston press. The samples were first
permeated with distilled water to obtain the reference hydraulic conductivity of the specimen
simulating pre-weathering condition of mine waste. After the specimens were brought to
equilibrium with distilled water, the AMD was introduced into the specimen. During the
experiments, room temperature, sample thickness, flow rate, and influent pressure were
continually monitored and recorded by automated data acquisition system. A fluid outlet at the
bottom of the cell allowed effluent to be collected. The hydraulic conductivity, pore volume of
flow, and hydraulic head were calculated from the imposed constant flow rate.
Journal of Environmental Engineering. Submitted January 16, 2009; accepted August 27, 2009; posted ahead of print December 18, 2009. doi:10.1061/(ASCE)EE.1943-7870.0000211
Copyright 2009 by the American Society of Civil Engineers
Accep
ted M
anus
cript
Not Cop
yedit
ed
6
Effluent chemistry analysis
The hydraulic conductivity and its susceptibility to changes with time or exposure to chemicals
are the major factors in the selection of clay for use in waste containment barriers (Mitchell and
Madsen 1987). In order to evaluate chemical compatibility of the barrier samples, the effluent
from each cell was collected periodically for chemical analysis during permeation. pH and
sulphate were analyzed immediately after sample collection. The pH was measured with a
combination electrode (Orion 410A) calibrated at pH 4, 7 and 10. The sulphate concentration
was measured using high-performance liquid chromatography (HPLC), and metals in acidified
filtrates were analyzed using inductively coupled plasma optical emission spectroscopy (ICP-
OES).
Post-testing analysis
Following completion of hydraulic tests, the samples were extruded from the cells and sub-
samples were analyzed for mineralogy, morphology, major oxides and trace metals in order to
identify changes after AMD permeation. Mineralogical analyses were carried out on random
powder samples by means of x-ray diffraction (XRD) analysis, using a D/max Rigaku
diffractometer (40 kV, 160 mA) with cobalt K radiation. A scanning electron microscope
(Hitatchi S-4500 SEM) was used to observe changes in the morphology of the surface after
permeation. Major and trace elements of the samples were analysed by using x-ray fluorescence
(XRF) technique (Philips PW-1400).
RESULTS AND DISCUSSION
Hydraulic conductivity
The results of hydraulic conductivity tests on AFA and two BAF samples permeated first with
distilled water and then with AMD are presented in Figure 1. The AMD was introduced after the
hydraulic conductivity of the samples had been stabilized with distilled water, which occurred
after approximately 5.25 pore volumes of water permeation. The experiment was run for a total
of approximately 30 pore volumes (PVs) of water and AMD permeation.
Journal of Environmental Engineering. Submitted January 16, 2009; accepted August 27, 2009; posted ahead of print December 18, 2009. doi:10.1061/(ASCE)EE.1943-7870.0000211
Copyright 2009 by the American Society of Civil Engineers

Accep
ted M
anus
cript
Not Cop
yedit
ed
7
The average hydraulic conductivity of AFA was initially 2.5 x 10⁻⁹
m/s within the first 0.55 PVs
of water permeation, increasing slightly to 5.8 x 10⁻⁹
m/s between 0.65 PVs and 1.25 PVs. The
hydraulic conductivity then more or less stabilized to an average value of 2 x 10⁻⁹
m/s until the
end of water permeation (the first 5.25 PVs). After switching the permeant to AMD, the
hydraulic conductivity decreased steadily and became lower than 1 x 10⁻⁹
m/s after 10.8 PVs,
and further decreased sharply to less than 4 x 10–11
m/s at the end of AMD permeation (30 PVs).
This sharp decrease in the hydraulic conductivity of the AFA sample is due to permeant-fly ash
interactions. The pozzolanic and self-cementing properties of Atikokan fly ash result in the
formation of hydration products that could possibly block void spaces and reduce the
interconnection between fly ash particles. The precipitation of new minerals as result of chemical
interaction between AMD and fly ash could also contribute to clogging of the pores between the
particles. These two processes could lead to a reduction in hydraulic conductivity. Since the
hydraulic conductivity of the fly ash during the first 11 PVs was higher than 1 x 10⁻⁹
m/s, the
target regulatory hydraulic conductivity for compacted soil liners, one may conclude that the fly
ash alone may not be suitable for use as a liner by itself.
As seen in Figure 1, the addition of bentonite decreased the hydraulic conductivity of the fly ash-
bentonite mixtures during water permeation. The average hydraulic conductivity of 5% BAF was
initially 2.2 x 10⁻⁹
m/s during the first 0.55 PVs of water permeation, and followed a trend
similar to the AFA by increasing slightly to 3.75 x 10⁻⁹
m/s between 0.65 PVs and 1.25 PVs and
then eventually stabilizing to an average value of 1.25 x 10⁻⁹
m/s until the end of water
permeation 5.25 PVs. The average initial hydraulic conductivity of 10% BAF was 2 x 10⁻¹⁰
m/s,
decreasing approximately one order of magnitude from that of AFA during water permeation.
However, upon switching to AMD the hydraulic conductivity of the mixture samples remained
fairly constant in contrast to the pure fly ash sample (AFA) which kept on decreasing sharply.
This shows the existence of an opposing phenomenon during AMD permeation in the samples
containing bentonite. This opposing phenomenon could be attributed to clay double-layer
contraction due to the displacement of the resident bentonite pore water by the AMD permeant.
This is consistent with the findings of Kashir and Yanful (2001), who observed an increase in the
hydraulic conductivity of bentonite filter cake permeated with AMD. The hydraulic conductivity
of the 10% BAF sample remained steady relative to that of the 5% BAF sample, indicating that
Journal of Environmental Engineering. Submitted January 16, 2009; accepted August 27, 2009; posted ahead of print December 18, 2009. doi:10.1061/(ASCE)EE.1943-7870.0000211
Copyright 2009 by the American Society of Civil Engineers
Accep
ted M
anus
cript
Not Cop
yedit
ed
8
bentonite-AMD interactions were more pronounced on the sample with higher bentonite content.
The AMD attack on pure fly ash was comparatively low.
The distance between the negatively charged clay particle surface and the centre of mass of the
diffuse double layer, 1/κ, may be related to the thickness of the double layer (Mitchell 1993). For
a nonsymmetrical electrolyte containing various ions, may be given by (Hunter 1993):
κ2 = ((e
2∑ni
0zi
2)/(εκT)) (1)
Where e is the charge of the electron (1.60 × 10⁻⁹
C); ni is the number of ions of type i in the bulk
solution per cubic metre; zi is the valence of ion i; k is Boltzmann’s constant (1.38 × 10⁻²³
J/K); ε
is the permittivity of the bulk solution (C2/J·m); and T is the absolute temperature (K).
Kashir and Yanful (2001) showed that the ionic strength, I, of effluents from compacted clays
permeated with AMD could be related to κ as follows:
κ = 3.28√I (nm-1
) (2)
Where I is the ionic strength.
Equation (2) was used to estimate double layer thickness of AFA and BAF samples. The ionic
strength of the effluents sampled during the hydraulic conductivity tests were computed using
MINTEQA2 (described in the next section). The variation of the diffuse double layer thickness
surrounding the fly ash and bentonite particles in each compacted AFA and BAF samples during
AMD permeation is presented in Figure 2. When the samples were permeated with distilled
water, the ionic strength decreased due to the flushing of dissolved salts from the samples
resulting in an increase in double layer thickness. After switching the permeant to AMD (i.e.,
5.25 PVs), the double layer thickness reduced significantly up to 10 PVs, but remained fairly
constant thereafter. Although double layer reduction might have occurred in all samples, it was
evidently greater in BAF samples compared to the reduction in AFA, resulting in an increase in
hydraulic conductivity. The change in hydraulic conductivity that occurred as a result of double
layer contraction was likely compensated by a decrease in hydraulic conductivity due to pore
clogging, as indicated by the steady hydraulic conductivity values for 10% BAF after 10 PVs of
permeation.
Journal of Environmental Engineering. Submitted January 16, 2009; accepted August 27, 2009; posted ahead of print December 18, 2009. doi:10.1061/(ASCE)EE.1943-7870.0000211
Copyright 2009 by the American Society of Civil Engineers

Accep
ted M
anus
cript
Not Cop
yedit
ed
9
The 5% BAF sample also did not meet the minimum hydraulic conductivity (1 x 10⁻⁹
m/s)
criterion during the early permeation stages (i.e. the first 5.6 PVs), and may not be suitable for
use as barrier for mine waste containment. Fly ash amended with 10% bentonite satisfied the
regulatory hydraulic conductivity requirement (1 x 10⁻⁹
m/s) throughout the test. From these
results, one may conclude that, compacted fly ash containing 10% bentonite may be required to
achieve acceptable level of hydraulic conductivity for mine waste containment. It is also possible
that slightly lower bentonite contents (6-8%) may be acceptable.
Effluent chemistry analysis
Effluent pH and Sulphate
Figure 3 shows pH measurements as a function of effluent pore volumes. When the samples
were permeated with distilled water, the initial effluent pH remained highly alkaline (greater than
12.0). The pH decreased slowly to approximately 11.5 after 5.25 PVs of distilled water had
passed through the samples. Upon switching the permeant to AMD, the effluent pH decreased
more quickly compared to distilled water permeation because of the strong acidity of AMD.
Both AFA and BAF samples showed essentially similar pH behavior. However, during the first
10 PVs of permeation, the pH of effluents from the BAF samples was slightly higher than that of
the AFA sample (i.e. pH of 10% BAF > 5% BAF > AFA). This trend completely reversed after
13 PVs (i.e. AFA > 5% BAF > 10% BAF) and then stabilized more or less thereafter. The
effluent pH of the samples showed plateaus from PV = 8 to PV = 14 and from PV = 19 to PV =
23 indicating that the fly ash showed high buffering capacity at about pH of 10.8 and 9.1
respectively. The alkaline oxides and calcium carbonate present in fly ash and fly ash-bentonite
samples provided this buffering capacity. Although the influent pH of AMD was strongly acidic
(2.78) after 30 total PVs, the effluent pH remained alkaline at pH 8.9 (compared to 11.5 with
distilled water). This high effluent pH is attributed mainly due to dissolution and hydrolysis of
CaO and other major alkali contributing oxides (MgO, Na2O, and K2O) originally present in fly
ash and fly ash-bentonite mixtures. This implies that in addition to its low hydraulic
conductivity, alkalinity of fly ash has the capacity to offset and neutralize highly acidic AMD
asserting its potential use for mine waste containment.
Journal of Environmental Engineering. Submitted January 16, 2009; accepted August 27, 2009; posted ahead of print December 18, 2009. doi:10.1061/(ASCE)EE.1943-7870.0000211
Copyright 2009 by the American Society of Civil Engineers

Accep
ted M
anus
cript
Not Cop
yedit
ed
10
The sulphate concentration of the effluent from all samples was monitored since it is a dominant
anion in mine drainage waters (Figure 4). The sulphate concentration dropped from
approximately 3000 ppm to 110 ppm during water permeation. This was likely due to dissolution
of sulphate salts and anions from fly ash and fly ash-bentonite samples. Upon switching the
permeation to AMD, the sulphate started increasing and reached approximately 1900 mg/L and
remained constant thereafter. Although the trend in effluent sulphate concentration during water
and AMD permeation was more or less similar in all samples, the fly ash sample has lower
sulphate concentration compared to BAF samples. Comparing BAF samples, the fly ash with 5%
BAF also showed relatively lower sulphate concentration than 10% BAF during most of the test
period.
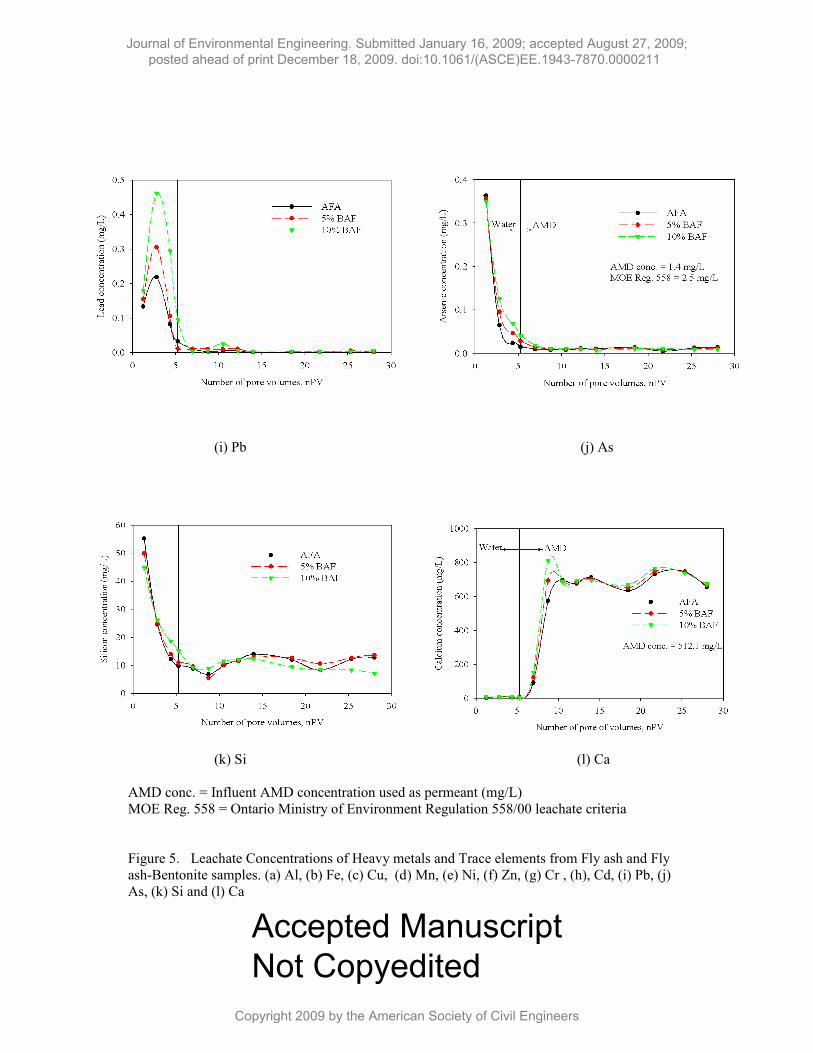
Effluent chemical composition and geochemical modeling
In order to establish chemical compatibility of the barrier samples and determine the fate of the
metals present in AMD, the effluent metal concentrations were analyzed and presented in Figure
5 (a) to (l). The data are plotted as absolute effluent concentration (in mg/L) versus pore
volumes. The effluent concentrations were also compared to Ontario Ministry of Environment
Regulation 558 (MOE Reg. 558) leachate criteria (MOE, 2000).
Geochemical modeling was also conducted to determine whether specific solid phases were in
equilibrium with the permeant, as an indication of possible precipitation and solid phase control
of the metal concentrations. The geochemical equilibrium model Visual MINTEQ version 2.50
(Gustavsson 2006), a Windows based version of MINTEQA2 (Allison et al. 1991), was used for
saturation indices calculation. The saturation index (SI) for an aqueous solution with respect to a
mineral indicates the thermodynamic tendency to precipitate or to dissolve certain phases. The
saturation index is defined by:
SI = log (IAP/Ksp) (3)
where IAP is the ion activity product calculated from the water sample, and Ksp is the theoretical
solubility product, both adjusted to the temperature of the sample. A negative value of the
saturation index indicates that the solution is undersaturated with respect to a particular solid
phase and that the solid phase would tend to dissolve if present, whereas a positive value
Journal of Environmental Engineering. Submitted January 16, 2009; accepted August 27, 2009; posted ahead of print December 18, 2009. doi:10.1061/(ASCE)EE.1943-7870.0000211
Copyright 2009 by the American Society of Civil Engineers

Accep
ted M
anus
cript
Not Cop
yedit
ed
11
indicates the tendency for a mineral to precipitate. A value close to zero suggests that the mineral
is in equilibrium in the solution and may either precipitate or dissolve.
The input parameters were measured pH, temperature and concentrations of inorganic
constituents of the effluent (As, Al, B, Ca, Cd, Cr, Cu, Fe, K, Mg, Mn, Na, Ni, Pb, Zn, and Si)
and SO4. The pH was fixed and solids were allowed to precipitate. The thermodynamic database
provided by the code was used. Both AFA and BAF samples showed similar effluent chemistry
and the difference was minimal. As a result, detail discussion on the effluent chemistry as well as
geochemical modeling was presented on the 10% BAF sample only. Table 1 presents the
calculated saturation indices (SI) for some minerals that can affect the concentration of heavy
metals in the effluent.
The initial effluent concentration of aluminium from the hydraulic conductivity testing cells was
relatively high (~ 140 mg/L) but reduced to approximately 60 mg/L during water permeation
(within 5.25 PV), and further reduced to less than 0.05 mg/L at the end of AMD permeation
(Figure 5 (a)). Geochemical simulation using vMINTEQ showed the effluent was supersaturated
with respect to the aluminium bearing mineral, diaspore (-AlOOH) during the test. The effluent
was also supersaturated with respect to crystallized gibbsite (-Al(OH)3 during the test , except
between PVs = 6.9 to PVs = 14 when the effluent was slightly undersaturated. Similarly, effluent
iron and copper concentrations decreased significantly compared to the corresponding influent
AMD concentration as shown in Figure 5 (b) and Figure 5 (c), respectively. Geochemical
modeling results indicated that the effluent was supersaturated with respect to the iron
oxyhydroxides: hematite (-Fe2O3), goethite (-FeOOH) and ferrihydrite (Fe5HO8·4H2O). The
effluent also appeared to be supersaturated with respect to crystalline tenorite (CuO) throughout
the test. The model also predicted that the effluent was at or near saturation with respect to
Cu(OH)2. Cu likely co-precipitated with Fe as cupric ferrite. The effluent was also supersaturated
with respect to crystalline Ni(OH)2 during the first 14 pore volumes of permeation, and was
slightly undersaturated thereafter. The effluent concentrations of chromium and lead were
significantly reduced and were far below the Reg. 558 leachate criterion of 5 mg/L for both
metals. Geochemical modeling using vMINTEQ predicted precipitation of Cr(OH)2 for the first
Journal of Environmental Engineering. Submitted January 16, 2009; accepted August 27, 2009; posted ahead of print December 18, 2009. doi:10.1061/(ASCE)EE.1943-7870.0000211
Copyright 2009 by the American Society of Civil Engineers
Accep
ted M
anus
cript
Not Cop
yedit
ed
12
10.5 pore volumes (at pH values greater than 10.9). The effluent was also supersaturated with
respect to Pb(OH)2 through out the test period.
Effluent calcium concentration showed a distinctly different behavior (Figure 5 (L)). The
effluent calcium concentration decreased and became relatively low (~ 10 mg/L) during water
permeation. However, after switching the permeant to AMD, the concentration of Ca started to
increase and reached 700 mg/L after 10 PVs, and then remained stable during the rest of the
experiment. This trend is similar to that of SO42-
concentration suggesting that both ions were
mainly controlled by gypsum and ettringite solubility as predicted by vMINTEQ. The computed
saturation indices indicated that both gypsum (CaSO4.2H2O) and ettringite
(Ca6Al2(SO4)3(OH)12.26H2O) were at or near saturation state.
Given an influent AMD highly loaded with hazardous heavy metal ions, the effluent chemical
analysis results showed significant decrease in effluent concentration. All regulated elements
have concentrations below the MOE Reg. 558 leachate criteria. This significant reduction is
mainly attributed to the precipitation of metals as metal hydroxides in high alkalinity
environment obtained from the coal fly ash. The reduction in effluent concentration could also be
due to the encapsulation of the metals by hydration products formed during fly ash-permeant
interaction, as discussed in the next section of this paper. The effluent chemical analysis showed
the fly ash and fly ash-bentonite mixture barriers are compatible and efficient in retarding heavy
metals from AMD.
Post-test solid samples analysis
Mineralogical analysis
X-ray diffraction (XRD) patterns obtained from powder samples of AFA, 5% BAF and 10%
BAF before and after permeation are presented in Figure 6, Figure 7 and Figure 8 respectively.
The major crystalline minerals present in the pre-permeation AFA sample (Figure 6-a) are quartz
(SiO2), mullite (Al6Si2O13) and anhydrite (CaSO4). It also contained a significant amount of
amorphous phase as shown by a broad diffraction hump between 2 =15o and 2= 35
o. The
AFA sample after permeation showed significant structural alterations compared to the original
fly ash (Figure 6-b). The XRD pattern of the post permeated AFA sample showed the presence
Journal of Environmental Engineering. Submitted January 16, 2009; accepted August 27, 2009; posted ahead of print December 18, 2009. doi:10.1061/(ASCE)EE.1943-7870.0000211
Copyright 2009 by the American Society of Civil Engineers

Accep
ted M
anus
cript
Not Cop
yedit
ed
13
of new, strong peaks at d-spacings of 0.762 nm (2 = 11.60) and 0.306 nm (2 = 29.07), which
correspond to that of gypsum (CaSO4.2H2O). Gypsum had formed as a result of the reaction
between the calcium from fly ash and sulphate from AMD. Gypsum is normally stable at pH
values lower than 10.5, and this is verified as shown from the vMINTEQ geochemical modeling
results (Table 1). The other major mineral phase detected on the x-ray traces is ettringite
(Ca6Al2(SO4)3(OH)12.26H2O). Ettringite is reported to exist as a stable phase in the pH range of
10.5 to 12.5 (Damidot and Glasser 1993). However, Mynenei et al. (1998) reported that ettringite
may still be present down to a pH of 9.5, dissolving partially to gypsum and aluminium
hydroxide. Although the final effluent pH from the columns were slightly less than 9.5,
characteristic peaks of ettringite were identified at d-spacing of 0.966 nm (2 = 9.14) and 0.561
nm (2 =15.78). Ettringite is formed through the reaction of calcium and alumina mainly from
fly ash and sulphate ions present in AMD, in the alkaline environment created by the fly ash as
indicated by the following reaction:
2 - 2- -
4 4 2 6 2 4 3 12 26Ca 2Al(OH) 3SO 4OH 26H O Ca Al (SO ) (OH) .26H O
The anhydrite peak, which appeared as a weak trace at 0.348 nm (2= 25.56o) on the x-ray
diffractogram for the unpermeated fly ash sample, disappeared after AMD permeation indicating
conversion to ettringite and gypsum.
The x-ray diffraction patterns of the BAF samples after permeation shown in Figure 7-b and
Figure 8-b are similar to the pattern of post permeation AFA, except for some changes in the
XRD intensities of the major peak associated with the different phases. The ettringite peak
intensity generally became relatively weaker and the gypsum peak intensity became relatively
stronger with the increase in the bentonite content. This was probably due to the fact that lower
pH in high bentonite content samples favored gypsum formation through the dissolution of
ettringite.
Most precipitates predicted by vMINTEQ were not confirmed by XRD analysis, probably
because they were present in amounts below the detection limits or were poorly crystallized.
Scanning electron microscopy (SEM) analysis
Scanning electron microscopy (SEM) was employed to investigate the morphological changes of
the fly ash and fly ash-bentonite mixtures after AMD permeation. SEM photographs of natural
Journal of Environmental Engineering. Submitted January 16, 2009; accepted August 27, 2009; posted ahead of print December 18, 2009. doi:10.1061/(ASCE)EE.1943-7870.0000211
Copyright 2009 by the American Society of Civil Engineers

Accep
ted M
anus
cript
Not Cop
yedit
ed
14
and AMD-permeated samples are presented in Figure 9 (a) to (e). It is observed that the original
fly ash before AMD permeation showed smooth spherical texture. However, the SEM
photograph of post-permeation solid samples (Figure 9 (b) to (e)) showed agglomeration and
deposits on the surfaces of fly ash and bentonite particles. This change in surface morphology on
post permeation samples is attributed to the formation of new precipitates and cementious matrix
due to the inherent pozzolanic and cementitious property of fly ash used. The formation of
gypsum crystal on post permeated samples was seen clearly.
Physico-chemical analysis
The physico-chemical characteristics of post permeation samples are presented in Table 2. The
changes in the major oxide compositions of post permeation BAF samples showed similar trend
to the post permeation AFA (Table 2). Comparing the major oxides of samples before and after
AMD permeation, the result showed a general trend of decrease in major oxides. The decrease in
basic oxides (CaO, MgO, Na2O and K2O) in post permeated samples is attributed to their
dissolution which is the main process contributing to the alkalinity of the fly ash. The basicity
(CaO/SiO2) of AFA fly ash decreased from 0.33 before permeation to 0.28, showing 18%
decrease at the end of AMD permeation. Another noticeable change occurred in the sulfide
content (SO3), which showed a significant increase after permeation. It increased from 1.05%
prior permeation to 1.24% after AMD permeation of AFA, an 18% increase. This increase is
probably attributed to sulfide minerals precipitated during permeation. There was also a large
difference in the loss on ignition (LOI) of fly ash prior to and following permeation with AMD.
The LOI of post permeation AFA increased from 0.48% to 7.32%. This significant increase in
LOI could be due losses of the newly formed sulphates, carbonates and other compounds.
The concentration of most trace metals in all solid samples increased after permeation. Trace
metals including zinc, cobalt, copper, nickel and manganese increased significantly compared to
the concentrations in the original fly ash before permeation (Table 2). The alkaline environment
generated by coal fly ash immobilized the migration of heavy metals from AMD. Consequently,
the heavy metals were precipitated and/or sorbed to the surface of the specimen.
Journal of Environmental Engineering. Submitted January 16, 2009; accepted August 27, 2009; posted ahead of print December 18, 2009. doi:10.1061/(ASCE)EE.1943-7870.0000211
Copyright 2009 by the American Society of Civil Engineers

Accep
ted M
anus
cript
Not Cop
yedit
ed
15
SUMMARY AND CONCLUSIONS
Laboratory experiments were performed to investigate the hydraulic conductivity of fly ash and
fly ash-bentonite mixtures at different mix proportions and its chemical compatibility with mine
waste (AMD). The following conclusions are drawn from the study.
1. The test results showed that pure Atikokan fly ash did not meet the hydraulic conductivity
regulatory requirement for compacted soil liners (i.e. 1 x 10⁻⁹
m/s) during the first 11 pore
volumes. Hence the fly ash alone is not adequate for use in mine waste containment. The
hydraulic conductivity of the fly ash-bentonite mixtures decreased with increasing bentonite
content during distilled water permeation. However, the hydraulic conductivity of BAF
samples remained the same after AMD permeation. This was due to the decrease in the
hydraulic conductivity due to pozzolanic reactions of fly ash and chemical precipitation is
offset by the increase due to reduction in the double layer thickness as a result of AMD
attacking the fly ash and bentonite particles. Based on these laboratory results, 10% bentonite
may be adequate for fly ash-bentonite mixture to attain an acceptable level of hydraulic
conductivity for mine waste containment. However, field applications may depend on several
factors including proper mixing of bentonite with fly ash and AMD chemistry.
2. Chemical analysis results showed fly ash provides alkalinity to the system and therefore is
able to precipitate heavy metals from AMD. As a result the concentrations of most heavy
metals in the effluent decreased significantly and were well below MOE Reg. 558 leachate
criteria. This shows that the coal fly ash and fly ash-bentonite mixtures barriers are efficient
in removing hazardous metals from AMD and Atikokan coal fly ash can be used for mine
waste containment.
3. Geochemical modeling of the effluent chemistry, based on vMINTEQ, predicted
precipitation of several potential secondary minerals during AMD fly ash-bentonite
interaction. These precipitates possibly controlled the composition of the effluent and
reduced the hydraulic conductivity of the samples studied.
4. Comparative study of pre and post permeation of AFA and BAF samples using XRD and
SEM conclusively showed the formation of new minerals and precipitates such as ettringite
and gypsum, which were not detected on the original fly ash before permeation. Gypsum was
the predominant mineral identified in post permeated solid samples by both XRD and SEM.
Journal of Environmental Engineering. Submitted January 16, 2009; accepted August 27, 2009; posted ahead of print December 18, 2009. doi:10.1061/(ASCE)EE.1943-7870.0000211
Copyright 2009 by the American Society of Civil Engineers

Accep
ted M
anus
cript
Not Cop
yedit
ed
16
ACKNOWLEDGEMENTS
The work described in this paper was funded by the Natural Sciences and Engineering Research
Council of Canada (NSERC) Corporate Research and Development Project Grant (No. CRDPJ
319808-04), Goldcorp Musselwhite Mine, Ontario Power Generation-Atikokan generating
station and Golder Associates Ltd.
REFERENCES
Allison, J.D., Brown, D.S., Novo-Gradac, K.J. (1991). “MINTEQA2/PRODEFA2, a
Geochemical Assessment Model for Environmental Systems, Version 3.0 User's
Manual”. U.S. Environmental Protection Agency, Athens, Georgia.
Barone, F.S., Yanful, E.K., Quigley, R.M. and Rowe, R.K. (1989). “Effect of multiple
contaminant migration on diffusion and adsorption of some waste contaminants in a
natural clayey soil.” Can. Geotech. J., 26, 189-198.
Bowders, J.J., Usmen, M.A., and J.S. Gidley, J.S. (1987). “Stabilized fly ash for use as low
permeability barriers”. Proc., Conference on Geotechical Practice for Waste Disposal,
ASCE, New York, NY, 320-333.
Bowders, J.J., Daniel, D.E., Broderick, G.P. and Liljestrand, H.M. (1986). “Methods for testing
the compatibility of clay liners with landfill leachate.” In: Petros Jr., J.K., Lacy, W.J. and
Conway, R.A., Editors, 1986. Hazardous and Industrial Solid Waste Testing: Fourth
Symposium, ASTM STP 886, ASTM, Philadelphia, 233-250.
Cokca, E., and Yilmaz, Z. (2004). “Use of rubber and bentonite added fly ash as a liner
material”. Waste Management, 24 (2), 153-164.
Chhabra, R., Pleysier, J., and Cremers, A. (1975). The measurement of the cation exchange
capacity and exchangeable cations in soils: A new method. In Proceedings of the
International Clay Conference, Applied Publishing Ltd, Wilmette, IL, pp. 439-449.
Damidot, D. and Glasser, F.P. (1993). “Thermodynamic investigation of the CaO–Al2O3–
CaSO4–K2O–H2O system at 25 oC and the influence of Na2O”. Cem. Concr. Res., 23,
221-238.
Daniel D. E. (1993). “Clay liners”. In Geotechnical Practice for Waste Disposal (ed. D. E.
Daniel). Chapman & Hall, London, pp. 137–163.
Journal of Environmental Engineering. Submitted January 16, 2009; accepted August 27, 2009; posted ahead of print December 18, 2009. doi:10.1061/(ASCE)EE.1943-7870.0000211
Copyright 2009 by the American Society of Civil Engineers

Accep
ted M
anus
cript
Not Cop
yedit
ed
17
Daniel, D.E., Anderson, D.C., and Boynton, S.S. (1985). "Fixed-Wall versus Flexible Wall
Permeameters," Hydraulic Barriers in Soil and Rock, ASTM STP 874, pp. 107-126.
Edil, T. B., Sandstrom, L.K. and Berthouex, P.M. (1992). “Interaction of inorganic leachate with
compacted pozzolanic fly ash”. J. Geotech. Engrg., ASCE, 118 (9), 1410-1430.
Fernandez, F., and Quigley, R.M. (1985). “Hydraulic conductivity of natural clays permeated
with simple liquid hydrocarbons”. Can. Geotech. J., 22, 205–214.
Gustavsson, J.P. (2006). “Visual MINTEQ version 2.50. Dep of Land and Water Resources
Engineering”. Royal Institute of Technology, Stockholm,
<http://www.lwr.kth.se/English/OurSoftware/vminteq/index.htm> (Jan. 1 2009).
Hunter, R.J. (1993). “Introduction to modern colloid science”. Oxford University Press, New
York.
Kashir, M. and Yanful, E.K. (2001). “Hydraulic Conductivity of Bentonite Permeated with Acid
Mine Drainage”. Can. Geotech. J., 38, 1034-1048.
Mitchell, J.K. (1993). “Fundamentals of soil behaviour”. John Wiley & Sons, Inc., New York.
Mitchell, J.K., and Madsen, F.T. (1987). “Chemical effects on clay hydraulic conductivity”.
Geotechnical Practice for Waste Disposal ’87, R.D. Woods, ed., ASCE, New York, 87–
116.
MOE (2000). “Ministry of the Environment Regulation 558/00, Schedule 4”. Publication of the
Ministry of the Environment, Ontario, Canada.
Myneni, S.C.B., Traina, S.J. and Logan, T.J. (1997). “Ettringite solubility and geochemistry of
the Ca(OH)2–Al2(SO4)3–H2O system at 1 atm pressure and 298 K”. Chem. Geol., 148, 1-
19.
Nhan, C.T., Graydon J.W. and Kirk D.W. (1996). “Utilizing coal fly ash as a landfill barrier
material”. Waste Management, 16, 587-595.
Usmen, M.A., Bowders, J. J., and Gidley, J.S. (1988). “Low permeability liners incorporating fly
Ash in disposal and utilization of electric utility wastes”. In Disposal and Utilization of
Electric Utility Wastes, ASCE Special Publication, M.A. Usmen, Editor, May 1988.
Yeheyis, M.B., Shang, J.Q., and Yanful, E.K. (2008). “Characterization and Environmental
Evaluation of Atikokan Coal Fly Ash for Environmental Applications”. J. Env. Engrg.
Sc., 7(5), 481–498.
Journal of Environmental Engineering. Submitted January 16, 2009; accepted August 27, 2009; posted ahead of print December 18, 2009. doi:10.1061/(ASCE)EE.1943-7870.0000211
Copyright 2009 by the American Society of Civil Engineers

Accep
ted M
anus
cript
Not Cop
yedit
ed
Figure Caption List
Figure 1. Hydraulic Conductivity of Fly Ash and Fly ash-Bentonite Mixture Samples Permeated
with Water and AMD.
Figure 2. Variation of Sample Double Layer-thickness with Pore Volume of Permeant.
Figure 3. Effluent pH of Fly Ash and Fly ash-Bentonite mixture Samples Permeated with Water
and AMD.
Figure 4. Effluent Sulphate Concentration of Fly Ash and Fly ash-Bentonite Mixture Samples
Permeated with Water and AMD.
Figure 5. Leachate Concentrations of Heavy metals and Trace elements from Fly ash and Fly
ash-Bentonite samples. (a) Al, (b) Fe, (c) Cu, (d) Mn, (e) Ni, (f) Zn, (g) Cr , (h), Cd, (i)
Pb, (j) As, (k) Si and (l) Ca
Figure 6. Comparison of X-ray Powder Diffraction Pattern Only for Low Angles (Less than 45o).
(a) AFA Before permeation; (b) AFA after Permeation.
Figure 7. Comparison of X-ray Powder Diffraction Pattern Only for Low Angles (Less than 45o).
(a) 5% BAF Before permeation; (b) 5% BAF after Permeation.
Figure 8. Comparison of X-ray Powder Diffraction Pattern Only for Low Angles (Less than 45o).
(a) 10% BAF Before permeation; (b) 10% BAF after Permeation.
Figure 9. SEM Images of Samples before and after AMD Treatment. (a) AFA before AMD
Treatment Showing Smooth Surfaces of Fly Ash, (b) AFA after AMD Treatment
Showing Cementation; (c), (d) and (e) SEM images of AFA, 5% BAF and 10% BAF
respectively after AMD Treatment Showing the Formation of Gypsum Crystals.
Figure Caption List
Journal of Environmental Engineering. Submitted January 16, 2009; accepted August 27, 2009; posted ahead of print December 18, 2009. doi:10.1061/(ASCE)EE.1943-7870.0000211
Copyright 2009 by the American Society of Civil Engineers
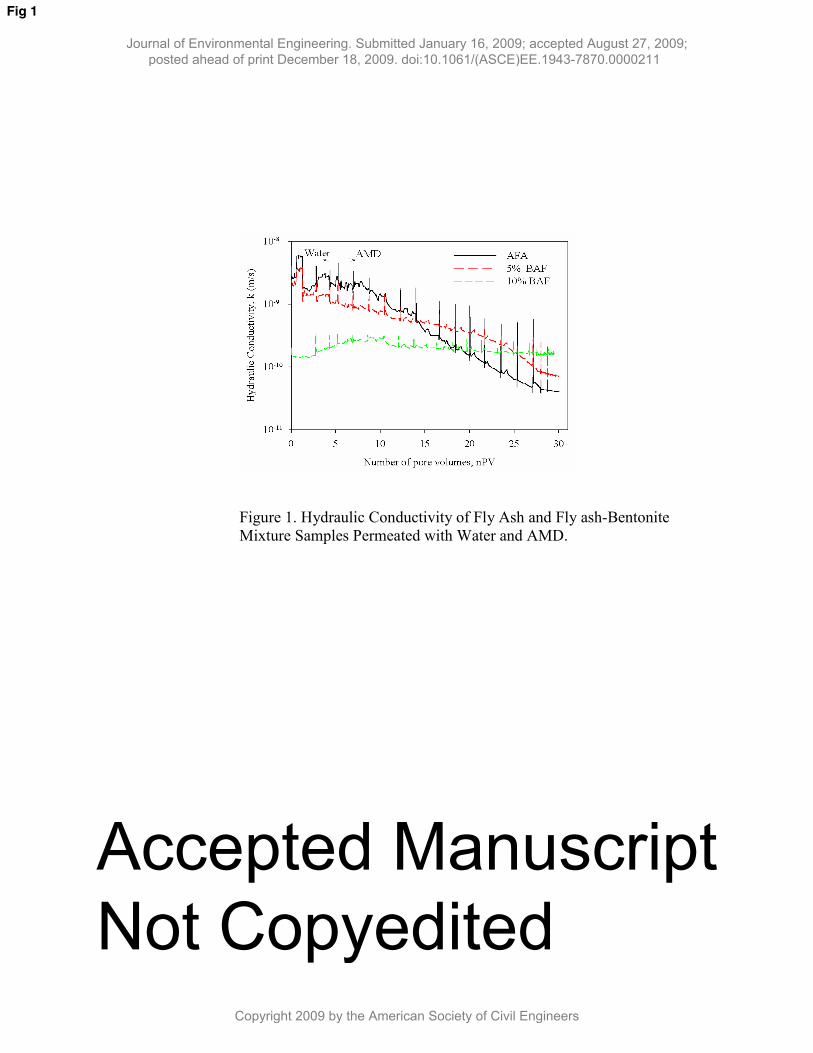
Figure 1. Hydraulic Conductivity of Fly Ash and Fly ash-Bentonite
Mixture Samples Permeated with Water and AMD.
Fig 1
Journal of Environmental Engineering. Submitted January 16, 2009; accepted August 27, 2009; posted ahead of print December 18, 2009. doi:10.1061/(ASCE)EE.1943-7870.0000211
Copyright 2009 by the American Society of Civil Engineers
Accepted Manuscript Not Copyedited
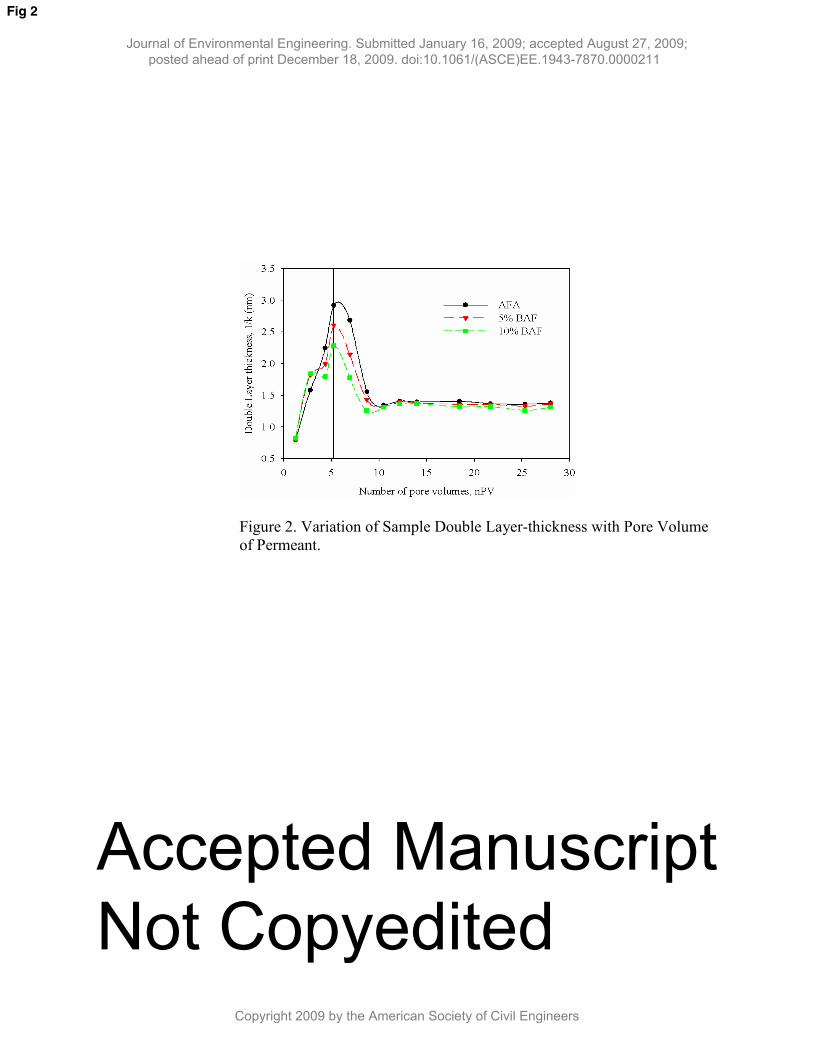
Figure 2. Variation of Sample Double Layer-thickness with Pore Volume
of Permeant.
Fig 2
Journal of Environmental Engineering. Submitted January 16, 2009; accepted August 27, 2009; posted ahead of print December 18, 2009. doi:10.1061/(ASCE)EE.1943-7870.0000211
Copyright 2009 by the American Society of Civil Engineers
Accepted Manuscript Not Copyedited

Figure 3. Effluent pH of Fly Ash and Fly ash-Bentonite mixture Samples
Permeated with Water and AMD.
Fig 3
Journal of Environmental Engineering. Submitted January 16, 2009; accepted August 27, 2009; posted ahead of print December 18, 2009. doi:10.1061/(ASCE)EE.1943-7870.0000211
Copyright 2009 by the American Society of Civil Engineers
Accepted Manuscript Not Copyedited

Figure 4. Effluent Sulphate Concentration of Fly Ash and Fly ash-
Bentonite Mixture Samples Permeated with Water and AMD.
Fig 4
Journal of Environmental Engineering. Submitted January 16, 2009; accepted August 27, 2009; posted ahead of print December 18, 2009. doi:10.1061/(ASCE)EE.1943-7870.0000211
Copyright 2009 by the American Society of Civil Engineers
Accepted Manuscript Not Copyedited

(a) Al (b) Fe
(c) Cu (d) Mn
Fig 5
Journal of Environmental Engineering. Submitted January 16, 2009; accepted August 27, 2009; posted ahead of print December 18, 2009. doi:10.1061/(ASCE)EE.1943-7870.0000211
Copyright 2009 by the American Society of Civil Engineers
Accepted Manuscript Not Copyedited

(e) Ni (f) Zn
(g) Cr (h) Cd
Journal of Environmental Engineering. Submitted January 16, 2009; accepted August 27, 2009; posted ahead of print December 18, 2009. doi:10.1061/(ASCE)EE.1943-7870.0000211
Copyright 2009 by the American Society of Civil Engineers
Accepted Manuscript Not Copyedited
(i) Pb (j) As
(k) Si (l) Ca
AMD conc. = Influent AMD concentration used as permeant (mg/L)
MOE Reg. 558 = Ontario Ministry of Environment Regulation 558/00 leachate criteria
Figure 5. Leachate Concentrations of Heavy metals and Trace elements from Fly ash and Fly
ash-Bentonite samples. (a) Al, (b) Fe, (c) Cu, (d) Mn, (e) Ni, (f) Zn, (g) Cr , (h), Cd, (i) Pb, (j)
As, (k) Si and (l) Ca
Journal of Environmental Engineering. Submitted January 16, 2009; accepted August 27, 2009; posted ahead of print December 18, 2009. doi:10.1061/(ASCE)EE.1943-7870.0000211
Copyright 2009 by the American Society of Civil Engineers
Accepted Manuscript Not Copyedited

Figure 6. Comparison of X-ray Powder Diffraction Pattern Only for Low Angles (Less than 45o). (a) AFA before permeation; (b) AFA after permeation.
Fig 6
Journal of Environmental Engineering. Submitted January 16, 2009; accepted August 27, 2009; posted ahead of print December 18, 2009. doi:10.1061/(ASCE)EE.1943-7870.0000211
Copyright 2009 by the American Society of Civil Engineers
Accepted Manuscript Not Copyedited

Figure 7. Comparison of X-ray Powder Diffraction Pattern Only for Low Angles (Less than 45o). (a) 5% BAF before permeation; (b) 5% BAF after permeation.
Fig 7
Journal of Environmental Engineering. Submitted January 16, 2009; accepted August 27, 2009; posted ahead of print December 18, 2009. doi:10.1061/(ASCE)EE.1943-7870.0000211
Copyright 2009 by the American Society of Civil Engineers
Accepted Manuscript Not Copyedited

Figure 8. Comparison of X-ray Powder Diffraction Pattern Only for Low Angles (Less than 45o). (a) 10% BAF before permeation; (b) 10% BAF after permeation.
Fig 8
Journal of Environmental Engineering. Submitted January 16, 2009; accepted August 27, 2009; posted ahead of print December 18, 2009. doi:10.1061/(ASCE)EE.1943-7870.0000211
Copyright 2009 by the American Society of Civil Engineers
Accepted Manuscript Not Copyedited

Figure 9. SEM Images of Samples before and after AMD Treatment. (a) AFA before AMD
Treatment Showing Smooth Surfaces of Fly Ash, (b) AFA after AMD Treatment Showing
Cementation; (c), (d) and (e) SEM images of AFA, 5% BAF and 10% BAF respectively after
AMD Treatment Showing the Formation of Gypsum Crystals.
c d
e
Gypsum crystals
a
d c
b
e
Fig 9
Journal of Environmental Engineering. Submitted January 16, 2009; accepted August 27, 2009; posted ahead of print December 18, 2009. doi:10.1061/(ASCE)EE.1943-7870.0000211
Copyright 2009 by the American Society of Civil Engineers
Acc
epte
d M
anus
crip
t N
ot C
opye
dite
d
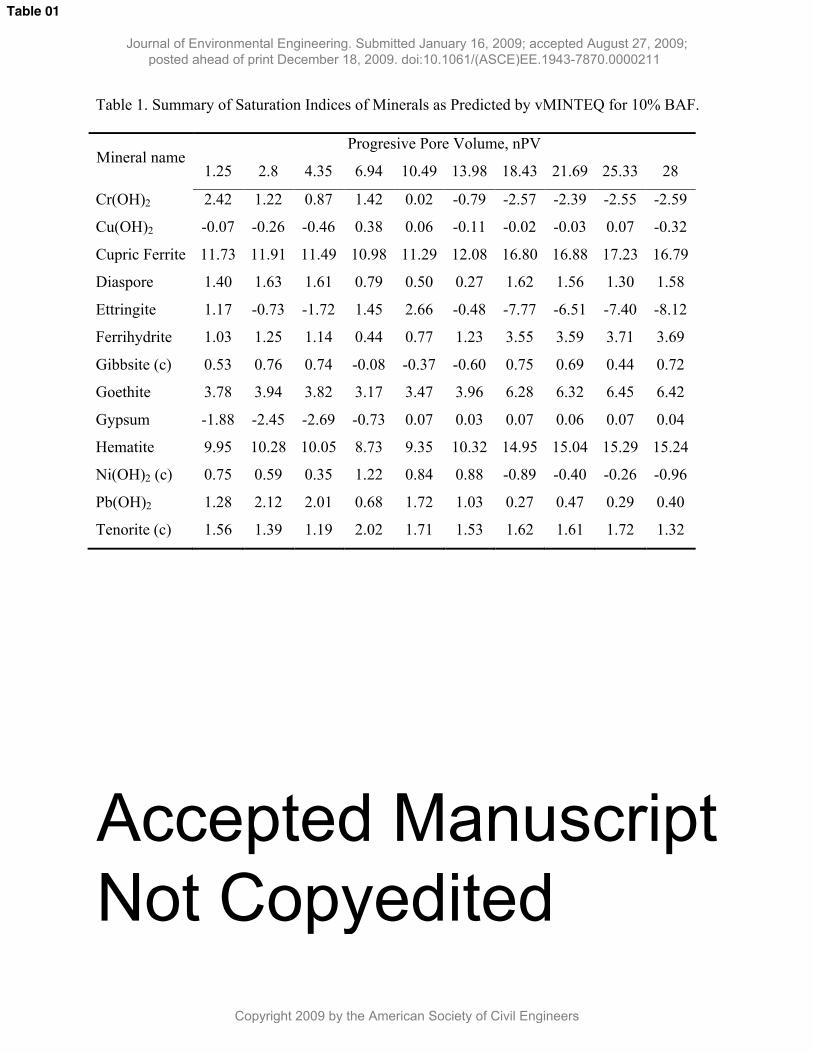
Table 1. Summary of Saturation Indices of Minerals as Predicted by vMINTEQ for 10% BAF.
Mineral nameProgresive Pore Volume, nPV
1.25 2.8 4.35 6.94 10.49 13.98 18.43 21.69 25.33 28
Cr(OH)2 2.42 1.22 0.87 1.42 0.02 -0.79 -2.57 -2.39 -2.55 -2.59
Cu(OH)2 -0.07 -0.26 -0.46 0.38 0.06 -0.11 -0.02 -0.03 0.07 -0.32
Cupric Ferrite 11.73 11.91 11.49 10.98 11.29 12.08 16.80 16.88 17.23 16.79
Diaspore 1.40 1.63 1.61 0.79 0.50 0.27 1.62 1.56 1.30 1.58
Ettringite 1.17 -0.73 -1.72 1.45 2.66 -0.48 -7.77 -6.51 -7.40 -8.12
Ferrihydrite 1.03 1.25 1.14 0.44 0.77 1.23 3.55 3.59 3.71 3.69
Gibbsite (c) 0.53 0.76 0.74 -0.08 -0.37 -0.60 0.75 0.69 0.44 0.72
Goethite 3.78 3.94 3.82 3.17 3.47 3.96 6.28 6.32 6.45 6.42
Gypsum -1.88 -2.45 -2.69 -0.73 0.07 0.03 0.07 0.06 0.07 0.04
Hematite 9.95 10.28 10.05 8.73 9.35 10.32 14.95 15.04 15.29 15.24
Ni(OH)2 (c) 0.75 0.59 0.35 1.22 0.84 0.88 -0.89 -0.40 -0.26 -0.96
Pb(OH)2 1.28 2.12 2.01 0.68 1.72 1.03 0.27 0.47 0.29 0.40
Tenorite (c) 1.56 1.39 1.19 2.02 1.71 1.53 1.62 1.61 1.72 1.32
Table 01
Journal of Environmental Engineering. Submitted January 16, 2009; accepted August 27, 2009; posted ahead of print December 18, 2009. doi:10.1061/(ASCE)EE.1943-7870.0000211
Copyright 2009 by the American Society of Civil Engineers
Accepted Manuscript Not Copyedited

Table 2. Physico-Chemical Characteristics of AFA and BAF Samples before and
after Permeation.
Property FFA 5% BAF 10% BAFBefore After Before After Before After
Major oxides (wt. %)SiO2 43.83 41.76 44.72 42.00 45.61 43.02Al2O3 21.85 20.80 21.59 19.93 21.33 19.76Fe2O3 4.01 3.83 3.98 3.79 3.94 3.75TiO2 0.93 0.83 0.89 0.83 0.86 0.80K2O 0.51 0.51 0.52 0.49 0.52 0.50MgO 2.71 2.67 2.66 2.90 2.61 2.93CaO 14.36 11.62 13.73 11.90 13.10 11.12MnO 0.03 0.11 0.03 0.11 0.03 0.11Na2O 7.15 5.76 6.91 6.09 6.66 5.55P2O5 0.54 0.47 0.52 0.49 0.49 0.43SO3 1.05 1.24 1.01 1.56 0.97 1.26L.O.I (%) 0.48 7.32 1.04 7.01 1.60 7.25Total 97.45 96.92 97.58 97.10 97.71 96.48Basicity 0.33 0.28 0.32 0.28 0.30 0.26
Minor and Traces (mg/kg)Manganese 121.00 754.45 129.40 764.71 137.79 702.89Nickel 13.10 595.56 12.63 548.13 12.17 608.82Lead 18.40 38.19 19.18 27.09 19.95 30.19Cobalt 2.09 117.85 2.13 109.76 2.18 118.32Chromium 24.50 23.06 23.28 27.86 22.05 19.57Copper 39.00 380.59 37.59 306.46 36.18 390.33Sulfur 3690.00 6795.03 3569.42 6625.68 3448.84 7085.67Vanadium 56.90 58.70 54.56 60.87 52.22 52.37Zinc 26.00 4270.00 27.04 3731.51 28.07 4287.17Barium 6020.00 5884.34 5728.72 6250.90 5437.45 4981.00Cadmium 0.84 8.77 0.81 7.81 0.79 7.86
Table 02
Journal of Environmental Engineering. Submitted January 16, 2009; accepted August 27, 2009; posted ahead of print December 18, 2009. doi:10.1061/(ASCE)EE.1943-7870.0000211
Copyright 2009 by the American Society of Civil Engineers
Accepted Manuscript Not Copyedited


